Article

Impact Assessment of a Major River Basin in Bangladesh on Storm Surge Simulation

by
Md. Abdul Al Mohit
1,2,*,
Masaru Yamashiro
3,
Noriaki Hashimoto
3,
Md. Bodruddoza Mia
4,
Yoshihiko Ide
3 and
Mitsuyoshi Kodama
3
1
Department of Maritime Engineering, Kyushu University, Fukuoka 819-0395, Japan
2
Department of Mathematics, Islamic University, Kushtia 7003, Bangladesh
3
Department of Civil and Environmental Engineering, Kyushu University, Fukuoka 819-0395, Japan
4
Department of Geology, Faculty of Earth and Environmental Sciences, University of Dhaka, Dhaka 1000, Bangladesh
*
Author to whom correspondence should be addressed.
J. Mar. Sci. Eng. 2018, 6(3), 99; https://doi.org/10.3390/jmse6030099
Submission received: 27 July 2018 / Revised: 20 August 2018 / Accepted: 21 August 2018 / Published: 28 August 2018
(This article belongs to the Special Issue Coastal Zone Management)

Abstract

:
A two-dimensional bay and river coupled numerical model in Cartesian coordinates was developed to find the impact of the river on the simulated water levels associated with a storm along the coast of Bangladesh. The shallow water models developed for both the bay and river were discretized by the finite difference method with forward in time and central in space. The boundaries for the coast and islands were approximated through proper stair steps representation and solved by a conditionally stable semi-implicit manner on a staggered Arakawa C-grid. A one-way nested scheme technique was used in the bay model to include coastal complexities as well as to save computational costs. A stable tidal condition was made by forcing the sea levels with the most energetic tidal constituent, M2, along with the southern open boundary of the bay model omitting wind stress. The developed model was then applied to foresee the sea-surface elevation associated with the catastrophic cyclone of 1991 and cyclone MORA. A comparative study of the water levels associated with a storm was made through model simulations with and without the inclusion of the river system. We found that the surge height in the bay-river junction area decreased by 20% and the surge height reduced by about 3–8% outside the junction area from this study. The obtained results were found to have a satisfactory similarity with some of the observed data.

1. Introduction

A low-lying riverine country, Bangladesh is affected by various environmental disasters like tropical cyclones. In 2013, the World Bank Group reported that Bangladesh would be the most affected country due to global warming. With climate change, a strong rise in the most horrific storms is evident. The concern is that Bangladesh will face various catastrophic cyclones every year due to global warming [1]. According to the Bangladesh Meteorological Department, in the last 44 years, 269 depressions and storms formed during January 1974 to May 2018. Due to this reason, huge economic losses and deaths occurred and this damage is not entirely due to the storm, the coastal structure of Bangladesh and its geological factors are also responsible. A huge number of people died as a result of past cyclone 1970 Bhola (167,000), cyclone 1991 (138,000) and cyclone Nargis 2008 (140,000) within this area. People believe that the storms of Bangladesh are a cruel cannibalistic monster. However, now, due to the extensive change in the study of storm surge research, there has been a decrease in the risk of death. Most of the research on storm surge has been conducted in the Atlantic, North Sea, Pacific, Gulf of Mexico, Gulf of Carpentaria and Bay of Bengal. For the Atlantic region and some other regions, some oceanographers [2,3,4,5,6] have conducted potential and pioneering works. The coastal zone of Apalache Bay and the northeastern Gulf of Mexico are at risk of acute severe storms. Some notable work has documented the storm surge in these coastal marshes [7,8]. Some 2D and 3D surge simulation models have been applied in this region to accurately investigate the surge height. The well-known surge simulation models SLOSH (Sea, Lake and Overland Surges from Hurricane) [9], CH3D [10,11], POM (Princeton Ocean Model) [12,13], FVCOM (Finite Volume Coastal Ocean Model) [14,15] and ADCIRC [16] have been used for this coast. For the SLOSH and POM model, a curvilinear orthogonal grid is used for the numerical computation. A non-orthogonal curvilinear grid is used in the CH3D model. After developing the grid system, an unstructured triangular grid is used for the ADCIRC and FVCOM models. In our study, a rectangular grid system was used in the bay-river coupled numerical model to compute the water level elevation due to a storm with a reduction in the time and cost. According to Alam [17], there are 6.69 cyclones and depressions crossing the coast of Bangladesh per year, which is 86.14% of the total formation of storms and depressions. As a result, floods occur around the coastal areas, which is also a major disaster for Bangladesh. Some numerical models for storm surge simulation in coastal areas have shown a little discrepancy. The reasons behind this may be the coastal complexities, wherein some worth mentioning can be pointed out as shallow bathymetry, long continental shelf, existence of offshore islands of different shapes, sediment accretion, curvilinearities of the coastal and island boundaries, high tidal range with the highest along Sandwip channel (Figure 1) and the high river discharge of the combined flow of Ganges–Brahmaputra–Meghna through lower Meghna and so forth. [18,19]. Besides these facts above-mentioned some other factors, namely, river runoff, torrential rain and so forth, also contribute to the rise in sea level caused by storm surges. The other factor, the north–west direction movement of cyclones striking the Bangladesh and Indian coast create serious disasters every year. The study of cyclone modeling in the Indian seas has been confined to the Bay of Bengal, especially the Coast of Bangladesh [20,21].
Thus, a complete understanding of the factors affecting surge development and its accurate prediction along the coast of Bangladesh is highly desirable. Although a considerable number of studies [18,20,21,22,23,24,25] have been conducted for the coast of Bangladesh, these studies have been insufficient at accurately incorporating the effect of the river system in storm surge modeling. The authors in [20] were the first to incorporate the effect of an idealized lower Meghna in a storm surge simulation, finding a contribution of the river on storm surge simulation. As the river was considered as an idealized river system in their study, their result may be somewhat different from reality. The work was further developed by Johns [26] to resolve the surge development along the coastal belt of Orissa in India with the use of a continuous contracting grid system. Dube et al. [27] conducted their study of the Bay of Bengal, adding the effect of the lower Meghna River for the simulation of storm surge along the Bangladesh coast. In their study, they also assumed an idealized river system and used a fixed water depth, which is also unrealistic. In subsequent work by Dube [28], the study coupled a one-dimensional river model with two-dimensional bay model with a curvilinear representation of the natural shoreline for the Orissa coast in India. In their study, a tidal solution was not used to provide the initial conditions for tide and surge interaction in the bay. Similarly retaining the limitations of the study of Agnihotri [29] introduced a two-dimensional bay-river coupled model for the simulation of storm surges along the east coast of India. The study was also limited by the lack of a representation of proper geometry of the river system.
The present study is a step towards the development of an operational surge forecasting bay and river-coupled model that incorporates the river system with realistic geometry. A non-linear interaction of tide and surge was also incorporated in this study. We also intended to investigate how the river influences the sea surface elevation when we incorporated the river into our model simulation as a channel gate.

2. Study Area and Cyclones

2.1. Study Area

One of the countries with the most risk of cyclones, Bangladesh, is situated at the northern tip of the Bay of Bengal between longitudes 88° E to 92° E and latitudes 20° N to 26° N.
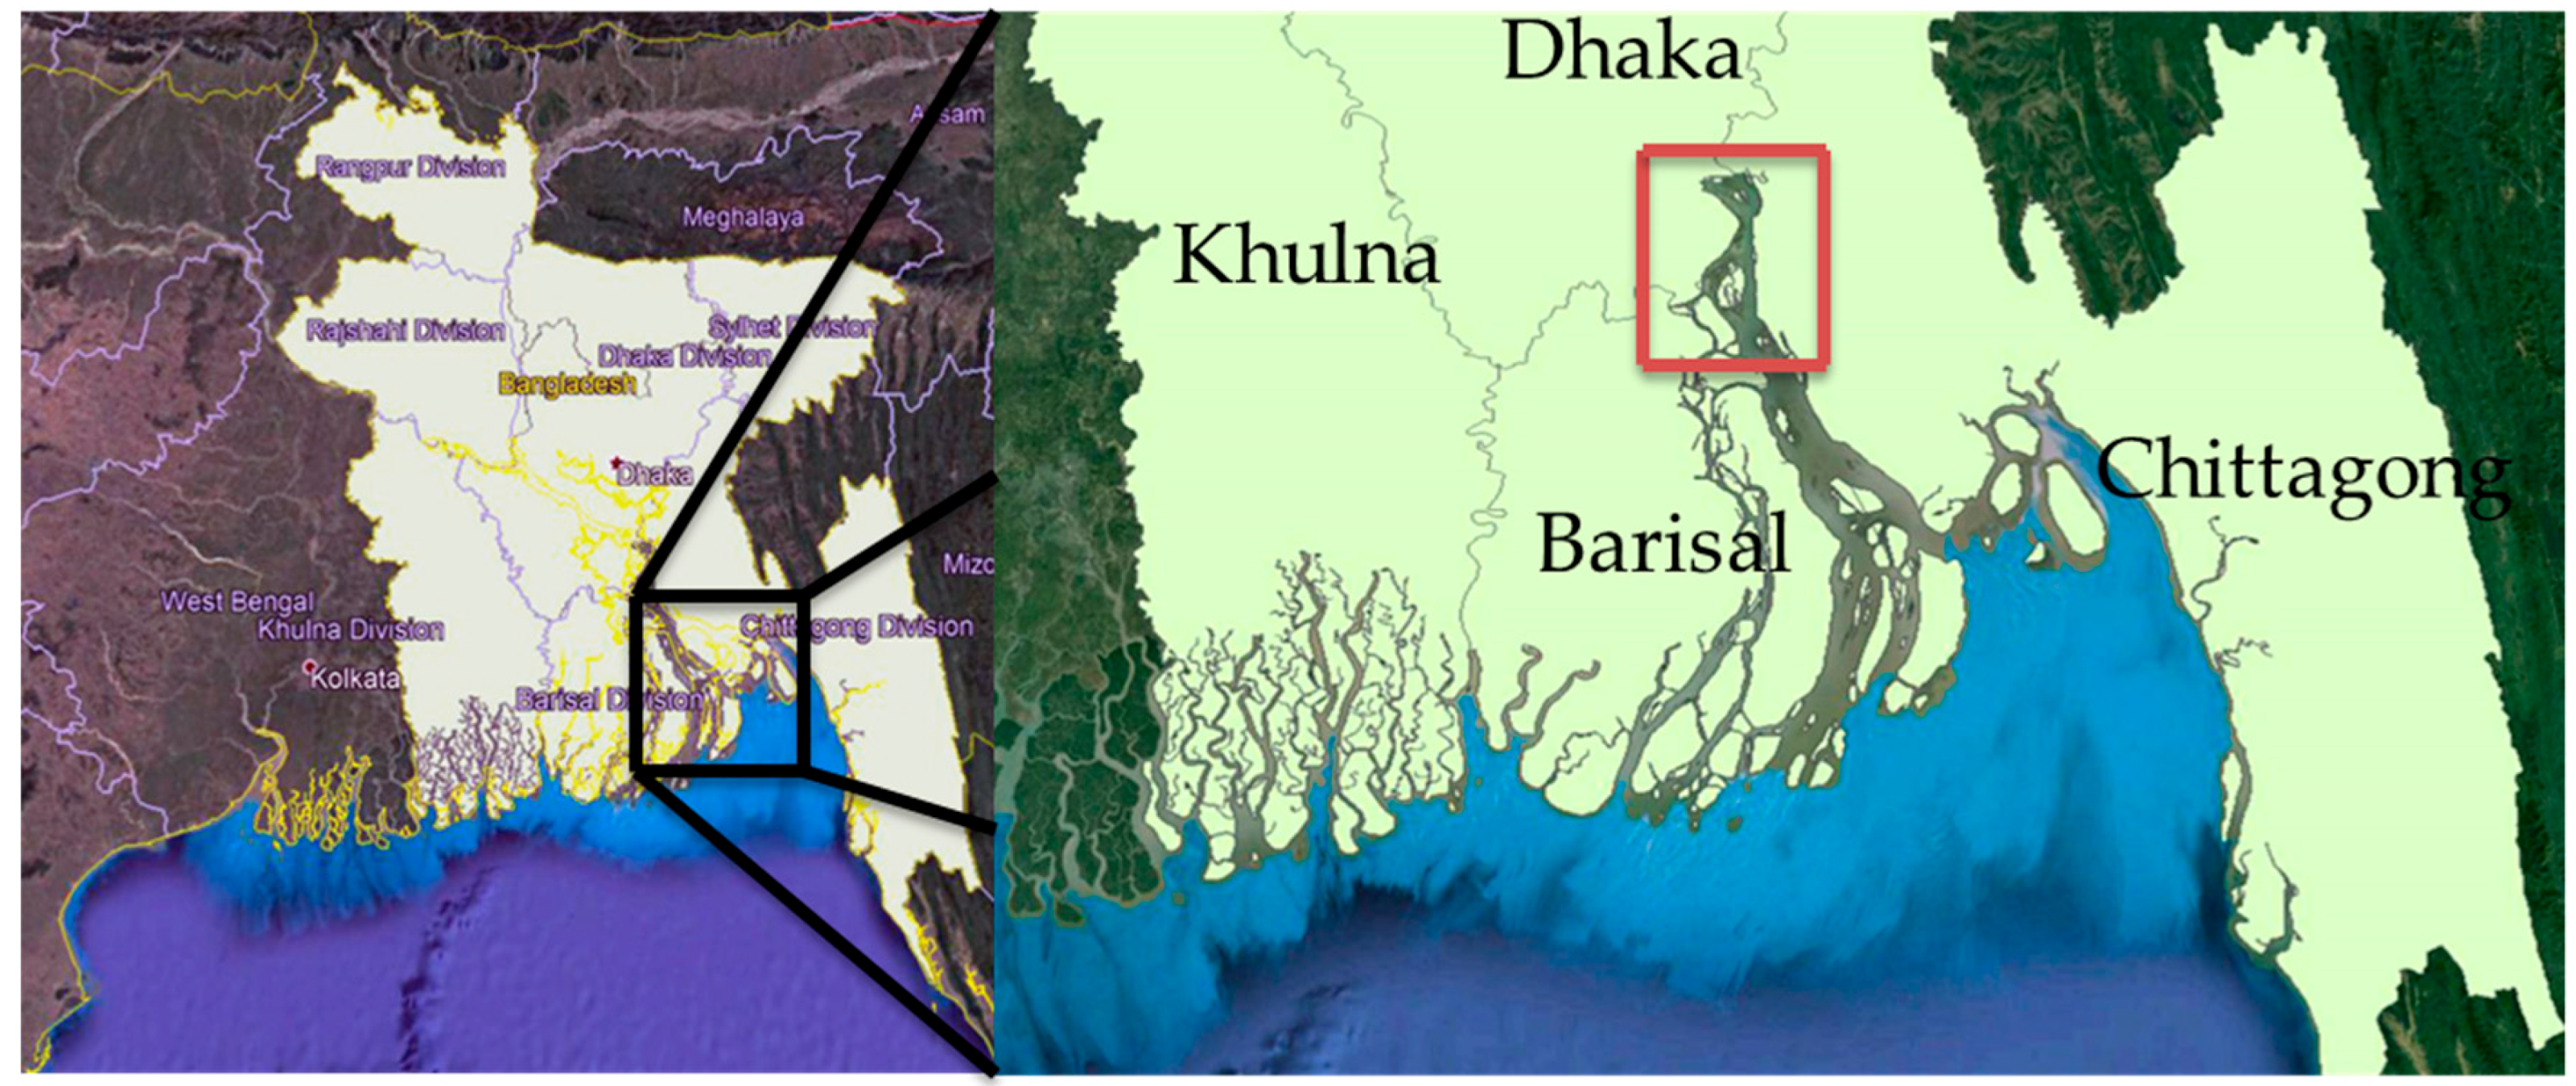
Nevertheless, the considered area was between the longitudes 85° E to 95° E and latitudes 15° N to 23° N to investigate a storm lasting two or three days in the analysis area before crossing the coast. The study area is bordered on the west, north and east by India, on the southeast by Myanmar and on the south by the Bay of Bengal (see Figure 1). It has long been advocated that the data-poor region, the coast of Bangladesh is the world’s most vulnerable place but has not been sufficiently studied. The reason behind this vulnerability may be the thickly populated offshore islands of different shapes, the curvilinearity of the coastal and island boundaries, long continental shelf, shallow bathymetry, high tidal range with the maximum at Sandwip channel (Figure 1) near Chittagong (about 5–6 m), huge freshwater discharge through the lower Meghna and so forth. Since the Meghna River contributes mainly to surge development in the area of interest, it was also considered in this study. In the river model, the lower part of the Meghna River was considered from mouth (23° N) to the head (23.25° N), wherein at the junction position of the bay and river (mouth of the river), the breadth was considered from longitude 90.40° E to longitude 90.68° E (Figure 2). The area considered was extended from Haiderganj to Moishadi (Chadpur), which is about 40 km in length (red color marked). It is of interest to note here that the sediment discharge from the river Meghna (combined flow of the Ganges–Brahmaputra–Meghna) is the highest and the freshwater discharge is the third highest of all the river systems worldwide [30].

2.2. Cyclones

Bangladesh faces different types of natural cyclones every year. In terms of deaths and economic losses, the cyclones Bhola (1970), BOB1 (1991), SIDR (2007), AILA (2007), Nargis (2008) and MORA (2017) have been the significant cyclones in the last few decades.
In our study, we chose two cyclones for investigation: cyclone 1991 and cyclone MORA.
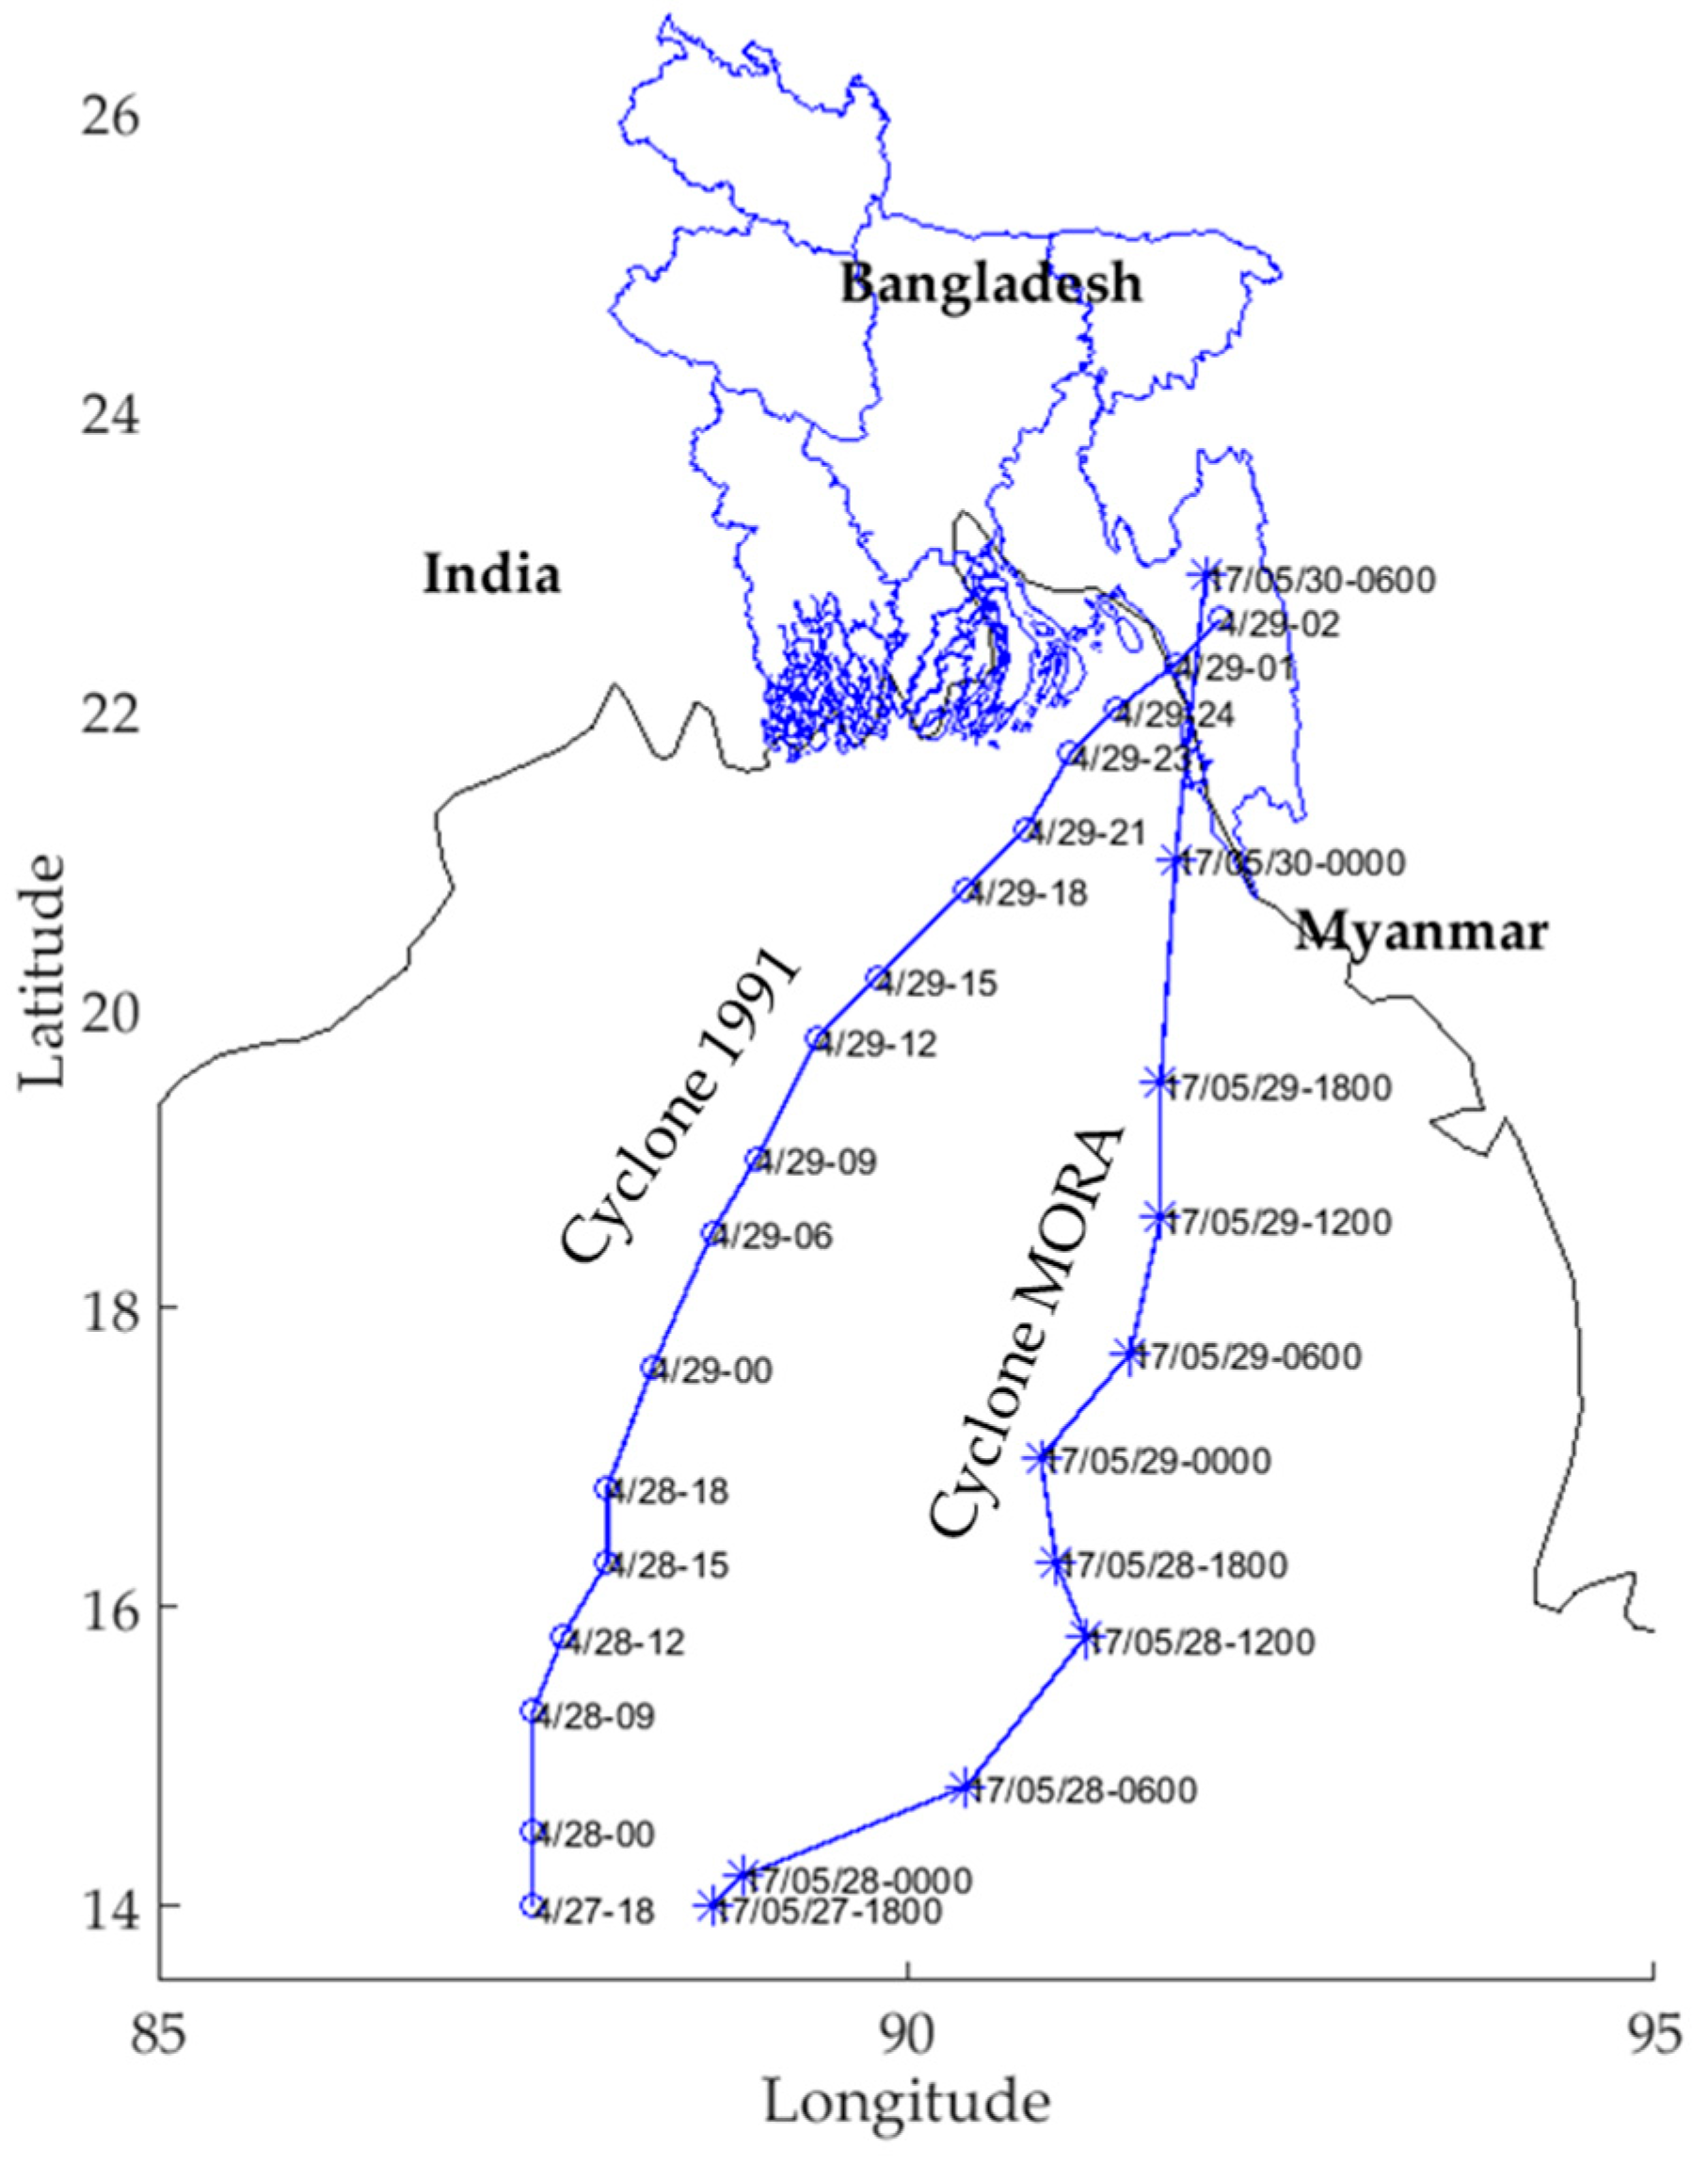
The 1991 cyclone has been studied enough by some oceanographers and it had a catastrophic nature. The other cyclone is MORA, which struck the Bangladesh coast recently. These cyclones should be investigated properly as one storm proved dangerous for causing human death and the other for economic losses. Furthermore, the parametric characteristics of the storms were different such as wind speed, maximum radius, coast crossing angle and landfall location. Figure 3 shows the path of the cyclone with the time and location that we used in our study.

2.2.1. Cyclone 1991 (BoB 01)

The 1991 cyclone of Bangladesh, known as BOB 01, was the most catastrophic and deadliest tropical cyclone that struck near Chittagong on the southeast side of Bangladesh on 29 April 1991. The approximate losses during the cyclone were 1.72 billion US dollars and the deaths of 138,000 people. The first circulation was formed on 22 April 1991 near the equator in the Indian Ocean and most of the mass cloud surrounded the Bay of Bengal region. The Indian Meteorological Department (IMD) detected the system as a depression on 23 April and it was also detected by the satellite picture taken from NOAA-I1 and GMS-4 satellites [31]. After that, the storm then moved northeastward from its genesis position. From the latitude 11.80° N to 13° N, the storm was a cyclonic storm, having a central pressure of 996 hPa. By this time, on 27 April, the system reserved its intensity until 28 April (UTC 6.00) and changed its nature as a severe cyclonic storm. After that, the system then forwarded to accelerate to the north–northeast side, which made it further intensify with a 938 hPa central pressure. At that time, the astronomical position of the cyclone was 20.60° N latitude and 90.70° E longitude. Finally, the storm crossed the coastal area of Bangladesh with a 6-m surge height on 30 April at 2:00 a.m. local time.

2.2.2. Cyclone MORA

According to the official announcement, on 28 May 2017 (midnight), when the cyclone was known as MORA, the cyclone was located 670 km away from Chittagong Port, 590 km away from the Cox’s Bazar Port, 715 km away from Mongla Port and 650 km away from Payra Port. Before this status, the depression was first observed on the afternoon of 27 May in the central Bay of Bengal. Later on, it became more condensed and crossed Chittagong Port at 6:00 a.m. local time on 30 May 2017. At that time, the wind speed and central pressure was 110 km/h and 978 hPa, respectively. However, the Ministry of Disaster Management and Relief of Bangladesh constituted a strong committee before the storm struck the Bangladesh coast and advised the local council to take necessary action against the cyclone disaster. With adequate alerts and the help of the Government, the number of deaths decreased but the number of economic losses increased greatly. According to the Ministry of Disaster Management and Relief, the death toll consisted of nine people and the economic loss was estimated to be 1.7 billion US dollars. After the storm hit the coast, it became a land deep depression and crossed the Rangamati district and surrounding area. At this time, heavy rainfall occurred in the region, causing floods. According to the Bangladesh Meteorological Department, rainfall was recorded as 225.2 mm in Chittagong, 213 mm in Sandwip, 208 mm in Sitakunda and 187 mm in Rangamati. The detailed statistical information of cyclone MORA is presented in Appendix A.

3. Numerical Model

3.1. Data and Materials

In our numerical model, we used the meteorological, hydrological, geographical and oceanographic data involved with some of the parameters. Meteorological input data like storm track, central pressure, maximum sustained wind radius and maximum sustained wind speed were taken from the Bangladesh Meteorological Department (BMD). The wind distribution data were generated by the empirically based formula of [2] from information from the Bangladesh Meteorological Department. The water depth data were collected from the general bathymetry chart of the ocean (GEBCO) 30 arc-second interval grid data and the data were interpolated to the model grid by using the inverse distance weighted interpolation method. Coastal geometry and island geometry of our study domain were collected from the geophysical data system (GEODAS) coastline shapefile and the shapefile was processed by using coastline extractor software and the MATLAB subroutine. Hydrological data like river discharge Q = 5100.00 m3/s (yearly average) and tidal elevation were collected from the study of [32] and the Bangladesh Inland Water Transport Authority (BIWTA), respectively. The friction coefficient Cf = 0.0026 and the drag coefficient Cd = 0.0028 were taken as uniform from the study of [22]. The drag coefficient could be calculated from the relation C d = ρ w g n 2 / H 1 / 3 , where ρ w is the seawater density, g is the gravitational acceleration, n is the Manning roughness coefficient, and H represents the water depth. The friction coefficient can be calculated from the relation C f = τ / D p , where τ represents the shear stresses and D p represents the dynamic pressure. The cyclone track data were 3-h interval data that were collected from the Bangladesh Meteorological Department observed data. Figure 3 represents the track information of cyclones 1991 and MORA.

3.2. Model Description

3.2.1. Parent Model (Bay Model)

A system of rectangular Cartesian coordinates was used, where the curvature of the earth’s surface was assumed to be zero. In this system, the origin, O, is taken in the undisturbed level of the sea surface, OX points towards the south, OY points towards the east and OZ is directed vertically upwards. The displaced position of the free surface is given by ζ ( x , y , t ) and the position of the seabed by h ( x , y ) . For any atmospheric or oceanic phenomenon, if the horizontal length scale is large in comparison with the vertical length scale, then the z-component of the momentum equation can be approximated by the hydrostatic equation [19]. By approximating and neglecting the molecular velocity, the flux form of the vertically integrated shallow water equation for the dynamical process in the sea can be written as
ζ   t + u ˜ x + v ˜ y = 0 ,
u ˜   t + ( u u ˜ ) x + ( v u ˜ ) y f v ˜ = g ( ζ + h ) ζ x + T x ρ C f   u ˜ ( u 2 + v 2 ) ζ + h ,
v ˜   t + ( u v ˜ ) x + ( v v ˜ ) y + f u ˜ = g ( ζ + h ) ζ y + T y ρ C f   v ˜ ( u 2 + v 2 ) ζ + h ,
where ( u ˜ , v ˜ ) = ( ζ + h ) ( u , v ) and u ,   v , are the Reynolds averaged components of velocities in the directions of x any y , respectively; ρ is the density of the sea water supposed to be homogeneous of the same density; f = 2 Ω sin φ is the Coriolis parameter where Ω is the angular speed of the earth rotation and φ is the latitude of the place of interest; and g is the acceleration due to gravity.
In this study, the wind stress components were parameterized by a conventional quadratic law [21] and is given by
( T x , T y ) = ρ a C d ( u a 2 + v a 2 )   1 2 ( u a , v a ) ,
where Cd = 2.8 × 10‒3 is the surface drag coefficient used by [22]; ρ a is the density of the air; and u a , v a are the x and y components, respectively, of the wind stress. The circulatory wind field based on the available information at the Bangladesh Meteorological Department (BMD) can then be generated by the empirical formulae of [2], being given by
V a = { V 0 ( r a   / R ) 3 for   all   r a R V 0 ( R / r a ) for   all   r a > R ,
where V 0 is the maximum sustained wind at the radial distance R and r a is the radial distance at which the wind field is desired.

3.2.2. River Model

A separate two-dimensional depth averaged river model was also developed to incorporate the effect of the river from the study of the researcher [29], wherein the modeling, the curvature of the earth was also assumed to be zero and the curvilinear properties of the study region for the river were approximated through proper stair steps. It was previously mentioned that the model domain was considered from 23° N to 23.25° N latitude and 90.40° E to 90.68° E longitude, which turned out to be a length of about 40 km and a breadth of about 16 km. For the developed river model, the origin O′ was taken at the equilibrium level of the free surface and was located at the left corner of the head of the river latitude (23.25° N, 90.40° E). The x -axis was taken as positive in the stream direction while the y -axis was taken parallel to the coast. The elevation of the free surface above its mean level was denoted by z = ξ r i v ( x , y ) and the bottom of the river by z = h r i v ( x , y ) . The depth averaged velocity components in the developed river system, u r i v and v r i v , satisfied the following equations
ξ r i v   t + x [ H u r i v ] + y [ H v r i v ] = 0 ,
t   [ H u r i v ] + x [ H u r i v 2 ] + y [ H u r i v v r i v ] H v r i v = g ξ r i v x C f u r i v ( u r i v 2 + v r i v 2 ) 1 / 2 ,
t   [ H v r i v ] + x [ H u r i v v r i v ] + y [ H v r i v 2 ] + H u r i v = g ξ r i v y C f v r i v ( u r i v 2 + v r i v 2 ) 1 / 2 ,
where H = [ ξ r i v + h r i v ] ( x , y ) represents the total water column depth where u r i v ,   v r i v , are the velocity component. The bottom stress, following the study [29], was parameterized as ρ C f u r i v 2 + v r i v 2 . To understand the discretization (see Appendix B).

3.3. Boundary Conditions

3.3.1. Boundary Condition of the Parent Model

The normal component of the depth-averaged velocity for open boundaries can be given by various formulas depending on the available data [33]. For the Bay of Bengal region, most of the researchers have used a radiation type of boundary condition, which is able to allow the disturbance generated within the model area to go out through the open boundary as a progressive wave. The following boundary condition was taken from [21], the western (85° E), eastern (95° E) and southern (15° N) are, respectively, given by
The east boundary (85° E):
v + ( g h )   1 2 ζ = 0
The west boundary (85° E):
v ( g h )   1 2 ζ = 0
The south boundary (15° N):
u ( g h )   1 2 ζ = 2 ( g h ) 1 2 a S i n ( 2 π t T + φ )
For the closed boundaries of the mainland as well as of the islands, the normal components of the mean current were taken as zero. In Equation (7), a , φ and T denote the amplitude, phase and period of the tidal constituent, respectively, under consideration.

3.3.2. Boundary Condition for the River Model

For the eastern and western river boundaries, whenever it is a vertical sidewall, the boundary condition can be set as [25]
ξ r i v   = 0
The extended analysis area of the northern boundary was situated at the head of the river, where the conditions can be put into the following form. If the fresh water discharge from the river is taken into account, then the appropriate boundary condition can be expressed as [25]
u r i v = Q B r i v h r i v ,  and  u r i v = 0
when no fresh water discharge is considered, where B r i v is the river breath and Q represents the river discharge.

3.3.3. Matching Boundary Condition

The southern boundary of the river model is influenced by the bay, which is why running a model with a perfect match between the river and bay is important. The continuity of volume flux should be ensured at the mouth of the river.
The previous study [20] explains one dimensional matching equation. By improving their idea, after simplifying the condition for the present study, the two-dimensional matching condition was used in our model by the following equation.
ξ r i v = ζ b a y ,   u b a y u r i v = 0   and   v b a y v r i v = 0
Equation (13) can ensure that the sea surface elevation that influences the river and the continuity of volume flux of the flow. This matching equation can exchange the information of the bay and river model in such a way that the model simulation’s updated value from the river model is again used as the bay model input. The following equation prepares the input for the bay model after the next iteration.
u b a y = u r i v + Q B r i v ( h r i v + ξ r i v )
This is an appropriate process through the matching to find the appropriate result from the bay and river couple model. In our model simulation, the bay model inner nested grid size and the river model grid size were the same so that the matching could exchange the flow velocity and volume easily with less time and cost. A contraction mapping is needed when the grid size does not match. In this study, the numerical matching computation started from the grid number (40, 7) for the river model and (1, 7) for the bay model.

4. Numerical Procedure

4.1. Nested Model Set Up

In the present study, the study domain of the extended bay model was taken from 15° E to 23° E and 85° E to 95° E (Figure 4), which is referred to as the coarse grid model (CGM) [19]. In this CGM, there were 60 × 61 computation grid points with 15.08 km grid spacing along the north–south direction and 17.52 km along the east–west direction. According to this grid spacing, all major offshore islands along the coast of Bangladesh as well as coastal curvilinearity could not be incorporated properly. Therefore, fine mesh grid is important but the fine resolution for the whole analysis area may result in more computing time with numerical instability.
To reduce computational cost as well as incorporate the coastal complexities of the desired region properly, the nested technique was applied here. In the FGM, the mesh sizes were taken as 2.15 km along the north–south and 3.29 km along the east–west directions and the total number of computational grid points in the model was 92 × 95. Such a grid resolution could incorporate only the major offshore islands. The results obtained from the CGM were interpolated in space with cubic spline interpolation to be able to supply the grid points of the FGM. The parameters ξ , u and v were prescribed from those obtained in FGM. To properly incorporate complexities like flat and shallow coastal plains, the nature of the surge conduciveness of the region of interest and the lower Meghna estuarine area, a high-resolution very fine grid model was needed, which was why a fine mesh grid (FGM) was then improved. To make the results more accurate, a very fine high-resolution grid was made, known as VFGM. In this very fine grid model (VFGM), the computational grid points were 190 × 145 (Table 1) with a grid spacing along the north–south direction of 0.72 km, it is of interest to note here that the resolution of the CGM and FGM were not the same. Such a grid resolution may be able to properly resolve coastal complexities. All of the models (CGM, FGM and VFGM) had the same dynamical Equations (1)–(3) but with different boundary conditions. In the river model, the study domain was extended between 23° N to 23.25° N and 90.40° E to 90.68° E (Figure 2). For the extended region, we considered 40 × 27 computational grid points with a grid spacing of 0.72 km along the north–south direction and 1.14 km in the east–west direction, which was referred to as a very fine grid model for river (VFGMR). The grids of the VFGMR were taken in such a way that along the west–east direction for the y-axis direction, the north–south direction was an x-direction river flow and the VFGM parent grid coincided with the grids of the VFGMR (matching points at the river and bay). The VFGMR depends on VFGM and the parameters ξ , u and v of the VFGM can pass through the boundary 23° N to 23.25° N and 90.40° E to 90.68° E.

4.2. Numerical Procedure

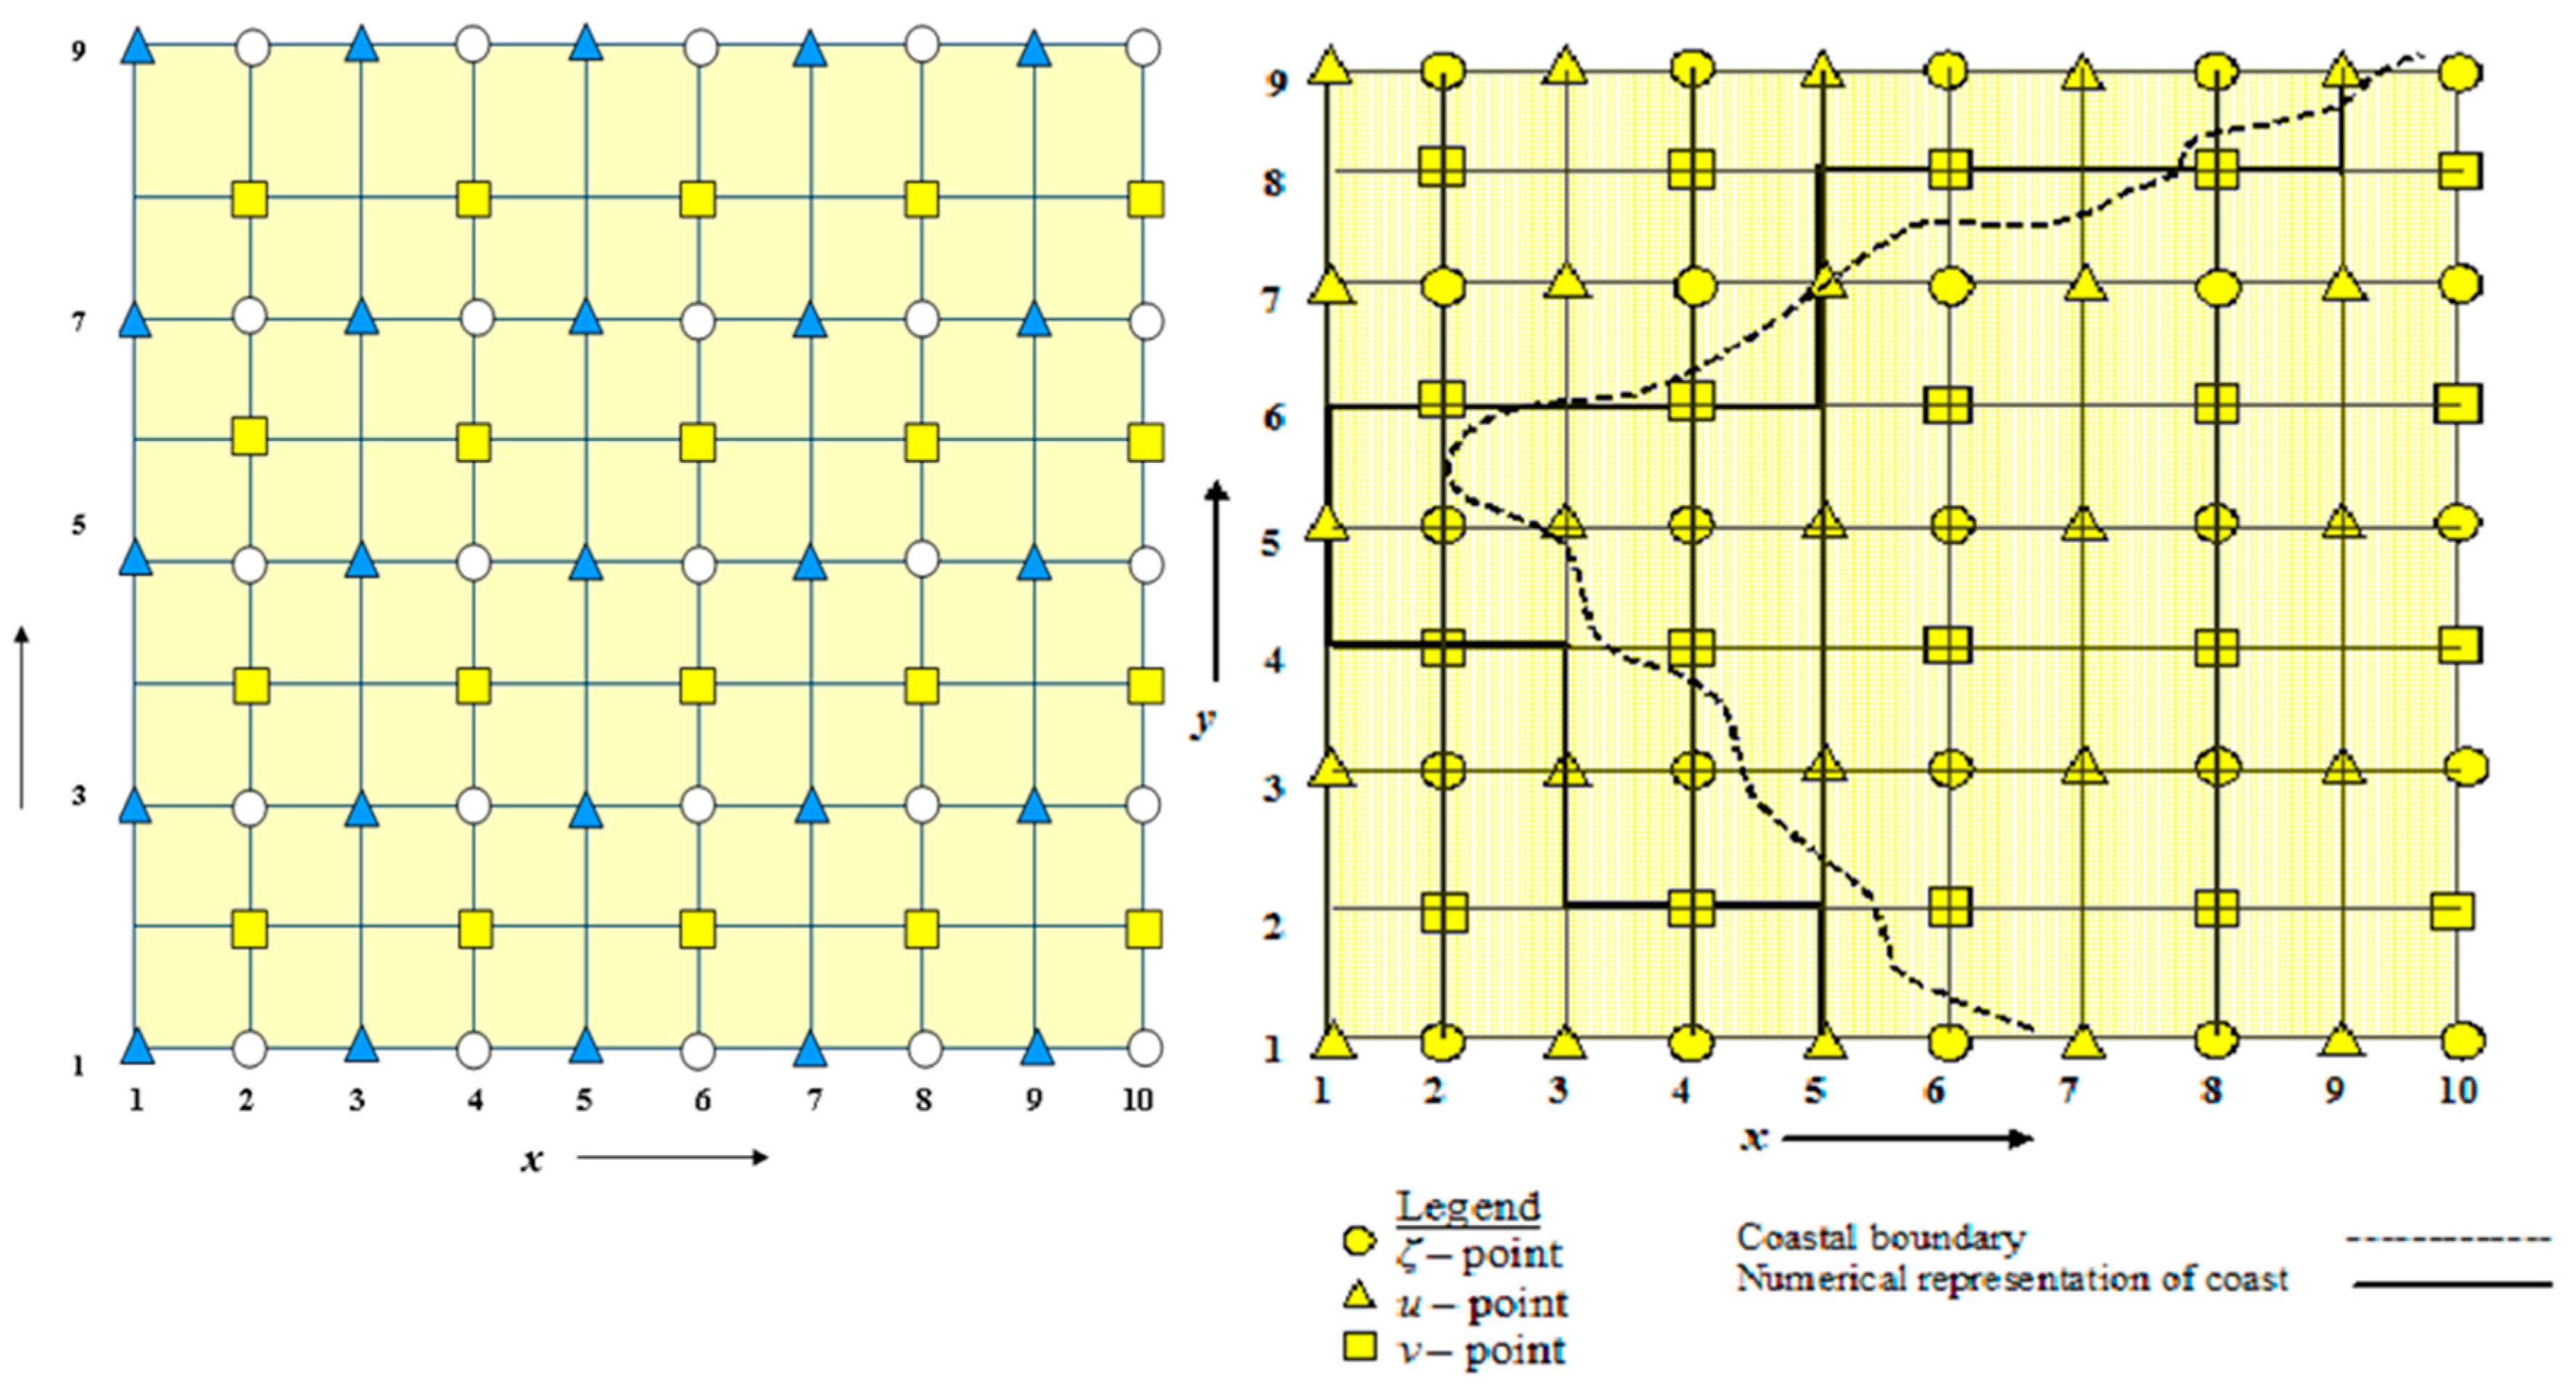
Both the bay and river models, the governing Equations (1)–(3) and (5)–(7) as well as boundary conditions Equations (8)–(10) and (11)–(15) except (13) were discretized by a forward in time, central in space finite difference scheme by considering discrete points in the x y plane. If ( i , j ) represent the position of a grid point in the bay model with 1 i M and , then x i = ( i 1 ) Δ x ,   i = 1 , 2 , 3 , m (even), y j = ( j 1 ) Δ y ,   j = 1 , 2 , 3 , n (odd) and the sequence of time instant is defined by t k = k Δ t ,   k = 1 ,   2 ,   3 , . The obtained equations were solved by a conditionally stable semi-implicit manner using a staggered C-grid (Figure 5) where there were three distinct types of computational points, namely ξ , u and v for the parent (bay) model and ξ r i v , u r i v and v r i v for the river model. With i even and j odd, the point is a ξ point at which ξ is computed. If i and j are both odd, the point is a u point at which u is computed and if i and j are both even, the point is v , at which v is computed. In a similar fashion to the river model, ξ r i v , u r i v and v r i v were computed. The M number of computation grid was chosen to be even so that the eastern open sea boundary consisted of both ξ -points and v -points. The N number of the computation grid was chosen to be odd to ensure that there were only ξ -points and u -points for all of the grid points of the river mouth, where the continuity of volume flux was ensured. The initial value of ξ , u and v were taken as zero to represent a cold start. A 60 second-time step process was used for both the model simulation in order to meet the Courant-Friedrichs-Levy (CFL) stability criteria. A stable tidal regime was then generated with the M 2 constituent along the southern open boundary of the CGM. The specified boundary data of FGM were then integrated forward in time. The computed boundary data was exchanged from each nesting model. For the CGM, FGM and VFGM, the computation time step was checked by the CFL criteria for stability. Bay and river matching is important for the river model to work properly. The data obtained from the VFGM were assigned in space to obtain a full set of boundary data by the matching condition Equation (14) and the river bathymetries were interpolated in every grid point from the GECBO data. In the river model, for the solution process, the extrapolated value of the elevation from the bay model at the bay-river junction point provided a forcing for the motion in the river. The use of Equations (5)–(7) demonstrated the updated elevations and currents at the ξ and u -points in the river, except for the current at the head of the river where the u -velocity was given by one of the boundary conditions specified by Equations (11) and (12).
The updated elevation at the junction point from the river model was chosen to update the elevations in the bay model by using Equations (13) and (14) for the next iteration. The first point of ξ and u in the river model, the elevation and current were computed from the bay model by using the matching phenomenon. This matching procedure guided the updated elevations in the river and, additionally, yielded boundary values of the mouth of the river to be used in the next update of the bay model variables. To find the impact of the river channel, we opened the vertical wall at the northern grid of the bay model where the matching conditions were established. For the next simulation, we set the vertical wall at the mouth of the river to consider no river influence on the bay.

4.3. Numerical Conditions

To perform the model simulation, we set some numerical conditions. Numerical conditions of the model simulation were considered such as the program running 4290 times, the program storing data after every 10 min, 289 was the number of data the program stores and the program started to store data after it was run 2040 times. The calculation period was set from 27/04/1991, 8:00 a.m. local time to 30/04/1991, 8:00 a.m. local time. The time step of our computation was 60 s after checking the stability criteria. The principal lunar semi-diurnal tide M2 was used in the study with a period of 12.42 h, speed of 28.98 deg/h and the Doodson number of this constituent was 255.55. The tide-surge interaction process in this study was similar to the study by Roy [21]. In our model simulation, the M2 tide was calculated from Equation (10) and the tidal oscillation was taken as 12.42 h. Commonly, the M2 tide was dominant our study region, so we selected this as the major constituent in this study. To generate the pure oscillation of the M2 tide, it was important to calculate the amplitude and phase of the constituent. Therefore, the process of Roy [21] was used to find the precious specifications of the values.

5. Model Validation and Outcomes

5.1. Model Results

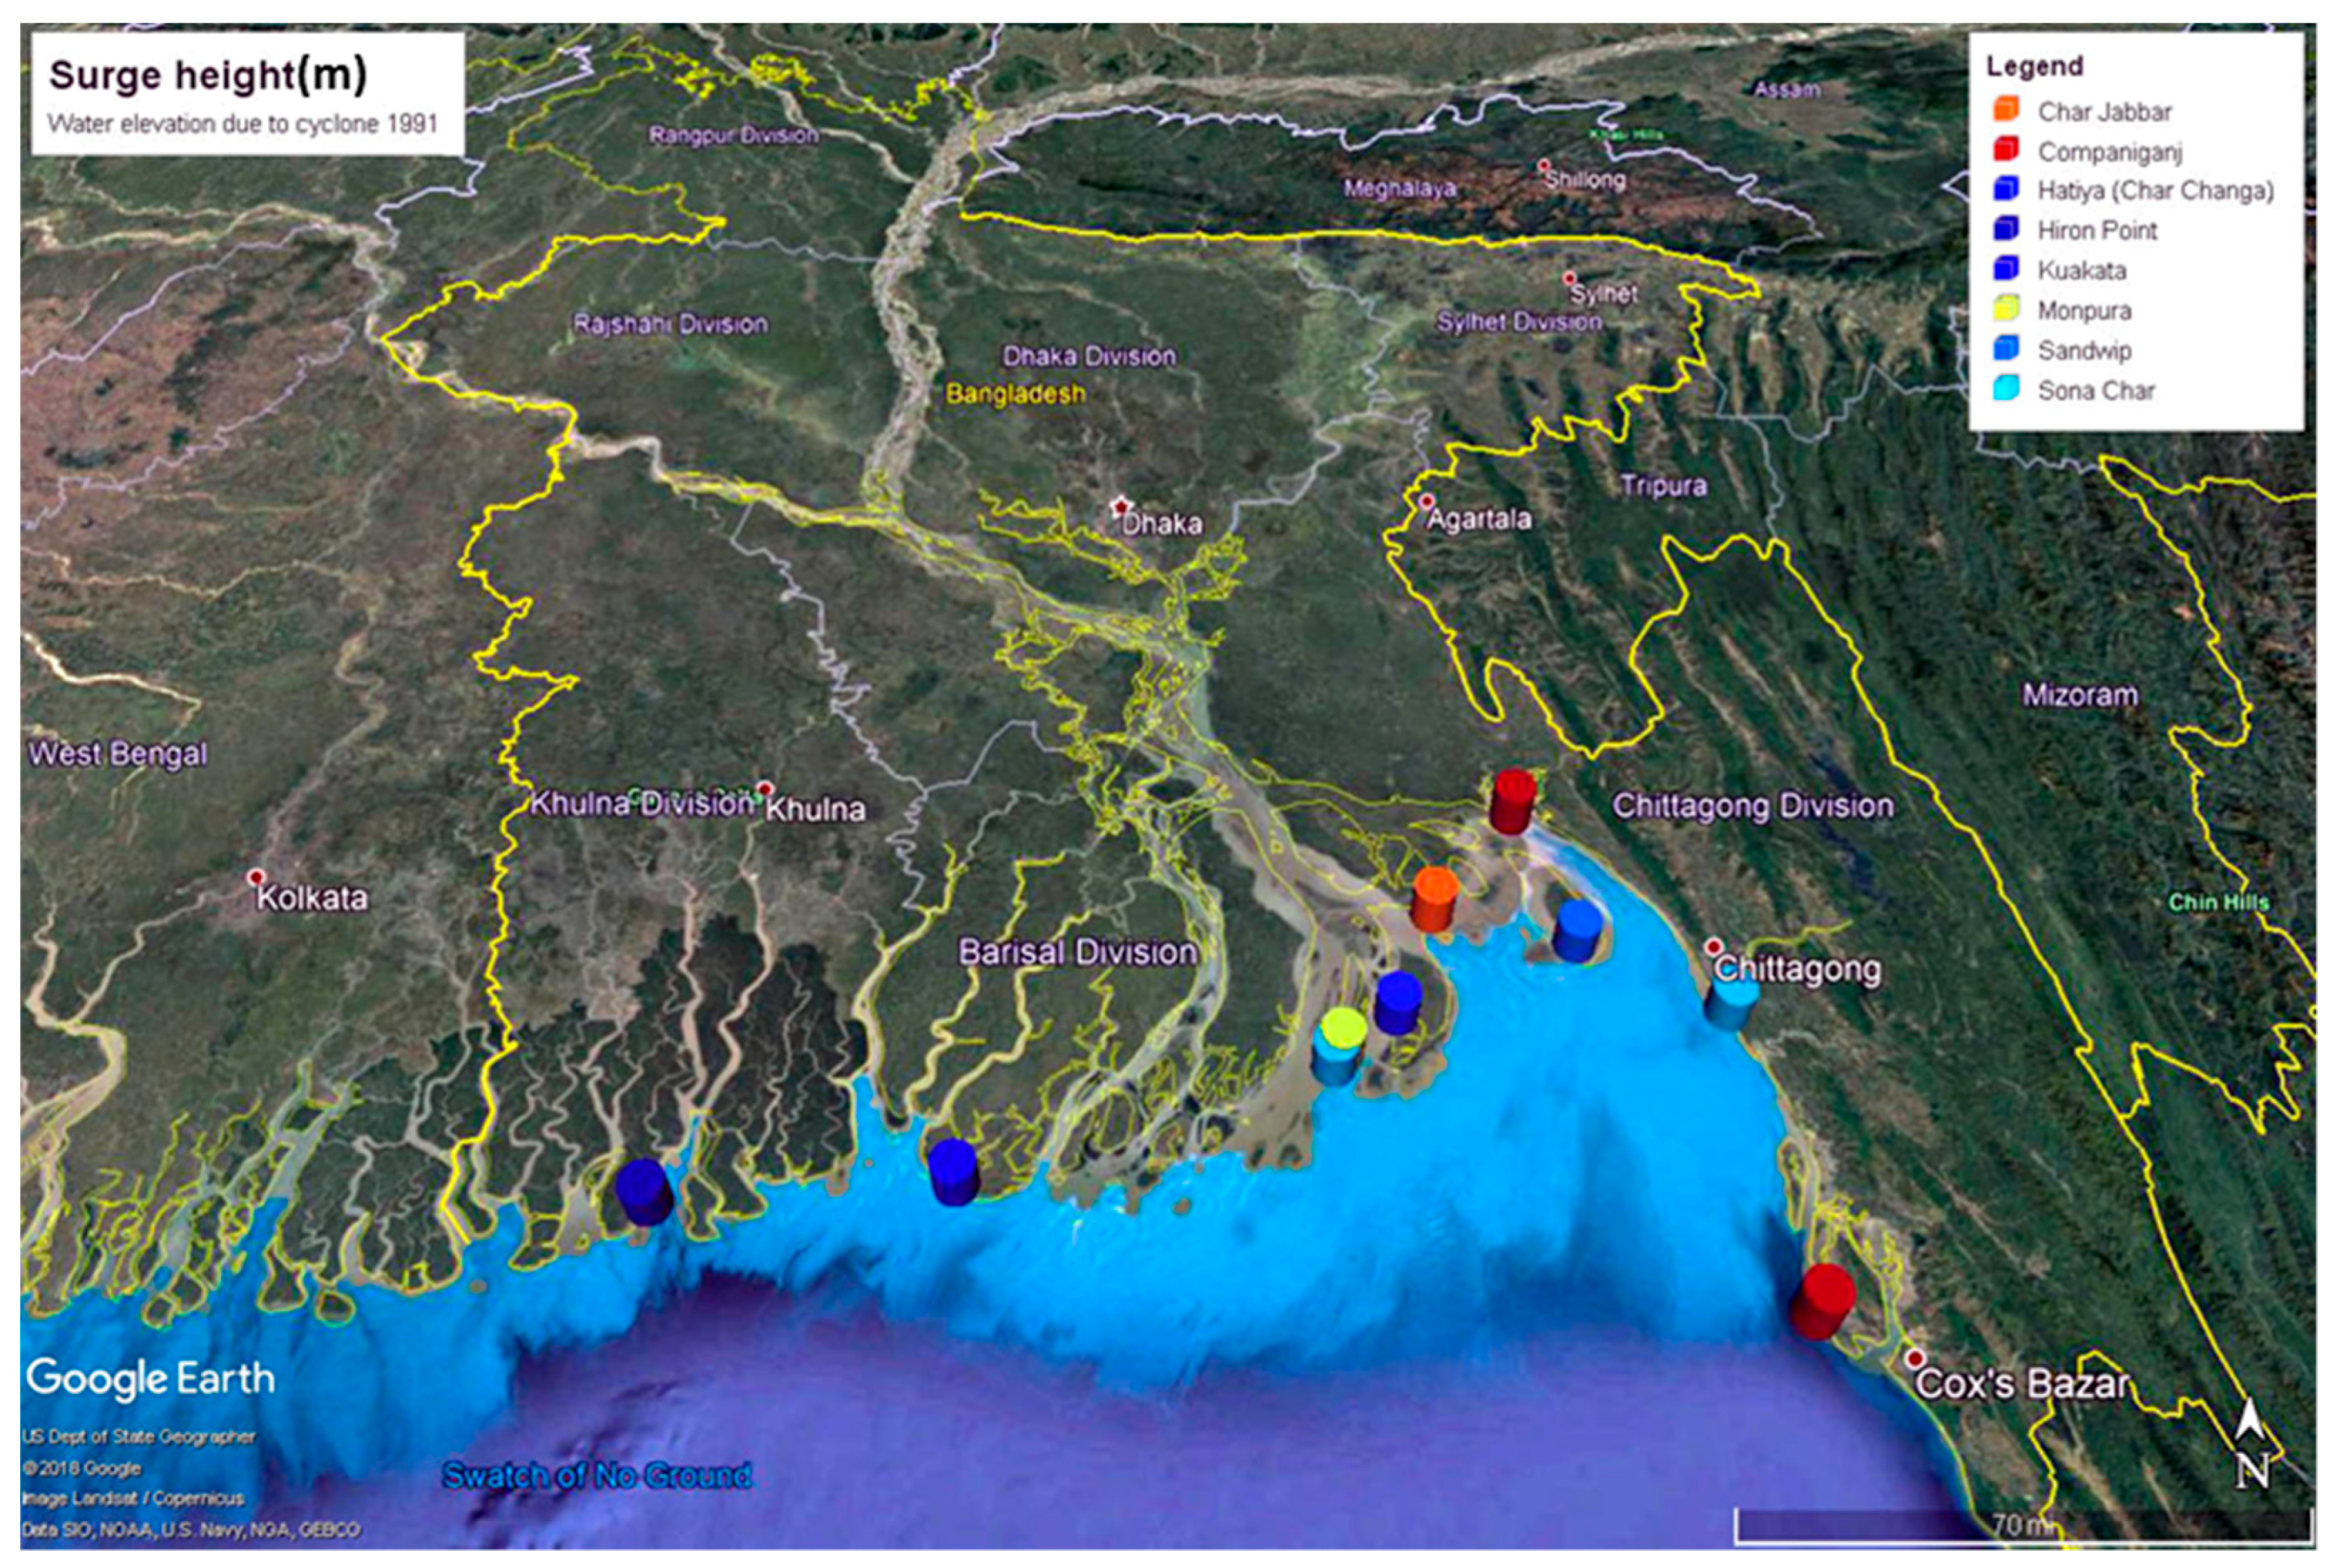
Cyclone April 1991 and a recent cyclone MORA were considered to validate our model simulation. The results were computed for 72 h of the storm from 0800 local time (LT) of 27 April to 0800 LT of 30 April for the storm April 1991 and 27 May 2017 UTC 0600 to 30 May 2017 0600 UTC and the results are presented for the last 48 h at some of the stations shown in Figure 1. We ran the model to simulate the surge height at different tidal stations. Figure 6 shows the surge height at some of the tide stations. To understand the investigated surge height clearly in the map locations, we multiplied the simulated surge height with an arbitrary number 100 for the altitude.
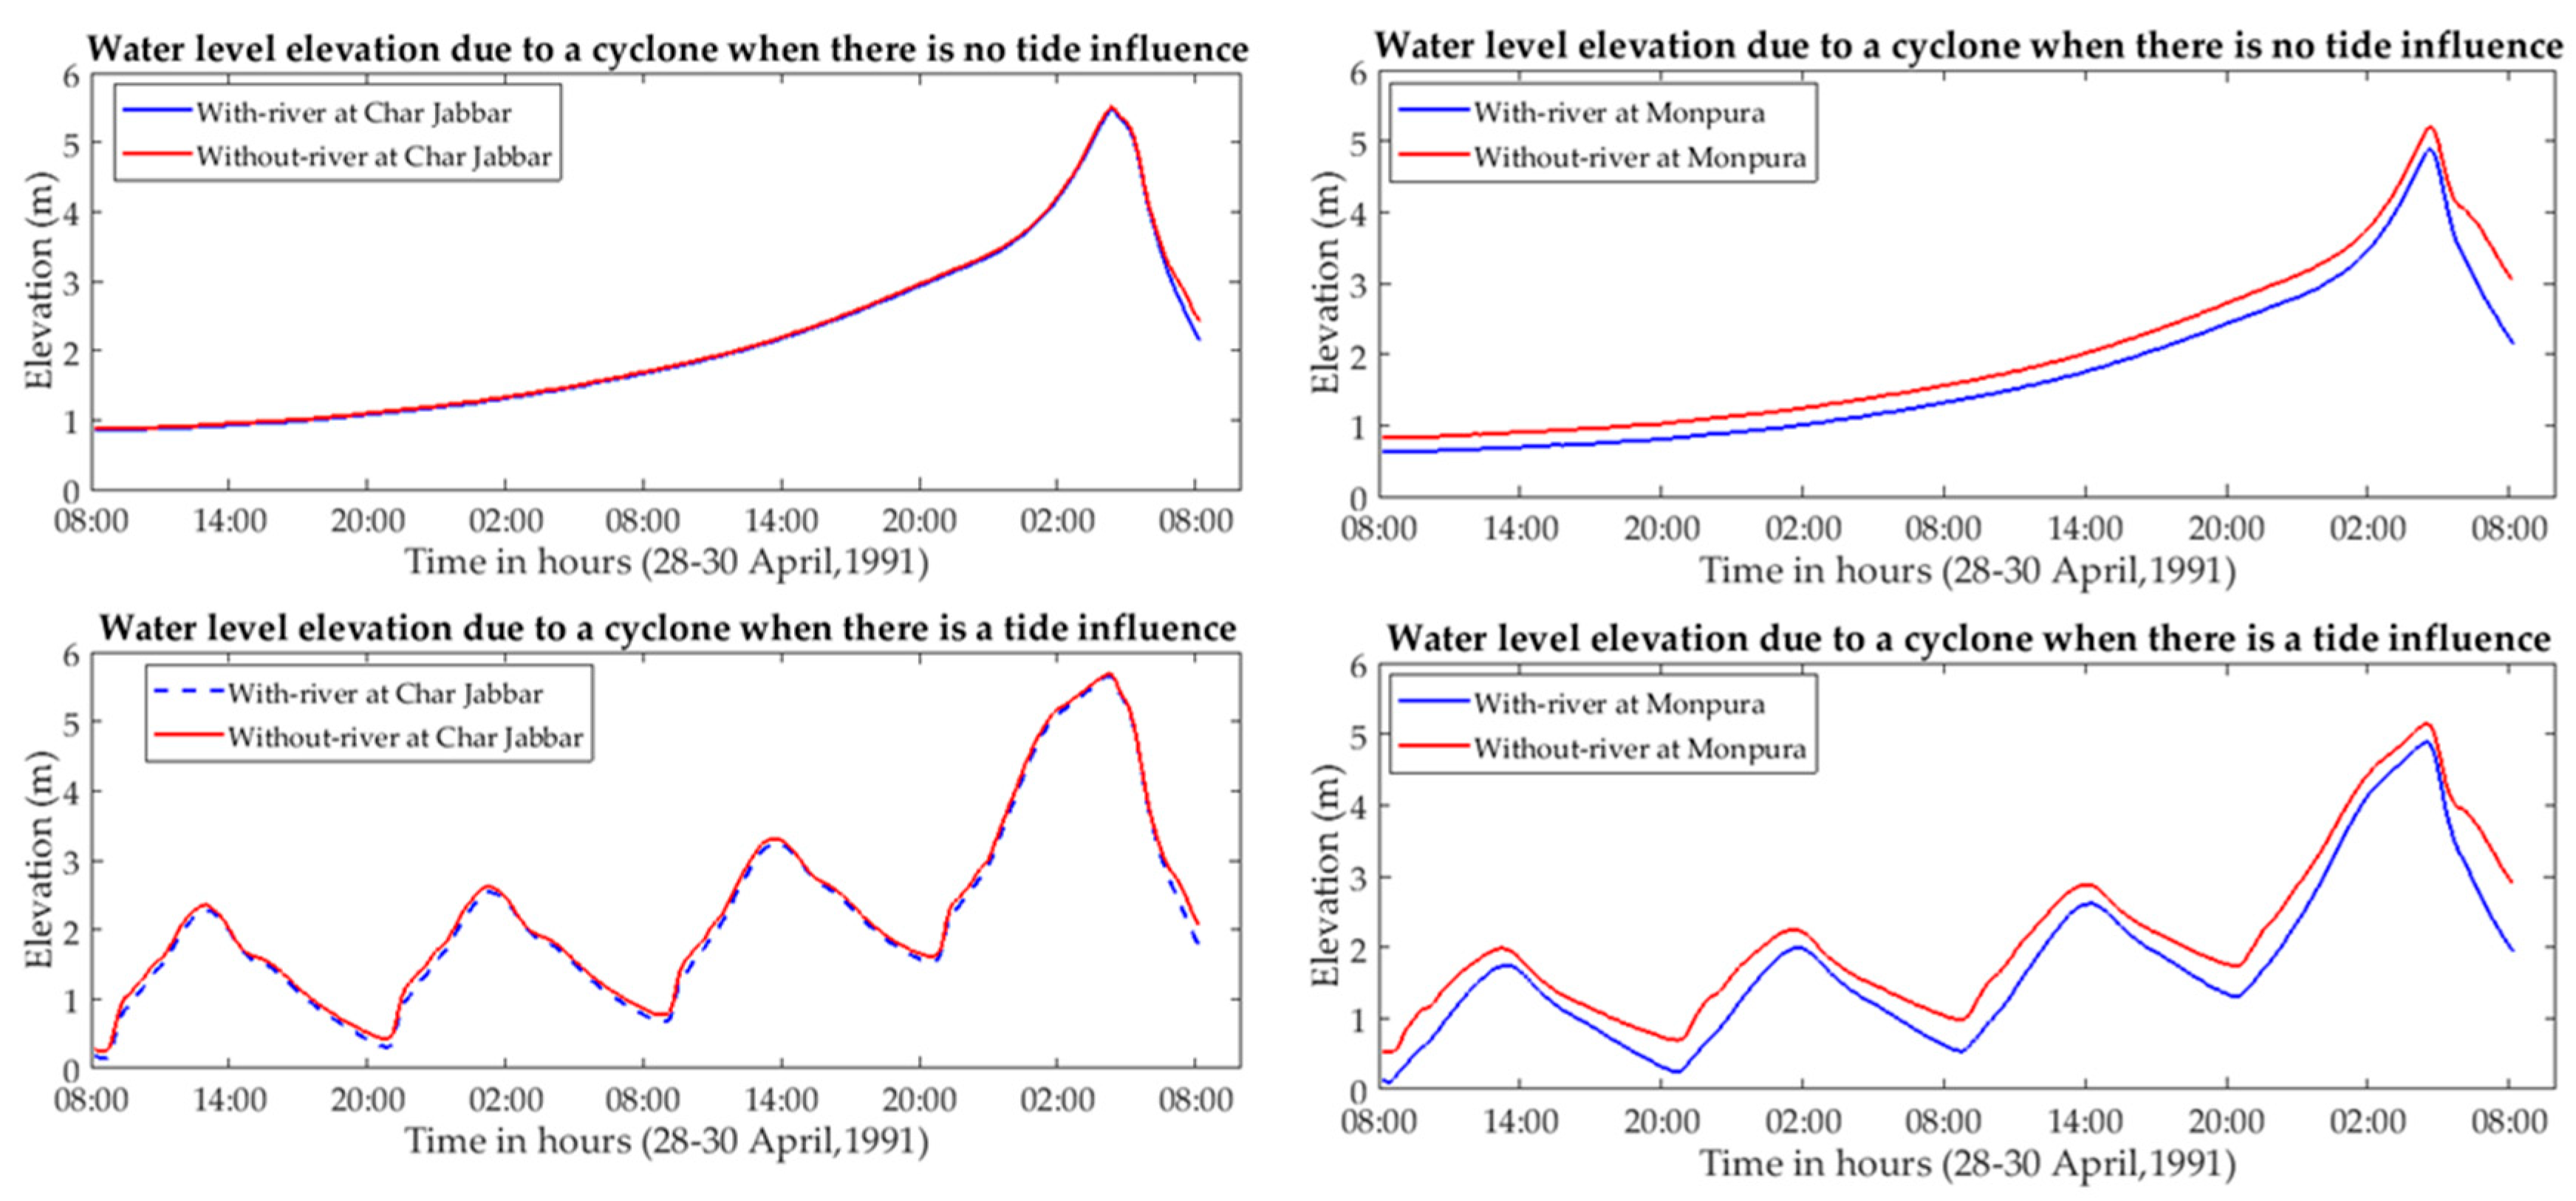
The model results that came out in this case fairly agrees with the observed tidal data collected from the Bangladesh Inland Water Transport Authority (BIWTA). In our investigation, we ran the bay and river model for the different cases; the cases were with and without the inclusion of the river. For those cases, we ran the model to consider the tide and surge. Figure 7 shows the water level elevations due to surge at the representative locations along the coast of Bangladesh when there was no tidal influence. It can be seen from Figure 7 that the maximum surge height came out through our calculation (3–6 m). We found that a strong recession could occur at Hiron Point. At Hiron Point, a strong recession occurred after 2:00 a.m. (LT) on 30 April. The reason behind why this recession took place was due to the backwash of water towards the sea. The figure indicates that a recession is delayed if the cyclone went from western to eastern coastal locations. Our calculated maximum water level due to the surge was only 5.98 m at the Cox’s Bazar tide station. This simulation result did not incorporate the influence of the lower Meghna river and the tidal influence. The right part of the same figure shows the simulation result at the same location when there was no river in the model simulation. Due to the river influence, we found that the water level elevation was reduced at some locations. Figure 8 indicates the results of tide, surge and their interaction at the same location presented in Figure 7, however, this figure shows the same condition simulation results but the nonlinear interaction of the M2 tide was introduced here. From this simulation, the water level was found to be (3–6.8 m).
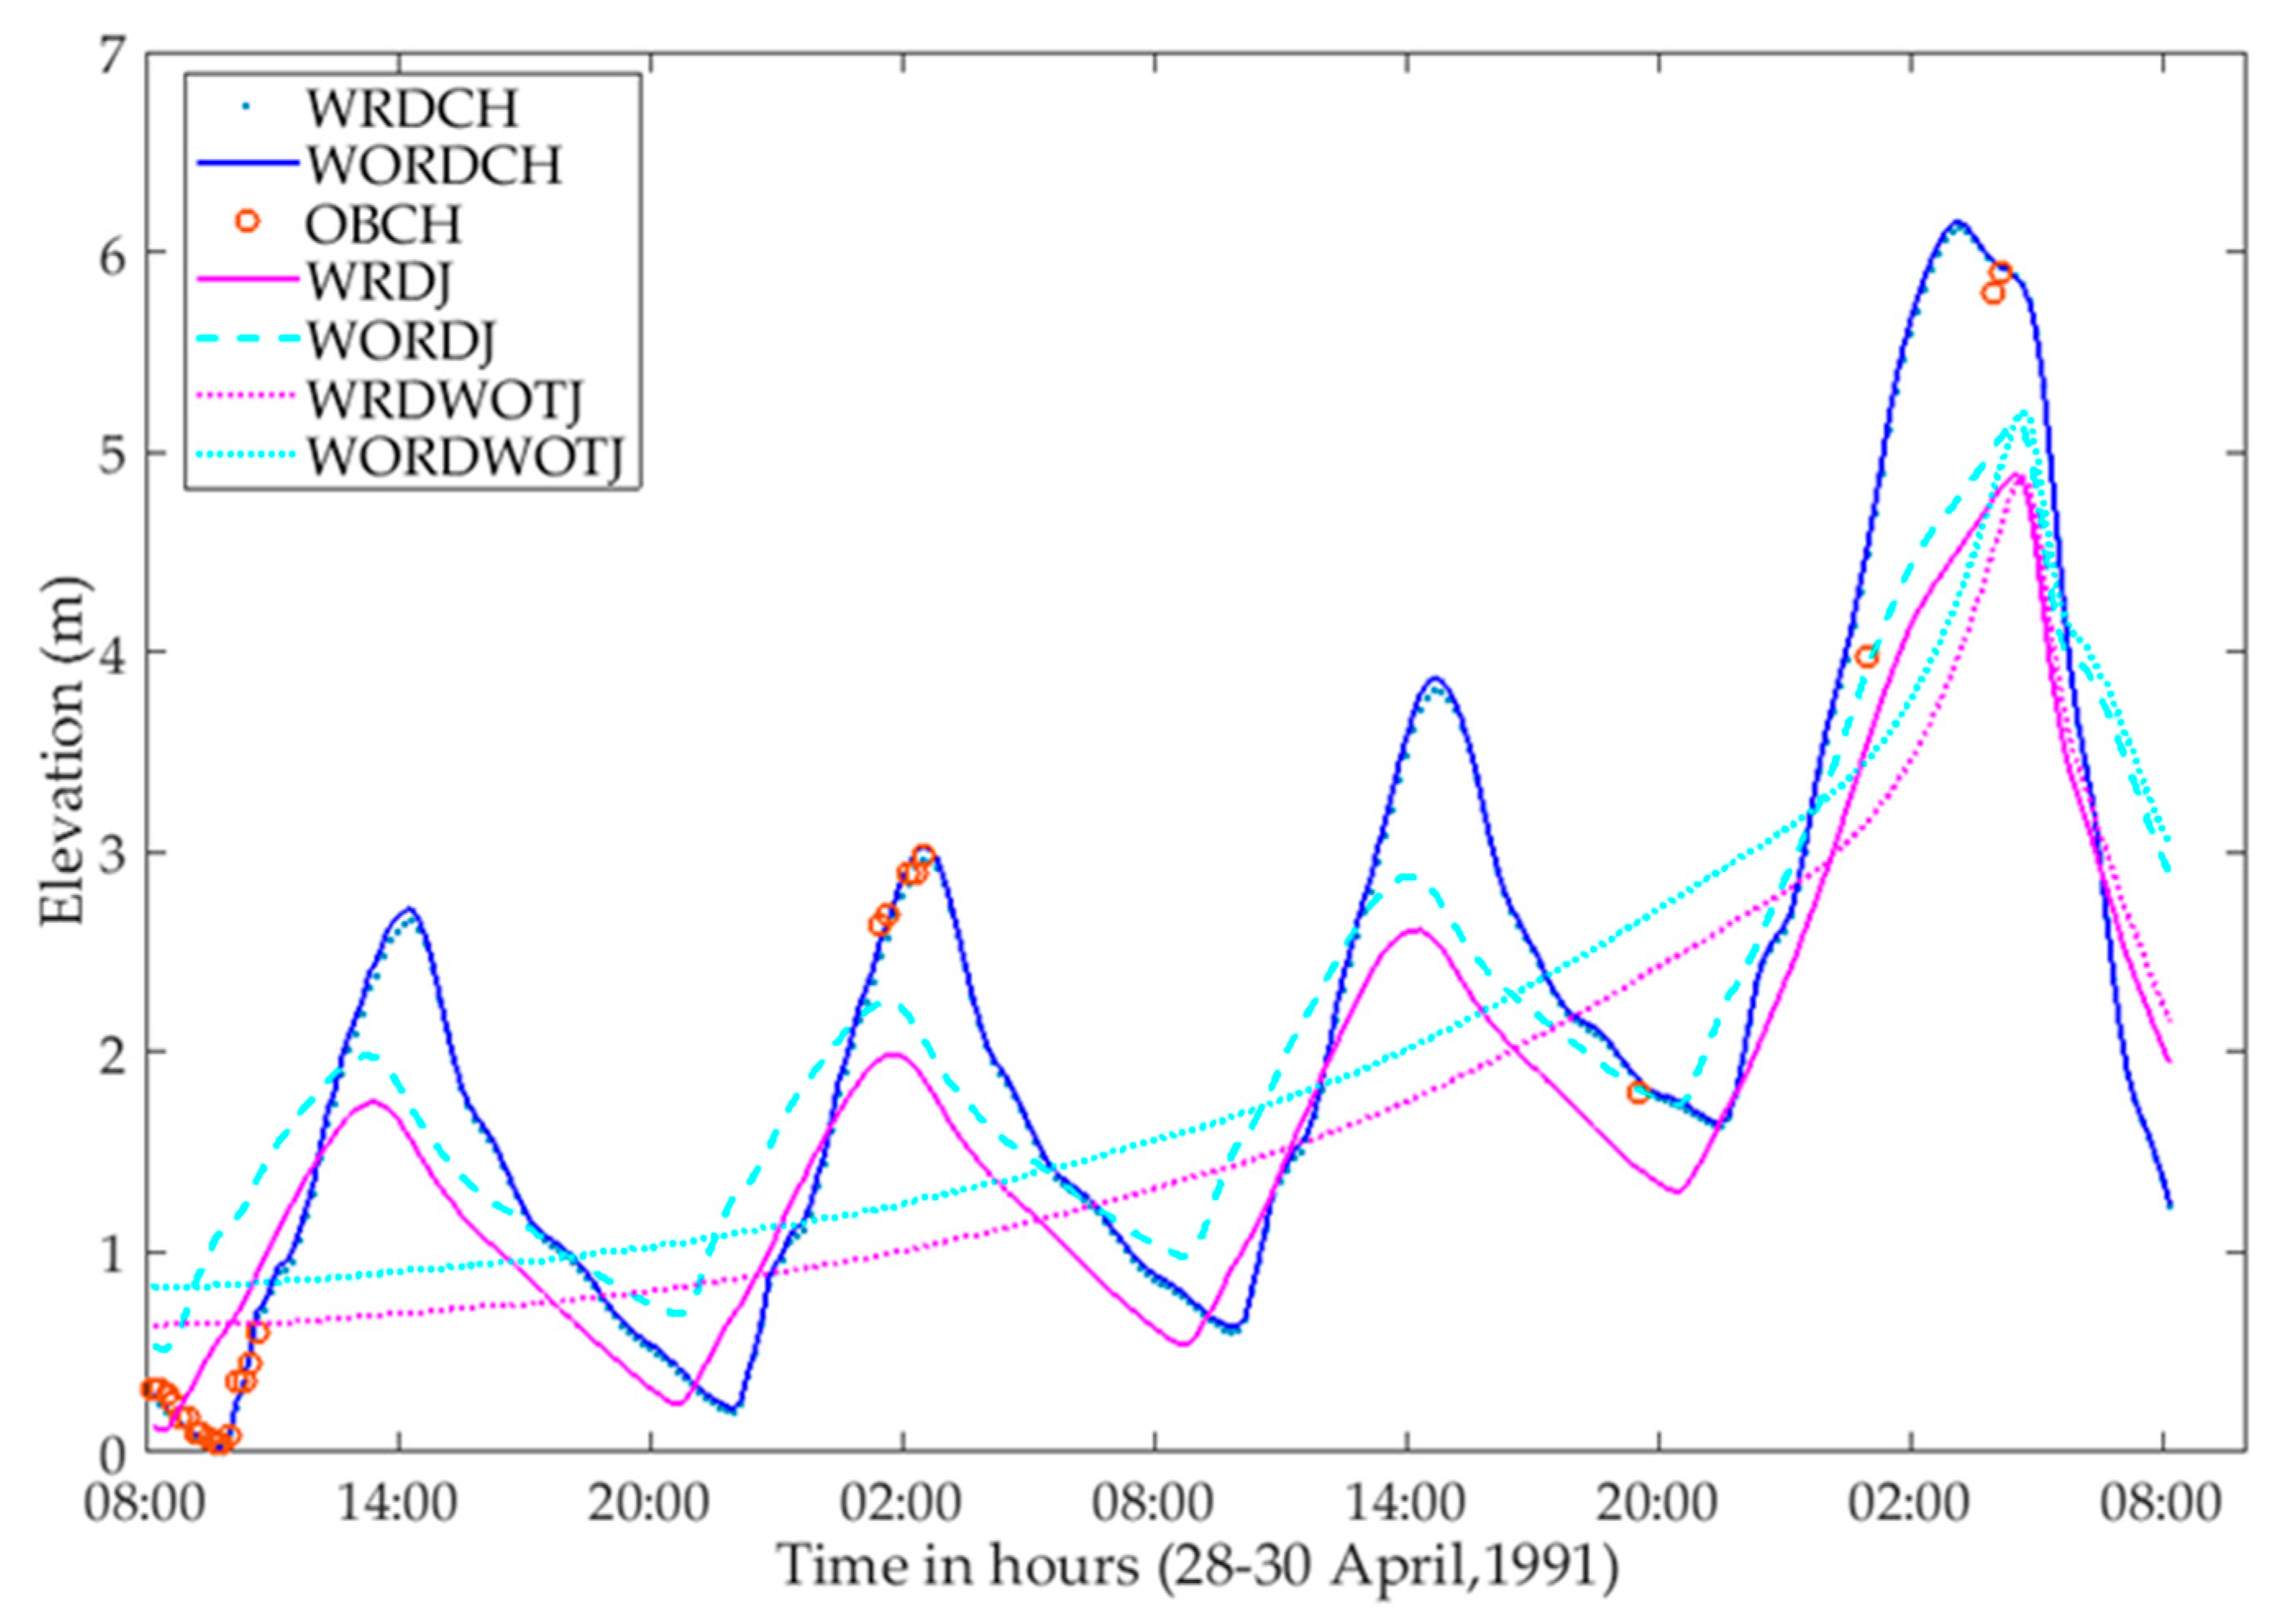
In this simulation, we used the M 2 tide at the southern open sea boundary and nonlinear interaction with the surge height. The results obtained from [22,34,35] fairly agreed well with the computed data. Due to the impact of the tide, the height of the water was very high due to the storm crossing the coast. Finally, we found that the river had some influence on the surge simulation. When we considered the river in our model simulation, we found that the surge height fluctuated at different tidal stations. Near the mouth of the river channel, the surge height decreased by up to 10–20% than at the other tidal stations. Figure 9 shows the investigation results near the mouth of the river (Sona Char Island (Figure 1)). The direct impact of the storm elevation in the river estuarine or nearby was noticed. For this reason, we found that the wave height decreased around the estuarine area. The reason behind the reduction was that the piled-up water penetrated inside the river and flooded the innermost area of the land. However, some areas of the Chandpur district 40 km away from the estuary were also inundated due to storm surge. Figure 9 explains the effects of the river on the water level elevations due to cyclone 1991. The left-hand side of Figure 9 shows the water level height outside of the bay–river junction area and the right side shows the water level height at the junction area. Figure 9 shows that there was an acceptable impact on the storm by the river. The figure explains simulation results of the different conditions mentioned as the tide, without tide, river and without river impact. The Bangladesh Inland Transport Authority (BIWTA) reported that the maximum water level at Cox’s Bazar was six meters and the water level along the coastal region of Bangladesh was computed as 3–6.8 m. Our model computation reported that the water level height at the Cox’s Bazar tide station with both the river and without river influence was 10–30 cm. However, at the junction point and near the estuary, the water level height fluctuated between 1–1.2 m. To test the accuracy of our model simulation results, Figure 10 shows the combined results of our simulation and the observed data.
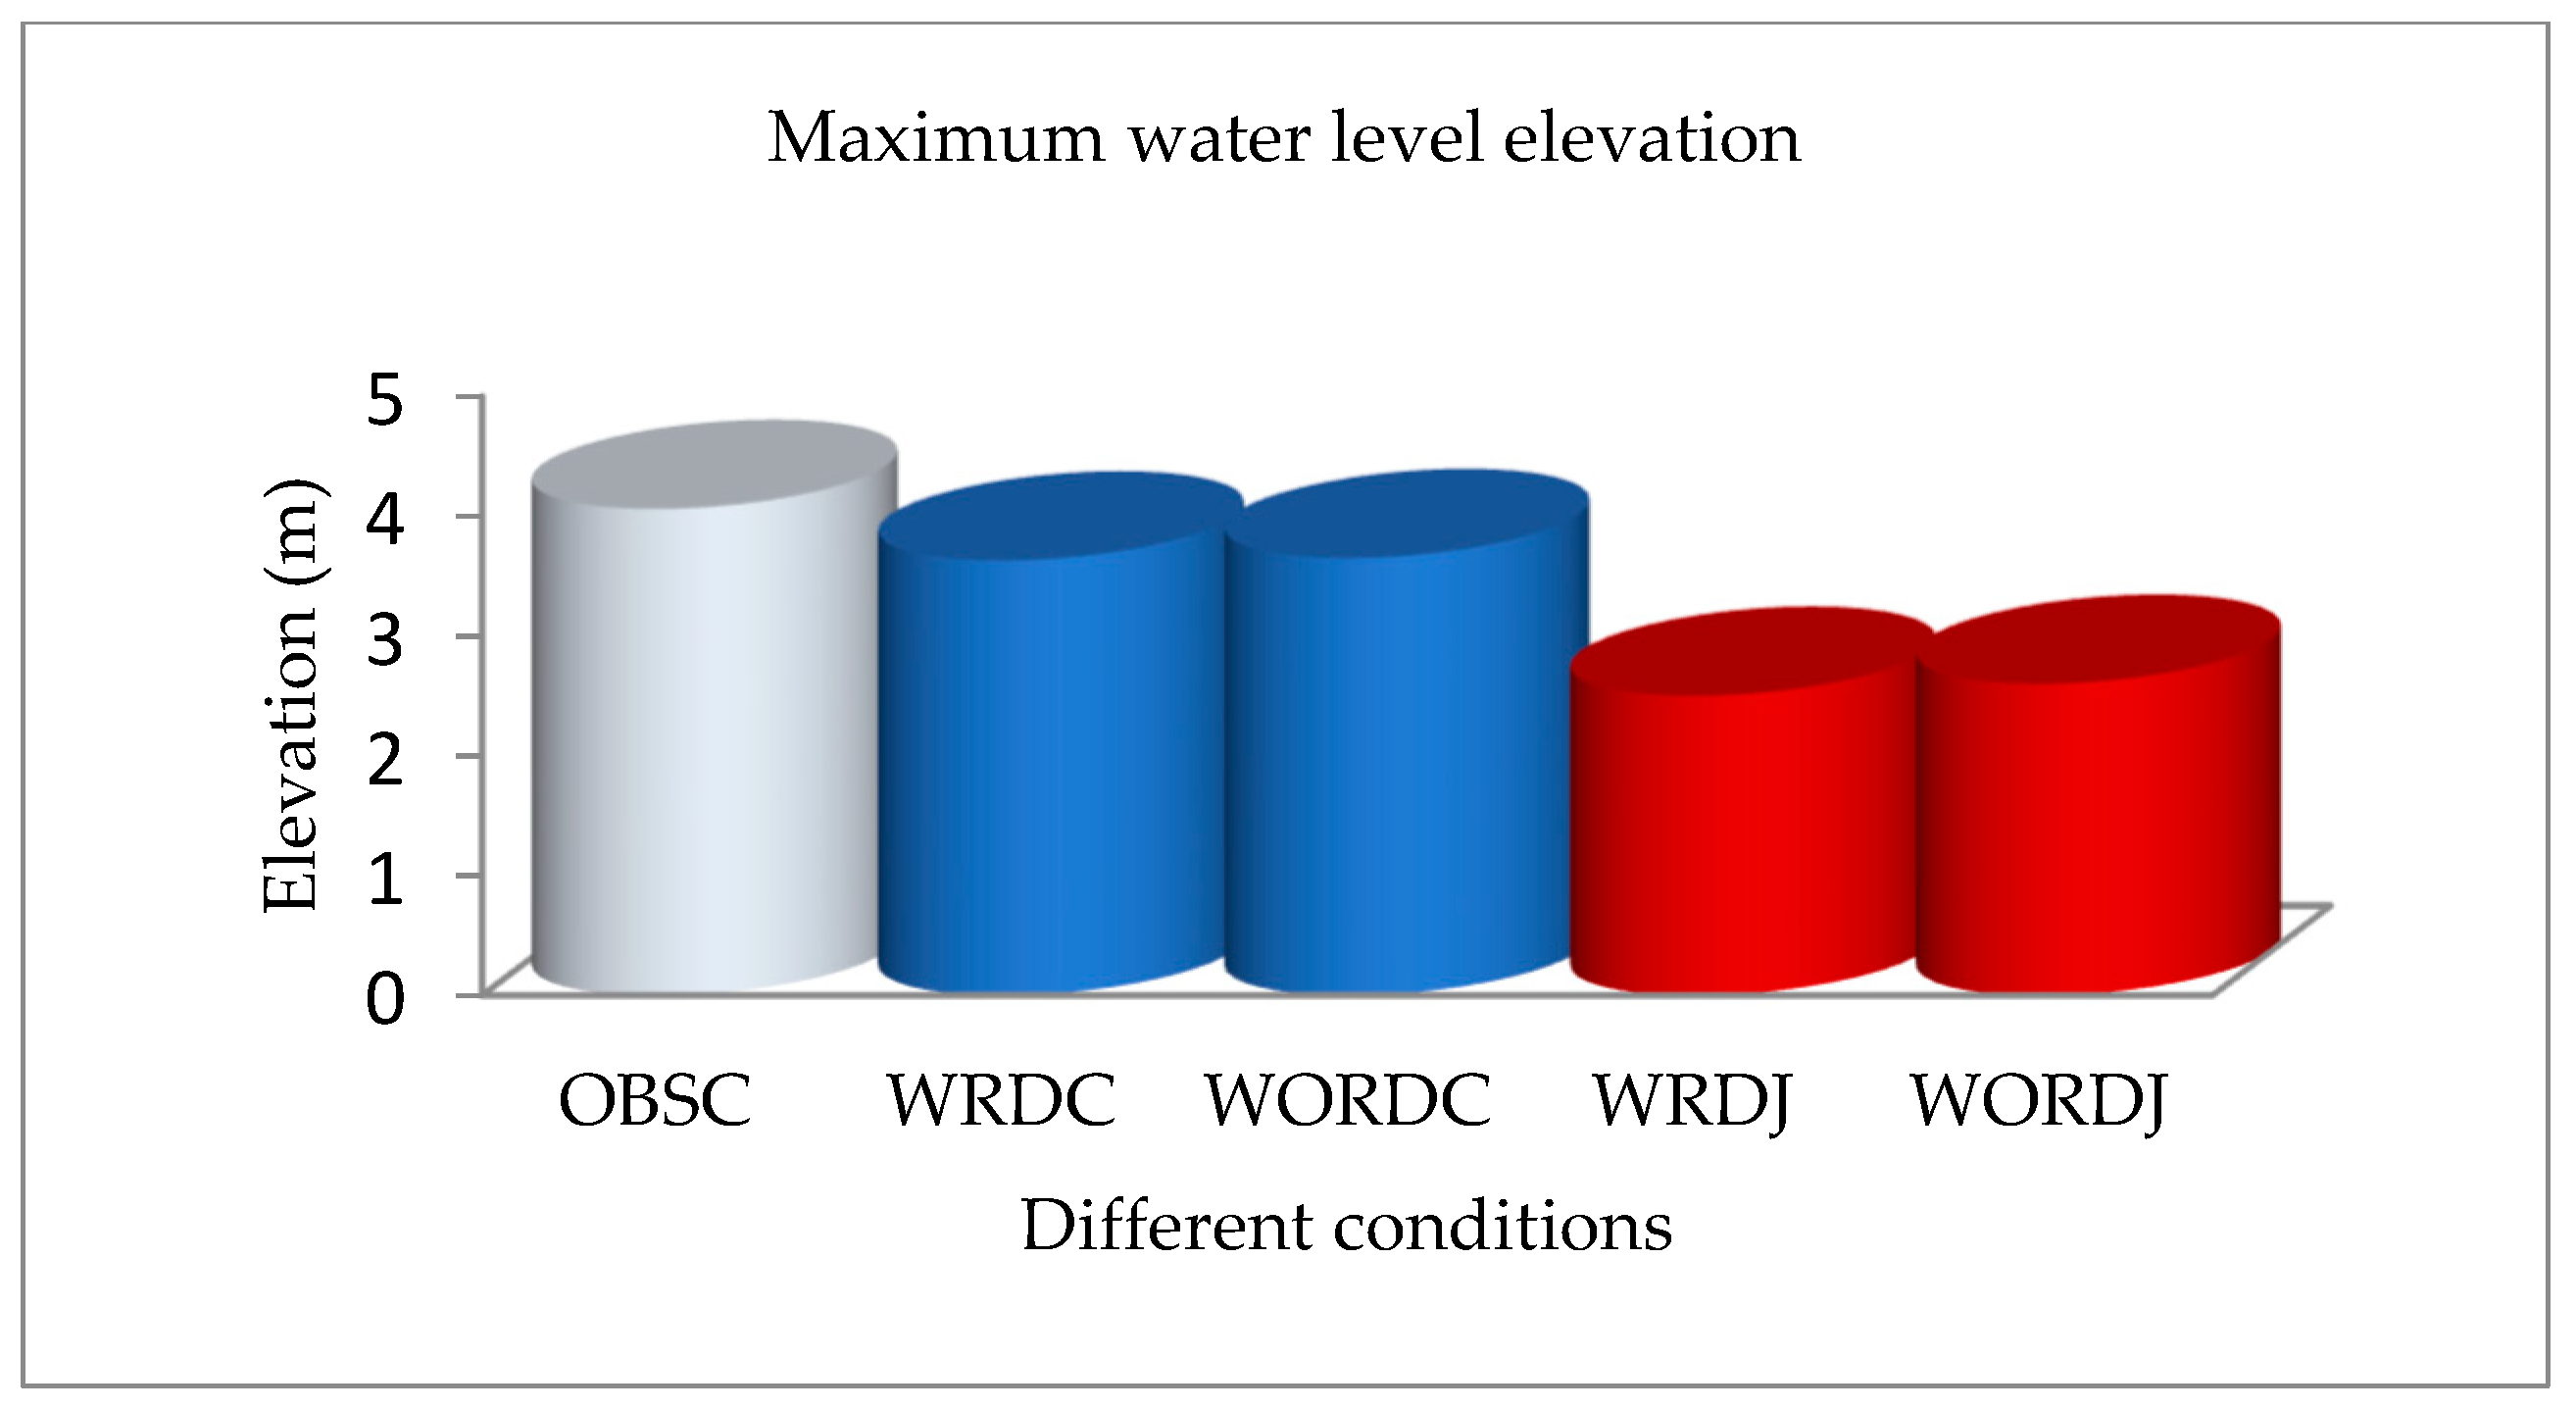
A direct comparison of our model simulation with the observed data was limited. The reason behind this may be due to the rough weather and the manual process of data collection. The red circle shows the observed data collected from the Bangladesh Inland Water Transport Authority (BIWTA), which were very scarce. The figure legend ‘WRDCH’ represents the surge height considering the river impact at the Cox’s Bazar tide station and ‘WORDCH’ stands for without river discharge at the Chittagong tide station. Similarly, ‘OBCH’ represents the observed data at the Cox’s Bazar tide station. The results ‘WRDJ’, ‘WORDJ’, ‘WRDWOTJ’ and ‘WORDWOTJ’ represent the simulated surge height at the junction point (Sona Char (Figure 1)) with the condition of the inclusion of river (WRDJ), without river (WORDJ), inclusion of the river and tide (WRDWOTJ) and without inclusion of the river and tide (WORDWOTJ).

5.2. Results Discussion

In this study, the impact of river systems has been observed by the two-dimension bay-river couple model to determine the storm surge height. From the above-mentioned figures, it is observed that the river has a visible effect on the water level height due to a storm. Therefore, the river channel and the coastal structure [36,37] of Bangladesh has an inpact on storm surge height. Table 2 provides the overall peak of the water level height at some location near the coastal area. The results of Table 2 have a similarity to our study with the results of other research.
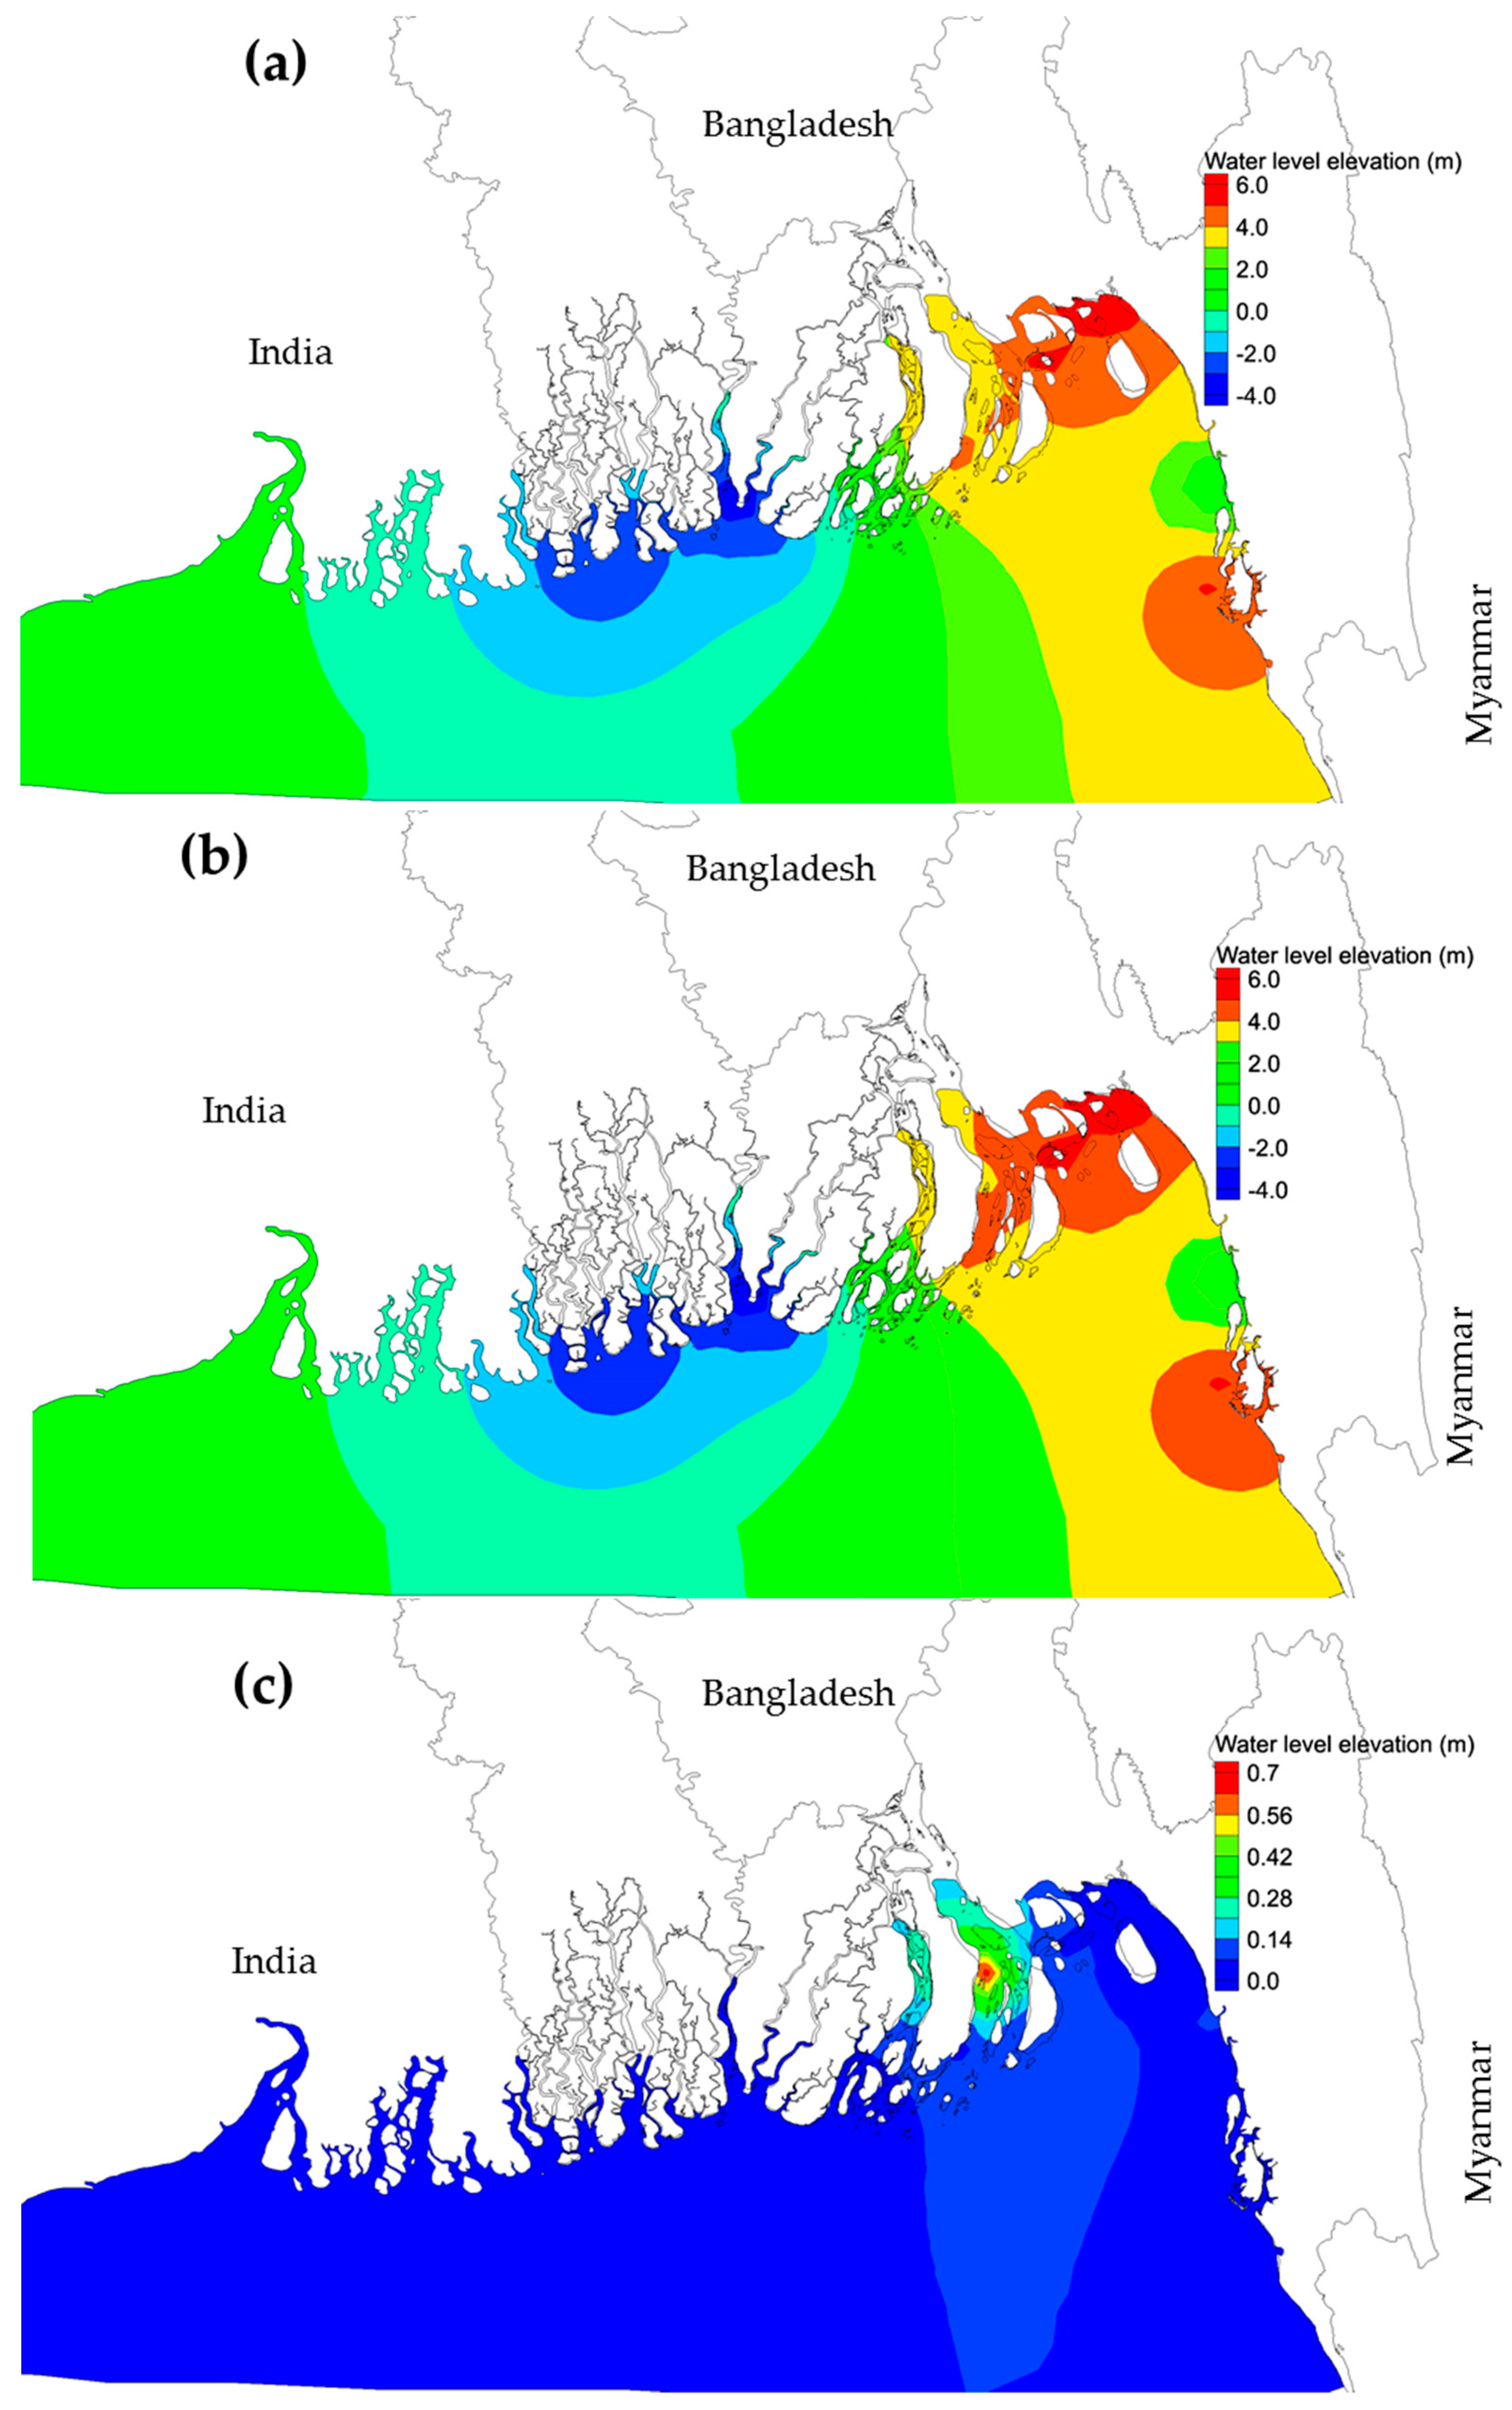
To understand more clearly the influence of river on the surge simulation, the water level elevation distribution results are represented by the Figure 11.
It is revealed by our findings that, the surge height influenced by the river system due to the inward inflow through the river channel. Though the freshwater has some influence, the surge height was dominated by the river discharge effect. Figure 11c shows the maximum reduces of surge height (m) near the junction area. This effect could be found due to inland penetration of water flow. In our study, we have used the average discharge of fresh water but there may have the seasonal impact. Therefore, it is important to find the seasonal river discharge impact on surge height near the junction area. However, this study investigates surge height considering the yearly average river discharge. The model can be improved by incorporating the precipitation model in future.
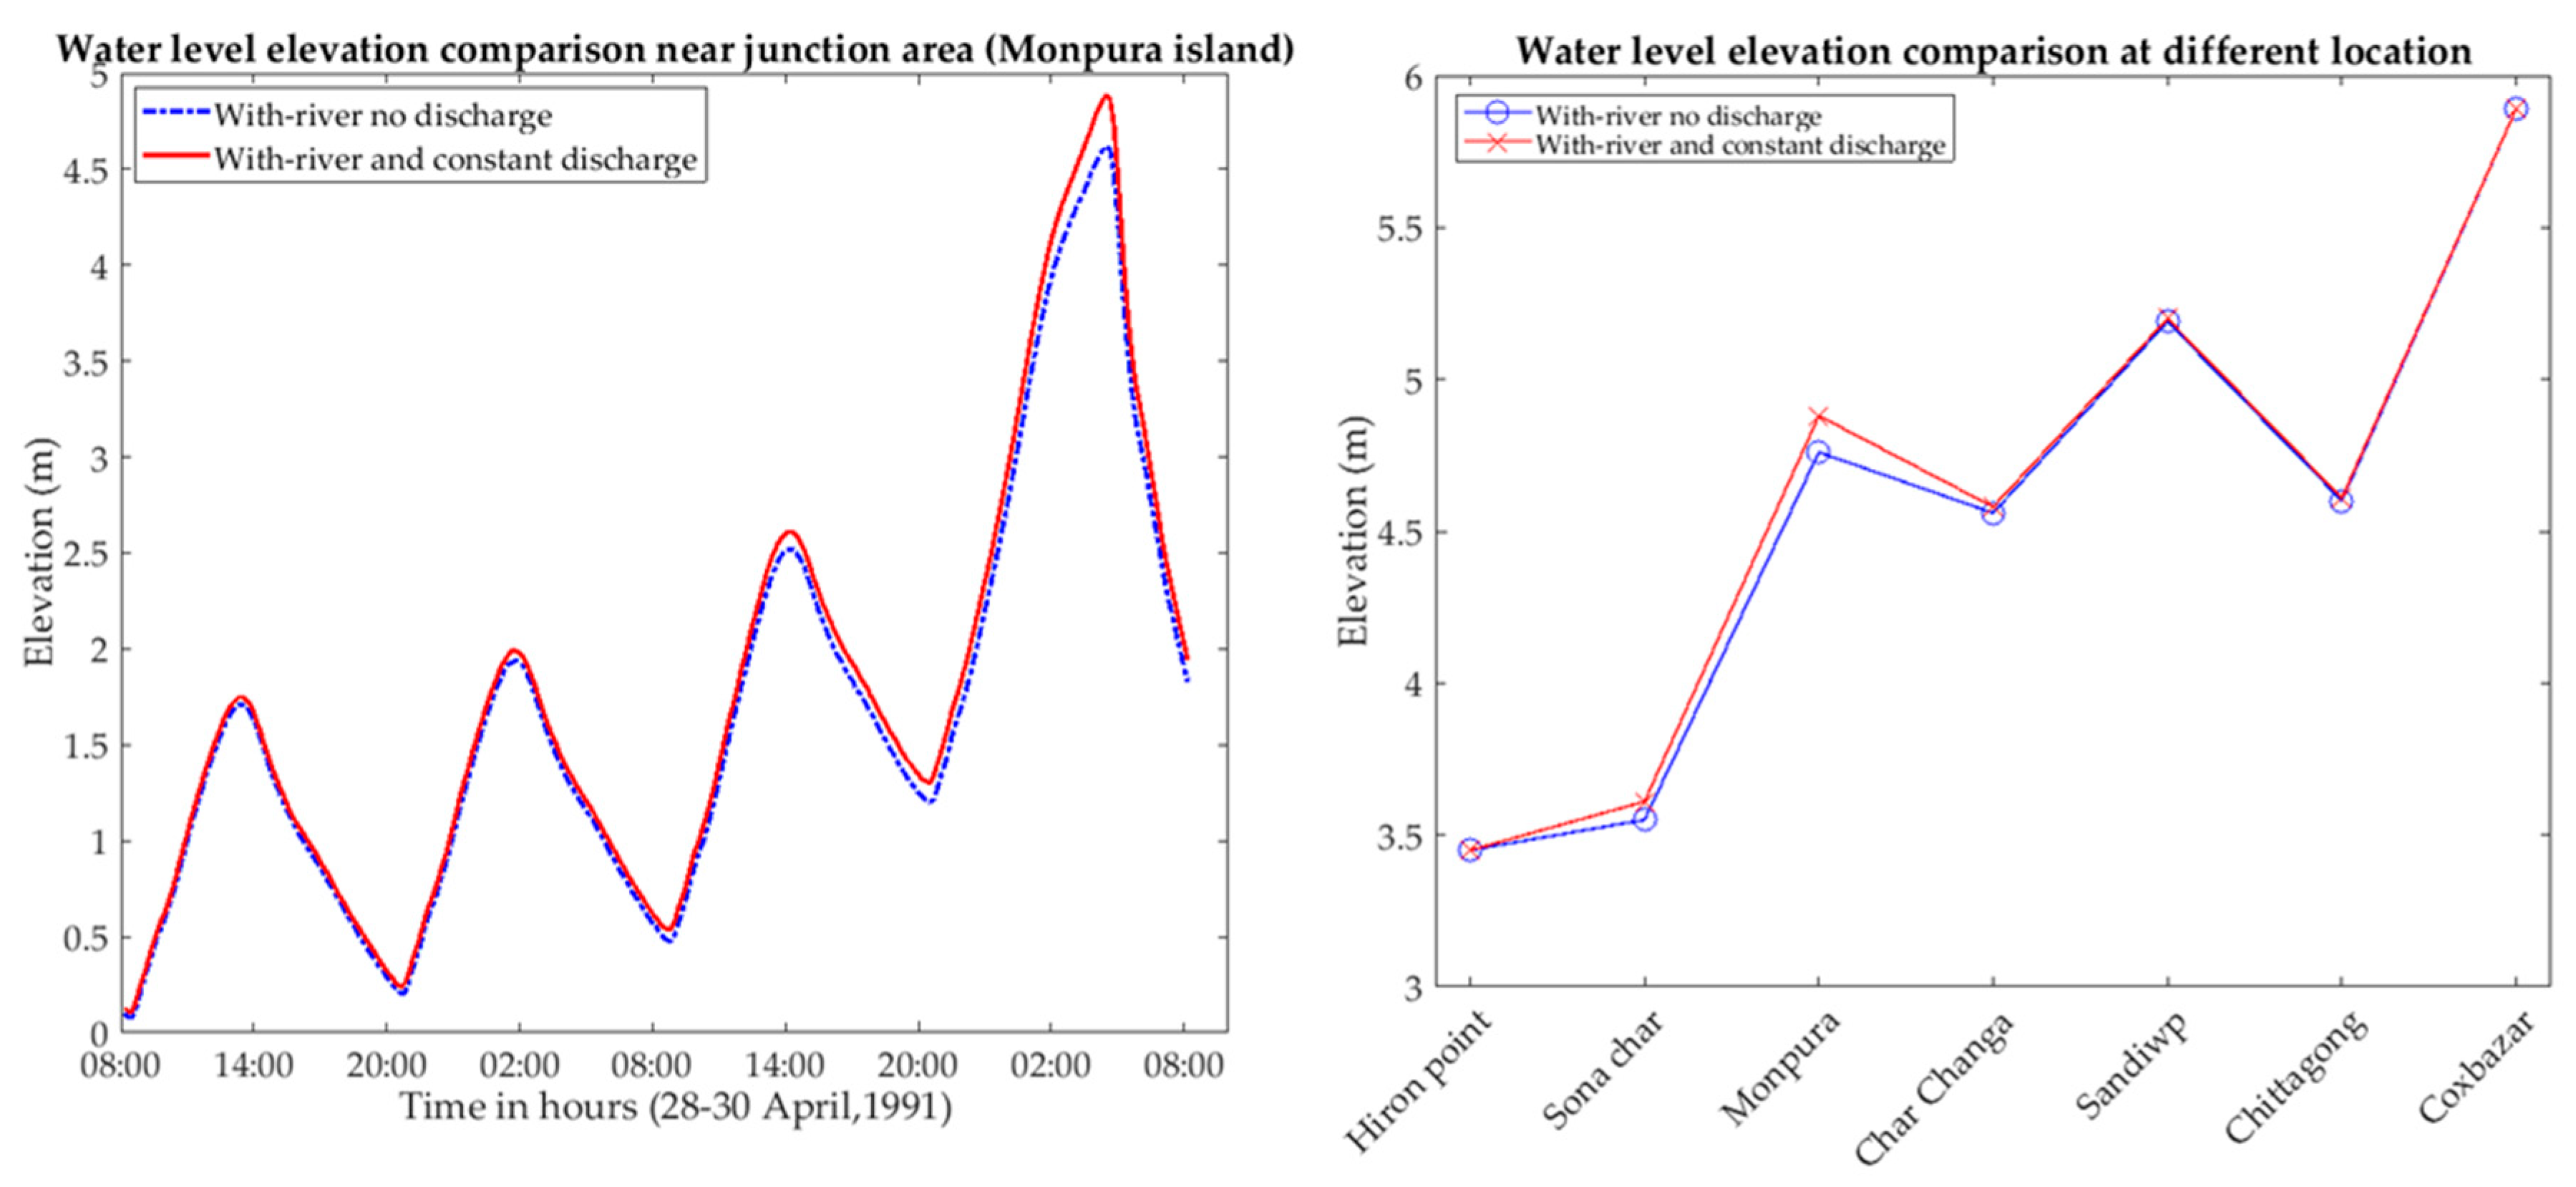
The Figure 12 shows the effect of river discharge on water level elevation due to a storm. For the numerical computation, we set the river discharge at zero and a yearly average value of 5100.00 m3/s. The left figure of Figure 12 shows the time series result of river discharge impact on the water level elevation due to a storm near the junction are Monpura island (see Figure 1). The right figure of Figure 12 shows the discharge impact at some reported location near the coast. Obviously, the surge height fluctuation near the junction area depends upon the characteristics of cyclone behavior like strength and landfall direction of a cyclone. Maybe the reason behind this, we have found a negligible impact of the river in another storm (MORA) surge simulation. We have mostly focused on the cyclone 1991, because of the huge study has been done on this storm by the researcher. We have run our model for the recent cyclone MORA and found the result reported in Figure 13. This figure shows the maximum water level height at Cox’s-Bazar tide station and the Junction area (Sona char). The result represents the water level height due to the tide and surge interaction under the condition of considering the river and without a river.
The results obtained by the different investigations and our computed water levels due to a surge at some stations with other coastal locations compared well. The height computed for both models were compared with and without the inclusion of the rivers for the April 1991 cyclone and MORA. The maximum surge height computed from the bay model at junction point (Monpura Island) was 5.2 m while at the same location, the value computed from the bay–river model was 4.88 m (Table 2). Thus, there was an average of a 10% to 20% reduction in the overall maximum surge height computed the from bay–river model due to the penetration of piled up water inside the Meghna River. In addition, the penetration depended upon the characteristics of the cyclone. Therefore, we found that there was a negligible impact of the river on the water level elevation due to cyclone MORA. Due to the river channel near the head of the river (Chandpur district), the peak surge values computed from the bay–river coupled model were 2.8 m approximately. It can be noted that the effect of the presence of the Meghna River was confined. Thus, the maximum water level elevations computed from the bay–river coupled models along the coast of Bangladesh were different from the bay model simulation where the Meghna River joins with the bay.

6. Conclusions

In this study, a two-dimensional bay–river coupled model was developed to test the effect of the Ganga–Bhramutra–Meghna river system on the water levels associated with a storm along the coast of Bangladesh. The study showed that the effect of a river on the water levels associated with a storm was dependent on the strength of the cyclone. The inclusion of the river in our model showed that the maximum water level due to a storm was reduced by up to 20% at the near location of the river mouth. It was confirmed by this study that the river had some influence on the water level elevation due to a storm. The presence of the river reduced the water level elevation due to a storm but the river discharge influence on the water level elevation increased. Thus, the response of a river on the surge development is appreciable and cannot be ignored for storm surge prediction purposes. However, the model has some limitations but the model can be used for operational predictions of storm surges along the coast of Bangladesh.

Author Contributions

M.A.A.M. developed the model, conducted the numerical analysis and wrote the paper. M.Y. and N.H. provided motivation for this study with good discussion and valuable comments and suggestions. M.B.M. checked the geological stability of this work with some good decisions and discussion. Y.I. and M.K. revised this manuscript to improve it.

Funding

This research was funded by “[Ministry of Education, Culture, Sports, Science and Technology, Japan] grant number [163618]”.

Acknowledgments

The author M.A.A.M. acknowledges the receipt of a scholarship from the Ministry of Education, Culture, Sports, Science and Technology, Japan with number 163618 and is obligated to the Coastal and Ocean Engineering Laboratory Authority, Kyushu University, Japan. The authors would like to thanks Gour Chandra Paul and Masum Murshed, Department of Mathematics, Rajshahi University, Bangladesh, for their endless help and support. We would like to thank the Bangladesh Meteorological Department and Bangladesh Inland Water Transport Authority for providing the necessary data.

Conflicts of Interest

The authors declare no conflict of interest.

Appendix A

SlDateTimeStatusArea of the SystemLatitude/LongitudeBulletinDistance (km)Signal
01.26.05.2017AfternoonLowSE Bay and adjoining Central Bay ----
02.27.05.2017AfternoonWMLSE Bay and adjoining Central Bay----
03.28.05.20179:00 a.m.
(03 UTC)
DepressionSE Bay and adjoining Central Bay15.2° N/90.6° ESWB:
01
Ctg:790;
Cxb:710;
Mgl:815;
Payra:755
DC-I for all maritime ports
04.28.05.201712 Noon
(06 UTC)
Depression SE Bay and adj Ctl Bay15.2° N/90.6° ESWB:
02
Ctg:790;
Cxb:710;
Mgl:815;
Payra:755
DC-I for all maritime ports
05.28.05.20173:00 p.m.
(09 UTC)
Deep DepressionSE Bay and adj Central Bay15.4° N/90.6° ESWB:
03
Ctg:770;
Cxb:690;
Mgl:790;
Payra:735
DC-I for all maritime ports
06.28.05.2017 6:00 p.m.
(12 UTC)
Deep DepressionSE Bay and adj Central Bay15.7° N/90.7° ESWB:
04
Ctg:735;
Cxb:655;
Mgl:760;
Payra:700
DC-I for all maritime ports
07.28.05.20179:00 p.m.
(15 UTC)
Deep DepressionSE Bay and adj Central Bay15.8° N/90.8° ESWB:
05
Ctg:720;
Cxb:640;
Mgl:750;
Payra:690
DC-I for all maritime ports
08.29.05.2017
(28.05.2017)
Midnight
(18 UTC)
Cyclone ‘Mora’EC Bay and Adj area16.2° N/91.2° ESWB:
06
Ctg:670;
Cxb:590;
Mgl:715;
Payra:650
DW-II for all maritime ports
09.29.05.2017
(28.05.2017)
3:00 a.m.
(21 UTC)
Cyclone ‘Mora’EC Bay and Adj area16.7° N/91.2° ESWB:
07
Ctg:615;
Cxb:535;
Mgl:665;
Payra:595
DW-II for all maritime ports
10.29.05.2017
(28.05.2017)
6:00 a.m.
(21 UTC)
Cyclone ‘Mora’EC Bay and Adj area17.1° N/91.2° ESWB:
08
Ctg:570;
Cxb:490;
Mgl:620;
Payra:555
LW-IV for all maritime ports
11.29.05.2017
(29.05.2017)
9:00 a.m.
(03 UTC)
Cyclone ‘Mora’EC Bay and Adj area17.5° N/91.3° ESWB:
09
Ctg: 525;
Cxb: 445;
Mgl: 580;
Payra:510
Ctg, Cxb- DS-VII
Mgl, Pyra- DS-V
12.29.05.2017
(29.05.2017)
12 Noon
(06 UTC)
Cyclone ‘Mora’EC Bay and Adj North Bay17.9° N/91.3° ESWB:
10
Ctg: 480;
Cxb: 400;
Mgl: 540;
Payra:470
Ctg, Cxb- DS-VII
Mgl, Pyra- DS-V
13.29.05.2017
(29.05.2017)
3:00 p.m.
(09 UTC)
Cyclone ‘Mora’EC Bay and Adj North Bay18.4° N/91.3° ESWB:
11
Ctg: 425;
Cxb: 345;
Mgl: 490;
Payra:415
Ctg, Cxb- DS-VII
Mgl, Pyra- DS-V
14.29.05.2017
(29.05.2017)
6:00 p.m.
(12 UTC)
SCS ‘Mora’North Bay and adj EC Bay18.8° N/91.3° ESWB:
12
Ctg: 385;
Cxb: 305;
Mgl: 450;
Payra:370
Ctg, Cxb- GDS-X
Mgl, Pyra- GDS-VII
15.29.05.20179:00 p.m.
(15 UTC)
SCS ‘Mora’North Bay and adj EC Bay19.0° N/91.3° ESWB:
13
Ctg: 360;
Cxb: 280;
Mgl: 430;
Payra:350
Ctg, Cxb- GDS-X
Mgl, Pyra- GDS-VII
16.30.05.2017
(29.05.2017)
Midnight
(18 UTC)
SCS ‘Mora’North Bay and adj EC Bay19.5° N/91.3° ESWB:
14
Ctg: 305;
Cxb: 230;
Mgl: 380;
Payra:300
Ctg, Cxb- GDS-X
Mgl, Pyra- GDS-VII
17.30.05.2017
(29.05.2017)
3:00 a.m.
(21 UTC)
SCS ‘Mora’North Bay and adj EC Bay20.2° N/91.4° ESWB:
15
Ctg: 230;
Cxb: 150;
Mgl: 320;
Payra:235
Ctg, Cxb- GDS-X
Mgl, Pyra- GDS-VII
18.30.05.2017
(30.05.2017)
6:00 a.m.
(00 UTC)
SCS ‘Mora’North Bay Started Crossing
Cox’s Bazar-Chittagong Coast near Kutubdia
SWB:
16
-Ctg, Cxb- GDS-X
Mgl, Pyra- GDS-VII
19.30.05.2017
(30.05.2017)
12 Noon
(06 UTC)
Land Deep Depression Rangamati and adjoining areaCrossed Cox’s Bazar-Chittagong Coast during 06:00 a.m. to 12 NoonSWB:
17
-Ctg, Cxb- GDS-X
Mgl, Pyra- GDS-VII
’SWB’ indicates ‘Special Weather Bulletin’, ‘GD’ Stands for ‘Great Danger Signal’, ‘GDS’ stands for ‘Great Danger Signal’, ‘EC’ Stands for ‘East Central’.

Appendix B. River Model Discretization

The river model Equations (8) to (10) are discretized by finite-difference technique (forward in time and central in space) and are solved by conditionally stable semi-implicit method using a staggered grid system Any variable ξ r i v at a grid point (i,j) at time tk is represented by:
ξ r i v   ( x i , y j , t k ) = R ξ i , j k
Thus, the finite-difference approximated form of the Equation (8) is as follows:
ξ r i v   t + x [ H u r i v ] + y [ H v r i v ] = 0
H = ( u ˜ , v ˜ ) = [ ξ r i v   ( u r i v , v r i v ) + h r i v ]
ξ i , j   k + 1 = ξ i , j k Δ t [ R T L 1 + R T L 2 ]
R T L 1 = ( R u ˜ i + 1 , j k R u ˜ i 1 , j k 2 Δ x )   and   R T L 2 = ( R v ˜ i , j + i k R v ˜ i , j 1 k 2 Δ y )
where, R ξ i , j k + 1 in Equation (A1) is computed at i = 2, 4, 6, ..., M − 2 and j = 3, 5, 7, ..., N − 2. Similarly, the finite-difference form of the Equation (9) as is follows
t   [ H u r i v ] + x [ H u r i v 2 ] + y [ H u r i v v r i v ] H v r i v = g ξ r i v x C f u r i v ( u r i v 2 + v r i v 2 ) 1 / 2
R u ˜ i , j k + 1 = R u ˜ i , j k Δ t ( R T L 1 + R T L 2 + R T L 3 ) + Δ t ( T R 1 ) ( 1 + Δ t .   R F R 3 )
R T L 1 = ( R u ˜ i + 2 , j k R U i + 2 , j k R u ˜ i 2 , j k R U i 2 , j k 4 Δ x )
R T L 2 = ( R u ˜ i , j + 1 k ¯ y   R V i , j + 1 k ¯ x R u ˜ i , j 1 k ¯ y     R V i , j 1 k ¯ x 2 Δ y )
R T L 3 = R v ˜ i , j k ¯ x y
R T R 1 = g R ξ i + 1 , j k + 1 R ξ i 1 , j k + 1 2 Δ x
R F R 3 = C f R U i , j k 2 + ( R V i , j k ¯ x y ) 2 R ξ i , j k + 1 + R h i , j
where, R u ˜ i , j k + 1 in Equation (A2) is computed at i = 3, 5, 7, ..., M − 1 and j = 3, 5, 7, ..., N − 2. In similar way the boundary and other equation are discretized.

References

  1. Mohit, A.A.; Yamashiro, M.; Ide, Y.; Kodama, M.; Hashimoto, N. Tropical cyclone activity analysis using MRI-AGCM and d4PDF data. In Proceedings of the Twenty-Eighth International Ocean and Polar Engineering Conference, Sapporo, Japan, 10–15 June 2018. [Google Scholar]
  2. Jelesnianski, C.P. A numerical calculation of storm tides induced by a tropical storm impinging on a continental shelf. Mon. Weather Rev. 1965, 93, 343–358. [Google Scholar] [CrossRef]
  3. Jelesnianski, C.P. Numerical computation of storm surges without bottom stress. Mon. Weather Rev. 1966, 94, 379–394. [Google Scholar] [CrossRef]
  4. Thacker, W.C. Irregular grid finite difference techniques for storm surge calculations for curving coastline. Elsevier Ocean Ser. Mar. Forecast. 1979, 261–283. [Google Scholar]
  5. Mehrdad, S. Storm surge and wave impact of low-probability hurricanes on the lower delaware bay—Calibration and application. J. Mar. Sci. Eng. 2018, 6, 54. [Google Scholar]
  6. Juan, L.G.; Celso, M.F. Storm surge modeling in large estuaries: Sensitivity analyses to parameters and physical processes in the chesapeake bay. J. Mar. Sci. Eng. 2016, 4, 45. [Google Scholar]
  7. Kurian, N.P.; Nirupama, N.; Baba, M.; Thomas, K.V. Coastal flooding due to synoptic scale, meso-scale and remote forcings. Nat. Hazards 2009, 48, 259–273. [Google Scholar] [CrossRef]
  8. Keim, B.D.; Muller, R.A. Hurricanes of the Gulf of Mexico; Louisiana State University Press: Baton Rouge, LA, USA, 2009; p. 216. [Google Scholar]
  9. Jelesnianski, C.P.; Chen, J.; Shaffer, W.A. SLOSH: Sea, Lake and Overland Surges from Hurricanes; Technical Report for NOAA Technical Report; U.S. Department of Commerce, National Oceanic and Atmospheric Administration, National Weather Service (NWS): Silver Spring, MD, USA, 1992.
  10. Sheng, Y.P. On modeling three-dimensional estuarine and marine hydrodynamics. Elsevier Oceanogr. Ser. 1987, 45, 35–54. [Google Scholar]
  11. Sheng, Y.P.; Paramygin, V.A. Forecasting storm surge, inundation and 3D circulation along the Florida coast. In Proceedings of the 11th International Conference on Estuarine and Coastal Modeling, Seattle, DC, USA, 4–6 November 2009; pp. 744–761. [Google Scholar]
  12. Peng, M.; Xie, L.; Pietrafesa, L.J. A numerical study of storm surge and inundation in the Croatan–Albemarle–Pamlico Estuary System. Estuar. Coast. Shelf Sci. 2004, 59, 121–137. [Google Scholar] [CrossRef]
  13. Oey, L.; Ezer, T.; Wang, D.P.; Fan, S.J.; Yin, X.Q. Loop current warming by Hurricane Wilma. Geophys. Res. Lett. 2006, 33, 8. [Google Scholar] [CrossRef]
  14. Chen, C.; Liu, H. An unstructured grid, finite-volume, three-dimensional, primitive equation ocean model: Application to coastal ocean and estuaries. J. Atmos. Ocean. Technol. 2003, 20, 159–186. [Google Scholar] [CrossRef]
  15. Rego, J.L.; Li, C. On the receding of storm surge along Louisiana’s low-lying coast. J. Coast. Res. 2009, 56, 1042–1049. [Google Scholar]
  16. Luettich, R.A.; Westerink, J.J.; Scheffner, N.W. ADCIRC: An Advanced Three-Dimensional Circulation Model for Shelves, Coasts and Estuaries. Report 1: Theory and Methodology of ADCIRC-2DDI and ADCIRC-3DL; Technical Report for Dredging Research Program DRP-92-6; US Army Engineers Waterways Experiment Station: Vicksburg, MS, USA, 1992. [Google Scholar]
  17. Alam, M.; Hossain, A.; Shafee, S. Frequency of Bay of Bengal cyclonic storms and depressions crossing different coastal zones. Int. J. Climatol. 2003, 23, 1119–1125. [Google Scholar] [CrossRef] [Green Version]
  18. Debsarma, S.K. Simulations of storm surges in the Bay of Bengal. Mar. Geod. 2009, 32, 178–198. [Google Scholar] [CrossRef]
  19. Paul, G.C.; Ismail, A.I.M. Numerical modeling of storm surges with air bubble effects along the coast of Bangladesh. Ocean Eng. 2012, 42, 188–194. [Google Scholar] [CrossRef]
  20. Johns, B.; Ali, A. The numerical modeling of storm surges in the Bay of Bengal. Quart. J. R. Met. Soc. 1980, 106, 1–18. [Google Scholar] [CrossRef]
  21. Roy, G.D. Estimation of expected maximum possible water level along the Meghna estuary using a tide and surge interaction model. J. Environ. Int. 1995, 21, 671–677. [Google Scholar] [CrossRef]
  22. Roy, G.D. Inclusion of off-shore islands in transformed co-ordinates shallow water model along the coast of Bangladesh. J. Environ. Int. 1999, 25, 67–74. [Google Scholar] [CrossRef]
  23. Rahman, M.M.; Hoque, A.; Paul, G.C.; Alam, M.J. Nested numerical schemes to incorporate bending coastline and islands boundaries of Bangladesh and prediction of water levels due to surge. Asian J. Math. Stat. 2011, 4, 21–32. [Google Scholar] [CrossRef]
  24. Lewis, M.; Bates, P.; Horsburgh, K.; Neal, J.; Schumann, G. A storm surge inundation model of the northern Bay of Bengal using publicly available data. Quart. J. R. Met. Soc. 2012, 139, 358–369. [Google Scholar] [CrossRef]
  25. Paul, G.C.; Ismail, A.I.M.; Karim, M.F. Implementation of method of lines to predict water levels due to a storm along the coastal region of Bangladesh. J. Oceanoger. 2014, 70, 137–148. [Google Scholar] [CrossRef]
  26. Johns, B.; Sinha, P.C.; Dube, S.K.; Mohanty, U.C.; Rao, A.D. Simulation of storm surge using a three dimensional numerical model: an application to the 1977 Andhra cyclone. Quart. J. R. Met. Soc. 1983, 109, 211–224. [Google Scholar] [CrossRef]
  27. Dube, S.K.; Singh, P.C.; Roy, G.D. The numerical simulation of storm surges in Bangladesh using a bay-river coupled model. J. Coast. Eng. 1986, 10, 85–101. [Google Scholar] [CrossRef]
  28. Dube, S.K.; Chittibabu, P.; Sinha, P.C.; Rao, A.D. Numerical modeling of storm surge in the head Bay of Bengal using location specific model. Nat. Hazards 2004, 31, 437–453. [Google Scholar] [CrossRef]
  29. Agnihotri, N.; Chittibabu, P.; Jain, I.; Sinha, P.C.; Rao, A.D.; Dube, S.K. A Bay–River coupled model for storm surge prediction along the Andhra coast of India. Nat. Hazards 2006, 39, 83–101. [Google Scholar] [CrossRef]
  30. Milliman, J.D. Flux and fate of fluvial sediment and water in coastal seas. In Ocean Margin Processes in Global Change; Mantoura, R.F.C., Martin, J.M., Wollast, R., Eds.; Wiley: Chichester, UK, 1991; pp. 69–89. [Google Scholar]
  31. Khalil, G.M. The catastrophic cyclone of April 1991: Its impact on the economy of Bangladesh. Nat. Hazards 1993, 8, 263–281. [Google Scholar] [CrossRef]
  32. Jain, S.K.; Agarwal, P.K.; Singh, V.P. Hydrology and Water Resources of India; Springer: Berlin, Germany, 2007; ISBN 10 1-4020-5179-4 (HB). [Google Scholar]
  33. Mills, D.A. A numerical hydrodynamic model applied to tidal dynamics in the Dampier Archipelago. In Bulletin (Western Australia. Dept. of Conservation and Environment) no:190 0156-2983; Perth, W.A., Ed.; Western Australia, Department of Conservation and Environment: Perth, Australia, 1985. [Google Scholar]
  34. Flather, R.A. A storm surge prediction model for the northern Bay of Bengal with application to the cyclone disaster in April 1991. J. Phys. Oceanogr. 1994, 24, 172–190. [Google Scholar] [CrossRef]
  35. As-Salek, J.A. Coastal trapping and funneling effects on storm surges in the Meghna estuary in relation to cyclones hitting Noakhali–Cox’s Bazar coast of Bangladesh. J. Phys. Oceanogr. 1998, 28, 227–249. [Google Scholar] [CrossRef]
  36. Dewan, A.; Corner, R.; Saleem, A.; Rahman, M.M.; Haider, M.R.; Rahman, M.M.; Sarker, M.H. Assessing channel changes of the Ganges-Padma River system in Bangladesh using landsat and hydrological data. Geomorphology 2017, 276, 257–279. [Google Scholar] [CrossRef]
  37. Islam, M.A.; Mitra, D.; Dewan, A.; Akhter, S.H. Coastal multi-hazard vulnerability assessment along the Ganges deltaic coast of Bangladesh–A geospatial approach. Ocean Coast. Manag. 2016, 127, 1–15. [Google Scholar] [CrossRef]
  38. Mohit, A.A.; Ide, Y.; Yamashiro, M.; Hashimoto, N. A comparative study of two different numerical methods on storm surge. In Asian and Pacific Coasts 2017, Proceedings of the 9th International Conference on APAC 2017, Pasay, Philippines, 19–21 October 2017; World Scientific Publishing Co. Pte Ltd.: Singapore, 2017; pp. 163–174. [Google Scholar]
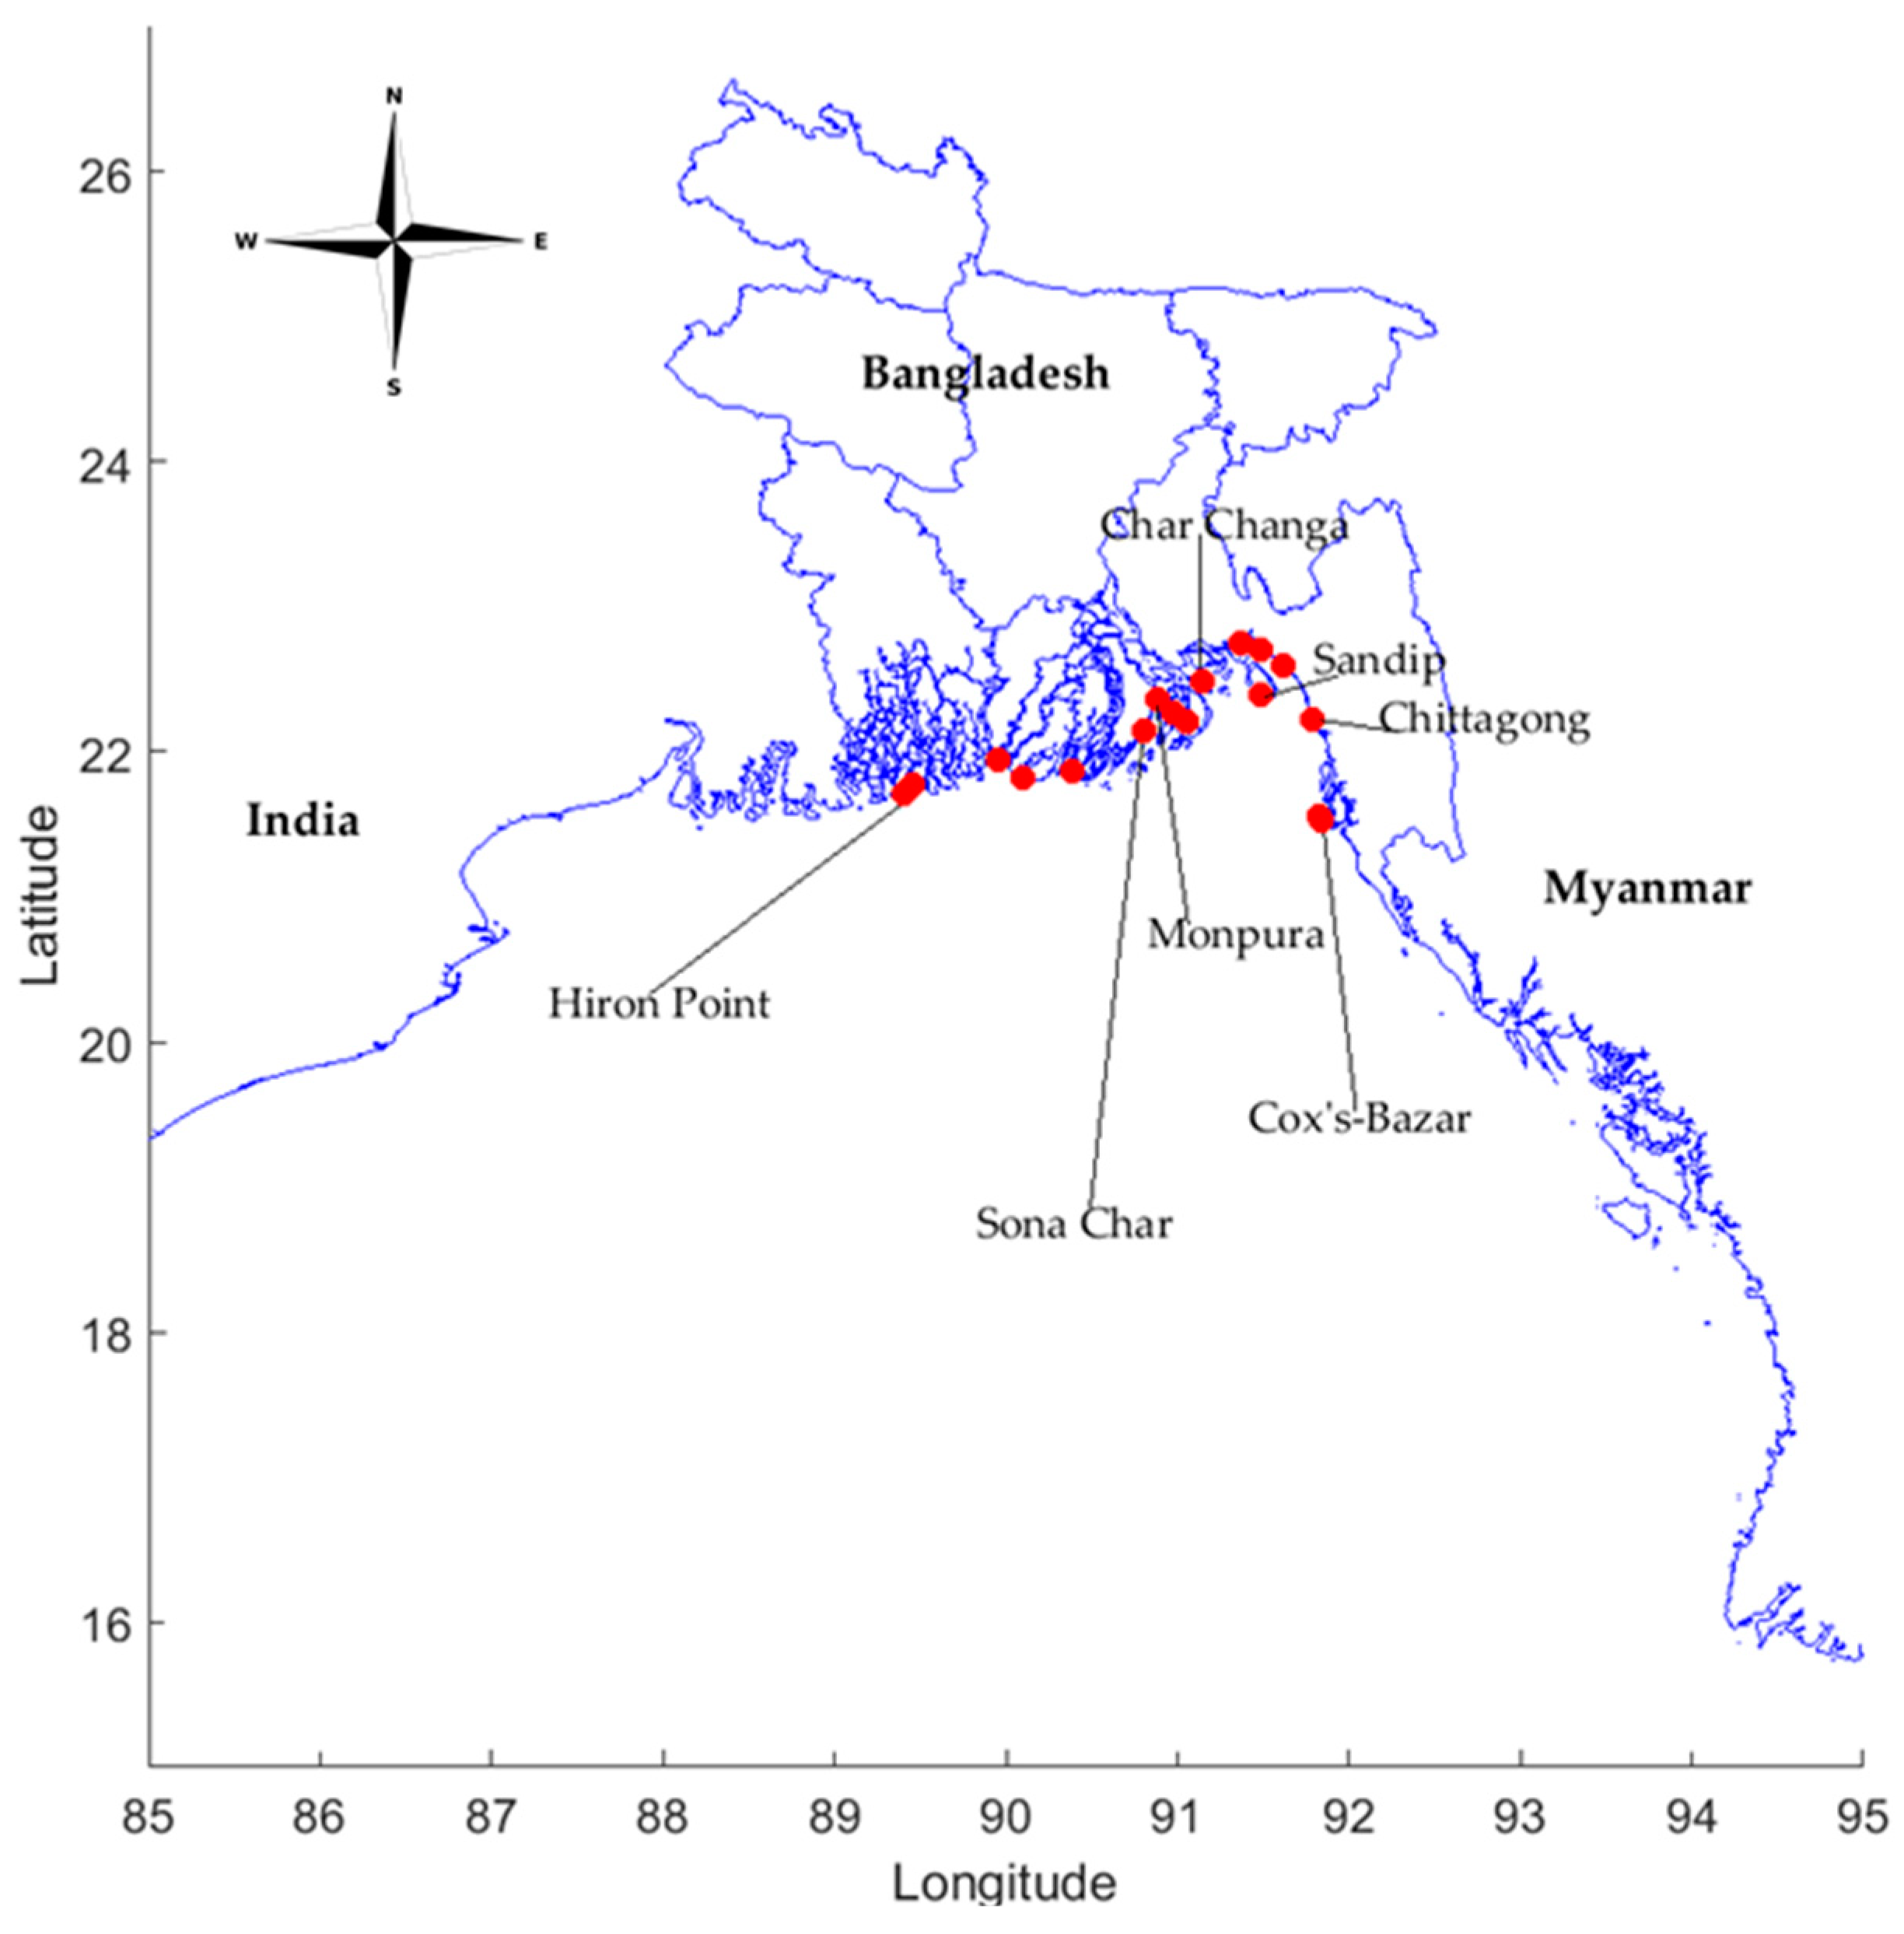
Figure 1. Study domain and the investigated area. The red dots represent the investigated tidal station locations operated by the Bangladesh Inland Water Transport Authority (BIWTA).
Jmse 06 00099 g001
Figure 2. The river model domain near the estuary known as lower Meghna. This lower Meghna River consists of the three big rivers Ganges–Brahmaputra–Meghna.
Jmse 06 00099 g002
Figure 3. Track information of cyclones 1991 and MORA. The landfall location and time are presented at the right side of the track.
Jmse 06 00099 g003
Figure 4. Different nested scheme areas. The nested schemes are CGM, FGM and VFGM. The small mesh grid area was VFGM, the outer of VFGM was FGM and the big grid area was CGM. (reproduced from [19], with permission from Elsevier, 2018).
Jmse 06 00099 g004
Figure 5. A staggered grid represented with a proper stair step for the finite difference solution technique. Staggered grid system (left). Stair-step representation of the coastline (right).
Jmse 06 00099 g005
Figure 6. Water level due to a storm at some tidal stations represented on the Google map. The surge height was multiplied by an arbitrary value 100 to clearly understand the elevation in the map.
Jmse 06 00099 g006
Figure 7. Water level elevation due to a storm at some of the locations near the coastal area of Bangladesh. (left) The simulation result when the river was incorporated in the model. (right) The simulation result when there was no river in the model. Both of the simulations were performed without the tidal effect. The different colors represent the different locations of the water level elevation.
Jmse 06 00099 g007
Figure 8. Nonlinear interaction of the tide and surge results are presented in this figure. The different colors represent the surge height at the same reported station. There was no river considered in the simulation result in the right figure and the left figure shows the result that incorporates the river. With river (left), Without river (right).
Jmse 06 00099 g008
Figure 9. The comparison result of the model simulation of the influence of the lower Meghna river near the junction area and outside the junction area. (left) The result of the outside junction area. (right) The result of the near junction area.
Jmse 06 00099 g009
Figure 10. The combined result represents the bay and river model data with the observed data. Due to the data scarcity, only a few observed data are represented.
Jmse 06 00099 g010
Figure 11. The figure shows the distribution result of surge height simulation at the land fall time 30 April 2:00 a.m. (local time) under different conditions. (a) represents the surge height distribution when the river has existed in the simulation. (b) represents the surge height distribution when the there is no river included in the simulation. (c) represents the surge height difference.
Jmse 06 00099 g011
Figure 12. River discharge effect on the water level elevation due to a storm. The left figure shows the time series result of water level elevation (left side) and the right figure show the river discharge effect on water level at some locations near the coast (right side).
Jmse 06 00099 g012
Figure 13. Maximum wave peak statistic of cyclone MORA and the model-simulated result at the Cox’s Bazar tide station.
Jmse 06 00099 g013
Table 1. Grid spacing of different nesting models with a number of computational points.
ModelDomainGrid Spacing along x AxisGrid Spacing along y AxisNumber of Computational Points
CGM15° N to 23° N and 85° E to 95° E15.08 km17.52 km60 × 61
FGM21°15′ N to 23° N and 89° E to 92° E2.15 km3.29 km92 × 95
VFGM21.77° N to 23° N and 90.40° E to 92° E720.73 m1142.39 m190 × 145
VFGMR23° N to 23.25° N and 90.40° E to 90.68° E720.73 m1142.39 m40 × 27
Table 2. Overall maximum wave peak statistic from the past study and the present study.
Coastal LocationOverall Max. Water Level (m) by [25]Simulated Overall Max. Water Level (m) by [22]Simulated Overall Max. Water Level (m) by FDM [38]Simulated Overall Max. Water Level (m) (without River)Simulated Overall Max. Water Level (m) (with River)Observed Overall Max. Water Level (m)
Cox’s Bazar----6.145.985.896.00
Moheshkhali----4.124.594.57--
Banshkhali----3.58------
Chittagong6.255.454.504.604.615.4
Sitakunda5.78--4.485.155.11--
Sandwip5.635.334.385.215.20--
Mirsharai----5.665.055.03--
Companiganj7.28--6.155.905.896.1
Chital Khali----4.50------
Char Jabbar6.355.185.695.515.47--
Char Changa5.814.314.124.604.58--
Char Madras5.81--4.324.994.95--
Rangabali4.50--4.073.563.56--
Kuakata3.86--3.963.603.58--
Patharghata----4.363.553.57--
Tiger Point4.57--4.214.304.30--
Hiron Point4.010.703.803.483.453.5
Monpura Island------5.204.88--
Sona Char------4.513.61--