Article

Characterization of the New Status of Nador Lagoon (Morocco) after the Implementation of the Management Plan

1
Institut Agronomique et Veterinaire Hassan II-BP 6202 Madinat Al Irfane, Rabat 10101, Morocco
2
Faculte des Sciences de Tetouan, Universite Abdelmalek Essaidi, Tetouan 93000, Morocco
3
Department of Environmental Sciences, Informatics and Statistic Universita Ca’ Foscari di Venezia, 30123 Venezia, Italy
4
Institut National de Recherche Halieutique, Casablanca 20050, Morocco
*
Author to whom correspondence should be addressed.
J. Mar. Sci. Eng. 2017, 5(1), 7; https://doi.org/10.3390/jmse5010007
Submission received: 9 October 2016 / Revised: 30 December 2016 / Accepted: 4 January 2017 / Published: 13 January 2017

Abstract

:
The present study was carried out in 2011 with the aims of (1) evaluating the changes in sedimentary distribution that occurred in Nador lagoon seabed (Morocco) after the implementation of the lagoon management plan in 2009; and (2) characterizing its new sedimentary status in 2011. Due to the lack of a baseline, we used the 1992 sedimentary status for comparison. The seabed surface sediment distribution showed a great change between 1992 and 2011. We found the same four sediment facies, which were present in 1992, namely: mud, sandy mud, muddy sand, and fine sand. However, in 2011, mud covered more than 54% of the lagoon seabed surface, mostly located in the middle part of the seabed, whereas in 1992, more than 80% of the lagoon seabed was covered by sandy mud. The sediments’ characteristics showed moderately to poorly sorted facies (S0), ranging between platykurtic and leptokurtic (SK) and with various symmetry indices (SG). The organic matter content in sediment has strongly decreased, from values higher than 20% in most areas in 1992 to a mean value of 3.9% in 2011, ranging from 0.2% to 10.4%, thus confirming that the management actions implemented in 2009 were likely effective in reducing the organic pollution.

1. Introduction

The Nador lagoon (or Marchica or sebkha Bou Areg) is the largest in Morocco (115 km2) [1] and the second largest lagoon ecosystem in the southern shore of the Mediterranean after El Bidan Lagoon in Tunisia (330 km2) [2]. This system is considered a Site of Biological and Ecological Interest (SBEI) since 1996, as it is characterized by high biodiversity and high productivity, thus allowing the development of aquaculture and artisanal fishery, as well as touristic activities. Therefore, the site is regarded as very important for the Moroccan economy.
This particularly attractive area is affected by many anthropic activities: urbanization, agriculture, fishing, fish and shellfish farming, tourism and recreational activities. The pressures generated by these activities, and the uncontrolled discharge of nutrients, organic matter, organic micropollutants and heavy metals [3] led to detrimental changes, a fragile ecological balance, and critical levels of widespread degradation that severely affected the functioning of the lagoon ecosystem and therefore compromised the provision of ecosystem services. This situation was worsened by the lack of political will in undertaking remediation actions and poor coordination between the agencies to which the environmental management of the lagoon was entrusted.
In order to stop the degradation process and invert this negative trend, the Moroccan government stopped the fish farming activity within the lagoon and launched a “special management plan” for incitement to spatial development and improving the state lagoon environment.
Within this framework in 2009, two major interventions were carried out to improve its environmental quality: (i) the closure of the old inlet connecting with the sea and the opening of a new larger artificial channel to enhance water circulation; (ii) the implementation in 2010 of a new wastewater treatment plant using the activated sludge process for Nador city and rural areas forming the watershed (Grand Nador) to mitigate pollution discharge in the lagoon. These management measures have fostered the main socioeconomic activity, related to the lagoon’s (artisanal fishery) added-value by increasing the catch and revenue of fishermen [4].
A few sedimentological surveys were performed in the lagoon seabed, with the last one conducted in 1992, giving only one baseline database available for comparison of the ex-ante and ex-post situations.
In order to fill this gap, in 2011, we carried out a scientific survey, aimed at assessing the changes in sedimentary status of the lagoon seabed after the management interventions within the characterization of the facies spatial and granulometric distribution, as well as the organic matter content in the lagoon surface sediment.

2. Material and Methods

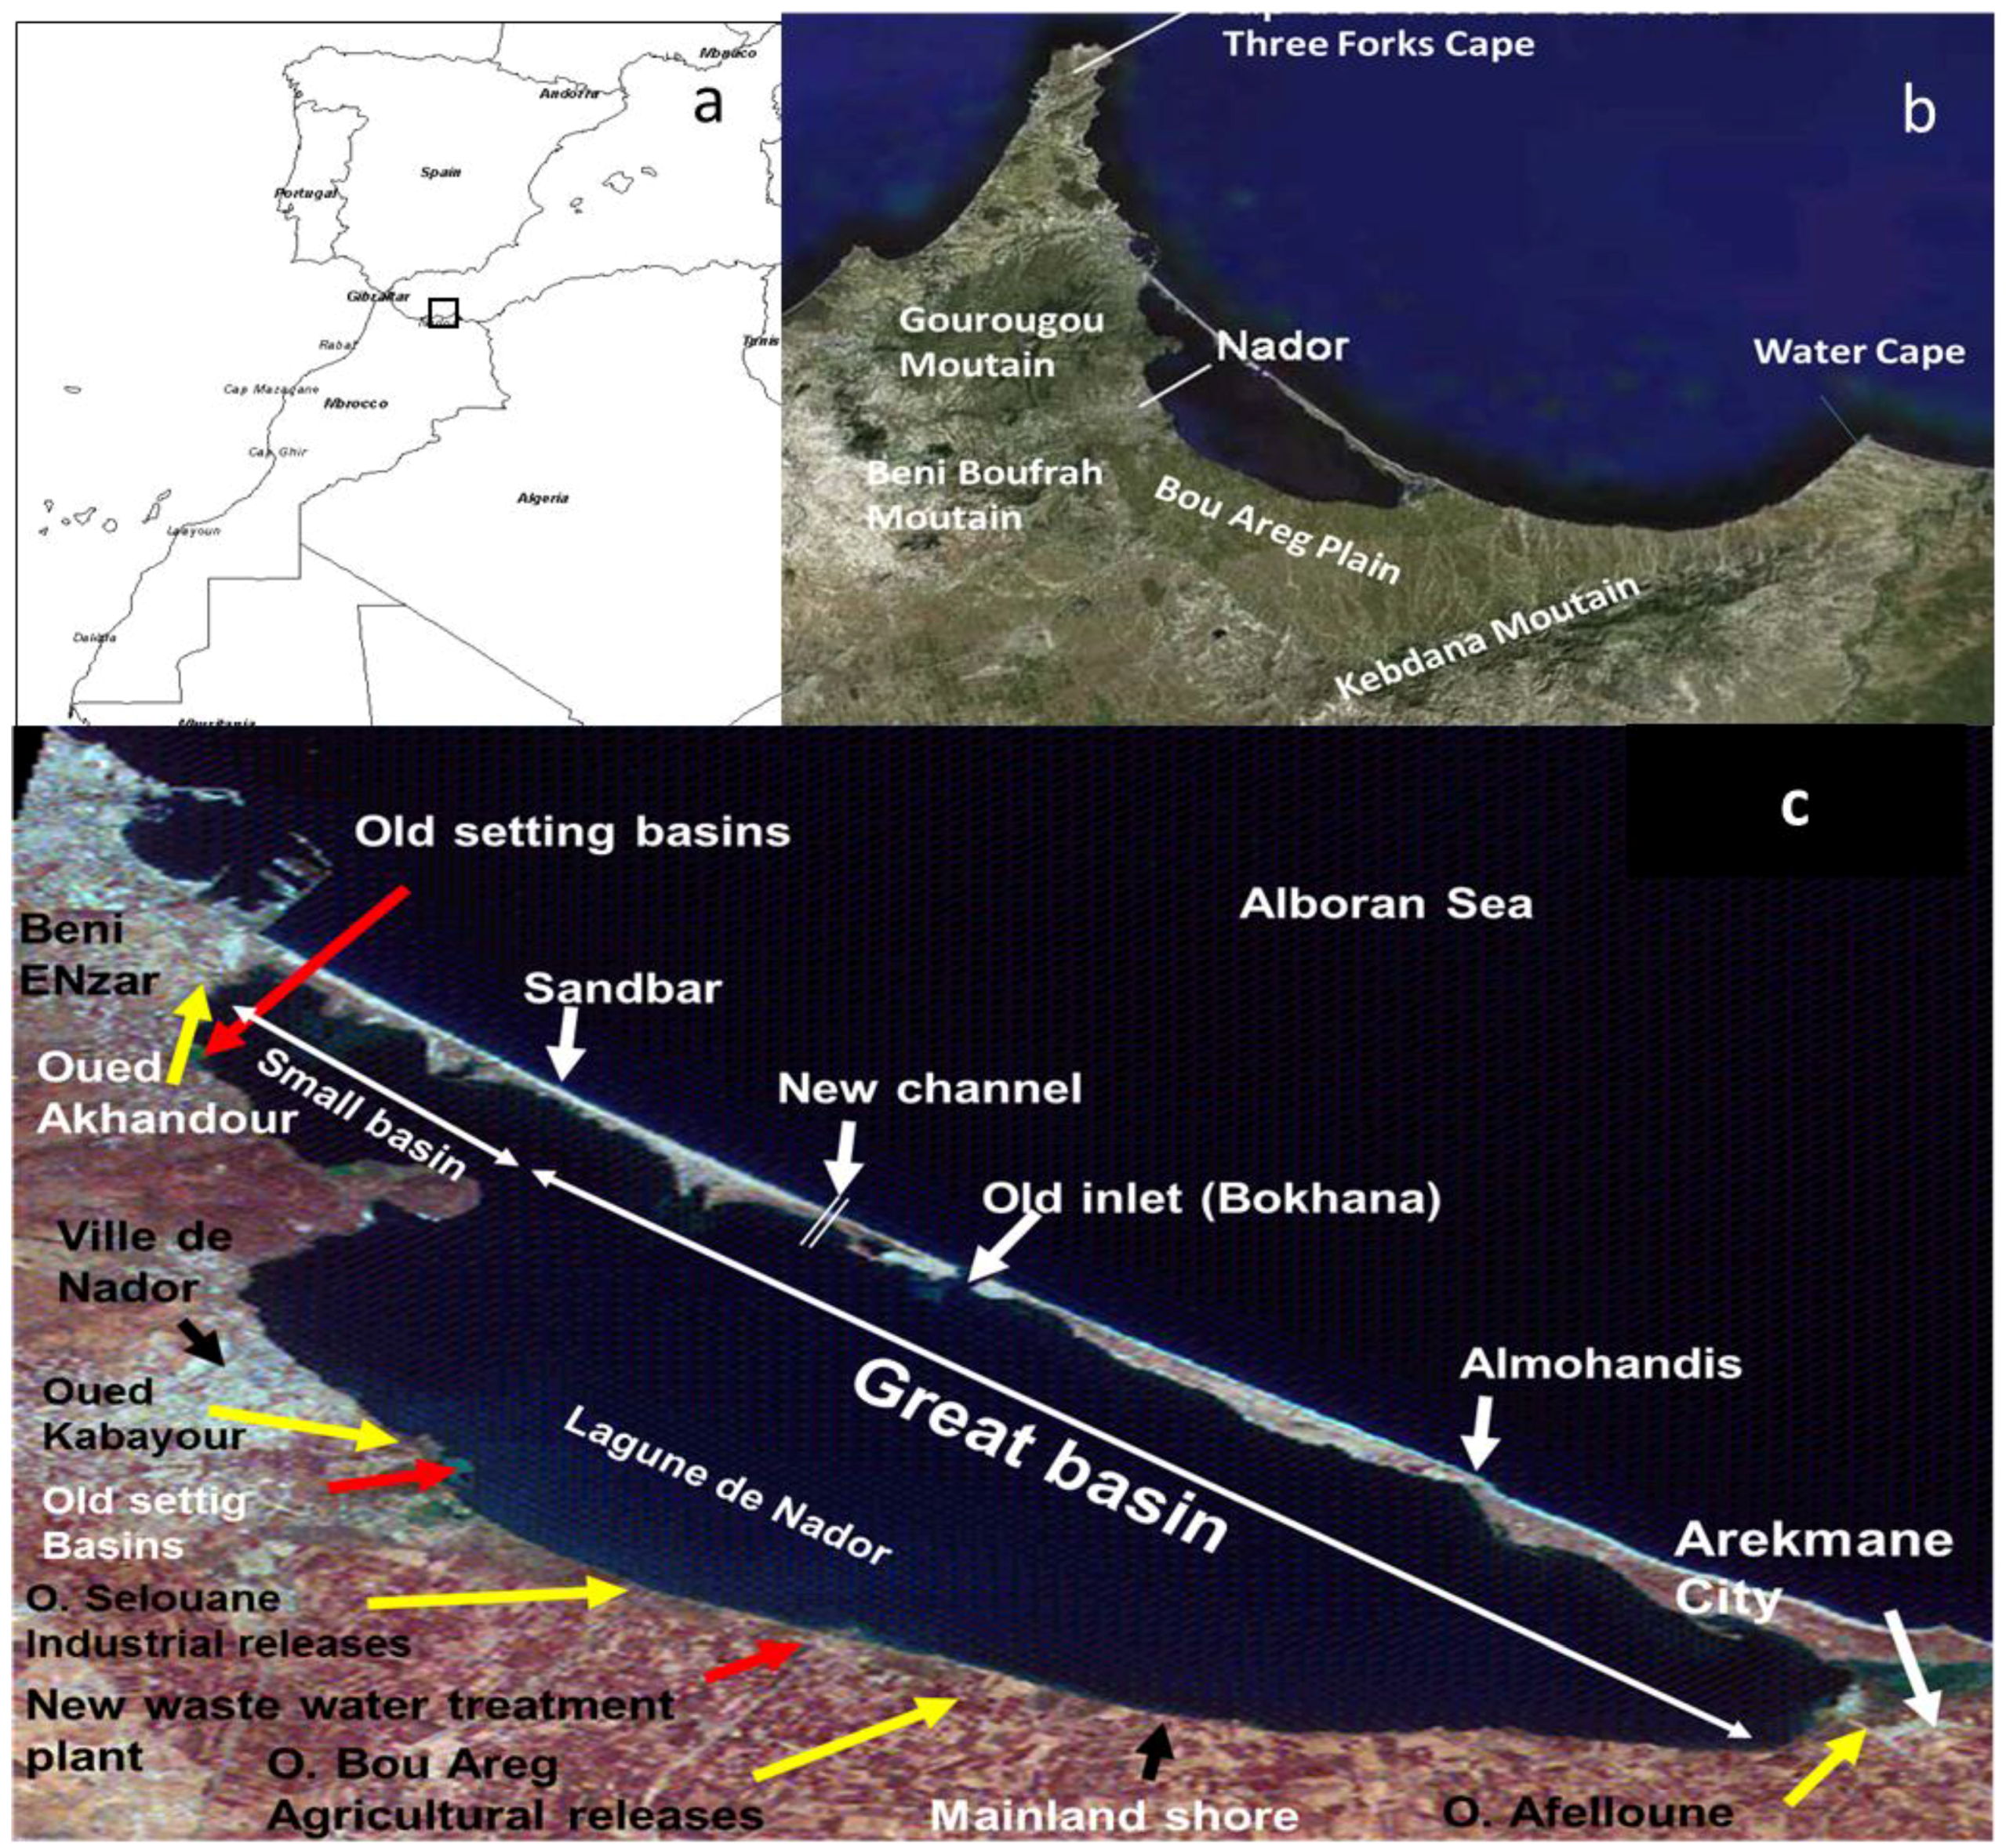
2.1. The Nador Lagoon Location and Morphological Features

The Nador lagoon (of coordinates: 34°54′ N–35°17′ N; 02°10′ W–03°05′ W) is situated on the shore of the eastern part of the Moroccan Rif, between Water Cape in the east and Three Forks Cape in the northwest (Figure 1). The lagoon extends 25 km of length and 7.5 km of width, with an average area of 11,500 ha (Figure 1). It is separated from the Mediterranean by a narrow sandbar (lido), partially consolidated with sandstone rocks. The length of the lido is 25 km, and the width and mean height range from 0.3 to 2 km and from 3 to 20 m respectively [5].
Taking into account its geomorphic shape, the lagoon can be divided into four areas: Area I (extreme NW part) and Area II (extreme SE part) are considered the most confined zones. Area III (southern part facing the mainland) is the most impacted by anthropic and freshwater inputs from small streams, rivers, discharge of treated wastewater, groundwater and agriculture drainage. Area IV (northern part facing the marine sandbar) is the most influenced by seawater inputs through the new channel and by infiltration within the sandbar. Some characteristics of this area are close to that of the sea [6]. This shape from the SE to the NW takes the form of two basins (Figure 1). The 1st one, the small basin (area I in Figure 1), is smaller and is located between Atalayoun and Beni Enzar, and the 2nd one, the great basin (areas II, III and IV), is larger and extends between Kariat Arkmane and Atalayoun [7].
The lagoon communicates with the sea by means of an artificial channel, which was dug and opened in 2009. The channel (35°20′ N; 02°86′ W) consists of two breakwaters with a depth of 6.00 m NGM [8], which are separated from each other by a width of 300 m. The eastern breakwater has a length of 1450 m and the western one has a length of 1350 m. Prior to this date, the lagoon was supplied with seawater intermittently via an inlet called Bokhana, whose location on the sandbar changed over time due to sediment deposit. This last process contributed to a significant decrease in water exchange between the lagoon and the sea, leading to a decrease in water quality.

2.2. Lagoon Watershed Features, Sedimentary Dynamics and Freshwater Inputs

According to Feinberg (1978) in [6], Nador lagoon is located at the northern end of the Quaternary basin of Gareb that fits into a set of basins called Eastern Rif Mediterranean basins. The lagoon is part of the subsiding of the Nador−Melilla basin, having begun to individualize from the upper Miocene [6], and the sandbar (lido) was formed on the seaward side by coarse sand rich in bivalve shells [9]. The northern part of the lagoon is located in the watershed constituted by the massif of Gourougou, while the southern part lies on the watershed of the massifs of Beni Bou Iffrour and Kebdana [5] (Figure 1).
The geomorphological form of the lagoon and its topography expose it to a rich accumulation of diverse kinds of deposits coming both from continental and marine sources. The sedimentary infilling process and the facies nature are especially dependent on the geological formations constituting the hinterland of the lagoon watershed [5]: the mountains of Gourougou displaying certain richness in feldspar, and Beni Bou Iffrour and Kebdana, rich in quartz and calcite (Figure 1). In addition to this source, the sediment may have organic origin (biogenic carbonates and organic matter) [10]. Continental sediments are mainly supplied by: (i) several small independent and juxtaposed rivers’ freshwater networks that discharge at different parts of the lagoon (Figure 1), with the main inputs due to Oued Selouane receiving jointly industrial discharges, Oued Bou Areg and Bou Areg plain agriculture drainage [11]; (ii) the Nador wastewater treatment plant, which contributes to freshwater and suspended solids supply. This latter is considered the largest on the southern shore of the Mediterranean and processes over 7 million m3/year of wastewater [12].

2.3. Climatological Characteristics of the Nador Lagoon

The climate in the Nador area is Mediterranean. It is characterized by the succession of two contrasting seasons [3]: a hot, dry summer, stretching from June to October with an average temperature of 20 °C, and a cool and rainy period from November to May, with average temperatures of 12 °C. The coldest month is January, with minimum temperature values ranging from 5 to 7 °C. At 79%, most of the rainfall occurs between November and May. The annual rainfall varies from 224 mm/year to 390 mm/year [13].
The general wind regime is WSW (24.8%) from November to May, and ENE (32.9%) from May to October, with a frequency of 17.1% in the NE and 15.8% for easterly directions with average intensities ranging from 3.8 to 6.2 m·s−1 [14].

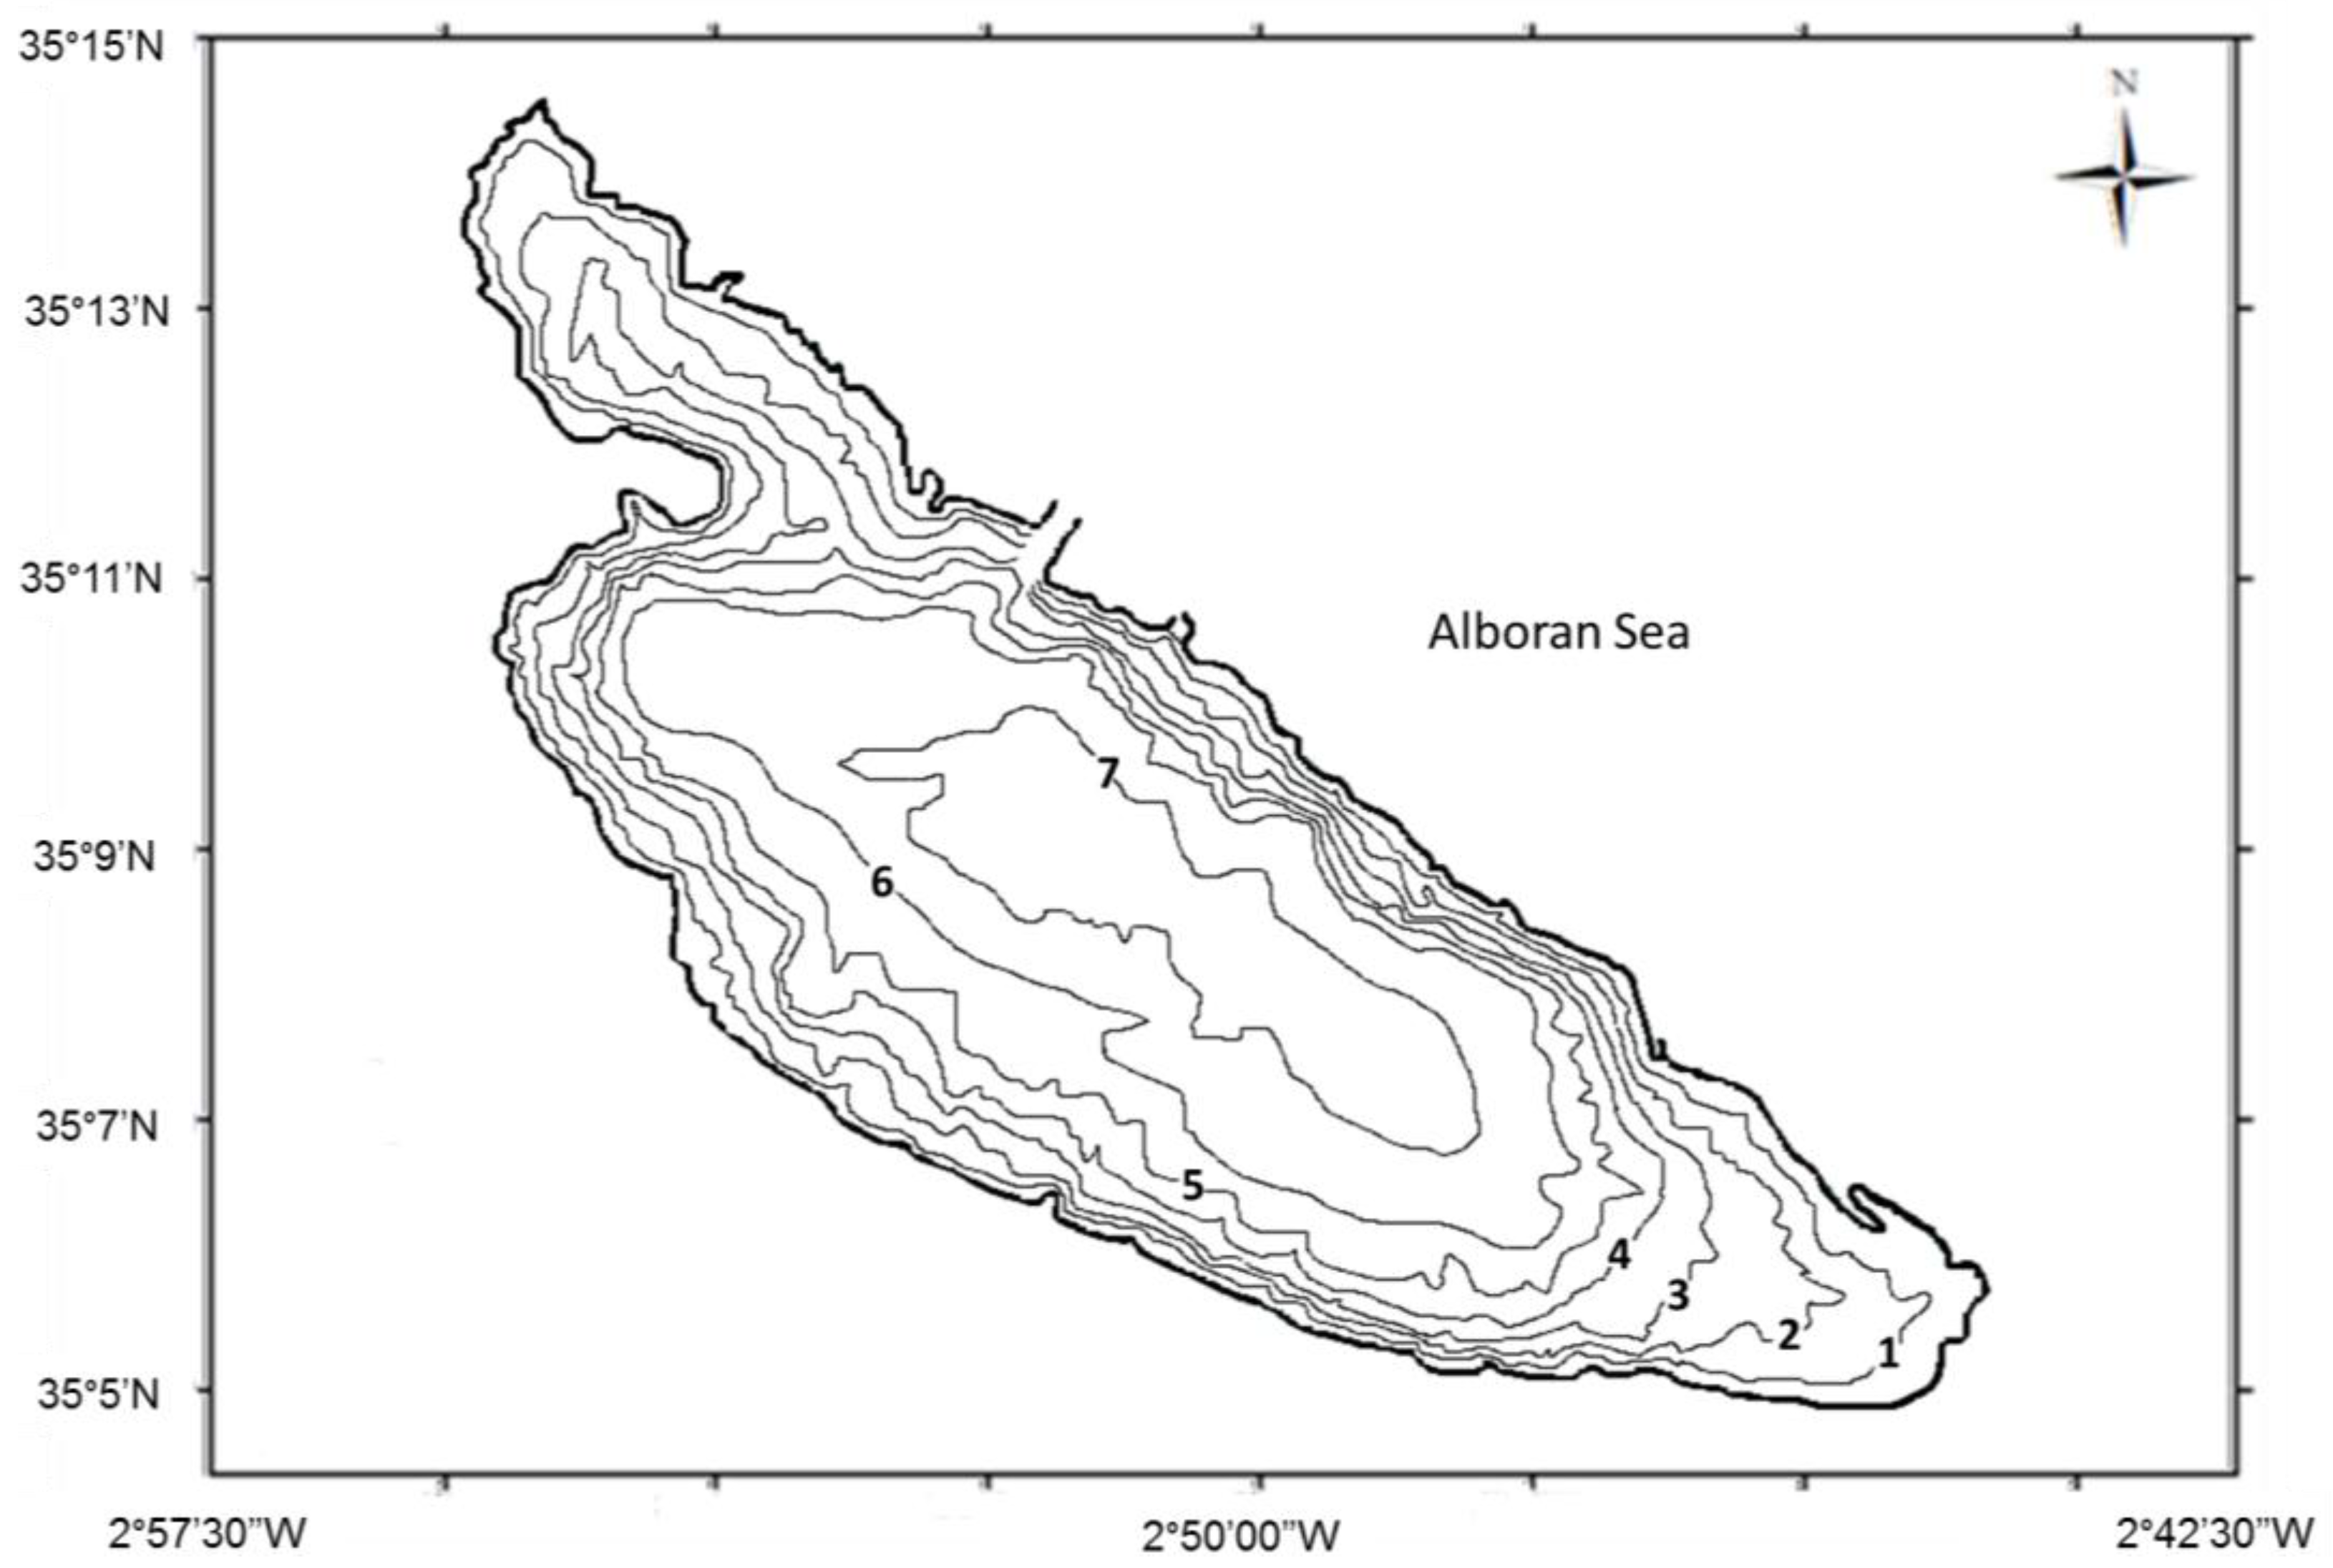
2.4. Lagoon Bathymetry and Hydrodynamics

As can be seen from Figure 2, the lagoon is shallow; barely exceeding 7 m in the deepest part and the isobaths strictly follow the edge of the lagoon and is characterized by a gentle slope from the littoral to the lagoon centre [15].
The hydrodynamic circulation is mainly wind driven: blowing ENE to E from May to October, and WSW to W from November to April. The surface currents occur and move in line with the wind direction, while the bottom currents occur in the opposite direction of the wind [14].
According to recent hydrodynamic studies [16] surface and bottom currents are characterized by relatively high velocity and opposite directions (Figure 2). The seawater masses entering through the channel create stronger surface currents that move from the channel to the mainland, at a velocity more than 1 m·s−1, within the channel, and decrease to less than 0.5 m·s−1 in the middle part of the lagoon, and then to 0.3 m·s−1 near the mainland sides. Then, the currents change into bottom currents of globally northern directions, and opposite the surface currents direction, moving at a velocity lower than 0.2 m·s−1.
To the increase of seawater masses entering the lagoon across the new channel with a velocity of ≥1 m·s−1 [15], it is very likely that the residence time after the opening of the new inlet has markedly decreased.

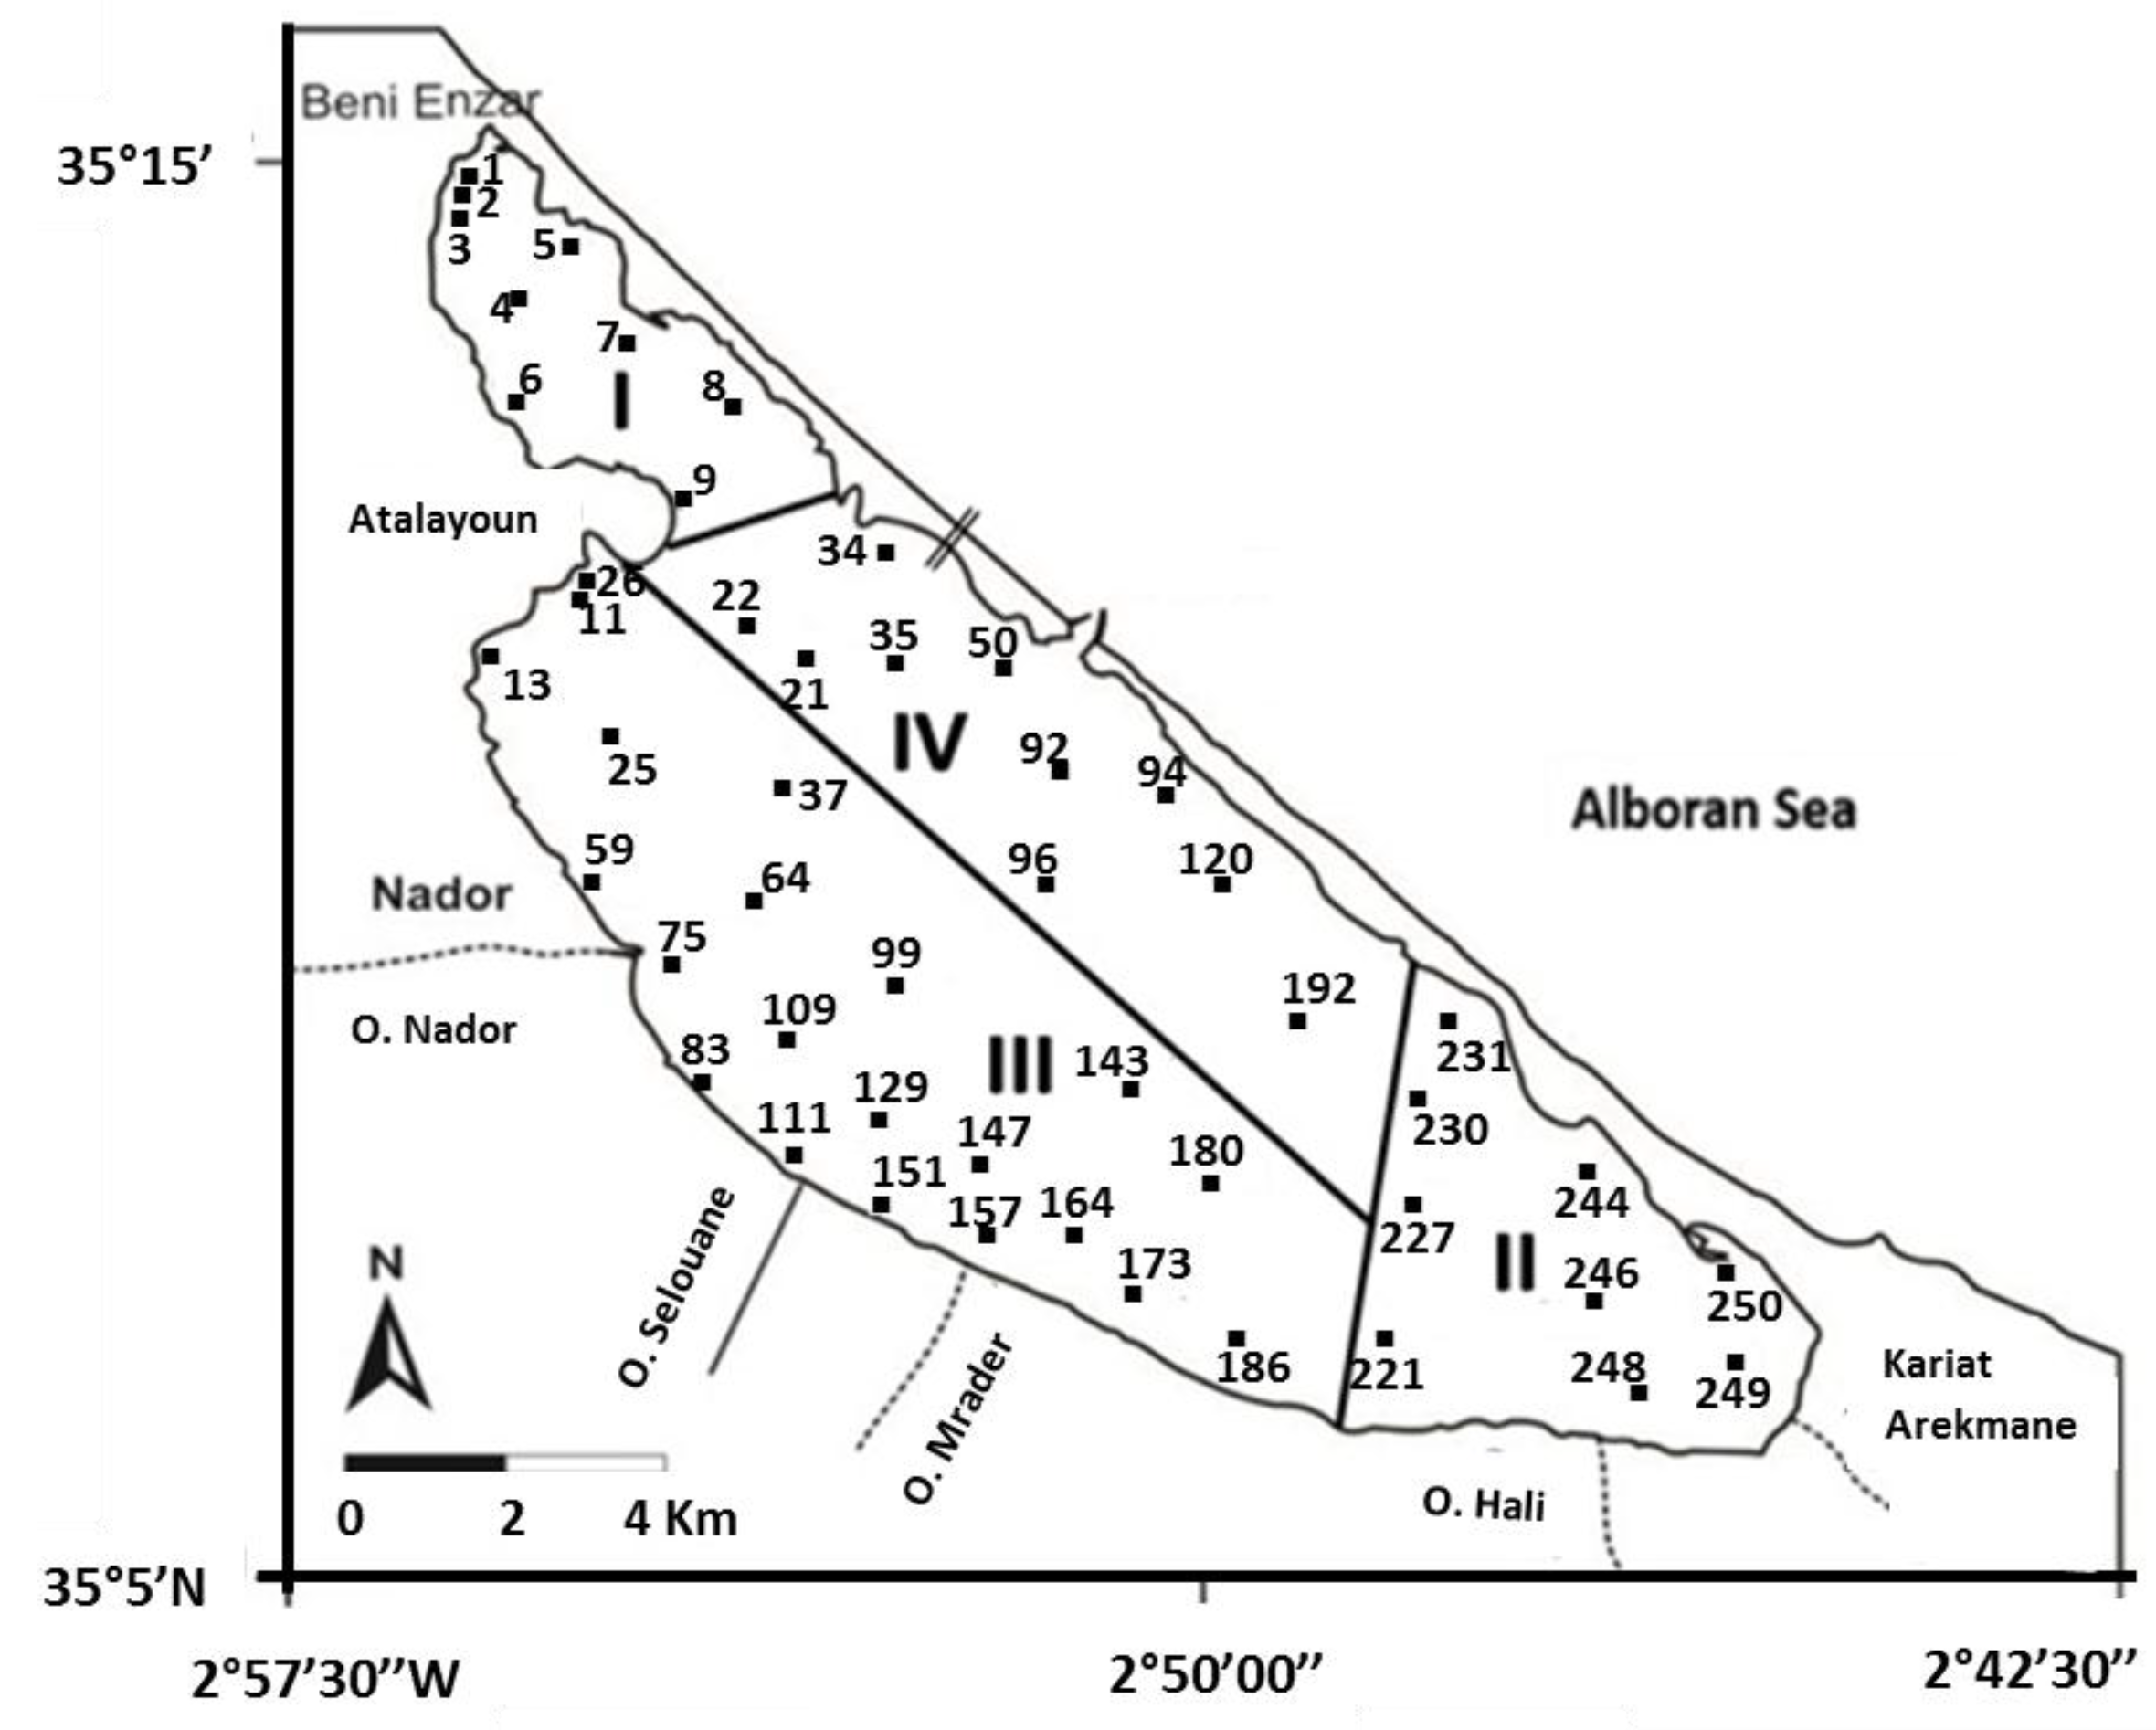
2.5. Sampling Area Selection and Samples Collection Method

Our sampling approach took into account: (i) the data sources of history of the lagoon seabed sediment distribution gathered from literature [9,11,17,18] (considered as a baseline); (ii) the bathymetry and water circulation characteristics of the lagoon and (iii) the environmental and anthropic pressure exerted on the lagoon system, such as freshwater [19] and pollution inputs.
In order to be consistent with previous studies, we designed our sampling strategy taking into consideration the ecological zonation of the lagoon suggested in [10], who identified four main areas: I and II are confined areas, III is a continental-influenced area, and IV is a marine-influenced area. Four sediment sampling campaigns were carried out from March to June 2011 in the four parts of the lagoon (Areas I–IV), (Figure 3, Table 1): the location of the sampling stations was consistent, as much as possible, with the sampling network adopted in [18]. The sediment sampling was performed by scuba diving and using a shovel (10 cm × 20 cm).
A total number of 50 sediment samples (S) were collected in the seabed (Figure 3, Table 1), within a surface layer and thickness of (0.4 m × 0.4 m × 8–10 cm). Samples were put in polyethylene bags and carried in a cooler to the laboratory, where they were frozen and stored until analysis.

2.6. Grain Size Analysis

Grain size analysis was carried out at the laboratory of sedimentology of the Faculty of Sciences of Tetouan. All samples were dried in an oven until constant weight and freed from biogenic components >1 mm and analysed separately for their grain size distribution, total organic carbon and carbonate.
Particle size analysis was performed according to the following procedure: the samples were dried at 105 °C for 24 h, and weighed, then sorted according to the wet method, using a vibration sieve of type Analysette 3 PRO. Sieves containing refusals were oven dried for 24 h at 105 °C, and different sediment fractions were weighed. The sediment classification was done according to Wentworth (1924) adapted by Blott, and Pye [21] on the basis of grain size expressed in a (Phi) Ø scale. Degree of siltation was determined on the basis of lutite rates in the sediments according to the classification of Chevillon [22] slightly modified by Chardy et al. [23].

2.7. Total Organic Matter (OM) Analysis

To determine OM content in the sediments, a total organic carbon (TOC) analysis was carried out on all the sediment samples according to the EN 15934 method of the European standard and Vatan (1967) [24], which relies on the removal of organic matter from dried and acidic pre-treated sediments (for inorganic carbon removal), using calcination method at (550 ± 25) °C. Organic components in the samples are converted into CO2 and TOC corresponds to the sediment dry weight change prior and after heat treatment.
Organic matter content was calculated according to the equation: [25].
( %   OM ) = 1.724 ( %   TOC ) 1

2.8. Carbonate Analysis

Carbonate content of the sediments was determined using the Bernard calcimeter method (UNE 7-367), whose principle is based on the estimate of volume of carbon dioxide (CO2) generated by the sample after digestion with hydrochloric acid versus volume of carbon dioxide (CO2) generated by a known amount of pure calcite (standard).
The percentage of carbonate is calculated using the formula [26]:
%   CaCO 3 =   L 2 L 1 L 2 L 1 × 100
where, L2L1: amount of CO2 released by the sample and L2L1: Volume of CO2 released from pure calcite.
The results are rounded to 0.1% nearest.
The limits and facies characterization according to carbonate contents were done according to Chamley [27].

2.9. Data Analysis

Statistical Parameters

The data collected in 50 sediment sample analyses were used to establish grain size, descriptive distributions and cumulative weight frequency plots of different sediments. The cumulative frequency curves were graphically plotted on a probability graph paper by reporting the grain size (in phi scale). The phi values of the following positional parameters or percentiles (5%, 16%, 25%, 50%, 75%, 84% and 95%) were read off and were used according to Folk and Ward (1957) [28] to calculate the statistical parameters: mean size, median, mode, standard deviation, sorting, skewness, and kurtosis indices (Table 2). The results allowed defining and characterizing the sediments texture, and consequently explaining the depositional processes.
The grain size parameters were determined according to the methodology presented in Flok et al. [28].
To highlight the spatial structure of the facies and lutite and OM rates in the lagoon, the information of each sampled station was integrated in Geographic Information System (GIS) of ArcGis 10.1. This integration allowed us to map the sampling stations and perform digital processing necessary for mapping and calculating surfaces. The projection system chosen for this purpose is that of LAMBERT-LCC (Lambert Conformal Conic) whose parameters are defined in the datum CLARKES (1880). The spatial distribution was identified by interpolation of the measurement data to one square mesh grid measuring 20 m × 20 m in size. The estimated value of the non-sampled points was approximately evaluated by applying the concept of nearest neighbor based on the method of inverse distance (Inverse Distance Weighted, IWD).

3. Results

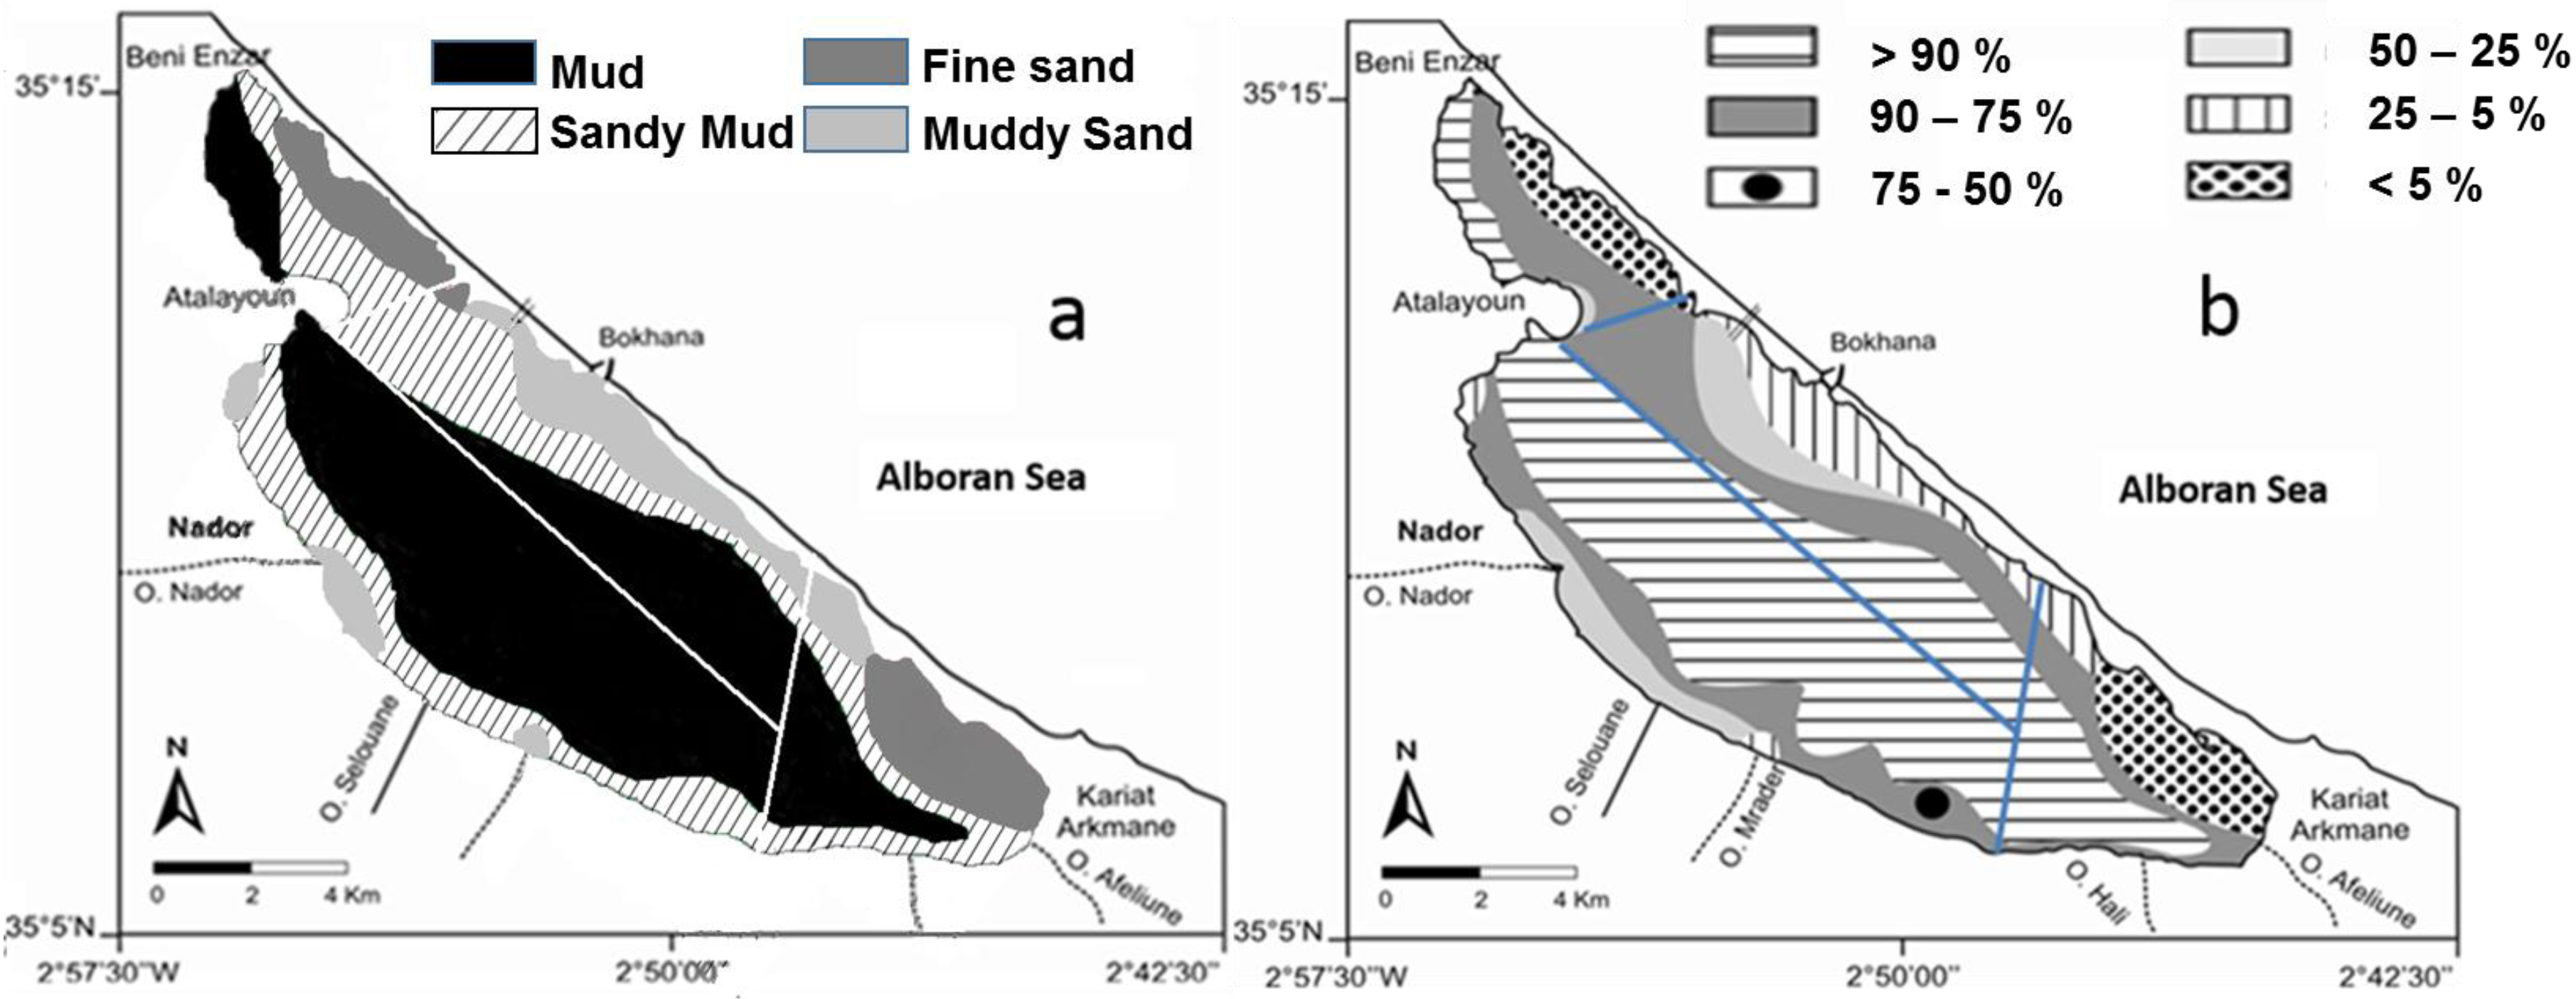
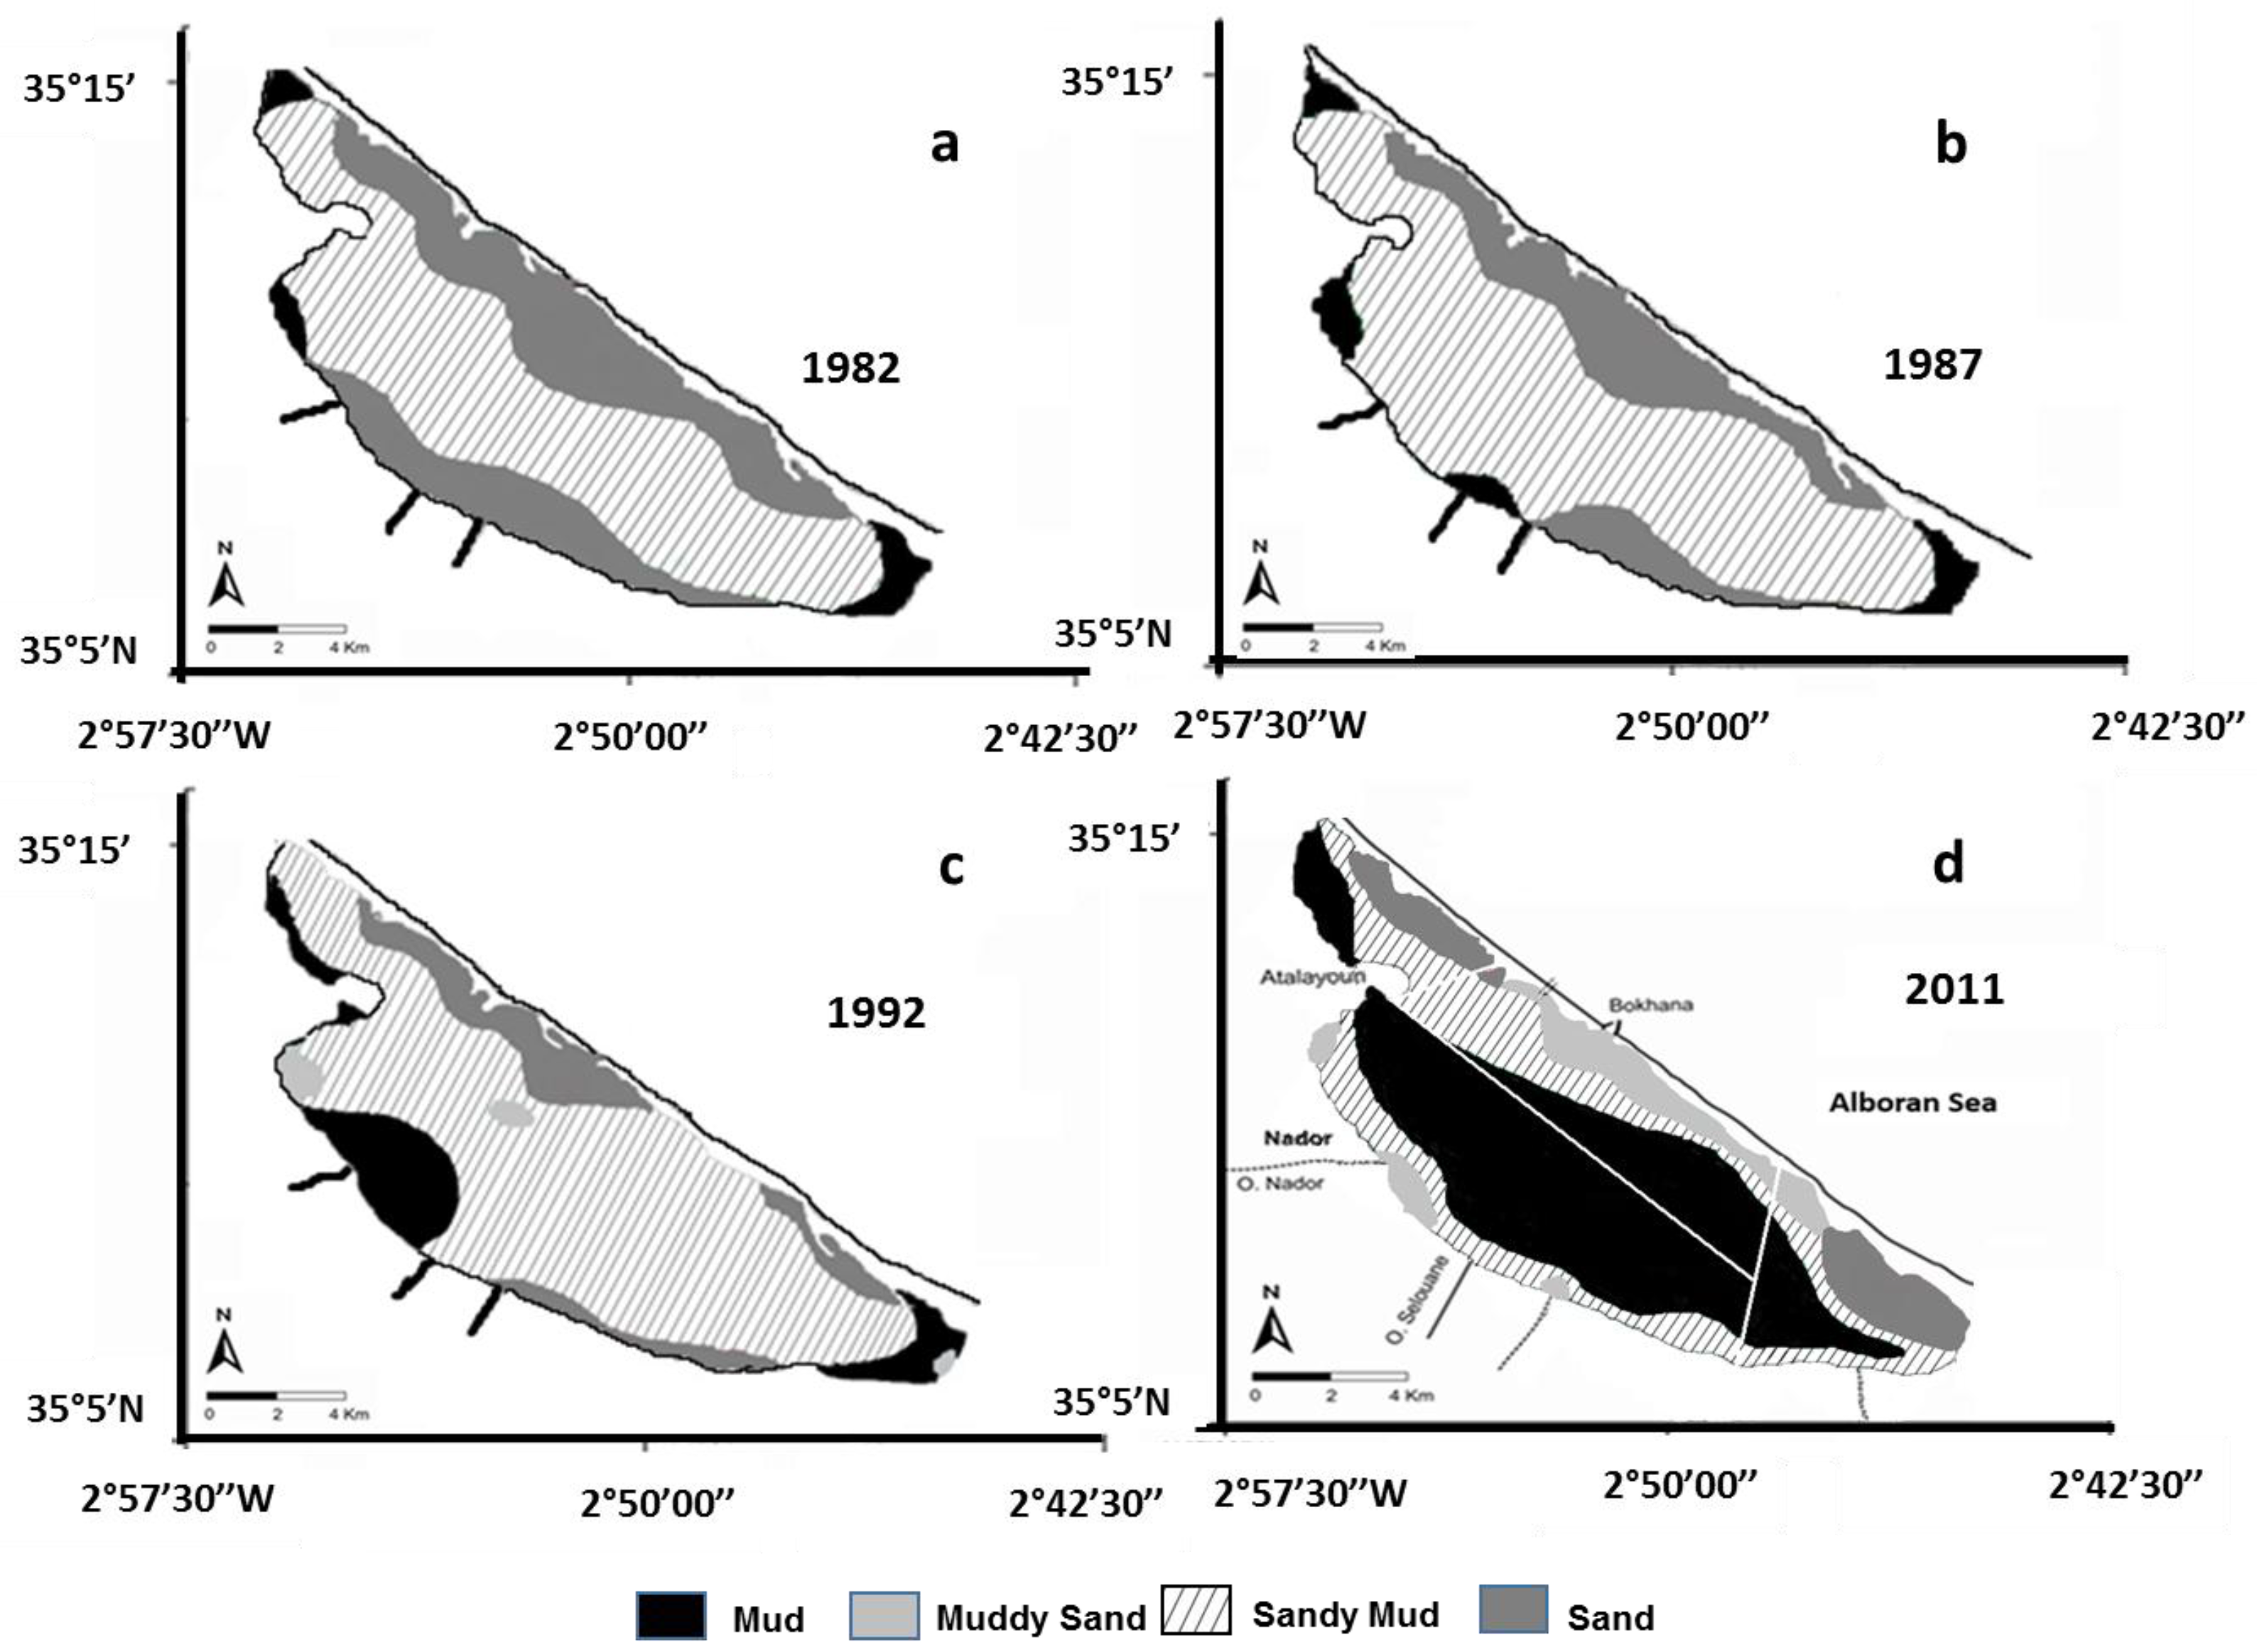
3.1. Distribution of Surface Sediment Facies in the Lagoon Seabed

3.1.1. Spatial Distribution of Surface Sediment Facies

The granulometric analysis of surface sediments of the lagoon seabed allowed us to distinguish four major facies: mud, sandy mud, muddy sand and sand. The mud constituted the main dominant facies of the seabed, surface covering more than 54%, followed by sandy mud, sand and muddy sand (19%, 15% and 13%, respectively) (Figure 4a).
The mud occurred within the middle part of the lagoon seabed from the SE to the NW edge of the large basin and extended to the mainland border of the small basin. The sandy mud constituted continuous strips, which surrounded the mud in the large basin and extended to the middle part of the small basin. The muddy sand stretched along the sandbar border, while it occurred as separate patches in the mainland border. The fine sand, taking the form of two large patches, was limited to the SE and NW extreme parts of the sandbar border.

3.1.2. Lutite Distribution

The lutite, which is defined as the fine fraction having a size of less than 63 μm, consists mainly of fine, medium and coarse silts. The global distribution of lutite rate within the lagoon seabed, expressed as a % of lutite in the total sample, (degree of siltation), showed a predominance of extremely silted to very silted facies (Figure 4b), with contents of lutite higher than 75%. This distribution followed an approximate standard pattern, with an increase from the banks to the middle part of the seabed, with regard to some dissimilarity of siltation rate between the mainland and the marine bank.
In general, the degree of siltation was dependent on the existing seabed facies and changed accordingly. The mud area was extremely silted and the largest part of the sandy mud area was very silted. The muddy sand area was mostly poorly silted and the fine sand area was very poorly silted and showed quasi-similar siltation rates in the two extreme parts of the lagoon (p > 0.05). The moderately silted facies were spread in limited areas of the marine and mainland sides, which were represented by small stretched patches of sandy mud and muddy sand.

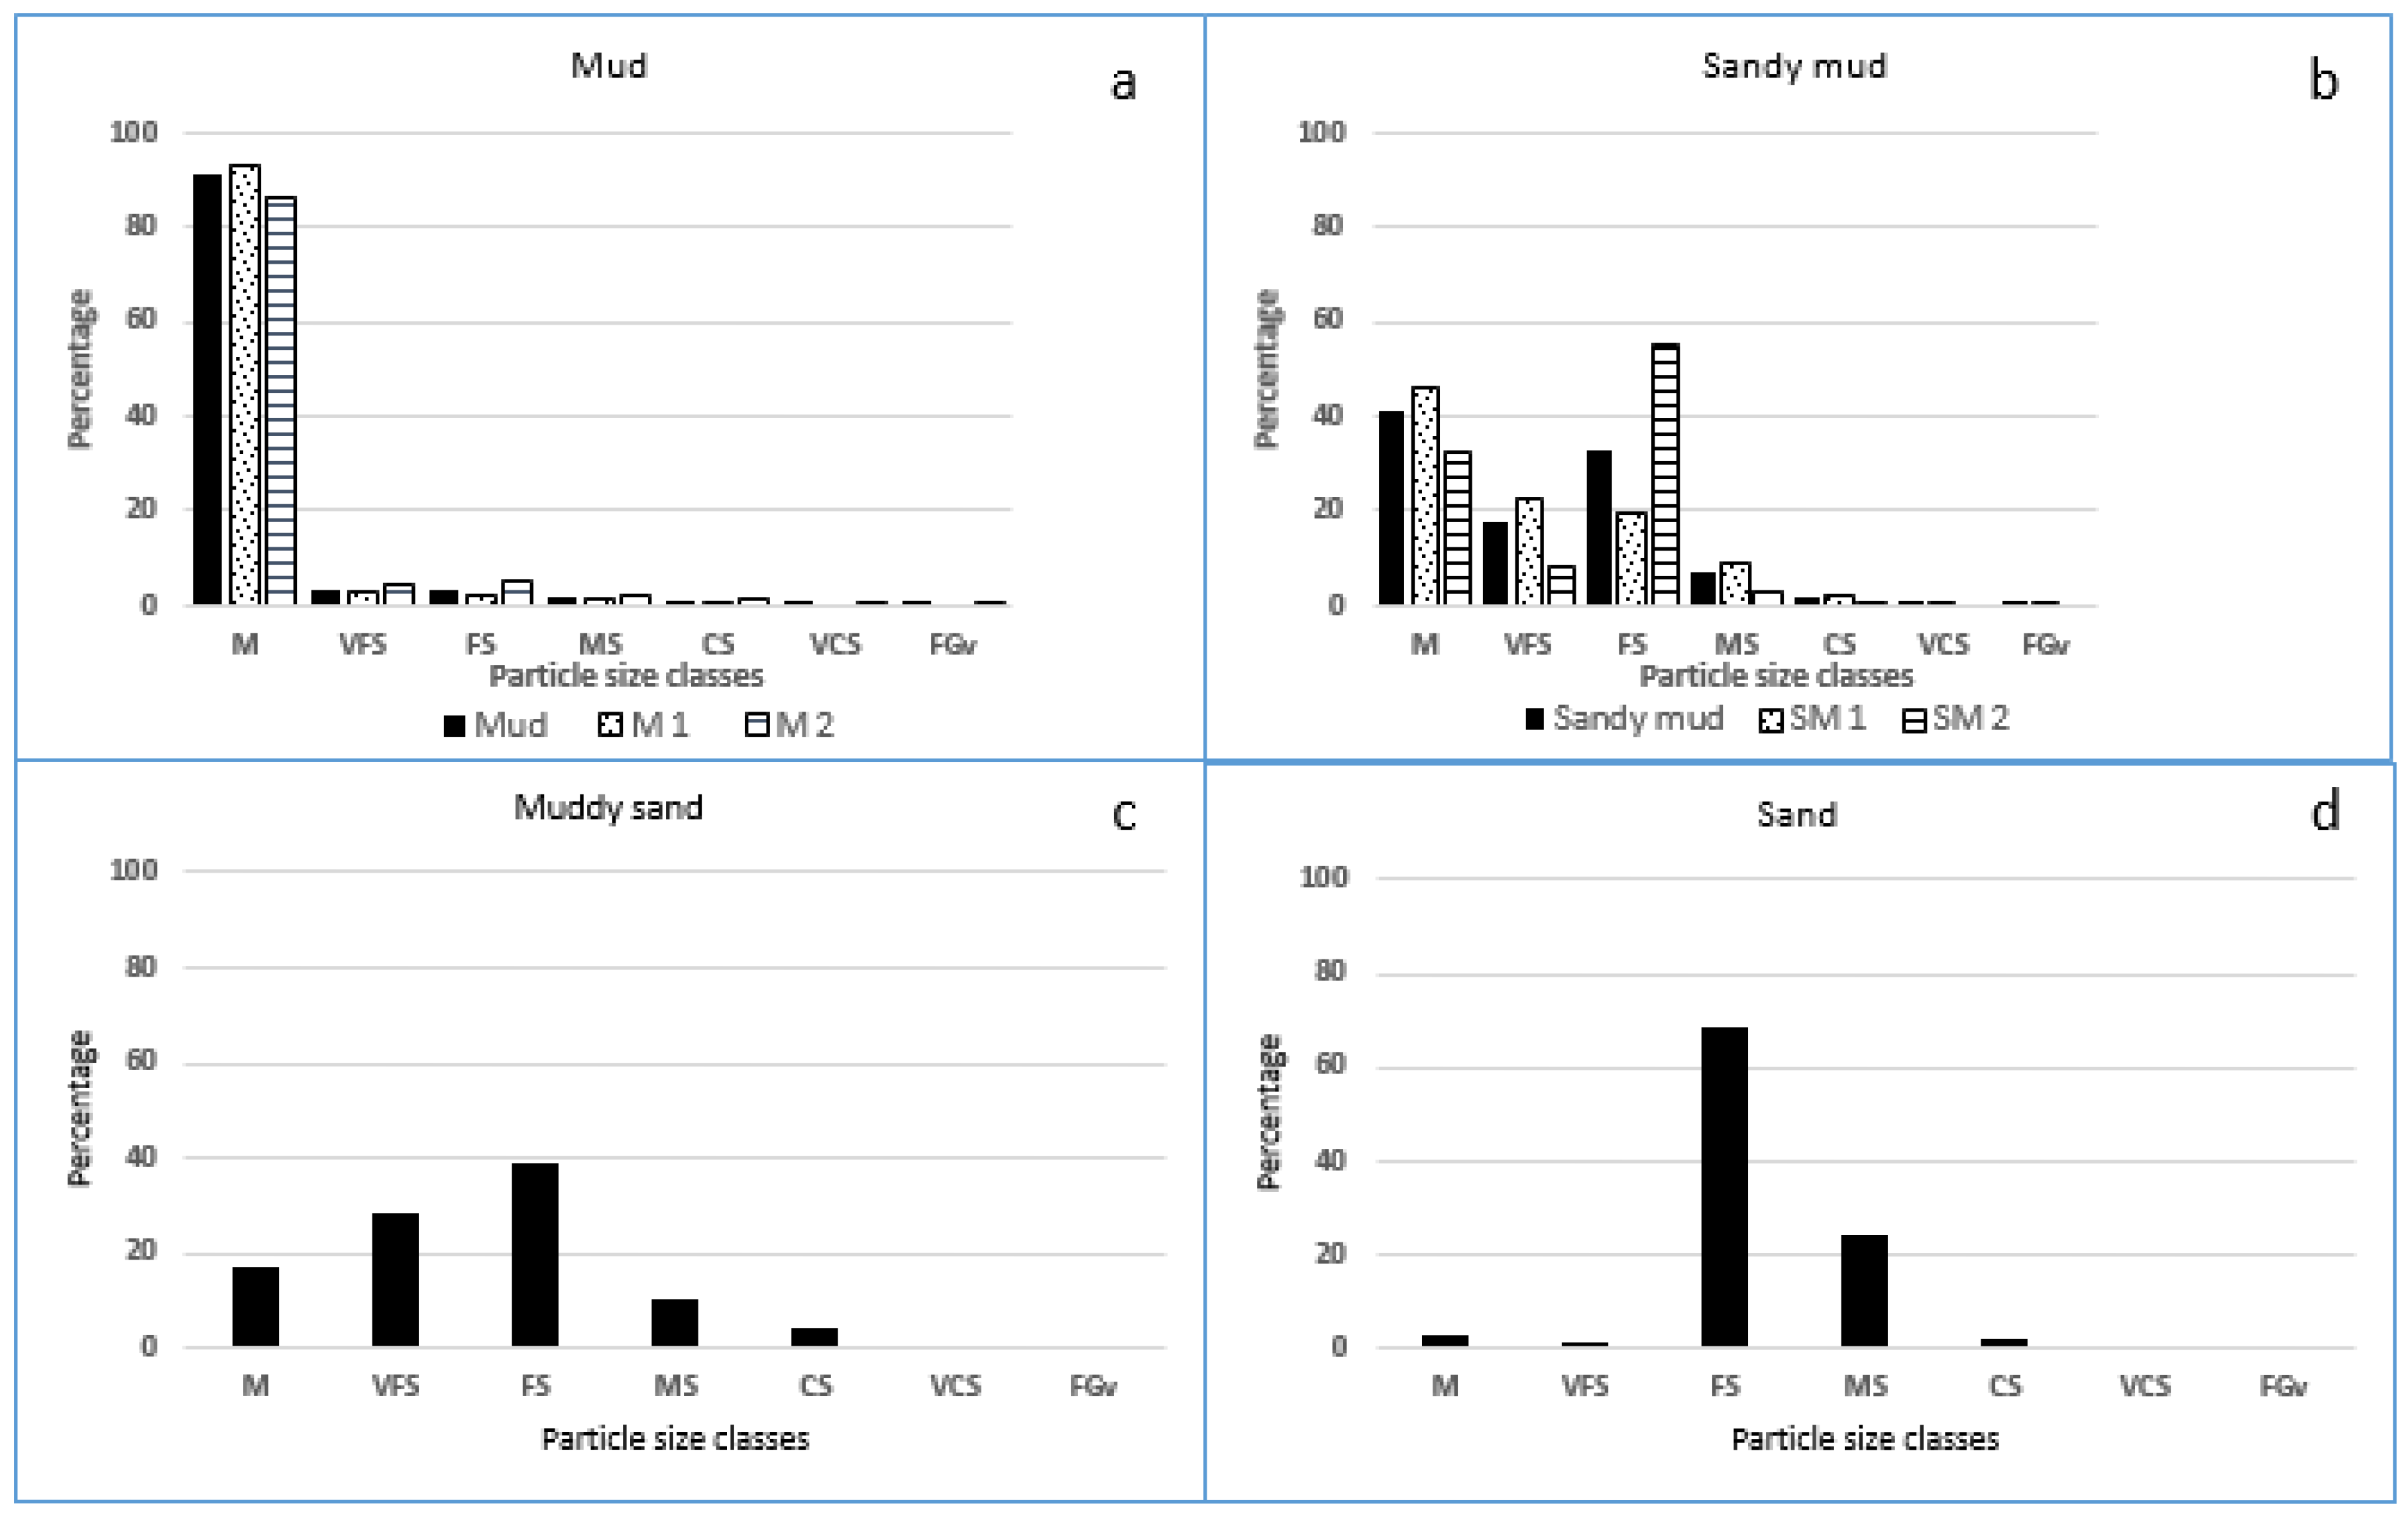
3.1.3. Sediments Grain Size Classes

The frequency distribution of particle size classes of the four facies observed in the lagoon seabed surface sediment is displayed in Figure 5. The qualitative analyses of mud showed a dark olive to brown ochre colour, a compact and cohesive consistency and a predominance of fine particles of lutite (<63 µm) (91.2), with some enrichment in coarse silt, sand and biogenic remains. Two sub-facies classes of mud (M1 and M2) were represented (Figure 5a): (i) the clayey silty mud (M1), which was highly homogeneous, rich in fine grains (<63 µm) that represented up to (93.1) and (ii) the silty clayey mud (M2), which was more heterogeneous, with 86.7% of fine particles in lutite. This last facies was found in some locations of area III (samples 99, 109, 120, 147, 173, and 230).
The sandy mud facies was predominantly silty-sandy, with a mud fraction less than 50% (41.3% ± 8.5%), the sandy fraction texture showed 32.8% and 17.4% of fine and very fine sand, respectively, while it remained very poor in medium, coarse and very coarse sands (6.8%, 1.5% and 0.1%, respectively) (Figure 5b).
Two sub-facies classes were represented: (i) SM1, characterized by a heavily silted material (fine fraction: 46.5%, with a rate of coarse silt in the fine fraction of 45%); (ii) SM2: characterized by a material relatively less silted, the fine fraction is 32.7%, coarse silts form over half of the fine fraction (59.4%).
The muddy sand facies contained 16.9% of mud, and was predominantly composed of fine and very fine sands (39% and 28.4% respectively), and less of medium sand, coarse and very coarse sands (10.4% and less than 4.6% respectively) (Figure 5c).
The sand contents showed less than 5% mud, with a mean of 2.8%. The sediment was predominantly constituted by fine sand (70% of total sand), and less by medium sand (25%), while the very coarse sand was met only in S55 sample at less than 1% (Figure 5d).

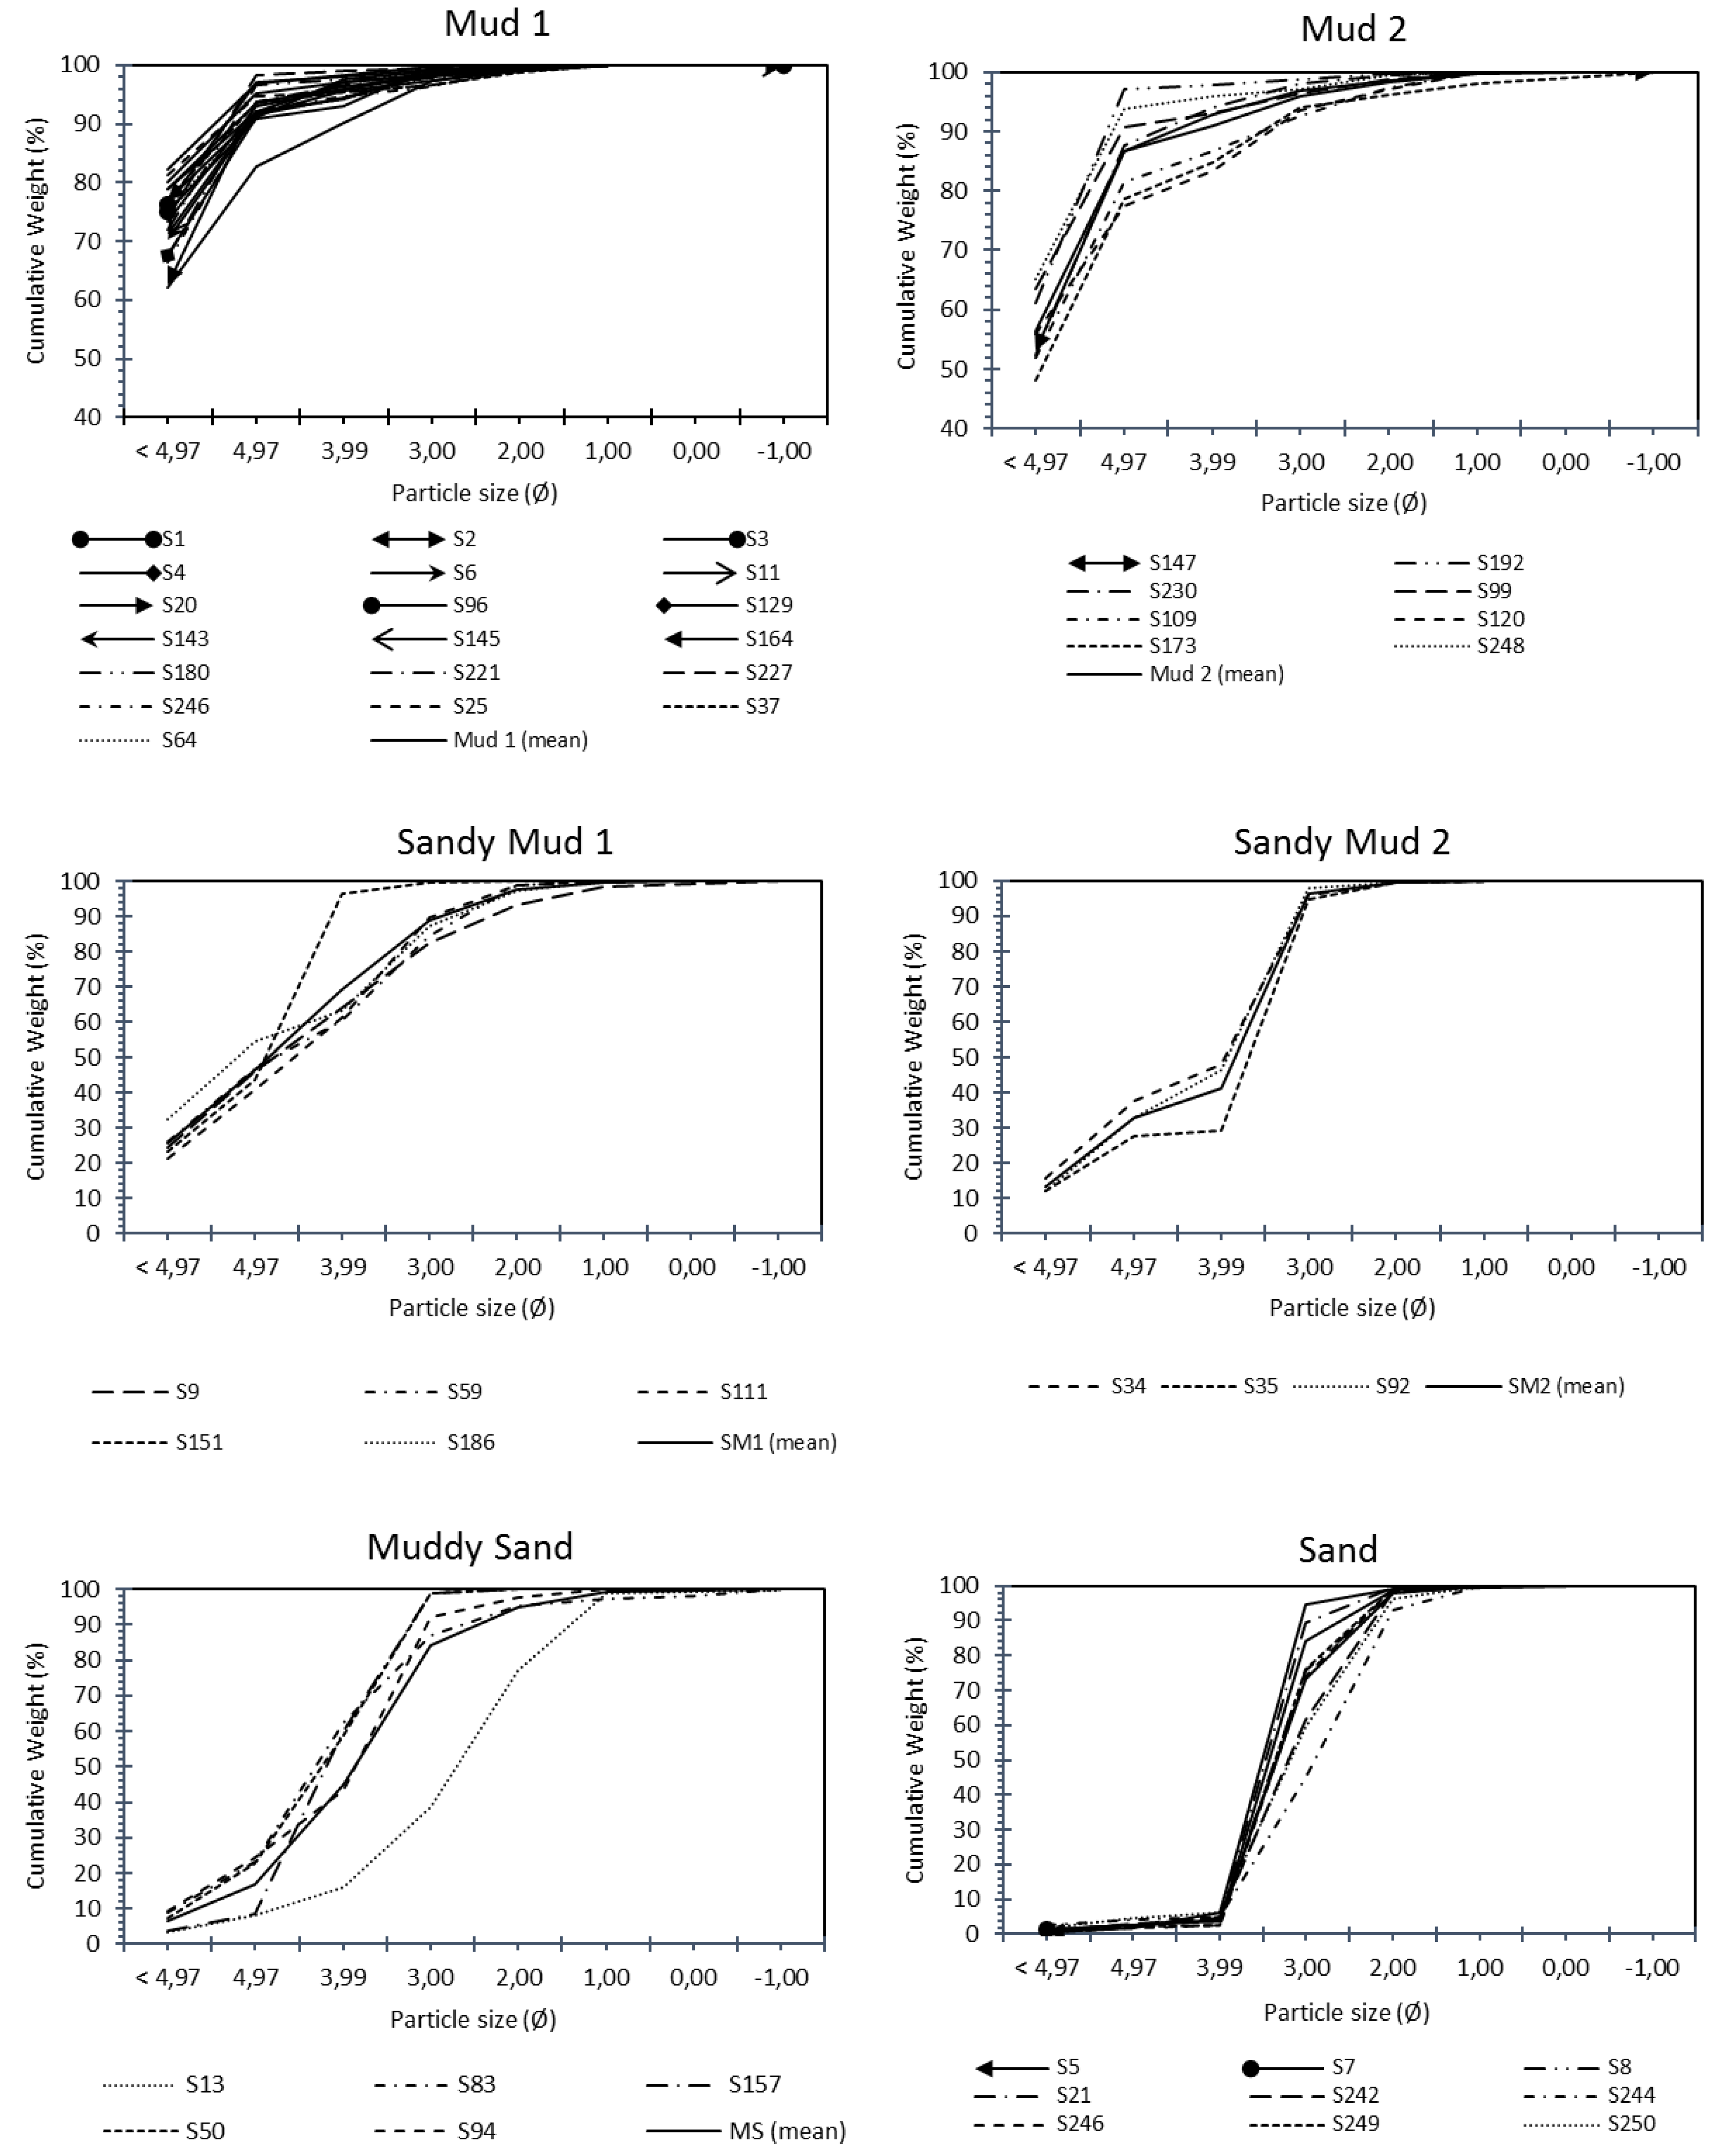
3.2. Granulometric Distribution of Sediments in the Seabed Surface Layer

Granulometric distribution of different facies occurring in the seabed surface layer were determined using grain size descriptive distributions, including cumulative weight frequency plots and grain size indices, which were calculated from the percentile values listed in Table 3.
In general, the Ø grain size distribution of sand and muddy sand facies and sub-facies of mud (Mud1 and Mud2) and sub-facies of sandy mud (SM1 and SM2) displayed a non-symmetric pattern (Figure 6 and Table 4), with differences between mean, mode and median values.
The Ø grain size mean, mode and median of the sub-facies Mud1 (M1) (Table 4), showed average values of 5.1, 5.8 and 5.3 respectively. The average of Mud2 (M2) Ø grain size mean, mode and median values (Table 4) were (4.9, 5.2 and 5.1, respectively). The two sub-facies M1 and M2 were moderately sorted, very coarse skewed and leptokurtic. The cumulative weight frequency plots showed hyperbolic trends, highlighting the features of calmer depositional environment by settling, where the sediment settled according to uniform suspension deposition model (Figure 6).
The Ø grain size mean, mode and median of the sub-facies sandy mud (SM1) (Table 4), showed average values of (3.81, 4.31 and 3.81, respectively). The average of sandy mud (SM2) Ø grain size mean, mode and median values (Table 4) were (3.29, 3.87 and 2.83, respectively). The SM1 sub-facies was poorly sorted, near symmetrical and platykurtic, while SM2 sub-facies was poorly sorted, very fine skewed and platykurtic. The cumulative frequency plot for SM1 displayed approximate hyperbolic trends, showing a predominantly silty sandy facies and reflecting a calmer depositional environment (Figure 6).
The average of muddy sand Ø grain size mean, mode and median values (Table 4) were (2.99, 3.68 and 2.88, respectively). The high σ value could be explained by the heterogeneity of this facies.
This material showed features of being poorly sorted, fine skewed and leptokurtic (1.17, 0.14, 1.19, respectively). The cumulative frequency plots of parabolic trend reflected a predominantly sandy facies, characteristic of rather agitated depositional environments (Figure 6).
The Ø grain size average of mean, mode and median were 2.24, 3.25 and 2.34, respectively.
The facies was moderately well sorted, coarse skewed and mesokurtic (Si = 0.60, Sk = −0.26, kg = 0.99). The cumulative frequency curves of straight parabolic trends highlighted predominantly sandy facies, reflecting a turbulent depositional environment, where the sediment was likely transported by rolling and saltation (Figure 6).

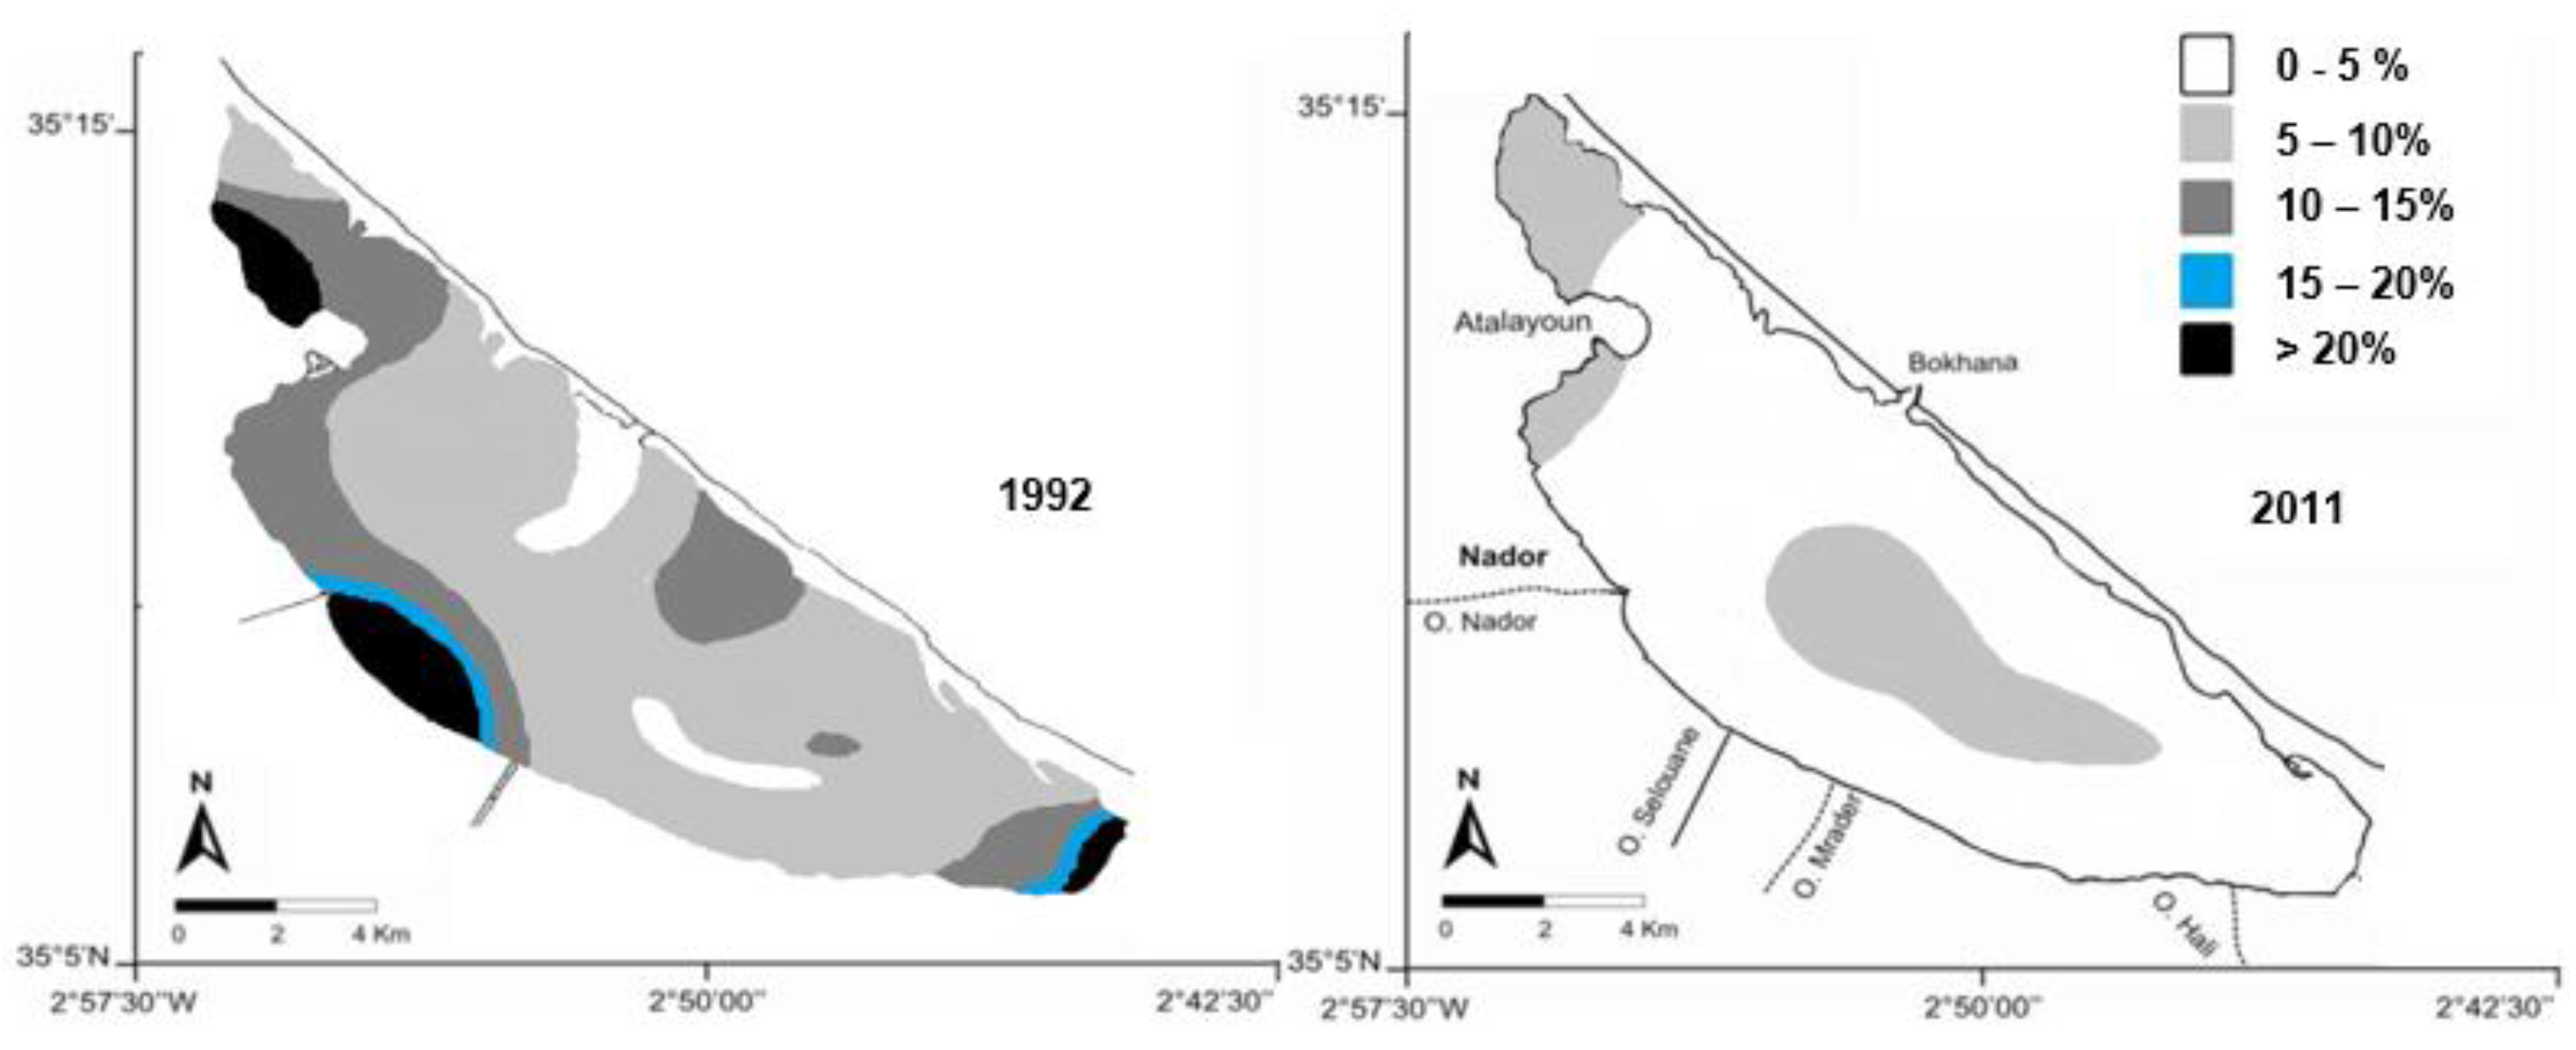
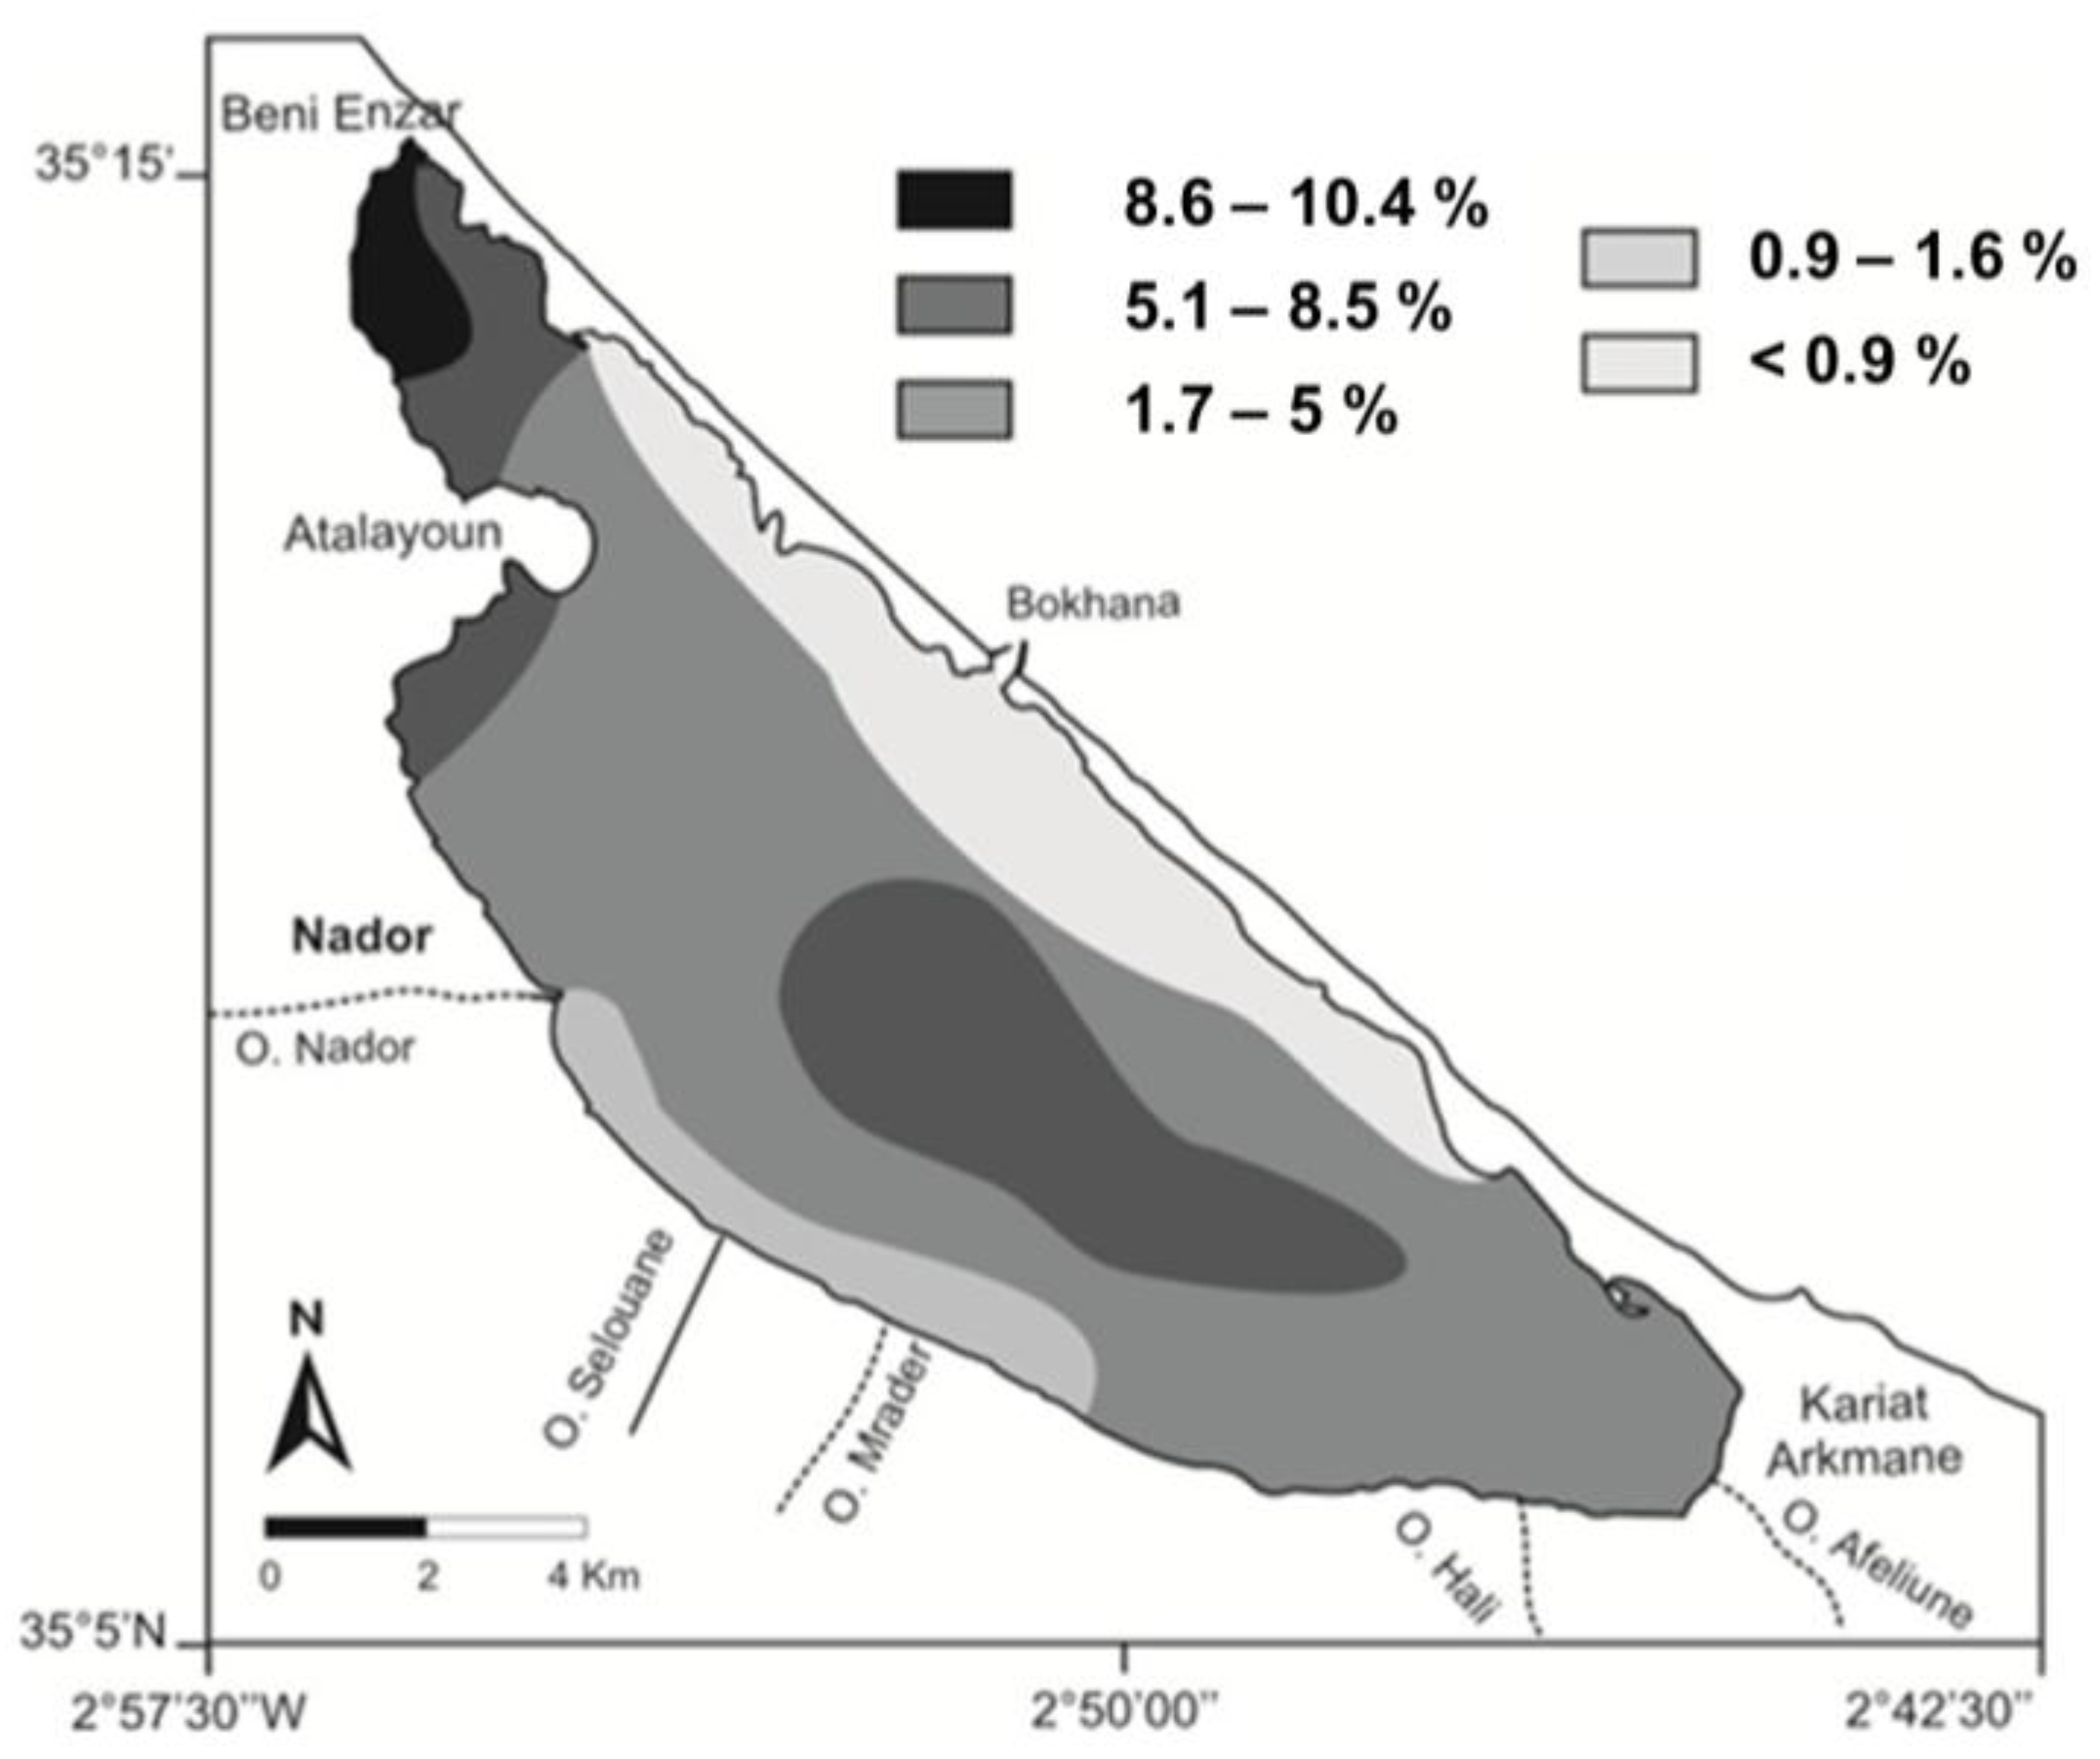
3.3. Organic Matter Distribution

The organic matter (OM) distribution is plotted in Figure 7. The sediment content in OM ranged from 0.2% to 10.4%, with an overall mean of 3.9%. The highest OM rates occurred in the extreme NW mainland part of the small basin (8.6% to 10.4%). High values, 5.1% to 8.1%, occurred both in the rest of the small basin, the central part and the extreme NW part of the large basin. The lowest values (less than 5%) were met in the rest of the lagoon seabed, especially within the middle part of the mainland border (0.9% to 1.6%) and the seabed strip along the boundaries of the sandbar (less than 0.9%).

3.4. Carbonate Distribution

The carbonate contents in the seabed surface sediment varied from 12.3% to 50.8%, with an average of 29%. Its distribution allowed the spotting of three main parallel strips, which occurred along the longitudinal extension of the lagoon, with a decreased change from the marine shore to the mainland side (Figure 8). The 1st strip, leaning against the sandbar along the lagoon, showed a facies moderately carbonated highlighting transitional features and constituted of relatively coarse material, sandy or sandy-muddy and highly rich in biogenic components. The 2nd one covered the main part of the lagoon, with facies poorly carbonated that revealed terrigenous features and predominantly composed of fine mud and muddy sand. Finally, the 3rd one, leaning against the mainland between Beni Enzar and Oued Mrader, was composed of very poorly carbonated sediments (highly terrigenous), slightly heterogeneous, ranging from mud to muddy sand and relatively less fossiliferous.

4. Discussion

The results of our study can be compared with those obtained in the 1980s and 1990s in order to assess changes in surface sediment distribution and gain some insight into the effects of the opening of the new inlet and wastewater treatment plan implementation on Nador lagoon sediment transport processes.
Surface sediments were thoroughly investigated in [11,17,18,29,30]. The evolution of the spatial distribution of the main four facies is summarized in Figure 9, which compares, from left to right, the situation in 1982, 1987, 1992 and the present one.
As can be seen, the sediment distribution did not undergo major changes from 1982 to 1992. The sandy mud remained the main dominant facies covering the majority of the lagoon seabed, and was bordered both at marine and mainland sides, by sand strips, which shrank markedly from 1982 to 1992. The muddy sand sediment appeared in the lagoon seabed later then 1992, and took the form of very small patches beside the SE and the NW edges of the large basin mainland and in the lagoon centre. The muddy sediments were located against the mainland parts of Nador, Beni Enzar and Kariat Arkmane, in the form of small patches in 1982, which extended over time, while a new patch of mud appeared in 1987 against the mainland close to the areas of the old wastewater settling ponds of Nador located inside the lagoon, and which extended largely over time.
A visual comparison of the three maps regarding the 1980s/1990s clearly shows that the facies distribution has completely changed in the last 20 years. The fine sand that covered the majority of the marine shore in the 1980s [6] was found only on the SE and NW edges of the lagoon parts leaning against the sandbar in 2011. The sandy mud, which was the quasi-dominant facies of the seabed [18], has been mainly replaced by mud. This latter, which was previously very limited to small and generally confined locations in areas I and II, the mainland border and around the old wastewater settling ponds (see Figure 1), became the most dominant facies.
In our opinion, the dominance of this mud was likely linked to the great amounts of mud accumulated between 1992 and 2009 in the four areas shown in Figure 9a–c. This is consistent with the hypothesis that the settling ponds in place before 2009, were not always operating very efficiently, thus releasing a large amount of muddy suspended solids in the lagoon and allowing the high mud deposition (source: personal communication by officials of the former treatment plant), in addition to some spills of industrial and agricultural wastewater, which entered the lagoon carried by the freshwater network. With the implementation of the new wastewater treatment plant of activated sludge, the mud deposition process in the lagoon has probably been greatly mitigated.
Taking into consideration that prior to the new channel operation the mud location was more limited to the mainland shore, after its operation, the water circulation inside the lagoon has been enhanced as described in section “Section 2.4” and which likely led to a change in the sediment distribution within the lagoon.
While moving along the mainland shores, the bottom currents likely scattered the muddy sediment confined to the mainland, leading to its displacement and spreading in the middle part of the lagoon.
In 1992, the seabed sediment displayed high contents of OM in most areas of the lagoon, where they had reached concentrations higher than 20% (Figure 10). This clearly shows that, the lagoon displayed a very high degree of pollution.
The surface sediment organic matter distribution underwent a global decrease in the lagoon between 1992 and 2011, including the most confined areas (NW and SE edges of the lagoon), with OM decrease from more than 20% to less than 5% to 10%. This comparison clearly shows that the management works led to an important decrease of organic pollution in the lagoon seabed.
The decrease of OM in the lagoon seabed was likely due to two main processes: (i) the strong hydrodynamics facilitated by the new larger channel, which led to a decrease of residence time, thus contributing to an important dilution of OM; and (ii) pollution input control through the implementation of the new wastewater treatment plant. The OM mean value (3.9%) is in the lowest range of values recorded within Mediterranean lagoons: for example, Thau and Salses-Leucate ponds present, respectively, means of 9.3% and 5.2% [13].
Carbonate contents, in surface sediments of the lagoon, underwent high increase in most parts of the lagoon between the periods from 2003–2005 [19] to 2011, including areas I, II and III, (the 2003–2005 period was taken as a baseline because of the lack of 1992 data), where the facies shifted from very poorly carbonated to moderately carbonated (Table 5), since marine influence became more pronounced with the opening of the channel. In area IV, it remained the same during the two periods, ranging from 20% to 60%, and shifting between poorly carbonated and moderately carbonated.

5. Conclusions

The sedimentary status of Nador lagoon seabed underwent significant changes between 1992 and 2011. First, the organic matter content has markedly decreased in all areas, while carbonate content has increased in most parts of the lagoon seabed. The sand was restricted to the areas I and II instead of the almost marine shore. The sandy mud, which was quasi-dominant in the previous state, was submitted to a strong narrowing and the mud, previously limited to small locations, invaded the entire central part of the lagoon.
These improvements in the quality of the seabed surface sediment could be considered evidence of the beneficial effects of the management project carried out in the lagoon in 2009 and could have significant consequences for ecosystem functioning.
The period between the new channel operation and the present study (up to two years) was not long enough to allow the sedimentary process to reach a new equilibrium. Thus, it seems useful to undertake further studies in the future, in order to detect the long-term trends in sediment redistribution. The present study provides very interesting information on the sedimentary status of the lagoon seabed that could be used as a reference for future studies, but needs to be supported by further surveys regarding sedimentation rates in the seabed.
This study contributes to evaluating the human impact on the marine sediments and management plan implementation for environment improvement, which could consider contributions to coastal management.
Based on the results, the lagoon management implementing a new, larger channel and an efficient wastewater treatment plant could widely affect the lagoon seabed sedimentary status. Additional surveys could determine the impact of these changes on the ecological status of the lagoon.

Acknowledgments

The authors would like to express their deep thanks to the research teams of the INRH Center of Nador and the Faculty of Sciences of Tetouan for their valuable support at different phases of the sampling campaigns and sedimentary analysis.

Author Contributions

The task distribution for the present article realization is as follows: conception and design of the experiments (N.M. and R.N.-d.), performance of the survey (N.M. and N.D.), Data analysis (N.M., B.N. and N.D.), material and analysis tools implementation (N.M., B.N., N.D. and. R.N.-d.), writing of the paper (N.M. and B.N.), in-depth review and correction of the paper (B.N., N.D., P.R. and L.A.).

Conflicts of Interest

The authors declare no conflict of interest. The funding sponsors had no role in any of the following stages: the design of the study; the collection, analyses, and interpretation of data; the writing of the manuscript; the decision on results publication.

References

  1. Berraho, A.; Et Orbi, A.; Dafir, J.E. The Lagoon of Nador: Organization, Functioning and Evolution, Travaux et Documents N° 85; Institut Scientifique des Pêches Maritimes: Casablanca, Morocco, 1995; p. 66. [Google Scholar]
  2. Lemoalle, J. Study of El Bidane Lagoon; Rapports et Documents; INSTOP: Tunis, Tunisia, 1986; p. 80. [Google Scholar]
  3. Dakki, M. Diagnosis for Wetland Management in Northeast Morocco—Sebkha Bou Areg (Nador Lagoon). Medwetcoast-Morocco. 2003. Available online: http://vinc.s.free.fr/IMG/MWC_Maroc_ZH_BouAreg.pdf (accessed on 10 January 2017).
  4. Najih, M.; Berday, N.; Lamrini, A.; Nachite, D.; Et Zahri, Y. Situation of small scale fisheries after the opening of the new channel in the lagoon of Nador. Rev. Mr. Sci. Agron. Vet. 2015, 3, 19–30. [Google Scholar]
  5. Bloundi, M.K. Geochemical Study of the Lagoon of Nador (Eastern Morocco): Impacts of the Anthropic Factors. Ph.D. Thesis, University of Mohammed V, Rabat, Morocco, 2005; p. 238. [Google Scholar]
  6. Mahjoubi, R. Nature and Origin of Particulate Matter Flow and Its Recording in a Microtidal Paralic: Case of the Nador Lagoon. Ph.D. Thesis, University of Moulay Ismail, Meknes, Morocco, 2001; p. 231. [Google Scholar]
  7. Najih, M. Constraints and Prospects for the Development of the Nador Lagoon. A Memo for the Graduation of Chief Engineer; INRH: Casablanca, Morocco, 2009; p. 120. [Google Scholar]
  8. Specific Management Plan for the Lagoon. Available online: http://www.agence-marchica.com (accessed on 21 August 2013).
  9. Guelorget, O.; Perthuisot, J.P.; Frisoni, G.F.; Et Monti, D. The role of confinement in the biogeographical organization of the Nador lagoon (Morocco). Oceanol. Acta 1987, 10, 435–444. [Google Scholar]
  10. Lefebvre, A.; Guelorget, O.; Perthuisot, J.P.; Et Dafir, J. Biological evolution of the lagoon of Nador (Morocco) during the period 1982–1993. Oceanol. Acta 1997, 20, 371–385. [Google Scholar]
  11. Zine, N. Study of the Malacofauna of the Nador Lagoon and Population Dynamics of Venerupis Decussata (Linne 1767). Ph.D. Thesis, University of Mohammed V, Rabat, Morocco, 1989; p. 97. [Google Scholar]
  12. ONEP. Depollution of Marchica. Sanitation, Transfer and Treatment of Wastewater. In Extension of Liquid Sinking Networks of Municipalities and Centers of the Great Nador; ONEP: Rabat, Morocco, 2010; p. 14. [Google Scholar]
  13. Re, V. Groundwater in Urban Coastal Areas: Hydrogeochemical Based Approach for Managing the Transition Areas, The Example of the Lagoon of Nador (Morocco). Ph.D. Thesis, Universita Ca’Foscar Venezia, Venezia, Italy, March 2010. [Google Scholar]
  14. Hilmi, K. Numerical Modeling of the Circulation of Two Paralic Environments of the Moroccan Littoral: The Lagoon of Oulidia (Atlantic) and the Lagoon of Nador (Mediterranean). Ph.D. Thesis, Univesity of Hassan II Casablanca, Casablanca, Morocco, June 2005; p. 182. [Google Scholar]
  15. Najih, M.; Mounir, F. Maccroflora and Bathymetry of Nador Lagoon; INRH: Nador, Morocco, 2013; p. 61. [Google Scholar]
  16. Himi, K.; Makaoui, A.; Idrissi, M.; Abdellaoui, B.; El Ouehabi, Z. Marine circulation of the Nador lagoon (Morocco) by hydrodynamic modeling. Eur. Sci. J. 2015, 11, 11. [Google Scholar]
  17. Guelorget, O.; Frisoni, G.F.; Ximenes, M.C.; Perthuisot, J.P. Biogeological Expressions of Containment in the Nador Lagoon; FAO Rapp: Rome, Italy, 1984; p. 15. [Google Scholar]
  18. MEDRAP. Working Group on the Development of Lagoon Management Methodology; MEDRAP: Montpellier, France, 1995; p. 102. [Google Scholar]
  19. International Atomic Energy Agency. Collection and Preparation of Bottom Sediment Samples for Analysis of Radionuclides and Trace Elements; IAEA-TECDOC-1360; International Atomic Energy Agency: Vienna, Austria, 2003; p. 130. [Google Scholar]
  20. Hamoumi, N.; Chafik, M.; Hazim, M.A.; Kharbaoui, R.; Terhzaz, L.; Hourimeche, A. Control and Evolution of Sedimentation Environments of the Lagoon of Nador (Eastern Mediterranean Coast, Morocco); Rapport Commission International Mer Mediterranee: Barcelone, Spain, 2007; p. 38. [Google Scholar]
  21. Blott, S.J.; Pye, K. GRADISTAT: A grain size distribution and statistics package for the analysis of unconsolidated sediments. Earth Surf. Process. Landf. 2001, 26, 1237–1248. [Google Scholar] [CrossRef]
  22. Chevillon, C. Descriptive sedimentology and cartography of the lagoon of the eastern coast of New Caledonia. In The Seawater of the Lagoons of New Caledonia (Sedimentology, Benthos); ORSTOM: Paris, France, 1997; Volume 3, pp. 7–30. [Google Scholar]
  23. Chardy, P.; Chevillon, C.; Clavier, J. Major benthic communities of the south-west lagoon of New Caledonia. Coral Reefs 1988, 7, 69–75. [Google Scholar] [CrossRef]
  24. Vatan, A. Manual of Sedimentology; Technip: Paris, France, 1967. [Google Scholar]
  25. Fournier, J.; Bonnot-Courtois, C.; Paris, R.; Voldoire, O.; le Vot, M. Granulometric Analysis, Principles and Methods; CNRS: Dinard, France, 2012; p. 99. [Google Scholar]
  26. Friedman, G. On sorting coefficient and the log-normality of the grain-size distribution of sandstones. J. Geol. 1962, 70, 737–756. [Google Scholar] [CrossRef]
  27. Chamley, H. Bases de Sedimentologie; Dunod: Paris, France, 2000; p. 178. [Google Scholar]
  28. Folk, R.L.; Ward, W.C. Brazos River bar: A study in the significance of grain size parameters. J. Sediment. Petrol. 1957, 27, 3–26. [Google Scholar] [CrossRef]
  29. Tesson, M.; Et Gensous, B. Some Characteristics of the Geochemistry of a Microtidal Lagoon: La Sebkha Bou Areg (Nador Lagoon); National Congress of Scientific Societies Acts 106, Science Section: Perpignan, France, 1981; Volume 3, pp. 183–194. [Google Scholar]
  30. Frisoni, G.F.; Guelorget, O.; Vetillart, T. Definition of a Communication Structure Between the Sea and a Coastal Lagoon, with a View to Aquaculture Exploitation of the Environment: Choice of an Optimal Solution Based on an Ecological Diagnosis. Case of the Marchica Lagoon (Morocco); 28th Hydraulic Days, 11–13 September Report No. 1; Cemagref: Marseille, France, 1984; p. 20. [Google Scholar]
Figure 1. Maps showing Nador lagoon location (a) Lagoon watershed (b) and lagoon and freshwater hydrographic network (shown by yellow arrows), old settling basins and new wastewater treatment plant (shown by red arrows) (c) [7].
Jmse 05 00007 g001
Figure 2. Bathymetry of Nador lagoon [15].
Jmse 05 00007 g002
Figure 3. Lagoon map showing sampled sites along the seabed.
Jmse 05 00007 g003
Figure 4. Global distributions of surface sediment facies (a) and lutite rates (degree of siltation) (b) within the Nador lagoon seabed.
Jmse 05 00007 g004

Limits (% of Lutites) [22]<55–2525–5050–7575–90>90
Facies featuresVery poorly siltedPoorly siltedModerately siltedVey siltedVery strongly siltedExtremely silted
Figure 5. Frequency distribution of grain size classes of Mud (a), Sandy mud (b), Muddy sand (c) and Sand (d) in the seabed surface layer. M: Mud, VFS: Very Fine Sand FS: fine sand, MS: Medium Sand, CS: Coarse S, and VCS: Very Coarse Sand, FGv: Fine Gravel.
Jmse 05 00007 g005
Figure 6. Cumulative frequency curves of the facies muddy sand, sand and the sub-facies of mud (Mud1 and Mud2) and sandy mud (SM1 and SM2).
Jmse 05 00007 g006
Figure 7. Distribution of organic matter (OM) in surface sediment of the Nador lagoon seabed.
Jmse 05 00007 g007

OM Limits (%) [22]8.6%–10.4%5.1%–8.5%1.7%–5%0.9%–1.6%<0.9%
Significance: Facies featuresadvanced irreversible anoxic state or tends to irreversible anoxiaTends toward state of anoxialess advanced anoxic statematches sandy facies or muddy sand relatively agitated
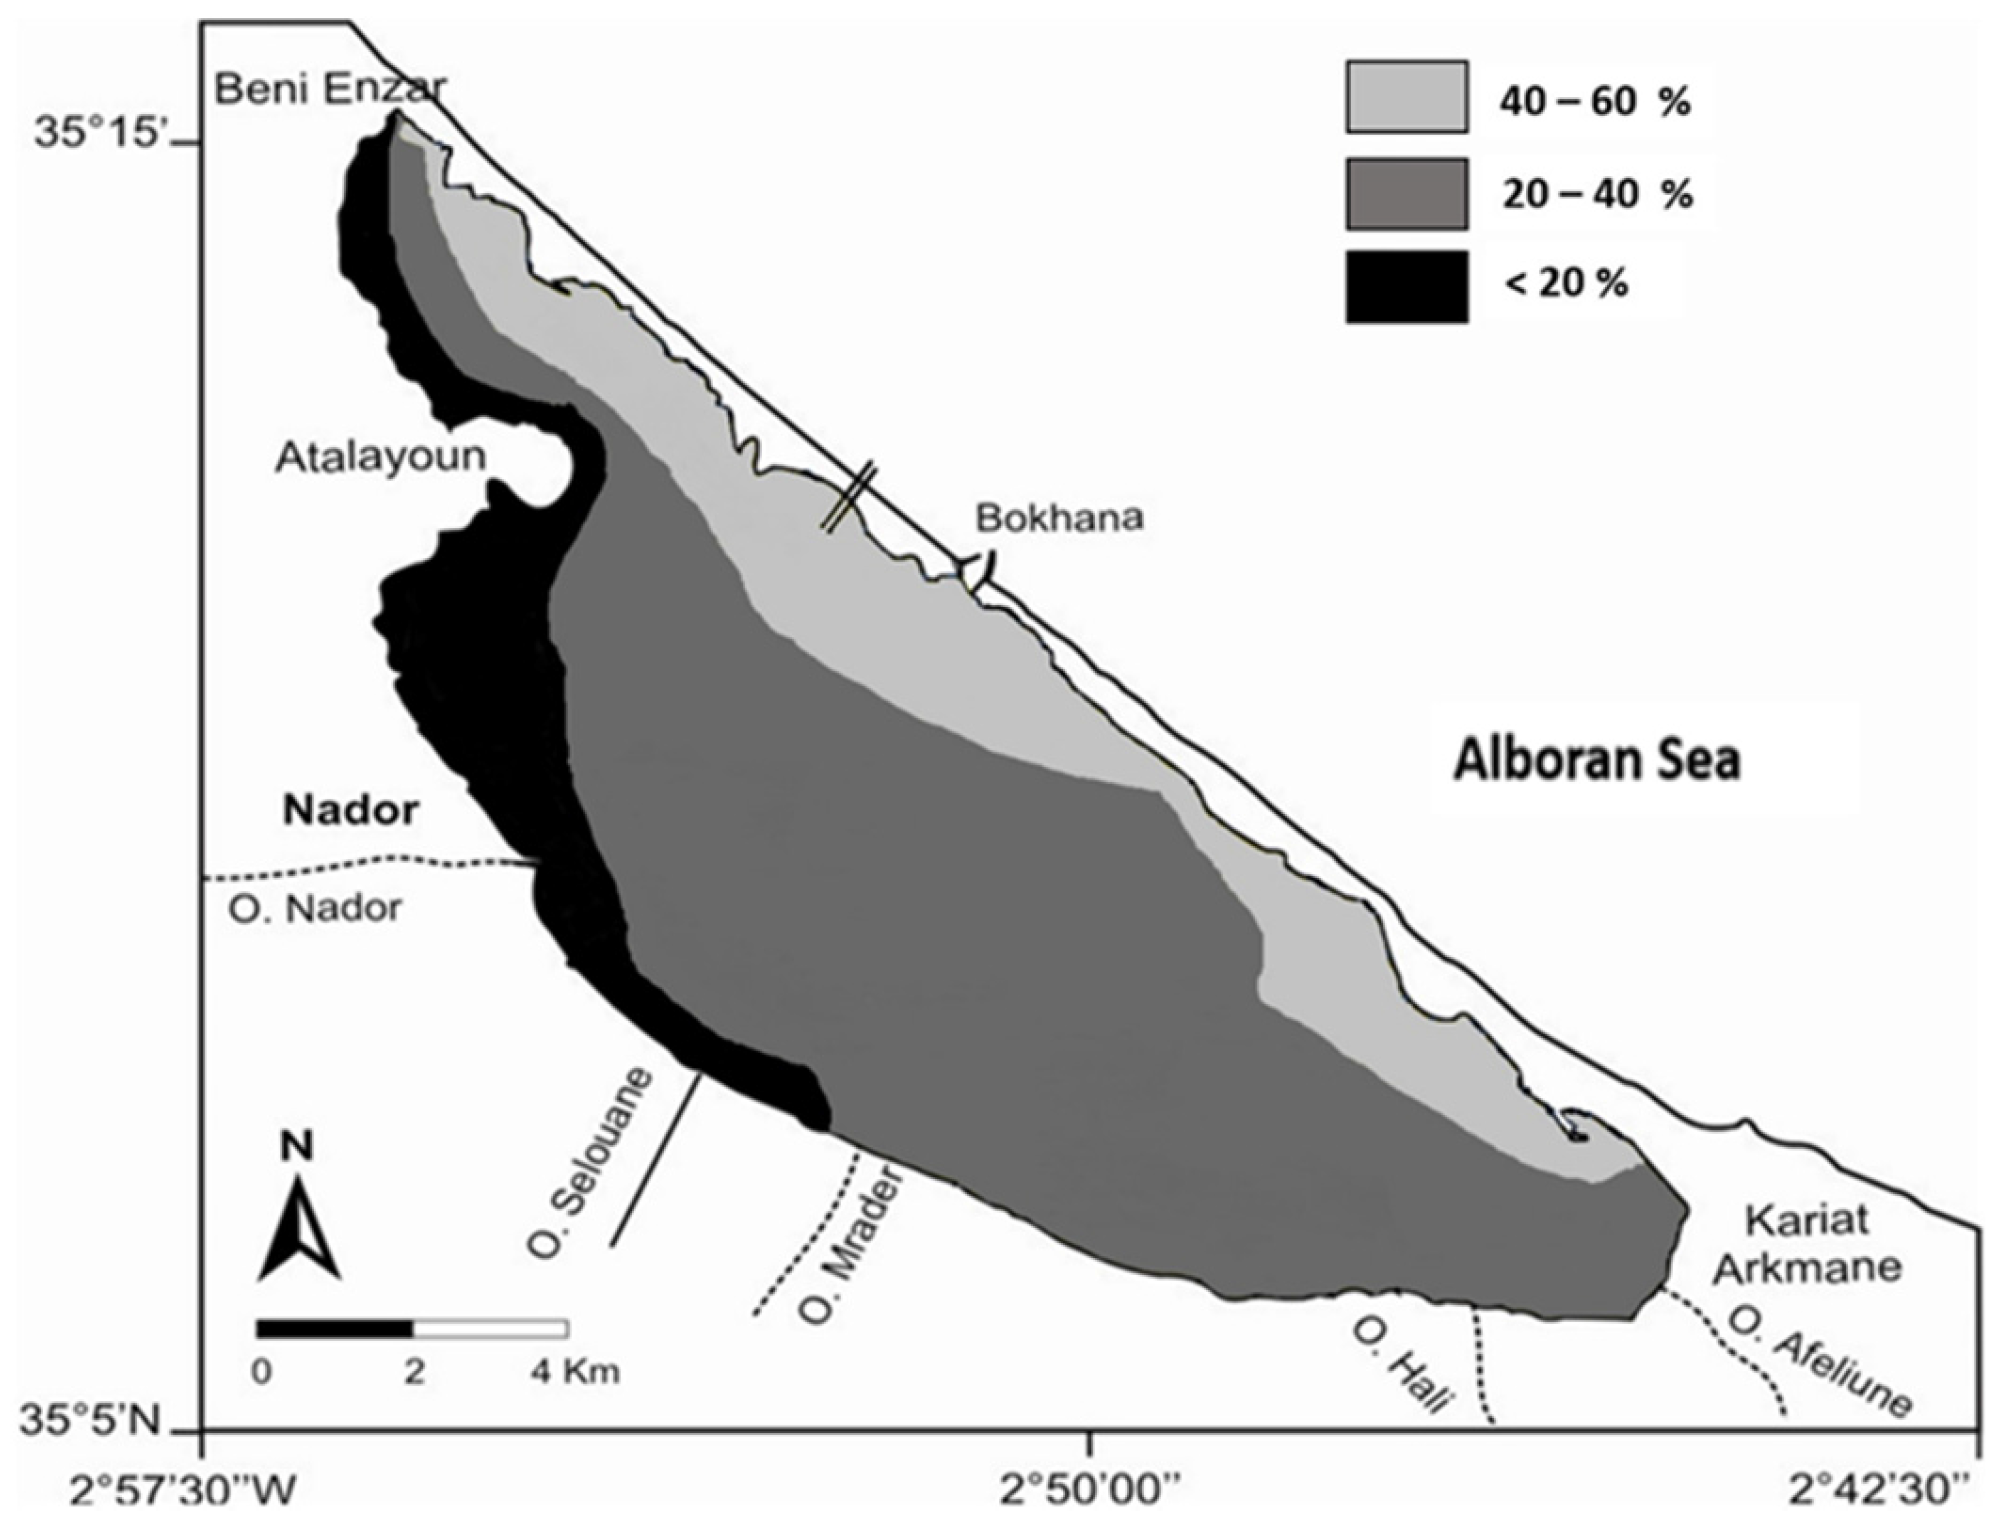
Figure 8. Distribution of carbonate in the seabed surface sediments.
Jmse 05 00007 g008

Carbonate Limits<20%20%–40%40%–60%60%–80%>80%
Facies characteristics [22]Very poorly carbonatedPoorly carbonatedModerately carbonatedHighly carbonatedExtremely carbonated
High terrigenousTerrigenousTransitionalImpure carbonateHigh carbonate
Figure 9. Changes in surface sediment distribution in Nador lagoon seabed from 1982 up to 2011 ((a) 1982, (b) 1987, (c) 1992, (d) 2011) [11,17,18]: figures redrawn.
Jmse 05 00007 g009
Figure 10. Changes in OM distribution in Nador lagoon seabed from 1992 [18] to 2011: figure redrawn.
Jmse 05 00007 g010
Table 1. Sampling points and description of sampling network characteristics.
Seabed AreaIIIIIIIV
Surface S = 12.3 km2S = 20.3 km2S = 51.1 km2S = 29.5 km2
Hydrodynamic characteristicsVery Low hydrodynamism (Highly confined) [20]
Depth: 0–3 m
Very Low hydrodynamism (Highly confined) [20]
Depth: 0–6.6 m
High to low hydrodynamism
Depth: 0–7 m
High hydrodynamism Under marine influence
Depth: 0–7 m
Potential pressureThis part is facing the industrial zone of Beni Nsar- old WWTP *Agricultural influenceThis part is facing Nador city, the old and new WWTP, receives inputs from rivers is under high anthropic and freshwater network influenceNo pressure
Sampling sites (S)S1–S9S221, S227, S230, S231, S244, S246, S248–S250S11, S13, S25, S26, S37, S59, S64, S75, S83, S99, S109, S111, S129, S143, S147, S151, S157, S164, S173, S180, S186S21, S22, S34, S35, S50, S92, S94, S96, S120, S192
* WWTP: Wastewater Treatment Plan.
Table 2. Calculation method of grain size parameters (logarithmic graphical measures [21,24]).
Calculation MethodClassification Used to Define Type of Sediment
median of the sample
M z = Ø ( 16 + 50 + 84 ) 3
- mean = median = mode: symmetric distribution
- mean, median and mode will be three different values: non-symmetric distribution
- mean value is flanked by 1 and 2 standard deviation points: normal distribution
Inclusive graphic standard deviation “sorting index” or Trask index
Ø ( 84 16 ) 4 + Ø ( 95 5 ) 6.6
Sorting
<0.35 → Very well sorted
0.35 to 0.5 → Well sorted
0.50 to 0.71 → Moderately well sorted
0.71 to 1.0 → Moderately sorted
1.0 to 2.0 → Poorly sorted
2.0 to 4.0 → Very poorly sorted
>4.0 → Extremely poorly sorted
Inclusive graphic “Skewness” or symmetry index
S k = Ø 16   +   Ø 84     2 Ø 50 2 (   Ø 84     Ø 16 ) + Ø 5 +   Ø 95   2 Ø 50 2 (   Ø 95     Ø 5 )
Skewness (Sk1)
1.0 to 0.3 → Very fine skewed
0.3 to 0.1 → Fine skewed
0.1 to −0.1→ Near symmetrical
−0.1 to −0.3 → Coarse-skewed
−0.3 to −1.0 Very coarse skewed
Graphic Kurtosis
K G = Ø 95   Ø 5 2.44   ( Ø 75     Ø 25 )
Kurtosis (KG)
<0.67 → Very Patykurtic
0.67 to 0.90 → Patykurtic
0.90 to 1.11 → Mesokurtic
1.11 to 1.50 → Leptokurtic
1.50 to 3.00 → Very Leptokurtic
>3.00 → Extremely leptokurtic
Table 3. Percentile mean values used for grain size parameter calculation.
FaciesØ5Ø16Ø25Ø50Ø75Ø84Ø95
Mud13.354.854.55.335.685.755.92
Mud22.214.084.415.155.665.695.88
SM11.352.212.723.855.075.355.8
SM22.032.232.382.854.424.885.69
Muddy sand0.992.002.252.883.724.105.25
Sand1.131.571.932.342.7O2.832.99
Table 4. Grain size attributes of mud, sandy mud, muddy sand and sub-facies M1, M2, SM1 and SM2.
FaciesSites OccurrenceMZ ± σ ØM ± σ µmMode ØMe ØSorting S0 Skewness SKKurtosis Kg Significance
Mud (mean) 5.13 ± 0.210.029 ± 0.0055.575.30.93−0.491.63Moderately sorted, Very Coarse skewed, Very Leptokurtic
Mud1Area I: S1–S6
Area II: S221, S227
Area III: S11, S20, S25, S37, S64, S129, S143, S145, S164, S180
Area IV: S96
5.17 ± 0.110.028 ± 0.0025.755.30.73−0.411.49Moderately sorted, Very coarse skewed, Leptokurtic
Mud2Area II: S230, S246, S249, S250, S244
Area III. S99, S109, S147, S173
Area IV: S120, S22
4.96 ± 0.210.033 ± 0.0065.215.10.97−0.411.36Moderately sorted, Very coarse skewed, Leptokurtic
Sandy mud (mean) 3.65 ± 0.290.079 ± 0.0164.133.51.400.110.77Poorly sorted, Near symmetrical, Platykurtic
SM1Area I: S9
Area III: S59, S111, S151, S186
3.81 ± 0.190.071 ± 0.0084.313.811.47−0.070.81Poorly sorted, Near symmetrical, Platykurtic
SM2Area IV: S34, S35, S923.29 ± 0.110.102 ± 0.0073.872.831.190.540.74Poorly sorted, Very fine skewed, Platykurtic
Muddy sandArea II: S231
Area III: S13, S83, S157
Area IV: S50, S94
2.99 ± 0.530.125 ± 0.063.682.881.170.141.19Poorly sorted, Fine skewed, Leptokurtic
SandArea I: S5, S7, S8
Area II: S246, S249, S250, S244
Area IV: S21
2.24 ± 0.130.22 ± 0.023.252.340.60−0.260.99Moderately well sorted, Coarse skewed, Mesokurtic
Facies grain size distribution.
Table 5. Changes in organic matter and carbonate distribution in the seabed sediment after lagoon management (%).
Parameters (%)DateArea IArea IIArea III Area IV
Carbonate2003–2005 [20] LowLow5.3–26.526.5–53
201140–6040–6020–4020–60

