Article

Assessment of Damage and Adaptation Strategies for Structures and Infrastructure from Storm Surge and Sea Level Rise for a Coastal Community in Rhode Island, United States

1
Department of Ocean Engineering, University of Rhode Island, Narragansett, RI 02882, USA
2
Departments of Ocean/Civil and Environmental Engineering, University of Rhode Island, Narragansett, RI 02882, USA
3
Swanson Environmental Associates LLC, Saunderstown, RI 02874, USA
*
Author to whom correspondence should be addressed.
J. Mar. Sci. Eng. 2016, 4(4), 67; https://doi.org/10.3390/jmse4040067
Submission received: 11 August 2016 / Revised: 12 October 2016 / Accepted: 14 October 2016 / Published: 20 October 2016

Abstract

:
This paper presents an evaluation of inundation, erosion, and wave damage for a coastal community in Rhode Island, USA. A methodology called the Coastal Environmental Risk Index (CERI) was used that incorporates levels of inundation including sea level rise, wave heights using STWAVE, and detailed information about individual structures from an E911 database. This information was input into damage functions developed by the U.S. Army Corps of Engineers following Hurricane Sandy. Damage from erosion was evaluated separately from local published erosion rates. Using CERI, two different adaptation strategies were evaluated that included a combination of dune restoration, protective berms, and a tide gate. A total of 151 out of 708 structures were estimated to be protected from inundation and wave action by the combined measures. More importantly, the use of CERI allowed for the assessment of the impact of different adaptation strategies on both individual structures and an entire community in a Geographical Information Systems (GIS) environment. This tool shows promise for use by coastal managers to assess damage and mitigate risk to coastal communities.

1. Introduction

Matunuck, Rhode Island is a coastal community in the northeast United States that is vulnerable to the effects of storm surge, sea level rise, and erosion. As such, it is representative of many small communities that are facing these challenges without the resources of large urban cities. The Matunuck Beach community (Figure 1) has only one evacuation route, which is a coastal road that runs parallel to the shore and is highly susceptible to flooding. Erosion rates in this area are among the highest in Rhode Island [1], ranging from 0.8 to 3.5 ft/year (Figure 2). Figure 3 shows photographs of a local restaurant in the study area taken in the 1950s and 2012, clearly showing the loss of shoreline [2]. The evacuation route for the community can be seen in Figure 1 and Figure 2 directly behind the restaurant.
Sea level is also increasing at this site, and estimates of sea level rise by 2100 range from 0.5 ft assuming a linear increase from historical records to almost 7 ft using the National Oceanic and Atmospheric Administration’s (NOAA) most conservative projections (Figure 4) [3]. The Rhode Island Coastal Resources Management Council (RI CRMC), which is the state agency responsible for preservation, protection, and development of the coast, has adopted NOAA’s most conservative projections of sea level rise (1 ft by 2025, 2 ft by 2050, and 7 ft by 2100) in their regulatory guidelines.
Given these challenges facing the Matunuck Beach community, the objectives of this study were the following:
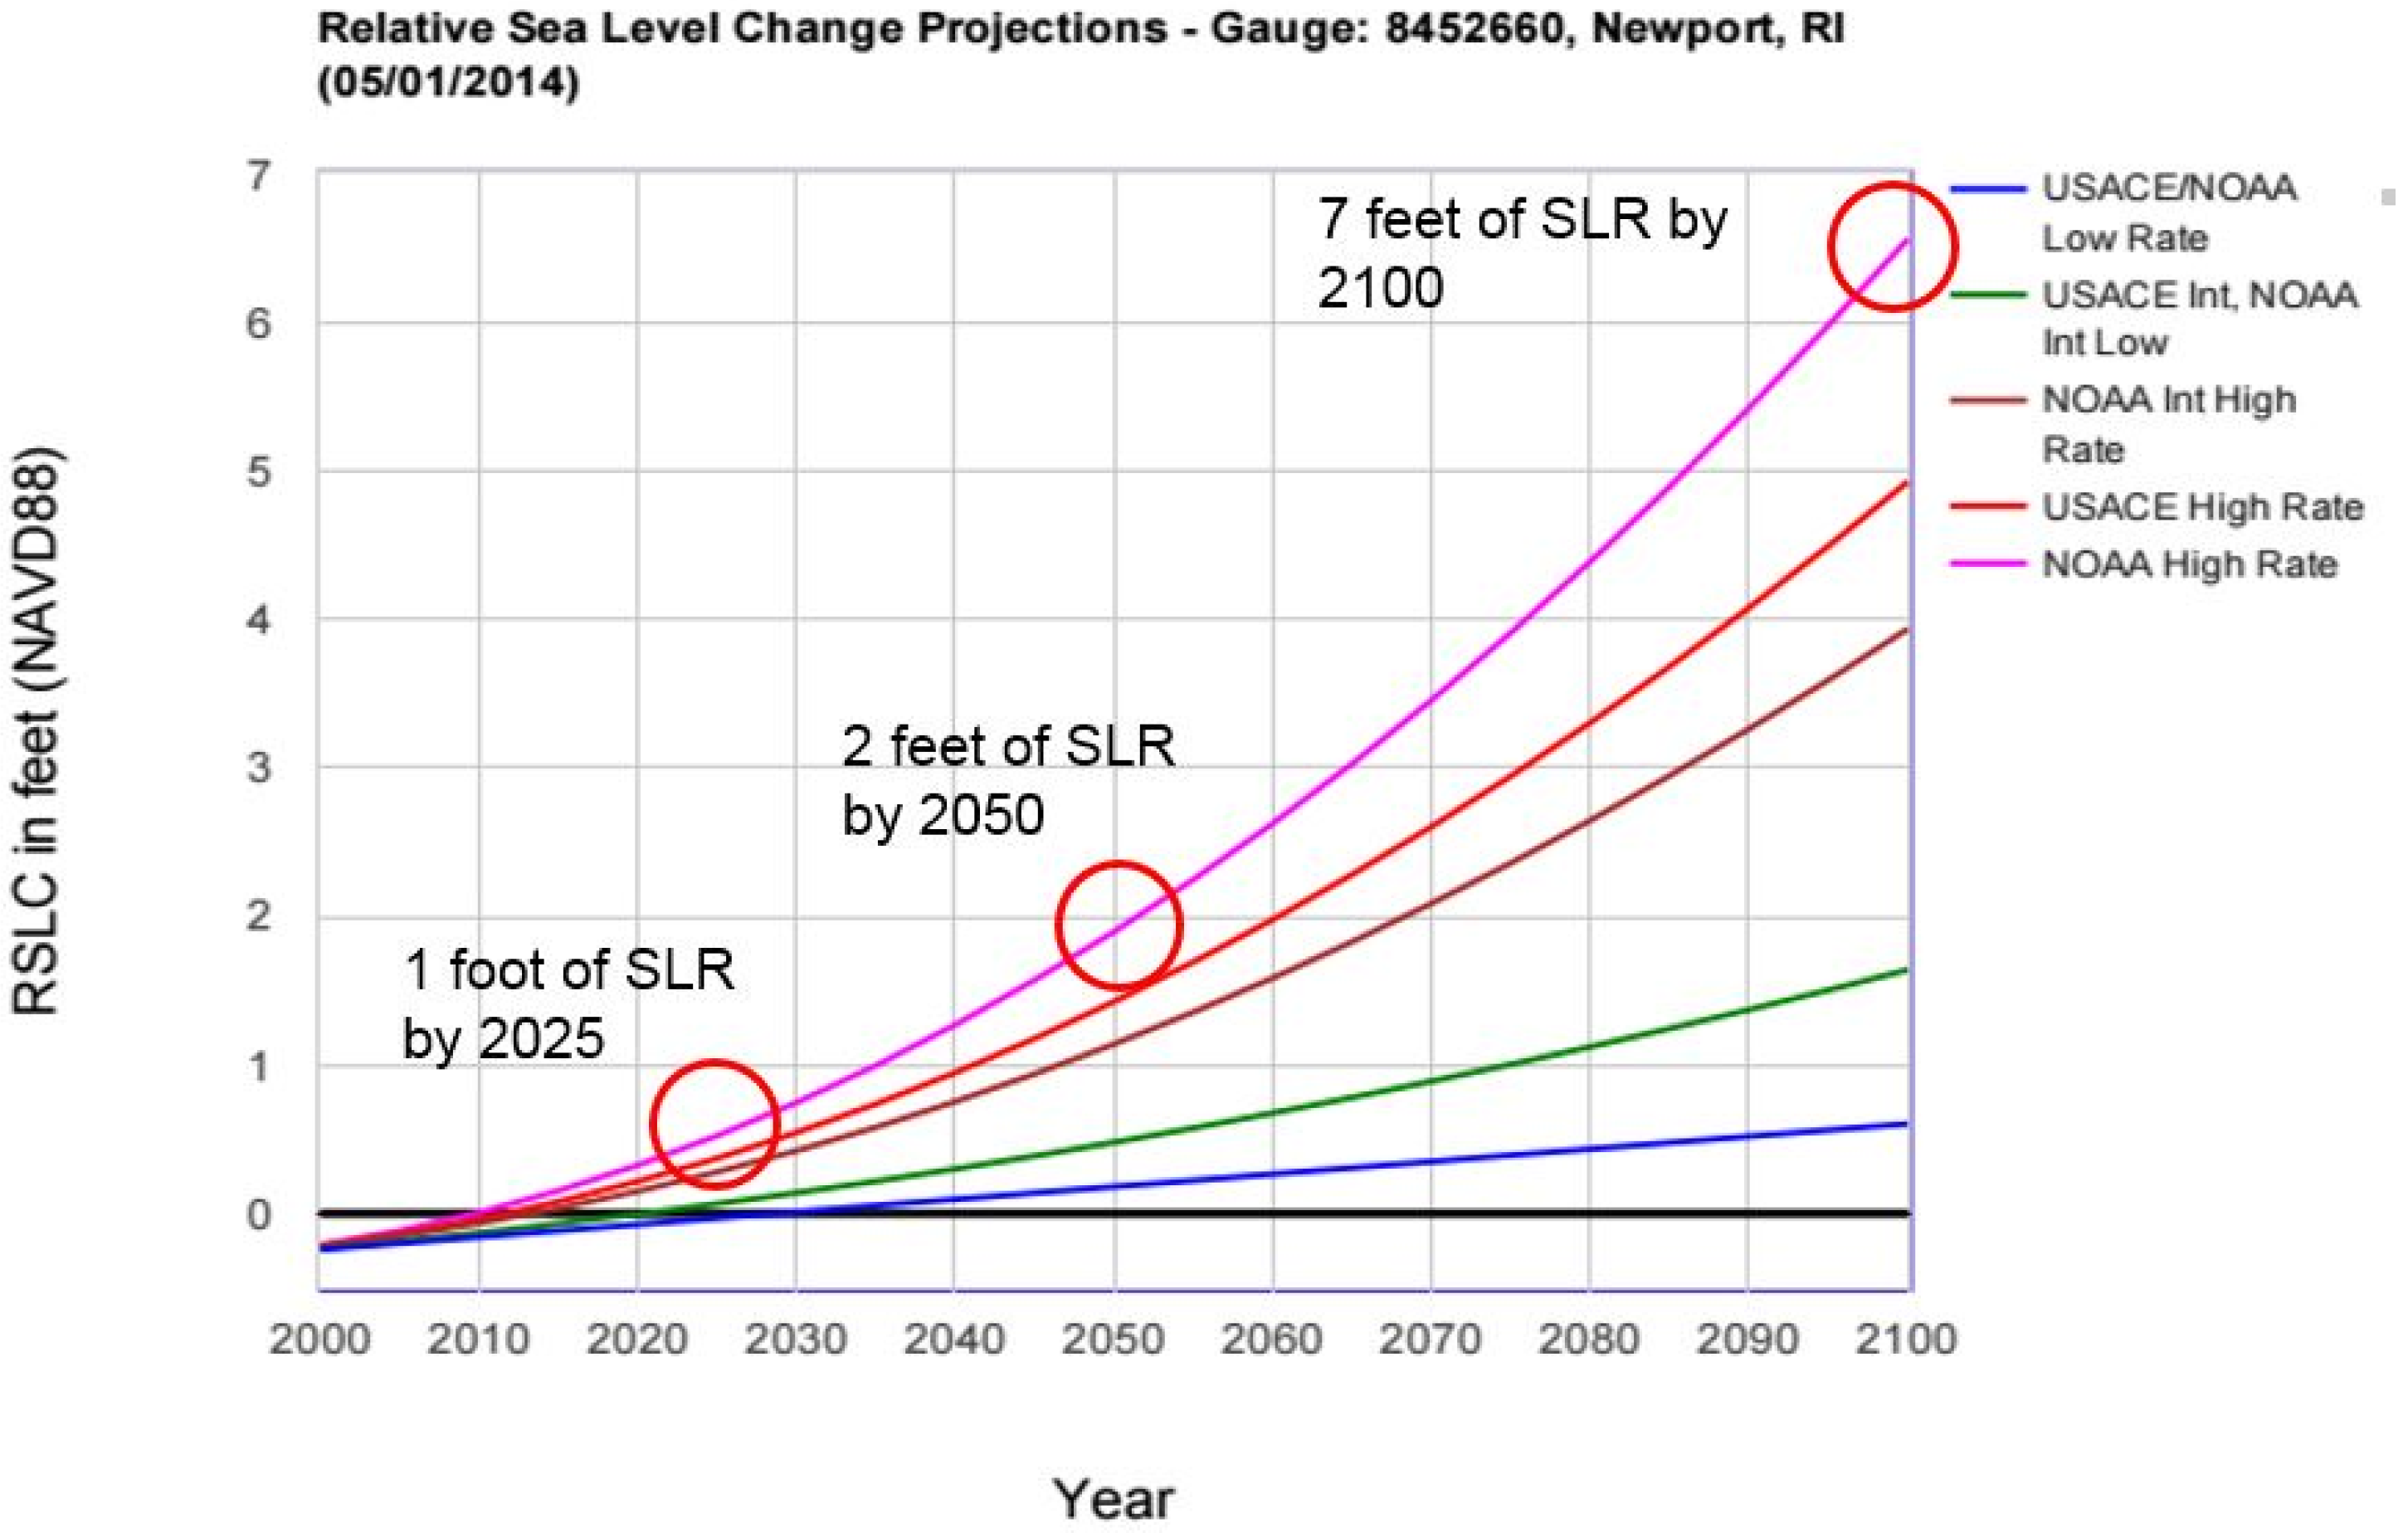
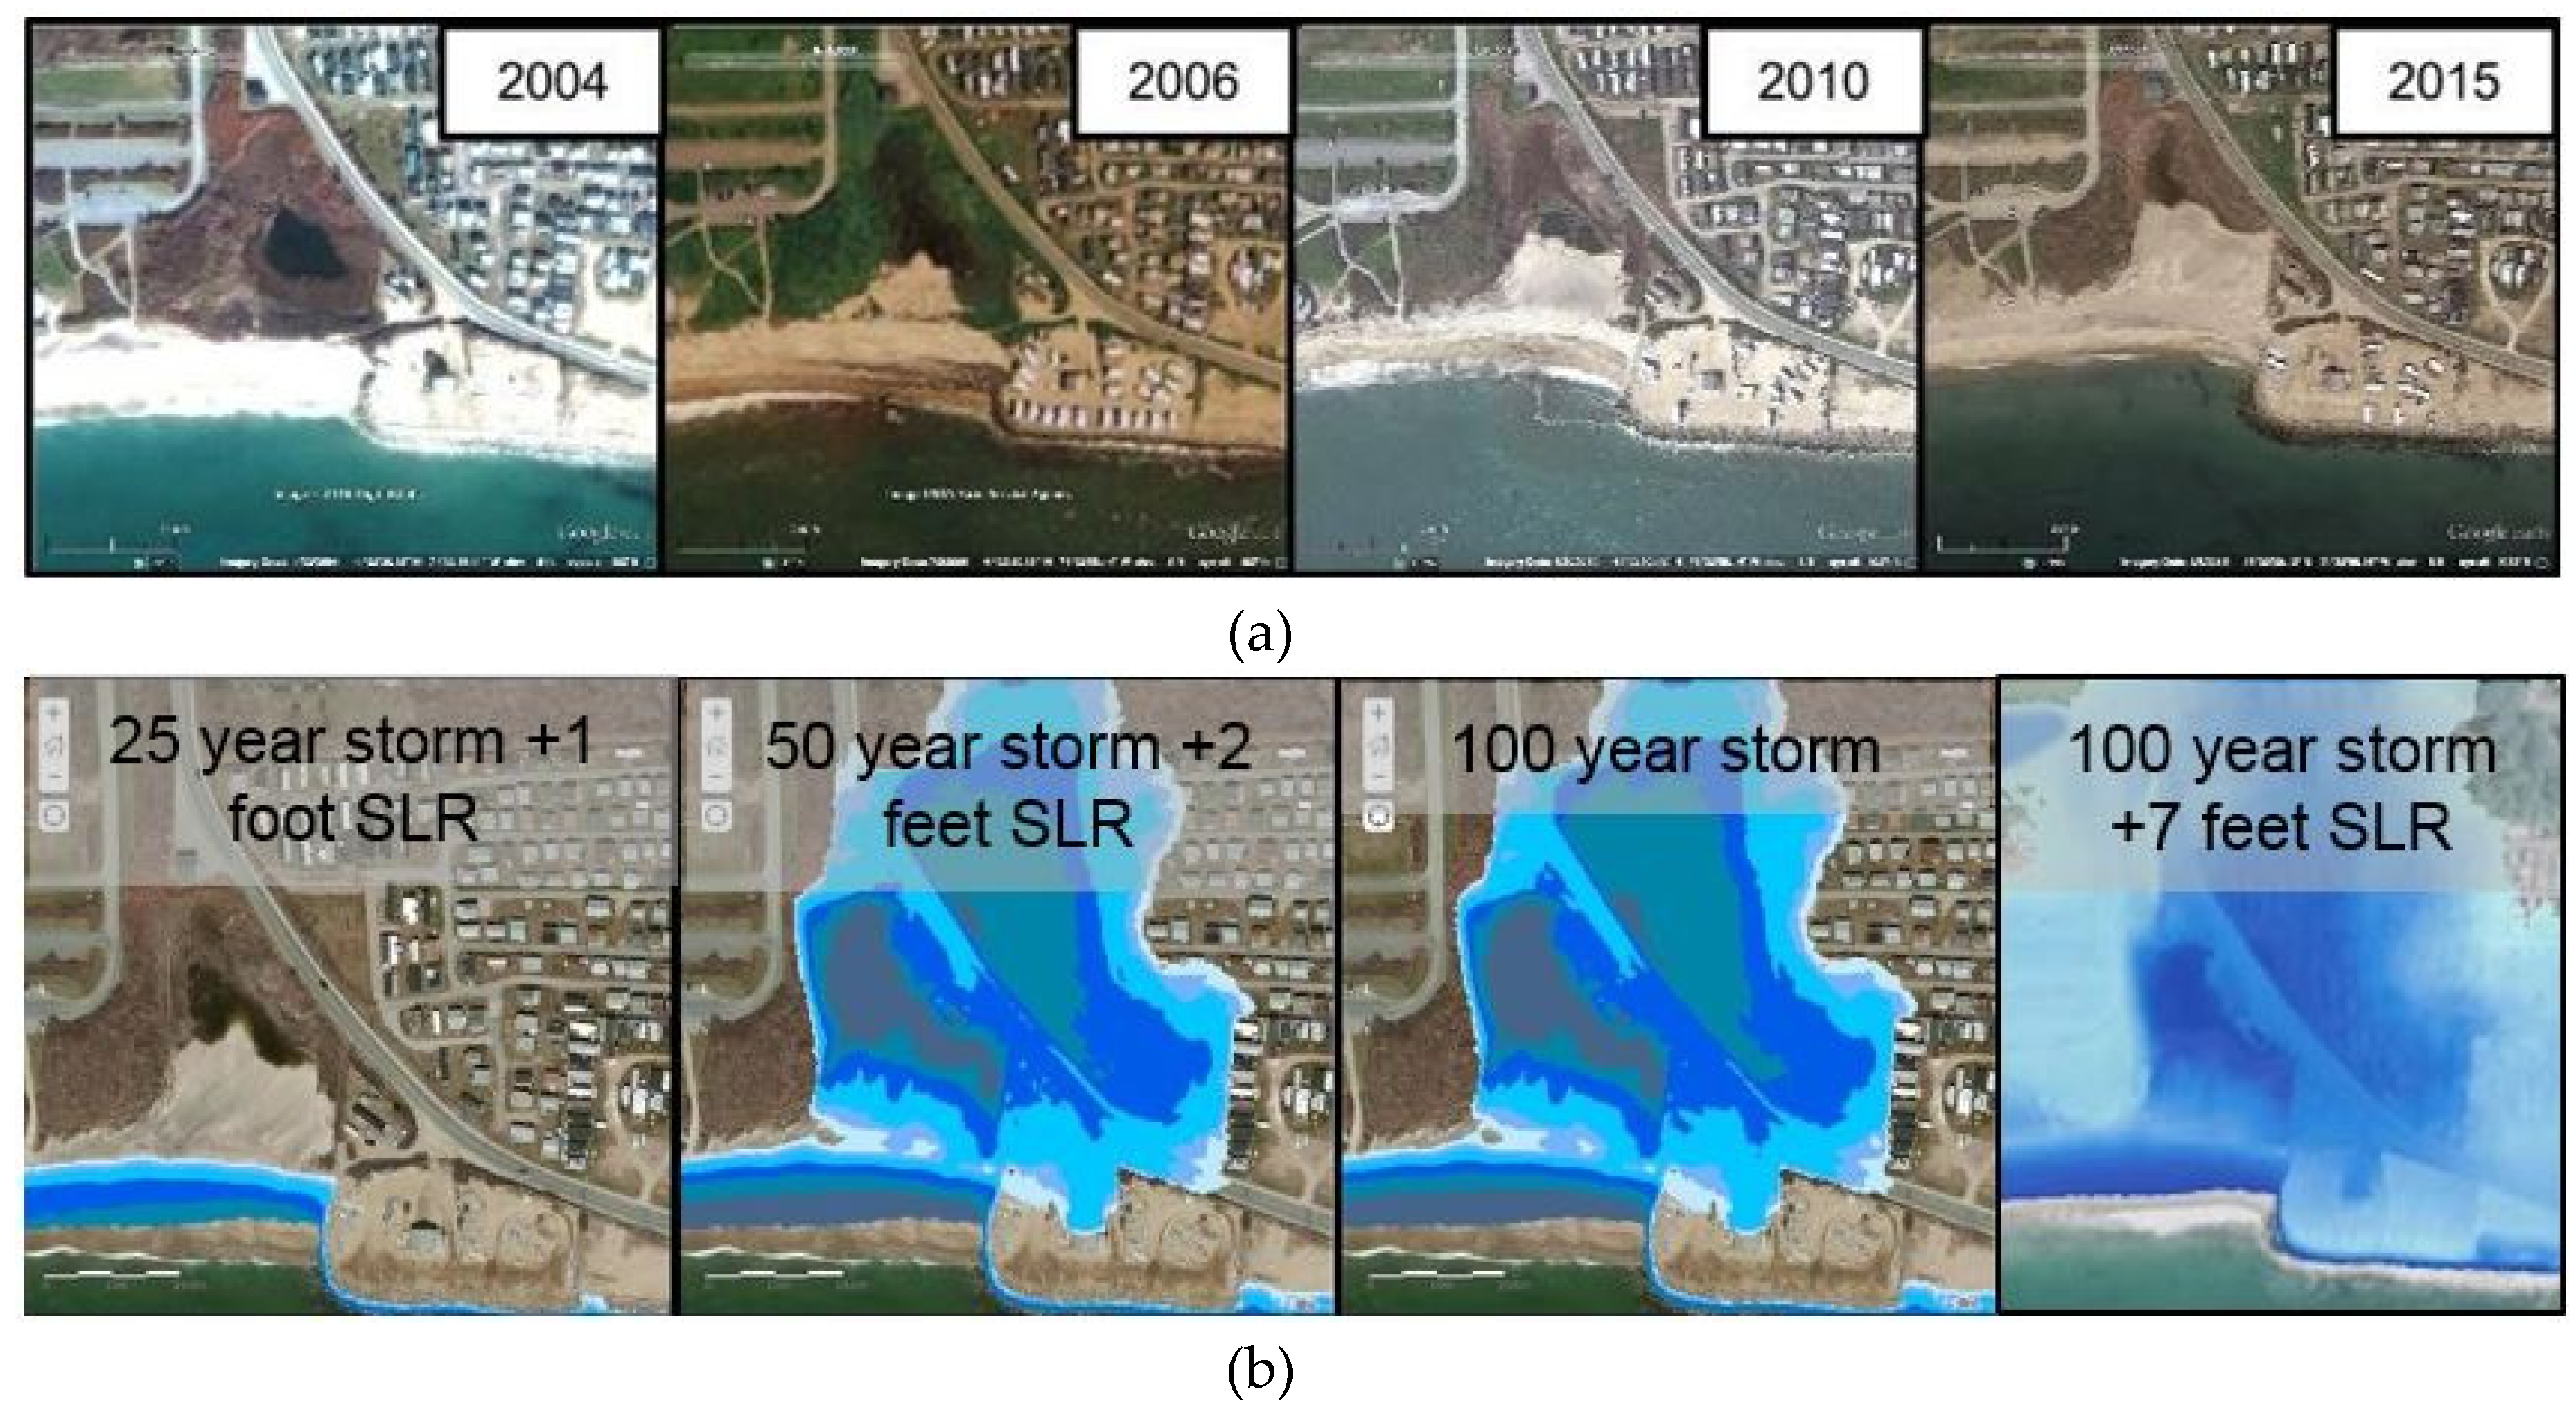
  • Estimate the inundation, wave attack, and erosion damage to the existing structures and infrastructure caused by a 100-year storm event, with and without 7 ft of sea level rise, and estimate the total damage;
  • Identify adaptation strategies to reduce the damage from inundation, wave attack, and erosion; and
  • Determine the impact associated with each adaptation strategy.
This was accomplished using a Geographical Information Systems (GIS) tool called the Coastal Environmental Risk Index (CERI) [4]. CERI is designed as an objective, quantitative tool to assess the risk that structures and infrastructure face from storm surges, including flooding and the associated wave environment, in the presence of sea level rise (SLR), and shoreline erosion/accretion. Additional details on CERI are provided in [4] including information on other assessment and index tools designed for this purpose. CERI can readily be extended to include hydrological flooding (e.g., rivers and streams). This feature was not, however, implemented in the present analysis since there are no substantial hydrological sources of flooding in the study area.

2. Methods

Figure 5 shows a flow chart of the organization of CERI. Inputs into CERI include detailed information about the structures within the study area, topography and bathymetry, and levels of inundation, wave heights, and erosion for different storm events. The level of damage for each structure was estimated using damage functions developed by the U.S. Army Corps of Engineers as part of the North Atlantic Coast Comprehensive Study (NACCS) [5]. The results were presented in terms of probability and cumulative distribution functions and graphically in a GIS. Based on these estimates of damage, different adaptation strategies were evaluated based on the reduction in damage to structures for different storm events with and without sea level rise.
A Digital Elevation Model (DEM) of the study area was obtained from a combination of NOAA bathymetry and a 2011 Light Detection And Ranging (LIDAR) topographic survey [6]. All elevations are referenced to the North American Vertical Datum of 1988 (NAVD 88). The accuracy of the DEM was evaluated using three approaches. In the first approach, values from the DEM at selected locations in Charlestown and South Kingstown, Rhode Island (adjacent to the study area) were compared to publically available Letters of Mapping Amendment (LOMAs), which document the lowest grade elevation at a particular structure. Elevations from fifteen LOMAs were used for the comparison. The second approach involved a comparison of elevations from three LIDAR control points near the study area with the corresponding values from the DEM. The third approach involved a comparison of elevations reported on building plans for several properties in South Kingstown with values from the DEM. Values of root mean square error for these three approaches were 0.78 ft, 0.04 ft, and 0.67 ft, respectively, which were considered to be reasonable.

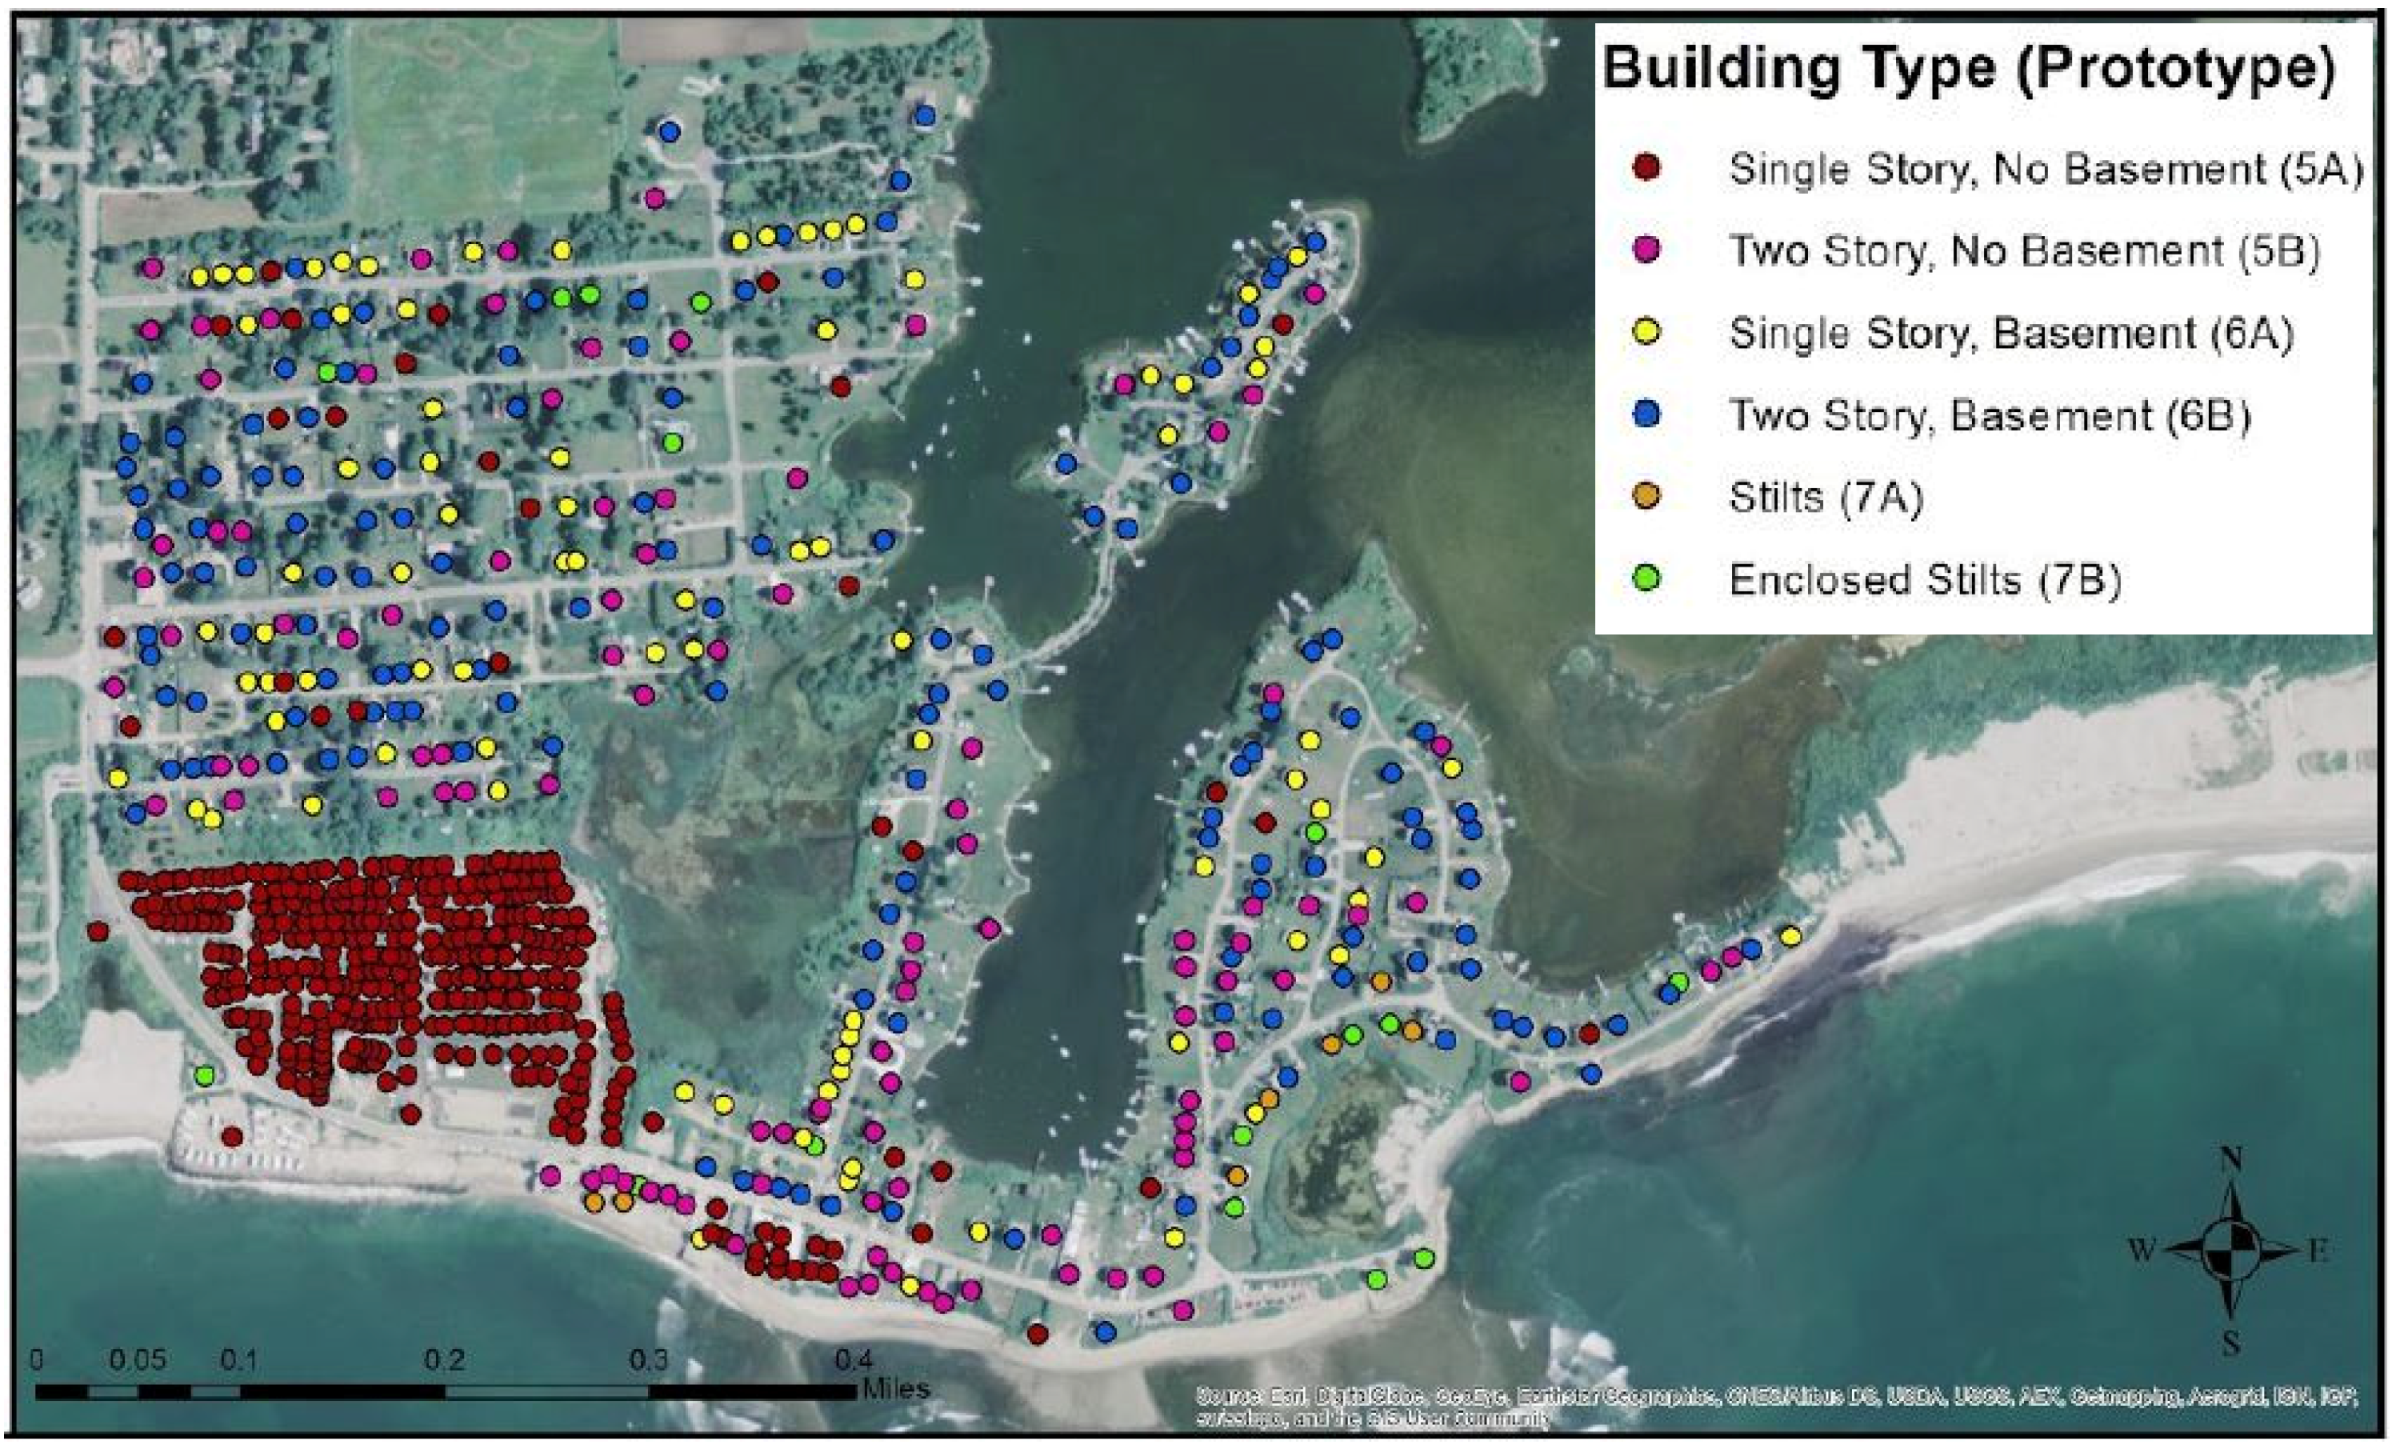
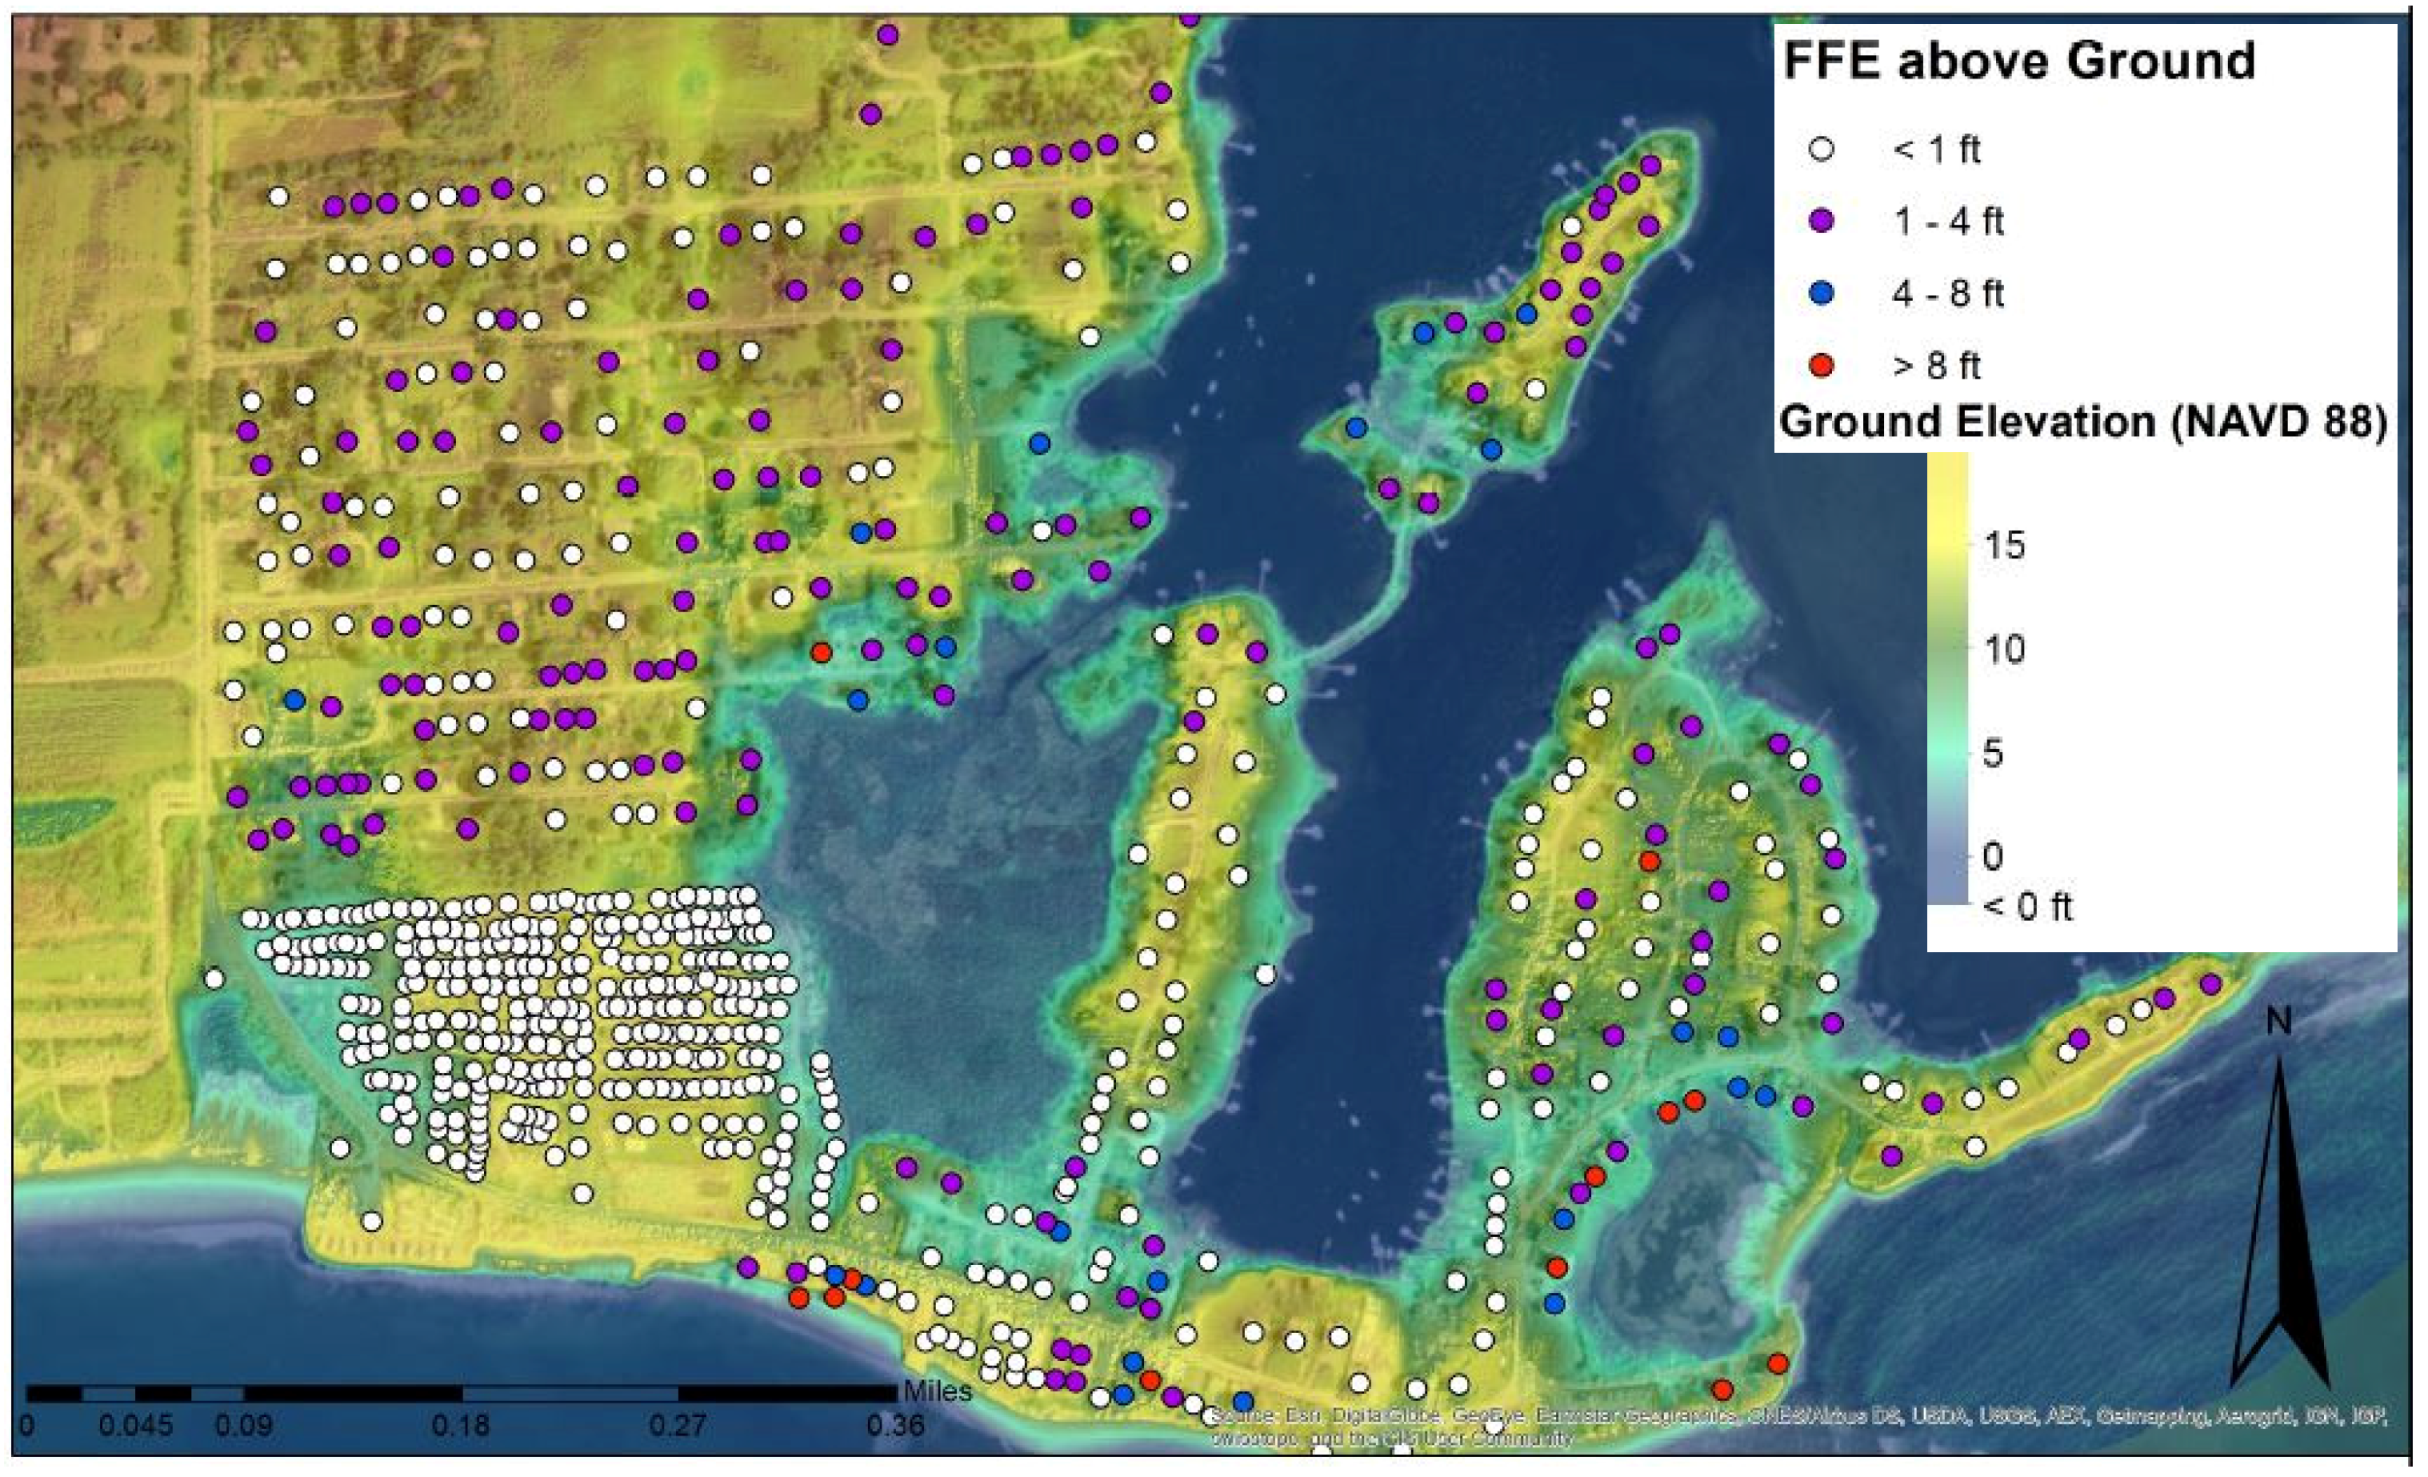
2.1. Classification of Structures

As part of the NACCS, the U.S. Army Corps of Engineers created a classification system of coastal infrastructure to be able to differentiate damage from inundation and wave attack between different structures. Seven structural prototypes were presented: (1) apartments; (2) and (3) commercial; (4) high rise; (5) single and two story residences with no basement; (6) single and two-story residences with basements; and (7) elevated or stilted buildings on pile foundations. In some cases prototypes were further sub-divided; for example, prototype 5A is a single story residence with no basement and 5B is a two story residence with no basement.
The study area consisted of 359 single story residences without basements (5A), 104 two story residences without basements (5B), 83 single story residences with basements (6A), 139 two story residences with basements (6B), 7 open stilted structures, and 16 enclosed stilted structures (7B). There was a total of 708 structures in the study area, and their distribution is shown in Figure 6. The structures in the study area were classified visually during visits to the site.
The NACCS damage functions require information about both the type of structure being impacted and the Furnished Floor Elevation (FFE), as the majority of damage occurs when inundation and waves exceeds the FFE. Values of FFE were obtained during site visits, and Figure 7 shows the values of FFE above grade for each structure. Included in the figure is the topography referenced to NAVD 88. Of particular interest in Figure 7 is the southwest corner of the study area, which shows both the main road (and evacuation route) and a collection of mobile homes at the ground surface (FFE < 1 ft) at very low elevations (< 5 ft above NAVD 88).

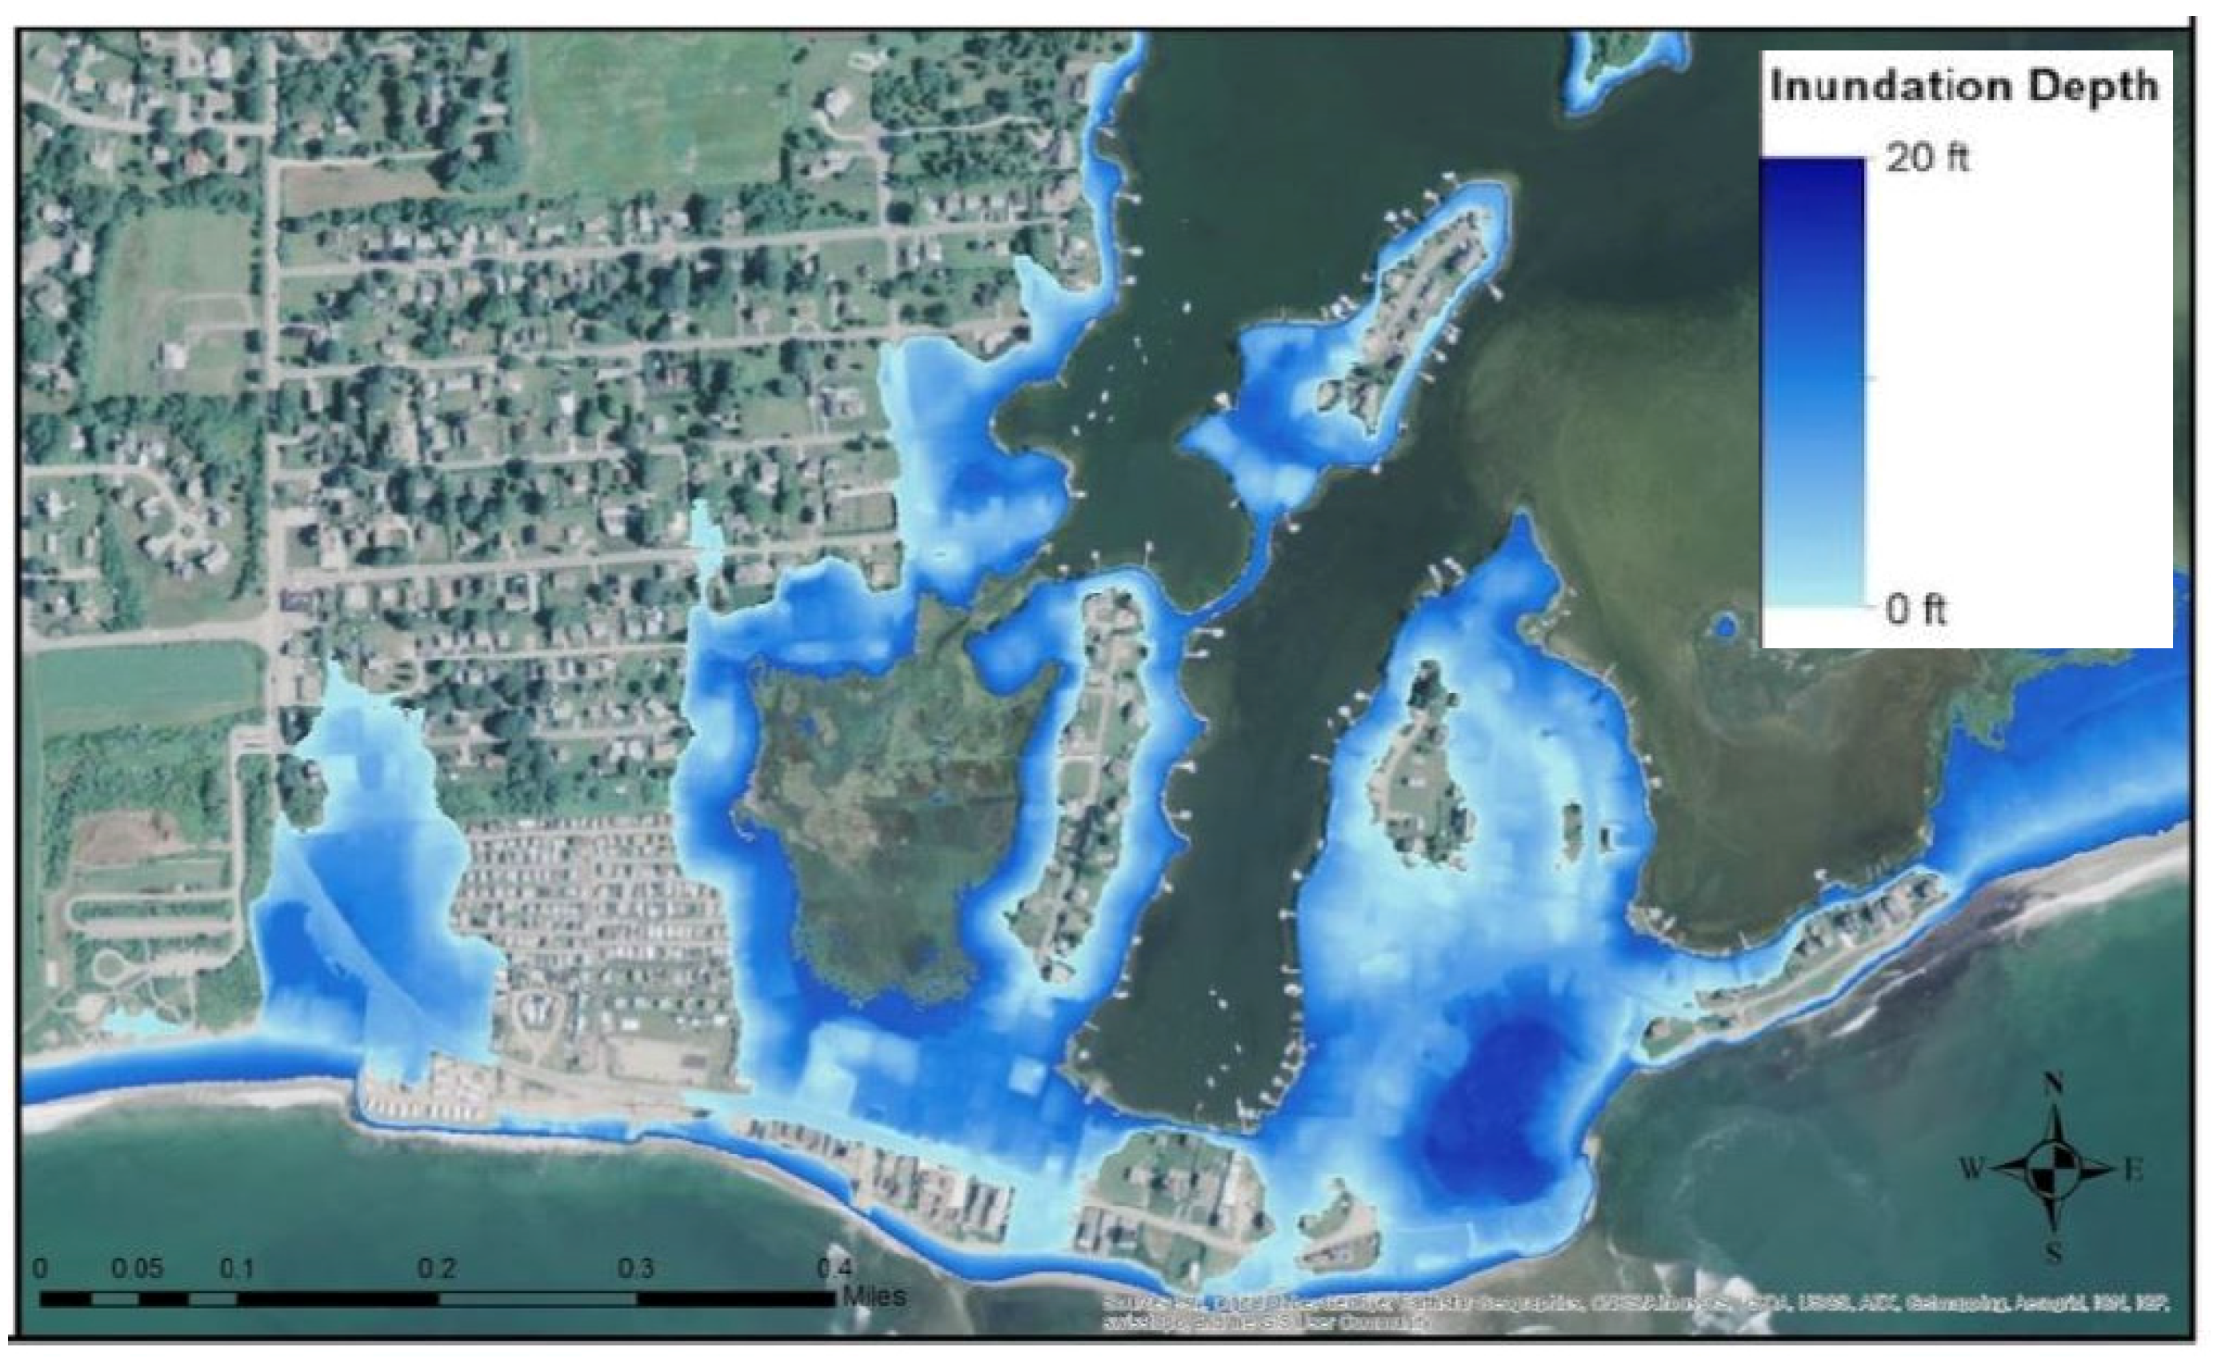
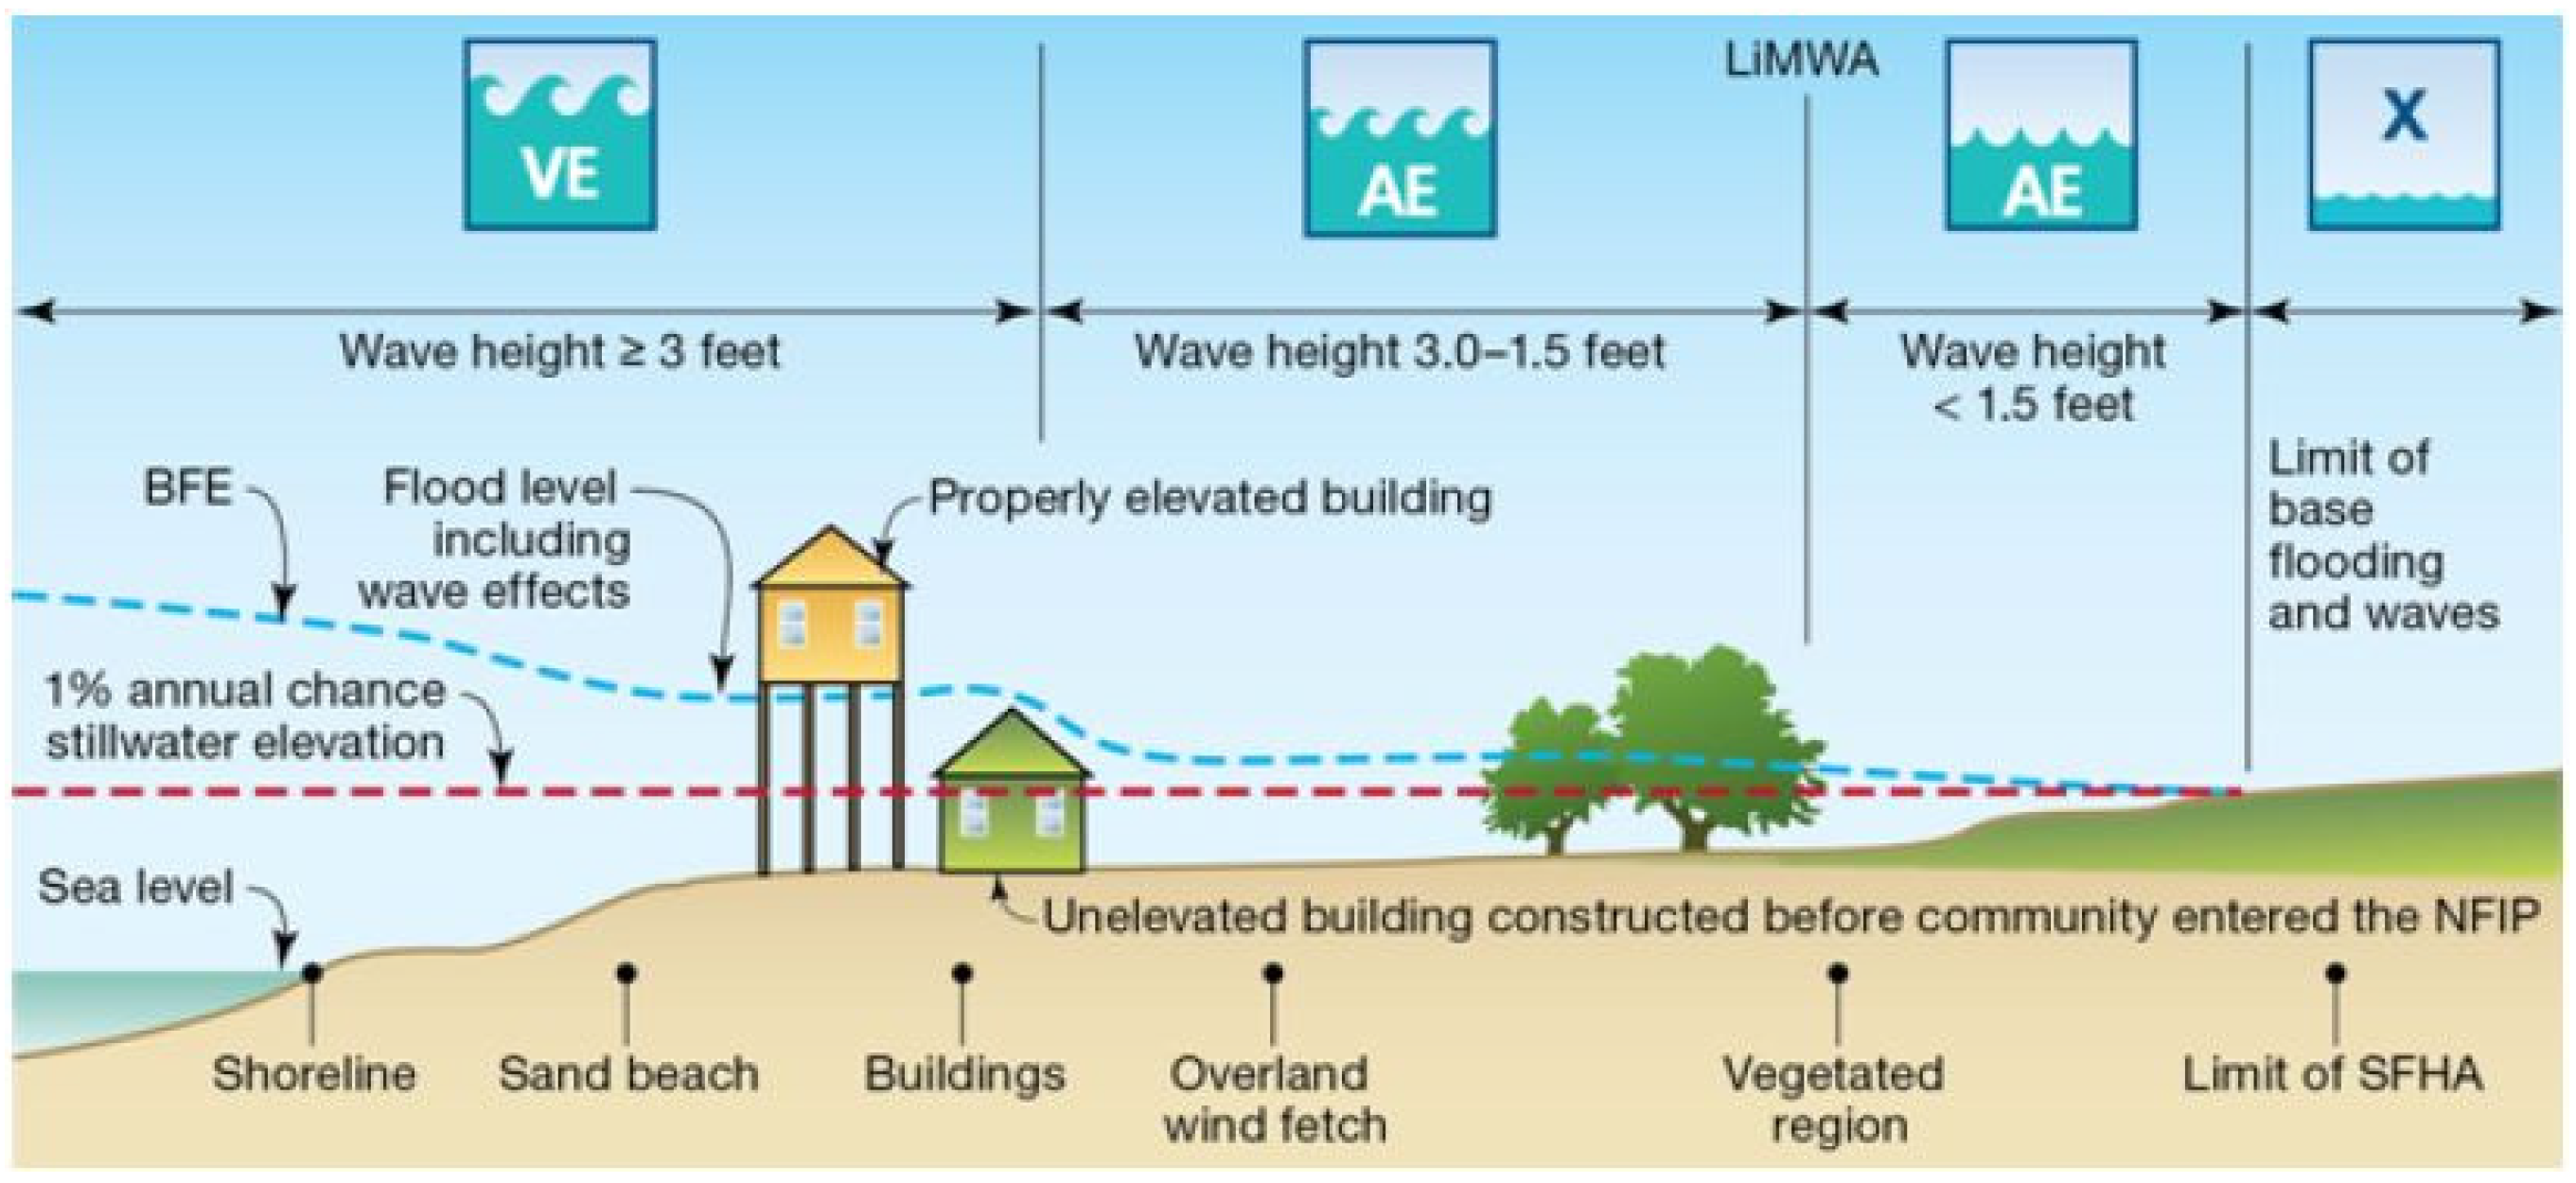
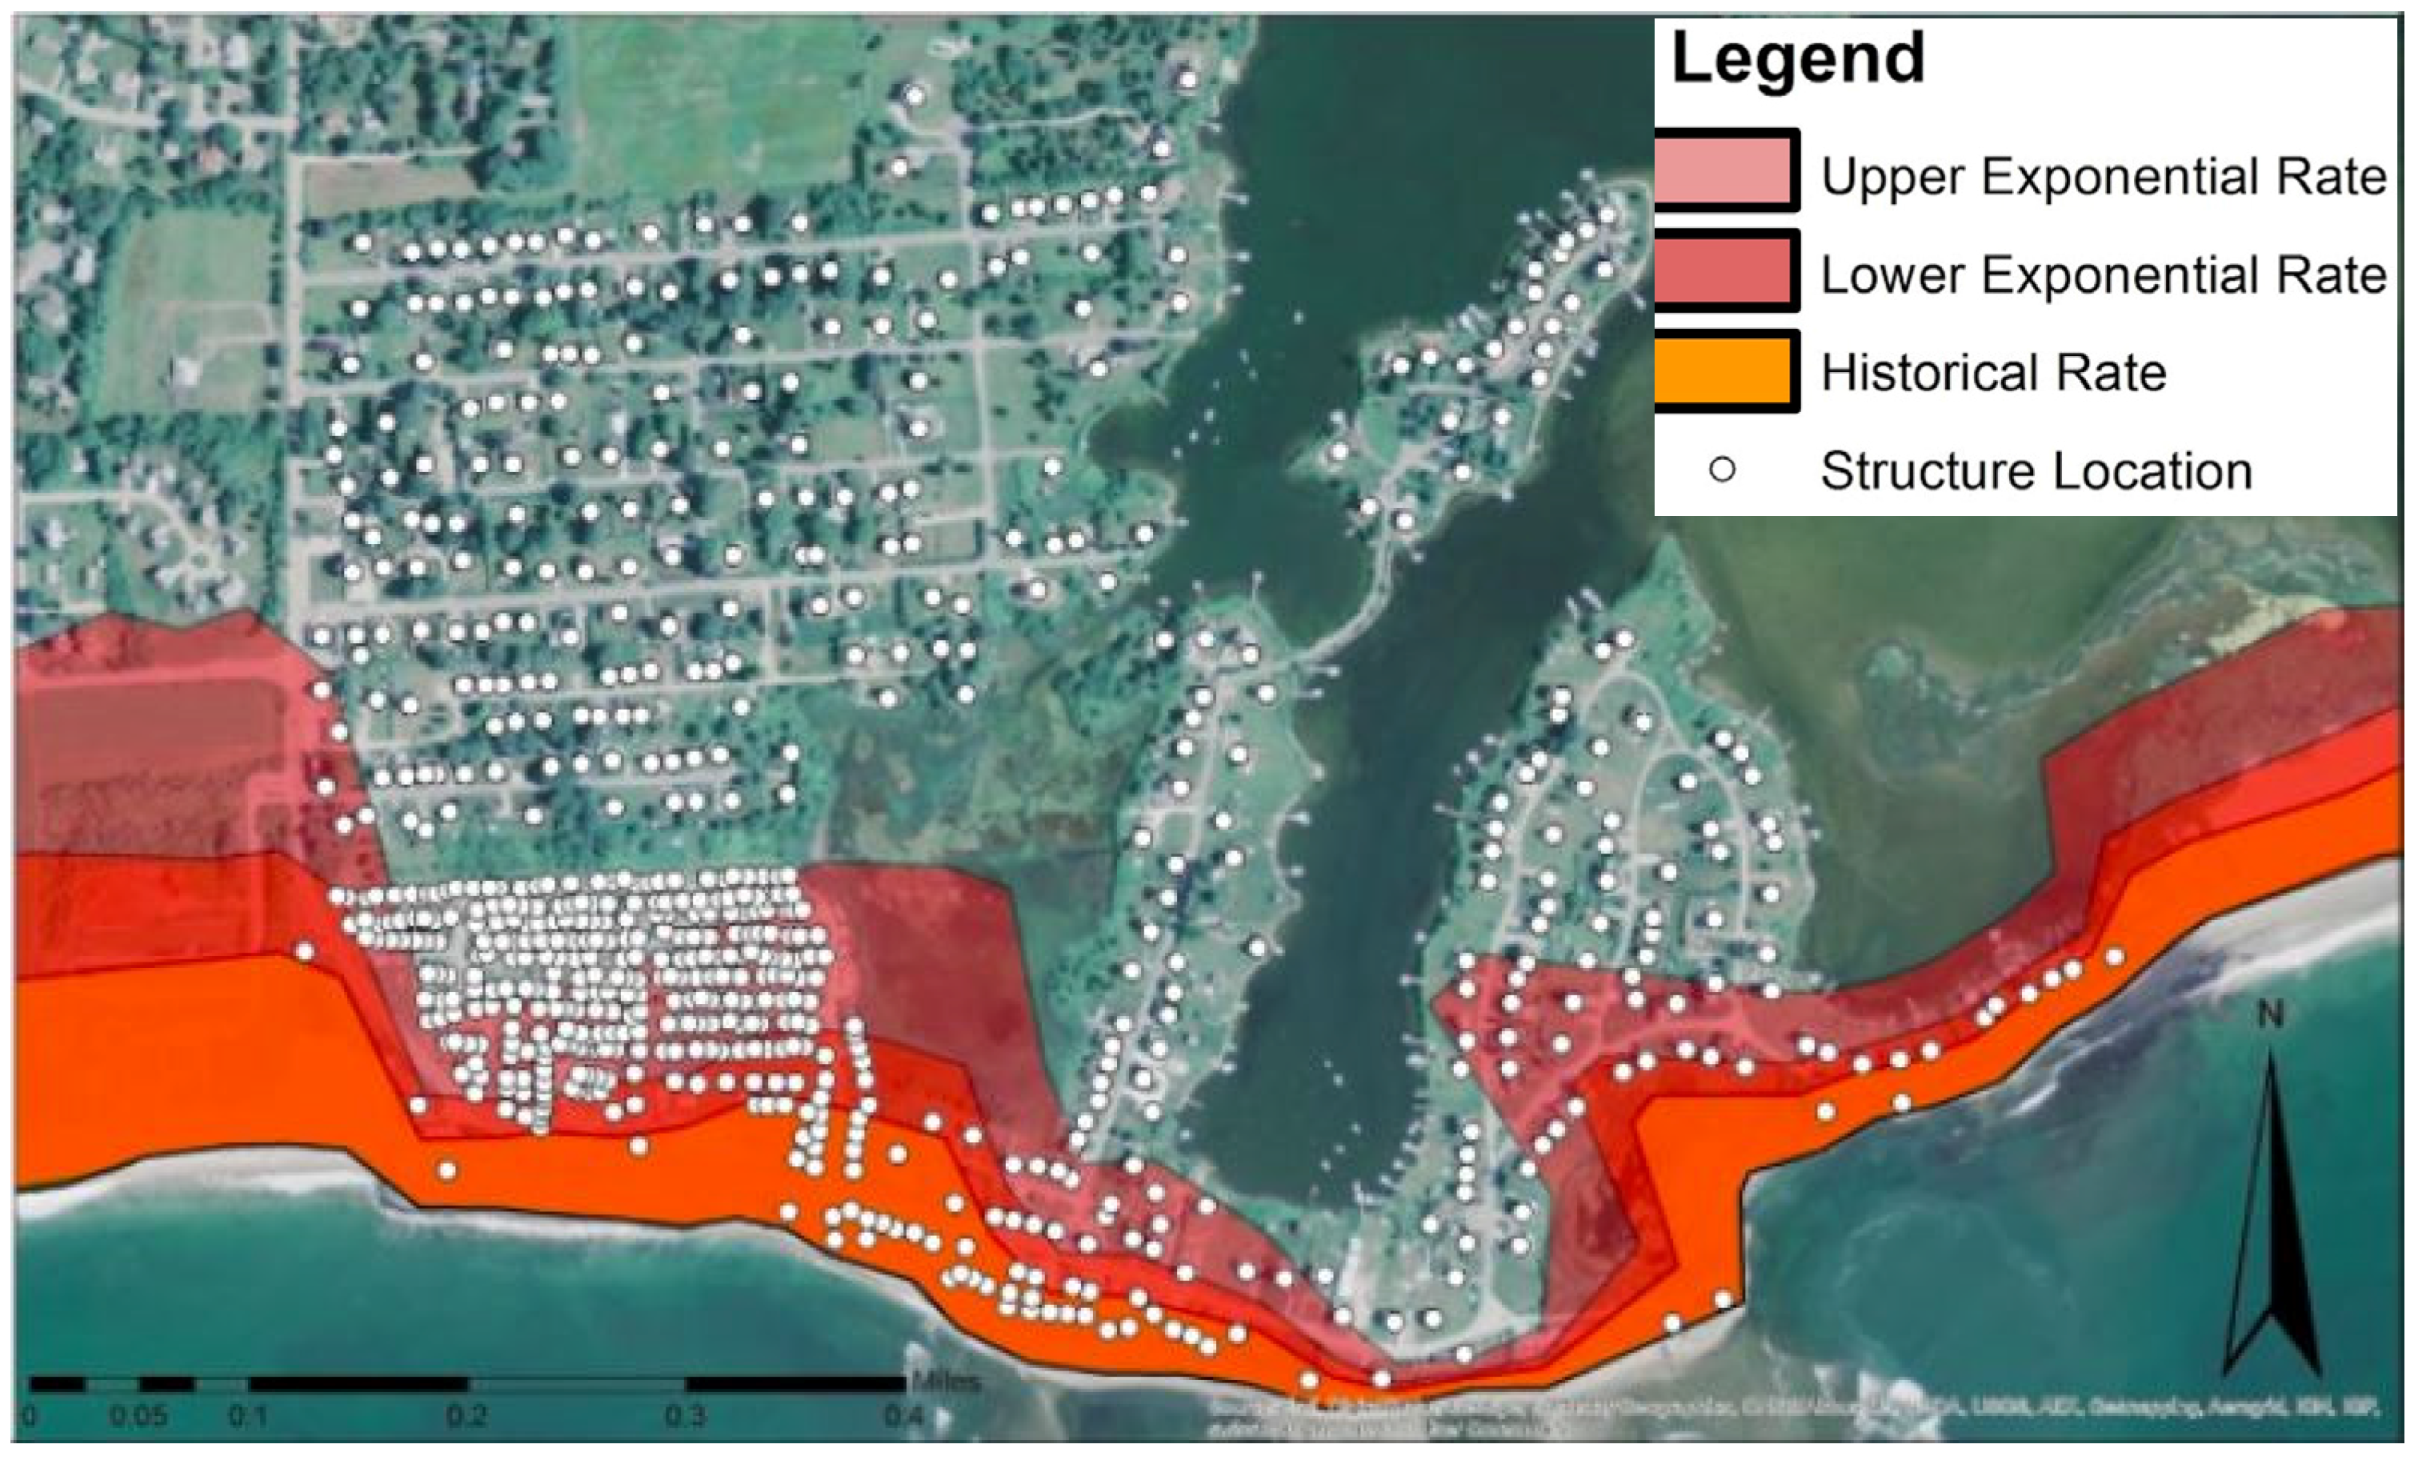
2.2. Inundation, Waves, and Erosion

Figure 8 illustrates how the U.S. Federal Emergency Management Agency (FEMA) defines the coastal zone in terms of flooding from both inundation and wave action. Inundation from storm surge is defined by a still water elevation (SWEL), and the impact of waves is added to the SWEL to define a Base Flood Elevation (BFE).
Levels of inundation were estimated using an on-line tool developed for Rhode Island called STORMTOOLS [4,8]. Water levels for events of various return periods were obtained from NOAA’s gauge station in Newport, RI. The values were scaled based on storm models from the NACCS study [9] to obtain levels of inundation for 25, 50, and 100 year storm events that included 1, 3 and 7 feet of sea level rise, respectively. The NACCS water levels were derived from their surge plus tide (96 random tides) simulation case at the upper 95% confidence limit. This confidence interval was selected to account for uncertainties in the analysis. The results also included wave induced set up since the simulations were based on a fully coupled surge-wave model system. Values of inundation within the study area were provided on a 1 m grid, and Figure 9 shows the estimated inundation of the study area from a 100-year storm event [10].
Significant offshore wave heights (Hmo) were obtained using two approaches from the US Army Corps of Engineers (USACE): the Coastal Storm Modeling System (CSTORM-MS) and the Wave Information Studies (WIS) dataset. CSTORM-MS is a suite of modeling tools that includes a deep water wave model (WAM), a nearshore wave model (STWAVE), and an advanced circulation model (ADCIRC). As part of the NACCS, 1030 separate synthetic tropical storms were modeled. Using these synthetic storms along with extratropical storms modeled from 100 historical storms, wave heights and wind and water levels were estimated for the northeast U.S. The second approach involved the Wave Information Studies (WIS), which provide modeled wave estimates from hindcast data (1980 to 2010) at discrete locations offshore.
Different probability distributions from both data sets were used to identify the significant wave height with a probability of exceedance of 1%. Values ranged from 30 to 33 ft (9 to 10 m) and 30 ft (9 m) was used as the input to nearshore wave modeling. Nearshore wave heights were modeled using the 2-D wave modeling program STeady State Spectral WAVE (STWAVE). Inputs included the DEM, bottom friction, and offshore significant wave height. STWAVE includes refraction, shoaling, and both depth-induced and steepness-induced breaking. Importantly, wave run-up is not included since it is not allowed in the USACE damage assessment methodology.
The NACCS uses controlling wave crest heights above FFE to determine wave damage at each structure. Values of significant wave height from STWAVE were multiplied by 1.12 to convert them to a controlling wave crest height.
Erosion within the study area was estimated using shoreline change maps as shown in Figure 2. Based on the historical position of the shoreline from 1938 to 2014 [1], future erosion rates were projected using the historical rates and also two exponentially increasing erosion rates (an upper and lower estimate) that account qualitatively for the effects of increasing sea level rise. Figure 10 shows estimates of the shoreline position within the study area in 100 years. The projected shoreline erosion would clearly impact a number of structures, ranging from 59 for the historical rates up to 349 using the more conservative exponentially increasing rate.

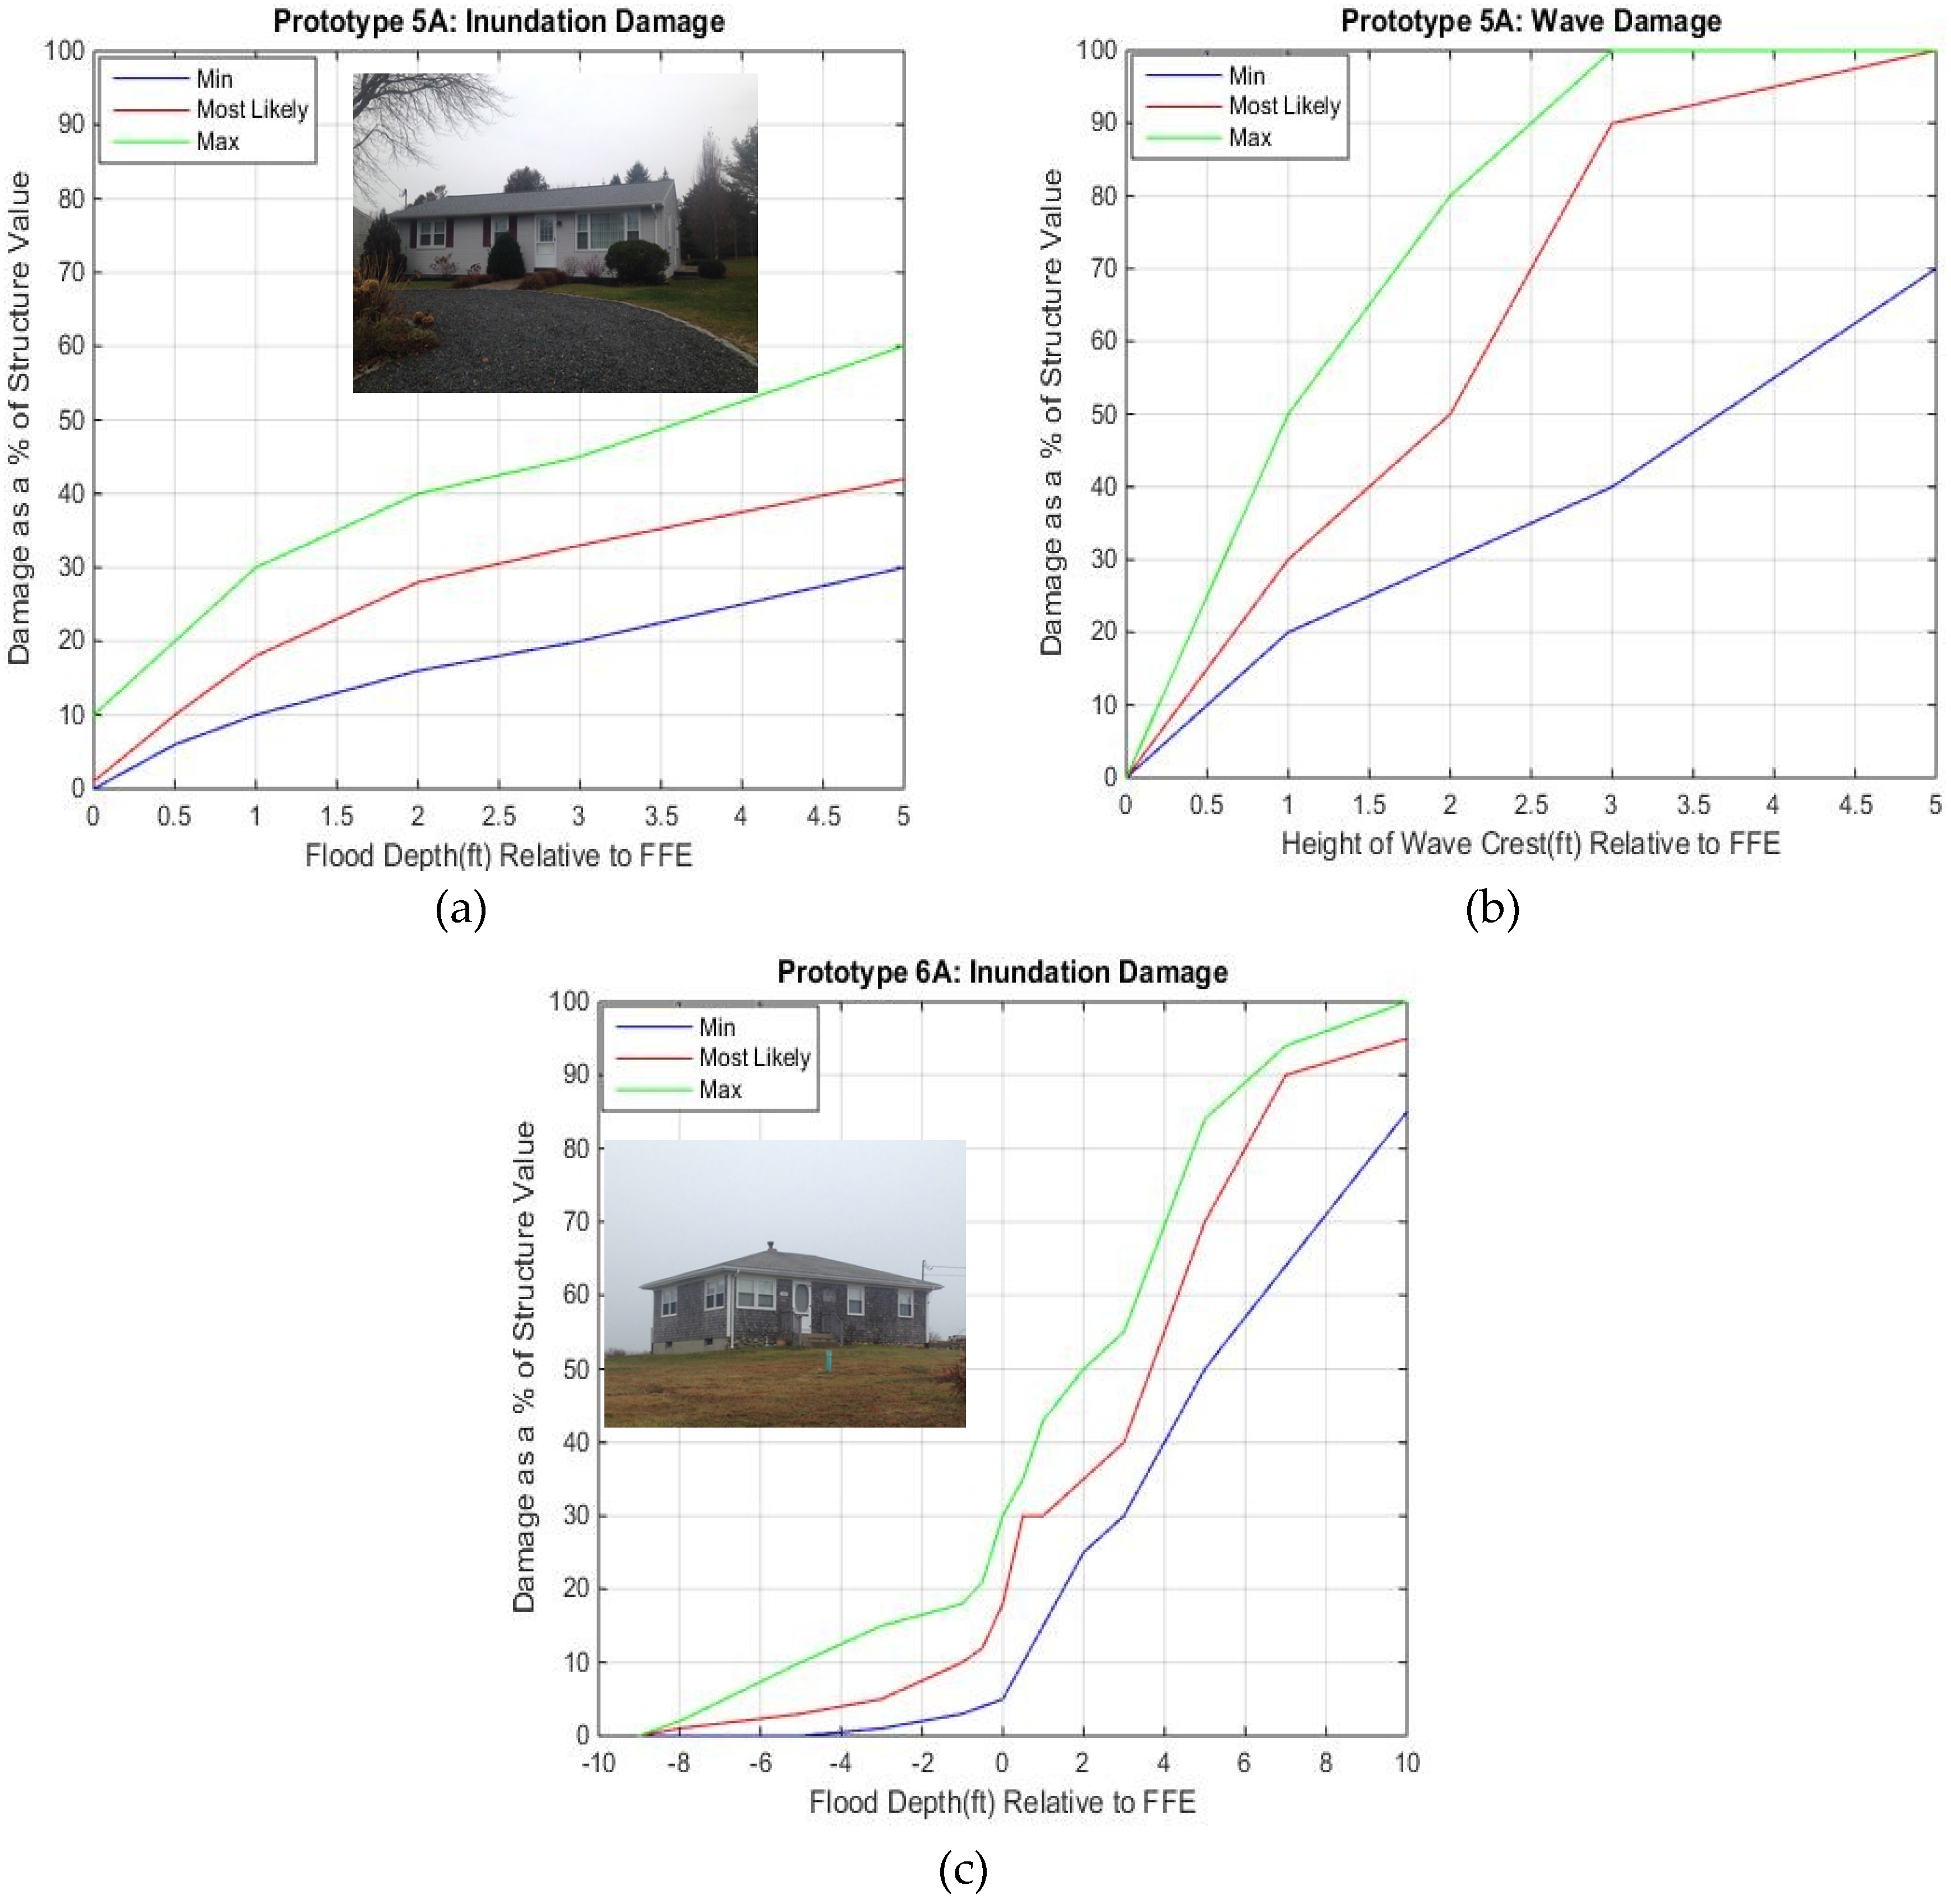
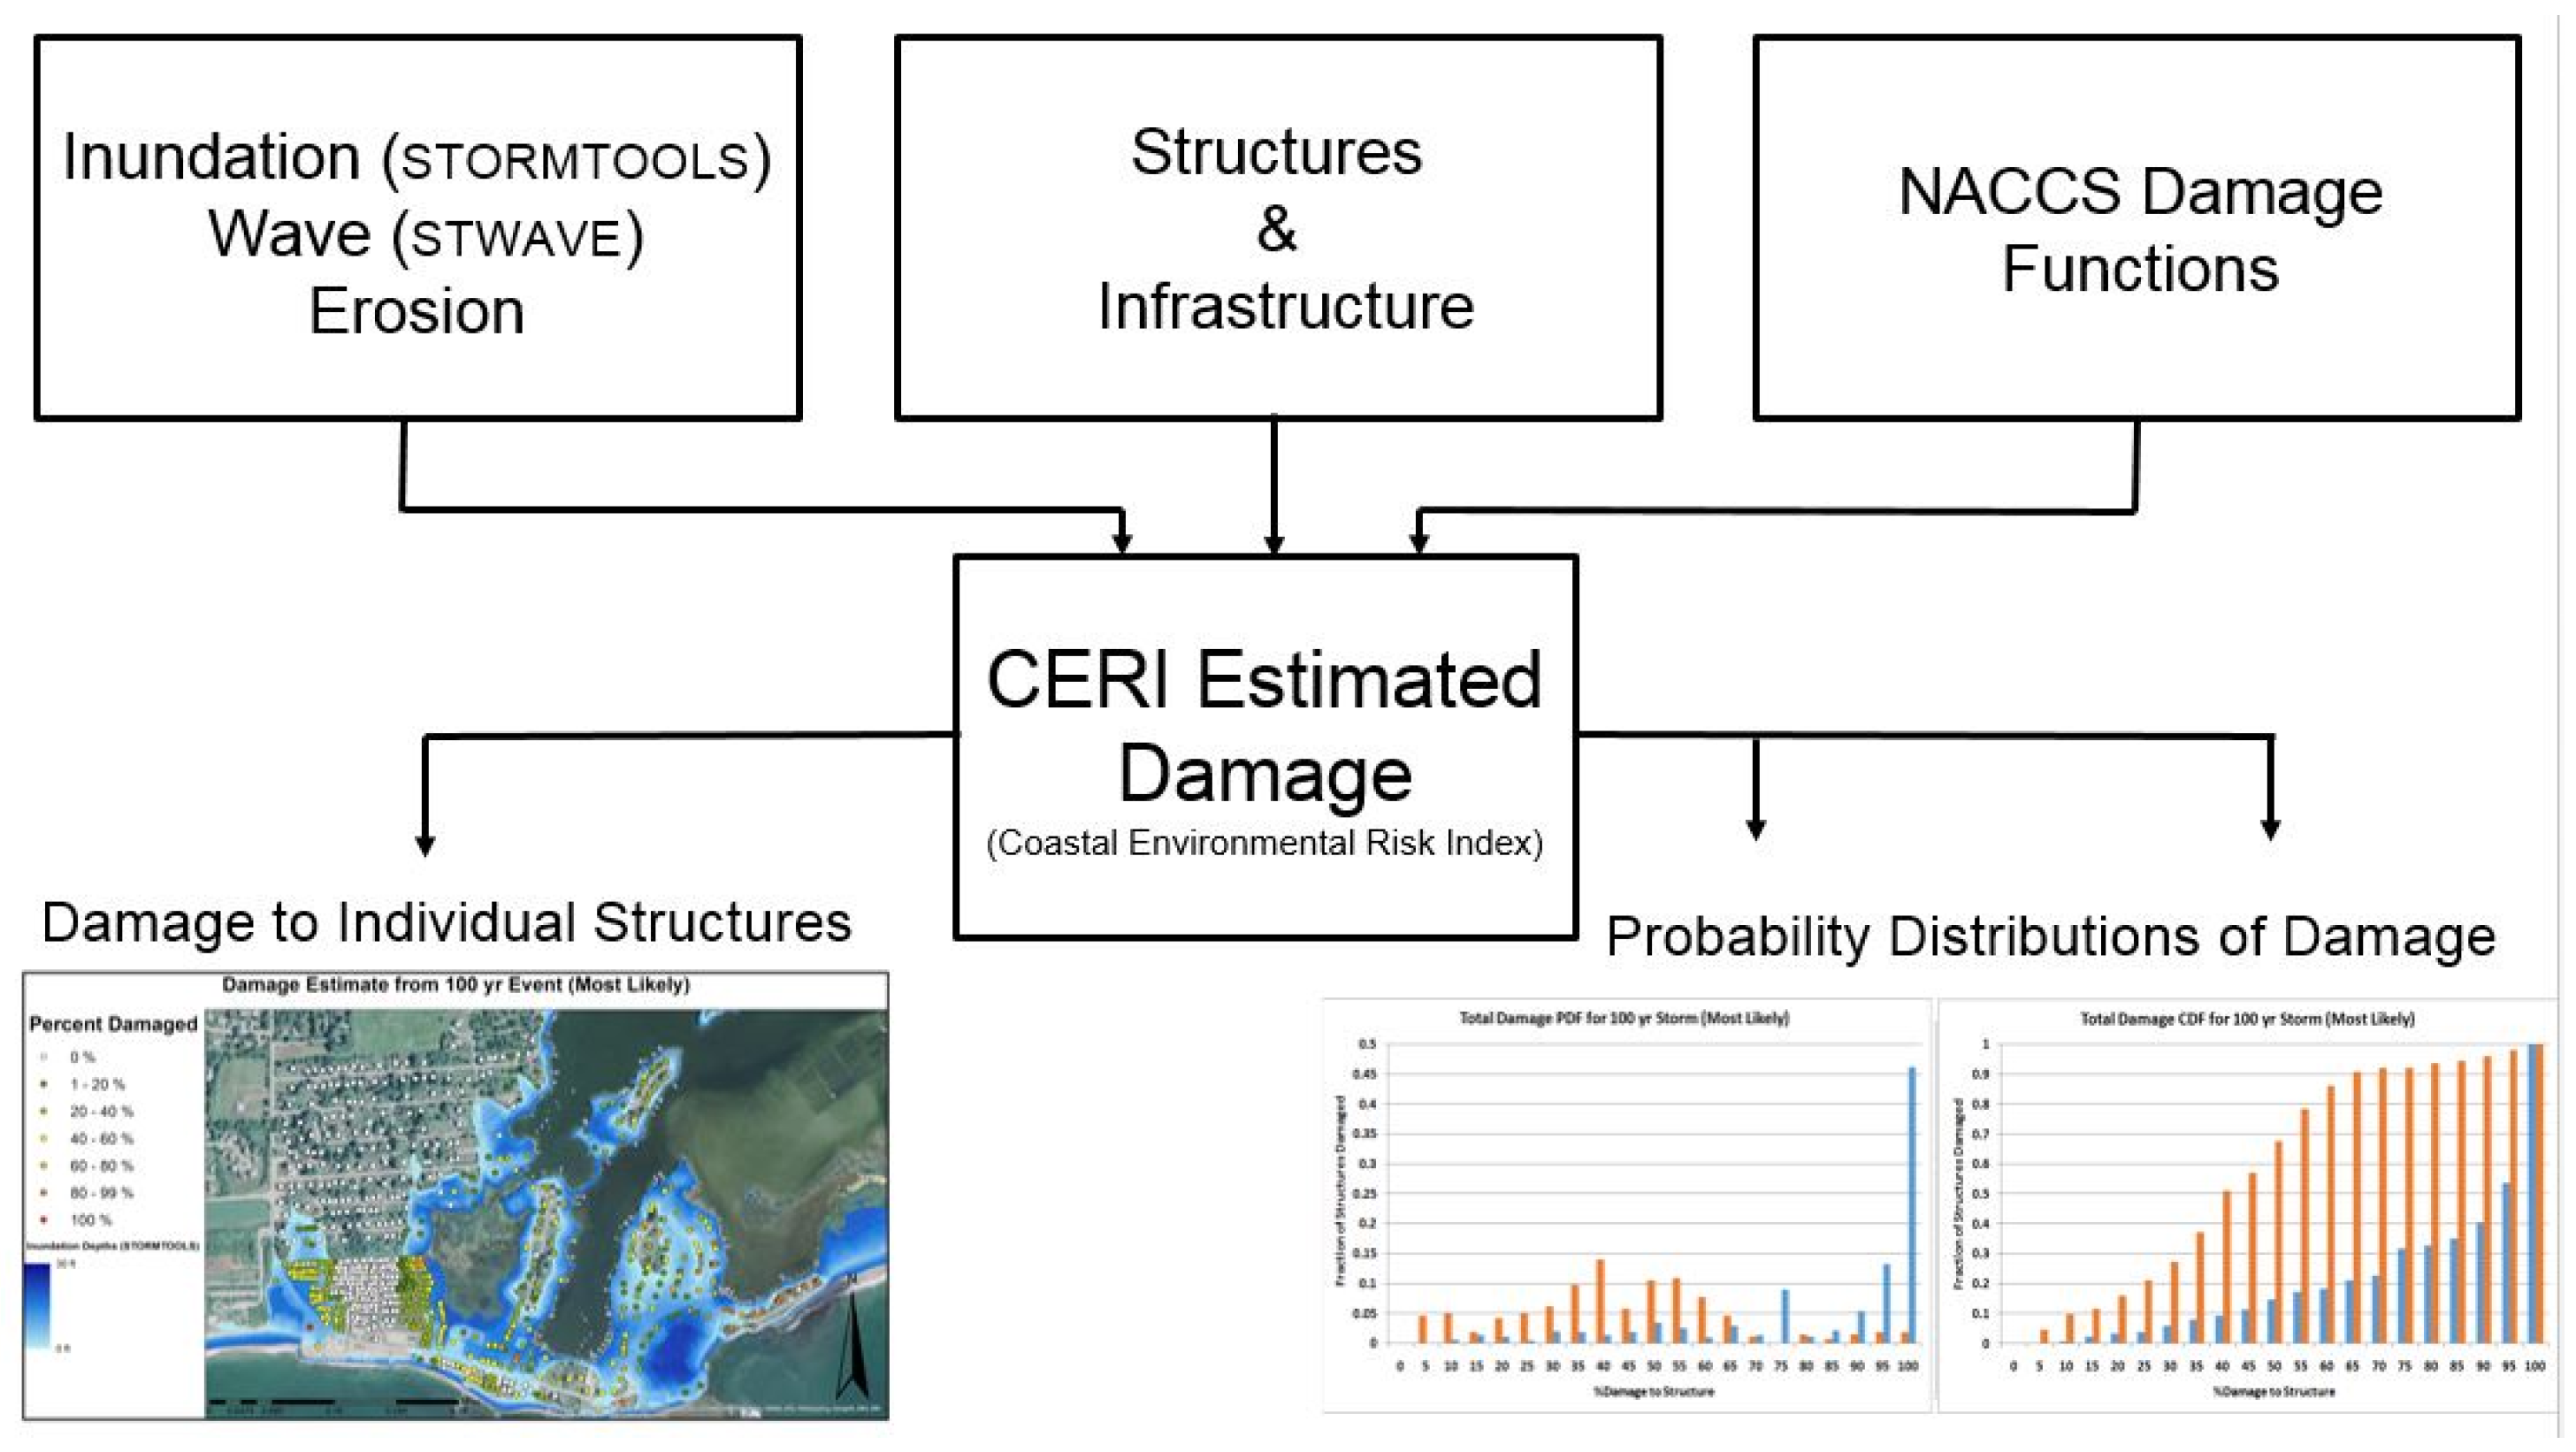
2.3. NACCS Damage Functions

The NACCS was conducted in the wake of Superstorm Sandy by the US Army Corps of Engineers (USACE) North Atlantic Division. The overall goal of the study was to develop a framework for managing risk in coastal communities. A tiered approach was proposed including characterizing environmental conditions, analyzing risk and vulnerability, and identifying and comparing possible solutions [10]. A key part of the study was the Physical Depth Damage Function Report [5], in which relationships between amounts of damage from inundation, wave action, and erosion for different coastal structures were proposed. Water level measurements at specific locations were measured following Superstorm Sandy and compared to the amount of damage caused to structures at those locations. A panel of coastal experts was convened to review the available data and damage functions were developed to estimate the minimum, most likely, and maximum damage to a structure based on the structure type and water level (from inundation and waves) at the structure. It was recommended [5] to evaluate each damage function separately and use the function that yields the largest estimate of damage as the measure of total damage from the storm.
Figure 11 shows examples of damage functions from the NACCS. Figure 11a,b show the relationship between the percent damage and elevation from inundation and wave attack for a single story residence with no basement (prototype 5A). The flood depth relative to FFE is used in the inundation damage function and the controlling wave crest height relative to FFE is used for the wave damage function. Figure 11c shows the inundation damage function for a single story structure with a basement (prototype 6A). This function reflects the damage that can occur from inundation of basements even if the flood depth is below the FFE.

3. Results and Discussion

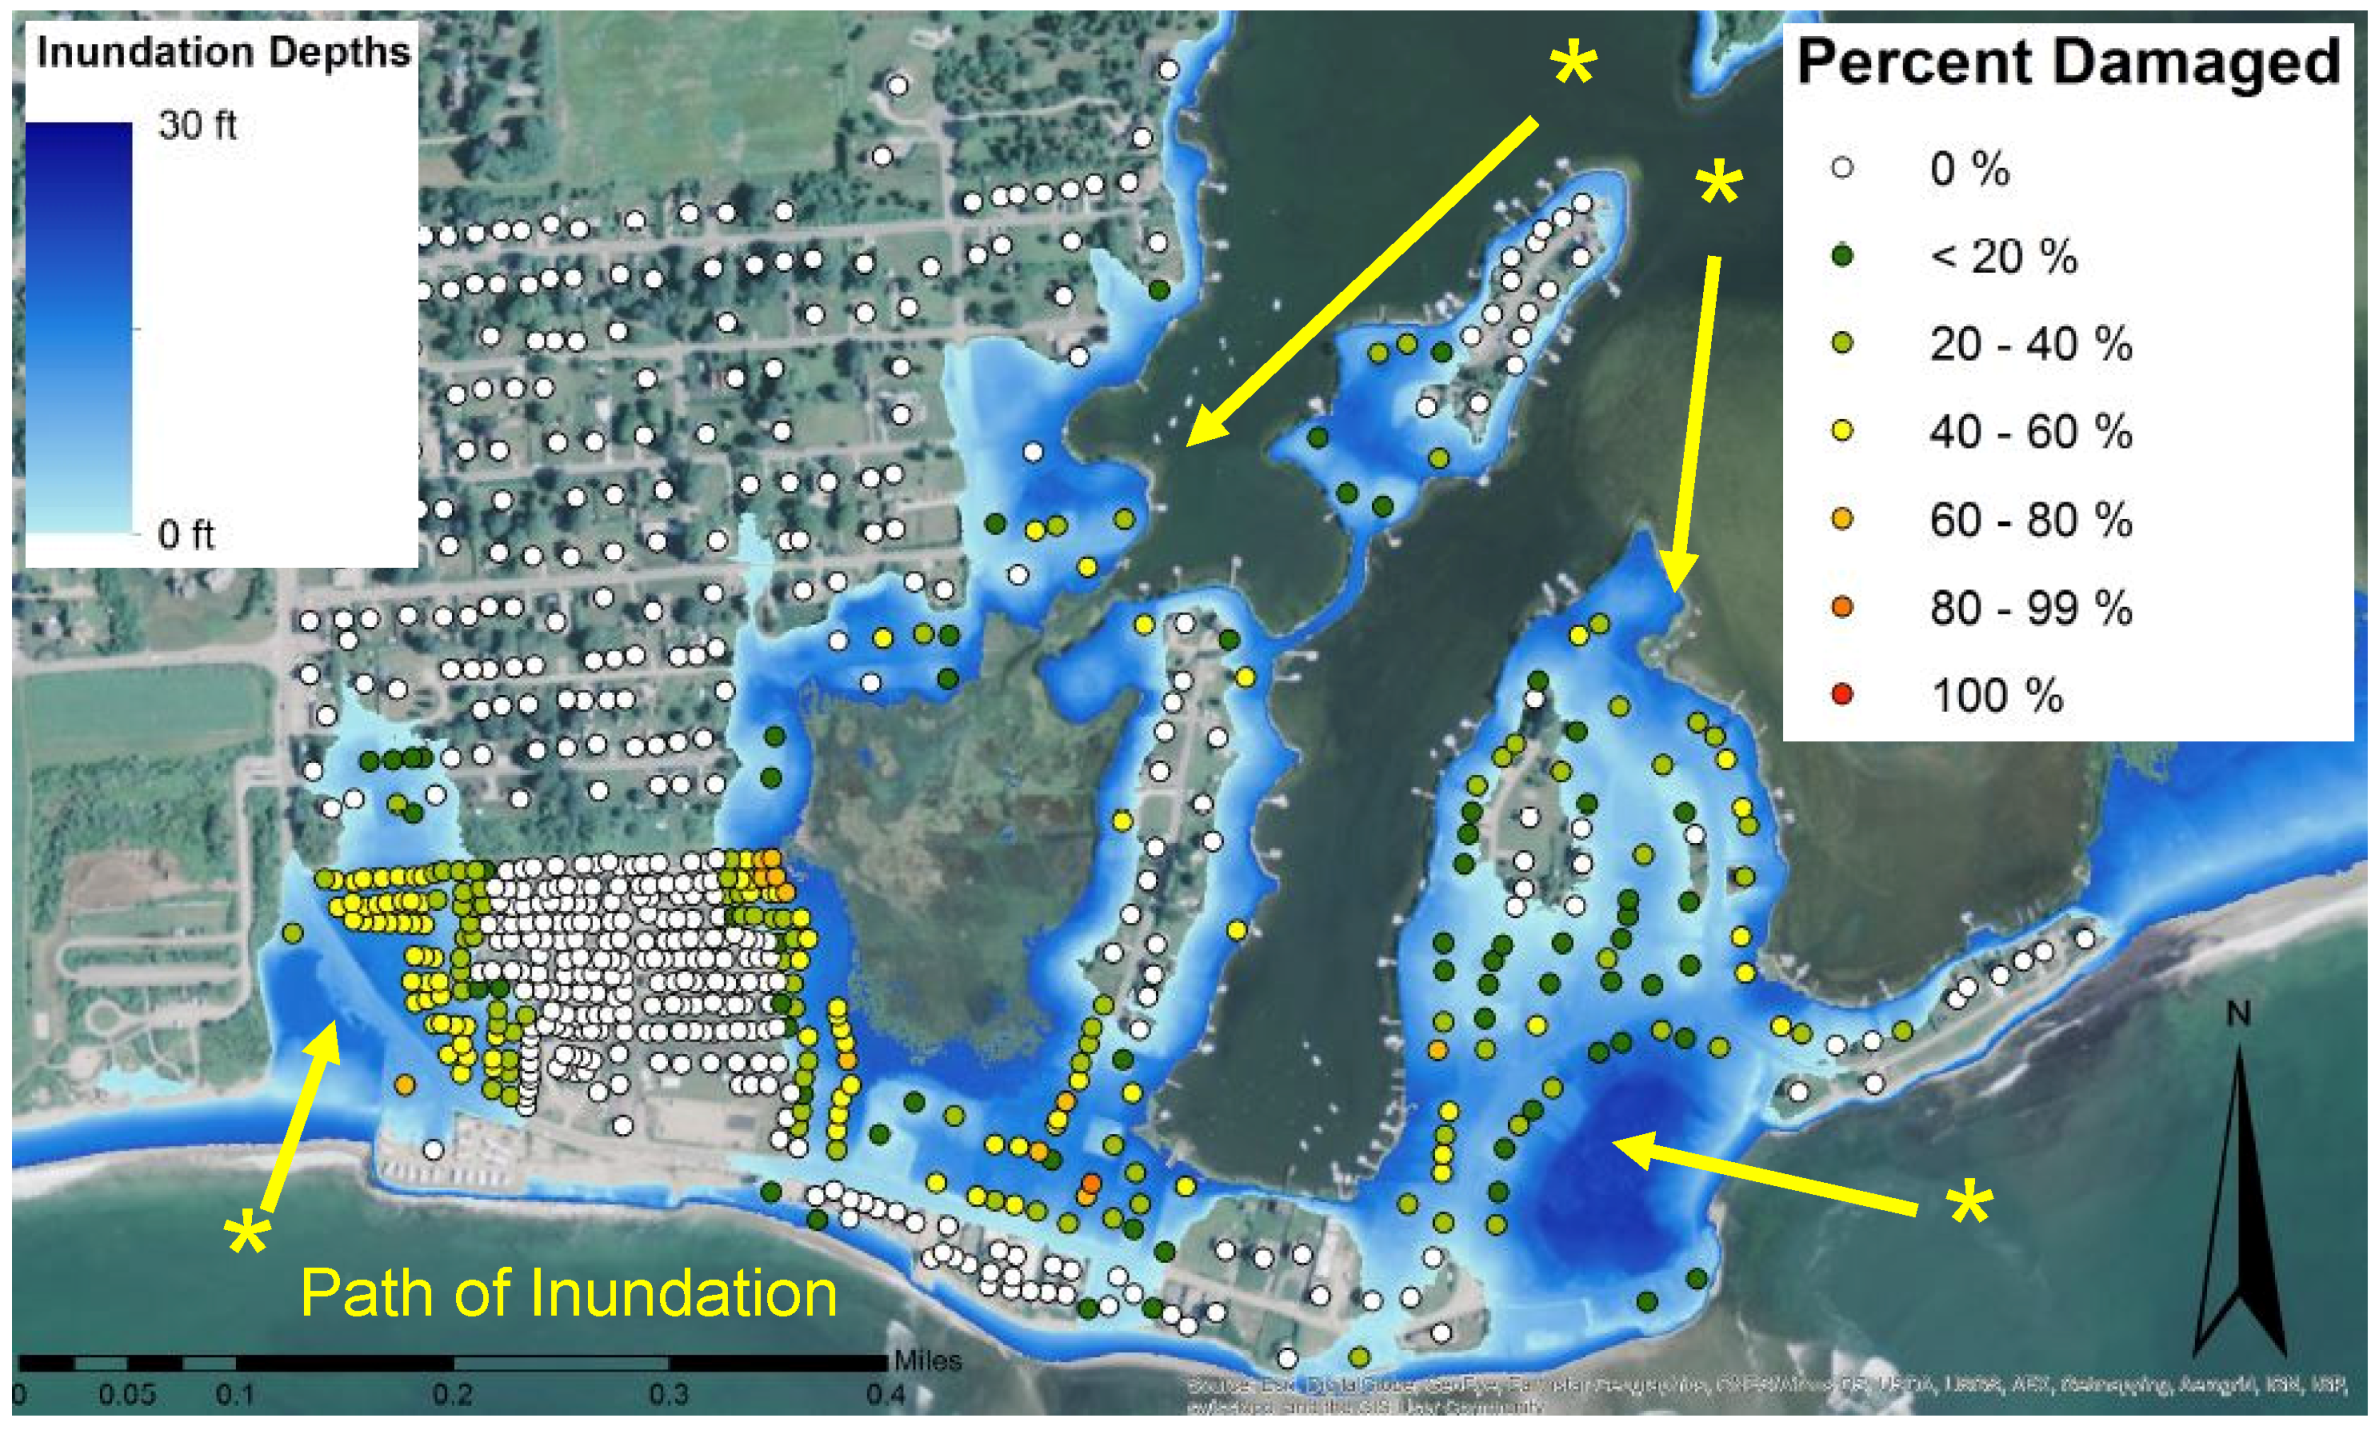
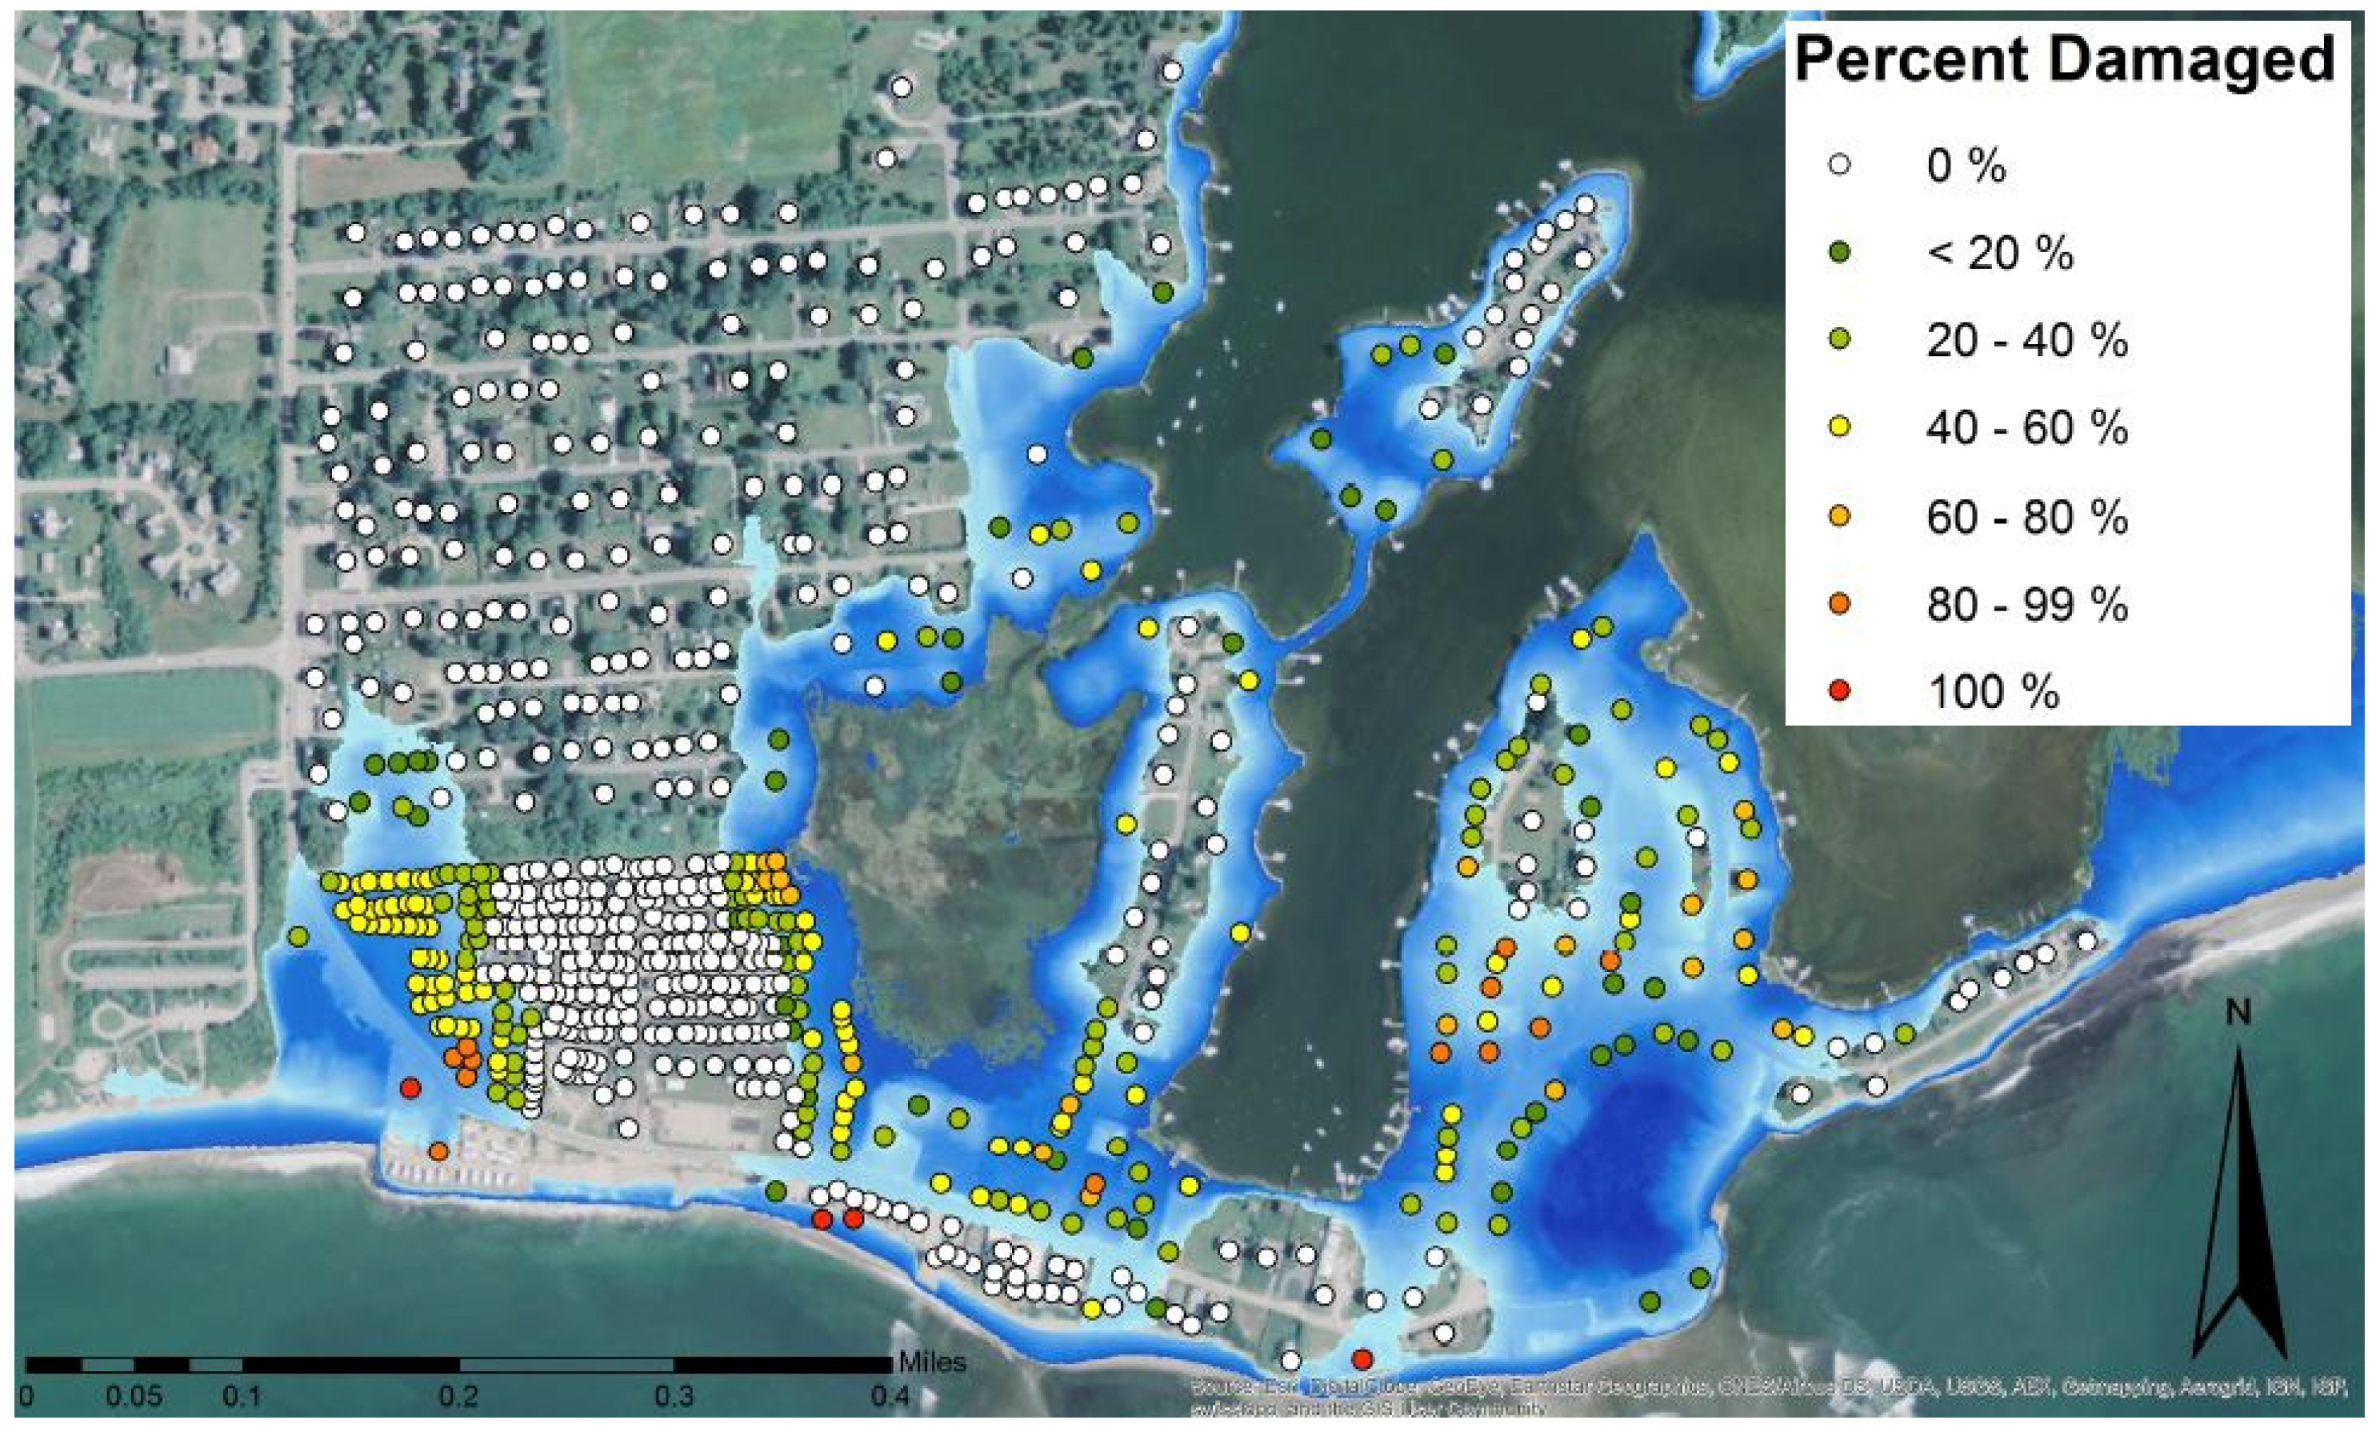
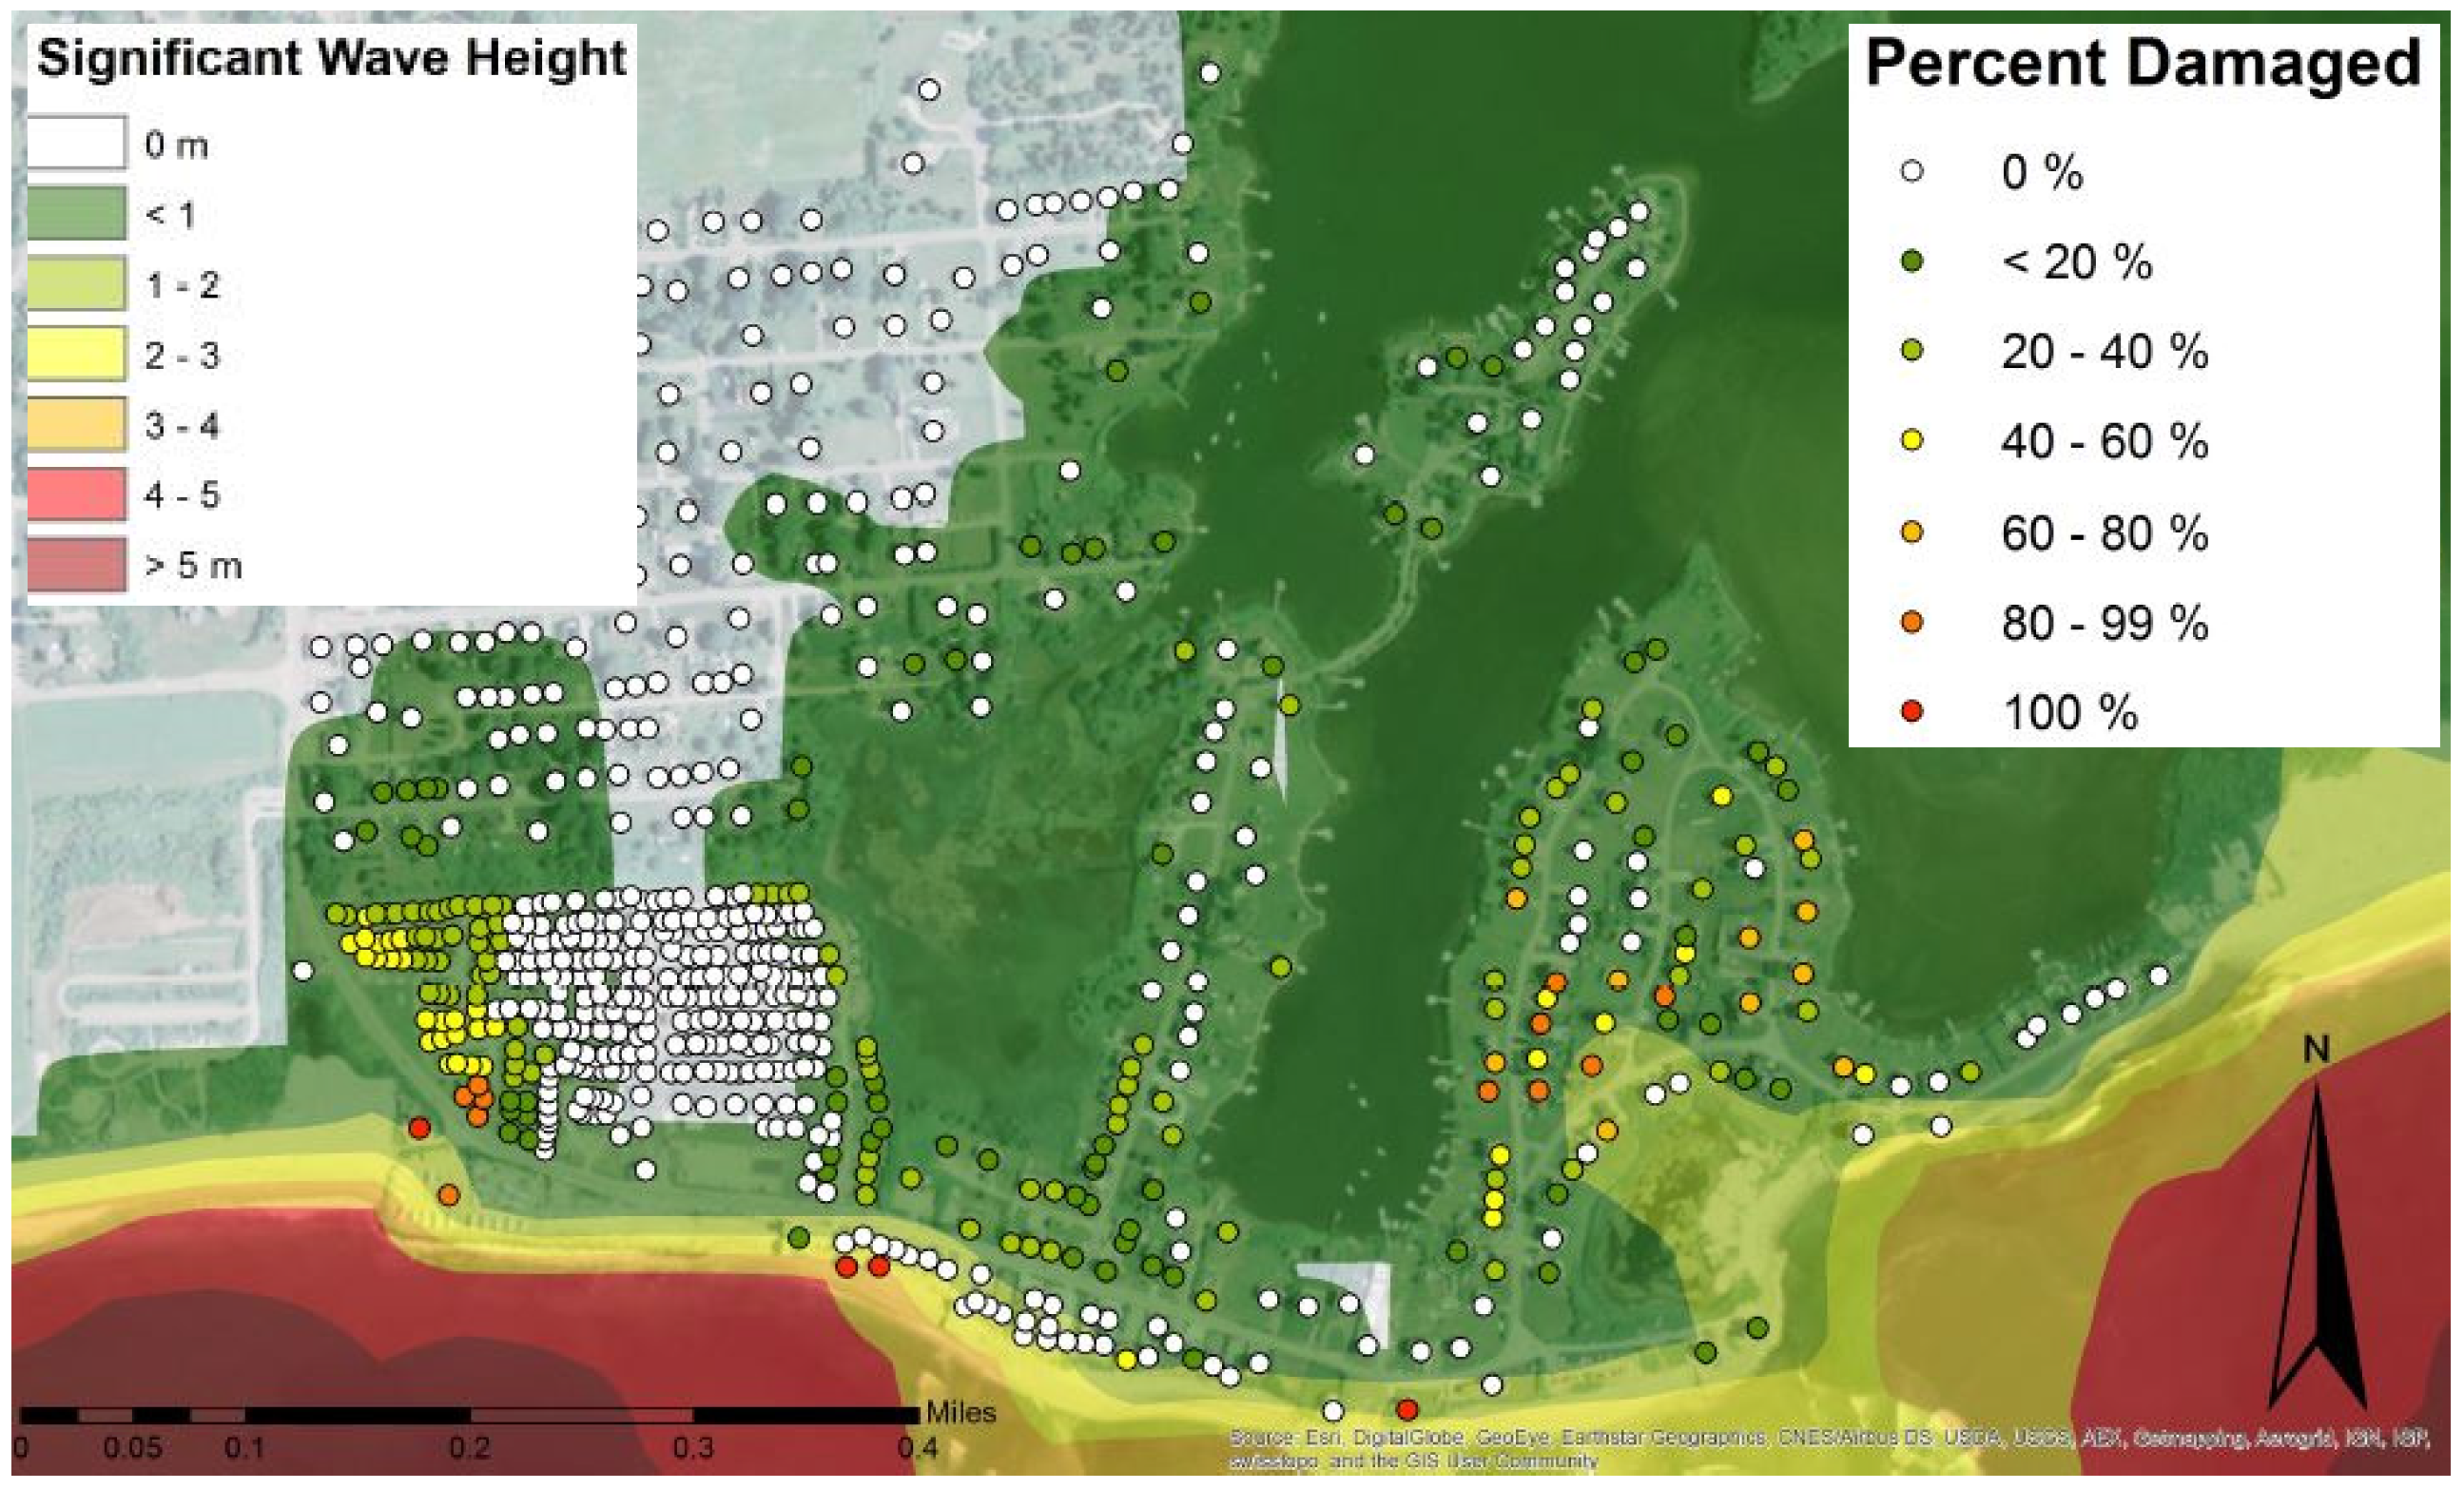
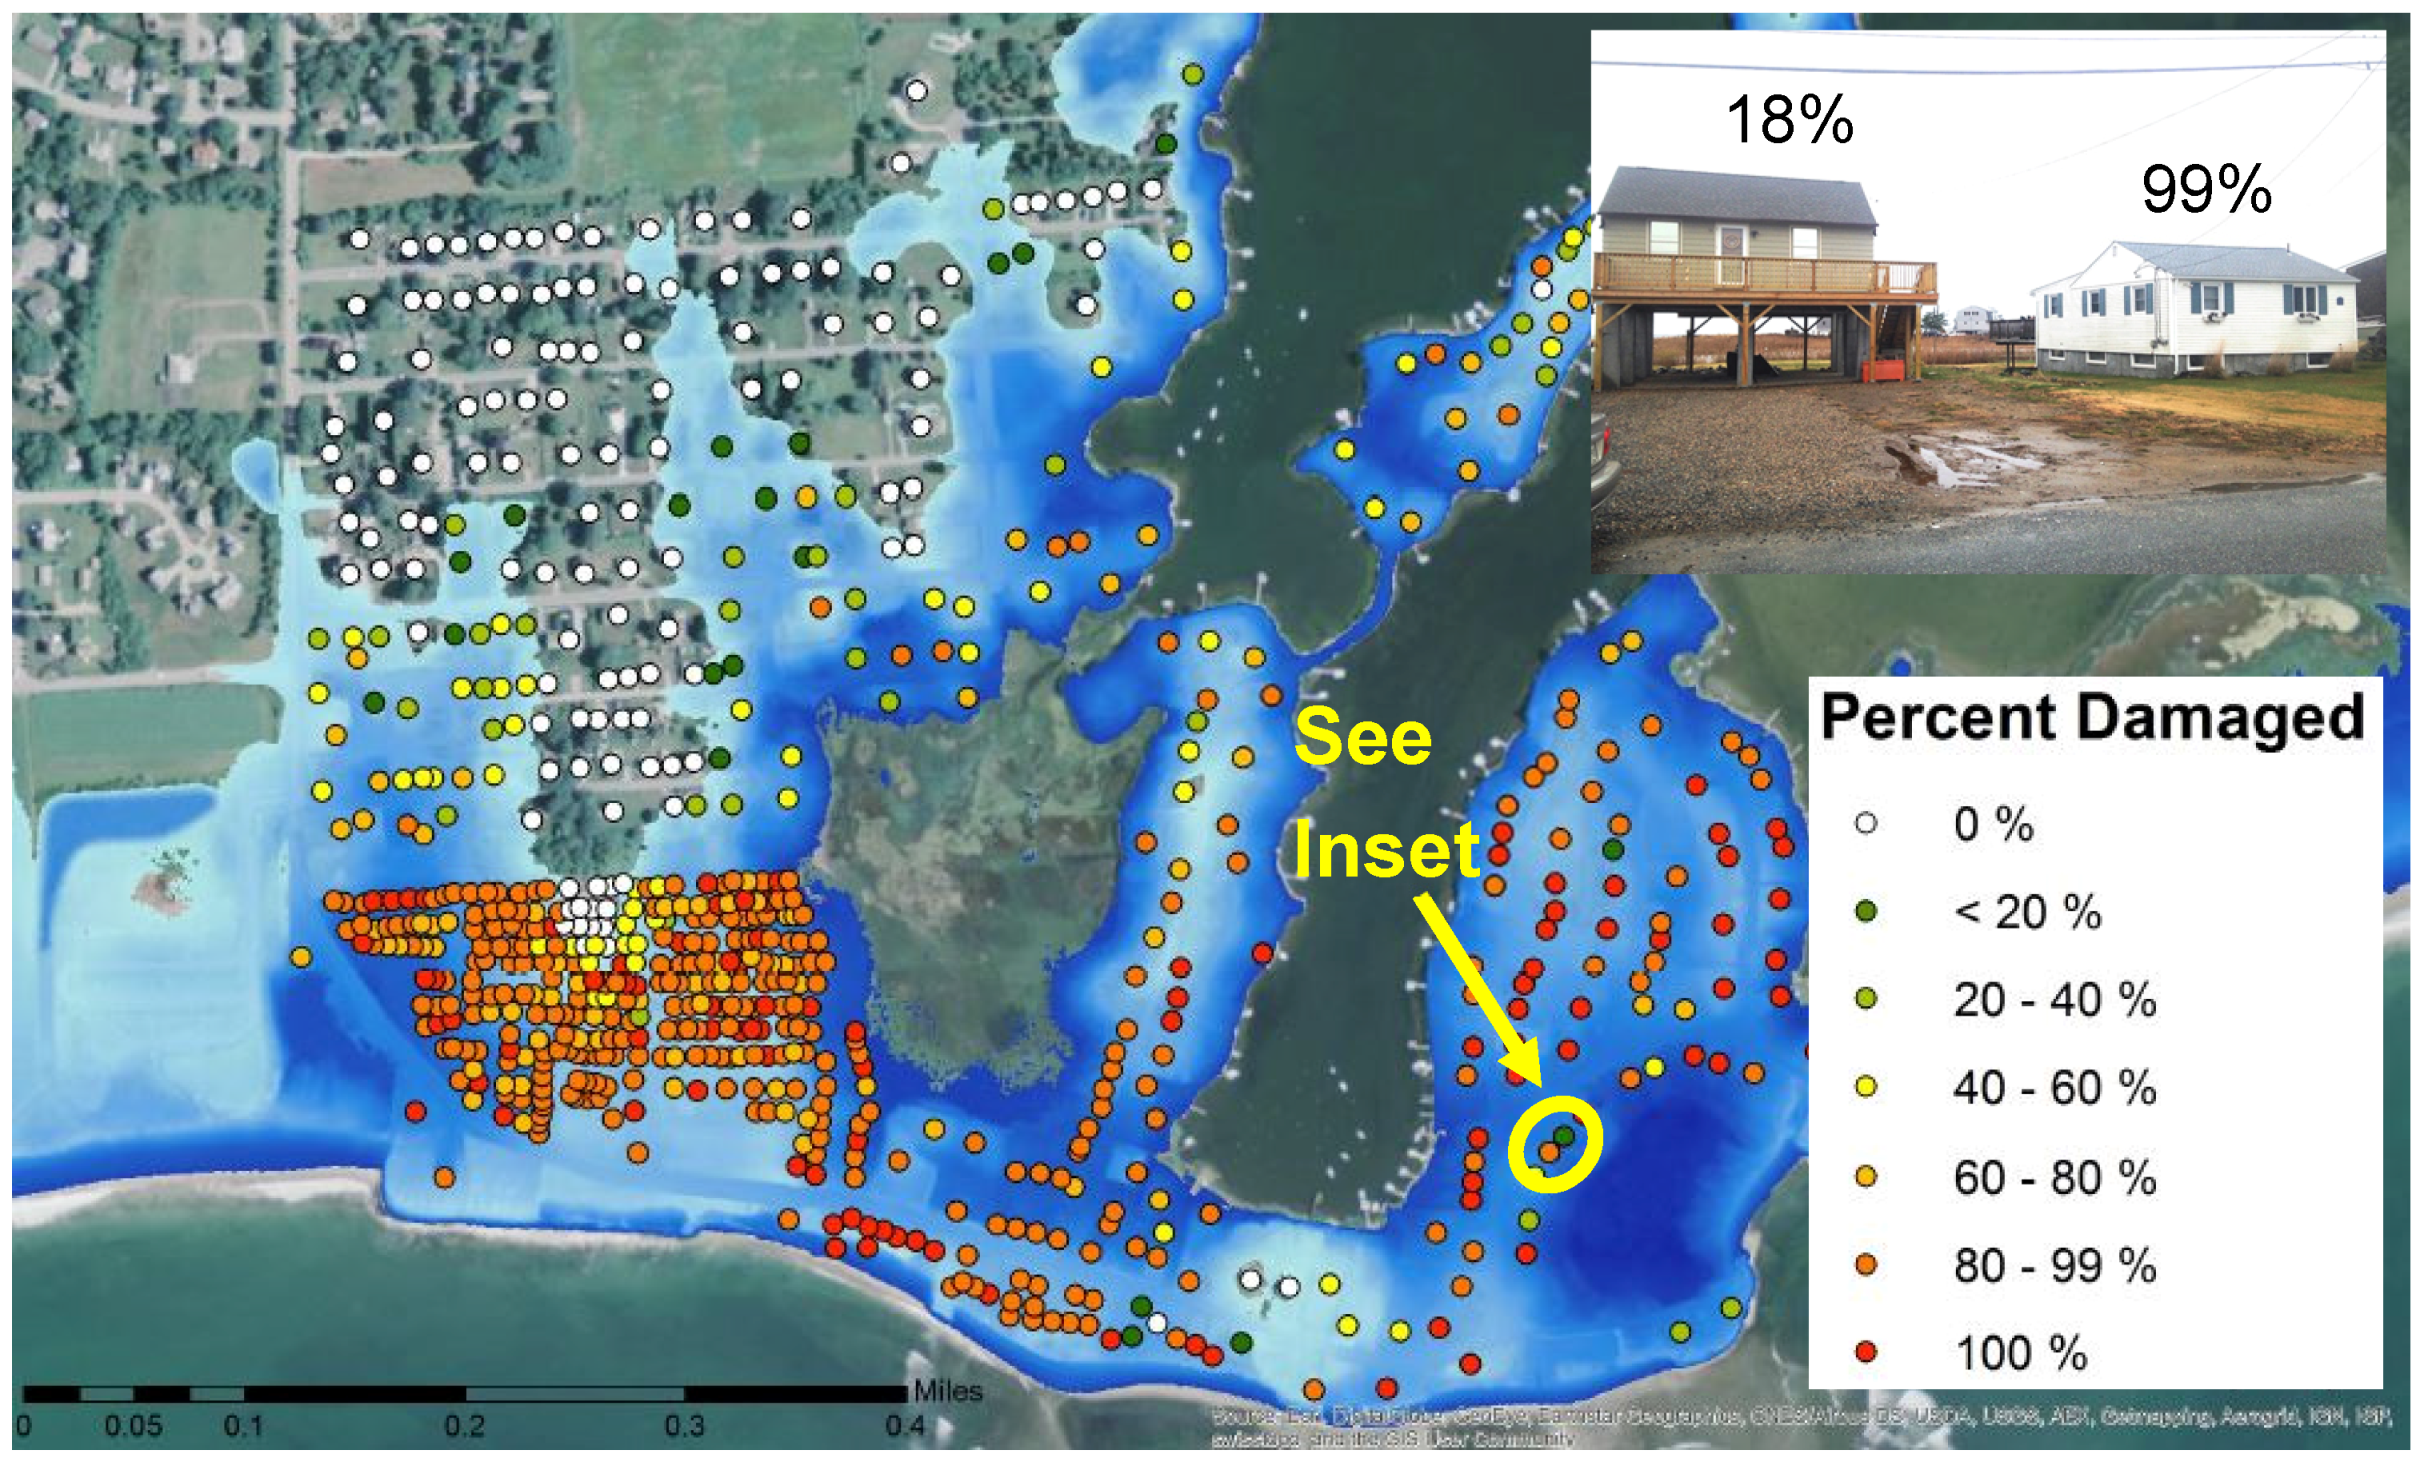
3.1. Assessment of Damage from Inundation and Waves

The estimated water levels from inundation and wave action were combined with the FFE at each structure and input into the appropriate damage functions for each prototype. Water levels were determined for two storm scenarios, a 100 year event, with and without 7 feet of sea level rise. As described above, the damage was calculated separately for inundation and waves and the larger of the two was used as the total damage. Damage from erosion was assessed directly from local erosion rates rather than from damage functions.
Figure 12 shows the estimated inundation damage for the study area from a 100 year event with no sea level rise using the “most likely” damage curves. The main sources of damage (>20%) occur in the low lying area in the southwest corner of the study area where the coastal road turns inland, a low barrier beach in the southeast corner of the study area, and from the wetlands within the coastal pond due to back flooding.
Figure 13 shows the estimated wave damage from a 100 year storm with no sea level rise. Maximum estimated wave heights along the coastline were 6.5–10 ft (2–3 m), however, most of the wave heights were <1 m. A comparison of Figure 12 and Figure 13 suggests that waves are present at locations where there is no inundation. This is the result of different resolutions of the wave and inundation estimates; the STWAVE results had a resolution of 10 m while the results from STORMTOOLS had a resolution of 1 m. This was resolved by setting the wave heights to zero wherever there was no inundation.
Figure 14 shows the total damage estimated for each structure within the study area. Close inspection of these figures shows that, as expected, wave damage dominates along the coastline and transitions to inundation damage dominating further inland and along the coastal pond. For this storm event, 253 of the 708 structures were estimated to have suffered some amount of damage.
Figure 15 shows the total damage from inundation and waves for a 100 year storm event with 7 feet of sea level rise (SLR). The extent of inundation is included, which clearly shows the increase in flooded areas. With sea level rise, the entire coastal road parallel to the shore is flooded. The estimated damage for the majority of the structures along the coastal road ranged from 80% to 100%, and wave damage dominated for most of these structures. In this case 578 of the 708 structures were estimated to have damage, which was 324 more than from the 100 year storm event with no sea level rise.
Two adjacent structures at the eastern end of the study area (shown in the yellow circle and the inset photograph in Figure 15) illustrate the obvious importance of elevation in mitigating inundation and wave damage. Damage to the elevated structure (Prototype 7A) is estimated to be 18% for a 100 year storm event with 7 feet of sea level rise while the adjacent single story home with a basement (Prototype 5B) is completely destroyed.
Table 1 summarizes the results in terms of both the number and percentage of structures that are damaged for each prototype. Columns (a) and (c) (in green) summarize the results from a 100 year storm event and columns (b) and (d) (in blue) show the results from a 100 year storm event with 7 feet of sea level rise. Approximately 35% of the one and two story structures (prototypes 5A, 5B, 6A, and 6B) are expected to be damaged from a 100 year storm event with no sea level rise. However, only 12% of these structures are estimated to be damaged more than 50%. It should be noted that 50% damage is a critical threshold for the RI CRMC, the states principal coastal regulatory agency; above this amount homeowners must rebuild to current building codes (i.e., increased loads, elevation of FFE, etc.). For the 100 year storm event with 7 feet of sea level rise, 75% of one and two story structures are expected to suffer some damage, and almost 60% of the structures would suffer more than 50% damage.
The performance of the elevated structures (prototypes 7A and 7B) is markedly different (in orange). Of the 23 elevated structures, approximately 60% (14 structures) are expected to suffer some damage during a 100 year storm event, however 13% have more than 50% damage. For a 100 year storm event with 7 feet of sea level rise, the percentage of elevated structures with more than 50% damage increased to approximately 52%. This suggests that at least half of the structures in the study area that are currently elevated on piles may still be vulnerable to damage when the effects of sea level rise are considered.

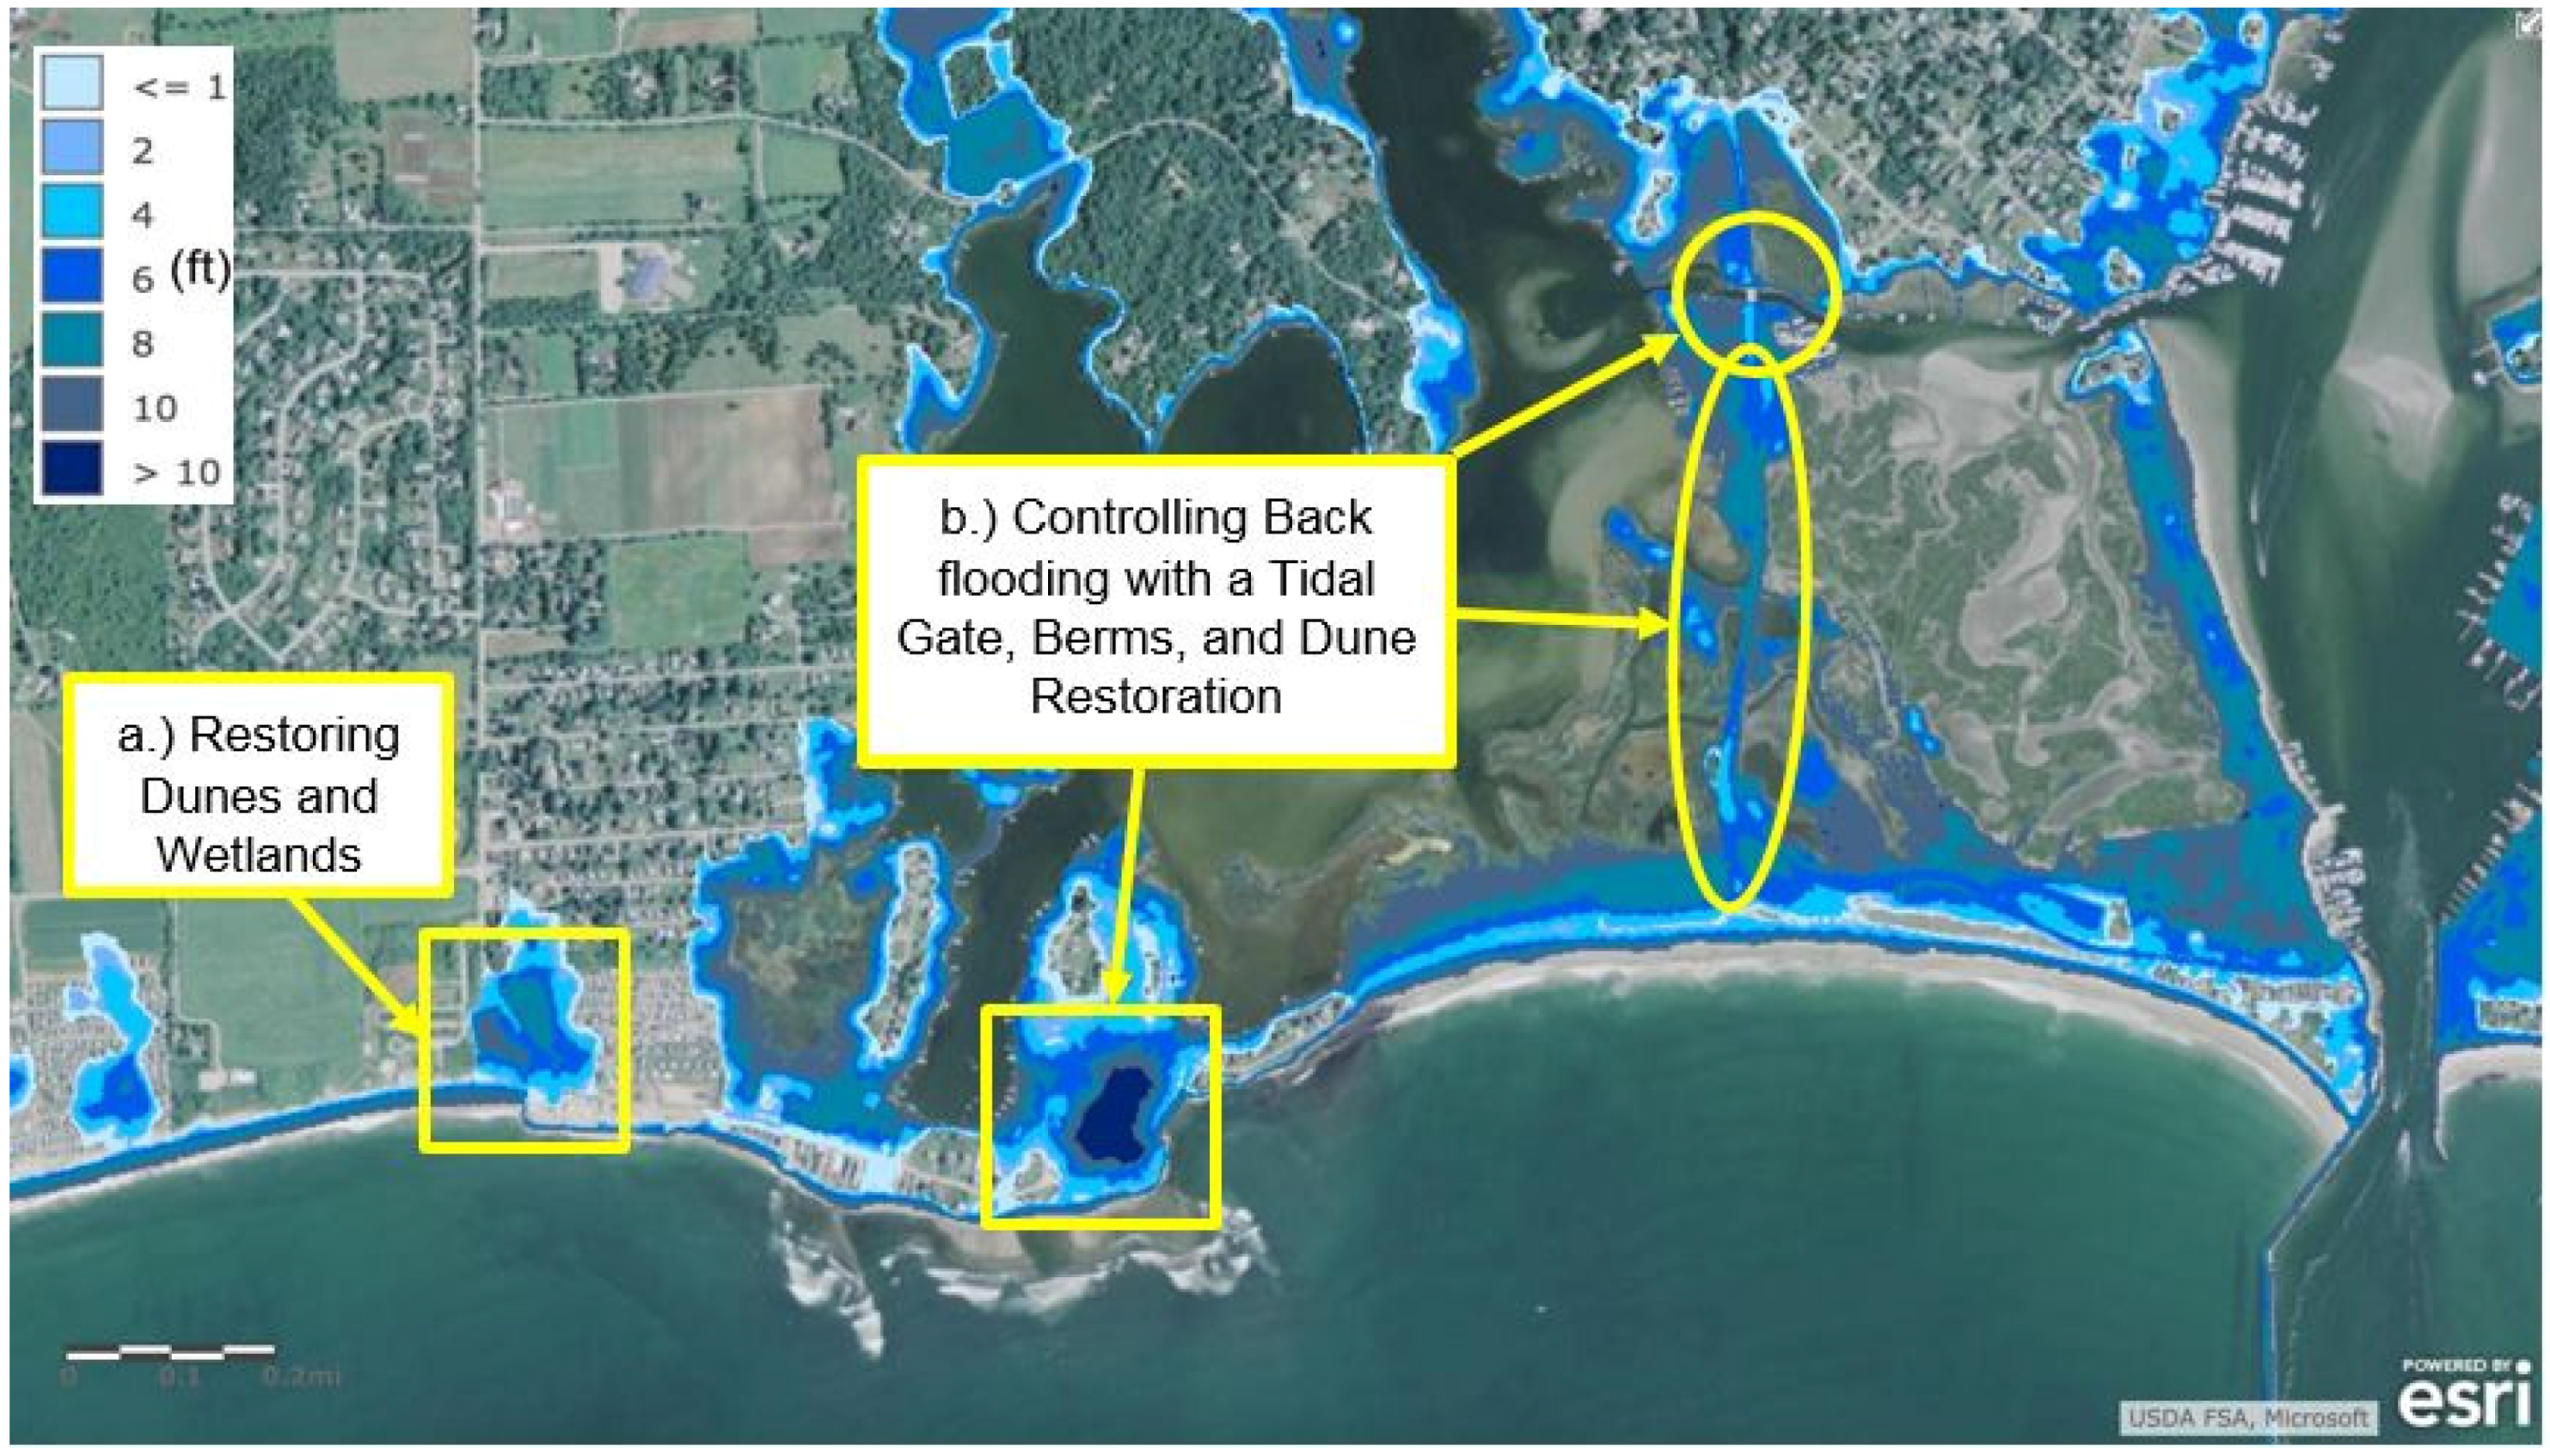
3.2. Evaluation of Adaptation Strategies

After using CERI to analyze damage from inundation and waves within the study area, two adaptation measures were evaluated. Although these measures are in the conceptual design stage, they can be evaluated based on the estimated reduction in damage to structures and infrastructure. As such, CERI can be used as a tool to aid planners, local governments, and emergency managers in evaluating different strategies to mitigate damage from storm events.
The two adaptation measures that were evaluated are shown in Figure 16. The first involved restoration of a dune and a coastal pond/wetland in the southwest corner of the study area. The primary function of this measure is to protect a collection of low-lying single story homes (see Figure 14) and the coastal road/evacuation route. The second adaptation measure is a combination of berms, a tide gate, and a restored dune along the eastern end of the study area, with the primary function of mitigating back flooding from the coastal pond.

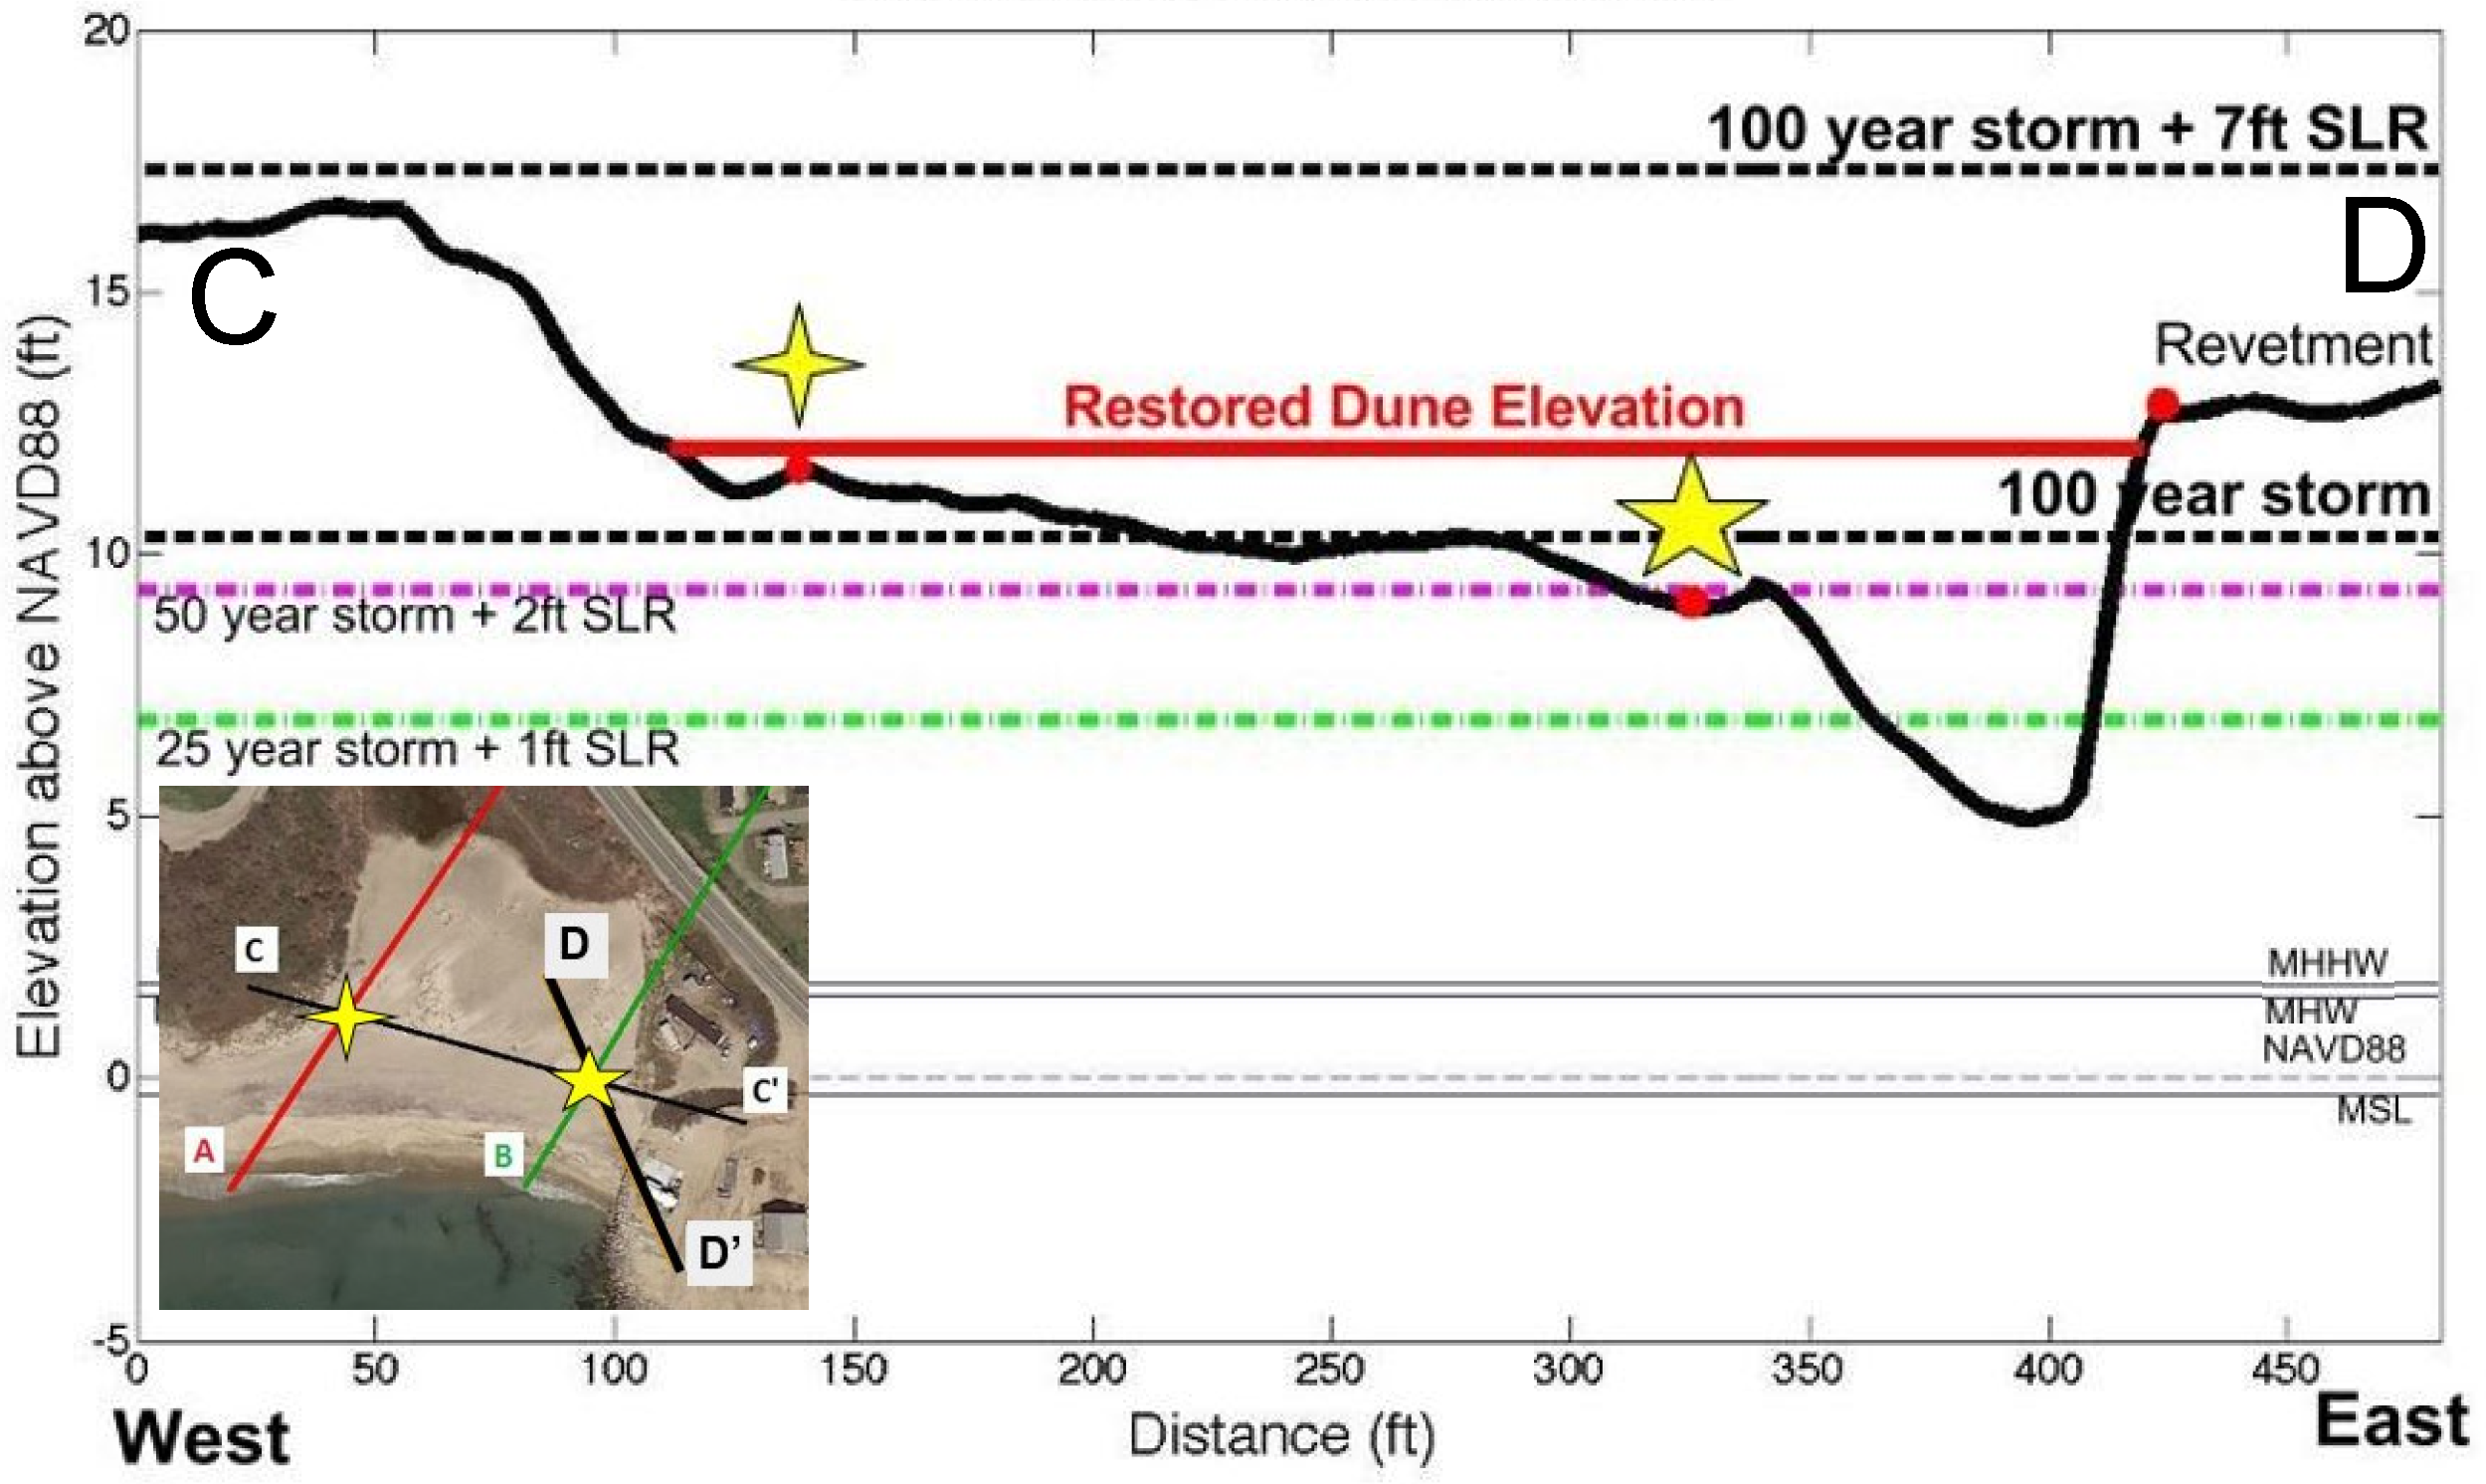
3.2.1. Dune Restoration

Figure 17a shows a series of photographs of the southwest corner of the study area from 2004 to 2015. Over the past 11 years there has been significant erosion at this location which has impacted the coastal pond and is currently (2016) encroaching on the coastal road. This area is the path of inundation for up to a 100 year storm event without sea level rise (Figure 17b) and is therefore a good location for a coastal protection system. Figure 18 shows a cross section across which a restored dune is proposed. At this location approximately 9000 ft3 of fill would be required to raise the elevation to above the level of inundation from a 100 year event.
One potential solution would be to design and build a reinforced dune with a core of geotextile sand containers (GSC), such as the recently completed Montauk Stabilization Project in Long Island, New York [11]. Potential advantages of using reinforced dunes included the added stability over dunes without GSCs (particularly during the first five years while dune grass plantings are maturing) and reduced costs and permitting restrictions relative to hardened structures. Additionally, “soft” solutions such as reinforced dunes are typically designed for events with lower return periods than 100 years (e.g., 25 or 50 years), and as such they can provide a cost-effective solution that gives decision makers more time to assess the actual impacts of sea level rise on coastal communities.
It is estimated that construction of a reinforced dune at this location would protect 81 structures (Table 2) and would also protect the coastal road and evacuation route from storm surge and wave action up to a 100 year event (without sea level rise).

3.2.2. Mitigation of Back Flooding

Much of the inundation in the study area comes from back flooding of the coastal pond north of the Matunuck Beach community. Mitigation of this flooding requires a combination of measures in the southeast corner and east of the study area. These include a tidal gate at the inlet of the pond (Figure 16), berms along sections of a shore-perpendicular road, and a restored dune in the southeast corner of the study area. A review of inundation levels with STORMTOOLS indicated that, even with these measures, storm events with 25 year return periods would still flood the coastal pond through numerous low-lying areas east of the study area. Therefore, only a 25 year storm event was evaluated for possible mitigation. Table 2 shows that, using these measures, mitigation of flooding of the coastal pond from a 25 year storm event would protect 70 structures from damage.

3.3. Benefits and Limitations of CERI

The ability to assess damage from inundation and wave action is a powerful tool for coastal planners, state agencies, and emergency managers. It is particularly useful for identifying structures and infrastructure that are most vulnerable from storm events and can be used to evaluate the impact or benefits of adaptation measures. This approach is also flexible enough to incorporate different storm scenarios and levels of sea level rise into the analysis. Wave run up and wind damage are currently not included, however, these could be addressed in the future using more advanced models (e.g., FUNWAVE) and additional damage functions.

4. Conclusions

Matunuck is a coastal village in South Kingstown, RI that has one of the highest erosion rates in the state, and the structures and infrastructure are at risk from inundation and wave damage from storms. The only evacuation route for much of the community is highly susceptible to flooding. Sea level rise is predicted by NOAA to be as high as 7 feet by 2100. Given these issues, the objective of this paper was to estimate inundation, wave, and erosion damage to the existing structures and infrastructure in this community caused by a 100 year storm with and without 7 feet of sea level rise. Adaptation strategies were identified to reduce the damage from inundation, wave, and erosion due to both storm scenarios and the reduction of damage associated with each adaptation strategy was determined.
A methodology called the Coastal Environmental Risk Index (CERI) was used to estimate the amount of damage relative to the first floor elevation of every structure in the study area. This can be generalized for any coastal community and it is unique because it gives information on damage to individual structures in a particular area. In order to create this tool, a GIS environment was utilized with STORMTOOLS inundation layers to find the estimated inundation depths, and Steady State Spectral Wave Model (STWAVE) modeling was used to find the estimated wave heights for the area of interest. This information was input into damage functions proposed by the U.S. Army Corps of Engineers’ NACCS. The total damage to each structure was considered to be the maximum of the estimated inundation and wave damage.
The level of estimated damage was heavily dependent on the local topography and structure type. Approximately 35% of the one and two story structures (prototypes 5A, 5B, 6A, and 6B) are expected to be damaged from a 100 year storm event with no sea level rise. However, only 12% of these structures are estimated to be damaged more than 50%. This is notable, as 50% damage represents a critical threshold for the RICRMC; above this amount homeowners must rebuild to current building codes. In Rhode Island, this includes elevation of the rebuilt structure above the BFE +1 ft., maintenance of a 50 ft. setback from the shoreline (or movement of the structure in the case of significant erosion), and compliance with the American Society of Civil Engineers’ standard ASCE 24-05 Flood Resistant Design and Construction. For the 100 year storm event with 7 feet of sea level rise, 75% of one and two story structures are expected to suffer some damage, and almost 60% of the structures would suffer more than 50% damage.
Shoreline erosion within the study area was estimated using local rates developed from historical positions of the shoreline and extrapolated while incorporating sea level rise and local effects. It is estimated that, by 2100, 59 to 349 structures within the study area will be impacted by erosion.
Two adaptation measures were evaluated: restoration of a dune in the southwest corner of the study area, and a combination of berms, a tidal gate, and a restored dune along the eastern end of the study area. A total of 151 of 708 structures are estimated to be protected from inundation and wave action using these measures.
Most importantly, this paper illustrates the benefits of using CERI to evaluate damage on a structure-by-structure basis and for its evaluation of different storm scenarios and adaptation measures. As such, this tool shows promise for use by coastal managers to manage risk to coastal communities.

Acknowledgments

This study was performed as part of a senior design class for Ocean Engineering undergraduates at the University of Rhode Island. Funding for participation in the 14th Estuarine and Coastal Modeling Conference and for publishing costs were provided by the Rhode Island Sea Grant. This support is gratefully appreciated.

Author Contributions

The students taking the class performed the study and prepared a final report and presentation of the work. The students included Christopher Small, Tyler Blanpied, Alicia Kauffman, Connor O’Neil, Nicholas Proulx, Mathew Rajacich, Hailey Simpson, and Jeffrey White. Malcolm L. Spaulding was the architect of CERI and served as a course advisor. Christopher D.P. Baxter was the course instructor and prepared this paper on behalf of the students. J. Craig Swanson served as an external advisor to the course.

Conflicts of Interest

The authors declare no conflict of interest.

References

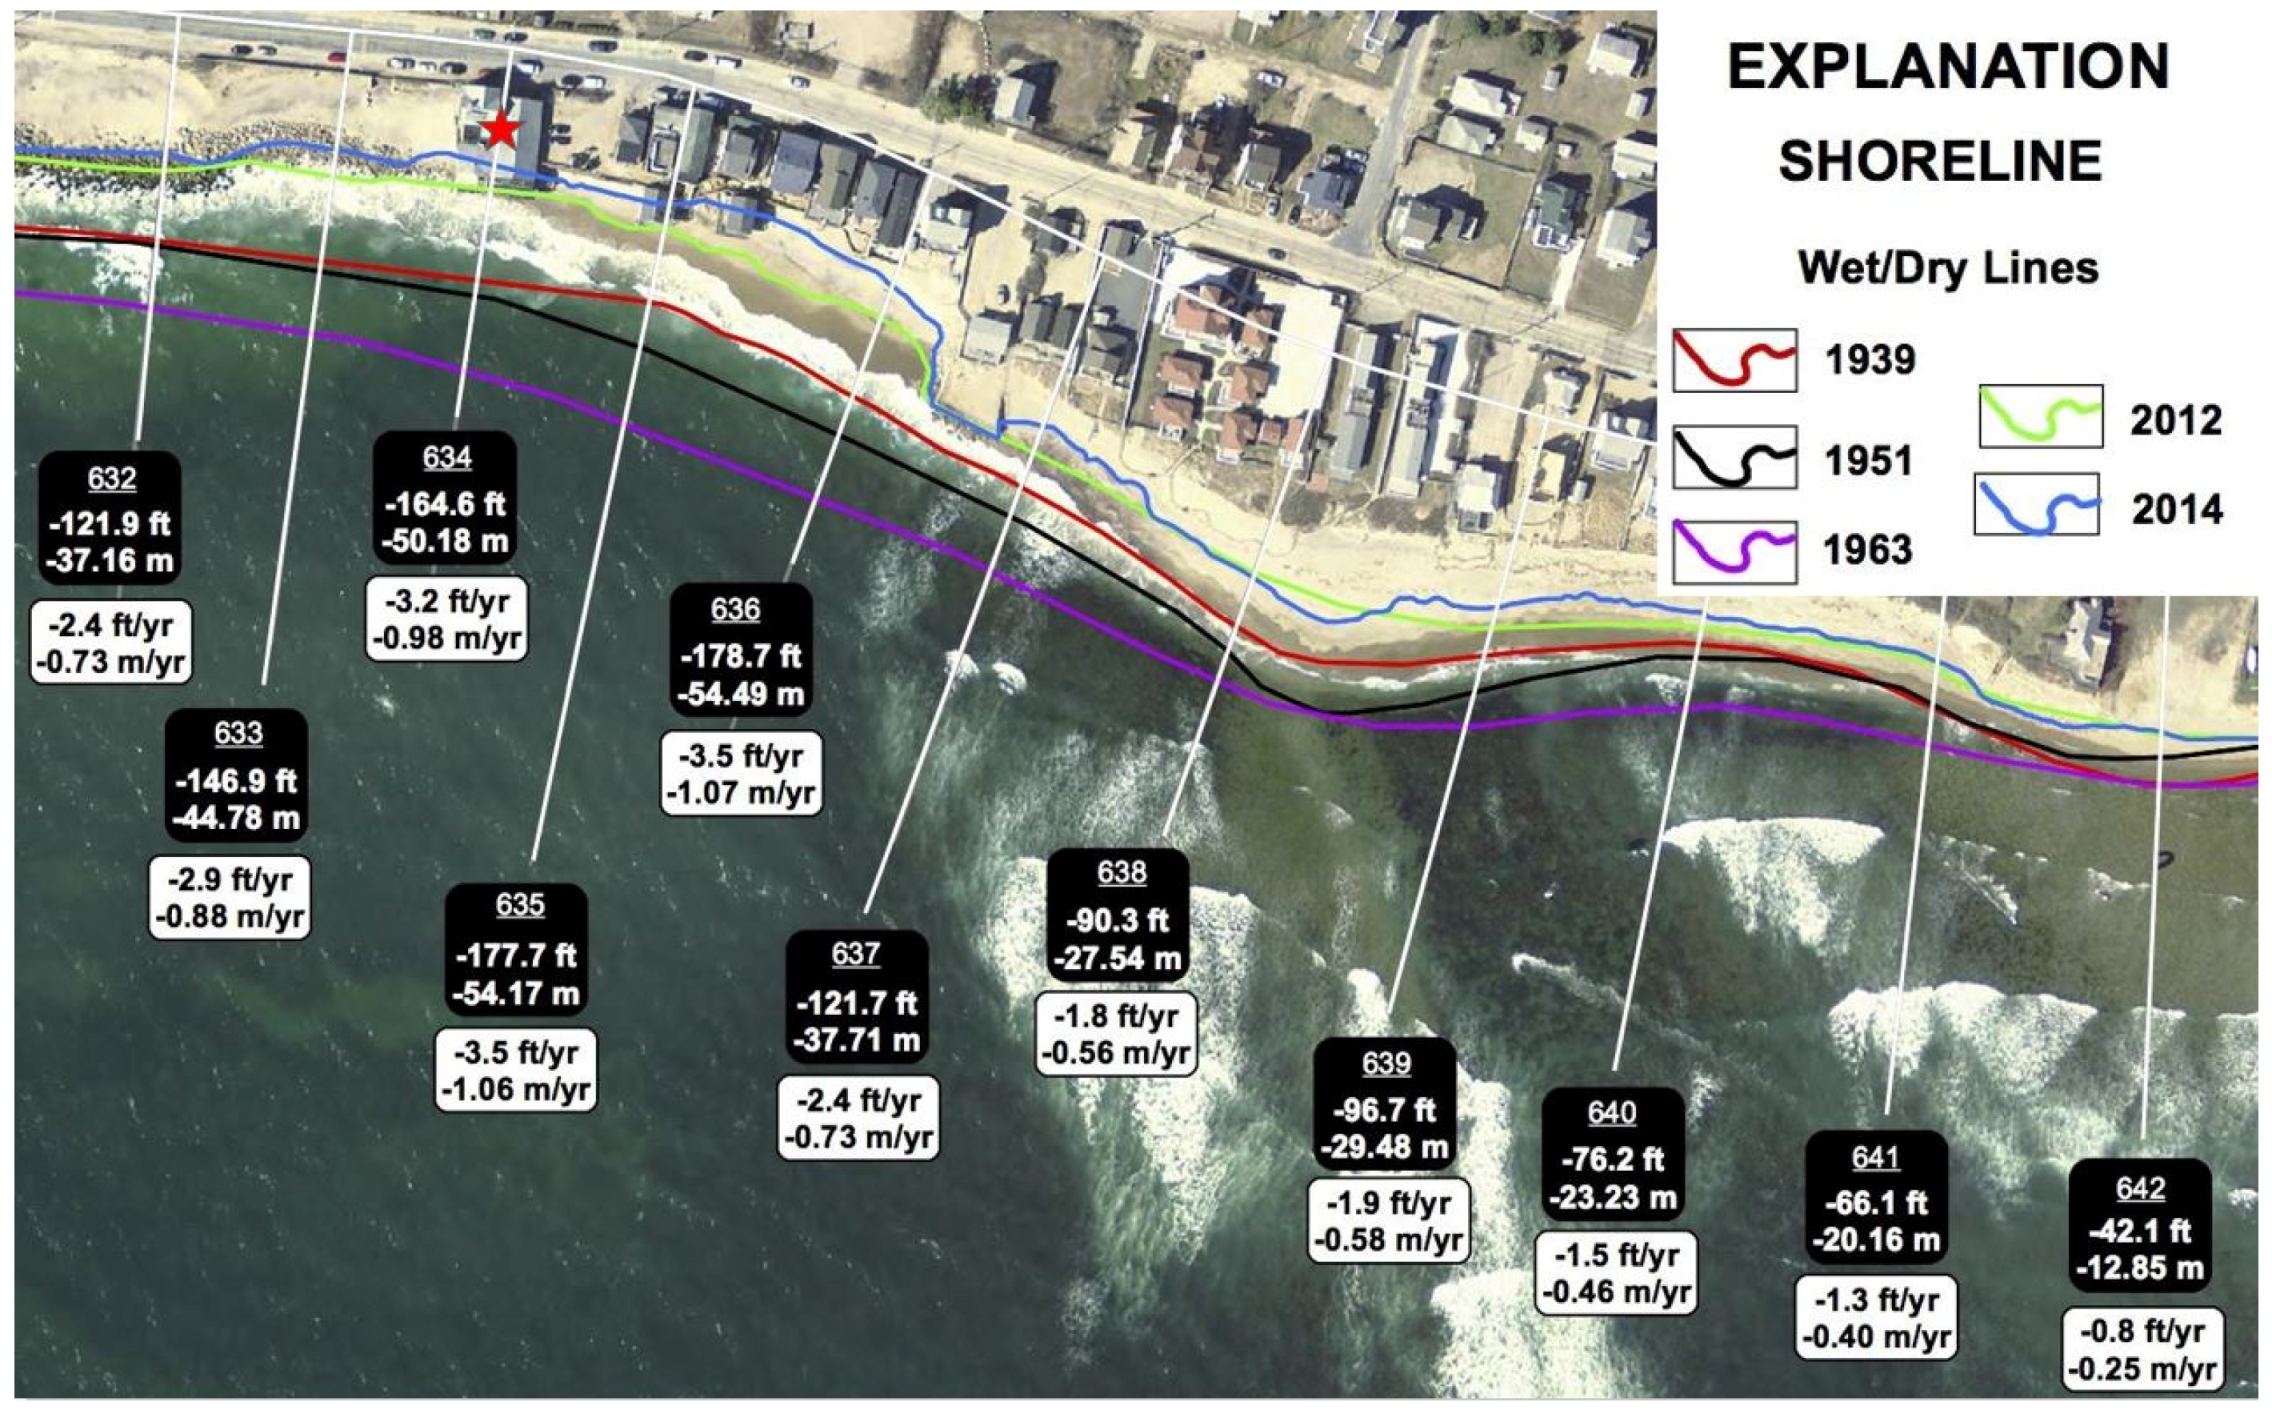
  1. Boothroyd, J.C.; Hollis, R.J.; Oakley, B.A.; Henderson, R.E. 2016, Shoreline Change from 1939–2014, Washington County, Rhode Island. 1:2,000 scale. Rhode Island Geological Survey. 45 maps. Available online: http://www.crmc.ri.gov/maps/maps_shorechange.html (accessed on 17 October 2016).
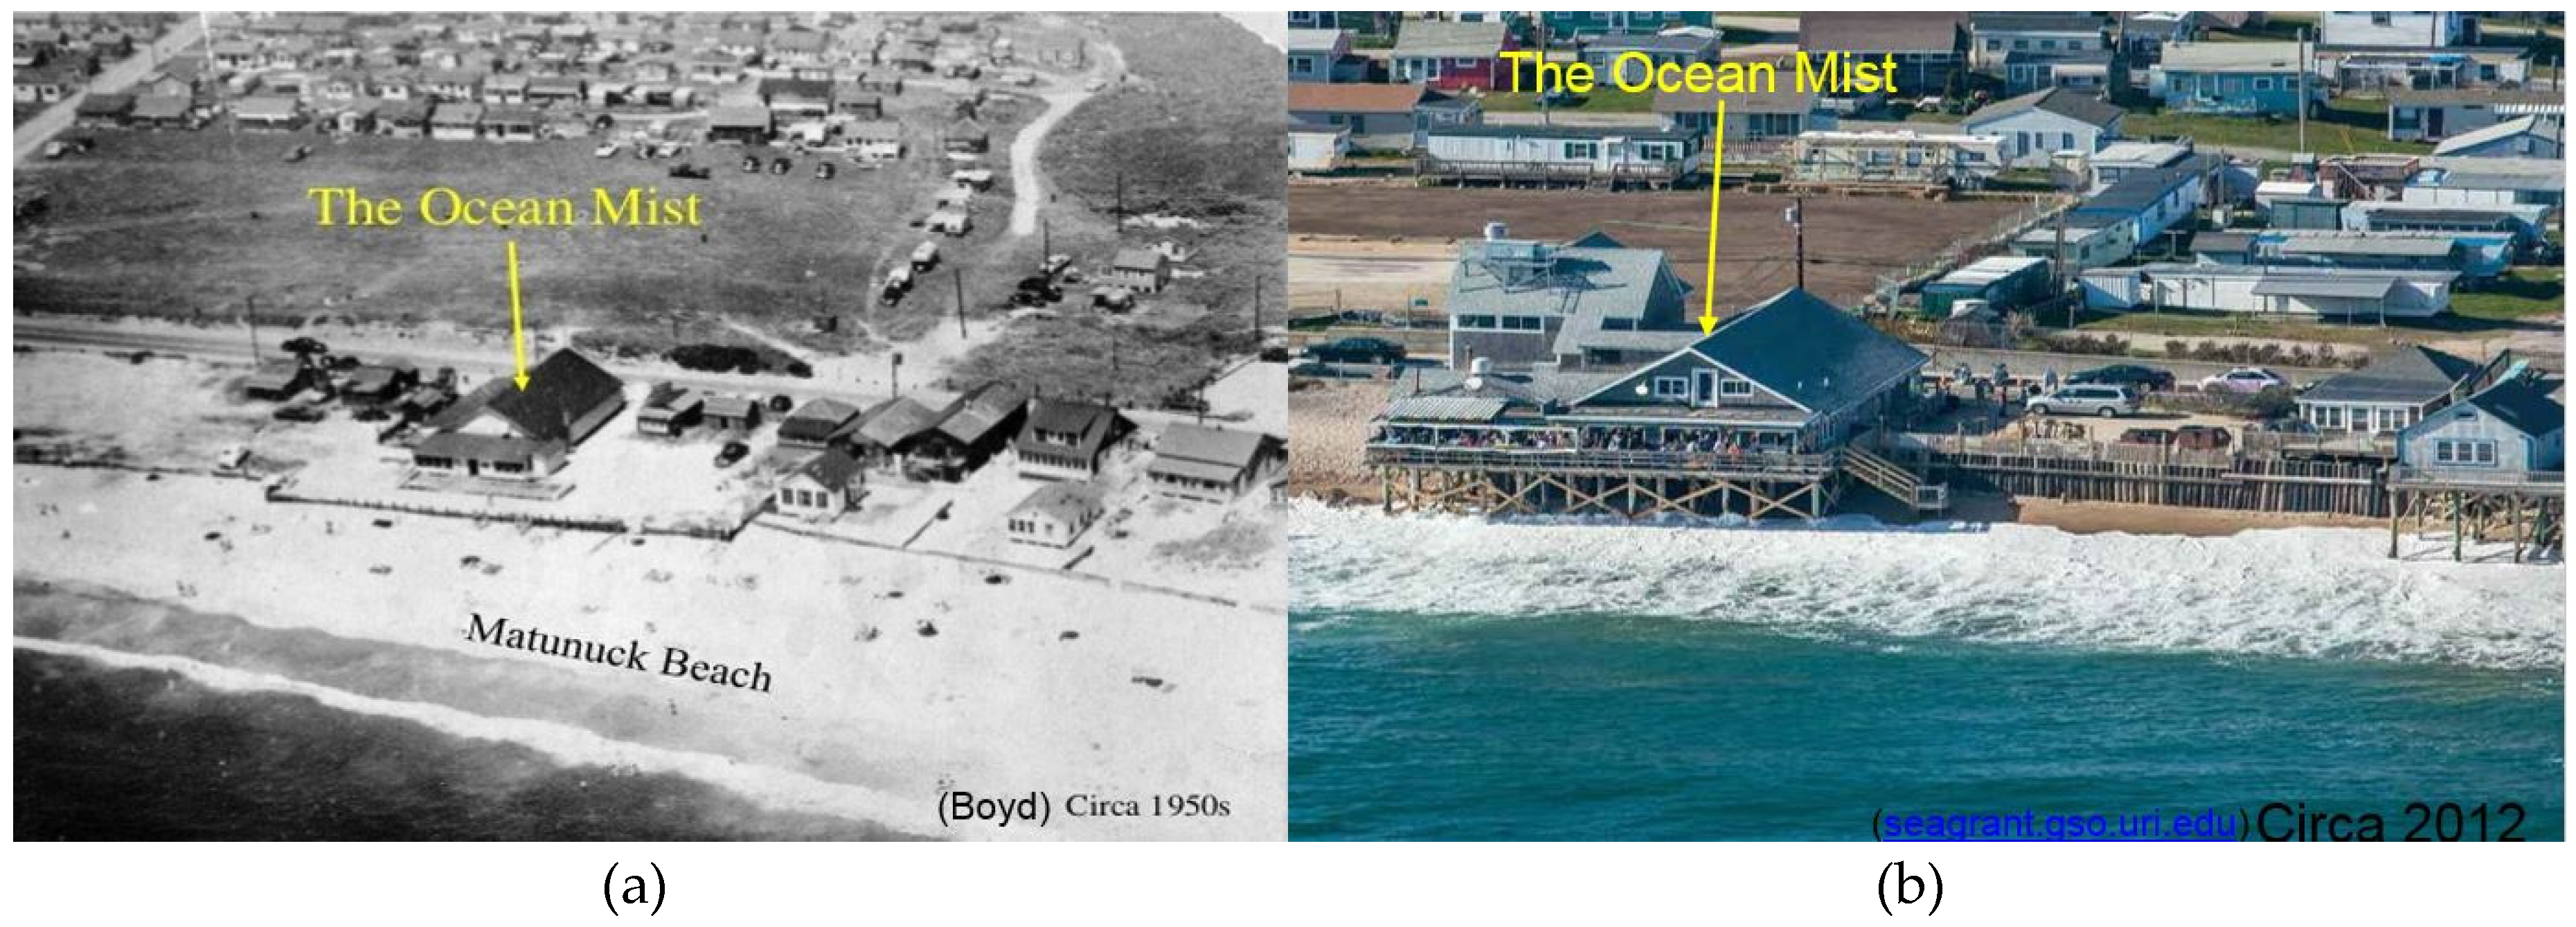
  2. Boyd, J.; (University of Michigan, Ann Arbor, MI, USA). Personal communication, 2015.
  3. NOAA Sea Level Rise Viewer. Available online: https://coast.noaa.gov/digitalcoast/tools/slr (accessed on 17 October 2016).
  4. Spaulding, M.L.; Grilli, A.; Damon, C.; Crean, T.; Fugate, G.; Oakley, B.A.; Stempel, P. STORMTOOLS: Coastal Environmental Risk Index (CERI). J. Mar. Sci. Eng. 2016, 4, 54. [Google Scholar] [CrossRef]
  5. U.S. Army Corps of Engineers. Physical Depth Damage Function Summary Report, North Atlantic Comprehensive Coastal Study: Resilient Adaptation to Increasing Risk. Available online: http://www.nad.usace.army.mil/Portals/40/docs/NACCS/10A_PhysicalDepthDmgFxSummary_26Jan2015.pdf (accessed on 17 October 2016).
  6. Rhode Island Geographical Information System. Available online: http://www.rigis.org/data/topo (accessed on 14 July 2016).
  7. Coastal Mapping Basics. Available online: http://www.region2coastal.com/resources/coastal-mapping-basics/ (accessed on 6 April 2015).
  8. Spaulding, M.L.; Isaji, T.; Damon, C.; Fugate, G. Application of STORMTOOLS’s simplified flood inundation model, with and without sea level rise, to RI coastal waters. In Proceedings of the ASCE Solutions to Coastal Disasters Conference, Boston, MA, USA, September 2015.
  9. U.S. Army Corps of Engineers. Main Report, North Atlantic Coast Comprehensive Study: Resilient Adaptation to Increasing Risk. Available online: http://www.nad.usace.army.mil/Portals/40/docs/NACCS/NACCS_main_report.pdf (accessed on 17 October 2016).
  10. RI CRMC Shoreline Change Special Area Management Plan. Available online: http://www.beachsamp.org/resources/stormtools/ (accessed on 10 August 2016).
  11. U.S. Army Corps of Engineers. Main Report, Downtown Montauk Stabilization Project. 2014. Available online: http://www.nan.usace.army.mil/Portals/37/docs/civilworks/projects/ny/coast/fimp/DM_files/HSLRR/App_E_Public%20Access%20Plan%20Oct2014.pdf (accessed on 17 October 2016).
Figure 1. Site map of the coastal community of Matunuck, Rhode Island that was chosen for this study.
Jmse 04 00067 g001
Figure 2. Shoreline change rates for the study area [1].
Jmse 04 00067 g002
Figure 3. Photographs of a local restaurant in the study area from: (a) the 1950s; and (b) 2012, showing the loss of shoreline due to erosion [2].
Jmse 04 00067 g003
Figure 4. Sea level change projections for the southern coast of Rhode Island [3]. USACE, US Army Corps of Engineers; NOAA, National Oceanic and Atmospheric Administration.
Jmse 04 00067 g004
Figure 5. Flow chart showing the methodology used to estimate damage from storm surge and sea level rise in this study (See [3]). CERI, Coastal Environmental Risk Index; NACCS, North Atlantic Coast Comprehensive Study.
Jmse 04 00067 g005
Figure 6. Distribution of structure type (i.e., prototypes) within the study area.
Jmse 04 00067 g006
Figure 7. Values of Furnished Floor Elevation (FFE) for each structure and topography within the study area.
Jmse 04 00067 g007
Figure 8. The U.S. Federal Emergency Management Agency’s (FEMA) designation of Special Flood Hazard Areas (SFHA) showing the base flood elevation (BFE) as the sum of the still water elevation from storm surge inundation and wave action [7].
Jmse 04 00067 g008
Figure 9. Extent of inundation within the study area from a 100-year storm event using the online tool STORMTOOLS [9].
Jmse 04 00067 g009
Figure 10. Estimated positions of the shoreline in the study area after 100 years using the historical erosion rate and two exponentially increasing erosion rates.
Jmse 04 00067 g010
Figure 11. Examples of damage functions proposed by the NACCS: (a) inundation damage to single story residences with no basement (prototype 5A); (b) wave damage to single story residences with no basement (5A); and (c) inundation damage to single story residences with a basement (6A). Inset photographs show 5A and 6A structures within the study area.
Jmse 04 00067 g011
Figure 12. Estimated inundation damage to each structure from a 100 year storm event with no sea level rise using the “most likely” damage curves. Inundation depths from STORMTOOLS are also shown.
Jmse 04 00067 g012
Figure 13. Estimated wave damage to each structure from a 100 year storm event with no sea level rise using the “most likely” damage curves. Wave height estimates from STWAVE are also shown.
Jmse 04 00067 g013
Figure 14. Total estimated damage to each structure from a 100 year storm event with no sea level rise. The extent of inundation is also shown.
Jmse 04 00067 g014
Figure 15. Total estimated damage to each structure from a 100 year storm event with 7 feet of sea level rise. The extent of inundation is also shown.
Jmse 04 00067 g015
Figure 16. Two adaptation measures proposed and analyzed for the study area.
Jmse 04 00067 g016
Figure 17. (a) Photographs showing significant erosion in the southwest corner of the study area since 2004; and (b) estimates of inundation for different storm events and levels of sea level rise.
Jmse 04 00067 g017
Figure 18. Cross section of southwest corner of the study area where a reinforced dune is proposed to mitigate damage from a 100 year storm event.
Jmse 04 00067 g018
Table 1. Summary of the total damage estimates by prototype for a 100 year storm event with and without 7 feet of sea level rise.
Prototype
(Number of Structures)
Structures with Damage
(Number/%)
Structures with >50% Damage
(Number/%)
(a)
100 Year Storm with
No SLR
(b)
100 Year Storm with 7′ SLR 1
(c)
100 Year Storm with
No SLR
(d)
100 Year Storm with 7′ SLR
5A, Single story with no basement
(359 Structures)
128 (36%)336 (94%)48 (13%)314 (87%)
5B, Two story with no basement
(104 Structures)
33 (32%)79 (76%)7 (7%)56 (54%)
6A, Single story with basement
(83 Structures)
31 (37%)56 (67%)12 (15%)43 (52%)
6B, Two story with basement
(139 Structures)
48 (35%)89 (64%)13 (9%)68 (49%)
7A, Elevated building with open pile foundation
(7 Structures)
6 (86%)7 (100%)2 (29%)5 (71%)
7B, Elevated building with enclosed pile foundation
(16 Structures)
8 (50%)11 (69%)1 (6%)7 (44%)
Total Number of Structures (708)254 (36%)578 (82%)83 (12%)493 (70%)
1 SLR = Sea Level Rise
Table 2. Effects of different adaptation measures in terms of structures protected for a given storm event.
(a) Restoration of
Dunes and Coastal Pond/Wetland
(b) Mitigation of Back Flooding
Design Event100 year storm event25 year storm event
Number of Structures Protected 8170
Additional Impacts of AdaptationAlso protects evacuation route for communityProtects inland structures outside the study area

