Article

Atmospheric Bulk Deposition of Polychlorinated Dibenzo-p-Dioxins, Dibenzofurans, and Polychlorinated Biphenyls in Finland

1
Finnish Environment Institute, P.O. Box 140 Helsinki, Finland
2
National Institute for Health and Welfare, Department of Health Protection, Chemicals and Health Unit, P.O. Box 95 Kuopio, Finland
*
Author to whom correspondence should be addressed.
J. Mar. Sci. Eng. 2016, 4(3), 56; https://doi.org/10.3390/jmse4030056
Submission received: 17 March 2016 / Revised: 23 August 2016 / Accepted: 23 August 2016 / Published: 7 September 2016
(This article belongs to the Special Issue Impacts of Climate Change on a Marginal Ecosystems—the Baltic Sea)

Abstract

:
The deposition of polychlorinated dibenzo-p-dioxins, dibenzofurans (PCDD/Fs), and polychlorinated biphenyls (PCBs) was studied during the period 2006–2008 in northern Finland (Pallas), 1998–2008 in southern Finland (Evo) and 2002–2004 in the Gulf of Finland archipelago (Utö). Retrospective snow samples were taken from the whole snowbank in Evo in 2003 and 2004, and recently fallen snow was collected in Evo in 2006–2008. The concentrations of PCDD/Fs in the depositions were usually small. The limit of quantification (LOQ) was often reached in Pallas and Utö. The analysis results of PCDD/F and PCB congeners from Evo were used to predict numerical results with linear regression for those congeners with results below LOQ. The deposition of PCDD/Fs in Pallas was mostly less than 0.4 pg·m−2·day−1 WHO-TEQ and less than 1.0 pg·m−2·day−1 WHO-TEQ and 0.5 pg·m−2·day−1 WHO-TEQ in Evo and Utö, respectively. The deposition of co-planar PCBs (cPCBs) was between 0.01 and 0.1 pg·m−2·day−1 WHO-TEQ. Annual PCDD/F deposition, calculated from the amount of collected rain and chemical analysis results, varied in Pallas between 0.04 and 0.15 ng·m−2·year−1 WHO-TEQ, in Evo between 0.11 and 0.22 ng·m−2·year−1 WHO-TEQ and in Utö between 50 and 145 pg·m−2·year−1 WHO-TEQ. For cPCBs the annual deposition in Pallas was 2–11 pg·m−2·year−1 WHO-TEQ, in Evo 6–17 pg·m−2·year−1 WHO-TEQ and in Utö 4–8 pg·m−2·year−1 WHO-TEQ. Wind directions are considered to be the main reason for the variation between seasons. Congener 1,2,3,7,8-PeCDD dominated in Pallas, Evo, and Utö, being 35%, 48%, and 47% of the overall WHO-TEQ, followed by 2,3,4,7,8-PeCDF (about 10%). The calculated pg/L concentrations of 1,2,3,7,8-PeCDD were about the same level as 2,3,4,7,8-PeCDF, but the TEF  correlations being twice as big ensured that all WHO-TEQ contributions were bigger. PCB126 accounted for 30% of WHO-TEQ in Pallas, whereas in Evo and Utö the proportion was less than 5%. Of PCDD/F homology groups, the highest concentration was found in Pallas as OCDDs (55%), followed by Evo and Utö, at 42% and 38%, respectively. Decreasing temporal PCDD/F deposition trends were observed for highly chlorinated octa-, hepta-, and hexacongeners. The findings indicate that, regardless of the major importance of Kymijoki to the dioxins in the Gulf of Finland, deposition sources may contribute more to the PCDD/Fs’ intake of fish in the studied sea area.

1. Introduction

Rather than produced intentionally, PCDD/Fs are minor impurities found in several chlorinated chemicals. Historically, the largest emission source categories in Europe are the incineration of municipal, hospital, and hazardous waste and sewage sludge. The originating of PCDD/Fs in incineration processes is clarified in new reports and also the methods to reduce the formation of PCDD/Fs are investigated [1,2]. The second largest are combustion sources. The third largest are industrial sources, like iron ore sintering which these days is believed to be the most important single emission source type [3], with the fourth largest being reservoir sources, or accidental and miscellaneous sources [4,5,6,7]. According to official emissions reports to the European Monitoring and Evaluating Programme (EMEP), the main emission sectors in Finland are combustion in power plants and industry, industrial processes, transport, commercial and residential combustion, and other stationary combustion [8,9]. At the global level, the initial distribution of dioxin emissions suggested several areas of likely high local dioxin production due to higher levels of economic activity [10].
PCBs have mainly been used by the power industry in electrical transformers, capacitors and hydraulic equipment, and as lubricants. PCBs have also been added to many products used directly by industry, such as adhesives, waxes, and links [11]. Since the mid-1970s, PCBs have been removed from active use in most countries. Dioxin-like PCBs usually constitute a small fraction of PCB mixtures. Dioxin-like PCB sources include the use and disposal of industrial PCB products or by-products of municipal solid waste incineration [12].
PCDD/Fs are either absorbed in particulate matter or present in the vapor phase. PCDD/Fs can also undergo association with aerosols as they are transported in the air [13,14]. Highly chlorinated dioxin/furans dominate the particle phase, while lower chlorinated dioxin/furans dominate the gas phase [15,16]. Dioxins’ atmospheric travel distance depends on their gas/particle partitioning and particle size distribution for particulate dioxins and furans and the deposition characteristics of the gaseous and particulate PCDD/Fs congeners [17]. Atmospheric deposition depends on precipitation, atmospheric turbulence, and the height of the emission and deposition surface type [16]. It has been reported that about 76% of the total deposition of PCDD/Fs (WHO-TEQ) to the Great Lakes is absorbed into organic matter in aerosols. More than 92% of all the deposition is particulate phase wet deposition and only 5%–8% is particle phase dry deposition [18]. Wet particle deposition was reported to contribute 30%–90% of the total deposition in different congeners with mass balance modelling [19].
In the EMEP region, using the modelled emission data of PCDD/Fs, significant levels in deposition can be seen mainly in Eastern Europe [20]. According to measured atmospheric particle-bound and gaseous PCDD/Fs concentrations in the air in southern Sweden, the highest levels were found in air that had passed over the European continent. In air that had passed over the British Isles and air from northerly directions, the concentrations were low [14].
Studying the surface snow in Antarctica, only 1,2,3,4,6,7,8-HpCDD and OCDD were detected among 17 priority PCDD/Fs in two samples [21]. However, a few results were published in the Nordic countries [14,22,23,24,25]. In addition, few results have been published with regard to long-term monitoring and all toxic dioxins and PCBs. In this study, we summarize the monitoring results of PCDD/F and PCB concentrations in depositions in Finland between 1998 and 2008. We also calculate the bulk deposition as WHO-TEQ pg·m−2·day−1, compare our results with other studies and make rough estimates for the northern Baltic Sea.

2. Material and Methods

2.1. Sampling

Monthly bulk deposition was collected at three stations during the snow-free period (May–November/December) at Evo (1998–2008), Utö (2002–2004), and Pallas (2006–2008) (Figure 1). Additional snow samples were collected in Evo from the total snowpack gathered during late winter in March 2003 and 2004, and a sampling also in winter recently fallen snow at Evo was carried out in 2006–2008. Evo is located about 100 km inland from the coast of the Gulf of Finland, with a distance of some 40–60 km from the nearest large urban areas. The Evo region is a mostly forested and agricultural area. Pallas is situated in the subarctic region of northern Finland, with a small urban area 35 km away. The nearest larger urban areas are situated 100 km and 200 km away, respectively. Utö is a small island some 70 km off the south-west coast near the open Baltic Proper. The distance between the southernmost and northernmost stations is some 1000 km.

2.2. Sample Extraction and Clean-up

The bulk deposition (wet deposition and dry particles) sampling was performed with two glass funnels (30 cm in diameter), which were installed 120 cm above the ground in an open place in a forest (Evo, Pallas) and on open bedrock in Utö. The samples were collected through funnels into 5-liter glass (Pyrex) bottles using a PTFE tube (14 mm). The bottles were buried in the ground and covered with a ten-centimeter-thick styrox plate to avoid photodegradation and heating of the sun. To avoid evaporation, 100 mL of dichloro-methane (Merck n:o 6054) and 100 mL of deionized water (purity class = 1, conductivity <0.005 mS·m−1) were added to the bottles prior to sampling. The sampling period ranged between 4 and 5 weeks. Before the start of each sampling period, the bottles, funnels and tubes were carefully washed with ethyl alcohol and deionized water. The method used was a bulk sampler modified by DMU, the National Environmental Research Institute, Denmark [26]. Bulk deposition sampling methods have been widely used in several studies [27,28,29,30,31,32].
The intercomparisons and quality control of sampling methods for deposition measurements of organic compounds had been evaluated in a joint project under the Nordic Council of Ministers [33].
The retrospective snow samples in 2003 and 2004 were taken using polyvinyl tubes, which were (diameter 10 cm and length 50 cm) by placing them through the snowpack. Any collection of vegetation or litter was carefully avoided. The wintertime deposition was collected with a bulk sampler with a surface area of 0.8 m2 connected with a PTFE-coated funnel to a Teflon bottle and melted after one month’s collection in a clean room. Sampling in bottles and washing procedures were equal to that in wet and dry sampling.

2.3. Instrumental Analyses

For the PCDD/Fs and PCBs analyses, the water samples were extracted with hexane and sodium chloride in glass funnels. Extracts were dried with activated Na2SO4 before fractionation and purification. The extracts were fractionated and purified by eluting them through three columns consisting of (1) sodium sulphate and silica gel; (2) activated carbon and Celite; and (3) aluminium oxide. The quantification of PCDD/Fs and cPCBs was achieved by measuring the native compounds and 13C-labeled internal standards using high-resolution gas chromatography-mass spectrometry (VG70SE or Autospec Ultima; Micromass, Manchester, UK).

2.4. Calculations

The PCDD/F concentrations in bulk deposition (pg·L−1) and the amount of deposition for a day (pg·m−2·day−1) or a year (ng·m−2·year−1) were calculated. We used the PCDD/Fs and cPCBs analyses results from Evo in linear regression equations between different congeners to predict numerical results for the congeners with analytical results below LOQ. The best possible surrogates of these congeners were calculated using Pearson correlation, 16 PCDD/F congeners or homolog concentrations, and 21 cPCBs equations were used to predict 24 PCDD/Fs congeners and 33 cPCB congeners together in all the study areas (Figure 2). The model was verified by the analysis results from the same congeners that were modelled. The percentages of the predicted results were calculated from these analyses results. In addition, with the calculation of WHO-TEQ [34], values were used equally. In Utö the amount of PCBs under the LOQ was 112 from 120 analyses and 93 from 105 analyses, respectively, and these results were not used. In calculations for the annual deposition amount, missing concentration values were replaced by the mean of the year and the precipitation of the actual month was used.
We evaluated the possible temporal trends in Evo by using the Visual Basic program for multivariate Mann-Kendall tests of monotone trends in time series of data grouped by sites, plots, and seasons, developed by Anders Grimvall at the Swedish University of Agricultural Sciences. The reason for choosing this program was its sensitivity to regression. Because of the sample collection system, generally only one result for one month was available. In case more data existed, mean values were used. We used the pg·L−1 and pg·m−2·day−1 results for all toxic and sum values of PCDD/Fs (17 and 8, respectively) and non-ortho PCBs [35]. In total, 58 trends were calculated (Supplementary Materials Table S1).

3. Results

3.1. PCDD/F and PCB Concentrations and Congener Profiles

The highest concentrations of PCDDs and PCDFs were measured in Evo (mean of the sum of all congeners 4.12 pg·L−1 and 3.11 pg·L−1 respectively) and the lowest in Pallas (1.61 pg·L−1 and 0.65 pg·L−1) (Table 1). OCDD was clearly dominant from all PCDDs in all areas followed by 1,2,3,4,6,7,8-HpCDD. OCDF and 1,2,3,4,6,7,8-HpCDF dominated the furans and less variation between different congeners was evident. The congener pattern varied between sites. While sum PCDDs and PCDFs were almost equal in the two southern stations, PCDDs dominated over PCDFs in Pallas, the northernmost station.
In the sum concentrations of PCBs, there was no clear difference between the sites. The sum concentrations of mono-ortho PCBs and indic7 PCBs in Pallas and Evo were about 10 times and 100 times as big, respectively, than the amount of non-ortho PCBs. In any case, PCB 77 was clearly dominant in all areas in non-ortho PCBs.

3.2. PCDD/F and cPCB Deposition

The deposition of PCDD/Fs in Pallas was mainly less than 0.4 pg·m−2·day−1 WHO-TEQ and less than 1.0 pg·m−2·day−1 WHO-TEQ and 0.5 pg·m−2·day−1 WHO-TEQ in Evo and Utö, respectively. The deposition of cPCBs was between 0.01 and 0.1 pg·m−2·day−1 WHO-TEQ. Similarly to concentrations, the deposition of PCDD/Fs was highest in Evo, clearly lower in Utö and lowest in Pallas. For PCB no clear difference was found between the sites (Table 2 and Table 3). There were two exceptionally high PCDD/F deposition rates in Evo (12 and 10 pg·m−2·day−1) in October 1999 and August 2000 which strongly affected the mean deposition rates for these years. Both these peaks were mainly caused by congener 1,2,3,7,8-PeCDD. The highest fluxes were generally recorded during autumn (Figure 3).

4. Discussion

4.1. Bulk Deposition Rates

We measured the highest deposition rates of PCDD/Fs in Evo station; the mean was 1.0 pg·m−2·day−1 WHO-TEQ for the whole period and 0.5 pg·m−2·day−1 for 2002–2008, i.e., the timescale comparable with other stations. These were considerably more compared to Utö station in the northern Baltic Proper (0.28 pg·m−2·day−1) and in Pallas station in northern Finland (0.13 pg·m−2·day−1). This may indicate a major role of Finnish domestic emissions to the deposition of PCDD/Fs in Evo. The Evo site is situated relatively close to population centers and some 100 km inland from the Gulf of Finland and the metropolitan area of Helsinki with some 1 million inhabitants, and smaller urban and industrial activity and residual wood and hazardous waste burning is located even closer. About 52% of the calculated and approximated dioxins emissions in Finland are due to energy production, with traffic, agriculture, and waste management accounting for about 24%, 19%, and 5% of the emissions respectively. The prevailing wind directions from between the south-west (SW) and north (N) during episodes of high deposition (Table 3 and Figure 3) (October 1999, August 2000, October 2003, and November 2006) in Evo further point to domestic sources in this site. At times of low deposition, the prevailing winds were almost from the opposite direction. If PCDD/Fs mostly originated from emissions in Central Europe or Eastern Europe, as suggested in the case of Aspvreten station in Sweden [14,31,48], we would have expected higher or equal concentration and deposition in Utö station than in Evo. However, Utö only showed a higher deposition rate than Evo in 2002, but clearly lower in 2003 and 2004 (Table 3).
Our results on deposition fluxes in Evo are in line but somewhat lower than those measured in rural areas in Sweden [23,31]. In Denmark the PCDD/Fs levels in urban areas have been slightly higher [24,25]. In rural and urban areas in Central Europe and the UK, depositions that were more than 10 times higher were measured, and in southern Europe there were higher depositions of up to two orders of magnitude. Logically, the northernmost station of Pallas exhibited the lowest concentrations and deposition rates for PCDD/Fs, which were in general comparable to those in the arctic environment in Canada (0.01–0.15 pg·m−2·day−1 WHO-TEQ) [47] with only a few exceptions (Table 2). There are few publications that are concerned with the amount of coplanar PCBs in deposition. In Sweden, the amount of coplanar PCBs was at the same level as this study [23], whereas clearly elevated deposition fluxes for dioxin-like PCBs were measured in urban areas in Japan [44].

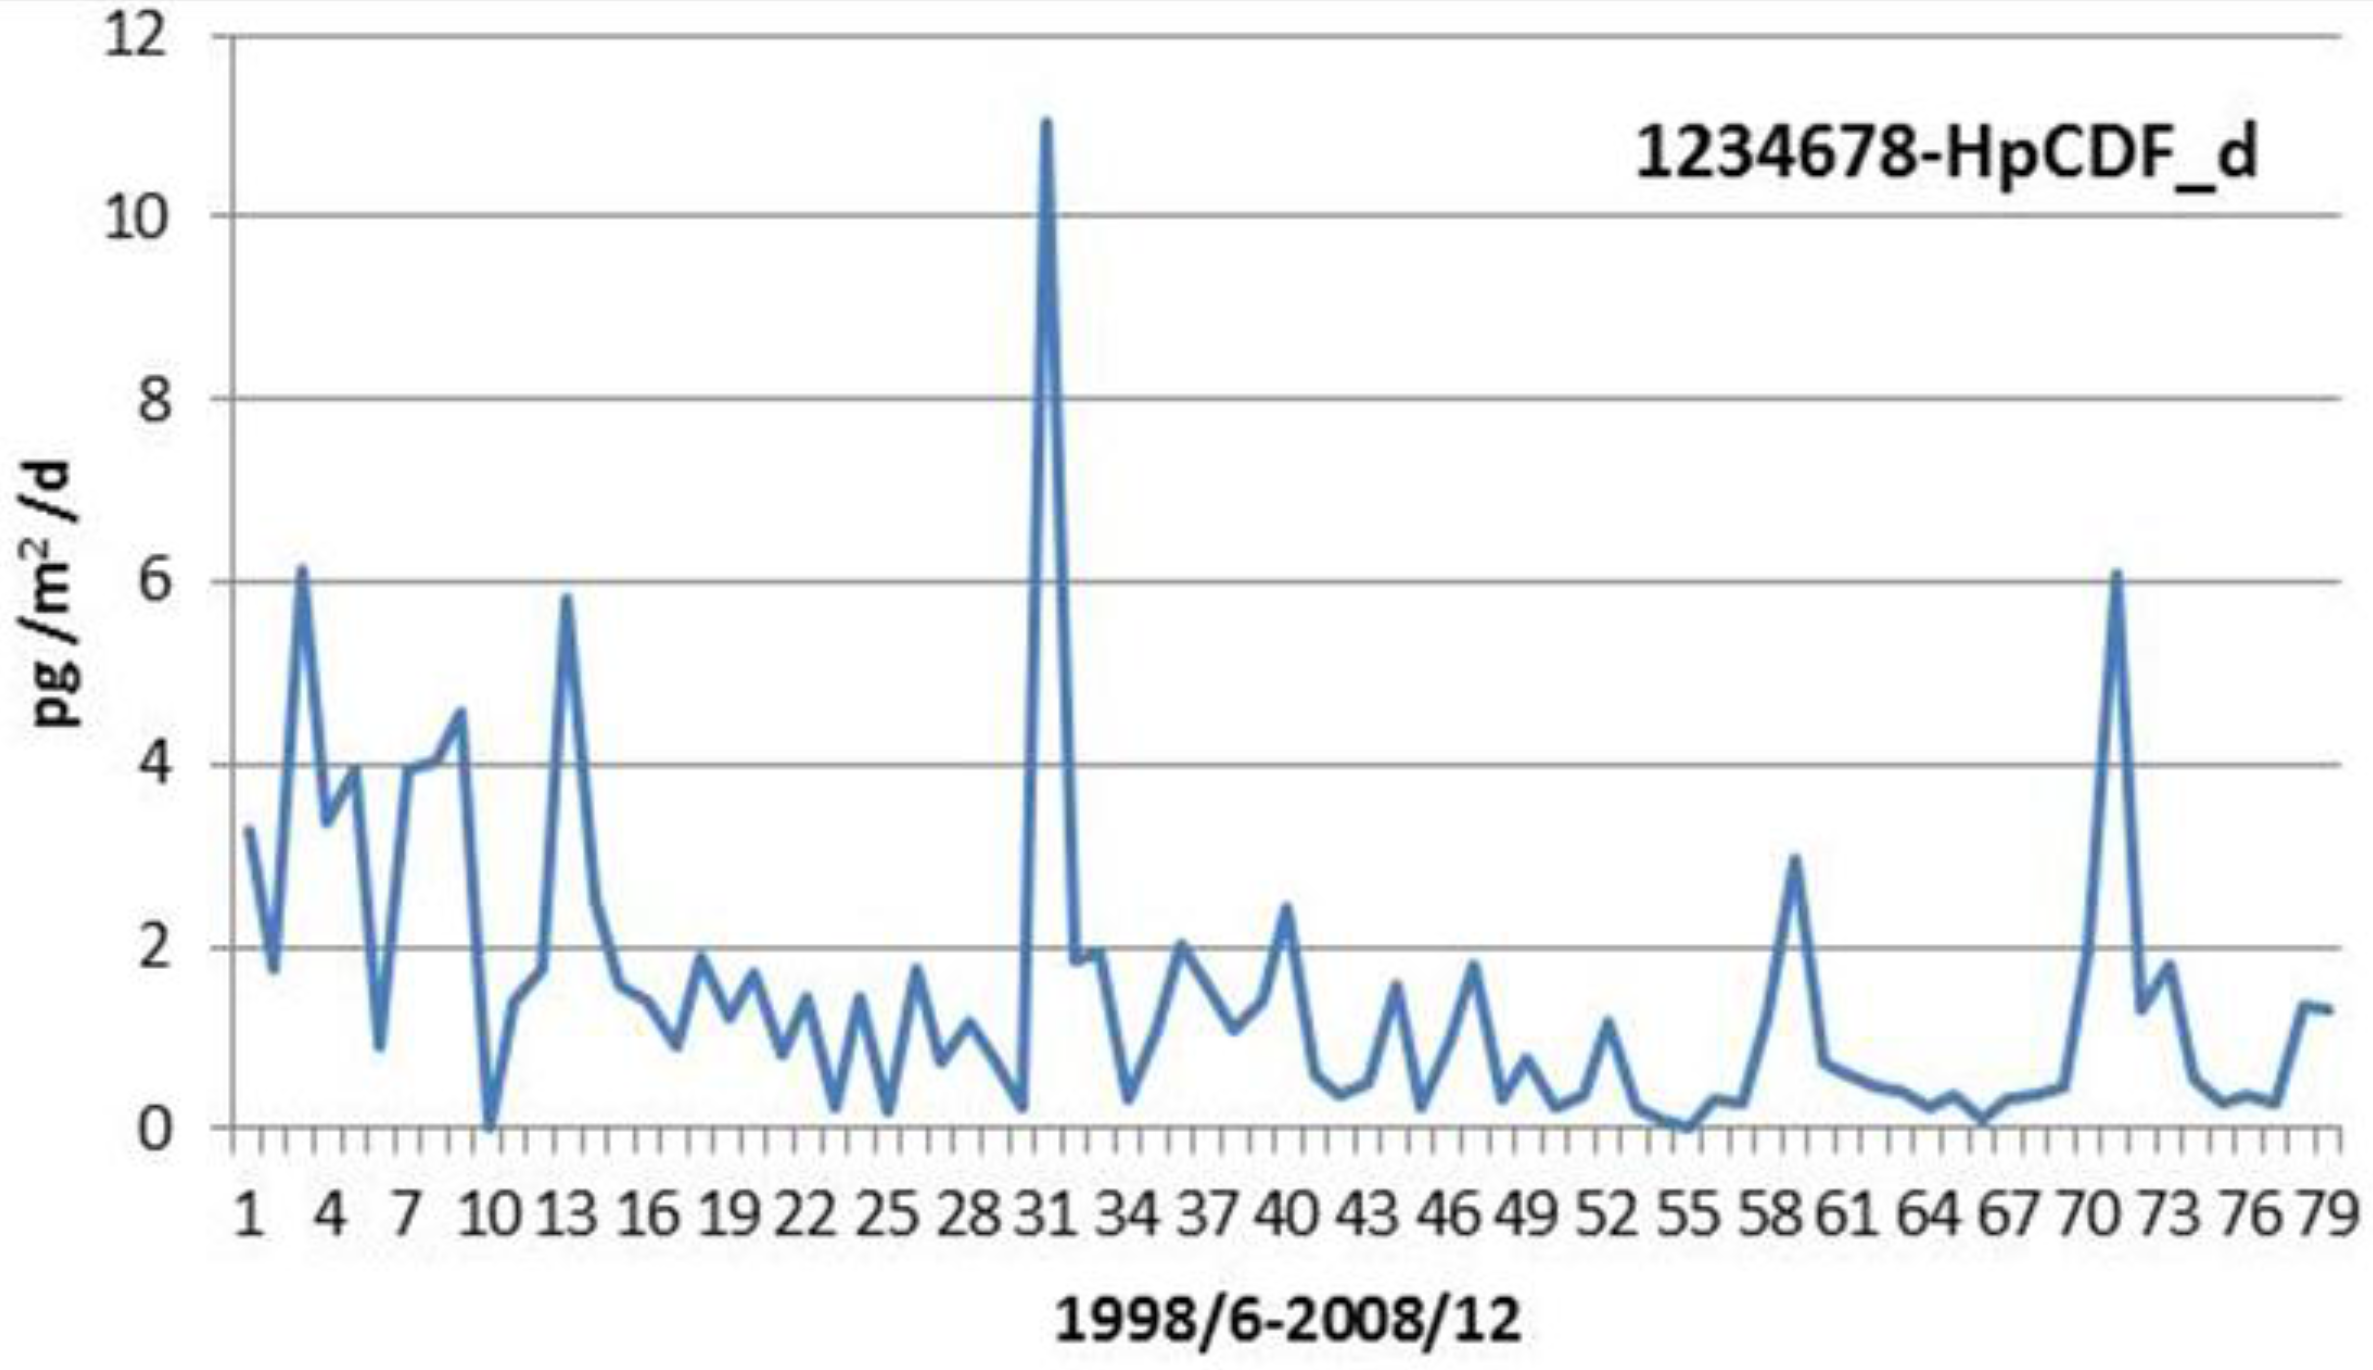
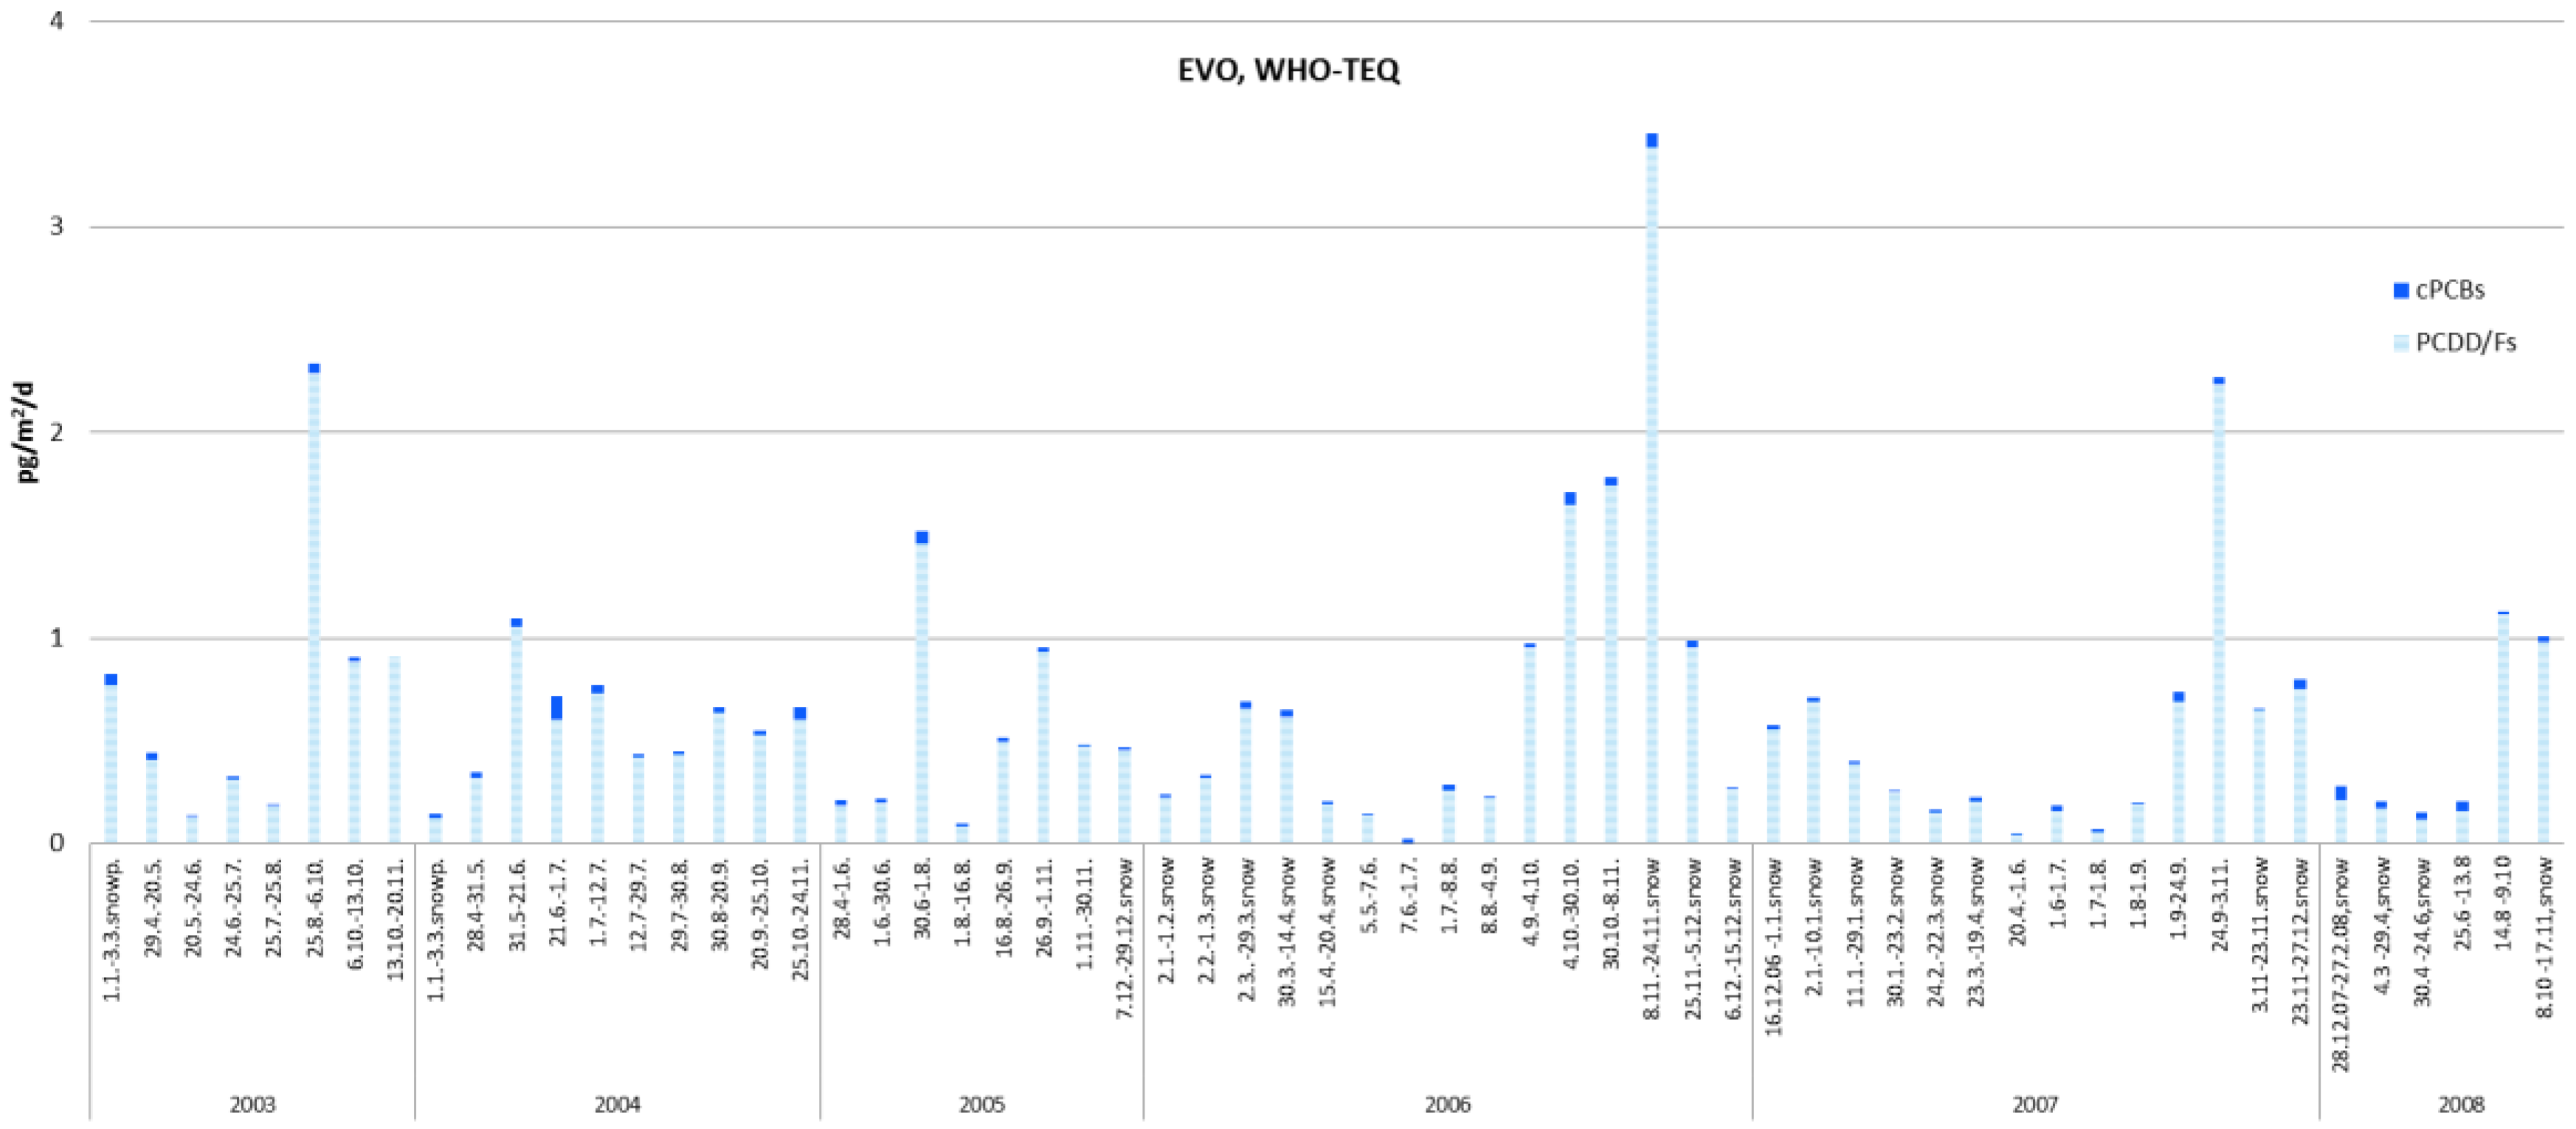
4.2. Temporal Trends

In Evo station, the highest mean deposition rates were measured during the first three years (1998–2000) and were followed by a more or less stable deposition level. Since there were only a few analyses from the winter period before 2002, the mean deposition during this period is probably underestimated. Also in the other stations, with notably lower concentrations and deposition, the highest deposition rates were from the first year of the three years of monitoring. The monthly minimum deposition rates decreased in all stations, as did the maximum deposition rates in Utö and Pallas, with the latter being at very low arctic levels in 2008 (Table 3). Although we only have three years of monitoring from two of the stations, these observations indicate a general and spatially broad decrease in deposition. The temporal trend in deposition in Evo station may be more affected by regional emissions than other stations as discussed earlier.
There were ten significantly (p-value < 0.005) and five almost significantly (0.008 > p > 0.006) decreasing trends in different congeners in Evo station (Figure 2). These were mostly highly chlorinated octa-, hepta-, and hexahomologs. Both concentrations and deposition rates were decreasing with congeners 1,2,3,4,7,8-HxCDD, sum HxCDDs, 1,2,3,4,6,7,8-HpCDD, sum HpCDDs, OCDD, 1,2,3,4,6,7,8-HpCDF, and sum HpCDFs. The congener 1,2,3,7,8-PeCDD showed decrease in concentration only. We did not find any significant change in PCDD/PCDF ratio over time, however. A decreasing trend in deposition is expected based on official emission estimates in EMEP countries and transport and deposition modelling. The emissions of PCDD/Fs were shown to decline in EMEP countries from 1990 to 2007 by almost 60 percent [8]. Later, however, official emission estimates have been questioned, with Gusev at al. (2011) suggesting that they may have been underestimated by as much as five times. Regardless of uncertainties in emission estimates, our data regarding a general decrease in deposition from the late 1990s to the late 2000s probably reflects a decrease in European and national emissions in general [49].

4.3. The Gulf of Finland and the Baltic Sea

The annual deposition rate of PCDD/Fs in Evo varied only slightly, between 0.11 and 0.22 ng·m−2·year−1 WHO-TEQ in 2002–2008, with data also from winter months and in the corresponding years of other stations. In Utö, deposition rates varied between 0.04 and 0.18 ng·m−2·year−1 and in Pallas between 0.04 and 0.15 ng·m−2·year−1 WHO-TEQ. For cPCBs the annual deposition in Pallas was 2–11 pg·m−2·year−1 WHO-TEQ, in Evo 6–17 pg·m−2·year−1 WHO-TEQ and in Utö 4–8 pg·m−2·year−1 WHO-TEQ. Based on official emission estimates, the modelled annual PCDD/F deposition ranged between 0.1 and 0.5 ng·m−2·year−1 TEQ in the Baltic countries and was higher in Central and Eastern Europe in the late 2000s [8,20]. The deposition profile of PCDD/Fs both in this region and worldwide is dominated by OCDD, followed by 1,2,3,4,6,7,8-HpCDD, OCDF and 1,2,3,4,6,7,8-HpCDF [22,31,44,50]. While the deposition of dioxins clearly seems to increase with increasing chlorination levels, this is not as obvious with furans [31].
The PCDD/Fs deposition in Utö, c. 0.1 ng·m−2·year−1 WHO-TEQ, is lower than in Aspvreten, 0.4 ng·m−2·year−1 WHO-TEQ [51]. Estimates of atmospheric deposition of PCDD/Fs vary by 30% due to sampling and pretreatment (elution) methods [32]. The placement, geometry, and other properties of sampling equipment may potentially cause still greater variation. The temporal coverage of sampling, moreover, can play a significant role. In addition to time trends, there are geographical trends [52]. In summary, estimates for the atmospheric deposition of PCDD/Fs in the Baltic Sea area vary by an order of magnitude for reasons that are not clear. Estimates may, to a considerable degree, be related to sampling and measurement methodology in addition to real trends and gradients. In the Bartnicki et al. model output (2009), the atmospheric deposition of PCDD/Fs in the Baltic Sea area varies from 0.1 to 0.2 ng·m−2·year−1 WHO-TEQ in Denmark to <0.03–0.05 ng·m−2·year−1 WHO-TEQ in the northern reaches of the Gulf of Bothnia. The MSCE-POP model (Meteorological Synthesizing Centre—East Persistent Organic Pollutants) ([53] pollution data 2002) has calculated the deposition amounts of PCDD/Fs (µg I-TEQ km−2·year−1) for the sub-basins of the Baltic Sea. For the Gulf of Finland (GOF) sub-basin, 0.11 ng·m−2·year−1 TEQ was calculated for the deposition flux, which is of the same magnitude as the measured and partially estimated deposition values in Utö. The total deposition for the whole GOF sub-basin area (29, 600 km2) in this model calculation was 3.2 I-TEQ mg·year−1 and with the results of Utö 2.7 I-TEQ mg·year−1, which is quite close to the former figure.

4.4. Fish

We considered what kind of impact the PCDD/Fs deposition can have on the possible source of PCDD/Fs in fish. The main dioxin components in fatty fish in the Baltic (e.g., Baltic herring and Baltic salmon) are 2,3,4,7,8-PeCDF and also 1,2,3,7,8-PeCDD, 2,3,7,8-TCDD, and 2,3,7,8-TCDF [54,55]. The Kymi, a river with high levels of PCDD/Fs in sediments, up to 350,000 ng·kg−1 WHO-TEQ (dw), is considered to be the main contributor of dioxins to the GOF. The main component of the Kymi load is the impurity of Ky-5, a wood preservative with mainly 1,2,3,4,6,7,8-HpCDF and lesser amounts of other hexafurans [56,57]. The two main congeners in depositions in Utö, calculated as percentage values of WHO-TEQ, were 1,2,3,7,8-PeCDD (about 47%) and 2,3,4,7,8-PeCDF (about 10%) (Figure 4). These same congeners dominated in a congener-specific PCDD/Fs emission inventory when calculated, dominating the total TEQ composition [19]. The findings indicate that, regardless of the major importance of the Kymi to the dioxins in the Gulf of Finland, deposition sources may contribute more to the PCDD/Fs intake of fish in the studied sea area.

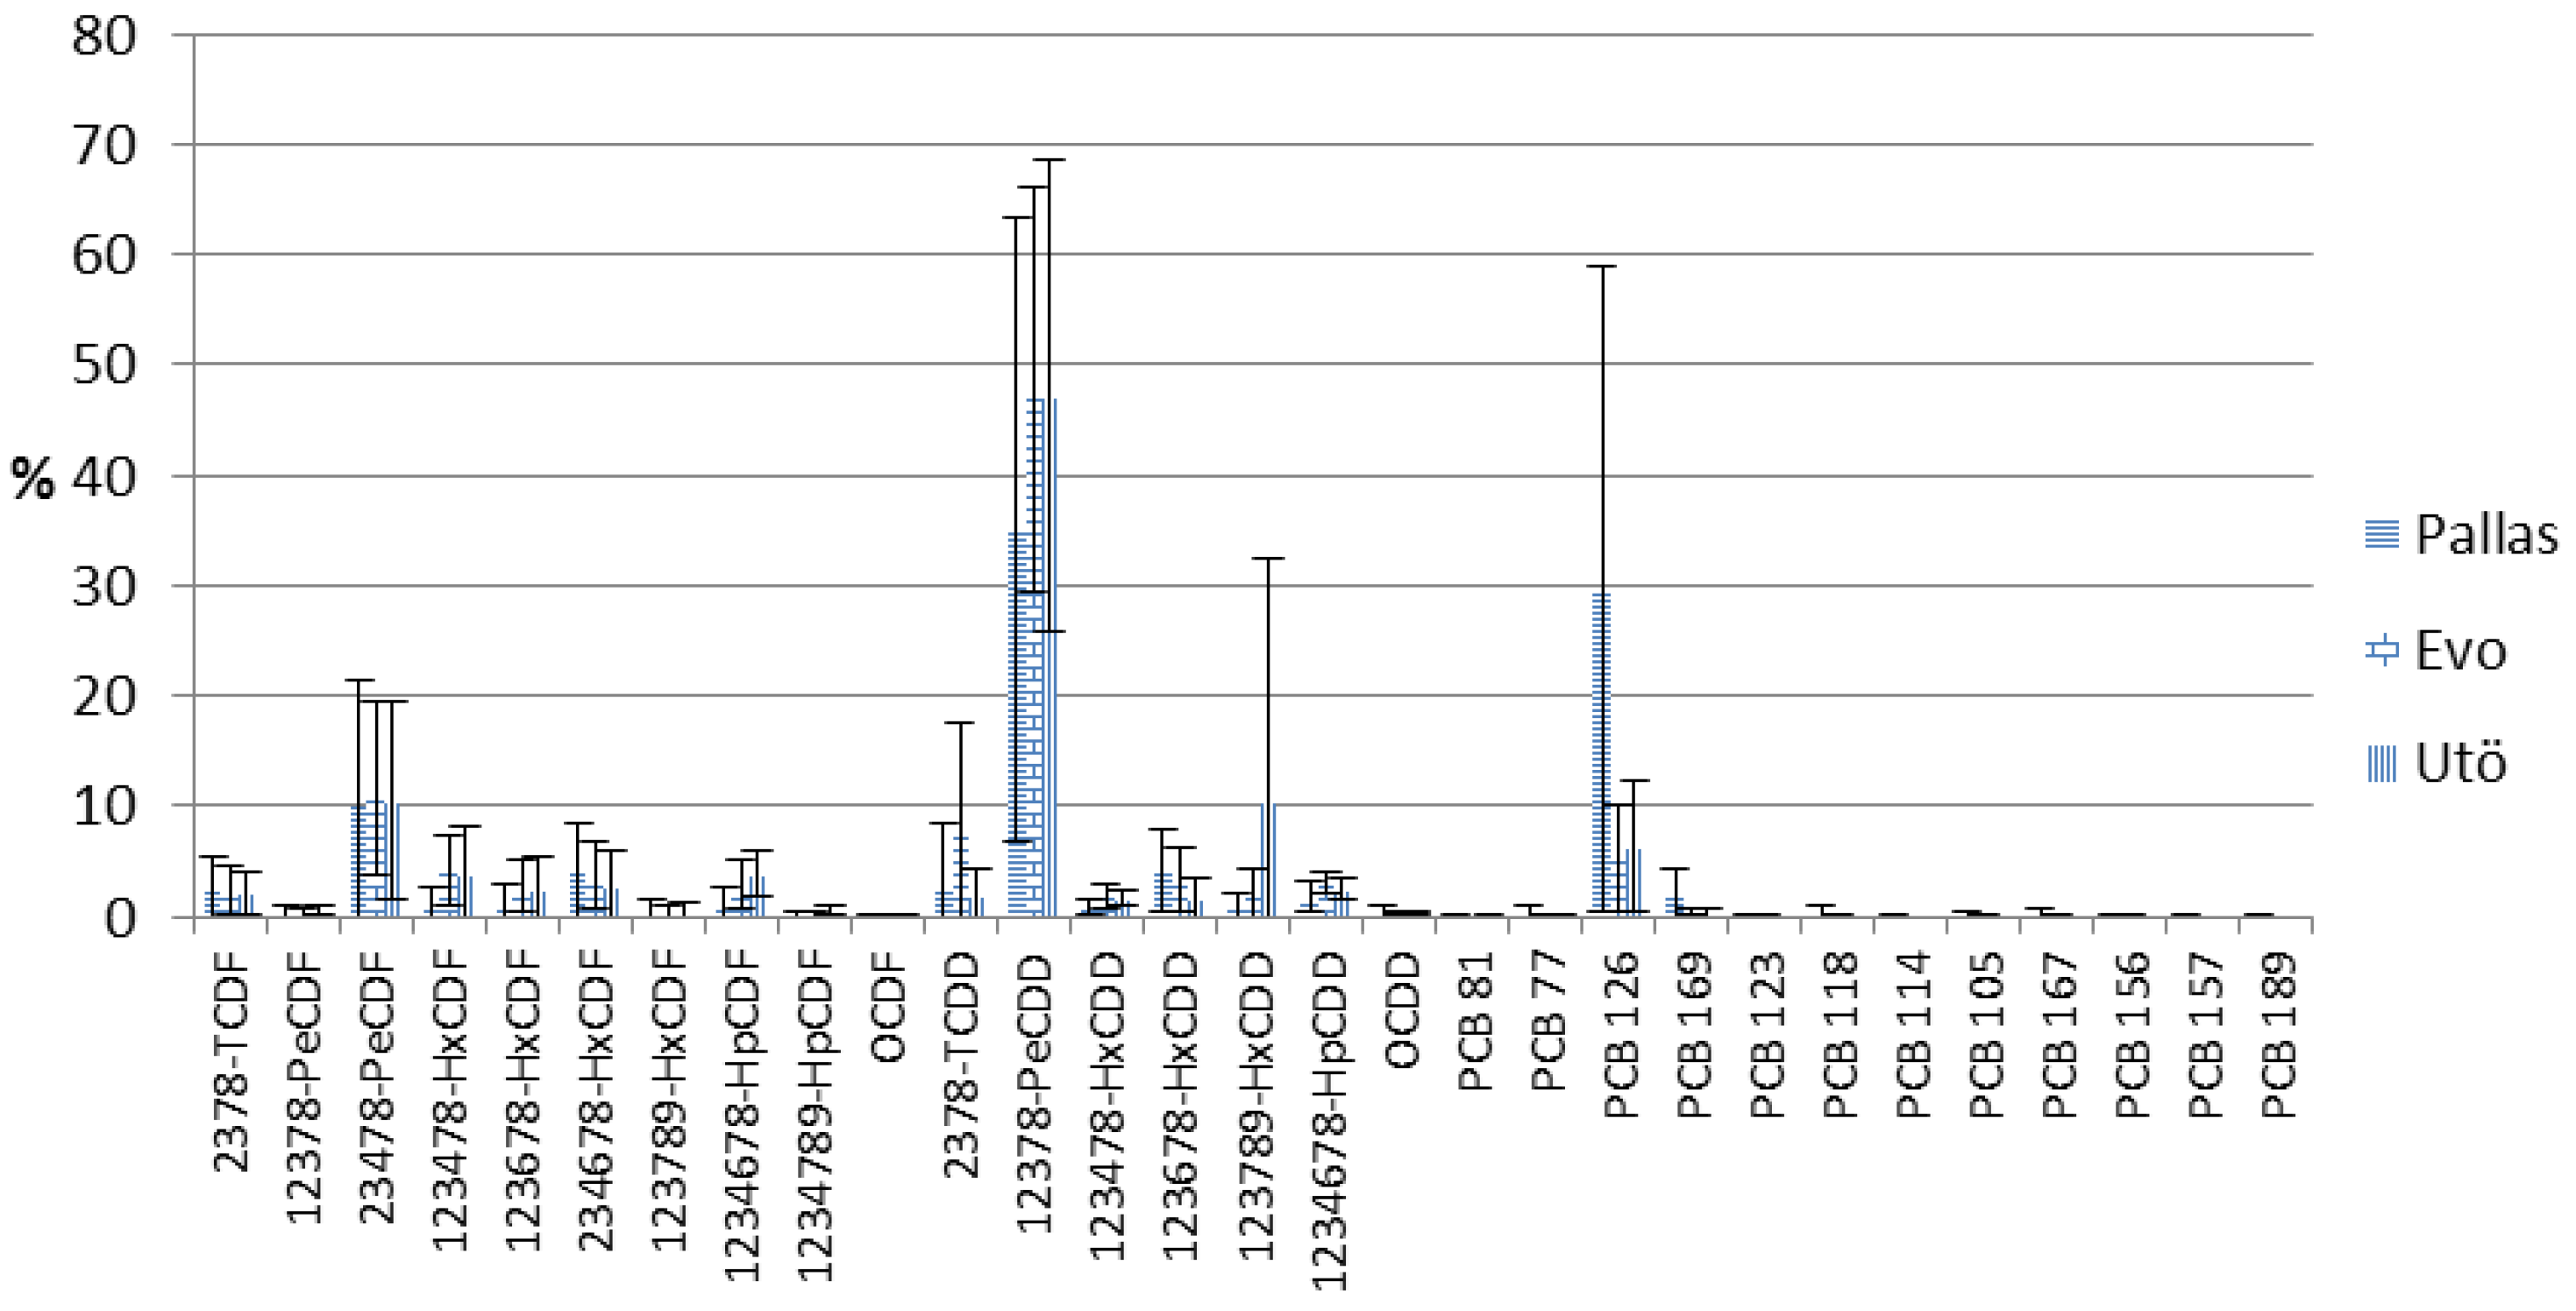
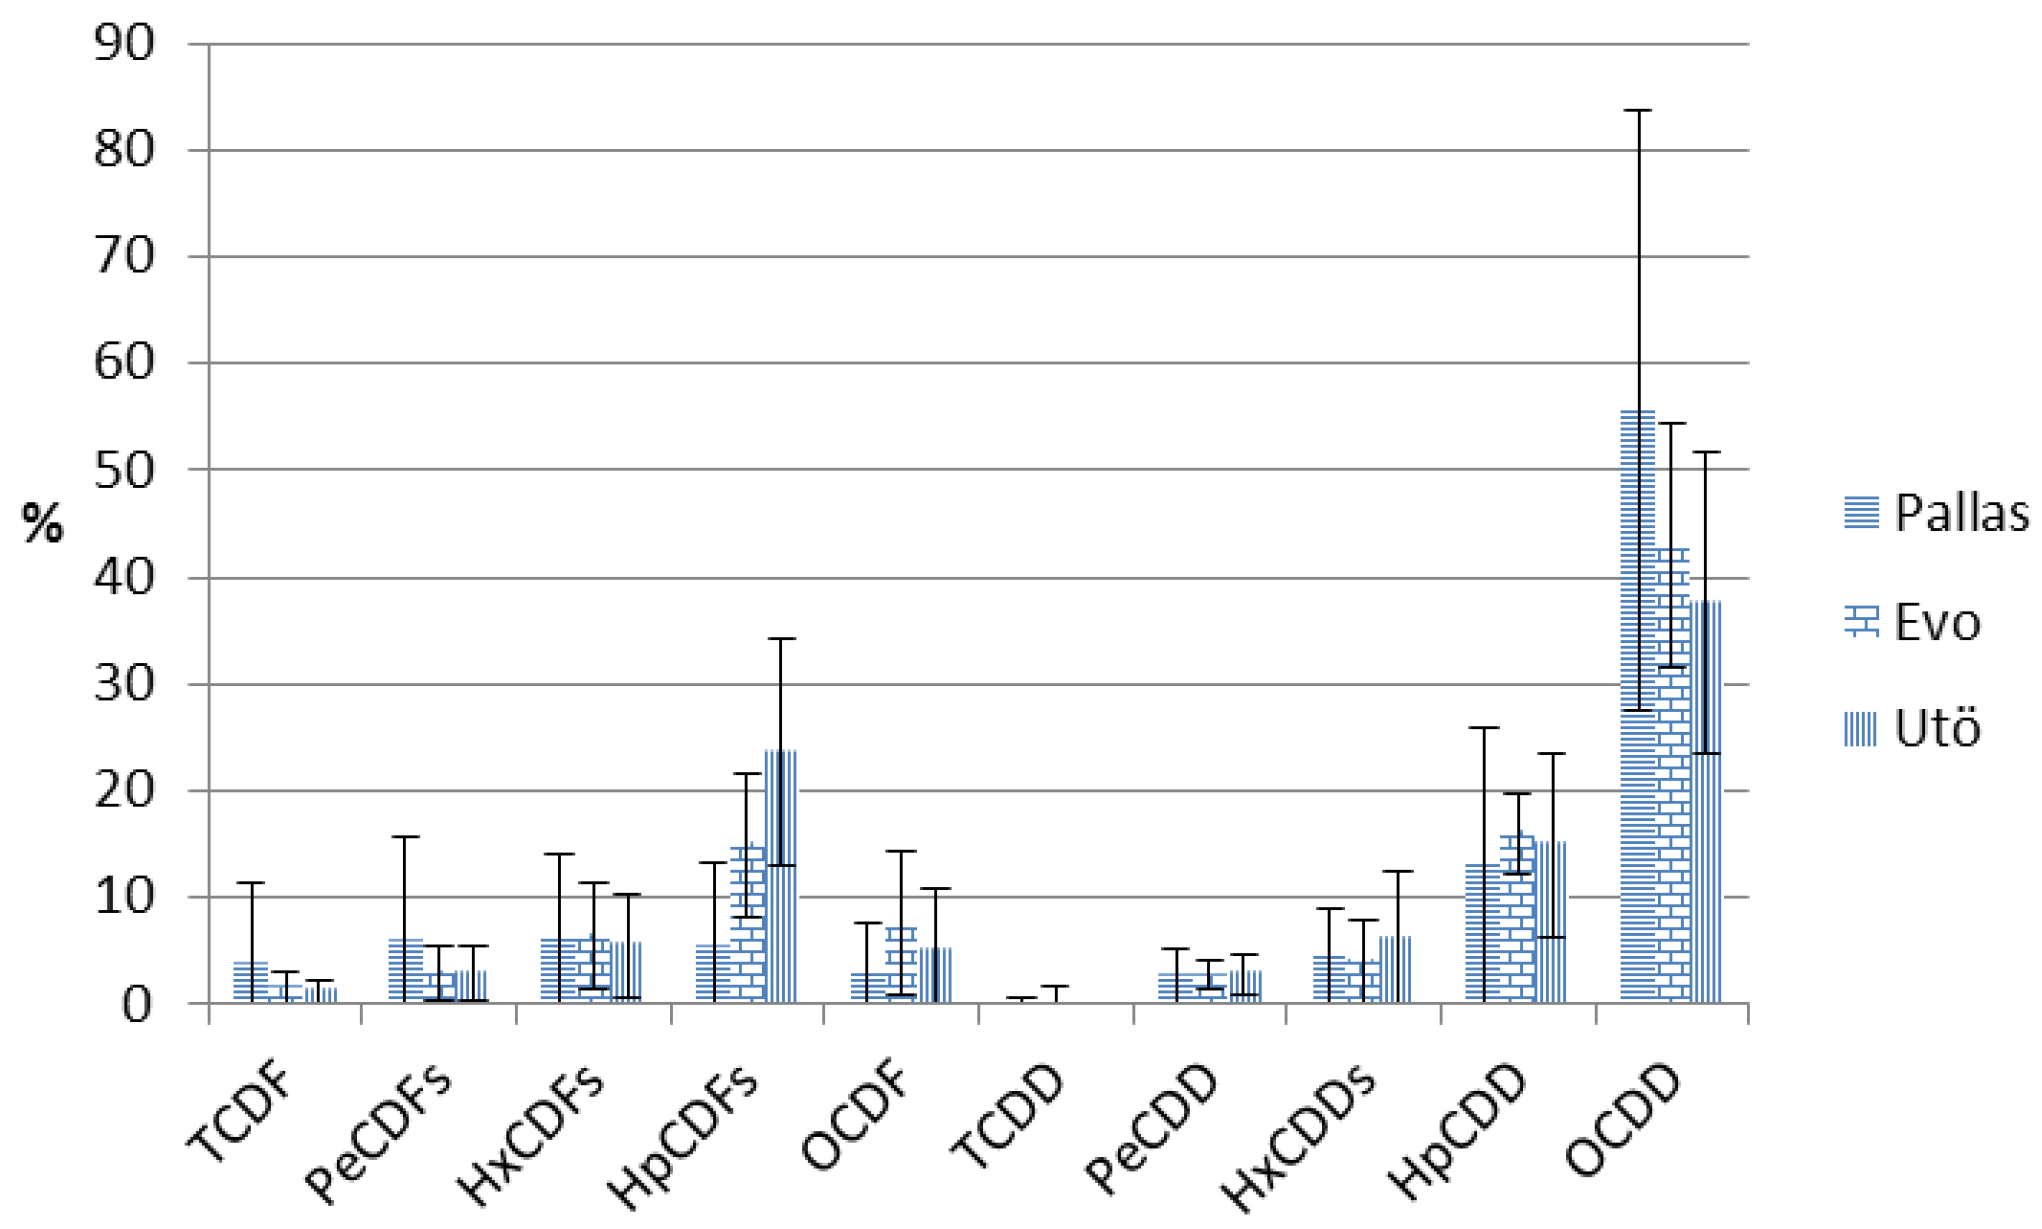
4.5. PCDD/F Congener Pattern and Congener Contribution to the WHO-TEQ

Congener patterns of PCDD (toxic congeners included) show increasing concentrations and percentages of the sum of congeners with increasing chlorination levels in all stations (Figure 5). In Pallas, the dioxin homolog OCDD was clearly the most dominant, representing 55% of all toxic congeners and ranging from 38% to 42% in Utö and Evo. A profile with a high relative concentration of OCDD has been considered to be representative for background or environmental sink air samples which have been subjected to different reactions in the air during transport [58,59]. Photolysis of PCDD/Fs favors the degradation of the lower chlorinated congeners, resulting in a higher proportion of the higher chlorinated isomers in the air transport masses [60]. The photochemical synthesis of OCDD from pentachlorophenol in condensed water could also be a significant source of OCDD to the environment [5]. Rather similar homolog patterns in the air, except near important local sources, has often been reported [17,61,62,63], although the individual congeners included in different groups are generally not well-documented.
On the TEQ basis the pattern is quite different. Congener 1,2,3,7,8-PeCDD dominated in Pallas, Evo, and Utö, being 35%, 48%, and 47% of the overall WHO-TEQ respectively, and followed by 2,3,4,7,8-PeCDF (about 10%) (Figure 4). The main congeners were the same as in the deposition in the Great Lakes [18]. The same congeners were dominating in deposition flux and air data reported mainly as I-TEQ in different continents, with only the share of congener 2,3,4,7,8-PeCDF being higher than 1,2,3,7,8-PeCDD, which could be influenced by the altered TEF factor [17,61,62,64]. Tetra- and penta-CDD/Fs together account for over 50% of the total WHO-TEQ. The same kind of results are also reported in literature (usually >50%) [41,63]. In this WHO-TEQ calculation, it should be noted that these congeners are often reported as close as or less than the LOG and then the TEQ is calculated with the assumption that the actual concentration is half the LOG, but in this paper we have calculated this below LOG results with linear regression equations. Using half of the LOG for lighter congeners (especially 2,3,7,8-TCDD) could result in overestimation of their real contribution [17]. The share of 126 PCB was high in Pallas, being 30% of the total WHO-TEQ, whereas in Evo and Utö it was less than 5%. The amount of 126 PCB calculated in pg/L (Table 1) was at the same level in all areas, while the percentage share of other congeners was bigger in Utö and Evo.

5. Conclusions

The findings indicate that, regardless of the major importance of Kymijoki to the dioxins in the Gulf of Finland, deposition sources may contribute more to the PCDD/Fs’ intake of fish in the studied sea area. Decreasing temporal PCDD/F deposition trends were observed for highly chlorinated octa-, hepta-, and hexacongeners.

Supplementary Materials

The following are available online at www.mdpi.com/2077-1312/4/3/56/s1.

Acknowledgments

We thank Pekka Vuori from Evo and Ahti Ovaskainen and Eveliina Pääkkölä from Pallas for helping us with the sample collection, and the Finnish Meteorological Institute for providing us with the meteorological data.

Author Contributions

Markku Korhonen: Study planning, sample collection, data handling, data calculations, paper writing, Simo Salo: Data handling, sample collection, Jussi Vuorenmaa: Data calculations, sample collection, Hannu Kiviranta and Päivi Ruokojärvi: Analyses, Matti Verta: Guiding, commenting.

Conflicts of Interest

There are not conflicts of interest.

References

  1. Fujimore, T.; Nakamura, M.; Takaoka, M.; Shiota, K.; Kitajima, Y. Synergetic inhibition of thermochemical formation of chlorinated aromatics by sulfur and nitrogen derived from thiourea: Multielement characterizations. J. Hazard. Mater. 2016, 311, 43–50. [Google Scholar] [CrossRef] [PubMed]
  2. Peng, Y.; Chen, J.; Lu, S.; Huang, J.; Zhang, M.; Buekens, A.; Li, X.; Yan, J. Chlorophenols in municipal solid waste incineration: A review. Chem. Eng. J. 2016, 292, 398–414. [Google Scholar] [CrossRef]
  3. Quass, U.; Ferman, M.; Bröker, G. The European dioxin air emission inventory. Chemosphere 2004, 54, 1319–1327. [Google Scholar] [CrossRef]
  4. Anderson, D.R.; Fisher, R. Sources of dioxins in the United Kingdom: The steel industry and other sources. Chemosphere 2002, 46, 371–381. [Google Scholar] [CrossRef]
  5. Baker, J.J.; Hites, A.R. Is combustion the major source of polychlorinated dibenzo-p-dioxins and dibenzofurans to the environment? A mass balance investication. Environ. Sci. Technol. 2000, 34, 2879–2886. [Google Scholar] [CrossRef]
  6. Kulkarni, P.; Crespo, J.; Afonco, C. Dioxins sources and current remediation technologies—A review. Environ. Int. 2008, 34, 139–153. [Google Scholar] [CrossRef] [PubMed]
  7. Wiberg, K.; McLachlan, M.; Jonsson, P.; Johansson, N.; Josefsson, S.; Knekta, E.; Persson, Y.; Sundqvist, K.; Armitage, J.; Broman, D.; et al. Sources, Transport, Reservoirs and Fate of Dioxins, PCBs and HCB in the Baltic Sea Environment; Naturvårdsverket Report 5912; Swedish Environmental Protection Agency: Stockholm, Sweden, 2009.
  8. Bartnicki, J.; Gusev, A.; Aas, W.; Valiyaveetil, S. Atmospheric Supply of Nitrogen, Lead, Cadmium, Mercury and Dioxines/Furans to the Baltic Sea in 2007; EMEP Centres Joint Report for HELCOM; Technical Report MSC/W2/2009; Norwegian Meteorological Institute: Oslo, Norway, 2009. [Google Scholar]
  9. Bartnicki, J.; Gusev, A.; Aas, W.; Valiyaveetil, S. Atmospheric Supply of Nitrogen, Lead, Cadmium, Mercury and Dioxines/Furans to the Baltic Sea in 2009; EMEP Centre Joint Report for HELCOM; Technical Report MSC/W2/2011; Norwegian Meteorological Institute: Oslo, Norway, February 2011. [Google Scholar]
  10. Booth, S.; Hui, J.; Alojado, Z.; Lam, V.; Cheung, W.; Zeller, D.; Steyn, D.; Pauly, D. Global deposition of airborne dioxin. Mar. Pollut. Bull. 2013, 75, 182–186. [Google Scholar] [CrossRef] [PubMed]
  11. Castro-Jimenez, J.; Mariani, G.; Eisenreich, S.J.; Christoph, E.H.; Hanke, G.; Canuti, E.; Skejo, H.; Umlauf, G. Atmospheric input of POPs into Lake Maggiore (Northern Italy): PCDD/F and dioxin-like PCB profiles and fluxes in the atmosphere and aquatic system. Chemosphere 2008, 73, S122–S130. [Google Scholar] [CrossRef] [PubMed]
  12. Sakai, S.I.; Hayakawa, K.; Takatsuki, H.; Kawakami, I. Dioxin-like PCBs released from waste incineration and their deposition flux. Environ. Sci. Technol. 2001, 35, 3601–3607. [Google Scholar] [CrossRef]
  13. Broman, D.; Näf, C.; Zebuhr, Y. Long-term high- and low-volume air sampling of polychlorinated dibenzo-p-dioxines and dibenzofurans and polycyclic aromatic hydrocarbons along a transect from urban to remote aeas on the swedish baltic coast. Environ. Sci. Technol. 1991, 25, 1841–1850. [Google Scholar] [CrossRef]
  14. Sellström, U.; Egeback, A.-L.; McLachlan, M.S. Identifying source regions for the atmospheric input of PCDD/Fs to the Baltic Sea. Atmos. Environ. 2009, 43, 1730–1736. [Google Scholar] [CrossRef]
  15. Gaus, C.; Brunskill, G.J.; Connel, D.W.; Prange, J.; Muller, J.F.; Päpke, O.; Weber, R. Transformation processes, pathways, and possible sources of distinctive polychlorinated dibenzo-p-dioxin signatures in sink environments. Environ. Sci. Technol. 2002, 36, 3542–3549. [Google Scholar] [CrossRef] [PubMed]
  16. Oh, E.-J.; Choi, J.; Chang, Y.-S. Gas/particle partitioning of polychlorinated dibenzo-p-dioxins and dibenzofurans in atmosphere; evaluation of predicting models. Atmos. Environ. 2001, 35, 4125–4134. [Google Scholar] [CrossRef]
  17. Lohmann, R.; Jones, K.C. Dioxins and furans in air and deposition: A review of levels, behaviour and processes. Sci. Total Environ. 1998, 219, 53–81. [Google Scholar] [CrossRef]
  18. Zhang, B.; Meng, F.; Shi, C.; Yang, F.; Wen, D.; Aronsson, J.; Gbor, P.K.; Sloan, J.J. Modeling the atmospheric transport and deposition of polychlorinated dibenzo-p-dioxins and dibenzofurans in North America. Atmos. Environ. 2009, 43, 2204–2212. [Google Scholar] [CrossRef]
  19. Alcock, R.E.; Sweetman, A.J.; Jones, K.C. A congener-specific PCDD/F emission inventory for the UK: Do current estimates account for the measured atmospheric burden? Chemosphere 2001, 43, 183–194. [Google Scholar] [CrossRef]
  20. Gusev, A.; Rozovskaya, O.; Shalatov, V.; Sokovyh, V.; Aas, W.; Breivik, K. Persistent Organic Pollutants in the Environment. EMEP Status Report 3/2009. Avaliable online: http://www.msceast.org/reports/3_2009.pdf (accessed on 24 August 2016).
  21. Vecchiato, M.; Argiriadis, E.; Zambon, S.; Barbante, C.; Toscano, G.; Gambano, A.; Piazza, R. Persistent Ogganic Pollutants (POPs) in Antarctica: Occurrence in contenental and coastal surface snow. Microchem. J. 2015, 119, 75–82. [Google Scholar] [CrossRef]
  22. Correa, O.; Raun, L.; Rifai, H.; Suarez, M.; Holsen, T.; Koenig, L. Depositional flux of polychlorinated dibenzo-p-dioxins and polychlorinated dibenzofurans in an urban setting. Chemosphere 2006, 64, 1550–1561. [Google Scholar] [CrossRef] [PubMed]
  23. Engwall, M.; Brunström, B.; Näf, C.; Hjelm, K. Levels of dioxin-like compounds in sewage sludge determined with a bioassay based on erod induction in chicken embryo liver cultures. Chemosphere 1999, 38, 2327–2343. [Google Scholar] [CrossRef]
  24. Oxbol, A.; Schleicher, O.; Fuglsang, K.; Jensen, A.A.; Borg-Jensen, K.; Schilling, B. Dioxin deposition around a danish municipal incinerator. Organohalog. Compd. 2002, 57, 369–372. [Google Scholar]
  25. Vikelsoe, J.; Hovmand, M.; Andersen, H.V. PCDD/F in deposition, spruce throughfall and air in Denmark. Organohalog. Compd. 2003, 61, 454–457. [Google Scholar]
  26. Korhonen, M.; Kiviranta, A.; Ketola, R. Bulkdeposition of PAHs, PCBs and HCBs in Finland in summer seasons 1993–1996. Toxicol. Environ. Chem. 1998, 66, 37–45. [Google Scholar] [CrossRef]
  27. Chi, K.H.; Liu, K.T.; Chang, S.H.; Chang, M.B. Atmospheric deposition of PCDD/Fs measured via automated and traditional samplers in Northern Taiwan. Chemosphere 2009, 77, 1184–1190. [Google Scholar] [CrossRef] [PubMed]
  28. Guerzoni, S.; Rossini, P.; Sarretta, A.; Raccanelli, S.; Ferrari, G.; Molinaroli, E. POPs in the lagoon of venice: Budgets and pathways. Chemosphere 2007, 67, 1776–1785. [Google Scholar] [CrossRef] [PubMed] [Green Version]
  29. Hortsmann, M.; McLachlan, M.S. Sampling bulk deposition of polychlorinated dibenzo-p-dioxins and dibenzofurans. Atmos. Environ. 1997, 31, 2977–2982. [Google Scholar]
  30. Horstmann, M.; McLachnan, M.S. Evidence of novel mechanism of semivolatine organic compound deposition in coniferous forest. Environ. Sci. Technol. 1996, 30, 1794–1796. [Google Scholar] [CrossRef]
  31. McLachlan, M.S.; Sellström, U. Precipitation scavenging of particle-bound contaminants—A case study of PCDD/Fs. Atmos. Environ. 2009, 43, 6084–6090. [Google Scholar] [CrossRef]
  32. Raccanelli, S.; Guerzoni, S.; Rossini, P.; Favotto, M. Monitoring POPs (PCDD/Fs, PCB, HCB, PAH, DDT) in atmospheric deposition: Sampling and analytical problems. Organohalog. Compd. 2002, 58, 49–52. [Google Scholar]
  33. Kiviranta, A.; Sandell, E.; Hilbert, G.; Poulsen, M.; Brorström-Lunden, E.; Braathen, O.; Oehme, M.; Larsson, P.; Bakke, C.; Ahsbrg, T.; et al. Intercomparison of Sampling Methods for Deposition Measurements of Persistent Organic Compounds; Joint project under the Nordic Council of Ministers, VTT/Kemiantekniikka (VTT.FI); Nordic Council of Ministers: Copenhagen, Denmark, 1993. [Google Scholar]
  34. Van den Berg, M.; Birnbaum, L.S.; Denison, M.; De Vito, M.; Farland, W.; Feeley, M.; Fiedler, H.; Hakansson, H.; Hanberg, A.; Haws, L.; et al. The 2005 world health organization reevaluation of human and mammalian toxic equivalence factors for dioxins and dioxin-like compounds. Toxicol. Sci. 2006, 93, 223–241. [Google Scholar] [CrossRef] [PubMed]
  35. Argiriadis, E.; Rada, E.C.; Vecchiato, M.; Zambon, S.; Ionescu, G.; Schiavon, M.; Ragazzi, M.; Gambaro, A. Assessing the influence of local sources on POPs in atmospheric depositions and sediments near Trento (Italy). Atmos. Environ. 2014, 98, 32–40. [Google Scholar] [CrossRef]
  36. Fiedler, H.; Rappolder, M.; Knetsch, G.; Basler, A. The German dioxin database: PCDD/PCDF concentrations in the environment—Spatial and temporal trends. Organohalog. Compd. 2002, 57, 37–40. [Google Scholar]
  37. Jensen, A.A. Inventories of sources of polychlorodioxins to the Baltic. In Proceedings of the NCM Workshop: Dioxins in Baltic Fish, Helsinki, Finland, 12–13 June 2003.
  38. Jones, C.K.; Duarte-Davidson, R. Transfewr of airborne PCDD/Fs to bulk deposition collectors and herbage. Environ. Sci. Technol. 1997, 31, 2937–2943. [Google Scholar] [CrossRef]
  39. Rossini, P.; Guerzoni, S.; Molinaroli, E.; Rampazzo, G.; de Lazzari, A.; Zancanaro, A. Atmospheric bulk deposition to the lagoon of Venice Part I. Fluxes of metals, nutrients and organic contaminants. Environm. Int. 2005, 31, 959–974. [Google Scholar] [CrossRef] [PubMed] [Green Version]
  40. Vassura, I.; Passarini, F.; Ferroni, L.; Bernardi, E.; Morselli, L. PCDD/Fs atmospheric deposition fluxes and soil contamination close to a municipal solid waste inginerator. Chemosphere 2011, 83, 1366–1373. [Google Scholar] [CrossRef] [PubMed]
  41. Bakoglu, M.; Karademir, A.; Durmusoglu, E. Evaluation of PCDD/F levels in ambient air and soils and estimation of deposition rates in Kocaeli, Turkey. Chemosphere 2005, 59, 1373–1385. [Google Scholar] [CrossRef] [PubMed]
  42. Moon, H.-B.; Lee, S.-J.; Choi, H.-G.; Ok, G. Atmospheric deposition of polychlorinated dibenzo-p-dioxins (PCDDs) and dibenzofurans (PCDFs) in urban and suburban areas of Korea. Chemosphere 2005, 58, 1525–1534. [Google Scholar] [CrossRef] [PubMed]
  43. Oka, H.; Kakimoto, H.; Miyata, Y.; Yonezawa, Y.; Niikawa, A.; Kyudoh, H.; Kizu, R.; Hayakawa, K. Atmospheric deposition of polychlorinated dibenzo-p-dioxins (PCDDs) and polychlorinated Dibenzofurans (PCDFs) in Kanazawa, Japan. J. Health Sci. 2006, 53, 33–307. [Google Scholar] [CrossRef]
  44. Ogura, I.; Masunaga, S.; Nakanishi, J. Atmospheric deposition of polychlorinated dibenzo-p-dioxins, polychlorinated dibenzofurans, and dioxin-like polychlorinated biphenyls in the Kanto Region, Japan. Chemosphere 2001, 44, 1473–1487. [Google Scholar] [CrossRef]
  45. Chi, K.H.; Luo, S.; Kao, S. J.; Lee, T.Y. Sources and deposition fluxes of PCDD/Fs in a high-mountain lake in central Taivan. Chemosphere 2013, 91, 150–156. [Google Scholar] [CrossRef] [PubMed]
  46. Fiedler, H.; Lau, C.; Cooper, K.; Andersson, R.; Hjelt, M.; Rappe, C.; Bonner, M.; Howell, F. PCDD/PCDF in Atmosphere of Southern Missisippi, USA. Organohalog. Compd. 1997, 33, 122–127. [Google Scholar]
  47. Muir, D.C.G.; de Wit, C.A.; Fisk, A.T. Levels and trends of persistent organic pollutants in the arctic environment. Organohalog. Compd. 2003, 6, 291–294. [Google Scholar]
  48. Shatalov, V.; Johansson, J.H.; Wiberg, K.; Cousins, I.T. Tracing the origin of dioxins in Baltic air using an atmospheric modeling approach. Atmos. Pollut. Res. 2012, 3, 408–416. [Google Scholar] [CrossRef]
  49. Gusev, A.; Dutchak, S.; Rozovskaya, O.; Shatalov, V.; Sokovykh, V.; Vulykh, N. Persistent Organic Pollutants in the Environment. EMEP Status Report 3/2011. Avaliable online: www.msceast.org (accessed on 29 August 2016).
  50. Hovmand, M.F.; Vikelsoe, J.; Andersen, H.V. Atmospheric bulk deposition of dioxin and furans to Danish background areas. Atmos. Environ. 2007, 41, 2400–2411. [Google Scholar] [CrossRef]
  51. Armitage, J.M.; McLachlan, M.S.; Wiberg, K.; Jonsson, P. A model assessment of polychlorinated dibenzo-p-dioxin and dibenzofuran sources and fate in the Baltic Sea. Sci. Total Environ. 2009, 407, 3789–3792. [Google Scholar] [CrossRef] [PubMed]
  52. Assmuth, T.; Jalonen, P. Risks and Management of Dioxin-Like Compounds in Baltic Sea Fish: An Integrated Assesment; Nordic Council of Ministers: Copenhagen, Denmark, 2005; Volume 568. [Google Scholar]
  53. Shatalov, V.; Fedyunin, M.; Mantseva, E.; Strukov, B.; Vulykh, N. Persistent Organic Pollutants in the Environment. EMEP Technical Report, 4/2003. Avaliable online: www.msceast.org (accessed on 29 August 2016).
  54. Adams, M. SCALE. Baseline Report on ‘Integrated Monitoring of Dioxins and PCBs in the Baltic Region’. Avaliable online: http://ec.europa.eu/environment/archives/health/pdf/dioxins.pdf (accessed on 24 August 2016).
  55. Kiviranta, H.; Vartiainen, T.; Parmanne, R.; Hallikainen, A.; Koistinen, J. PCDD/Fs and PCBs in Baltic herring during the 1990s. Chemosphere 2003, 50, 1201–1216. [Google Scholar] [CrossRef]
  56. Salo, S.; Verta, M.; Malve, O.; Korhonen, M.; Lehtoranta, J.; Kiviranta, H.; Isosaari, I.; Ruokojärvi, P.; Koistinen, J.; Vartiainen, T.; et al. Contamination of River Kymijoki sediments with polychlorinated dibenzo-p-dioxins, dibenzofurans and mercury and their transport to the Gulf of Finland in the Baltic Sea. Chemosphere 2008, 73, 1675–1683. [Google Scholar] [CrossRef] [PubMed]
  57. Verta, M.; Korhonen, M.; Lehtoranta, J.; Salo, S.; Vartiainen, T.; Kiviranta, H.; Kukkonen, J.; Hämäläinen, H.; Mikkelson, P.; Palm, H. Ecotoxicological and health effects caused by PCP=S, PCDE=S, PCDD=S, and PCDF=S in River Kymijoki Sediments, South-Eastern Finland. Organohalog. Compd. 1999, 43, 239. [Google Scholar]
  58. Tysklind, M.; Fängmark, I.; Marklund, S.; Lindskog, A.; Thaning, L.; Rappe, C. Atmospheric transport and transformation of polychlorinated dibenzo-p-dioxins and dibenzofurans. Environ. Sci. Technol. 1993, 27, 2190–2197. [Google Scholar] [CrossRef]
  59. Wagrowski, D.M.; Hites, R.A. Insights into the global distribution of polychlorinated dibenzo-p-dioxins and dibenzofurans. Environ. Sci. Technol. 2000, 34, 2952–2958. [Google Scholar] [CrossRef]
  60. Marklund, S.; Tysklind, M.; Andersson, R.; Ljung, K.; Rappe, C. Environmental deposition of PCDDs and PCDFs as determined by the analysis of Snow Samples from the Northern Sweden. Chemosphere 1991, 23, 1359–1364. [Google Scholar] [CrossRef]
  61. Hippelein, M.; Kaupp, H.; Dörr, G.; McLachlan, M.S.; Hutzinger, O. Baseline contamination assesment for a new resource recovery facility in Germany. Part II: Atmospheric concentrations of PCDD/F. Chemosphere 1996, 32, 1605–1616. [Google Scholar] [CrossRef]
  62. Lohmann, R.; Green, N.J.L.; Jones, K.C. Detailed studies of the factors controlling atmospheric PCDD/F concentrations. Environ. Sci. Technol. 1999, 33, 4440–4447. [Google Scholar] [CrossRef]
  63. Moon, H.B.; Lee, S.J.; Choi, H.G.; Kim, S.S.; Choi, M.K.; Lee, P.Y.; Ok, G. Atmospheric deposition of PCDDs, PCDFs and dioxin-like PCBs from urban and suburban areas of Korea. Organohalog. Compd. 2003, 61, 450–457. [Google Scholar]
  64. Shih, M.; Lee, W.-S.; Chang-Chien, G.-P.; Wang, L.-C.; Hung, C.-Y.; Lin, K.-C. Dry deposition of polychlorinated dibenzo-p-dioxins and dibenzofurans (PCDD/Fs) in ambient air. Chemosphere 2006, 62, 411–416. [Google Scholar] [CrossRef] [PubMed]
Figure 1. The map of Finland and the regions of Pallas, Evo, and Utö.
Jmse 04 00056 g001
Figure 2. Visual Basic program for multivariate Mann-Kendall tests of monotone trends in time series of data grouped by sites, plots, and seasons, to evaluate the possible trends using Evo results, was used and the trend of 1,2,3,4,6,7,8-HpCDF pg·m−2·day−1 are presented in these figures.
Jmse 04 00056 g002
Figure 3. The deposition sample results of PCDD/Fs and cPCBs (pg/m2/day) in Evo in years measured the whole year (snowp. = snowprofile and snow = recently fallen snow).
Jmse 04 00056 g003
Figure 4. PCDD/Fs and cPCBs congener contributions pg/L WHO-TEQ calculated as % from the sum of all congeners.
Jmse 04 00056 g004
Figure 5. PCDD/Fs (toxic congener) homolog groups pg/L calculated as % of the sum of all homologs.
Jmse 04 00056 g005
Table 1. Concentrations (mean and standard deviations, SD) of PCDD/Fs and PCBs (pg/L) in Pallas, Evo, and Utö.
CongenerPALLASEVOUTÖ
MeanSDMeanSDMeanSD
PCDDs
2378-TCDD0.020.030.040.040.010.01
12378-PeCDD0.060.080.180.440.080.08
123478-HxCDD0.010.020.060.090.040.05
123678-HxCDD0.050.050.240.690.180.16
123789-HxCDD0.040.030.230.480.090.08
1234678-HpCDD0.30.381.11.990.530.63
OCDD1.131.722.281.961.291.26
sum PCDDs1.612.34.125.72.232.28
PCDFs
2378-TCDF0.020.010.110.090.090.07
12378-PeCDF0.020.010.120.110.080.12
23478-PeCDF0.030.030.180.20.210.23
123478-HxCDF0.040.020.230.30.210.23
123678-HxCDF0.040.020.170.190.240.23
234678-HxCDF0.040.030.210.250.260.24
123789-HxCDF0.020.010.050.040.020.04
1234678-HpCDF0.160.110.770.860.680.87
1234789-HpCDF0.060.030.310.950.10.1
OCDF0.210.140.951.620.70.56
sumPCDFs0.650.423.114.622.572.69
non-ortho
PCB 810.090.120.10.10.10.05
PCB 772.272.911.581.611.770.82
PCB 1260.130.160.130.080.140.08
PCB 1690.020.010.040.030.050.03
sum non-ortho2.523.211.851.822.050.98
mono-ortho
PCB 1231.381.551.431.04
PCB 1187.024.898.975.21
PCB 1140.620.850.340.53
PCB 1052.641.873.631.93
PCB 1672.793.7821.82
PCB 1561.1612.191.79
PCB 1570.770.70.930.72
PCB 1890.921.041.020.87
sum mono-ortho17.315.6820.5113.92
indic 7
PCB 28/31102.83105.0262.5371.38
PCB 5223.8234.7326.0425.24
PCB 10131.1857.0532.1174.05
PCB 1187.024.898.975.21
PCB 15377.7999.5384.52108.33
PCB 13814.249.8550.9674.97
PCB 1807.293.8620.1733.31
sum indic 7264.18314.93285.3392.49
Table 2. The deposition of PCDD/Fs and cPCBs calculated as WHO-TEQ [34] (pg/m2/day) in some countries, rural (R)/urban (U) (Wallenhorst, Bakogly, Vikelsoe, and Chi I-TEQ).
LocationR/UPCDD/FscPCBsReferences
Finland/UtöR0.1–0.4<0.1–0.1This study
Finland/EvoR0.3–3.0<0.1–0.1This study
Finland/PallasR0.1–0.5<0.01–0.1This study
SwedenR0.05–0.7 [14]
SwedenR 0.1[23]
DenmarkU2.5–8 [25]
DenmarkU1.2–2.5 [24]
GermanyR3–15 [36]
GermanyU3–20 [37]
United KingdomR3–70 [38]
ItalyU20–160 [39]
ItalyU 2.9[11]
ItalyU0.75–3.73 [40]
ItalyR<0.01–1.5 [35]
TurkeyU21–182 [41]
South KoreaU3–10 [42]
JapanR<0.1–43 [43]
JapanU16–460.1–110[44]
JapanU 1.35[12]
TaiwanR0.61–3.0 [45]
United StatesR0.6–2.6 [46]
United StatesU1.5 [22]
CanadaR0.01–0.15 [47]
Table 3. Bulk deposition in different years (mean, SD = standard deviation) of PCDDs, PCDFs, non-ortho PCBs and mono-ortho PCBs WHO-TEQ pg/m2/day in Pallas, Evo, and Utö.
PCDDsPCDFsNon-Ortho PCBsMono-Ortho PCBs
MeanSDMeanSDMeanSDMeanSD
Pallas
20060.1940.2010.2190.1960.0060.0040.0010
20070.0680.1070.1050.1410.030.0290.0010.001
20080.0320.030.0480.0440.0350.0440.0010
mean0.098 0.124 0.024 0.001
Evo
19980.7490.1740.1930.04
19992.5344.6610.2870.331
20002.7184.0070.2350.2160.0640.015
20010.2920.1580.0910.080.0380.016
20020.2210.1050.1030.0990.0310.018
20030.4790.6560.1260.1190.0250.02
20040.3390.1770.1850.0930.0260.020.0010.002
20050.3550.3350.1560.1120.0220.0170.0010.001
20060.3930.4060.2990.3680.0240.0180.0010.001
20070.2330.1980.180.2810.0150.0110.0010
20080.2870.2380.1630.150.0340.0150.0010
mean0.782 0.183 0.031 0.001
Utö
20020.2730.2850.2480.320.0290.017
20030.0950.0920.0870.1010.0110.011
20040.0870.0610.0440.0450.010.009
mean0.152 0.126 0.017

