3.1. Choice of Chain
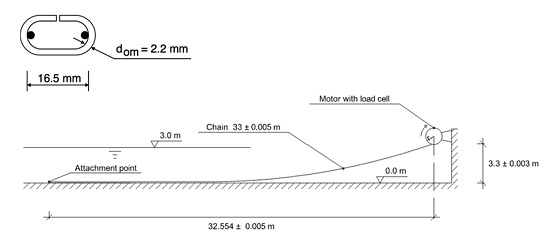
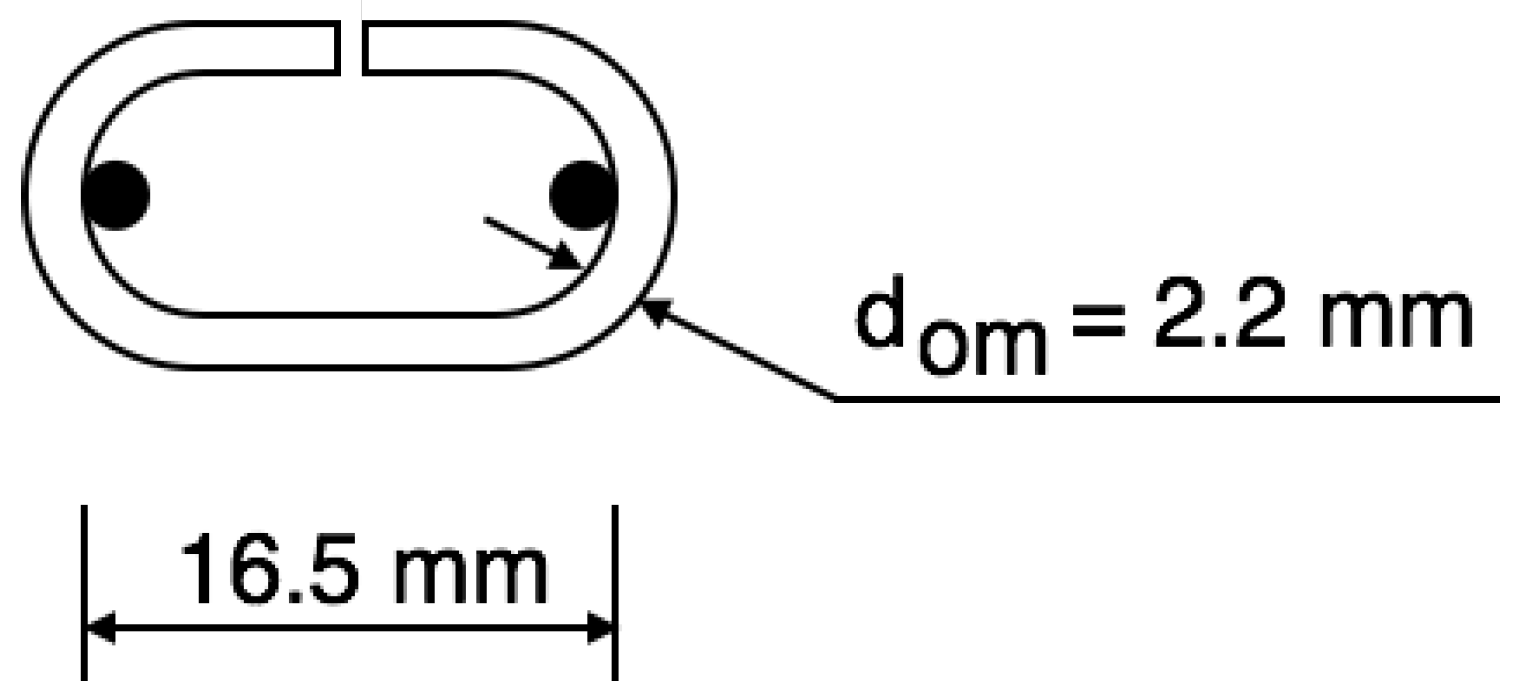
We chose a lacquered decoration chain with “open” links. “Open” means that the link loops were not welded after bending. The shape of the links is pictured in
Figure 2.
Figure 2.
The shape and dimensions of the chain links.
Figure 2.
The shape and dimensions of the chain links.
A few lengths of chain were tested in a tensile tester to get the relation between strain and pulling force. The relation was almost linear for a pulling force lower than 200 N. The stiffness of the chain was measured at Km = 10,000 ± 500 N, which is a low value caused by the links being open. Again, the index m denotes model values and the index p prototype values.
The mass of the chain per unit length was measured to γom = 0.0818 ± 0.0005 kg/m by weighing a long length of the chain. The longitudinal wave speed was then calculated as . The density was assumed to be 7800 kg/m3, neglecting the thin lacquer.
The link diameter of the model chain was
dom = 2.2 mm. A prototype chain in a mooring system can have a link diameter of
dop = 76 mm. Such a chain has the stiffness of
Km = 5.8 × 10
8 N [
29] and the mass γ
op = 126.5 kg/m [
29,
30] but the same density as the model chain, because both are made from steel. The longitudinal wave speed can then be calculated as
.
The two chains can be compared with respect to dynamic similarity. Through Equation (34) the length scale can be calculated as
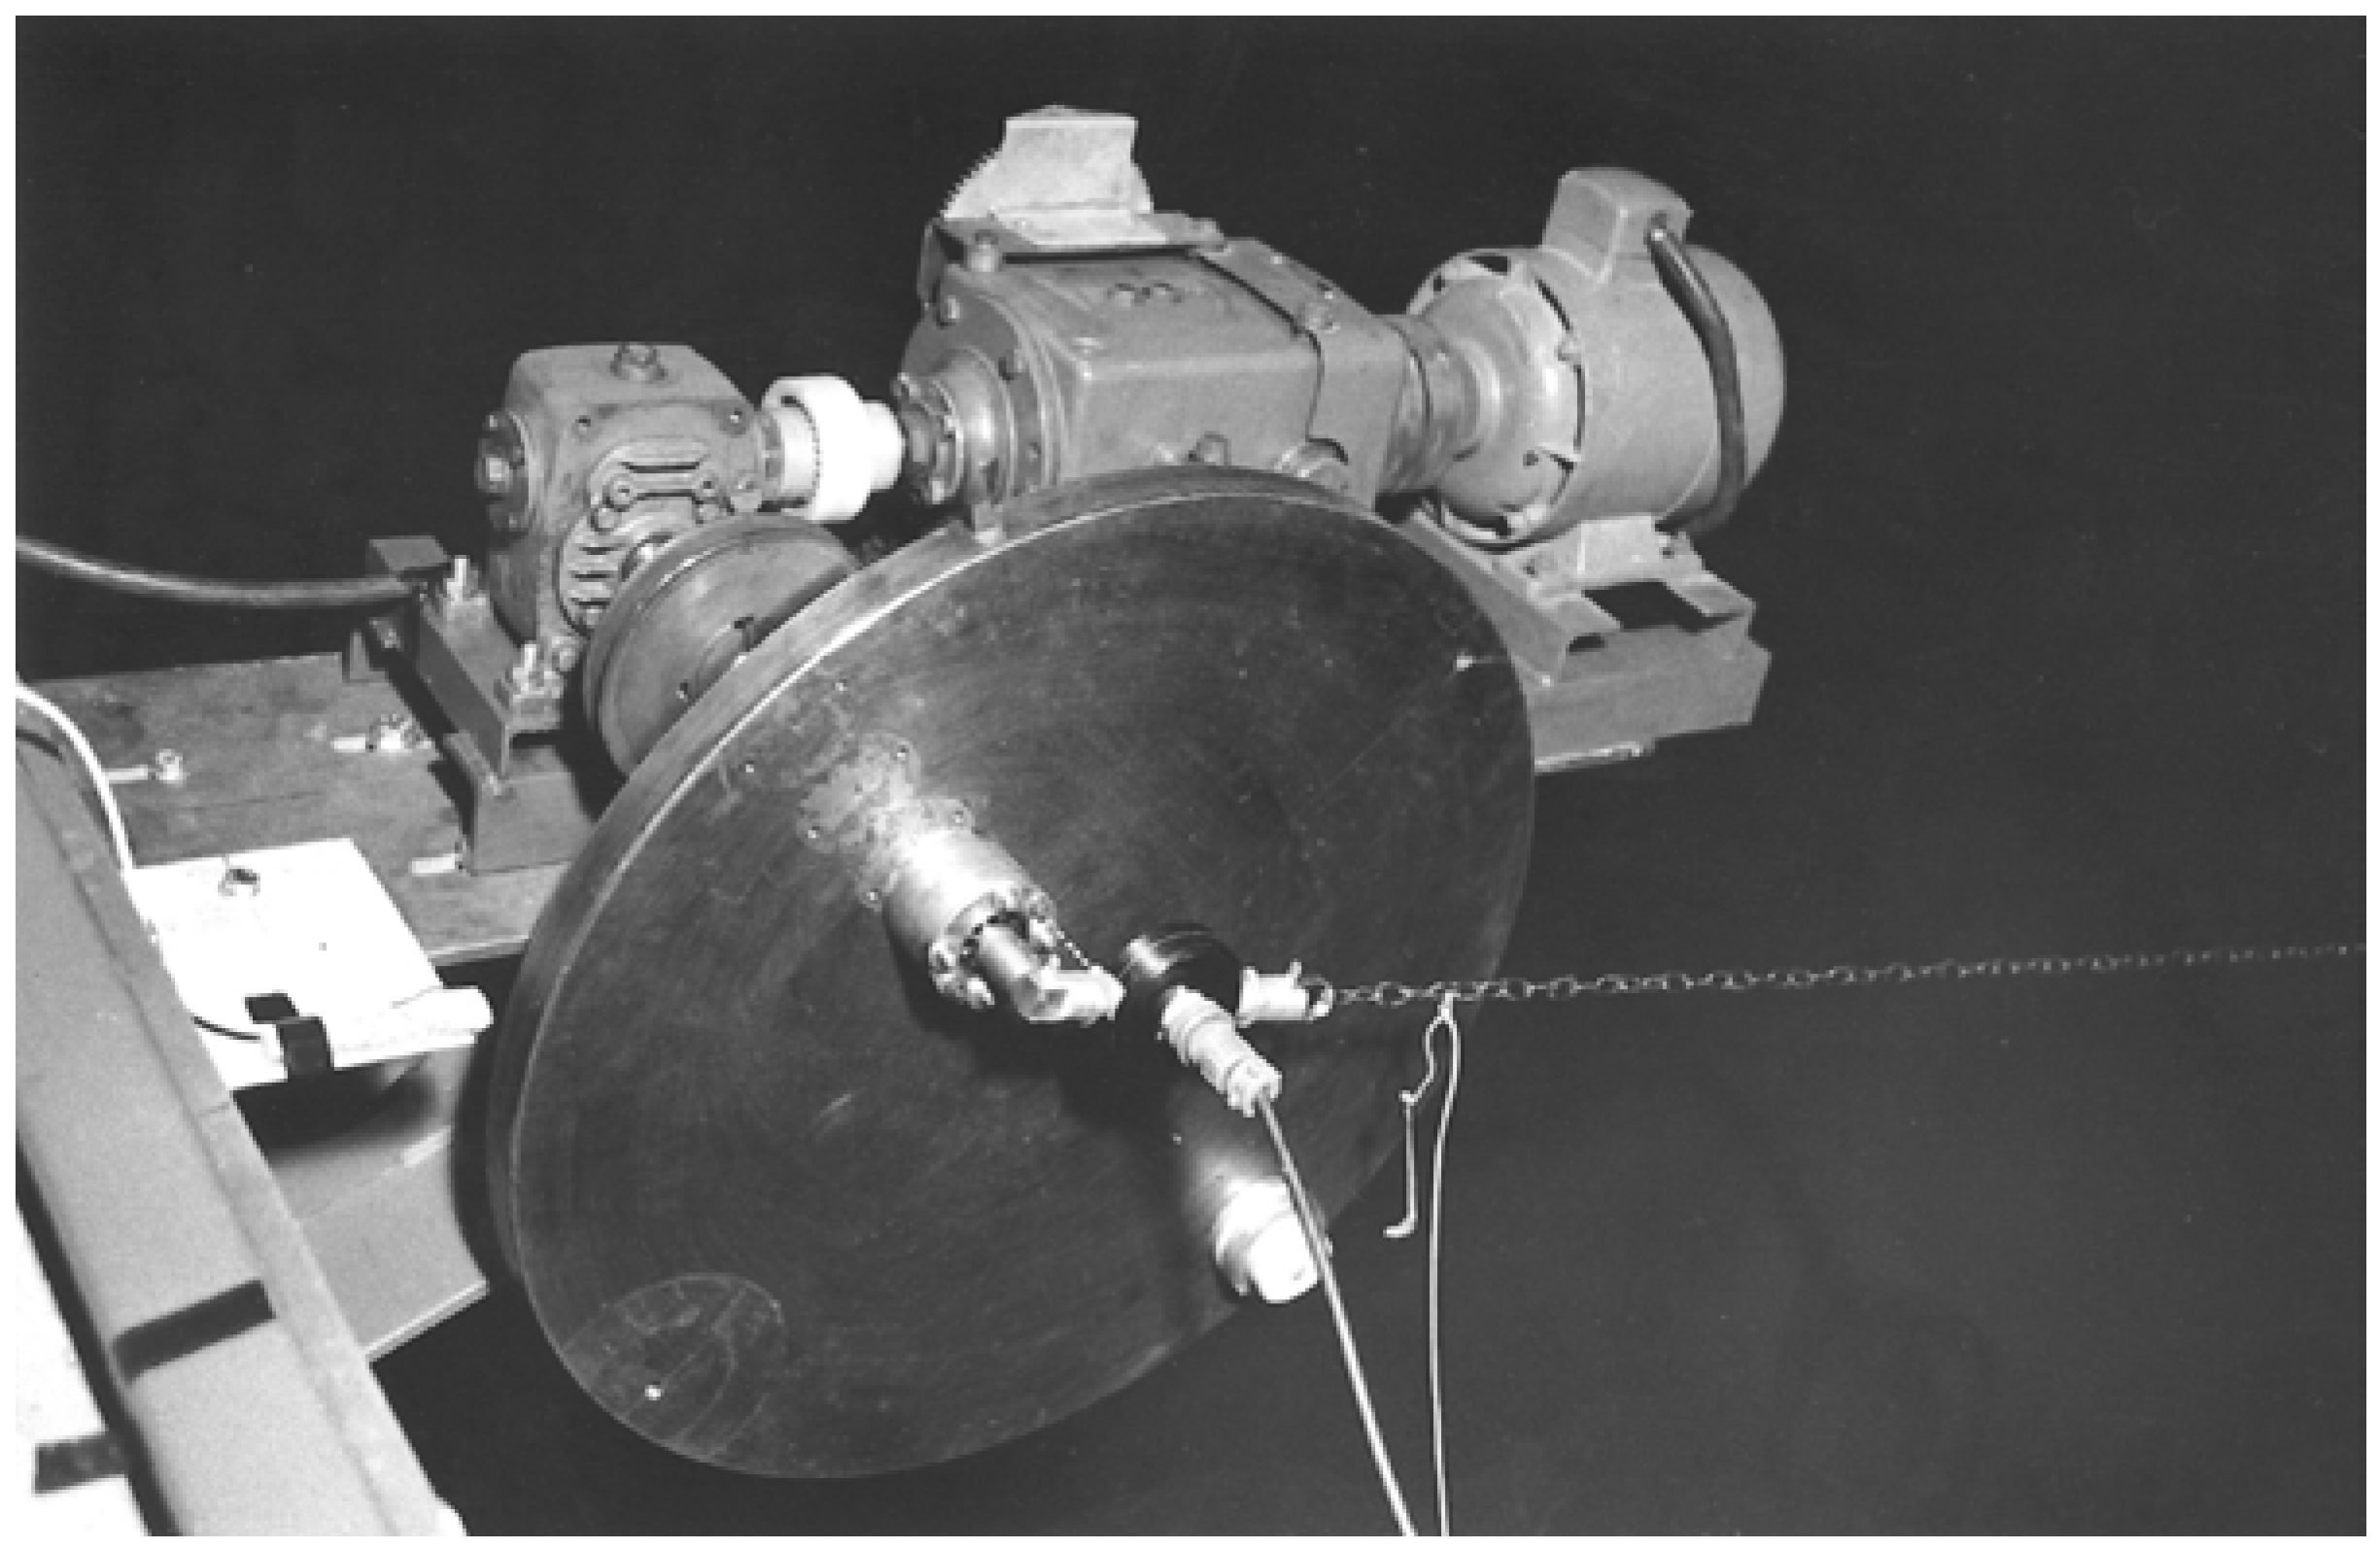
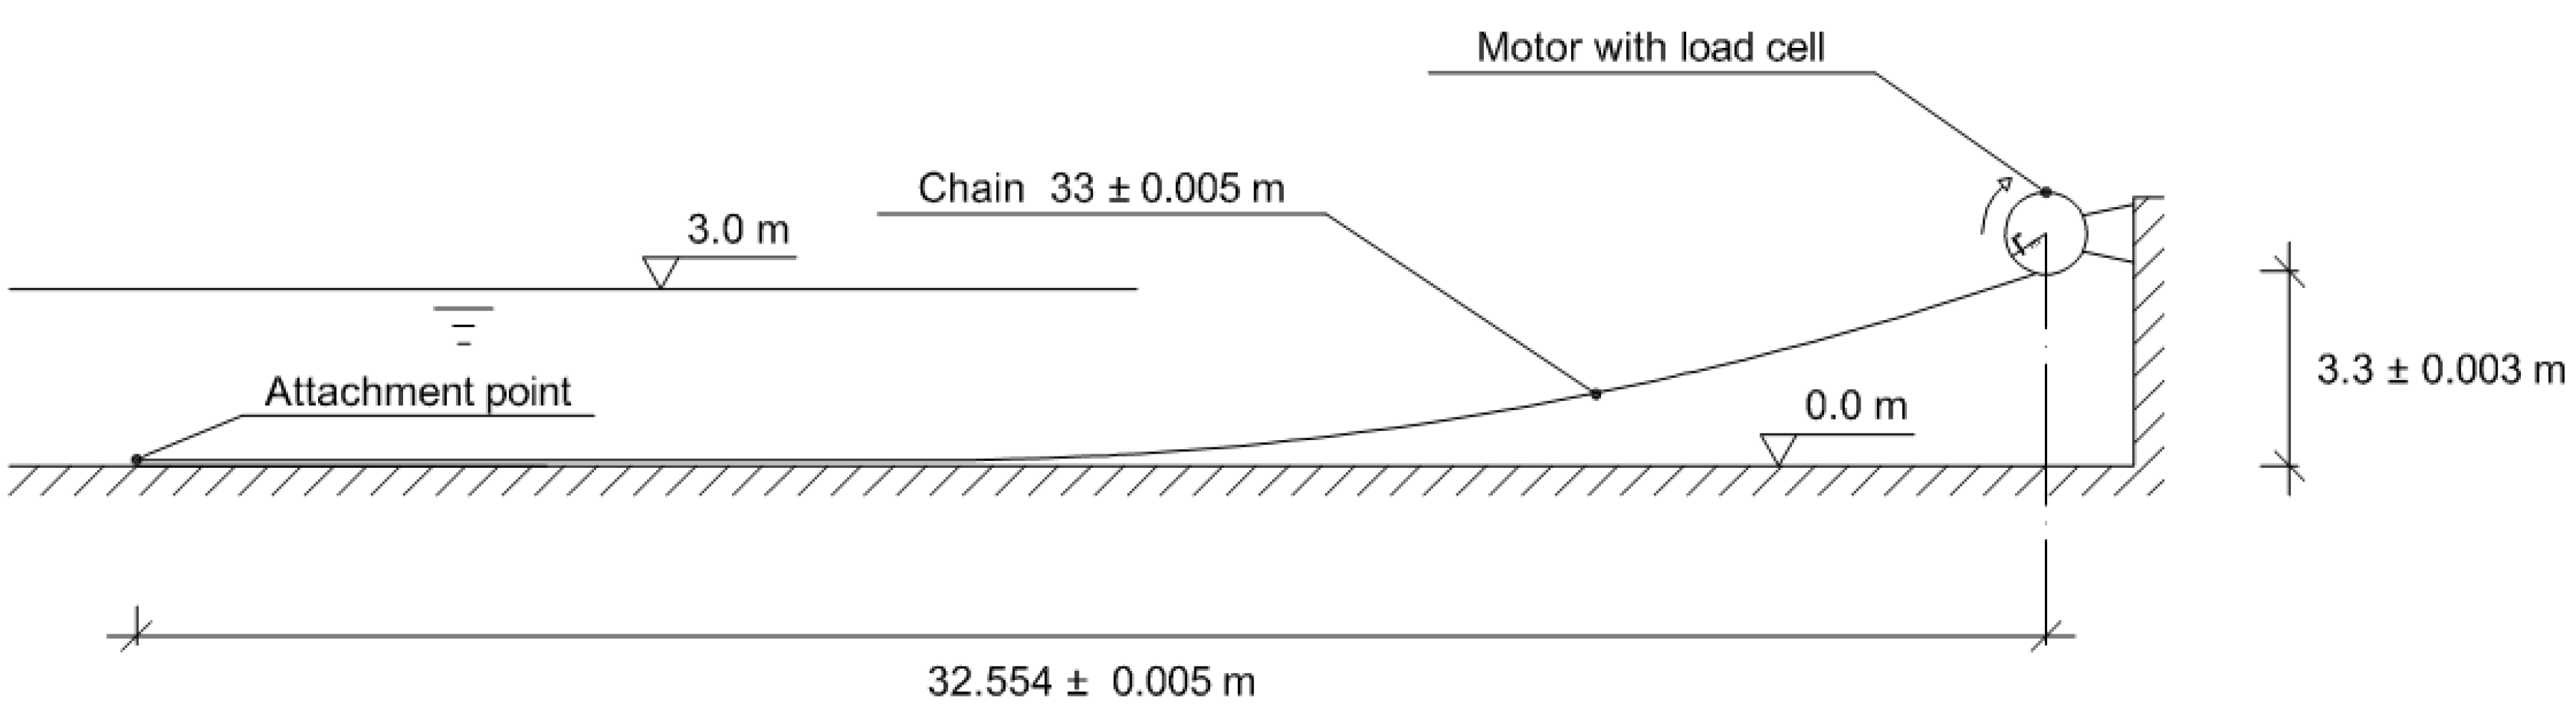
In the physical experiment the chain length was chosen to be
Lm = 33 ± 0.005 m for practical reasons and to get a somewhat taut cable. The vertical span from the concrete floor to the mean elevation of the upper attachment point was 3.3 m. The chain length also included a shackle and a force probe in the upper end with the length 0.159 m and a shackle in the other, lower end with a length of 0.026 m. These are neglected in the numerical simulations in
Section 4. With
λ = 0.027 and
Lm = 33 m the length of the prototype chain would become
Lp 1240 m.
These two chains thus fulfil the necessary conditions to be dynamically similar for oscillations in vacuum, i.e., without hydrodynamic forces, and the dimensionless parameters and are equal between the model and prototype. To assess the hydrodynamic scaling we revert to Equations (31a) and (38).
According to Equations (31a)
α1 should be the same in the model as in the prototype
The volume coefficient of the model chain was calculated to be
Cvm 2.76 and that of the prototype chain to be
Cvp 3.58. Then, the volume coefficient scale is
φ =
Cvm/Cpm 0.74. See Equation (36). The ratio between the added mass coefficients in the model and the prototype can then be solved from Equation (42):
The scale β =
dom/
dop = 2.2/76 = 0.029 and λ = 0.027 inserted in Equation (38), based on
being equal, gives the ratio between the normal drag coefficients in the model and the prototype as:
To judge whether the hydrodynamic forces are similar, relevant data from the coefficients are needed. However, we can note that the added-mass and the drag coefficients shall, at least, have the same order of magnitude in model and prototype.
The parameters , and contain the normal added-mass coefficient , the tangential drag coefficient and the normal drag coefficient , which all are functions of the Reynolds number, , and the Keulegan-Carpenter number, . At the upper end the transverse maximum velocity of the cable during a cycle is , where r is the radius of excitation. Then we can write and .
In the present experiments
and
. In the prototype
and
. Thus one may conclude that the
KC number is almost equal in the model as in the prototype and also well above 50, a value where the dependence of the added mass coefficient on the Keulegan-Carpenter number is flattening out for circular cylinders. See for instance an experimental graph by Sarpkaya (Figure 3.18 in [
31]). The authors have found no qualified information on added mass for chains in the literature, but a qualified guess is that the added mass coefficient of the prototype chain is somewhat larger than that of the model chain, which gives a better agreement for Equation (43). A first guess would be to set the added mass coefficient equal to the volume coefficient. Furthermore, as the density of steel is 7.8 times greater than the density of water, the exact value of the added-mass coefficient may not be very important for this case, but may be more significant for lighter synthetic ropes.
If we assume almost stationary flow at the present very high
KC numbers, we can expect a rather constant drag coefficient
for
. At the upper limit it sharply drops to 0.3 and then gradually rises to 0.6 at
. See for instance a graph based on experiments with circular rods by Schlichting (Figure 3.1b in [
31]) or Figure 12 in [
32]). Thus
in both the model and the prototype near the upper end of the cable;
instead of 0.84 according to Equation (44). However, the transverse velocity at the mid span of the hanging part of this relatively taut cable may be around 10 times greater than the excitation velocity at the upper end. The drag coefficient would then be expected to drop to 0.5 in the prototype for the mid span. This would give
i.e., which does not agree as well with Equation (44). However, the discussion is strictly valid for circular cylinders only. In DnV-OS-E301 [
33] the normal drag coefficient is recommended to have a value of 2.6 for a stud chain and 2.5 for a studless chain, using the material diameter as the diameter in the drag expression. The present decoration chain is, however, less compact than the prototype stud chain, which is why the drag coefficient may be a little lower.
3.3. Alternative Dimensional Analyses
There are many possibilities for grouping non-dimensional parameters. For instance, in [
10] two approaches using either the displacement amplitude or the velocity amplitude as the forcing function are formulated, resulting in two sets of nine dimensionless groups, two of which are different. Here, however, we will compare our modelling using the dimensionless groups presented in [
9] and [
2].
A complete list of the data of the model and the prototype are given in
Table 3.
Table 3.
Input data for the parameters in Table 4, Table 5 and Table 6.
| Quantity | Model | Prototype | |
|---|
| L | 33 | m | 1240 | m | Length of cable |
| V | 3.3 | m | 124.0 | m | Vertical span |
| do | 0.0022 | m | 0.076 | m | Material diameter |
| de | 0.00365 | m | 0.144 | m | Equivalent solid-rod diameter (reference diameter) |
| | 0.699 | N/m | 1078 | N/m | Weight in water |
| Ts | 22.68 | N | 1.314 × 10⁶ | N | Static tension |
| K | 10 | kN | 5.8 × 10⁵ | kN | Stiffness |
| umax | 0.135–1.0 | m/s | 0.825–6.16 | m/s | Excitation speed |
| ν | 10−6 | m2/s | 10−6 | m2/s | Kinematic viscosity |
| 7800 | kg/m3 | 7800 | kg/m3 | Cable density |
| 1000 | kg/m3 | 1024 | kg/m3 | Water density |
| r | 0.075–0.2 | m | 2.82–7.51 | m | Diameter of motion |
| ψ | 0.455 | rad | 0.454 | rad | Angle between motion and the horizontal |
| | 2.76 | - | 3.58 | - | Volume coefficient |
Webster [
9] formulates a non-dimensional tension in a cable as a function of 12 non-dimensional parameters. See
Table 4. These include the running time over the period of excitation, the moment of inertia in bending over the cross-sectional area squared, two parameters containing
CD and
Cm—essentially depending on the Reynolds number—and one containing the steady current drag over the weight of the mooring line. In our physical model there is no bending stiffness, there is no current and the drag and added-mass parameters may be combined into a Reynolds number. This leaves us with nine parameters. These are checked below for the presented model. Papazoglou
et al. [
2] and Mavrakos
et al. [
3] also present nine non-dimensional parameters for similitude, but not in the same combinations.
Table 4.
The nondimensional parameters (groups) used by Webster [
9] and relevant for this problem with Webster’s explanations of their physical meanings. Notations as in the present article.
Table 4.
The nondimensional parameters (groups) used by Webster [9] and relevant for this problem with Webster’s explanations of their physical meanings. Notations as in the present article.
| Parameter | |
|---|
| t/T | is the time relative to the period of the sinusoidal excitation. If a steady state is achieved, the state of the mooring line repeats for each unit increment in this parameter; This parameter scales with the square root of the length scale and is not listed explicitly below in Table 5 and Table 6; |
| L/V | is the ratio of the mooring line length to the vertical span and is commonly called the “scope” of the mooring line; |
| Ts/(wV) | is the ratio of the static pretension of the mooring line to the weight in water of a length of mooring line equal to the vertical span. This parameter, together with the scope, governs the geometry of the mooring line when no motions are imposed; |
| r/V | is the ratio of the amplitude of motion to the water depth; |
| | is the ratio of the hydrodynamic, cross-flow drag forces acting on the real mooring line to those which would act on the reference mooring line if exposed to the same flow situation; |
| | is the ratio of the added mass loads to those which would act on the reference mooring line exposed to the same flow situation; |
| | is the ratio of the period of the excitation to the period of a pendulum of length V; |
| | is the ratio of the water mass density to the mass density of the mooring line material. This parameter measures the relative importance of the hydrodynamic loads to the internal mechanical loads; |
| K/wL | is the inverse of the strain at the top of the cable resulting from suspending the mooring line vertically in water of unrestricted depth. This parameter measures the relative “stiffness” of the mooring line; |
| do/V | is the ratio of the diameter of the reference mooring line to the vertical span. Since almost all mooring lines are exceptionally thin compared to the vertical span, this parameter approaches zero. |
Table 5.
Nondimensional parameters according to [
9] calculated for the present experimental data with the notations used in the present article.
Table 5.
Nondimensional parameters according to [9] calculated for the present experimental data with the notations used in the present article.
| Parameter | Model | Prototype | Ratio Prototype/Model |
|---|
| 1 | L/V | 10 | 10 | 1 |
| 2 | Ts/(wV) | 1.017 | 1.018 | 1.00 |
| 3 | r/V | 0.023–0.061 | 0.023–0.061 | 1.00 |
| 4 | | CDm∙1.66 | CDp∙1.95 | 1.14 |
| 5 | | Cmm∙2.76 | Cmp∙3.82 | 1.30 |
| 6 | | 0.343–0.960 | 0.343–0.960 | 1.00 |
| 7 | | 0.128 | 0.131 | 1.02 |
| 8 | K/wL | 435 | 435 | 1.00 |
| 9 | do/V | 0.67 × 10⁻³ | 0.61 × 10⁻³ | 0.92 |
Table 6.
Non-dimensional parameters according to [
2] calculated for the present experimental data with the notations used in the present article.
Table 6.
Non-dimensional parameters according to [2] calculated for the present experimental data with the notations used in the present article.
| Parameter | Model | Prototype | Ratio Prototype/Model |
|---|
| 1 | L/V | 10 | 10 | 1 |
| 2 | do/L | 67 × 10−6 | 61 × 10−6 | 0.92 |
| 3 | wL/Ts | 1.018 | 1.016 | 1.00 |
| 4 | Remax = umaxdo/ν | 300–2200 | 6.27 × 10⁴–4.7 × 10⁵ | 212 |
| 5 | | 7.80 | 7.62 | 0.98 |
| 6 | K/Ts | 441 | 442 | 1.00 |
| 7 | r/do | 34.1–90.9 | 37.1–98.8 | 1.09 |
| 8 | | 12.7–99.2 | 12.7–99.5 | 1.00 |
| 9 | ψ | 0.455 | 0.454 | 1.00 |
The present model fulfils most of Webster’s parameters except the ones containing the coefficients of drag and added mass and the diameter over vertical-span ratio. See
Table 5. The prototype over model ratio for Parameter 4 is 1.14
and the ratio
may be between 0.5 and 1 referring to the discussion in
Section 3.1. Then, 1.14
would be in the range of 0.6 and 1.1, which may be considered reasonably correct. Parameter 5 would give the ratio 1.4 using the ratio for recommended added mass coefficients
. This is not completely satisfactory, but as said before, for a steel cable the steel mass dominates the inertia. Parameter 9 gives a prototype over model ratio of 0.92 because the diameter over vertical-span ratio
d/
V simply depends on the difference in steel material diameter which is a result of modelling compromises and this is of minor importance.
The present model also fulfils most of the parameters of [
2]. See
Table 6. The modelling error in Parameters 2 and 7 is caused by the different material diameters and scale
β. Using the equivalent homogeneous rod diameter
de instead of the material diameter
do in Parameters 2 and 7, we would get prototype over model ratios of 1.05 and 0.96, respectively. As discussed above, the Reynolds number, Parameter 4, cannot be the same in the model and prototype. The modelling error in
Section 5 is simply caused by the fact that we had fresh water in the model and assumed sea water in the prototype. As for Parameter 8, [
2] does not discuss its physical significance, but again we may encounter a modelling error. If we use the diameter
do instead of
de the prototype over model ratio becomes 0.77.
We can conclude that the presented dynamic experiment with a chain submerged in water can be considered as a model of a 1240 m long 76 mm stud chain at a length scale of 1:37.6. As the chain was also scaled to have correct propagation celerity for longitudinal elastic waves, it provided a perfect geometrical and dynamic scaling in vacuum. In [
1] it was pointed out that this is the most difficult scale to achieve, but here we have stated it is possible to accomplish this. The similarity in water was not perfect mainly due to viscous effects as the comparisons of non-dimensional parameters confirm. The main modelling error arises from the impossibility of achieving Reynolds number equality, but if the Reynolds number is high enough, the drag and added mass coefficients could be considered equal in model and prototype.


