Article

Oil Characterization and Distribution in Florida Estuary Sediments Following the Deepwater Horizon Spill

U.S. Environmental Protection Agency, Gulf Ecology Division, 1 Sabine Island Drive, Gulf Breeze, FL 32561, USA
*
Author to whom correspondence should be addressed.
These authors contributed equally to this work.
J. Mar. Sci. Eng. 2015, 3(3), 1136-1148; https://doi.org/10.3390/jmse3031136
Submission received: 22 July 2015 / Accepted: 17 September 2015 / Published: 23 September 2015
(This article belongs to the Special Issue Marine Oil Spills)

Abstract

:
Barrier islands of Northwest Florida were heavily oiled during the Deepwater Horizon spill, but less is known about the impacts to the shorelines of the associated estuaries. Shoreline sediment oiling was investigated at 18 sites within the Pensacola Bay, Florida system prior to impact, during peak oiling, and post-wellhead capping. Only two locations closest to the Gulf of Mexico had elevated levels of total petroleum hydrocarbons (TPH) and total polycyclic aromatic hydrocarbons (PAHs). These samples showed a clear weathered crude oil signature, pattern of depletion of C9 to C19 alkanes and C0 to C4 naphthalenes, and geochemical biomarker ratios in concordance with weathered Macondo crude oil. All other locations and sample times showed only trace petroleum contamination. The results of this study are consistent with available satellite imagery and visual shoreline survey data showing heavy shoreline oiling limited to sandy beaches near the entrance to Pensacola Bay and shorelines of Santa Rosa Island.

Graphical Abstract

1. Introduction

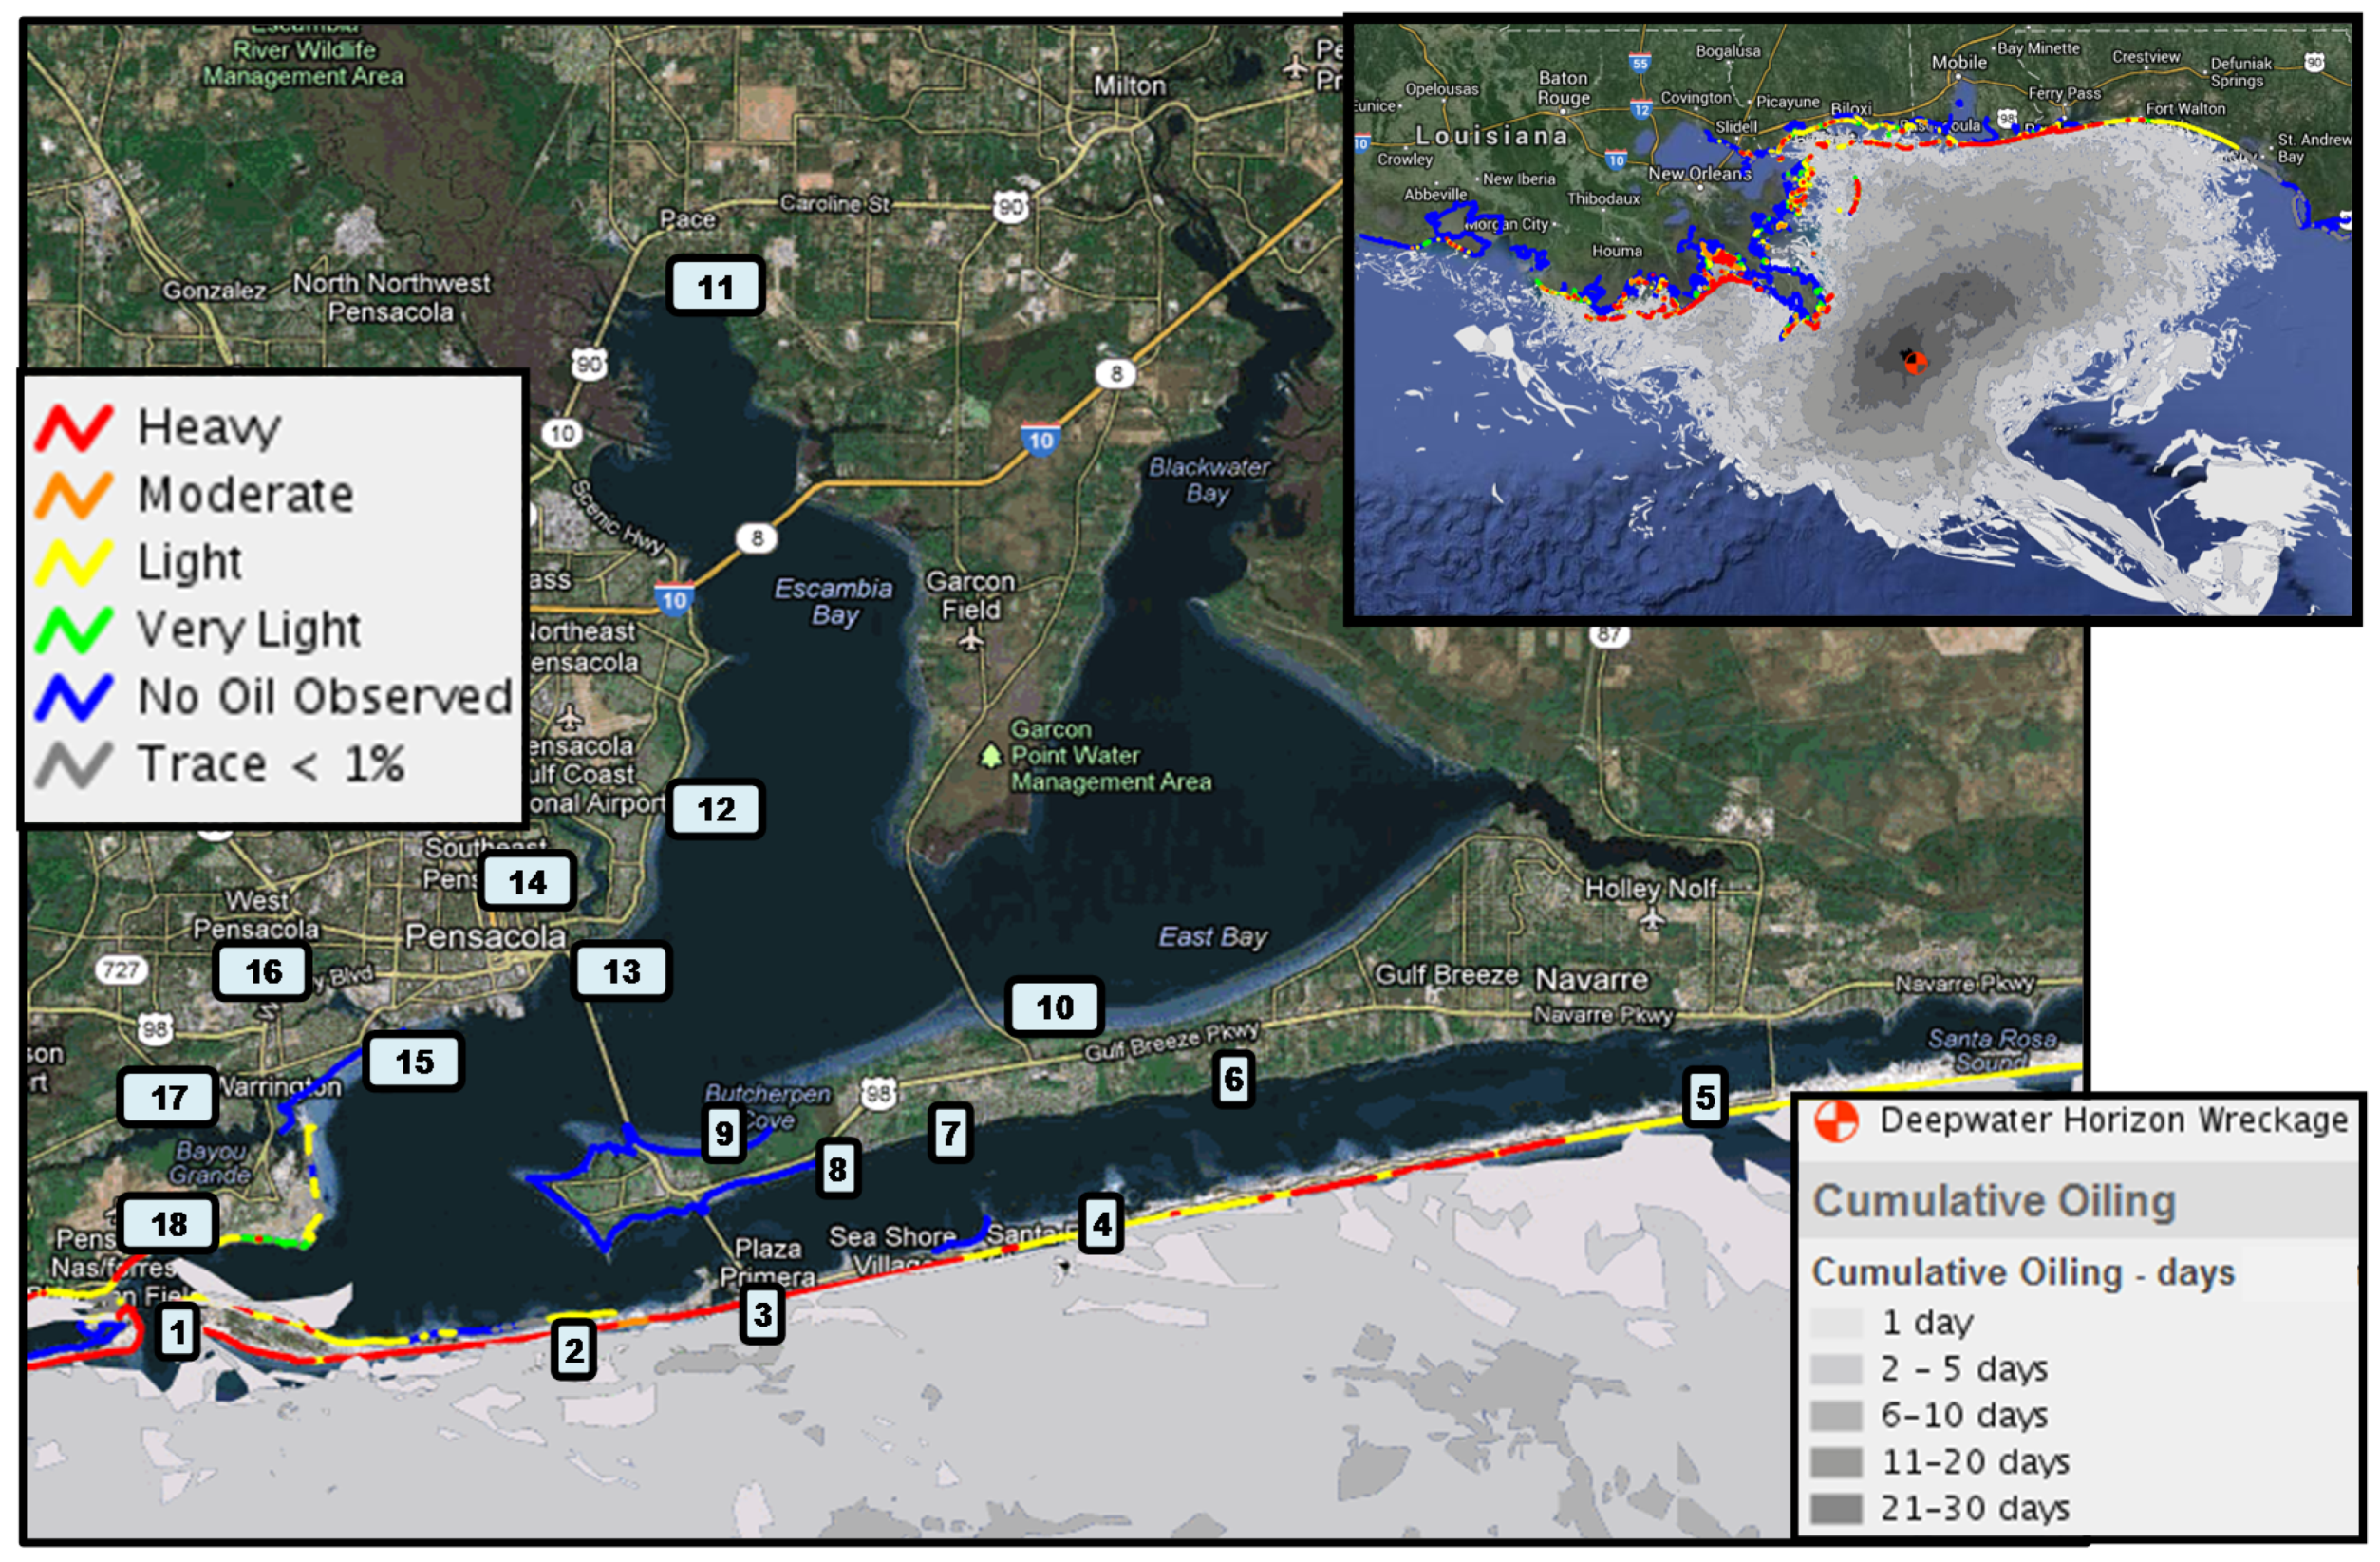
The Deepwater Horizon (DWH) oil rig exploded on 20 April 2010, initiating the discharge of 800 million liters of oil into the northern Gulf of Mexico over an approximately three month period [1,2,3]. The spill was the largest environmental disaster in United States history, and the largest accidental oil spill in human history [4]. Vast areas of the Gulf of Mexico were impacted by oil, including deep ocean, pelagic, and estuarine ecosystems. Over 20 million hectares of the Gulf of Mexico were closed to fishing and 1600 km of shoreline were visibly oiled [2,5]. Shoreline oiling was temporally and spatially heterogeneous, with the heaviest oiling occurring in coastal areas of eastern Louisiana, Mississippi, Alabama, and on the barrier islands of Northwest Florida [6]. Along the more heavily oiled sand beaches, some oil and sand mixed and accumulated in the nearshore subtidal zone resulting in formation of extensive submerged oil residue mats [7]. In Florida, Shoreline Cleanup and Assessment Technique (SCAT) surveys were focused on coastal areas, with only limited surveys performed within large estuaries, including Pensacola Bay [7].
Satellite imagery and nearshore trajectories showed oil in proximity to Pensacola Bay and potential impacts on Santa Rosa Island from 17 June to 3 July 2010 [5,8]. The heaviest oiling of Santa Rosa Island occurred on June 23, with all 60 km of the barrier island’s southern shoreline impacted with visible free product and particulate oil. Near shore water and sediment samples from the area were reported to have elevated levels of TPH and PAHs [9]. Passive water sampling devices deployed by Allan et al. [10] at the entrance to Pensacola Bay showed elevated levels of bioavailable petrogenic PAHs in August and September 2010, but only background concentrations in May, June, and July 2010, and in spring 2011 follow up sampling. Anecdotal reports indicated that mousse, sheen, tar balls, and tar mats were present within the Pensacola Bay system for multiple weeks, with the first consistent reports beginning about 10 June 2010.
The objectives of the current study were to assess shoreline sediment oiling within the Pensacola Bay system during the DWH spill for comparison to coastal oiling observations. The Pensacola Bay system is a 370 km2 low energy river-dominated estuarine system comprised of interconnected large bays, smaller tidal bayous, and Santa Rosa Sound located in Northwest Florida [11]. Sampling times occurred prior to visible shoreline oiling, during peak oiling, and following capping of the wellhead. Samples were analyzed for multiple petroleum related analytes, including polycyclic aromatic hydrocarbons (PAHs) and geochemical biomarkers. Samples were also analyzed for a range of other organic chemicals and metals to allow evaluation of the spatial heterogeneity of contamination relative to petrogenic chemicals.

2. Materials and Methods

2.1. Sample Collection

Eighteen sample locations were selected throughout the Pensacola Bay system on the basis of accessibility, with the objective of collecting at geospatially diverse areas that represented the major habitats of the open bay and bayou habitats (Table 1, Figure 1). Sample sites included the entrance to Pensacola Bay and locations ranging from approximately 43 km to the east and 36 km to the north, including three bayous on the western coast of the bay. Sites were selected to be accessible by automobile because many locations within the bay had limited boat access due to the presence of oil containment booms. Boom placements varied throughout the study period, but were consistent at the mouth of bayous and public beach areas near Pensacola Pass. Where booms were present, samples were taken on the outside of booms along the unprotected shoreline when possible (Table 1). Sites were sampled from mid-June through September during eight serial sampling events: 16 or 17 June, 24 or 25 June, 30 June or 1 July, 8 or 9 July, 22 or 23 July, 5 or 6 August, 18 or 19 August, and 29 or 30 September. Exceptions to the sampling regime include sites in East Bay and the Escambia River Delta, where sampling began on 25 June, and Naval Air Station where permission was obtained to begin sampling on 23 July 2010.
Samples were collected according to a quality assurance sampling plan. At each site, surficial sediments (2 to 5 cm) were collected using stainless steel spoons and placed in 1.8 L glass jars with Teflon lids and homogenized by mixing prior to storage. An additional 240 mL sample was similarly collected at each site to analyze for non-petroleum related contaminants. Samples were immediately placed in a cooler on ice and frozen when returned to the laboratory (−70 °C).
Table 1. A Shoreline sediment sample collection site locations and characteristics within Pensacola Bay, Florida, USA.
Site NameSite 1 IDSite 1 NumberDistance from Pass (km) 2LatitudeLongitudeSite CharacteristicsBooms Present 3
Fort PickensFP11.130.3310−87.2966sandy beachyes 4
Santa Rosa Sound 1SRS1212.130.3273−87.1823sandy beachNo
Santa Rosa Sound 2SRS2317.730.3345−87.1389sandy beachyes 5
Santa Rosa Sound 3SRS3427.930.3531−87.0414sandy beachyes 5
Santa Rosa Sound 4SRS4543.230.3830−86.8650sandy beachNo
Santa Rosa Sound 5SRS5629.330.3852−87.0135sandy beachNo
Santa Rosa Sound 6SRS6722.130.3737−87.0914sandy beachNo
Naval Live Oaks SNLOS818.630.3641−87.1276sandy beachNo
Naval Live Oaks NNLON917.230.3696−87.1426sandy beachNo
East BayEB1024.430.3988−87.0735sandy beachNo
Escambia RiverdeltaERD1136.230.5810−87.1611sand, organic mixNo
Scenic BluffsSB1221.230.4551−87.1675sand, organic mixNo
Bayou Texar southBTS1315.430.4201−87.1933sand, silt, clayyes 6
Bayou Texar northBTN1416.730.4315−87.1902sand, silt, clayyes 6
Bayou Chico eastBCE1511.930.4001−87.2428sand, silt, clayNo
Bayou Chico westBCW1613.630.4037−87.2604sand, silt, clayyes 6
Bayou GrandeBG11712.830.3762−87.3031sand, silt, clayyes 6
Naval Air StationNAS181.530.3441−87.3072sandy beachyes 3
1 ID: Site identification site numbers shown on Figure 1; 2 Distance via waterways to Pensacola pass approximated as the most direct path in ArcGIS [12]; 3 Booms in place when sampling initiated through 5 August 2010; 4 Samples taken outside of boomed area; 5 Samples taken within boomed area; 6 Booms at mouth of bayou.
Figure 1. Composite graphic of Pensacola Bay, Florida derived from NOAA [6] data showing MODIS satellite imagery, maximum shoreline oiling (colored lines), and cumulative days of surface water oiling (grey surface shading). Sampling locations and identification numbers listed in Table 1. Inset: Gulf of Mexico, United States.
Jmse 03 01136 g001

2.2. Analytical Chemistry

Sediment samples were extracted and analyzed for petroleum related analytes, metals, PCBs, and other organic contaminants (Tables S1–S4). Additionally, one sample of Macondo crude oil (MCO) collected by a remotely operated vehicle (ROV) directly at the wellhead was analyzed only for petrogenic chemicals. Sample holding, preservation, processing, and chemical analyses were performed following rigid chain of custody and quality assurance/quality control procedures according to USEPA methods and the Quality Assurance Project Plan of the contract laboratory. Sediment samples were mixed with sodium sulfate to remove moisture, than 20 g subsamples were prepared by automated Soxhlet extraction with dichloromethane followed by silica gel cleanup. Extracts analyzed for organochlorine pesticides had additional clean up by passing the extract through a Florisil column (elution with 10% acetone in hexane) and a solid phase carbon cartridge (elution with dichloromethane and hexane) to remove non-analyte interferences.
Petroleum-related analytes included total petroleum hydrocarbons (TPH), saturated hydrocarbons (SHC), petrogenic PAHs, and biomarkers. TPH representing the total aromatic and aliphatic hydrocarbon content of sample extracts were analyzed by gas chromatography/flame ionization detection (GC/FID) using a HP 5890 GC (Hewlett-Packard, Palo Alto, CA USA). Concentrations were determined from integration of the FID signal over the entire hydrocarbon range from n‑C9 to n‑C44 and were calibrated against an average alkane hydrocarbon response factor. Saturated hydrocarbons were analyzed by GC/FID based on EPA Method 8015 with the SHC fraction determined by integrating the resolved chromatographic peaks from the unresolved response. Individual alkanes including pristane, phytane, and C9 to C39 normal alkanes were quantified against a calibration curve made from C9 to C44 n-alkanes. Fifty-seven petroleum-related PAHs, including alkyl homolog groups, were analyzed by gas chromatography with mass spectrometry using selected ion monitoring (GC/MS-SIM) following the methods of Page et al. [13] and Wang and Stout [14]. The analytical procedure was based on EPA Method 8270D with the GC and MS operating conditions optimized for separation and sensitivity of the target analytes using an Agilent 5973 quadrupole GC/MS system (Agilent, Palo Alto, CA USA). Alkyl PAH homologs were quantified using a response factor assigned from the parent PAH compound. Fifty-six petroleum biomarkers were analyzed by GC/MS-SIM following the method of Wang et al. [15] using an Agilent 5973 quadrupole GC/MS system.
Non-petroleum analytes included heavy metals, PCBs, and pesticides. Seven metals were determined by inductively coupled plasma atomic emission spectrometry (ICP-AES) and inductively coupled plasma-mass spectrometry (ICP-MS) and total mercury by cold vapor atomic absorption using a CETAC M6200A mercury analyzer (CETAC Technologies, Omaha, NE USA). Total PCBs were analyzed by comparison to Aroclors following EPA method 8082. Twenty-six organochlorine pesticides were analyzed by GC/MS/MS with isotope dilution, including diphenyl, cyclodiene, and organophosphate insecticides following EPA method 1699 using a Waters Micromass Quattro Micro GC tandem MS (Waters, Milford, MA USA).

2.3. Data Analyses

Satellite imagery, cumulative surface water oiling, and shoreline oiling survey data for the Pensacola Bay area were downloaded from public domain databases [5] for comparison to analytical chemistry results. Weathering and diagnostic geochemical biomarker ratios were determined from the detectable concentrations of specific analytes following the equations in Table 2. Total PAH (tPAH) values were computed from the sum of detected analytes consisting of 57 parent PAHs and alkyl homolog groups. Depletion indices were computed from ratios of tPAH:hopane or the sum of C9 to C34 alkanes:hopane relative to MCO, and weathering ratios from C3 dibenzothiophenes: C3 chrysenes (Table 3).
Table 2. Total petroleum hydrocarbon (TPH) concentrations (mg/Kg) in shoreline sediment samples from Pensacola Bay, Florida during the 2010 Deepwater Horizon oil spill.
Sample Location 1Sediment TPH (mg/Kg) at Each 2010 Sample Date
16–17 Jun24–25 Jun30 Jun–1 Jul8–9 Jul22–23 Jul5–6 Aug18–19 Aug29–30 Sept
16.65197 *366 *4580 *14.32.447.187.91
29.597.9939.8 *2.518.344.026.326.94
316.19.587.104.049.813.107.867.30
47.718.736.962.389.553.937.608.53
58.737.649.492.457.663.856.697.80
68.398.857.803.089.164.397.526.85
710.511.18.188.979.126.196.8510.2
87.179.543.691.828.133.226.568.01
98.318.199.572.028.742.596.986.43
107.7110.57.142.339.215.976.518.98
11X 29.5613.62.8310.704.708.6013.6
12X8.339.392.899.804.159.5610.6
1335.7 *27.226.621.035.4 *23.721.045.7 *
1413.91120.118.516.412.214.922.8
1523.219.312.89.5413.88.8212.136.4 *
1612.224.318.552.2 *11.58.4710.918.7
1711.59.948.432.628.294.947.5411.4
18XXXX18.35.6210513.7
1 Locations are shown in Figure 1 and described in Table 1; 2 X: No sample collected because of restricted access; *Asterisk indicates values exceeding 30 ppm TPH
Table 3. Diagnostic geochemical biomarker ratios for Macondo source oil (MCO) and weathering in Pensacola Bay, Florida sediment samples (FP–July, NAS–August). 1
BiomarkerComponentsMCOFP 1NAS 1
Ts/Tm 218α-22,29,30-trisnorneohopane/17α-22,29,30-trisnorhopane1.281.200.911
Ts/(Ts+Tm) 318α-22,29,30-trisnorneohopane/(18α-22,29,30-trisnorneohopane + 17α-22,29,30-trisnorhopane)0.5610.5450.477
Triplet terp 2C26 tricyclic terpane 22S + 22R/C24 tetracyclic terpane2.662.522.66
24Tri/23Tri 2C24 tricyclic terpane/C23 tricyclic terpane0.5080.7980.812
26Tri/25Tri 2C26 tricylclic terpane 22S + 22R/C25 tricyclic terpane1.031.06NC 3
28Tri/29Tri 2C28 tricylclic terpane 22S + 22R/C29 tricyclic terpane 22S + 22R1.031.17NC 3
29D/29H 218α(H)-30-norneohopane/17α(H),21β(H)-30-norhopane0.4010.3980.349
C28R/C29R 214α,17α-methylcholestane 20R/14α,17α-ethylcholestane 20R1.000.9871.139
C31S/(S+R) 4,517α,21β-homohopane 22S/17α,21β-homohopane 22S + 22R0.3710.4070.472
H29/H30 2,617α,21β-30-norhopane/17α,21β-hopane0.4930.4270.466
Pri/Phy 6pristane/phytane1.6520.6110.719
C31S/H30 217α,21β-homohopane 22S/17α,21β-hopane0.2270.2660.325
C29S/(S+R) 614α,17α-ethylcholestane 20S/14α,17α-ethylcholestane 20S + R0.5470.4970.517
D2/P2 2,7C2 dibenzothiophenes/C2 phenanthrenes0.3400.2700.272
D3/P3 2,7C3 dibenzothiophenes/C3 phenanthrenes0.3710.4050.465
Pri/C17 6pristane/n-C170.6290.5950.765
Phy/C18 6phytane/n-C180.4890.3970.528
WR 8∑ (nC23 to nC34)/∑ (nC11 to nC22)0.2381.48 31.08 3
RPDI 9[1 − (tPAH/hopanesample)/(tPAH/hopaneoil)] × 100099.598.9
RADI 9[1 – (∑ alkanes/Hopanesample)/(∑ alkanes/Hopanesource oil)] × 1000100100
D3/C3 7C3 dibenzothiophenes/C3 chrysenes0.9691.731.88
1 Table 1 for site identifications and Figure 1 for sample location. Sediment samples collected July (FP) and August (NAS) 2010; 2 Rosenbauer et al. [3,16]; 3 One or more analytes below detection limits; 4 Mulabagal et al. [17]; 5 Hostettler et al. [18]; 6 Alkane to isoprenoid ratio [14]; 7 Douglas et al. [19]; 8 WR: Alkane weathering ratio; excludes pristane and phytane; 9 RPDI: Relative tPAH depletion index; RADI: Relative alkane depletion index. Modified from Atlas and Bragg [20].

3. Results

3.1. Oil Distribution

Satellite imagery and available cumulative surface water oiling data showed only trace oiling within Pensacola Bay (Figure 1) [6]. The limited SCAT survey (USGS 2011; NOAA 2013) data for the Pensacola Bay system during the DWH spill also indicated that oiling was restricted to areas of the outer bay (Figure 1) [6]. Although consistent repeated SCAT observations for these areas were not available, the reported maximum oiling levels indicated that heavy shoreline oiling was limited to sandy beach areas near the entrance to Pensacola Bay and the south shoreline of Santa Rosa Island. The 18 sample locations in Pensacola Bay had trace levels of TPH prior to observable shoreline oiling during the DWH spill (Table 2). Only the July 8 sample at Site 1 (FP) near the entrance to Pensacola Bay had very high elevations in both TPH (4580 mg/kg) and tPAH (13.2 mg/kg) (Table 2). Minor elevations in both TPH (52.2 mg/kg) and tPAH (0.3 mg/kg) were present at Site 16 (BCW) on July 9, and Site 18 (NAS) showed relatively high levels on Aug 19 (101 mg/kg TPH and 0.4 mg/kg tPAH). Site 13 (BTS; June 17) showed a minor elevation in pre-impact TPH (35.7 mg/kg) and tPAH (0.01 mg/kg); inspection of the specific analytes in that sample showed PAHs were elevated in pyrogenic, rather than petrogenic PAHs.

3.2. Weathering and Fingerprinting to Source Oil

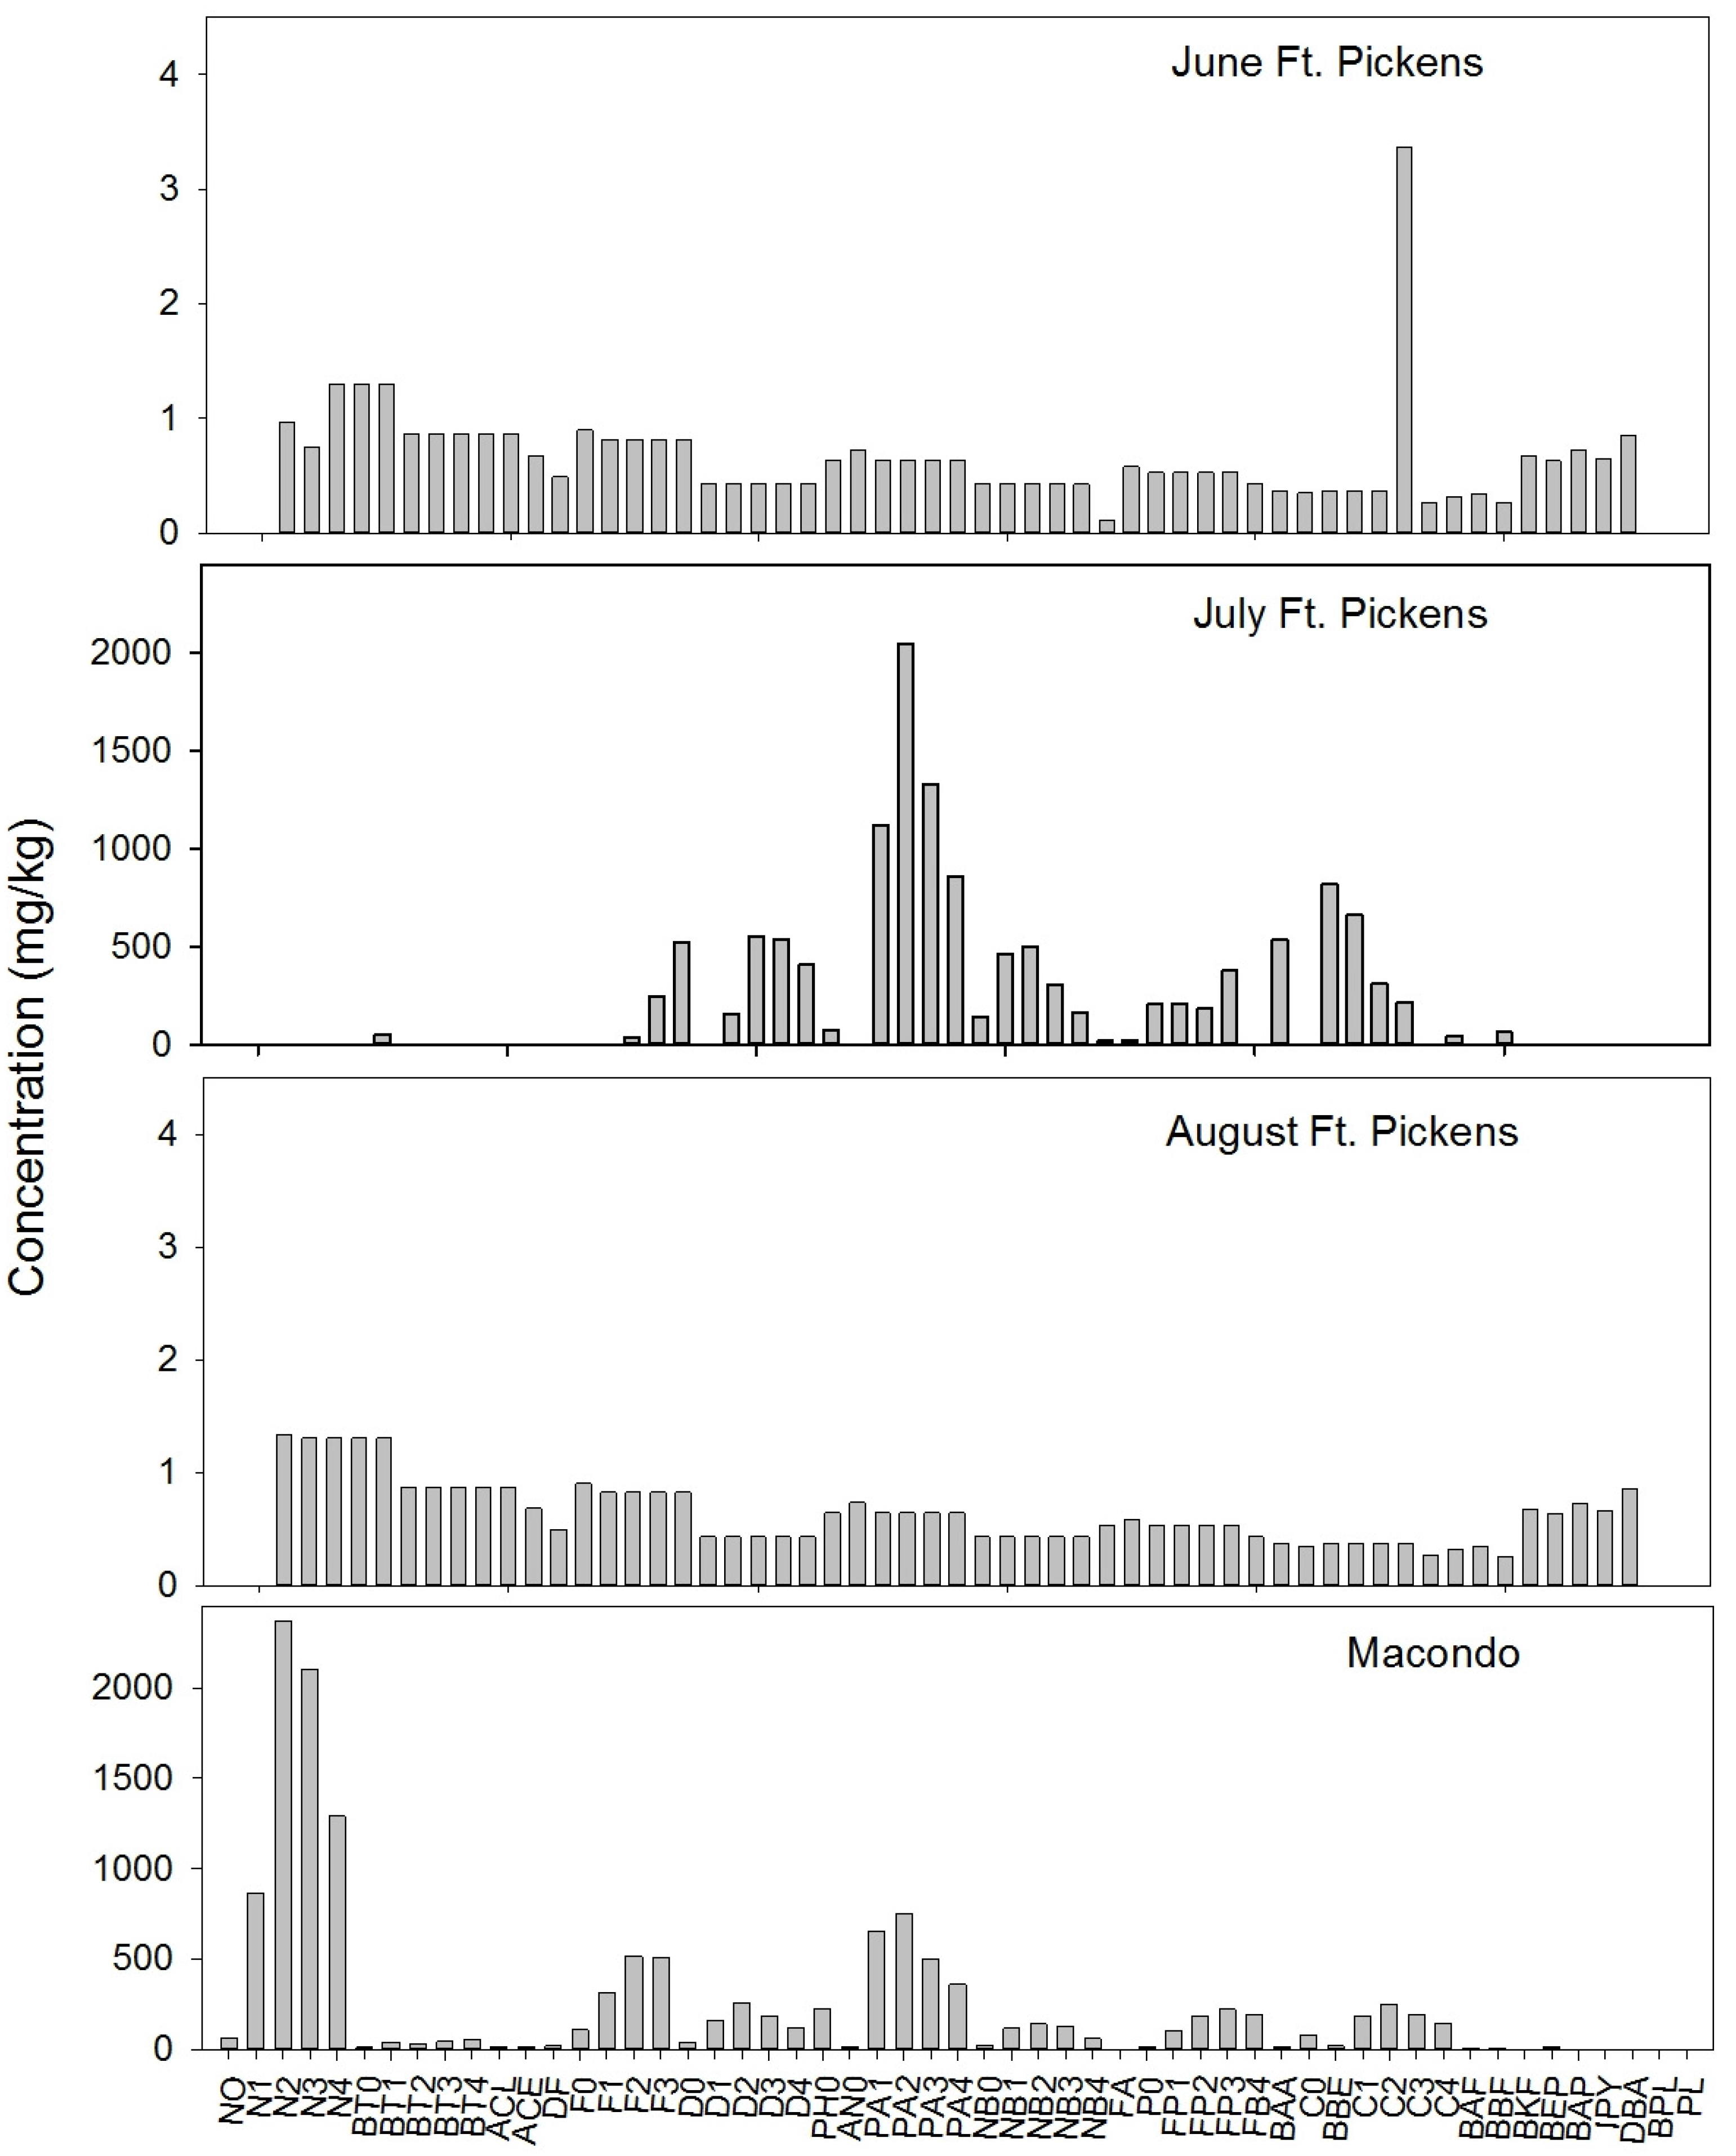
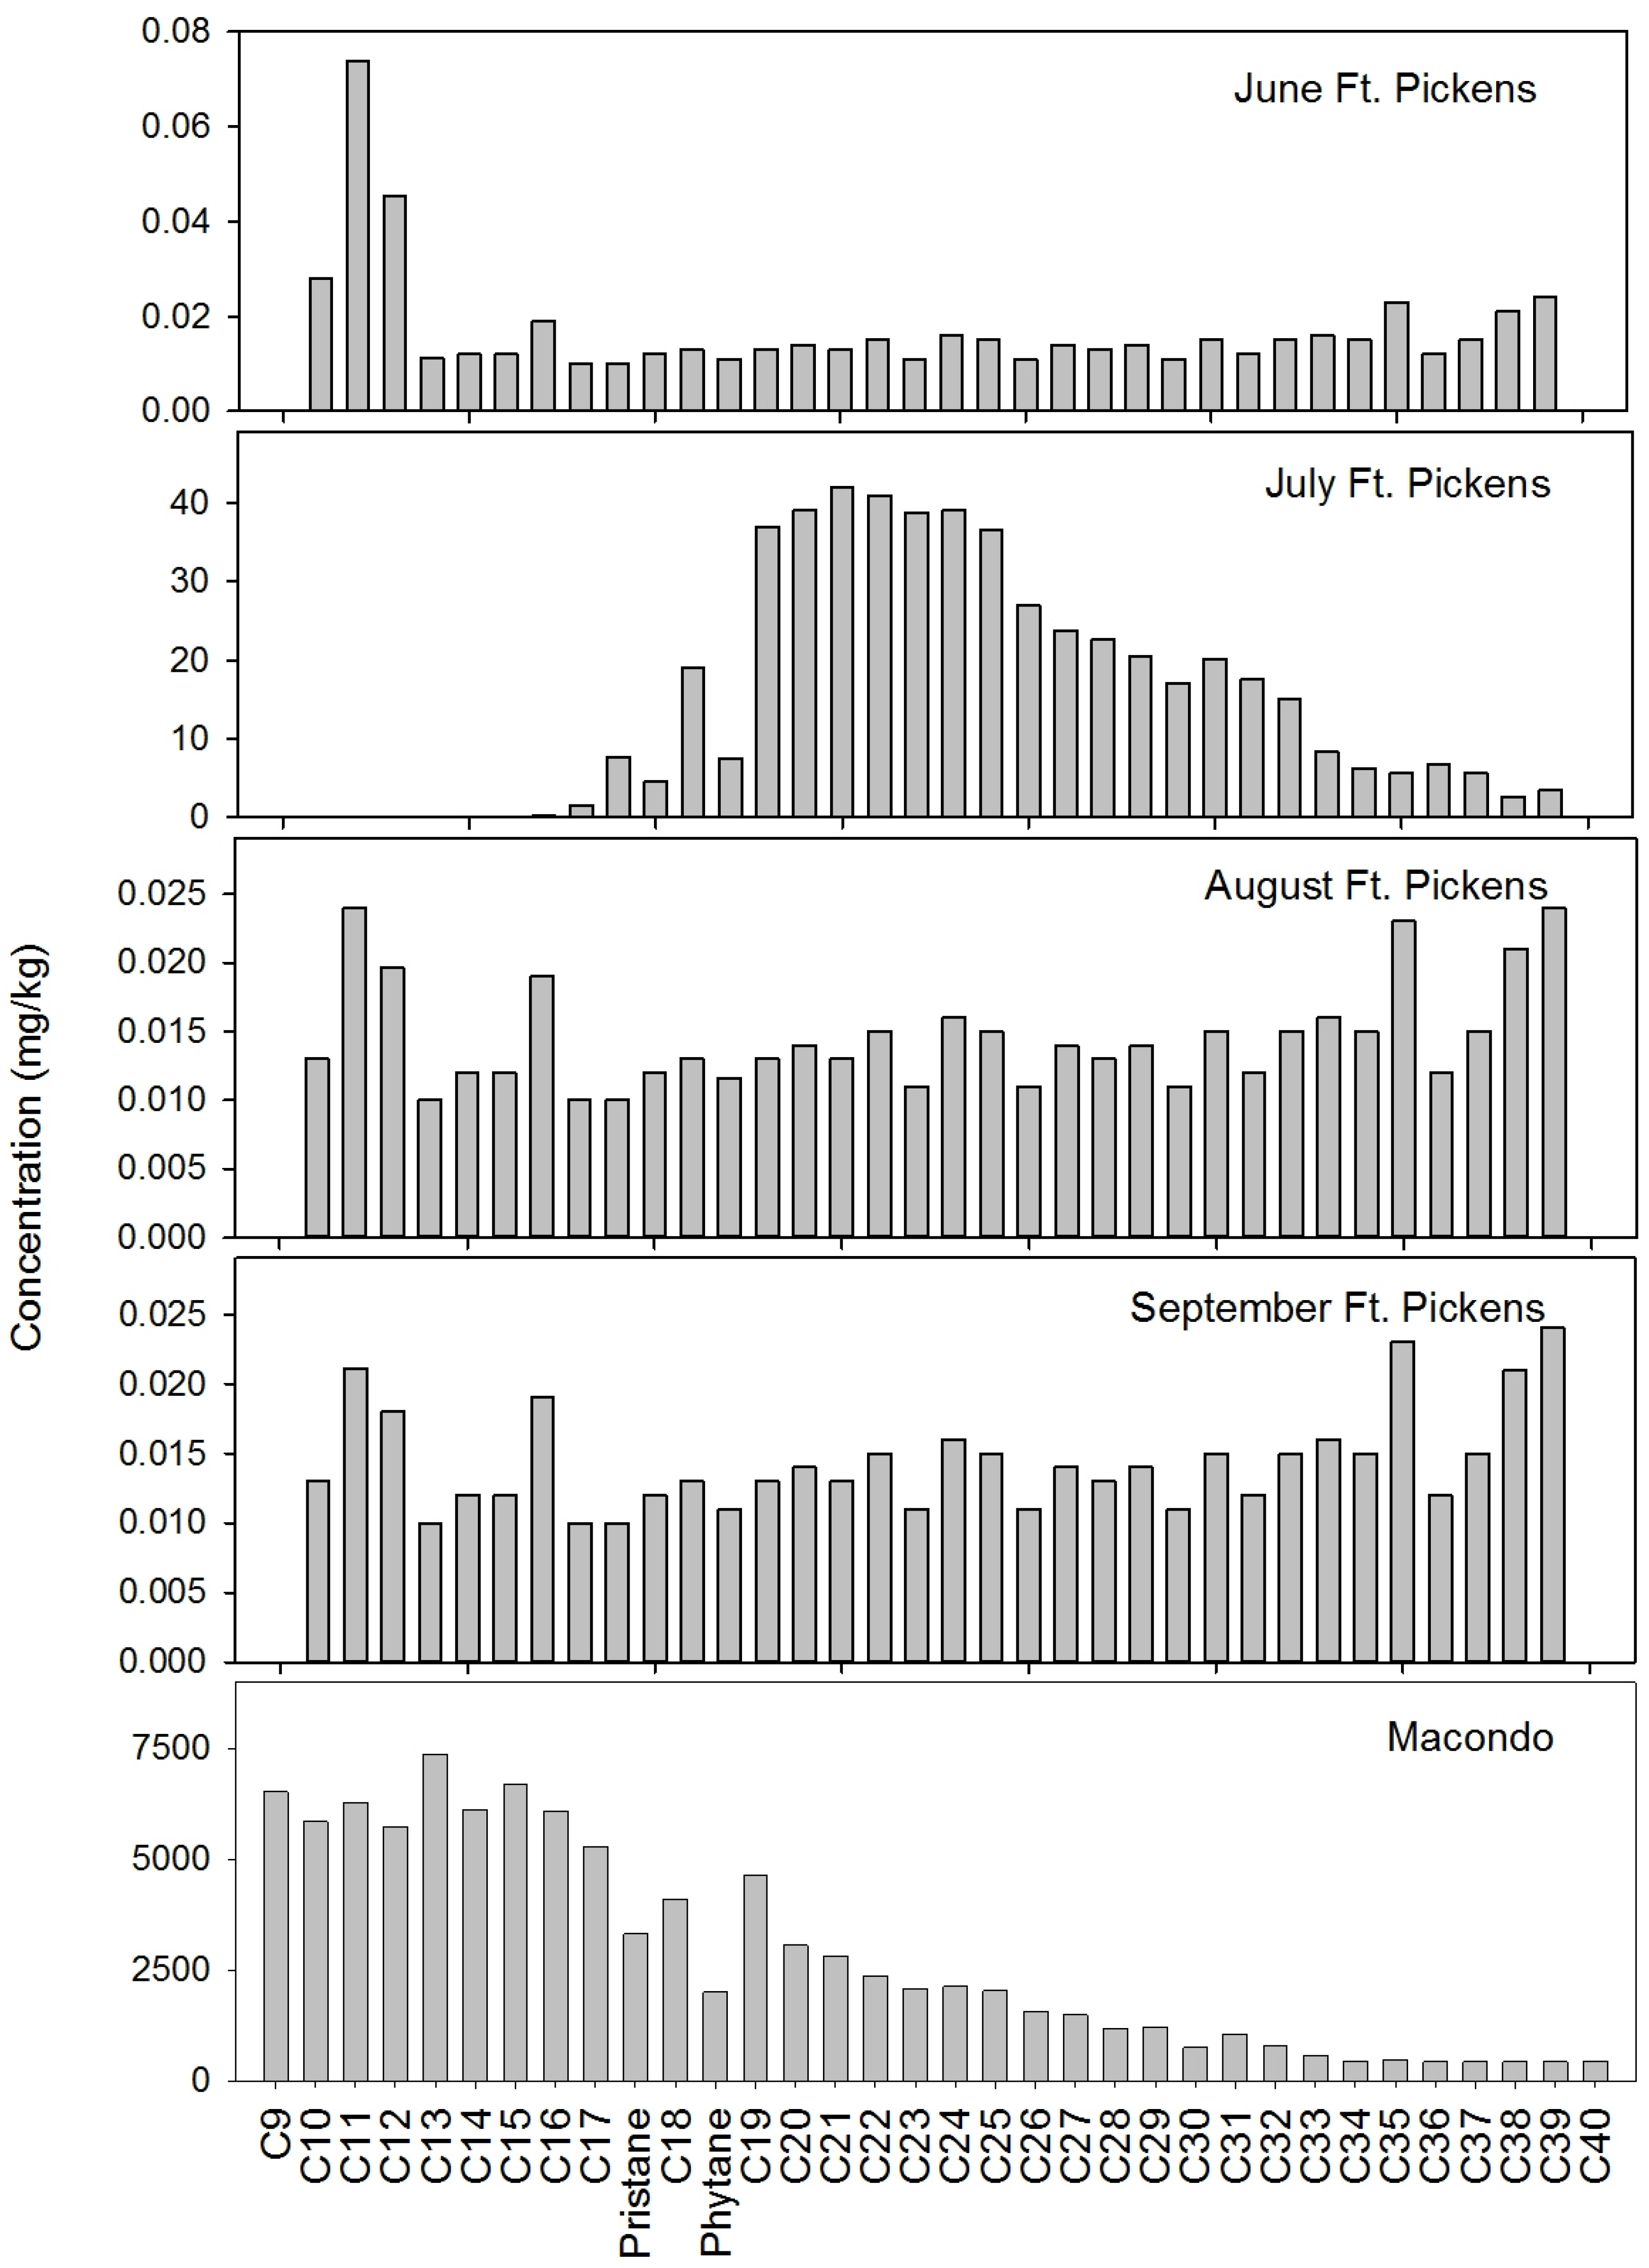
Assessment of TPH levels, PAH and alkane distributions, and geochemical biomarker ratios in MCO and shoreline sediment samples collected prior to oil impact, during active oiling, and post well capping showed that only two sites had evidence of oil derived from the DWH spill. Samples collected during the period of active oiling at Fort Pickens (FP, Site 1) at the entrance to Pensacola Bay and Naval Air Station (NAS, Site 18) within 2 km of the entrance had elevated TPH and PAH concentrations, and norhopane, triterpane, and other biomarker ratios generally consistent with weathered MCO (Table 3). These samples also showed a characteristic pattern of depletion of C9 to C19 alkanes and C0 to C4 naphthalenes indicative of weathered crude oil, and higher concentrations of C2 and C3 PAH homologs (Figure 2 and Figure 3). Relative tPAH and alkane depletion ratios indicated high weathering in both FP and NAS samples, whereas alkane to isoprenoid ratios were equivocal (Table 3). Pre-oiling and post well capping samples at FP and NAS, and all other sample locations and times had low concentrations of petroleum (Table 2, Figure 2 and Figure 3).

3.3. Other Contaminants

Of the 72 non-petroleum analytes, 55 were not detected at any site (Table S2). None of the 26 organophosphates or seven PCB aroclors were detected. Of the 31 pesticides, 25 were not found at any of the sites; however, DDT isomers, dieldrin, and heptachlor epoxide were detected in Santa Rosa Sound (Sites 5, 6, and 7) as well as Bayou Texar (Sites 13 and 14), and Bayou Chico (Site 15; Table S3). Trace amounts of metals were found at most sites (Table S4). Bayous Chico and Texar had higher levels of metals than other sites. Lead levels in both bayous (Sites 14 and 15) and copper levels in north Santa Rosa Sound (site 7) were as much as 200-fold higher than levels detected at other sites (Table S4).
Figure 2. Composition of unsubstituted (0) and alkyl homologs (1 to 4 carbons) of PAHs in Macondo crude oil and shoreline sediment samples from Fort Pickens, Santa Rosa Island, Florida (Site 1; Figure 1, Table 1). Samples collected in June (Pensacola Beach pre-impact), July (following visible oiling), and August (post oiling). Note scale differences. N: napthalenes, BT: Benzothiophenes, ACL: Acenaphthylene; ACE: Acenaphthene; F: fluorenes; D: Dibenzothiophenes, PH: Phenanthrene; AN: Anthracene; PA: Phenanthrenes/anthracenes; NB: Napthobenzothiophenes; FA: Fluoranthene; PO: Pyrene; FP: Fluoranthenes/pyrenes; BAA: Benzo(a)anthracene; C: Chrysenes; BAF: Benzo(a)fluorene; BBF: Benzo(b)fluorene; BKF: Benzo(k)fluorene; BEP: Benzo(e)pyrene; BAP: Benzo(a)pyrene; IPY: Ideno(1,3,3-CD)perylene; DBA: Dibenzo(a,h)anthracene; BPL: Benzo(g,h,i)perylene; PL: Perylene.
Jmse 03 01136 g002
Figure 3. Alkane distribution (nonane, C9 to tetracontane, C40) in Macondo crude oil and shoreline sediment samples from Fort Pickens, Santa Rosa Island, Florida (Site 1; Figure 1, Table 1). Samples collected in June (Pensacola Beach pre-impact), July (during peak oiling), and August (post oiling). Note scale differences of samples.
Jmse 03 01136 g003

4. Discussion

Over 1600 km of northern Gulf of Mexico shorelines were impacted from the DWH spill, with approximately 360 km heavily oiled [1,2,7]. SCAT survey results, satellite imagery, and cumulative oil determinations indicated that shoreline oiling was temporally and spatially heterogeneous [6]. In Florida, SCAT surveys were focused on the western barrier islands, with only a few surveys performed within the large estuary systems [6,7]. The analysis of petroleum analytes in the current study were consistent with available SCAT results and satellite imagery that heavy shoreline oiling within the Pensacola Bay system was limited to areas in proximity to the Gulf of Mexico. Other locations and sample times showed only trace petroleum contamination, and limited evidence of MCO. The June sampling dates preceded oil impacts on Santa Rosa Island and the Pensacola Bay system, consistent with sampling results in the current study. The single elevation in C2-chrysenes in the June Fort Pickens sample (Figure 2) appeared to be a minor anomaly compared to the 200 ppb of this specific PAH in the impacted July sample. Although visible oil occurred in proximity to Pensacola Bay for approximately two weeks, the hydrodynamics of the system may have limited more extensive shoreline oiling. Surface flows tend to be seaward, and based on average river flow and tidal range, the Pensacola Bay system should flush approximately every 34 days [11]. Additionally, the minimal tidal range of 0.5 m and primarily sandy shoreline sediments would tend to limit oil stranding and reduce residence time within the bay system.
Of the 138 sediment samples collected within the Pensacola Bay system in the current study and analyzed for TPH, only the July and August 2010 samples closest to the Gulf of Mexico had elevated levels of petroleum hydrocarbons and showed a clear signature of weathered MCO. Moderate weathering was indicated by the depletion of alkyl napthalenes and lower molecular weight alkanes, and similar concentrations of C2 and C3 PAH homologs [14]. Relative tPAH and alkane depletion, weathering ratios and quantitative biomarker ratios also were indicative of weathered MCO and consistent with other reported values [3,16,17,21]. For example, norhopane ratios (Ts/Tm; Ts/(Ts + Tm); 29D/29H) showed declines with distance from the Gulf of Mexico, whereas cyclic terpane (24Tri/23Tri) and hopane (C31S/(S + R); C31S/H30) ratios were elevated relative to MCO (Table 3). Triplet terp and cholestane (C28R/C29R) ratios were similar between MCO and the two impacted sites. Geochemical biomarkers have been used routinely in oil spill forensics since the Exxon Valdez incident because they are relatively resistant to degradation and oil formed under different geological conditions can have unique biomarker fingerprints [15,18]. Rosenbauer et al. [3,16] used a suite of diagnostic biomarkers to determine the presence of MCO oil in pre- and post- impact sediment and tar bar samples from Texas to Florida. The one Santa Rosa Island sample site (east of Navarre Beach, Florida) of Rosenbauer et al. [3,16] had no identifiable MCO in May 2010, whereas in October 2010 the sample results were indicative of a mixture of MCO and other oil sources. Mousse collected approximately 50 km west of the Santa Rosa Island Florida site in Alabama by Muglabagal et al. [17] during the June peak oiling period also showed a strong MCO signature.
Only the July Fort Pickens sample in the current study had high levels of TPH and petrogenic PAHs, and was the only sample to exceed screening level aquatic toxicity benchmarks for PAHs in sediment [22]. Maximum concentrations of 4600 mg TPH/kg were similar to levels reported by Kostka et al. [23] for the heavily exposed Gulf of Mexico side of Santa Rosa Island. These observations were consistent with the OSAT [24] report of a generally low incidence of coastal sediment samples exceeding aquatic toxicity benchmarks during the DWH spill. Sampling at Fort Pickens in August and September showed that petroleum contamination at this location had returned to pre-impact levels. OSAT [24] concluded that oil was weathering with variable degradation rates after the DWH spill, and bacterial gene sequencing revealed the presence of both alkane and PAH degraders in Santa Rosa island beach sand [23]. However, oil loss from the sandy shoreline sediments of the Pensacola Bay system may have been more dependent on tidal scouring and water washing than biodegradation. Remedial actions including beach cleaning and physical oil removal may also have contributed to oil declines [7]. Analysis of a diversity of potential other contaminants showed only minimal non-petroleum contamination of shoreline sediments within the Pensacola Bay system.
In contrast to petroleum contamination, metal and organic contaminants were largely restricted to anthropogenic source areas in proximity to boat docks and bayous, consistent with EPA [11] results for deeper surficial sediments. Alkyl homologs were absent in PAH profiles in shoreline sediment samples collected in areas of Pensacola Bay distant from the Gulf of Mexico and were indicative of combustion sources rather than oiling. The conclusion that Deepwater Horizon oiling of shoreline sediments was limited within the Pensacola Bay must be considered in the context of the sampling design. Sampling focused on surficial sediments of the estuary system and did not target deeper sediments, submerged tar mats, or the heavily oiled southern shoreline sediments of Santa Rosa Island within the Gulf of Mexico, areas which are known to be impacted by the spill [25]. Additional research and analysis of historical samples would be needed to address areas not targeted in this study.

Supplementary Materials

Supplementary File 1

Acknowledgments

Thanks to Greg Salata and staff at ALS for analytical chemistry, to Robyn Conmy for review of a draft of the manuscript, and to Becky Hemmer, Crystal Jackson, Hannah Rutter, Michael Norberg, and Alex Almario for field team assistance. The opinions expressed in this work are those of the authors and do not represent the policies or opinions of the U.S. EPA.

Author Contributions

M.G.B., J.A. and S.R. conceived of the study and designed the sampling and analysis plan. J.A. and S.R. performed sediment collections. J.A. and M.G.B. compiled, summarized, and interpreted the results. M.G.B. drafted the manuscript. All authors read and approved the manuscript.

Conflicts of Interest

The authors declare no conflict of interest.

References

  1. USCG. On Scene Coordinator Report Deepwater Horizon Oil Spill. Submitted to National Response Team September 2011. United States Coast Guard: Cincinnati, OH, USA, 2010. Available online: http://www.uscg.mil/foia/docs/dwh/fosc_dwh_report.pdf (accessed on 15 January 2015).
  2. Barron, M.G. Ecological impacts of the Deepwater Horizon oil spill: Implications for immuntoxicity. Toxicol. Pathol. 2012, 40, 315–320. [Google Scholar] [CrossRef] [PubMed]
  3. Rosenbauer, R.J.; Campbell, P.L.; Lam, A.; Lorenson, T.D.; Hostettler, F.D.; Thomas, B.; Wong, F.L. Reconnaissance of Macondo-1 Well Oil in Sediment and Tarballs from the Northern Gulf of Mexico Shoreline, Texas to Florida; U.S. Geological Survey Open-File Report 2010–1290; United States Coast Guard: Cincinnati, OH, USA, 2010. Available online: http://pubs.usgs.gov/of/2010/1290/of2010-1290.pdf (accessed on 15 January 2015).
  4. Eckle, P.; Burgherr, P.; Michaux, E. Risk of large oil spills: A statistical analysis in the aftermath of Deepwater Horizon. Environ. Sci. Technol. 2012, 46, 13002–13008. [Google Scholar] [CrossRef] [PubMed]
  5. Carriger, J.; Barron, M.G. Minimizing risks from spilled oil to ecosystem services using influence diagrams: The Deepwater Horizon spill response. Environ. Sci. Technol. 2011, 45, 7631–7639. [Google Scholar] [CrossRef] [PubMed]
  6. NOAA. Environmental Response Management Application (ERMA) Deepwater Gulf Response. National Oceanographic and Atmospheric Administration; NOAA: Washington, DC, USA, 2013. Available online: http://resources.geoplatform.gov/news/mapping-response-bp-oil-spill-gulf-mexico (accessed on 25 September 2013).
  7. Michel, J.; Owens, E.H.; Zengel, S.; Graham, A.; Nixon, Z.; Allard, T.; Holton, W.; Reimer, P.D.; Lamarche, A.; White, M.; et al. Extent and degree of shoreline oiling: Deepwater Horizon oil spill, Gulf of Mexico, USA. PLoS ONE 2013, 8, e65087. [Google Scholar] [CrossRef] [PubMed]
  8. Dietrich, J.C.; Trahan, C.J.; Howard, M.T.; Fleming, J.G.; Weaver, R.J.; Tanaka, S.; Yu, L.; Luettich, R.A.; Dawson, C.N.; Westerink, J.J.; et al. Surface trajectories of oil transport along the northern coastline of the Gulf of Mexico. Cont. Shelf Res. 2012, 41, 17–48. [Google Scholar] [CrossRef]
  9. Sammarco, P.W.; Kolian, S.R.; Warby, R.A.F.; Bouldin, J.L.; Subra, W.A.; Porter, S.A. Distribution and concentrations of petroleum hydrocarbons associated with the BP/Deepwater Horizon oil spill, Gulf of Mexico. Mar. Pollut. Bull. 2013, 73, 129–143. [Google Scholar] [CrossRef] [PubMed]
  10. Allan, S.E.; Smith, B.W.; Anderson, K.A. Impact of Deepwater Horizon oil spill on bioavailable polycyclic aromatic hydrocarbons in Gulf of Mexico coastal waters. Environ. Sci. Technol. 2012, 46, 2033–2039. [Google Scholar] [CrossRef] [PubMed]
  11. USEPA. The Ecological Condition of the Pensacola Bay System, Northwest Florida; EPA/620/R-05/002; United States Environmental Protection Agency, Office of Research and Development: Washington, DC, USA, 2005.
  12. ESRI. ArcGIS Desktop: Release 10; Environmental Systems Research Institute: Redlands, CA, USA, 2011. [Google Scholar]
  13. Page, D.S.; Boehm, P.D.; Douglas, G.S.; Bence, A.E. Identification of hydrocarbon sources in the benthic sediments of Prince William Sound and the Gulf of Alaska following the Exxon Valdez oil spill. In Exxon Valdez Oil Spill: Fate and Effects in Alaskan Waters; ASTM STP 1219; Wells, P.G., Bulter, J.N., Hughes, J.S, Eds.; American Society for Testing and Materials: Philadelphia, PA, USA, 2008; pp. 44–83. [Google Scholar]
  14. Wang, Z.; Stout, S.A. Chemical fingerprinting of spilled or discharged petroleum—Methods and factors affecting petroleum fingerprints in the environment. In Oil Spill Environmental Forensics: Fingerprinting and Source Identification; Wang, Z., Stout, S.A., Eds.; Elsevier Publishing Company: Boston, MA, USA, 2007; pp. 1–53. [Google Scholar]
  15. Wang, Z.; Stout, S.A.; Fingas, M. Forensic fingerprinting of biomarkers for oil spill characterization and source identification. Environ. Forensics 2006, 7, 105–146. [Google Scholar] [CrossRef]
  16. Rosenbauer, R.J.; Campbell, P.L.; Lam, A.; Lorenson, T.D.; Hostettler, F.D.; Thomas, B.; Wong, F.L. Petroleum Hydrocarbons in Sediment from Northern Gulf of Mexico Shoreline, Texas to Florida; U.S. Geological Survey Open-File Report 2011-1014; USGS: Reston, VA, USA, 2011. Available online: http://pubs.usgs.gov/of/2011/1014/of2011-1014.pdf (accessed on 15 January 2015).
  17. Mulabagal, V.; Yin, F.; John, G.F.; Hayworth, J.S.; Clement, T.P. Chemical fingerprinting of petroleum biomarkers in Deepwater Horizon oil spill samples collected from Alabama shoreline. Mar. Pollut. Bull. 2013, 70, 147–154. [Google Scholar] [CrossRef] [PubMed]
  18. Hostettler, F.D.; Lorenson, T.D.; Bekins, B.A. Petroleum fingerprinting with organic markers. Environ. Forensics 2013, 14, 262–277. [Google Scholar] [CrossRef]
  19. Douglas, G.S.; Bence, A.E.; Prince, R.C.; McMillen, S.J.; Buttler, E.L. Environmental stability of selected petroleum hydrocarbon source and weathering ratios. Environ. Sci. Technol. 1996, 30, 2332–2339. [Google Scholar] [CrossRef]
  20. Atlas, R.M.; Bragg, J.R. Bioremediation of marine oil spills: When and when not—The Exxon Valdez experience. Microbiol. Biotech. 2009, 2, 213–221. [Google Scholar]
  21. Schantz, M.M.; Kucklick, J.R. Interlaboratory Analytical Comparison Study to Support Deepwater Horizon Natural Resource Damage Assessment: Description and Results for Crude Oil QA10OIL01; NISTIR 7793; National Institute of Standards and Technology: Gaithersburg, MD, USA, 2011.
  22. Buchman, M.F. NOAA Screening Quick Reference Tables; NOAA OR&R Report 08-1; National Oceanic and Atmospheric Administration: Seattle, WA, USA, 2008; p. 34.
  23. Kostka, J.E.; Prakash, O.; Overholt, W.A.; Green, S.J.; Freyer, G.; Canion, A.; Delgardio, J.; Norton, N.; Hazen, T.C.; Huettel, M. Hydrocarbon-degrading bacteria and the bacterial community response in Gulf of Mexico beach sands impacted by the Deepwater Horizon Spill. Appl. Environ. Microbiol. 2011, 77, 7962–7974. [Google Scholar] [CrossRef] [PubMed]
  24. OSAT. Summary Report for Fate and Effects of Remnant Oil Remaining in the Beach Environment; Operational Science Advisory Team (OSAT-2); United States Coast Guard: Cincinnati, OH, USA, 2011. Available online: http://www.restorethegulf.gov/sites/default/files/u316/OSAT-2%20Report%20no%20ltr.pdf (accessed on 15 January 2015).
  25. Hayworth, J.S.; Clement, T.P.; Valentine, J.F. Deepwater Horizon oil spill impacts on Alabama beaches. Hydrol. Earth Syst. Sci. 2011, 15, 3639–3649. [Google Scholar] [CrossRef]