Article

Deep-Sea Sediment Creep Mechanism and Prediction: Modified Singh–Mitchell Model Under Temperature–Stress–Time Coupling


1
College of Civil Engineering, Hunan University of Science and Technology, Xiangtan 411201, China
2
Hunan Province Key Laboratory of Geotechnical Engineering Stability Control and Health Monitoring, Hunan University of Science and Technology, Xiangtan 411201, China
3
National-Local Joint Engineering Laboratory of Marine Mineral Resources Exploration Equipment and Safety Technology, Hunan University of Science and Technology, Xiangtan 411201, China
*
Author to whom correspondence should be addressed.
J. Mar. Sci. Eng. 2026, 14(2), 133; https://doi.org/10.3390/jmse14020133
Submission received: 19 November 2025 / Revised: 30 December 2025 / Accepted: 6 January 2026 / Published: 8 January 2026
(This article belongs to the Section Ocean Engineering)

Abstract

With the advancement in deep-sea resource development, the creep behavior of deep-sea remolded sediments under coupled temperature, confining pressure (σ3), and stress effects has become a critical issue threatening engineering stability. The traditional Singh–Mitchell model, limited by its neglect of temperature effects and prediction of infinite strain, struggles to meet deep-sea environmental requirements. Based on low-temperature, high-pressure triaxial tests (with temperatures ranging from 4 to 40 °C and confining pressures ranging from 100 to 300 kPa), this study proposes a modified model incorporating temperature–stress–time coupling. The model introduces a hyperbolic creep strain rate decay function to achieve strain convergence, establishes a saturated strain–stress exponential relationship, and quantifies the effect of temperature on characteristic time via coupling through the Arrhenius equation. The modified model demonstrates R2 values > 0.96 for full-condition creep curves. The results show several key findings: a 10 °C increase in temperature leads to a 30–50% growth in the steady-state creep rate; a 100 kPa increase in confining pressure enhances long-term strength by 20–30%. 20 °C serves as a critical temperature point. At this point, strain amplification reaches 2.1 times that of low-temperature ranges. These experimental findings provide crucial theoretical foundations and technical support for incorporating soil creep effects in deep-sea engineering design.

1. Introduction

As engineering projects such as deep-sea oil and gas development, seabed mineral extraction, and pipeline installation advance into waters deeper than 2000 m, the long-term deformation stability of deep-sea remolded sediments has become a critical challenge threatening engineering safety [1,2,3]. The deep-sea environment is characterized by high hydrostatic pressures, low temperatures, high water content, and complex geological stress fields. These conditions cause sediment and artificial backfill materials to exhibit mechanical responses that are fundamentally different from those of terrestrial soft soils. Creep behavior serves as a key trigger for seabed structural instability, with interface interactions between seabed structures (such as pile foundations, pipelines, and mining vehicle tracks) and remolded sediments inducing sustained creep. The unique coupling effects of low temperatures, high confining pressures, and stress gradients in deep-sea environments further complicate creep behavior [4,5,6,7,8,9]. This not only threatens the applicability and durability of seabed engineering facilities but also creates an urgent need for the precise prediction of the long-term mechanical characteristics of sediments in deep-sea resource development [10]. Therefore, elucidating the regulatory mechanisms of deep-sea environmental factors on remolded sediments creep behavior and accurately predicting creep under temperature–stress–time coupling conditions are prerequisites for ensuring long-term safety in deep-sea engineering.
Current research on soil creep has extensively covered special soil types such as marine soft soils [11], natural gas hydrate sediments [12], and calcareous sands [13,14], focusing on the influence of loading conditions, structural characteristics, and environmental factors on the entire creep process. For instance, Hu et al. [15] found through multi-step loading tests that marine natural gas hydrate sediments primarily exhibit elastic deformation and attenuation creep under low-loading conditions and that they enter an elastic–plastic deformation stage with significantly accelerated creep rates under medium–high-loading conditions. Li et al. [16] demonstrated that the long-term strength of sandy hydrate sediments (GHBS) is merely 0.45–0.60 times the triaxial shear strength, and acoustic parameters such as sound velocity and dominant frequency during creep can effectively characterize the evolution of material damage. Tang et al. [5,17] pointed out that calcareous sand creep curves exhibit two-phase characteristics of “deceleration–stabilization”, with particle fragmentation effects intensifying as stress levels increase, necessitating the introduction of fragmentation parameters in models to improve prediction accuracy. Additionally, Liu et al. [18] took into account the spatiotemporal deformation data during both the construction and storage phases to forecast the long-term deformation and conduct the inversion of creep parameters in the vicinity of the dam slope. Yuan et al. [19] observed, through scanning electron microscopy, that Nansha soft soil particles exhibit reduced spacing and an elliptical pore morphology during creep, with the fragmentation degree increasing nonlinearly under pressure. These studies collectively demonstrate that soil creep behavior is closely related to loading levels, material composition, and microstructural evolution. They also lay the foundation for nonlinear deformation analyses of remolded sediments in deep-sea environments.
As temperature is a critical factor in deep-sea environments, its regulatory mechanisms on soil creep have become a research hotspot. Li et al. [16] demonstrated through experiments reshaping Hong Kong marine sediments that temperature increases shorten the main consolidation time and enhance permeability coefficients, while the compression index Cc shows minimal temperature dependence. Kirkham et al. [20] investigated the thermodynamic properties of artificial clay (KSS), revealing that thermal volume strain not only correlates with the overconsolidation ratio (OCR) but is also constrained by pressure levels. The irreversible thermal deformation observed in highly consolidated samples may originate from the formation of Hvorslev yield surfaces. Merita Tafili [21] proposed that the coupling effect of the temperature and creep strain rate alters soil stiffness and strength, with heating-induced irreversible compression and thermal expansion significantly impacting long-term deformation, even under constant stress. Additionally, Staszewska et al. [20] conducted frozen soil tests at −5 to −2 °C, showing that creep curves may lack acceleration phases in low-temperature environments, with the ice content inversely correlating with creep sensitivity. Wang et al. [22] focused on radioactive waste disposal sites. They highlighted that temperature variations from thermal systems accelerate soil consolidation creep significantly. This necessitates three-dimensional viscoelastic models to account for dynamic thermal expansion viscosity changes. Amin [23] and Lv [24] investigated the strain response of temperature gradient-frozen clay under triaxial creep conditions, proposing a constitutive model for frozen soil thermal creep deformation based on critical state thermoplastic–viscoplastic theory. These findings revealed the complex regulatory role of temperature in remolded sediment creep behavior in low-temperature, high-pressure environments.
The theoretical modeling of soil creep has evolved from macroscopic phenomenological models to multi-scale coupled models. Hu et al. [15] proposed a modified Kelvin-type ideal viscoplastic Westerly model based on experimental data, introducing nonlinear viscosity coefficients to describe damage characteristics. Liu et al. [25] validated the applicability of the Singh–Mitchell empirical model in predicting creep in the South China Sea sediments through a comparative analysis of different constitutive models. Xia et al. [26] improved the Discrete Element Method (DEM) by integrating Parallel Contacted Particle Code (PFC) to construct a “wing-type” physical model, achieving high-precision simulation of soft rock creep throughout its lifecycle (attenuation–stabilization–acceleration phase) with an error rate below 3%. Additionally, Zhou et al. [27] established a macro–mesoscopic coupled model using Photoshop software to quantify particle porosity characteristics, revealing how pore reduction and particle orientation contribute to creep deformation under loading conditions. Liu et al. [28] proposed a “nonlinear spring–Bingham slider” model for marine soft clay, simultaneously considering elastic, plastic, and viscous effects, providing a predictive tool for tunnel and pile foundation design. Wang et al. [29] established the creep characteristics of frozen soil under variable temperature conditions and a saturated state, along with a unified macroscopic creep model. Ma et al. [30] conducted triaxial compression and creep tests on deep-sea soft sediment from the C-C mining area in the Pacific. The study revealed that the K-H model accurately captured the triaxial compression creep characteristics of the simulated soil under identical confining pressures and varying axial pressures. However, existing models predominantly address single factors (e.g., loading or temperature) while insufficiently accounting for multi-field coupling effects, such as high confining pressures, low temperatures, and pore water pressures in deep-sea environments. There is an urgent need to develop creep models that are applicable to reconstituted soils.
In summary, while existing research has made significant progress in understanding soil creep behavior, temperature effects, and model development, most studies have focused on terrestrial soft soils or shallow marine sediments. Research on deep-sea sediments remains limited, primarily concentrating on specific environments (such as those containing natural gas hydrates or calcareous sand). Systematic studies on the creep mechanisms and predictive models of deep-sea soft soils under temperature–perimeter–pressure–stress multi-field coupling still exhibit notable gaps. Moreover, current models predominantly address single factors or scales, lacking a four-dimensional creep constitutive framework that integrates temperature, stress, damage, and time. This limitation hinders the advancement in deep-sea engineering soil mechanics theory. From an engineering perspective, the precise prediction of long-term deformation in remolded sediments for deep-sea resource development remains critical, yet the robustness and generalizability of the existing methods require further enhancement. This study investigates deep-sea remolded soil through triaxial creep tests performed under laboratory conditions. We simulate temperature gradients (4–40 °C) across different depths, confining pressures (100–300 kPa), and deviatoric stress paths (p = 30–210 kPa) in engineering disturbance scenarios. Through this simulation, we systematically explore the creep behavior governed by the interactions between temperature, confining pressure, and deviatoric stress. This research focuses on analyzing the phase characteristics of creep curves, isochronous evolution patterns, and time–velocity relationships. Building upon the classical Singh–Mitchell model, we introduce temperature sensitivity coefficients and confining pressure enhancement factors to develop a modified creep model incorporating temperature–stress–time coupling effects. Experimental validation confirms the model’s applicability, ultimately revealing how deep-sea environmental factors regulate soil creep behavior. This study provides theoretical foundations and technical support for the long-term deformation prediction and safety design of deep-sea engineering structures. It also offers critical theoretical support for the safe design and operation of deep-sea oil/gas exploration and mineral extraction projects.

2. Materials and Methods

2.1. Soil Sample Collection and Preparation

The deep-sea sediment samples used in this study were collected from specific waters of the South China Sea. Sampling was conducted using the “Hainiu” pressure-resistant core drilling rig, independently developed by Hunan University of Science and Technology, with support from Haiyang Geological Research Vessel No. 2. The rig successfully drilled samples at a depth of 2060 m [31]. After collection, the samples underwent waterproof sealing treatment and were carefully transported to an indoor laboratory, where they were stored in a low-temperature (0–4 °C), high-humidity (RH ≥ 90%) environment. The soil samples used in this experiment were high-liquid-limit cohesive organic soil (CHO), the main physical and mechanical properties of which are detailed in Table 1.

2.2. Test Apparatus and Principle

2.2.1. Test Equipment

The primary equipment used in the experiments described in this section included a low-temperature, high-pressure automatic environmental triaxial testing system manufactured by Xi’an Kangtuo Li Instrument Equipment Co., Ltd. (Xi’an, China). This triaxial testing apparatus is a high-precision, temperature-controlled experimental device that integrates advanced temperature control technology with a triaxial mechanical loading system. Its core components include a pressure chamber, temperature control system, axial loading system, and data acquisition and processing module. The pressure chamber, constructed from high-strength alloy materials, can withstand a confining pressure up to 30 MPa, ensuring stability and safety in deep-sea high-pressure environments. The temperature control unit employs a precision PID control algorithm to achieve accurate temperature regulation, maintaining temperature fluctuations within ±0.1 °C. This equipment can meet testing requirements under various temperature gradients. The axial loading system features high-precision displacement and force control capabilities, accurately simulating the vertical stresses experienced by deep-sea soil. The data acquisition and processing module integrates multi-channel sensor interfaces and high-speed data acquisition cards, enabling the real-time collection of critical parameters, such as stress, strain, and temperature, during testing. These parameters undergo preliminary processing and analysis through built-in software algorithms. Figure 1 illustrates the low-temperature, high-pressure automatic environmental triaxial testing system. The equipment’s main technical parameters are as follows: the maximum triaxial load capacity is 256 kN, the upper limit of the confining pressure is 30 MPa, the maximum back pressure can reach 20 MPa, the axial displacement range is 100 mm, and the temperature control range covers −30 °C to 100 °C.

2.2.2. Test Method

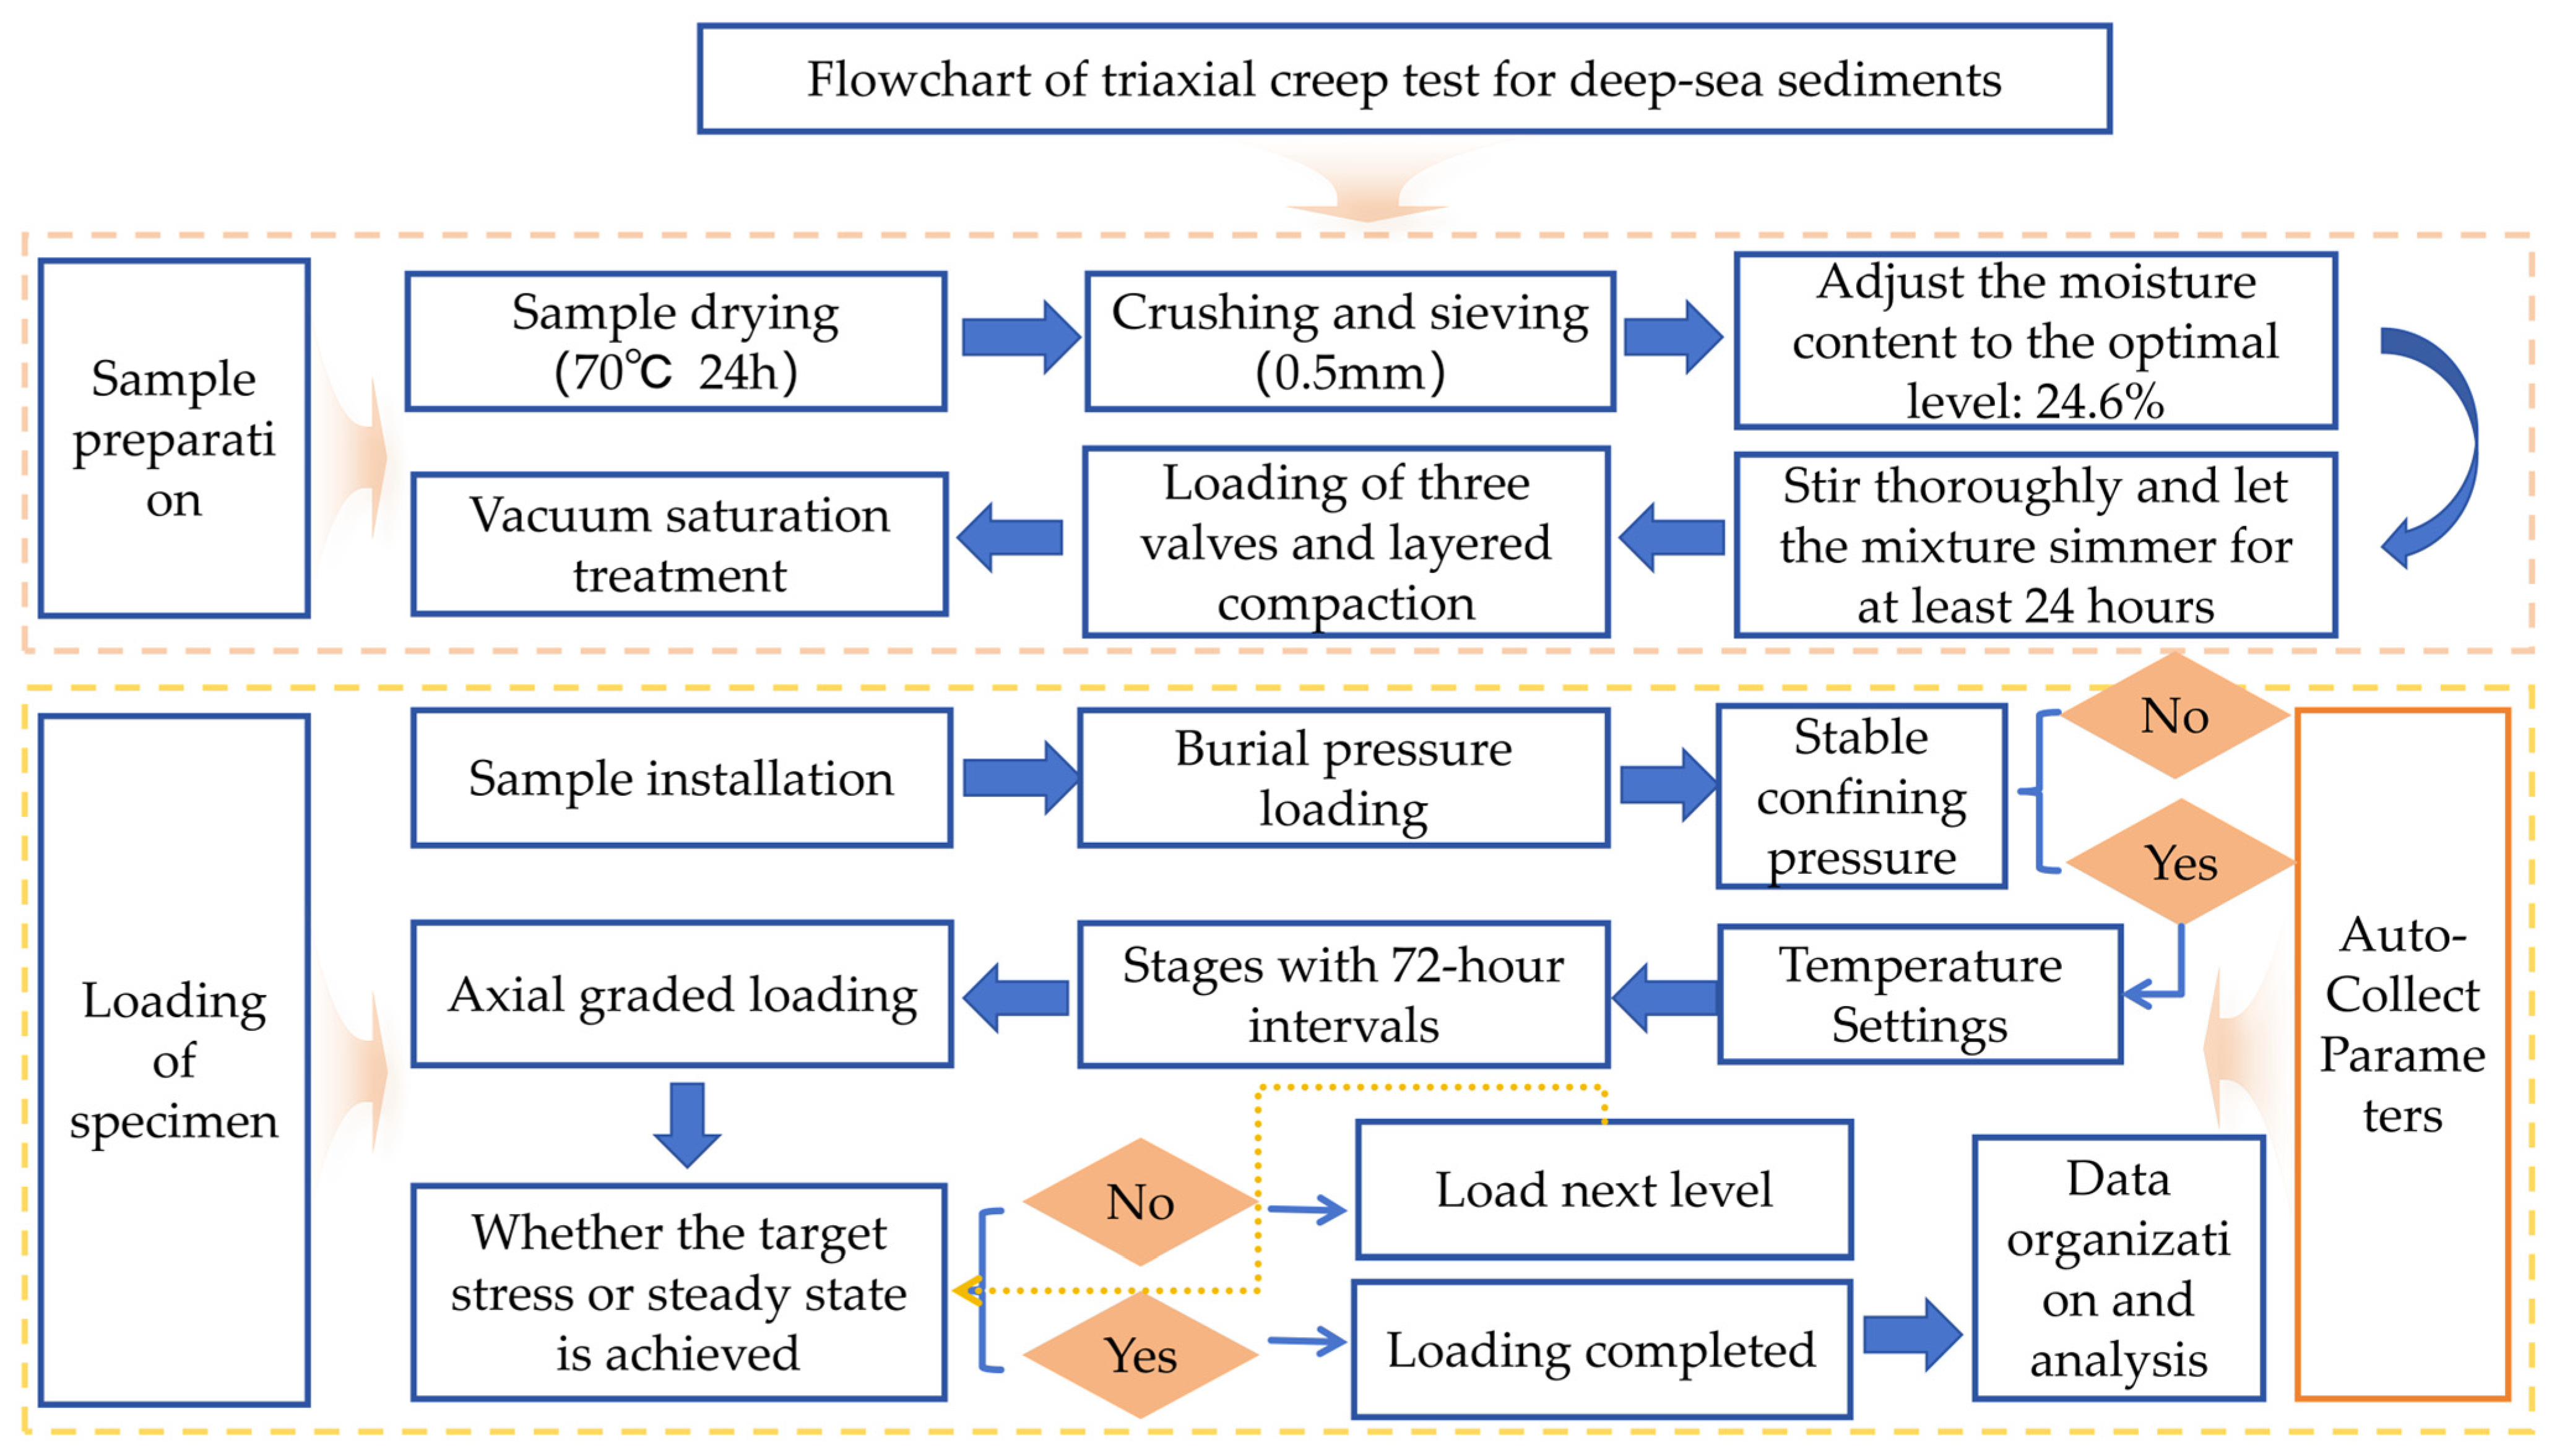
To enhance the comparability of the tests, samples were prepared using reconstituted specimens from the same batch. The preparation process included pretreatment steps such as air-drying, grinding, sieving, homogenization, aliquoting, and storage, followed by test preparation procedures such as tamping and saturation. Sediment samples collected from the seabed at a depth of 2060 m were dried in an oven at 70 °C for 24 h. The soil samples were then crushed and sieved through a 0.5 mm mesh. The sieved sediments were moistened with the calculated water volume to achieve their optimal moisture content of 24.6%, and they were manually mixed to ensure uniform distribution. The prepared soil samples were batch-loaded into standard triaxial mold specimens. After each layer was loaded, layered compaction was performed to ensure uniform density of the soil sample. After the specimens were prepared, they underwent vacuum saturation treatment in a vacuum saturation chamber for at least 24 h to ensure complete saturation (Confirm that the pore water pressure coefficient B is ≥0.95).
During the creep test, the saturated specimen was first placed in the pressure chamber of the low-temperature, high-pressure automated triaxial testing system. Following the predefined test protocol, different confining pressures were applied at a controlled rate of 0.5 kPa/s to ensure smooth loading. Once the confining pressure stabilized, axial pressure was applied through the axial loading system. The axial stress level was set according to the test requirements, with the axial displacement rate maintained at a constant 0.01 mm/min throughout the process to simulate the creep behavior of deep-sea soil under long-term loading conditions.
During the triaxial creep test, the seabed sediment samples were subjected to confining pressures of 100 kPa, 200 kPa, and 300 kPa. These pressure levels were selected to accurately simulate the actual stress conditions experienced by soil at different depths in the South China Sea. Specifically, 100 kPa corresponds to shallow-water environments, 200 kPa represents mid-depth conditions, and 300 kPa mimics high-pressure scenarios in deeper marine zones. Under varying confining pressures, significant changes occur in soil particle arrangement, pore structure, and inter-particle contact forces, which collectively influence creep characteristics. By conducting experiments with these three pressure levels, combined with different temperature gradients, researchers can comprehensively investigate the creep behavior of remolded sediments in the South China Sea under combined temperature and confining pressure effects.
Meanwhile, considering the unique characteristics of deep-sea environments, the influence of temperature on the creep behavior of remolded soil cannot be ignored. The experiment employed temperature gradients of 4 °C (close to in situ low-temperature conditions in deep-sea environments) and 20–40 °C (simulating engineering disturbance temperatures such as drilling-induced thermal disturbances and seabed heat flow development). During the experiment, the temperature was precisely controlled and maintained at four levels: 4 °C, 20 °C, and 40 °C through a temperature control system. Temperature regulation adopted staged heating or cooling methods, with each temperature stage maintained for a sufficient duration (no less than 72 h) to ensure uniform temperature distribution and achieve a stable state within the specimen. Across the temperature variations, the stress–strain response of the specimen was closely monitored to record the impact of temperature fluctuations on the creep curve. Data was collected at a frequency of once per minute, continuously recording parameters such as axial strain, confining pressure changes, axial stress, and temperature during the creep process until the specimen reached a stable state of creep deformation or the specified test time ended. Each confining pressure and temperature combination condition underwent at least three parallel tests to minimize experimental errors and enhance the reliability of the results.
The design of the stress path primarily considers the complex stress states that soil often experiences in actual deep-sea engineering. This experimental design simulates the stress variation process that deep-sea soil may undergo under different engineering scenarios. The design of the 30–210 kPa deviatoric stress path is based on three key considerations: ① The lateral frictional resistance of deep-sea pile foundations causes additional deviatoric stress in soil, which ranges from 30 to 180 kPa. This range is based on design data from the South China Sea oil and gas platform pile foundations. Meanwhile, the instantaneous deviatoric stress exerted by submarine mining vehicle tracks on soil can reach 210 kPa. ② Preliminary tests revealed that the yield deviatoric stress of this deep-sea remolded soil is approximately 60 kPa, leading to the establishment of three stress levels: low (≤60 kPa), medium (90–150 kPa), and high (≥180 kPa), covering the full spectrum from initial creep to steady-state creep and accelerated creep. ③ While existing studies typically employ 30–200 kPa deviatoric stress for similar deep-sea soils, this research extends the stress range to 210 kPa to capture the accelerated creep phase prior to failure [9,10,15,16,18,29].
The loading method adopts a graded loading approach, and each loading stage lasts for 72 h—leading to a total test duration of over 9 months. During loading, initial confining pressure is first applied to consolidate the soil to its initial state, which simulates the overburden pressure that acts on deep-sea soil during sedimentation. Subsequently, axial pressure is imposed to replicate the additional stresses induced by deep-sea engineering structures on the soil. This stress path design enables a more accurate reflection of the actual stress conditions of deep-sea soil in engineering scenarios, thus yielding creep test data with higher engineering applicability. Throughout the experiment, an automated data acquisition system continuously monitored key parameters such as axial stress, axial strain, confining pressure and temperature. This was done to ensure data integrity and accuracy. After the experiment, the collected data were subjected to preliminary collation and analysis. Considering the inhomogeneity of moisture content and density during soil sample preparation, as well as instrument and environmental errors, the experiment used a control variable method. Each test group was repeated three times to keep data dispersion below 5%. Details of the experimental protocol are provided in Table 2 below.
A flowchart of the triaxial creep test is shown in Figure 2.

3. Results

3.1. Creep Process Curve

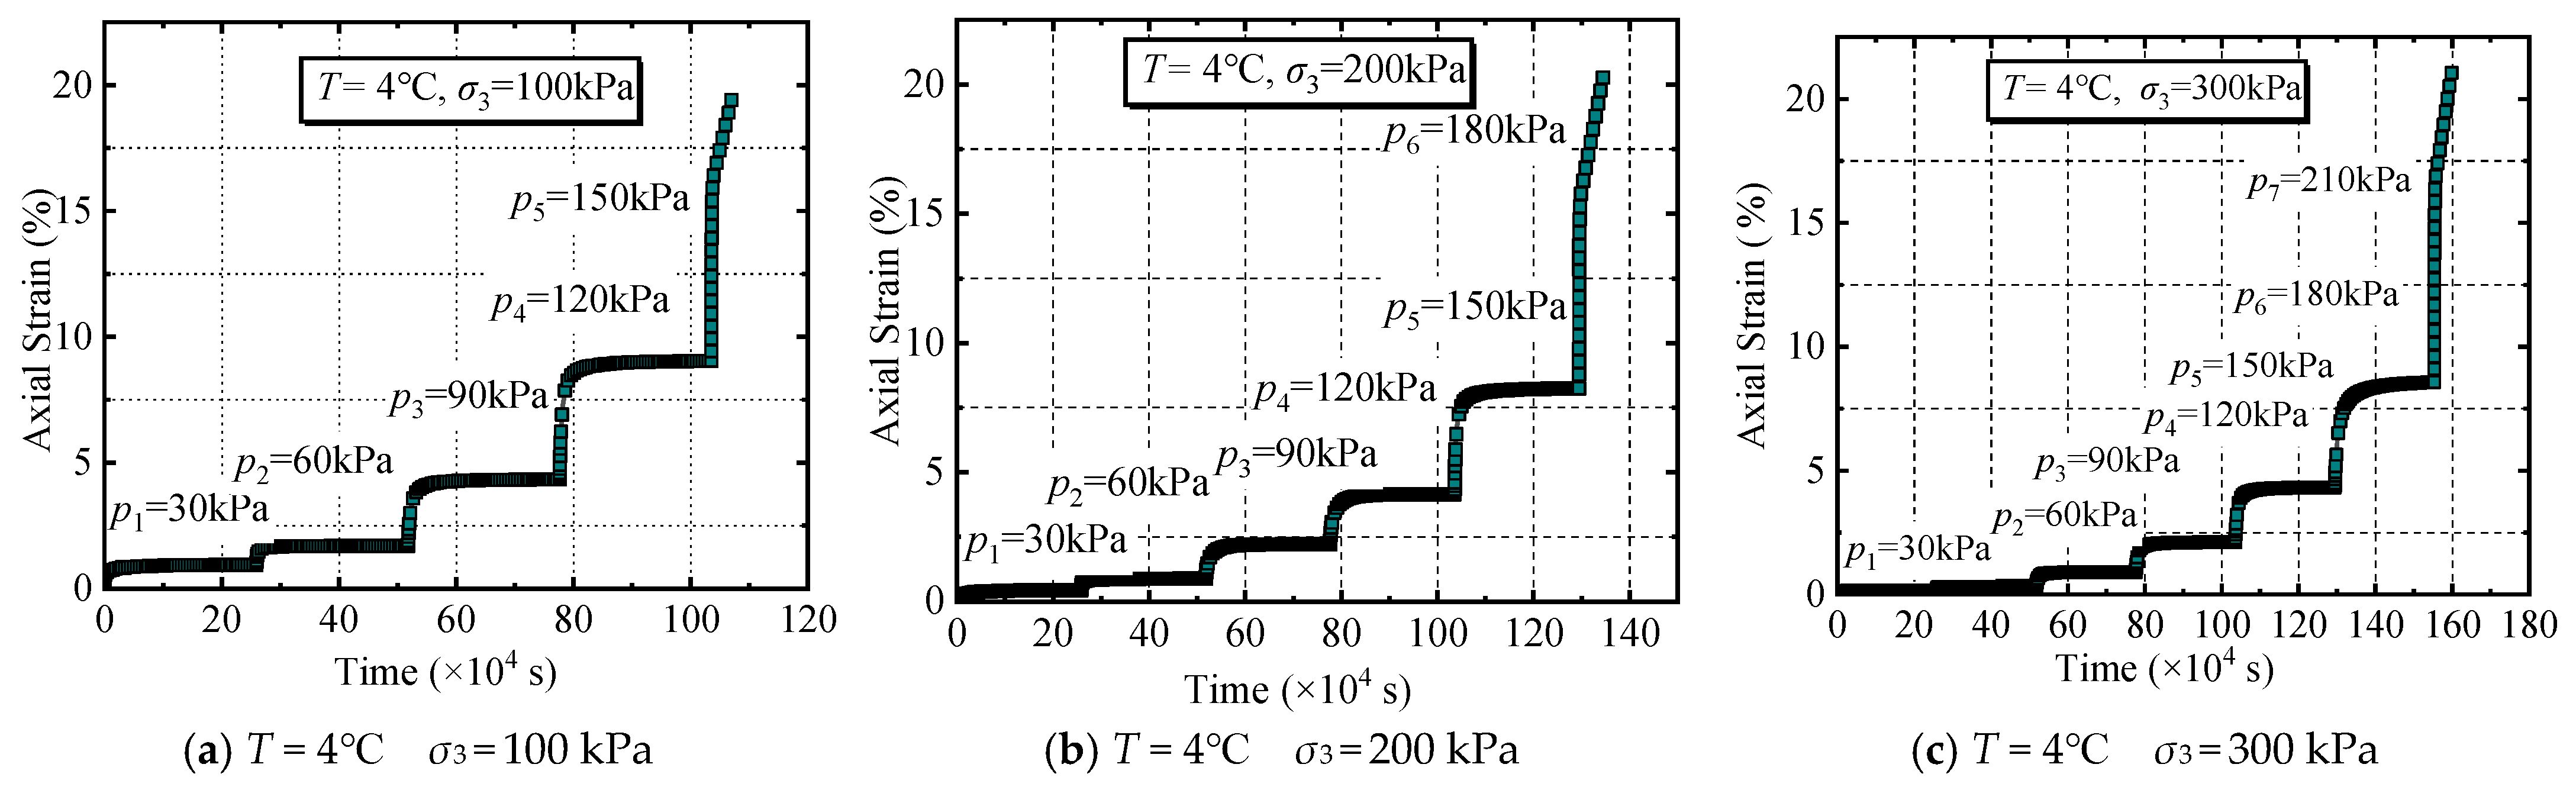
Taking the triaxial creep curves of the samples under varying confining pressures at 4 °C (Figure 3) as an example, this study analyzes the distinct creep characteristics of deep-sea sediments. The analysis demonstrates that, under 4 °C conditions, the sediment creep behavior is a typical stress-driven, time-dependent mechanical process. The complete creep curve systematically exhibits three classical stages: deceleration, a steady state, and acceleration. As a critical influencing factor, the confining pressure significantly enhances the sediments’ creep resistance and long-term strength. A comprehensive analysis of the creep curves under different confining pressures (σ3) and varying deviatoric stresses (p) reveals that the applied deviatoric stress level governs both the progression and rate of creep. At low deviatoric stresses, the samples primarily undergo initial creep, with creep strain rates gradually decreasing over time before stabilizing into a low-rate steady-state phase, indicating long-term stability. However, when the deviatoric stress exceeds a critical threshold, the creep strain rate surges dramatically after brief initial and steady-state phases, entering an accelerated creep phase that ultimately leads to macroscopic failure.
Changes in the confining pressure significantly influence the sediments’ creep resistance and long-term strength. A comparative analysis of three experimental groups reveals that, as the confining pressure σ3 increases from 100 kPa to 300 kPa, the sediments’ long-term strength also improves. This is specifically reflected in the rising threshold stress required to initiate accelerated creep and induce final failure. For instance, at a confining pressure of 100 kPa, a deviatoric stress of 150 kPa can trigger accelerated creep; however, at 200 kPa and 300 kPa, approximately 180 kPa and 210 kPa of deviatoric stress are needed, respectively, to initiate failure. Additionally, at identical deviatoric stress levels, a higher confining pressure effectively suppresses the development of creep deformation, as evidenced by the reduced creep rates and the extended time required to achieve equivalent strain. This demonstrates that an increased confining pressure enhances inter-particle interlocking and friction, thereby improving the sediments’ resistance to long-term deformation.

3.2. Creep Strain–Time Curve

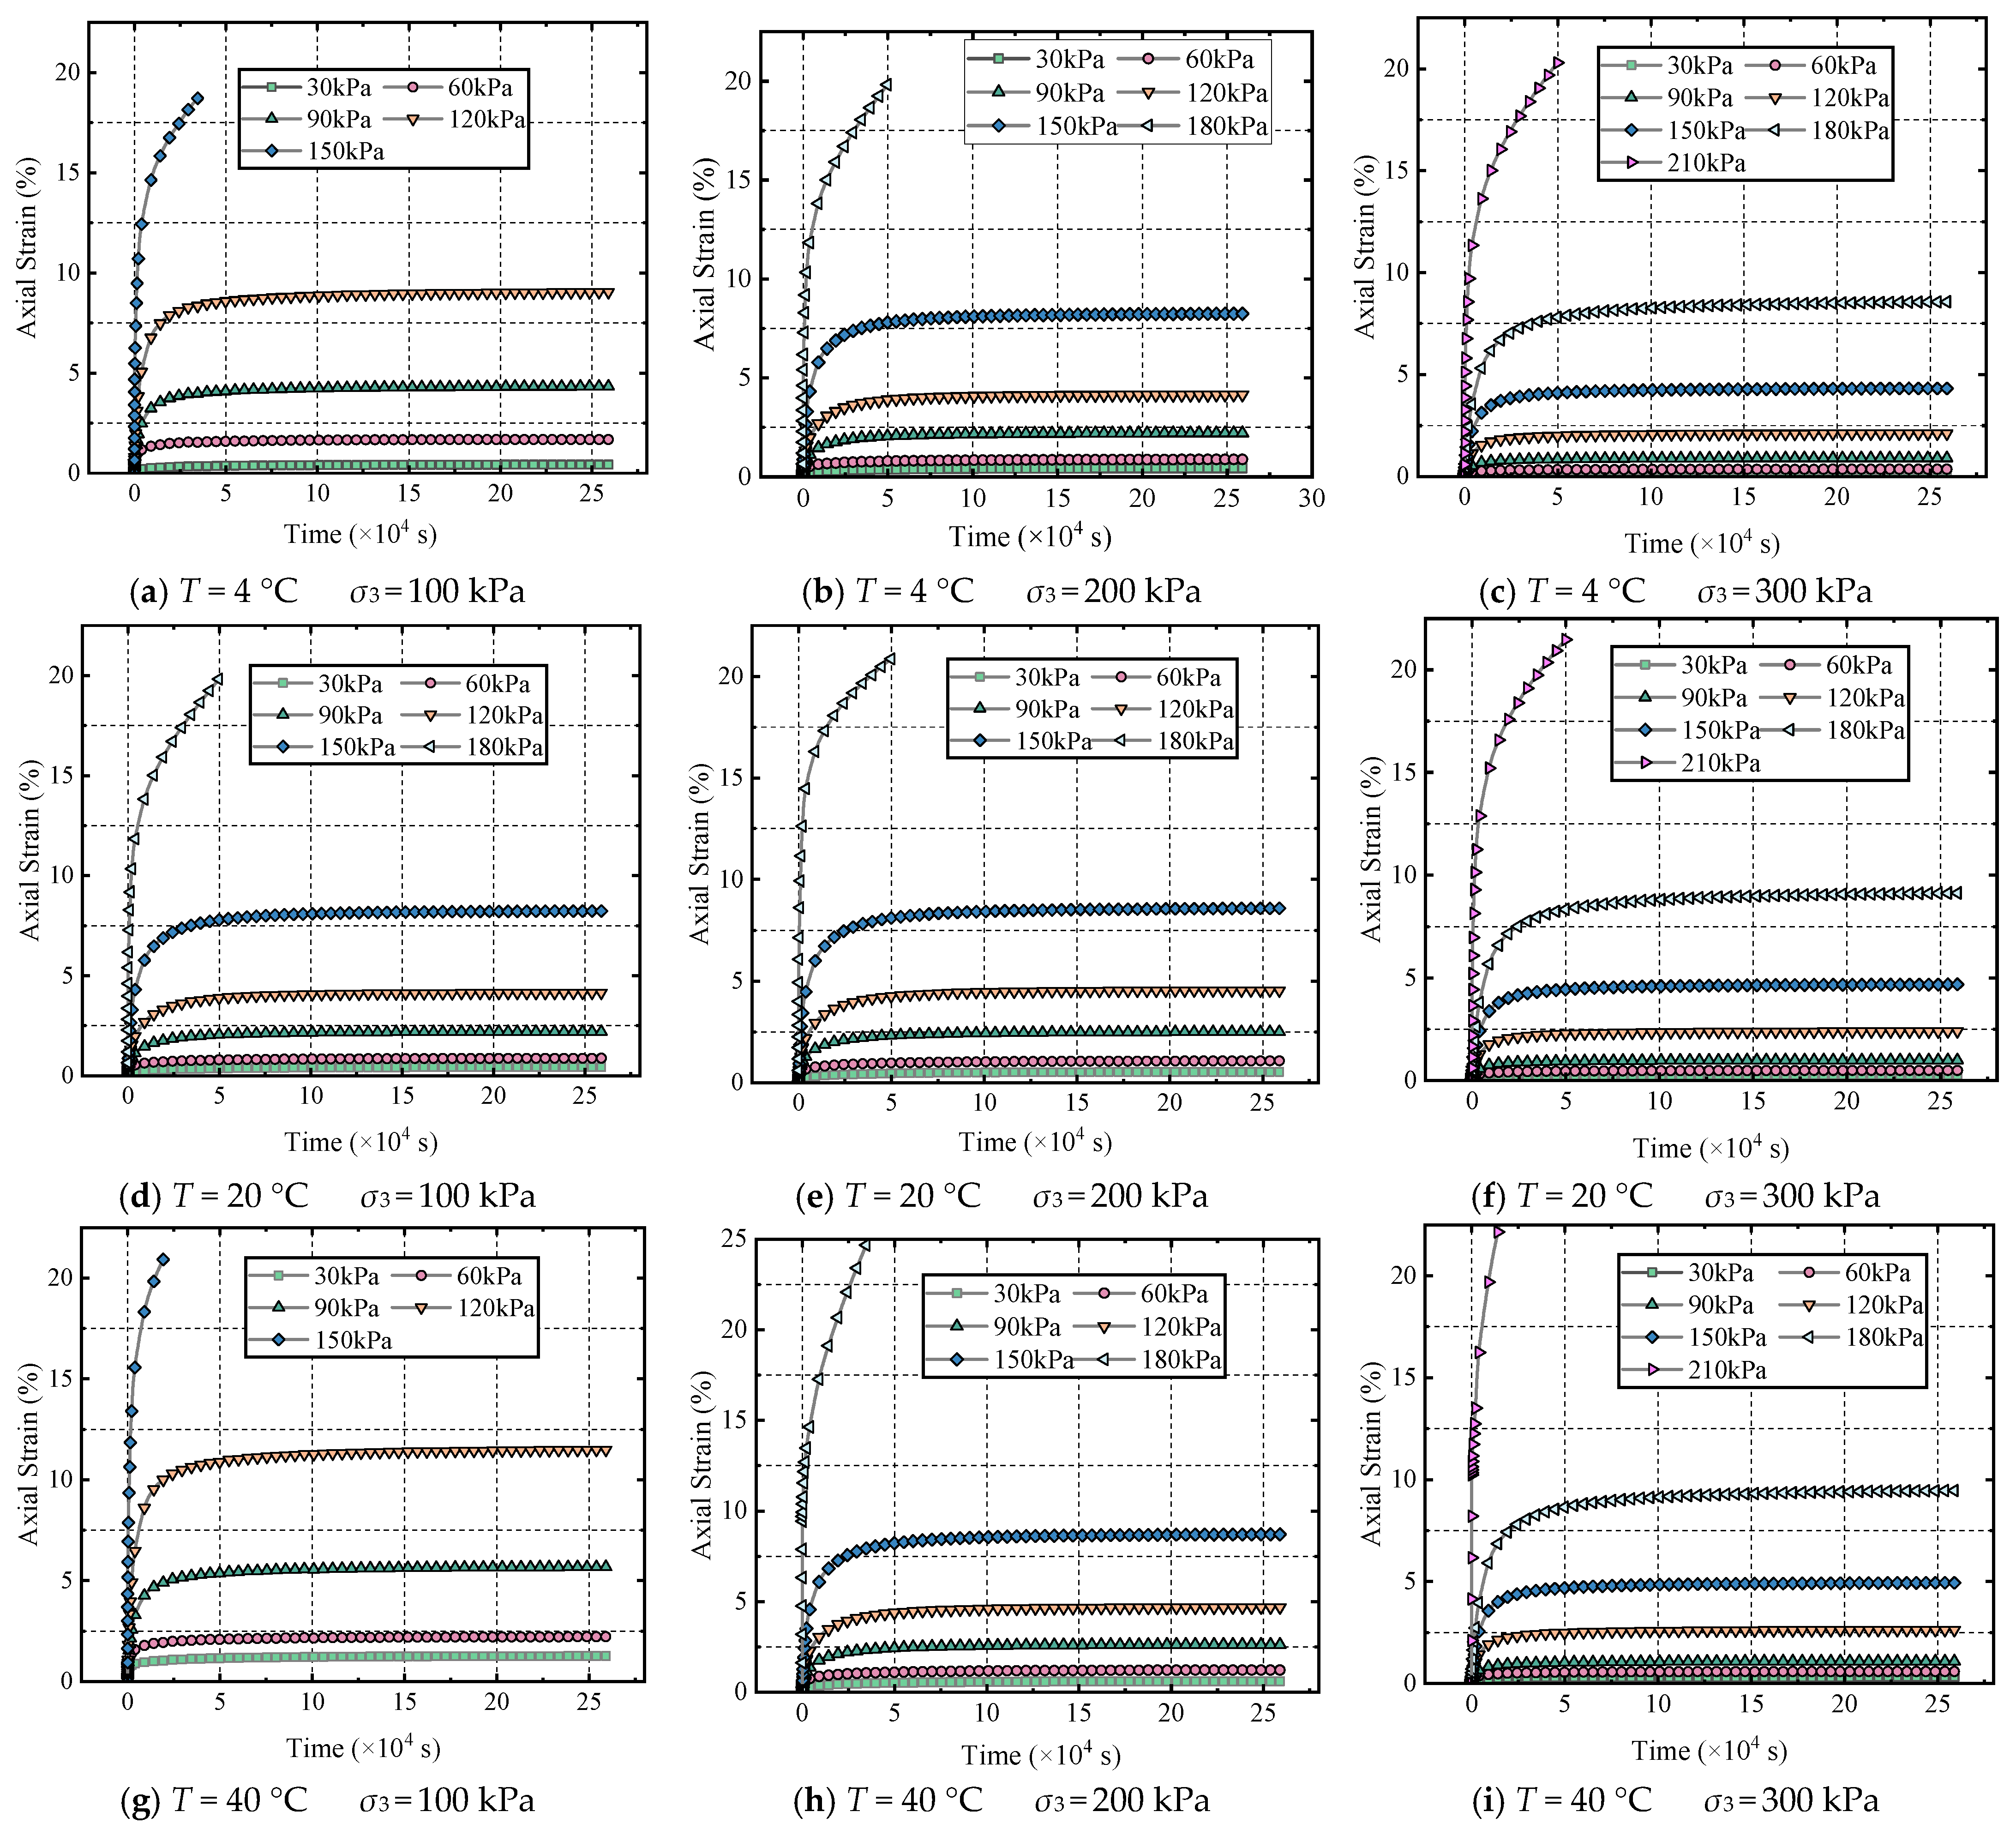
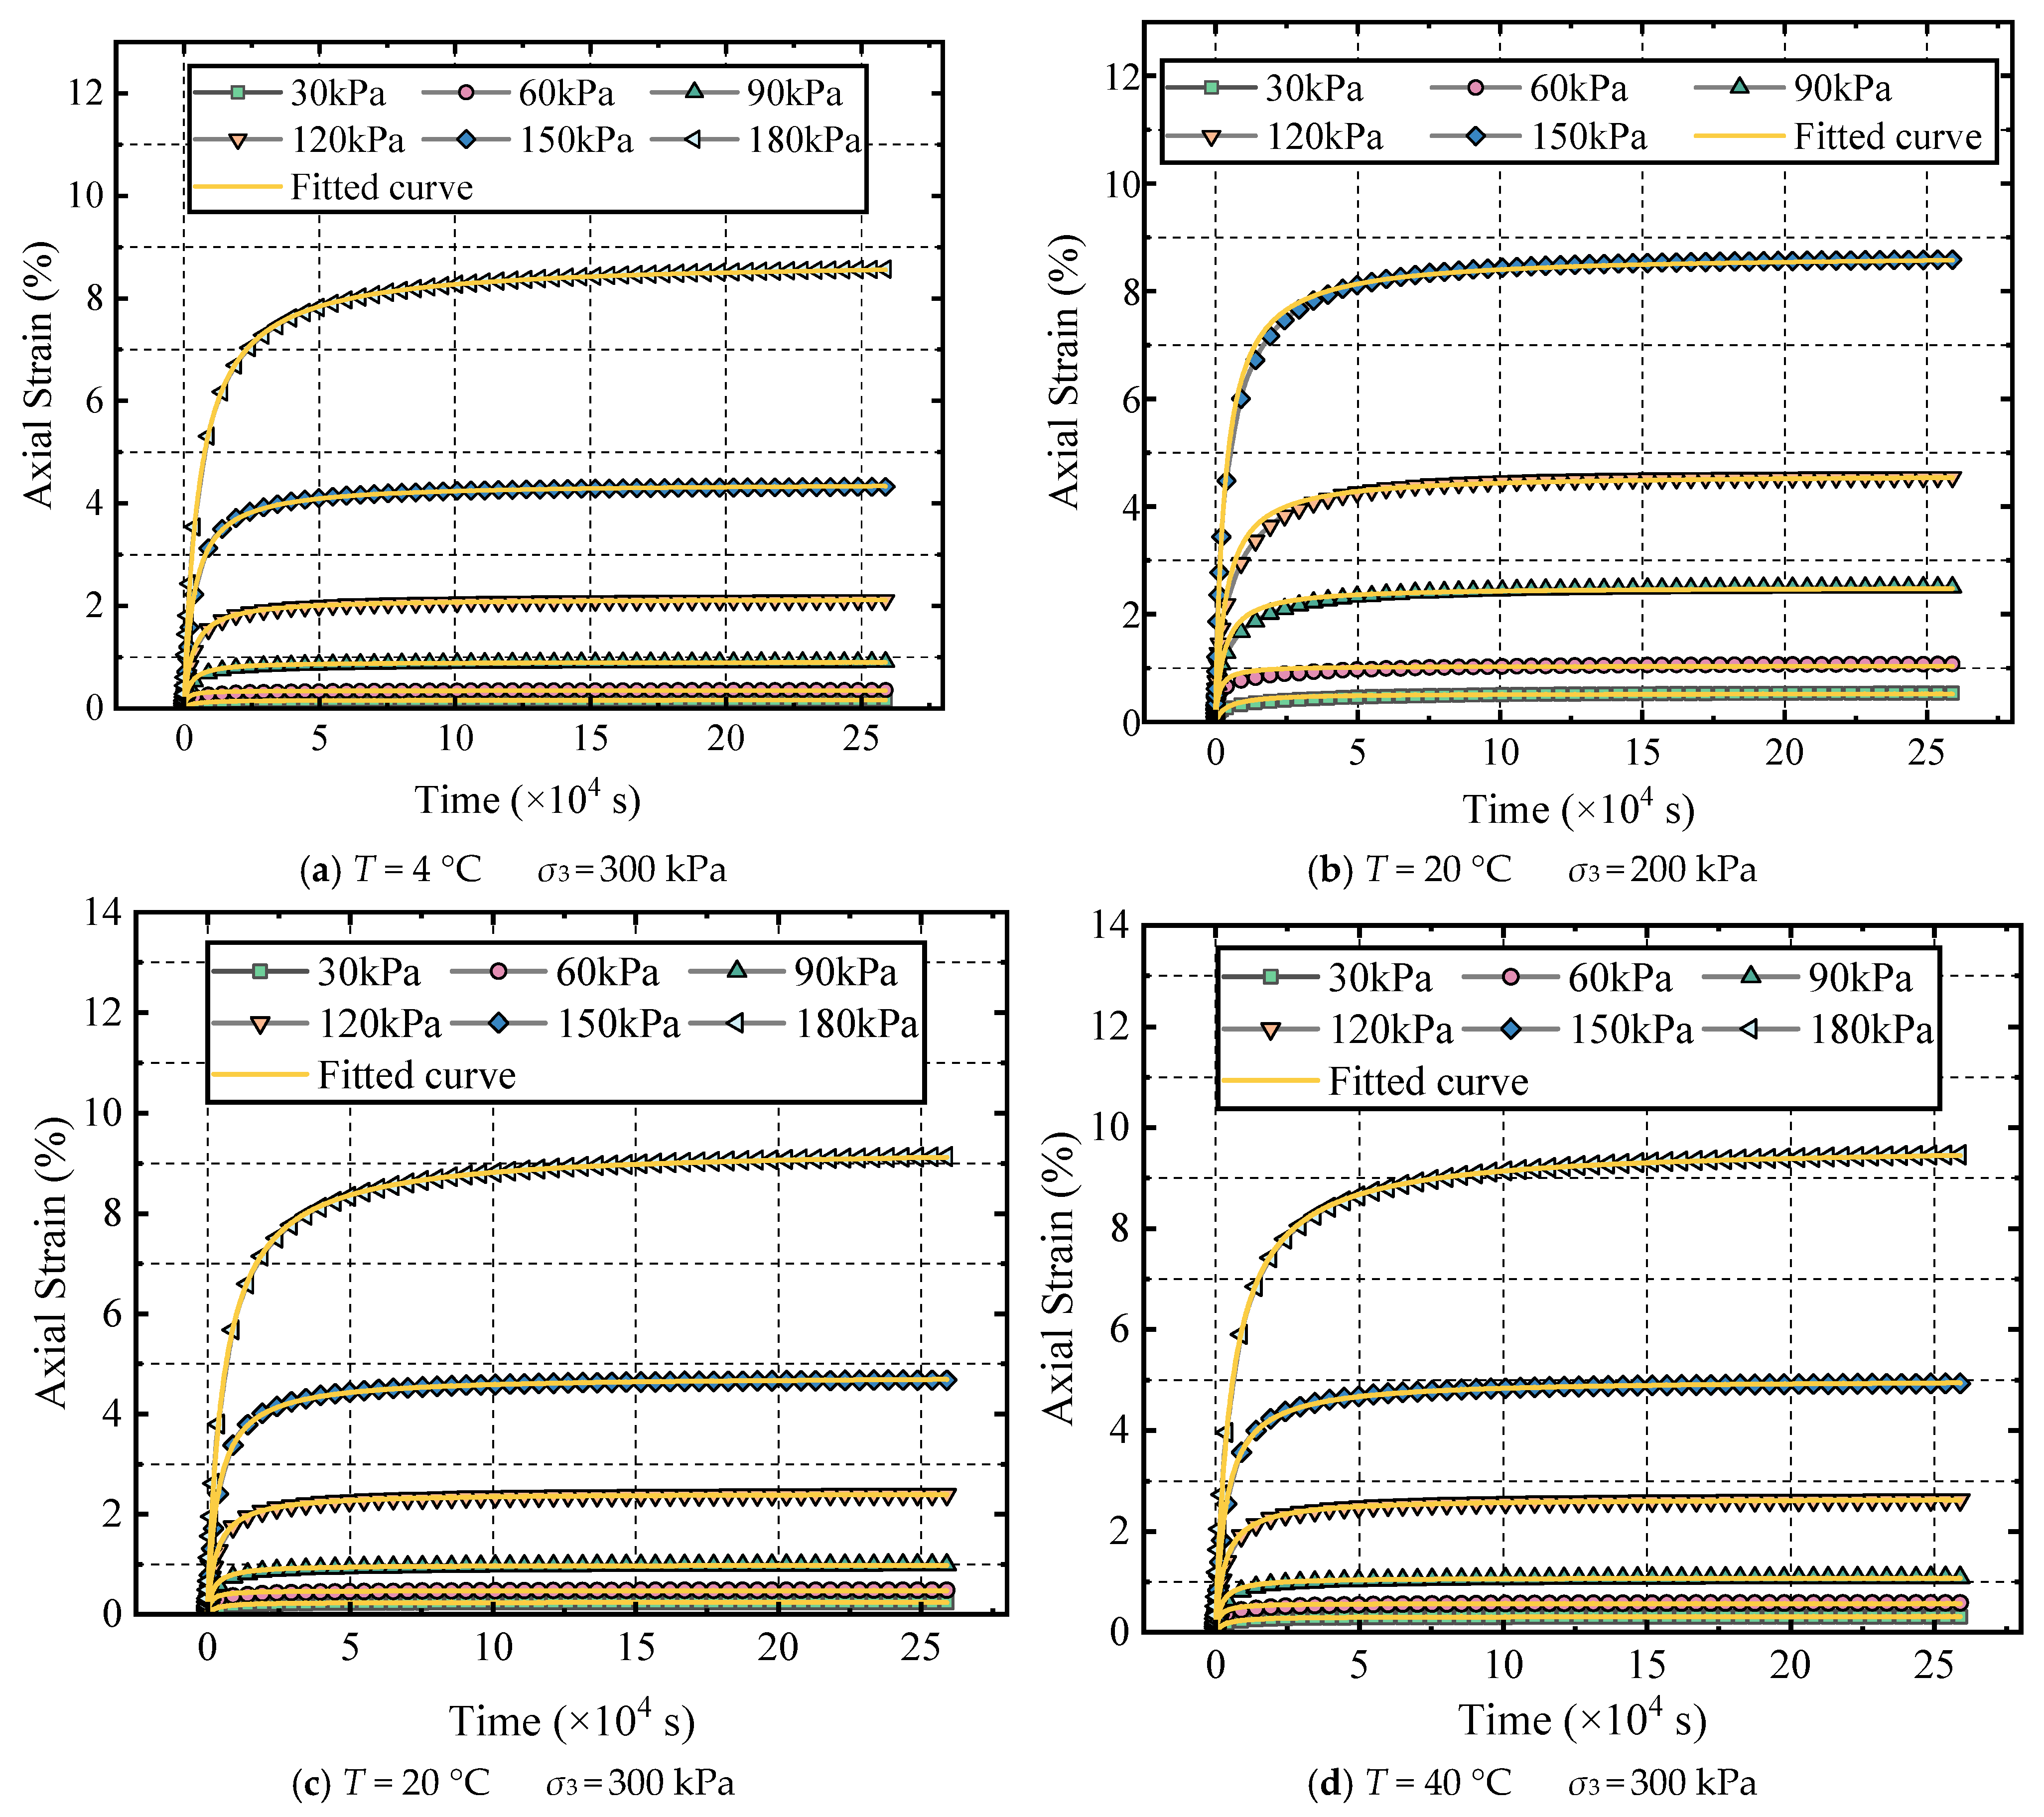
Triaxial creep tests were conducted on sulfate-impregnated soil samples under various experimental conditions. After obtaining the full creep curves of the samples, the graded loading method was adopted in this study. To align the data with those from separate loading tests, the Chen loading method [32] was applied for processing. The resulting strain–time curves under different confining pressure–temperature combinations are illustrated in Figure 4.

3.2.1. Influence of Different Temperature Conditions on Triaxial Creep Characteristics of Deep-Sea Sediments

Figure 4 demonstrates that, under identical confining pressures (100 kPa, 200 kPa, and 300 kPa), temperature elevation significantly intensifies creep deformation in deep-sea sediments. This is evidenced by an increasing strain with temperature rise and accelerated creep rates (strain–time curve slopes). At low deviatoric stress levels (≤60 kPa), temperature effects remain relatively weak but still show distinct trends. For example, at σ3 = 100 kPa and 30 kPa deviatoric stress, the final creep strain at 4 °C is approximately 0.8%. It increases to 1.2% at 20 °C and further reaches 1.8% at 40 °C, with a temperature-induced strain increase of 0.25–0.28% per 10 °C rise. The curve primarily exhibits an initial creep phase without evident steady-state characteristics, with the initial creep stage shortening at elevated temperatures. At medium–high deviatoric stress levels (≥90 kPa), the amplification effect of temperature on creep becomes significantly pronounced. For instance, at σ3 = 200 kPa and 120 kPa deviatoric stress, the final strain increases from 2.5% at 4 °C to 5.8% at 40 °C, with a cumulative strain increase exceeding 130% between these temperatures. The curve then displays clear “initial creep-steady-state creep” phase transitions. These transitions are marked by markedly accelerated steady-state creep rates—for example, the steady-state rate at 40 °C is triple that at 4 °C—and a tendency to enter accelerated creep phases, such as upward-curving at 40 °C with 150 kPa deviatoric stress. When temperatures exceed 20 °C, creep sensitivity (the slope of the strain–temperature curve) increases significantly. For instance, at a confining pressure σ3 of 300 kPa and deviatoric stress of 150 kPa, the strain increase (3.2%) between 20 °C and 40 °C is 2.1 times that observed in the 4 °C to 20 °C range (1.5%). This suggests that 20 °C may serve as a “temperature-sensitive turning point” for creep characteristics in this type of soft soil. The primary mechanisms driving creep intensification include the thickening of inter-particle bound water films and the reduction in cementation strength at elevated temperatures.

3.2.2. Influence of Different Confining Pressures on Triaxial Creep Characteristics of Deep-Sea Sediments

Under identical temperature conditions (4 °C, 20 °C, and 40 °C), an increased confining pressure significantly suppresses creep deformation in deep-sea sediments. This is evidenced by a reduction in strain with a rising confining pressure, resulting in flatter creep curves. The confining pressure also exhibits a pronounced inhibitory effect on the peak strain: at identical deviatoric stress levels, a 100 kPa increase in the confining pressure reduces strain by approximately 30% to 50%. For instance, at 20 °C and 90 kPa deviatoric stress, the final strain at σ3 = 100 kPa is about 3.5%, decreasing to 2.1% at σ3 = 200 kPa and further to 1.4% at σ3 = 300 kPa. When the confining pressure rises from 100 kPa to 300 kPa, the total strain reduction reaches 57%. Simultaneously, the confining pressure prolongs the steady-state creep stage by limiting soil skeleton shear dilation and pore water pressure accumulation. At a low confining pressure (100 kPa), medium-to-high deviatoric stress (≥120 kPa) tends to trigger accelerated creep. However, at a high confining pressure (300 kPa), even at 180 kPa deviatoric stress, the curve continues to predominantly indicate steady-state creep. The coupling effect of confining pressure and deviatoric stress demonstrates that the confining pressure’s inhibitory effect on creep intensifies with increasing deviatoric stress. For example, at 30 °C and 60 kPa deviatoric stress, the strain reduction at σ3 = 300 kPa is 35% compared to that at 100 kPa. When the deviatoric stress reaches 150 kPa, the reduction increases to 62%, indicating that the “constraint reinforcement effect” of confining pressure becomes more pronounced under high deviatoric stress. At this stage, particle interlocking and frictional resistance in the soil increase with a rising confining pressure, effectively resisting creep deformation.
In conclusion, the influence of temperature and confining pressure on the creep of deep-sea sediments shows “reverse synergy”. An increase in temperature aggravates creep by weakening the connections between soil particles. Meanwhile, an increase in confining pressure inhibits creep by strengthening the skeleton constraint. The two factors jointly determine the long-term deformation stability of soft soil.

3.2.3. Influence of Deviatoric Stress on Triaxial Creep Characteristics of Soft Sediments in the Deep Sea

As a direct driving force for soil deformation, deviatoric stress plays a decisive role in regulating the creep characteristics of deep-sea sediments. The influence is generally manifested as an increase in deviatoric stress, a significant increase in the total creep strain, early transition of the creep stage, nonlinear growth of the steady-state creep rate, and easy triggering of accelerated failure.
In terms of the total creep strain, deviatoric stress shows a significant positive correlation with strain, with the strain increase accelerating as deviatoric stress levels rise. Taking a confining pressure of σ3 = 200 kPa and a temperature of 20 °C as an example, the final creep strain reaches only 0.6% at 30 kPa, increases to 1.5% at 60 kPa, reaches 4.2% at 120 kPa, and further rises to 7.8% at 180 kPa, demonstrating characteristics of “linear growth under low deviatoric stress followed by exponential growth under medium–high deviatoric stress”. This phenomenon becomes more pronounced in high-temperature environments. For instance, at 40 °C with σ3 = 100 kPa, when the deviatoric stress increases from 90 kPa to 150 kPa, the strain jumps from 2.8% to 6.5%, achieving a 132% increase. This indicates that, after the weakening of the soil skeleton structure at high temperatures, the deformation-driving effect of deviatoric stress is amplified. Regarding creep stage evolution, deviatoric stress determines the morphological characteristics of the creep curve: ① Under low deviatoric stress (≤60 kPa), the curve is dominated by “initial creep”, with the strain gradually stabilizing over time without a distinct steady-state phase. ② Under medium deviatoric stress (90–120 kPa), the curve exhibits two-phase characteristics of “initial creep–steady-state creep”, where the duration of the steady-state phase shortens with an increasing deviatoric stress. ③ Under high deviatoric stress (≥150 kPa), the curve shows three-phase characteristics of “initial–steady-state–accelerated”, with the strain growth rate in the accelerated phase sharply increasing as the deviatoric stress rises.
Regarding critical deviatoric stress thresholds, there exists a “creep failure critical value” beyond which soil transitions directly from steady–state creep to accelerated failure. This critical value increases with rising confining pressure and decreases with temperature. For instance, at 4 °C, the critical deviatoric stress for σ3 = 300 kPa is approximately 180 kPa, decreasing to 150 kPa at σ3 = 100 kPa; and at 20 °C, the critical deviatoric stress for σ3 = 100 kPa further drops to 120 kPa. The steady-state creep rate corresponding to this critical deviatoric stress is about 0.0005%/min. When deviatoric stress exceeds this value, the rate exhibits exponential growth. This reflects the progressive loss of inter-particle frictional resistance and cementation strength in soil. Therefore, deviatoric stress directly regulates the magnitude and rate of creep deformation by modifying internal shear stress in soil. Its influence is modulated via the coupled effects of temperature and confining pressure. In high-temperature environments, reduced soil shear strength enhances the deformation–driving effect of deviatoric stress. Conversely, high confining pressure raises the critical deviatoric stress threshold via constraining effects, thereby slowing the creep failure process. This fundamental principle offers critical guidance for determining appropriate deviatoric stress thresholds in long-term stability evaluations of deep-sea engineering projects.

3.3. Stress–Strain Isochronism Curve Characteristics Under Creep Test Conditions

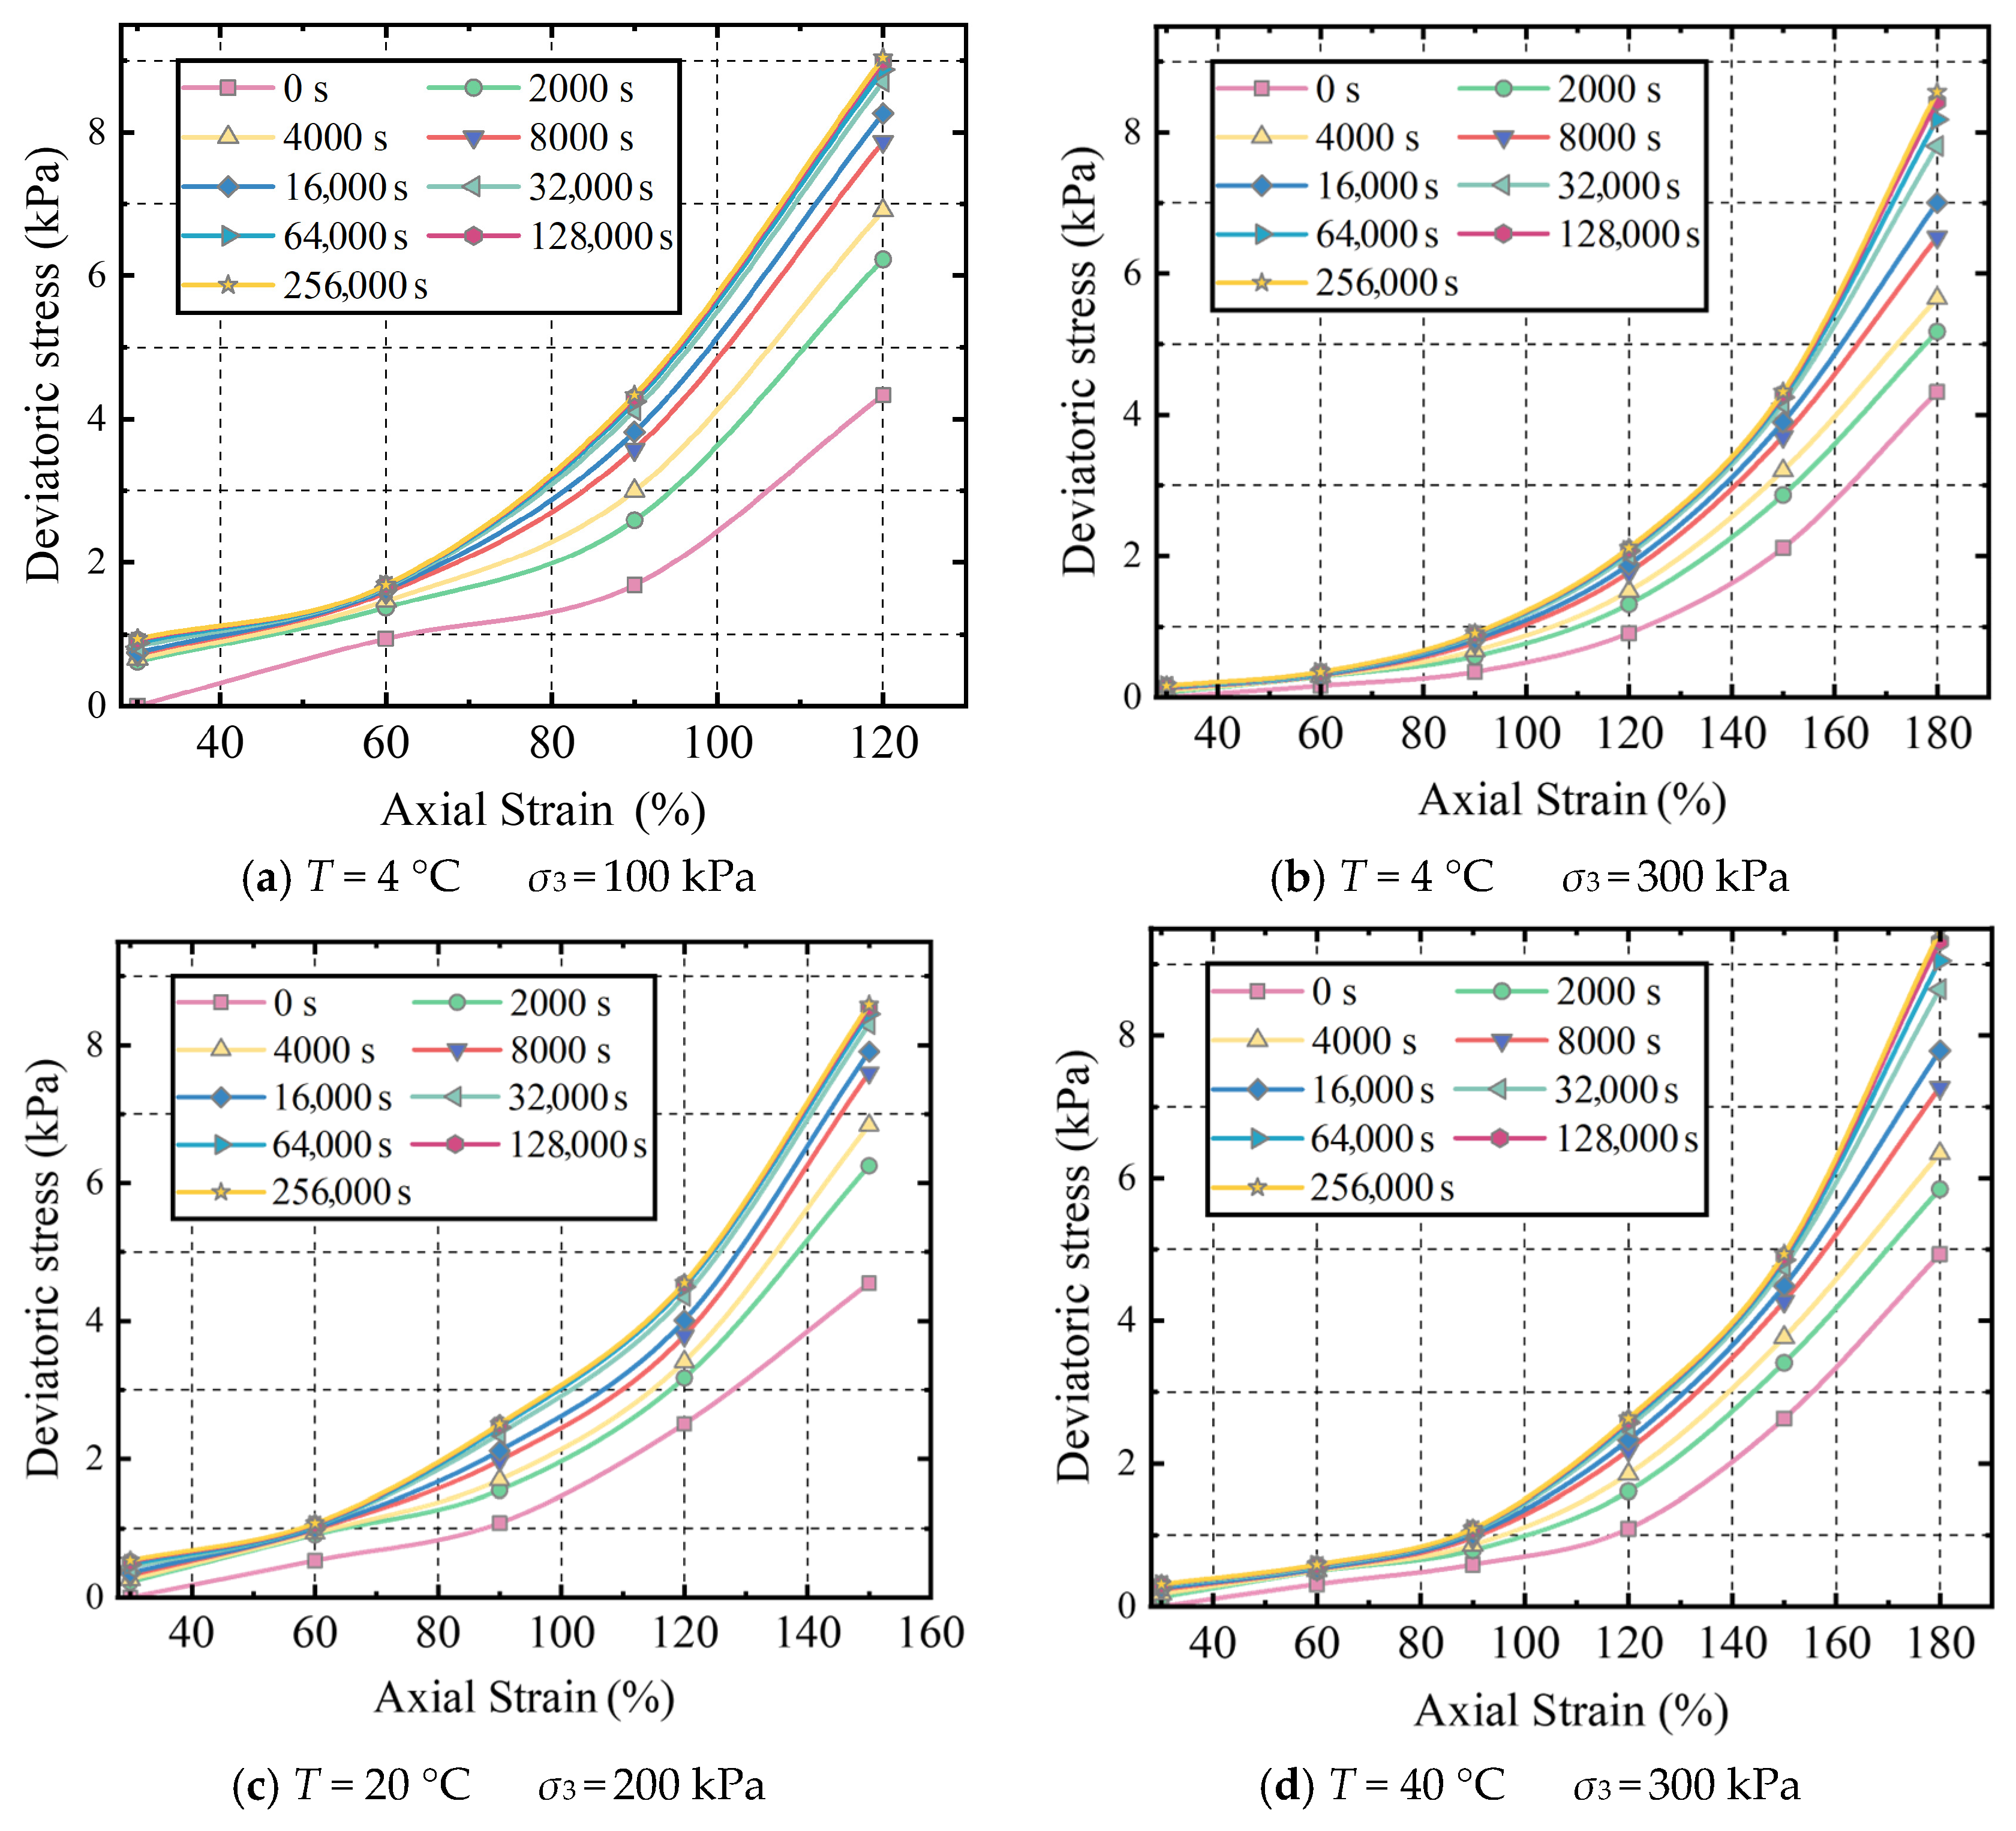
To further explore the deformation law of triaxial creep in deep-sea sediments, in this section, we select nine nodes, 0 s, 2000 s, 4000 s, 8000 s, 16,000 s, 32,000 s, 64,000 s, 128,000 s, and 256,000 s, and construct the corresponding isochronous stress–strain curves, as shown in Figure 5. (Due to space constraints, only some operating conditions are displayed).
As shown in Figure 5, the influence of time on deep-sea sediment creep is primarily manifested through strain accumulation and material degradation, with temperature and confining pressure exerting significant regulatory effects. Under identical temperature and confining pressure conditions, the isochronous stress–strain curves gradually shift toward the strain axis over time (0 s to 256,000 s). This indicates that, during the instantaneous deformation stage (0 s), material stiffness remains high, dominated by elastic and initial plastic deformation. However, under prolonged loading (e.g., 256,000 s), viscous–plastic deformation accumulates continuously, leading to a significant strain increase at the same stress level, demonstrating a “time softening” characteristic. High-temperature environments accelerate this process by reducing inter-particle viscous resistance and cementation strength, increasing strain amplification by approximately 30–50% within the same timeframe. Conversely, an increased confining pressure suppresses pore water expulsion and particle reorganization through compaction effects, thereby reducing long-term strain accumulation rates by 20–40% and minimizing shear modulus attenuation.
The experimental results demonstrate that deep-sea sediments exhibit distinct stage-specific characteristics and degradation patterns in their creep behavior. Over time, the material’s tangent modulus progressively decreases, indicating gradual stiffness deterioration. Notably, a transition from attenuation creep to stable creep occurs at high stress levels. The long-term yield strength shows a significant reduction compared to instantaneous values. For instance, at 4 °C with σ3 = 300 kPa, the yield stress decreases by approximately 40–50% after 256,000 s, with the degradation rate increasing by 15–25% for every 10 °C rise in temperature. Additionally, the protective effect of confining pressure on yield strength intensifies over time. At 40 °C, the long-term yield strength at a confining pressure of 300 kPa remains over 50% higher than that at 100 kPa, demonstrating that confining pressure effectively delays the material’s time-dependent softening process.
The fundamental mechanism lies in the progressive damage to deep-sea sediments caused by microcrack propagation and pore structure deterioration during prolonged creep processes. This damage evolution follows the “stress–temperature–time” coupling mechanism, indicating that long-term creep damage results from the combined effects of time and environmental factors. Therefore, engineering applications require coupling damage models to predict the long-term stability of marine structures.

3.4. Comparison of Variable Coupling Effects: Time–Group Versus Creep Strain Rate Relationship Curves

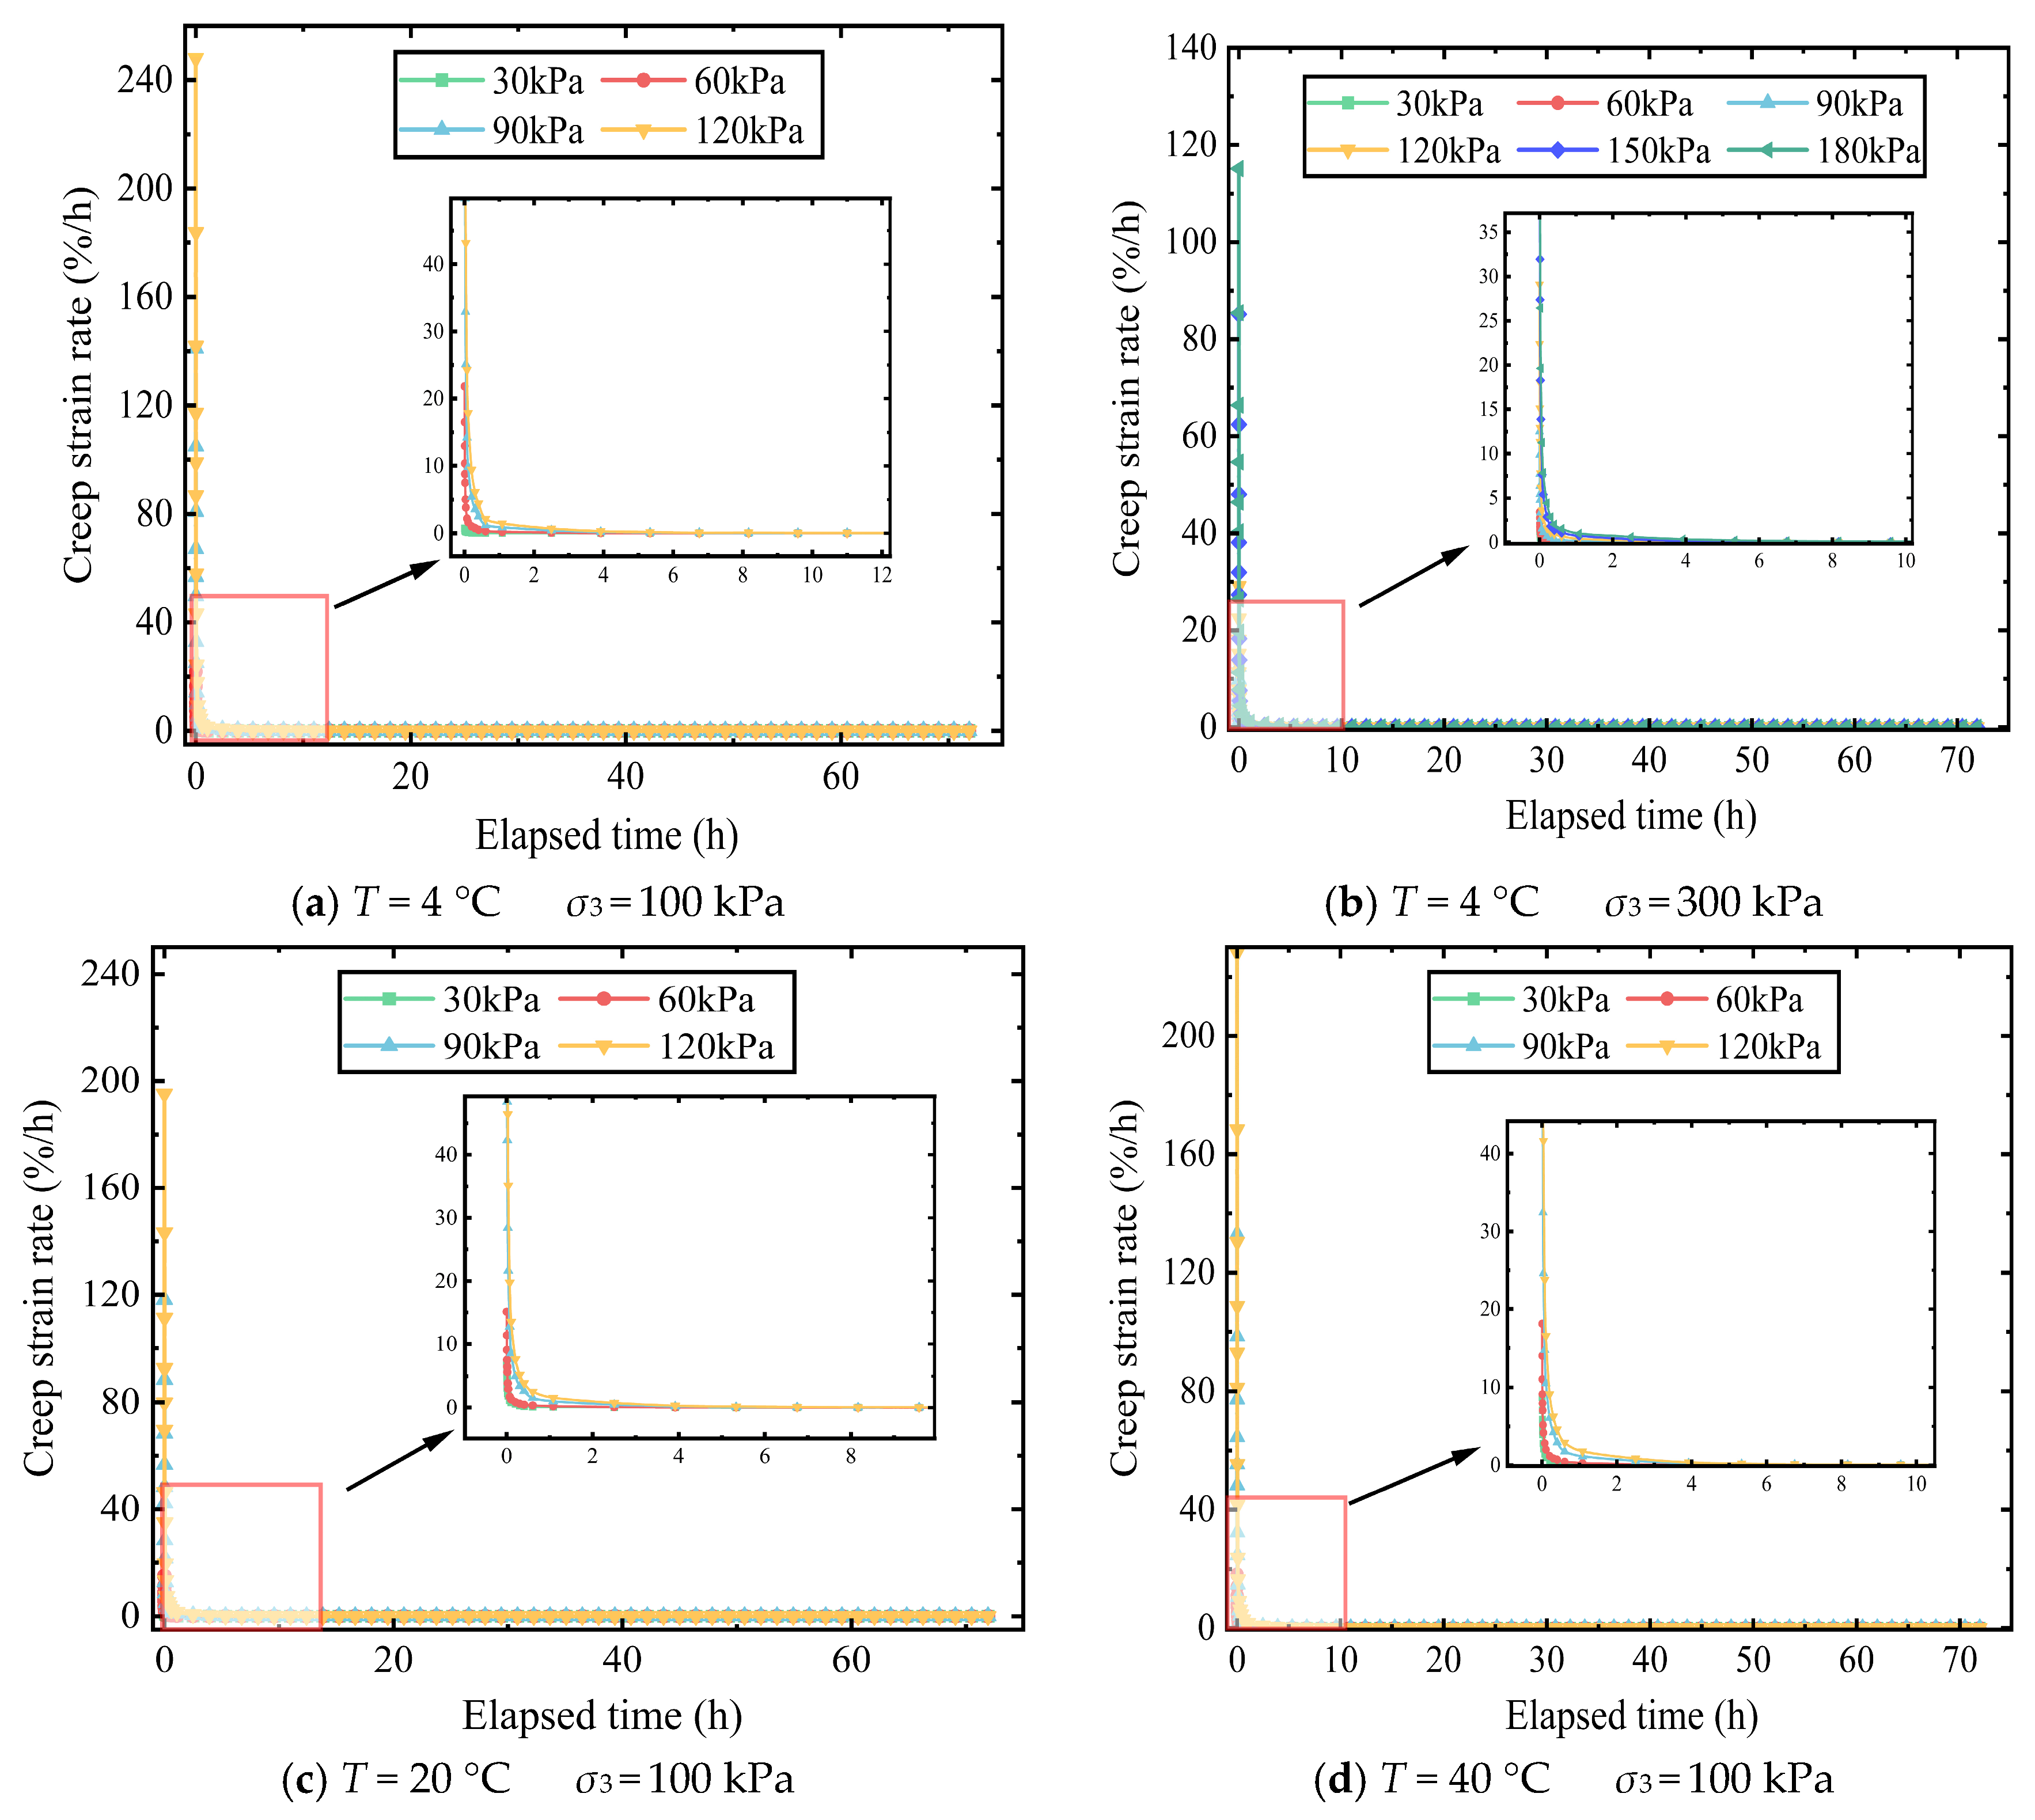
Figure 6 shows the creep strain rate–time curves under various test conditions. Given the large number of test groups, we analyzed only the results of the creep tests conducted at T = 4 °C under different confining pressures and those of the tests conducted at σ3 = 100 kPa under different temperatures. The inset figure is a partial enlargement of the boxed area in the main figure.
As shown in Figure 6, the creep strain rate evolution exhibits distinct phase characteristics over time, with significant coupling effects of temperature and confining pressure. Under constant 4 °C temperature conditions, the deep-sea soft soil demonstrates marked regular variations in creep behavior as the confining pressure increases from 100 kPa to 300 kPa. The elevated confining pressure enhances inter-particle effective stress and tightens the soil framework structure, resulting in a notable decrease in the peak rate during the initial creep stage. This reduction also occurs in the steady-state creep phase, indicating improved long-term deformation resistance with an increasing confining pressure. Notably, under high-confining-pressure conditions, the creep strain rate decay becomes more pronounced over time. The soil samples transition from the initial to steady-state creep phases more rapidly, demonstrating the significantly enhanced stability of the overall creep process.
When the confining pressure is fixed at 100 kPa, increasing the temperature from 20 °C to 40 °C produces an opposite effect on creep characteristics compared to the confining pressure. Elevated temperature enhances the mobility of bound water between soil particles and reduces soil cohesion and internal friction angle, leading to a significant rise in the peak rate during the initial creep stage. Moreover, the creep rate in the steady–state phase also shows a distinct upward trend. Meanwhile, the creep attenuation rate of soil samples slows under high-temperature conditions; in some cases, it even exhibits slight recovery after an initial rate decline. This indicates that higher temperatures weaken the long-term stability of soil samples and increase the potential risk of accelerated creep failure.
In summary, the creep behavior of deep-sea soft soil modified by geotechnical engineering is jointly regulated by confining pressure and temperature, with opposing mechanisms. Confining pressure acts as the key factor inhibiting creep by enhancing the density of the soil skeleton structure, thereby reducing deformation rates and improving stability. Conversely, temperature serves as the dominant factor facilitating creep by weakening particle bonding strength, accelerating long-term deformation, and compromising stability. Morphological variations in time–strain–rate curves reveal distinct creep mechanisms under different combinations of variables: At low temperatures and high confining pressures, frictional resistance-controlled decaying creep predominates; under high temperatures and low confining pressures, viscous flow-dominated steady-state creep prevails; while moderate temperatures and confining pressures typically result in a composite rate evolution pattern of “decaying–steady–accelerating”. This phenomenon is closely linked to the coupled effects of inter–particle water film thickness, cementation strength, and dynamic pore water pressure variations. These findings suggest that in deep-sea engineering design, it is crucial to consider two important factors. The first factor is the inhibitory effect of high confining pressure on soft soil creep, and the second is the potential adverse impacts of temperature fluctuations. By considering these factors, we can ensure the long-term safety and stability of engineering structures under complex environmental conditions.

4. Singh–Mitchel Model and Its Modifications

4.1. Singh–Mitchel Model

Among the empirical models for describing soil creep characteristics, the Singh–Mitchell empirical creep model has gained widespread application. This model is particularly effective in characterizing the creep behavior of soft clay. Singh and Mitchell synthesized research findings on soil creep, demonstrating that using an exponential stress–strain relationship and a power law stress–time relationship better captures soil creep characteristics. They proposed a three-parameter stress–strain–time relationship equation, which offers advantages such as fewer parameters and a simple constitutive equation. This model proves especially suitable for analyzing the creep characteristics of soft and frozen soils [25]. The mathematical expression of the Singh–Mitchell creep model is
ε . t = A e α Dr t 1 t m
Here,  ε . t  represents the creep strain rate of the soil sample; t denotes the loading duration (in seconds); t1 is the reference time (in seconds); D indicates the deviatoric stress level, where  D r = σ 1 σ 3 ( σ 1 σ 3 ) f ; A represents the creep strain rate at the reference time t1 with  σ 1 σ 3  a deviatoric stress is zero.  ( σ 1 σ 3 ) f  is the shear stress at failure;  α  is the slope of the current segment in the logarithmic relationship between creep strain rate and shear stress; and m represents the linear slope of the linear segment of the ( lnt     ln ε . ) relationship curve.
While the traditional Singh–Mitchell model has been widely used to describe soft soil creep, it exhibits significant limitations in deep-sea environments. Firstly, it fails to account for the regulatory effect of temperature on creep time scales, thus neglecting how deep-sea temperature gradients (e.g., 4–40 °C) influence soil particle viscosity. Secondly, its assumption of the creep strain rate decaying exponentially over time leads to theoretically infinite long-term strain growth, which contradicts the observed “strain saturation” phenomenon in experiments. Therefore, the model needs to be modified.

4.2. Modified Singh–Mitchell Empirical Creep Model

First, to resolve the issue of infinite strain growth, the relationship between creep strain rate and time needs to be reconstructed to ensure that the strain converges to a finite value after integration. Based on the experimental observation that the strain eventually stabilizes, we hypothesize that the creep strain rate decays exponentially over time.
ε t = ε τ 1 ( 1 + t τ ) 2
Here,  ε . t  is the instantaneous creep rate, which is expressed as %/h;  ε  is the long-term saturation (steady-state) strain (constant related to stress level, %), the value of which depends on the stress level;  τ  is the temperature-dependent characteristic time (s), reflecting the “rate” at which creep reaches saturation, where the smaller the value, the faster the strain stabilizes; and t is the load duration (s).
Integrating this equation from 0 to t with the initial condition  ε  = 0 at t = 0, the substitution method is applied: Let u = 1 +  x τ , then du d x τ . When t = 0, u = 1; and when t = t, u = 1 + t τ . The integral result is
ε t = 0 t ε ( x ) d x = ε 1 τ 0 t 1 ( 1 + x τ ) 2 d x
After substitution with the change in variables, the integral is obtained.
ε t = ε · t t + τ
This formula shows that when t → ∞,  ε (t)   ε , which successfully achieves strain convergence and solves the infinite strain problem of the traditional model.
The saturation strain  ε  is directly governed by the deviatoric stress level, and  ε  exhibits exponential growth when q exceeds the yield threshold. Drawing from the stress level of  D r = σ 1   σ 3 ( σ 1   σ 3 ) f  defined in Singh–Mitchell’s original model, we introduce a stress sensitivity coefficient β; then,  ε  is represented as
ε = A 0 e β D r
Here, β denotes the stress sensitivity coefficient, and its value exhibits a nonlinear increase with the augmentation of the deviatoric stress. Β > 0 indicates that elevated stress levels accelerate the growth of saturated strain. The equation demonstrates that deviatoric stress promotes pore compression and particle reorganization, causing long-term saturated strain to accumulate exponentially. The value of β can be used to quantitatively characterize the anti-crawling ability of the soil skeleton: the larger the value of β, the more sensitive the soil to deviatoric stress and the higher the risk of long-term deformation. A0 is the reference saturation strain constant (in%), where Dr represents the saturation strain at zero. This formula quantifies the exponential effect of shear stress on saturation strain, which is consistent with the experimental observation that an increase in shear stress leads to a significant rise in strain.
The deep-sea temperature affects creep rates by altering the viscosity of inter-particle bound water films and cementation strength, necessitating the expansion of characteristic time τ into a temperature-dependent function. Drawing from thermodynamic viscoelasticity theory in soil mechanics, this study utilizes triaxial creep test data of deep-sea soft sediments obtained under varying temperature and confining pressure conditions, combined with the soil’s thermo-viscoelastic–plastic characteristics, and further employs a modified Arrhenius equation [33,34] for describing the temperature effects on  τ T .
τ ( T ) = τ 0 e E a ( T ) R T
Here, the value of  τ 0  represents the characteristic time (in seconds) at the reference temperature T0. Ea(T) denotes the activation energy (J/mol), representing the energy required to overcome interparticle viscous resistance. R is the ideal gas constant (8.314 J/(mol·K)), and T is the absolute temperature (K), where T = 273.15 + Tc (Tc being the Celsius temperature).
The formula shows that the characteristic time  τ T  decreases and the creep rate increases with the increase in temperature, which is consistent with the effect of temperature on the creep.
The modified Singh–Mitchell model is obtained by substituting the strain Formula (5) and the temperature function of characteristic time (6) into the strain–time relationship (4)
ε ( t , T   ) = A 0 e β Dr · t t + τ 0 e E a T R T
To enhance the physical significance of the model, the expression of activation energy Ea(T) is derived from microscopic mechanisms. First, considering that the viscosity  η T  of the water film follows the Arrhenius equation
η T = η 0 e E η R T
Here, η0 denotes the viscosity at reference temperature T0 (Pa·s), Eη represents the viscosity activation energy (J/mol), and T is the absolute temperature. Furthermore, as the temperature increases, the water film thickens, and its thickness is assumed to follow a linear relationship with the Celsius temperature
d ( T ) = d 0 + k d · ( T c   T c 0 )
In the formula,  d 0  denotes the water film thickness at  T 0  = 4 °C (in m), with  k d  being the thickness temperature coefficient (m/°C). The activation energy Ea(T) represents the energy required to overcome the resistance of the bound water film. As the water film thickness increases, the resistance rises; hence, Ea(T) is directly proportional to d(T).
E a ( T ) =   K E · d ( T )
where  K E  is the proportionality constant (J/( mol · m )). Substituting Equation (9) into Equation (10) yields
E a ( T ) = E a 0 + k E · ( T T 0 )
Here,  E a 0   =   K E · d 0  denotes the activation energy at reference temperature  T 0  (J/mol), and  k E   K E · k d  represents the temperature coefficient of activation energy (J/(mol·K)).
The modified Singh–Mitchell model demonstrates five key advantages:
(1) It achieves strain convergence, which aligns with the observed strain saturation in experiments.
(2) It incorporates temperature dependence to account for temperature gradients in deep-sea environments.
(3) Its parameters have clear physical interpretations: β reflects stress sensitivity, while Ea(T) indicates the temperature effects on viscous resistance.
(4) It achieves high-fidelity fitting, accurately capturing the creep characteristics throughout the process.
(5) Its streamlined design requires only four core parameters to model the temperature–stress–time coupling, ensuring strong engineering applicability.
By addressing the limitations of traditional models through multidimensional refinements, this derivation provides a rigorous theoretical framework for deep-sea engineering creep prediction.

4.3. Comparative Analysis of Different Creep Models

To verify the applicability of the modified Singh–Mitchell model to the creep characteristics of deep-sea sediments, this study compares the traditional Singh–Mitchell model, Burgers viscoelastic model, Nishihara creep model, modified Kelvin–Voigt model, and modified Singh–Mitchell model. The creep models and their characteristics of each model are shown in Table 3 below.
As shown in Table 3, the modified Singh–Mitchell model is the only one that simultaneously considers both temperature and confining pressure. This is because the creep behavior of deep-sea sediments is significantly influenced by temperature (4–40 °C) and confining pressure (100–300 kPa): increased temperature accelerates viscous deformation, while higher confining pressure inhibits pore water drainage rates. However, other models either ignore temperature (e.g., the traditional Singh–Mitchell model only considers confining pressure) or neglect both factors (e.g., Burgers’ model, Nishihara’s model, and the modified Kelvin–Voigt model). As a result, their fitting results fail to accurately reflect the actual creep patterns in deep-sea environments. Additionally, the modified Singh–Mitchell model has only 4 parameters compared to the traditional 6, reducing fitting complexity and overfitting risks while still capturing deep-sea sediments’ creep characteristics through temperature-related terms (l(T)) and confining pressure integration terms. Other models with similar parameter counts lack environmental factor terms, compromising both fitting accuracy and environmental adaptability. Finally, the modified Singh–Mitchell model is specifically designed for the temperature and confining pressure ranges of the South China Sea deep-sea, targeting the soft, high-porosity nature of deep-sea sediments. In conclusion, the modified Singh–Mitchell model is the best choice for fitting the creep process of deep-sea sediments due to its triple advantages of environmental factor coverage, parameter reduction, and scenario matching.
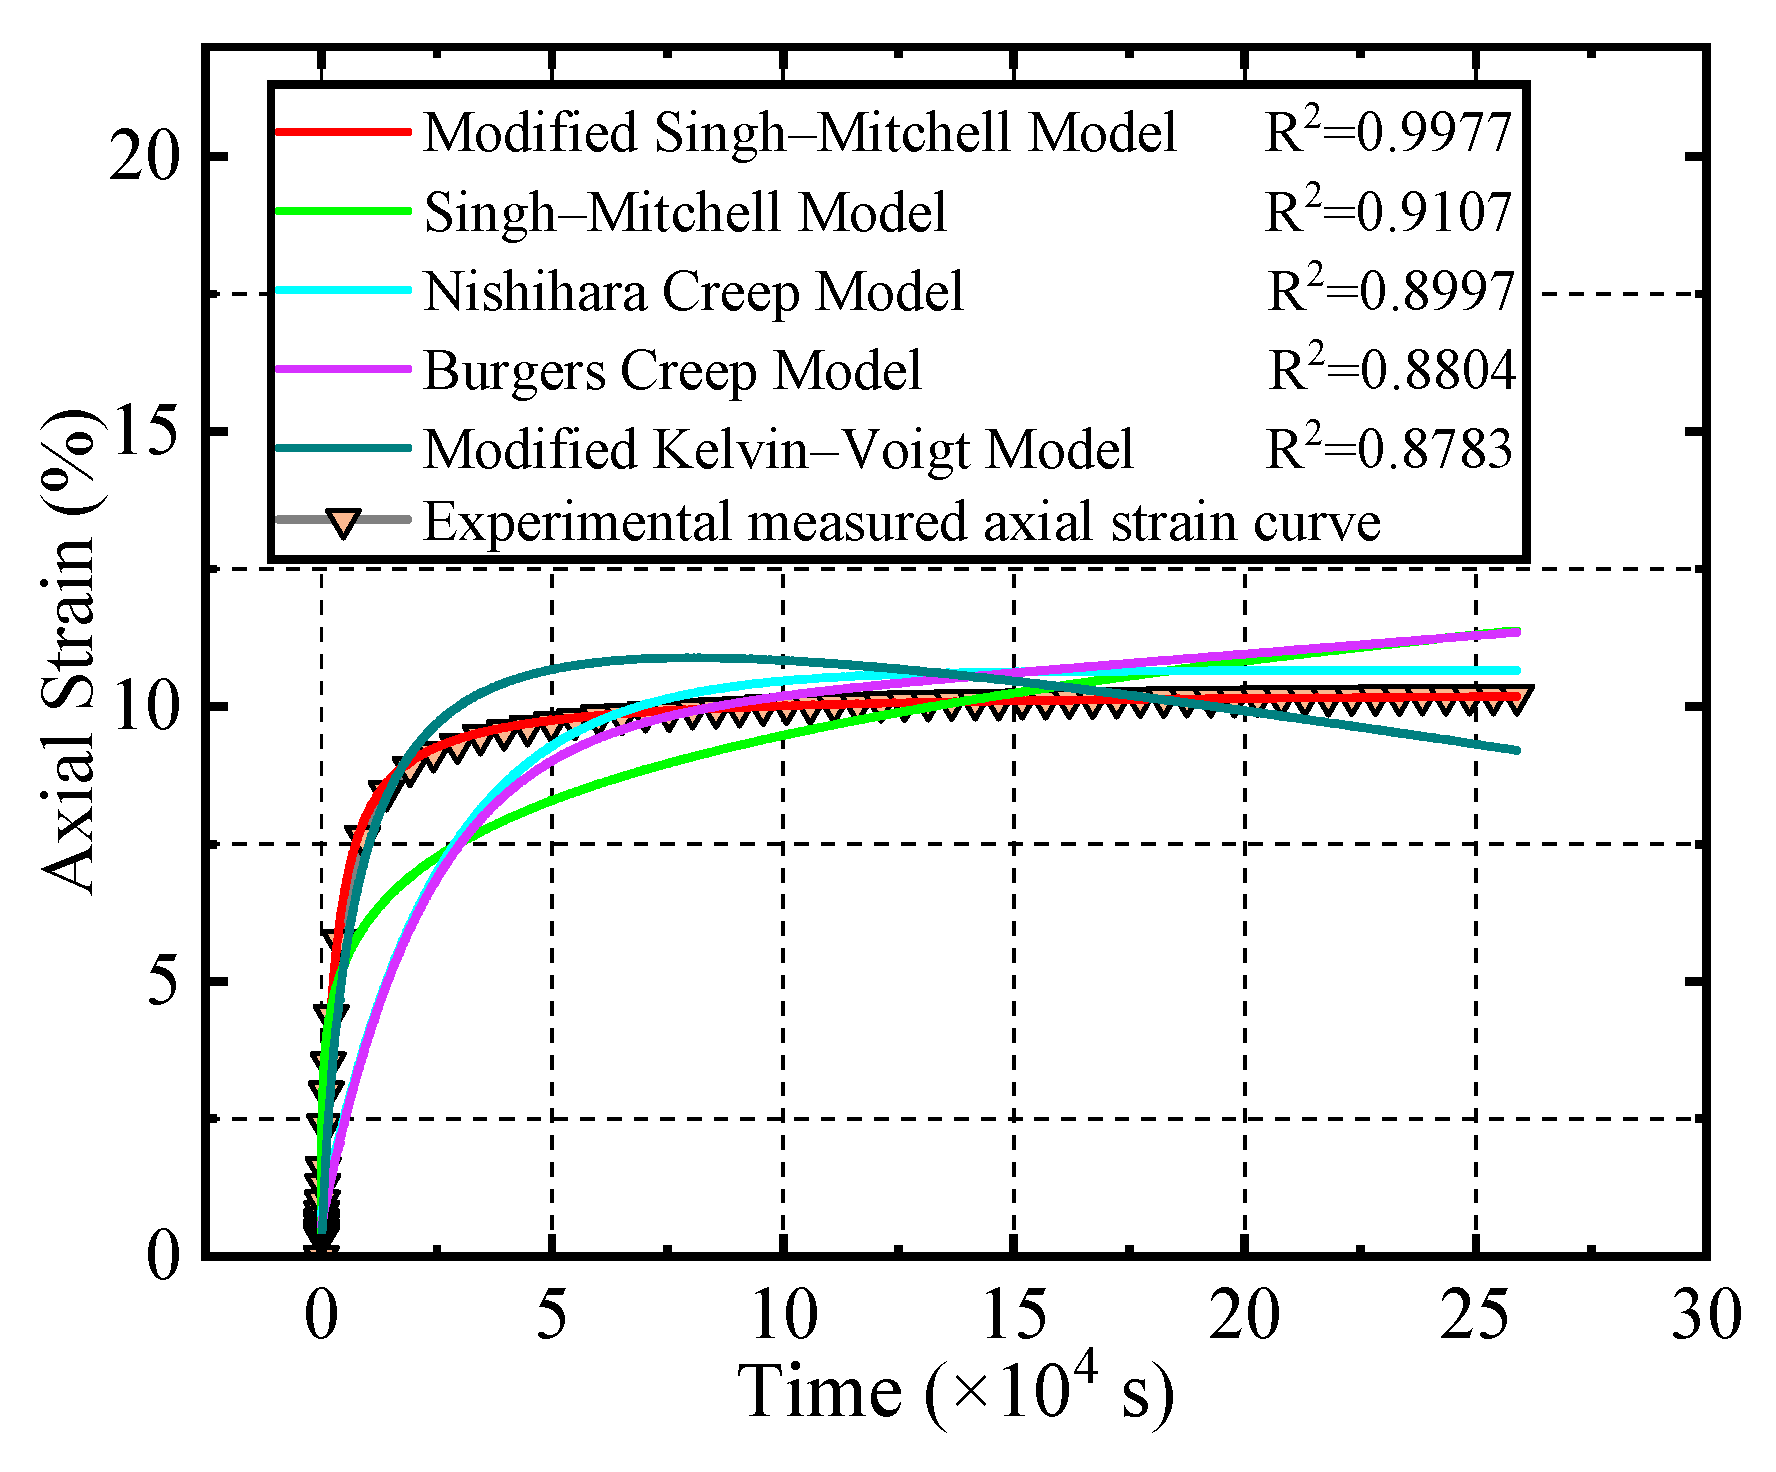
In the experimental study at T = 20 °C, σ3 = 100 kPa, and 120 kPa deviatoric stress, we compared the fitting performance of strain–time curves using different models. As shown in Figure 7, the modified Singh–Mitchell model demonstrates optimal performance in modeling deep-sea sediment creep processes. Its core advantage lies in exceptional goodness of fit, indicating the highest agreement between predicted curves and actual creep data, effectively capturing the characteristics of deep-sea sediment creep. Deep-sea sediment creep typically involves three stages: instantaneous elastic deformation, decay creep, and steady-state creep. The modified Singh–Mitchell model’s curve shows a rapid initial rise followed by gradual flattening, perfectly aligning with experimental trends. Particularly noteworthy is its accurate depiction of slow strain accumulation in later stages. This capability stems from the model’s incorporation of temperature regulation effects and a hyperbolic decay law during refinement, enabling theoretical convergence to saturation values. This approach resolves the infinite strain growth limitation of traditional models, allowing comprehensive coverage of complex creep phases.
In contrast, other models exhibit notable limitations. While the Nishihara creep Model is applicable to hard materials like rocks, deep-sea sediments as soft materials involve processes such as particle rearrangement and pore water expulsion during creep. The model’s linear assumptions prove inadequate, yielding an R2 value of only 0.8997. The Burgers Creep Model, based on linear viscoelasticity, shows excessive growth in later stages with significant deviations from actual data (R2 = 0.8804). The modified Kelvin–Voigt Model primarily describes decay creep but fails to capture the steady-state creep phase of deep-sea sediments, resulting in insufficient late-stage growth (R2 = 0.8783). Although the original Singh–Mitchell model has a higher R2 value (0.9107), its modified version further improves fitting accuracy through parameter optimization, making it more suitable for modeling the complex creep behavior of deep-sea sediments.

4.4. Modeling Verification

To validate the applicability of the modified Singh–Mitchell model to the triaxial creep characteristics of deep-sea sediments, we selected creep test data obtained under various temperature (4 °C, 20 °C, and 40 °C) and confining pressure (100 kPa, 200 kPa, and 300 kPa) combinations for parameter fitting and prediction comparison. The comparison between the calculated curves of the modified Singh–Mitchell creep model and the experimental curves is shown in Figure 8.
As shown in the modified Singh–Mitchell creep equation and Figure 8, the modified Singh–Mitchell creep model enhances the original model’s stress–strain relationship function. This improvement enables the modified model to fully describe strain hardening behavior from zero strain to failure strain, thereby expanding the applicability of the original Singh–Mitchell creep model. The calculated curves of the modified model align closely with experimental trends, demonstrating that the calculated creep displacement increases at a decelerating rate over time and gradually approaches the peak value. This behavior matches the strain attenuation characteristics observed during the stable creep stage of experimental soft clay.
As shown in Table 4, the goodness of fit (R2) values indicate excellent overall performance across all test conditions, with all groups achieving R2 > 0.96. Notably, most scenarios (e.g., 4 °C temperature, 300 kPa confining pressure, 30 kPa deviatoric stress) exhibit R2 values approaching 0.9999, indicating near-perfect alignment between predicted curves and experimental data points. This confirms the model’s ability to accurately capture both the initial attenuation phase and steady-state characteristics of creep curves.
Under low-temperature (4 °C) and high confining pressure (300 kPa) conditions, the coefficient of determination (R2) remained consistently between 0.9642 and 0.999979 regardless of deviatoric stress variations. Notably, at low deviatoric stress levels, R2 reached 0.999979, with data points nearly perfectly aligning with the model’s predicted curves, demonstrating the model’s high–precision fitting capability in low-temperature stable environments. In medium-temperature (20 °C) scenarios with varying confining pressures (200 kPa, 300 kPa), even when deviatoric stress increased to 150 kPa (20 °C-200 kPa), R2 maintained a high value of 0.9985029. A minor fluctuation occurred at 60 kPa deviatoric stress (R2 = 0.964004), but overall remained robust, confirming the model’s reliability in describing creep characteristics under moderate temperature and confining pressure coupling. For high-temperature (40 °C) and high deviatoric stress conditions (e.g., 300 kPa-180 kPa), the model’s goodness of fit showed no significant decline. This indicates that the modified model effectively mitigates the temperature-induced nonlinear enhancement of creep curves. It also accurately tracks deformation patterns under high-energy environments. Additionally, the fitting results of the time parameter Ea(T) demonstrated reasonable physical trends: under identical temperature and confining pressure conditions, Ea(T) increased from 239.36899 to 255.86908 (4 °C-300 kPa) with rising deviatoric stress, reflecting the deviatoric stress’s regulatory effect on creep time characteristics consistent with experimental observations.
At the same time, the parameter adjustments of the Singh–Mitchell model align with physical principles. For example, the stress sensitivity coefficient β increases nonlinearly as deviatoric stress rises, which reflects the regulatory effect of deviatoric stress on creep. Additionally, the activation energy Ea(T) decreases with increasing temperature, corresponding to the mechanism by which temperature influences characteristic time. The fitting data shows that under confining pressure conditions of 4 °C and 300 kPa, when deviatoric stress increases from 30 kPa to 150 kPa, the time parameter β nonlinearly increases from 0.0169 to 2.1225, a 125-fold increase, indicating that minor changes in deviatoric stress can significantly alter the time scale of creep processes. This aligns with the experimental result in Section 3.2.3, where “strain exhibits exponential growth after deviatoric stress exceeds the yield threshold,” verifying the sensitivity of model parameters to deviatoric stress levels. The activation energy Ea(T) fluctuates within the range of 239.3690–245.9774 kJ/mol under the same confining pressure and deviatoric stress range (e.g., 30–150 kPa at 4 °C), generally showing a slow upward trend with increasing deviatoric stress. This phenomenon can be attributed to the increased effective stress on the soil particle skeleton under high deviatoric stress, leading to higher energy required to overcome interparticle viscous resistance, consistent with the thermodynamic viscosity theory that “higher stress levels require higher activation energy to drive deformation.” Furthermore, by comparing Ea(T) values under identical confining pressure and deviatoric stress conditions at different temperatures (e.g., Ea(T) = 1196.6757 kJ/mol at 20 °C-300 kPa-30 kPa, and Ea(T) = 2393.4517 kJ/mol at 40 °C-300 kPa-30 kPa), we observed that the activation energy increases nonlinearly with temperature. This aligns with the temperature-dependent activation effect on molecular thermal motion in the modified Arrhenius equation. Specifically, in high-temperature environments, the viscosity of inter-particle bound water films decreases, requiring higher activation energy to induce significant creep deformation. This further validates the physical rationality of the model parameters.
In summary, the time parameter fitting results of the modified Singh–Mitchell model demonstrate its excellent adaptability across a wide temperature range (4–40 °C), confining pressure (100–300 kPa), and deviatoric stress (30–180 kPa). The high R2 values (>0.96) validate its precise capability to describe the full creep process of deep-sea sediments. The rational variation pattern of parameter Ea(T) further confirms the model’s physical consistency, providing reliable parameter support for long-term deformation prediction in deep-sea engineering. Overall, the modified model demonstrates significantly enhanced applicability.
Firstly, it encompasses a wide range of operating conditions, precisely depicting full-stage creep within a temperature range of 4–40 °C, a confining pressure of 100–300 kPa, and a deviatoric stress of 30–180 kPa. All fitting R2 values are greater than 0.96, and the prediction errors of the steady-state creep rate are less than 5%.
Secondly, it attains mechanism completeness. It addresses the “infinite strain” defect of the original model by using a hyperbolic creep strain rate decay function that is consistent with the experimental “strain saturation” phenomena and captures the temperature-induced compression effects on the creep time-scale.
Thirdly, its engineering applicability is substantially improved. It can be directly applied in deep-sea engineering scenarios and offers reliable parameter support for long-term deformation prediction.

5. Discussion

5.1. Temperature–Confining Pressure Coupling Mechanism

The creep behavior of remolded sediments is co-regulated by temperature and confining pressure. Its microscopic mechanism manifests as a dynamic equilibrium of temperature-induced weakening and confining pressure-driven strengthening. Our research findings show that under conditions of 200 kPa confining pressure and 150 kPa deviatoric stress, the steady-state creep rate at 40 °C is six times higher than at 4 °C. Confining pressure suppresses creep via the “compaction-biting” effect on particle frameworks. When confining pressure increases from 100 kPa to 300 kPa, the porosity of soil samples decreases by 18–25%. Meanwhile, the particle contact area increases by more than 40%. These changes lead to a 50–70% improvement in long-term strength at 300 kPa (high confining pressure) compared to 100 kPa. The coupled effect of these factors manifests as follows. Under low-temperature, high-pressure conditions (4 °C, 300 kPa), the strengthening effect of confining pressure dominates. Creep here occurs primarily in a decaying phase, with creep strain rate attenuation reaching 80%. Under high-temperature, low-pressure conditions (40 °C, 100 kPa), the weakening effect of temperature becomes prominent. This leads to steady-state creep rates 5–8 times higher than those under low-temperature, high-pressure conditions. It thus triggers accelerated failure.

5.2. Creep Model Establishment and Verification

The modified Singh–Mitchell model achieves high-precision prediction of creep behavior in deep-sea remolded sediments by introducing temperature-sensitive characteristic time (l(T)) and activation energy parameter (Ea(T)). Validation results show that the model achieves an R2 goodness-of-fit exceeding 0.96 over a temperature range of 4 °C to 40 °C and confining pressure conditions of 100 to 300 kPa. Under extremely low temperature and high pressure conditions (4 °C, 300 kPa), the R2 reaches 0.9999, and the prediction error of the steady-state creep rate is less than 5%. The key parameter β (stress sensitivity coefficient) shows nonlinear increases with rising deviatoric stress: when deviatoric stress increases from 30 kPa to 180 kPa under a confining pressure of 300 kPa, β rises from 0.0169 to 2.8103, reflecting intensified particle fragmentation and pore deterioration under high stress. Activation energy Ea(T) decreases with temperature (239–256 kJ/mol at 4 °C, dropping to 1243–2597 kJ/mol at 40 °C), consistent with the physical mechanism of temperature-induced weakening of interparticle cohesion.
A more in-depth analysis of creep mechanisms is conducted from the perspectives of micro-macro correlation. This analysis reveals the physical essence of the temperature-sensitive characteristic time (T) and the activation energy parameter Ea(T) in the modified model. This physical essence can be explained by the evolution of the soil skeleton’s microstructure. When temperatures rise, decreased interparticle viscous resistance leads to a significant reduction in the Ea(T) required for viscous flow of the soil skeleton. Meanwhile, increased confining pressure enhances interparticle friction resistance through compaction and interlocking effects, corresponding to the slowed growth rate of the stress sensitivity coefficient in the model. Experimental data directly verifies this mechanism: For every 10 °C rise in temperature, the steady-state creep rate increases by 30–50%, consistent with the reduction in Ea(T) facilitating viscous flow. A 100 kPa increase in confining pressure results in a 20–30% improvement in long-term strength, corresponding to an average 20% increase in Ea(T) that reflects the increased energy requirements for interlocking. The critical temperature point of 20 °C aligns with the inflection point of Ea(T), where the rate of decrease in Ea(T) slows above 20 °C, a direct correlation with accelerated organic matter decomposition and rapid weakening of cementation under high temperatures. The “time softening” phenomenon exists. It is characterized by the deviation of isochronous curves over time. This phenomenon matches the model’s β increase with prolonged loading. It also matches the growth of saturated strain  ε . In addition, it reflects the macroscopic progressive failure of particle cementation under long-term loading.

5.3. Engineering Optimization Design

Based on the quantitative principles derived from the experimental results and the modified model of this study, targeted technical solutions can be formulated for deep-sea engineering design. For the structural foundations in deep-sea projects, priority should be given to utilizing strata with higher confining pressures. These strata can enhance stability through their creep-suppressing effects. Simultaneously, areas with active submarine thermal flows that cause elevated temperatures should be avoided to minimize the promoting effect of high temperatures on creep. In structural deformation prediction, the modified Singh–Mitchell model should replace traditional empirical models. This can be achieved by inputting parameters such as field confining pressure, temperature, and deviatoric stress. This model enables strain convergence prediction and can accurately calculate the cumulative deformation over the long-term service period of structures. Additionally, it is recommended to install strain and temperature monitoring equipment at critical structural locations to continuously monitor creep strain and ambient temperature. When abnormal changes in creep rate or temperature are detected, reinforcement measures should be promptly initiated to mitigate deformation risks.

5.4. Uncertainty and Error Analysis

This study has errors and uncertainties that primarily stem from three aspects. The first aspect is systematic errors in the experimental apparatus. These include temperature control accuracy of ±0.1 °C, axial displacement measurement accuracy of 0.01 mm, and confining pressure loading rate control error. The second aspect is non-homogeneity in soil sample preparation, with parallel test dispersion being less than 5%. The third aspect is simplified model assumptions. For instance, hyperbolic creep strain rate decay may deviate from reality when deviatoric stress exceeds 180 kPa. Moreover, the linear correlation between temperature and activation energy may fail under extreme temperatures of <4 °C or >40 °C. Quantitative results indicate that the goodness-of-fit R2 of the modified model fluctuates between 0.96 and 0.9999, with steady–state creep rate prediction errors <5% and activation energy Ea(T) analytical solution errors <1%. These errors remain within the allowable deformation thresholds for deep-sea engineering applications. However, under extreme conditions, dynamic model parameter adjustments based on field monitoring are required to reduce uncertainties.

6. Conclusions

This study systematically investigates the influence of temperature (4 °C, 20 °C, 40 °C), confining pressure (100 kPa, 200 kPa, 300 kPa), and deviatoric stress (30–180 kPa) on the creep characteristics of deep-sea sediments through triaxial creep tests. The findings are validated and modified using the Singh–Mitchell model, with the key conclusions summarized as follows:
The coupling mechanism of temperature-induced weakening and confining pressure-induced strengthening in deep-sea remolded soil is revealed: the temperature decreases the cohesion of particles through the thickening of the bound water film, and the confining pressure strengthens the skeleton stability through the compaction effect. Quantitative laws show that the steady-state creep rate increases by 30–50% for every 10 °C rise in temperature (under medium-high triaxial stress), and the long-term strength improves by 20–30% for every 100 kPa increase in confining pressure. The pressure strengthening effect is dominant under low-temperature and high-confining-pressure conditions, while the temperature weakening effect is significant under high-temperature and low-confining-pressure conditions.
A modified Singh–Mitchell model incorporating temperature–stress–time coupling was developed and validated. This model introduces temperature-sensitive characteristic time and activation energy parameters. Through this introduction, the model achieves the first three-dimensional coupling of temperature, stress, and time. This coupling enables the model to precisely predict the full creep process. The prediction covers a temperature range of 4–40 °C and a confining pressure range of 100–300 kPa. All conditions exhibited an R2 value> greater than 0.96, with parameter variations consistent with physical principles. The modified model overcomes the limitations of traditional Singh–Mitchell models in considering temperature effects and predicting infinite strain, providing a reliable constitutive tool for pile foundation design in deep-sea oil and gas development projects.
This study identifies 20 °C as the critical temperature for soil creep sensitivity. Beyond this threshold, organic matter decomposition intensifies, causing the steady-state creep rate to increase by 130% (under a confining pressure of 200 kPa and deviatoric stress of 150 kPa). Notably, a high confining pressure (300 kPa) significantly suppresses creep deformation, reducing strain by 62% under medium-to-high deviatoric stress (180 kPa). This “confinement-enhancing effect” provides crucial mechanical evidence for deep-sea structural foundation design. In deep-sea engineering, priority should be given to utilizing the suppression effect of high confining pressure (≥300 kPa) (with 62% strain reduction) while avoiding high-temperature zones above 20 °C to minimize long-term deformation risks.

Author Contributions

Methodology, L.W. and Q.C.; Resources, G.L.; Data curation, Z.W., J.T. and X.X.; Writing—original draft, Y.F.; Supervision, B.C. and S.L.; Project administration, Q.C. and Y.F. All authors have read and agreed to the published version of the manuscript.

Funding

The authors gratefully acknowledge the Hunan University of Science and Technology’s “Hainiu” Series Deep-sea Drilling Rig R&D Team for providing soil samples, and express sincere appreciation for the financial support from the National Natural Science Foundation of China (Grant No. 52478341) and Natural Science Foundation of Hunan Province (No. 2025JJ30022). The authors additionally acknowledges the research funding from the Postgraduate Scientific Research Innovation Project of Hunan Province (No. CX20240089).

Data Availability Statement

The original contributions presented in this study are included in the article material. Further inquiries can be directed to the corresponding author.

Conflicts of Interest

The authors declare no conflicts of interest.

References

  1. Liu, Z.; Liu, K.; Chen, C.M. Deep-sea rock mechanics and mining technology: State of the art and perspectives. Int. J. Min. Sci. Technol. 2023, 33, 1083–1115. [Google Scholar] [CrossRef]
  2. Jin, Y.; Cai, Z.; Cui, J. The characteristics of coarse particle solid–liquid two-phase flow and wear properties in deep-sea multistage mining pumps. Phys. Fluids 2025, 37, 013339. [Google Scholar] [CrossRef]
  3. Amaechi, C.V.; Reda, A.; Shahin, M.A.; Sultan, I.A.; Beddu, S.B.; Ja’E, I.A. State-of-the-art review of composite marine risers for floating and fixed platforms in deep seas. Appl. Ocean Res. 2023, 138, 103624. [Google Scholar] [CrossRef]
  4. Hayes, C.T.; Costa, K.M.; Anderson, R.F.; Calvo, E.; Chase, Z.; Demina, L.L.; Dutay, J.C.; German, C.R.; Heimbürger-Boavida, L.E.; Jaccard, S.L.; et al. Global Ocean Sediment Composition and Burial Flux in the Deep Sea. Glob. Biogeochem. Cycles 2021, 35, 2020GB006769. [Google Scholar] [CrossRef]
  5. Li, A.; Chen, Z.J.; Feng, W.Q.; Yin, J.H. The effects of temperature on one-dimensional consolidation and creep behaviors of Hong Kong marine deposits. Int. J. Geomech. 2023, 23, 04023215. [Google Scholar] [CrossRef]
  6. Spearman, J.; Taylor, J.; Crossouard, N.; Cooper, A.; Turnbull, M.; Manning, A.; Lee, M.; Murton, B. Measurement and modelling of deep sea sediment plumes and implications for deep sea mining. Sci. Rep. 2020, 10, 5075. [Google Scholar] [CrossRef] [PubMed]
  7. Aidy, U.; Seyed Morteza, Z.; Sherif, L.A. Temperature Effects on Residual Shear Strength of Soil. In Proceedings of the Geo-Congress 2023, Los Angeles, CA, USA, 26–29 March 2023; pp. 541–548. [Google Scholar]
  8. Li, Y.; Li, Y.; Guo, Z.; Xu, Q. Durability of MICP-reinforced calcareous sand in marine environments: Laboratory and field experimental study. Biogeotechnics 2023, 1, 100018. [Google Scholar] [CrossRef]
  9. Feng, Y.; Chen, Q.; Wu, L.; Tang, J.; Liu, G.; Wang, Z.; Hu, W.; Chen, B.; Liu, S. Study on variation characteristics of shear strength of deep-sea sediments in the South China sea under thermo-hydraulic coupling. Sci. Rep. 2025, 15, 35512. [Google Scholar] [CrossRef] [PubMed]
  10. Liu, Y.; Huang, F.; Cao, Y.; Jin, F.; Wang, G.; Hou, W. Review of Soil Creep Characteristics and Advances in Modelling Research. Buildings 2024, 14, 1668. [Google Scholar] [CrossRef]
  11. Nitta, S.; Kasaya, T.; Kawamura, K. Active sediment creep deformation on a deep-sea terrace in the Japan Trench. Geol. Mag. 2021, 158, 39–46. [Google Scholar] [CrossRef]
  12. Lei, L.; Seol, Y. Pore-Scale Investigation of Methane Hydrate-Bearing Sediments Under Triaxial Condition. Geophys. Res. Lett. 2020, 47, e2019GL086448. [Google Scholar] [CrossRef]
  13. Ye, J.; Haiyilati, Y.; Cao, M.; Zuo, D.; Chai, X. Creep characteristics of calcareous coral sand in the South China Sea. Acta Geotech. 2022, 17, 5133–5155. [Google Scholar] [CrossRef]
  14. Gao, Y.; Shi, T.; Yuan, Q.; Shi, X.; Sun, K. Particle gradation effects on creep characteristics and the underlying mechanism in calcareous sand. Constr. Build. Mater. 2024, 424, 135952. [Google Scholar] [CrossRef]
  15. Hu, Q.; Li, Y.; Wu, N.; Sun, J.; Chen, Q.; Sun, X. Study on creep behaviors and nonlinear creep constitutive model for sandy marine hydrate-bearing sediments. Ocean Eng. 2023, 286, 115717. [Google Scholar] [CrossRef]
  16. Li, Y.; Hu, Q.; Wu, N.; Wang, H.; Sun, X.; Hu, G.; Sun, Z.; Jiang, Y. Acoustic characterization for creep behaviors of marine sandy hydrate-bearing sediment. Sci. Rep. 2023, 13, 22199. [Google Scholar] [CrossRef]
  17. Tang, B.; Huang, X.; Zhong, W.J. Study on shear creep model of calcareous sand in China South Sea. Front. Earth Sci. 2024, 12, 1525037. [Google Scholar] [CrossRef]
  18. Liu, Y.; Zhuang, W.; Gao, C.; Wei, C.; Xue, L.; Yang, Q. Creep parameter inversion and long-term deformation prediction of a near-dam slope considering spatio-temporal deformation data during construction and impoundment period. Eng. Geol. 2025, 351, 108043. [Google Scholar] [CrossRef]
  19. Yin, S.; Huang, J.N.; Li, X.; Bai, L.; Zhang, X.; Li, C. Experimental study on deformation characteristics and pore characteristics variation of granite residual soil. Sci. Rep. 2022, 10, 1137324. [Google Scholar] [CrossRef] [PubMed]
  20. Kirkham, A.; Tsiampousi, A.; Potts, D.M. Thermo-mechanical behaviour of a kaolin-based clay soil. Geotechnica 2024, 74, 1742–1751. [Google Scholar] [CrossRef]
  21. Tafili, M.J. Modeling Temperature- and Rate-Dependent Behavior of Soft Soils: A Thermo-Visco-Hypoplastic Approach. Int. J. Numer. Anal. Methods Geomech. 2025, 49, 2076–2091. [Google Scholar] [CrossRef]
  22. Wang, L. An analytical model for 3D consolidation and creep process of layered fractional viscoelastic soils considering temperature effect. Soils Found. 2022, 62, 101124. [Google Scholar] [CrossRef]
  23. Amini, D.; Maghoul, P.; Hollnder, H.; Bilodeau, J.P. A critical state-based thermo-elasto-viscoplastic constitutive model for thermal creep deformation of frozen soils. Acta Geotech. 2024, 19, 2955–2973. [Google Scholar] [CrossRef]
  24. Lv, H.; Chen, L. Time-Dependent Creep Damage Model of Frozen Soil with Unsteady Fractional Order under Temperature and Stress Coupling. Math. Probl. Eng. 2023, 2023, 3791177. [Google Scholar] [CrossRef]
  25. Liu, T.; Wu, P.; Lu, Q.; Li, Y.; Song, Y. Creep and Wave Velocity Characterization on Anisotropic Consolidated Methane Hydrate Sediments of the South China Sea. Energy Fuels 2024, 38, 16416–16425. [Google Scholar] [CrossRef]
  26. Xia, C.; Liu, Z.; Zhou, C. Burger’s Bonded Model for Distinct Element Simulation of the Multi-Factor Full Creep Process of Soft Rock. J. Mar. Sci. Eng. 2021, 9, 945. [Google Scholar] [CrossRef]
  27. Zhou, C.; Cui, G.; Liang, W.; Liu, Z.; Zhang, L. A Coupled Macroscopic and Mesoscopic Creep Model of Soft Marine Soil Using a Directional Probability Entropy Approach. J. Mar. Sci. Eng. 2021, 9, 224. [Google Scholar] [CrossRef]
  28. Liu, Y.; Zhang, H.; Sun, Y.; Wu, K.; Xiao, W. Mechanical Behavior of Marine Soft Soil with Different Water Contents Under Cyclic Loading. J. Mar. Sci. Eng. 2024, 12, 2307. [Google Scholar] [CrossRef]
  29. Wang, P.; Liu, E.; Zhi, B.; Song, B.; Kang, J. Creep characteristics and unified macro–meso creep model for saturated frozen soil under constant/variable temperature conditions. Acta Geotech. 2022, 17, 5299–5319. [Google Scholar] [CrossRef]
  30. Ma, W.; Rao, Q.; Li, P.; Guo, S.C.; Feng, K. Shear creep parameters of simulative soil for deep-sea sediment. J. Cent. South Univ. 2014, 21, 4682–4689. [Google Scholar] [CrossRef]
  31. Wan, B.; Peng, F.; Yongping, J.; Peng, Y.; Deshun, L. Drilling Technology Status and Development Trends of Deep-sea Seafloor Drill. J. Mech. Eng. 2024, 60, 385–402. (In Chinese) [Google Scholar]
  32. Zhang, X. Comparative analysis of soft soil creep data processing methods. J. Jilin Univ. (Earth Sci. Ed.) 2010, 40, 1401–1408. (In Chinese) [Google Scholar]
  33. Srikanth, T.; Padmarekha, A. Application of the Arrhenius Equation in Predicting the Temperature Susceptibility of Unmodified and Modified Bituminous Binder. Civ. Eng. J. 2024, 10, 885–901. [Google Scholar] [CrossRef]
  34. Youssef, A.A.; Salas, A.; Al-Harbi, N.; Basfer, N.M.; Nassr, D.I. Determination of chemical kinetic parameters in Arrhenius equation of constant heating rate: Theoretical method. Alex. Eng. J. 2023, 67, 461–472. [Google Scholar] [CrossRef]
  35. Yin, Z.; Zhang, X.; Li, X.; Zhang, J.; Zhang, Q. Modified Burgers model of creep behavior of grouting-reinforced body and its long-term effect on tunnel operation. Tunn. Undergr. Space Technol. 2022, 127, 104537. [Google Scholar] [CrossRef]
  36. Jiang, H.; Jiang, A. Numerical analysis and application of Nishihara creep nonlinear damage model considering ubiquitous joints. Tunn. Undergr. Space Technol. 2025, 157, 106335. [Google Scholar] [CrossRef]
  37. Proena, M.S.; Paschoalini, A.T.; Silva, J.B.C.; Souza, A.; Obata, D.H.S.; Lima, L.P.M. The finite element method applied in the viscoelastic constitutive model of kelvin–voigt for characterization of the soil dynamic response to water leakage simulation. J. Braz. Soc. Mech. Sci. Eng. 2022, 44, 470. [Google Scholar] [CrossRef]
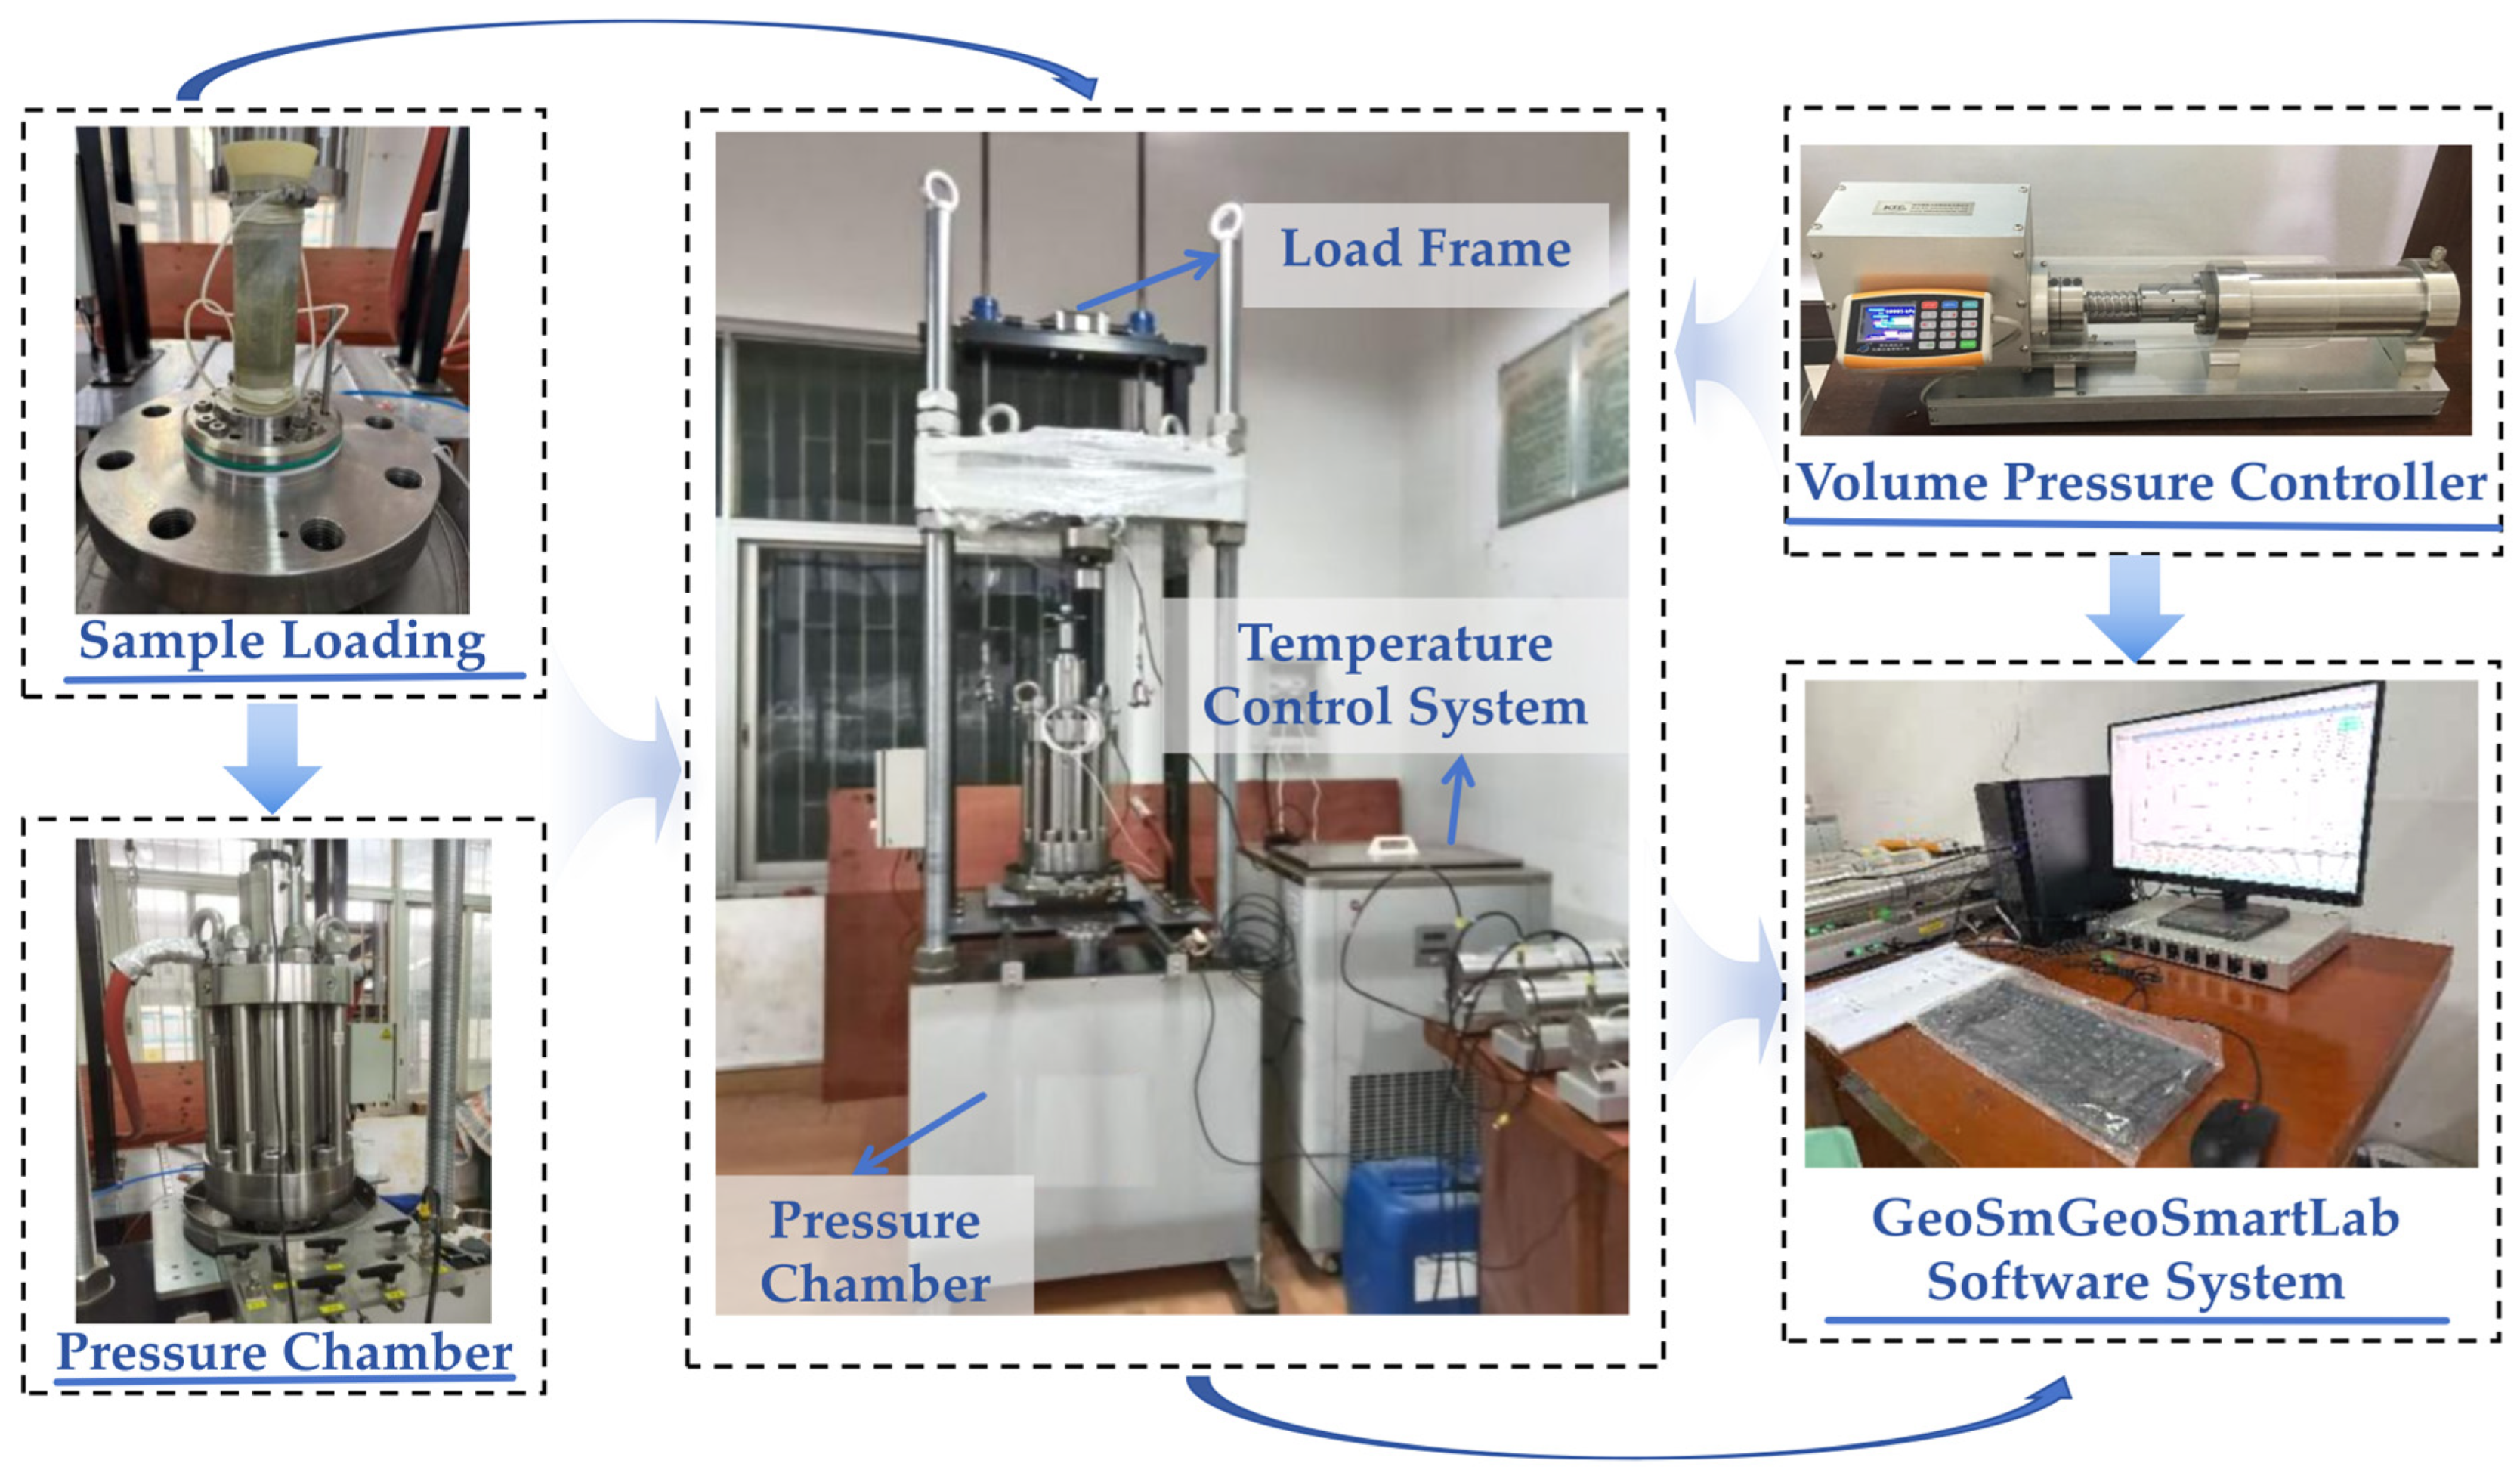
Figure 1. Low-temperature high-pressure automatic environmental triaxial test system.
Jmse 14 00133 g001
Figure 2. Flowchart of triaxial creep loading test for deep-sea sediments.
Jmse 14 00133 g002
Figure 3. Triaxial creep curves of specimens under varying confining pressures at 4 °C.
Jmse 14 00133 g003
Figure 4. Strain–time curves of deep-sea sediments under different temperatures and confining pressures.
Jmse 14 00133 g004
Figure 5. Triaxial creep stress–strain isochronism curves of deep-sea sediments.
Jmse 14 00133 g005
Figure 6. Triaxial creep-time versus creep strain rate relationship curve of deep-sea sediments.
Jmse 14 00133 g006
Figure 7. Comparison of fitting effects of different creep models.
Jmse 14 00133 g007
Figure 8. Comparison of fitting curves for the Singh–Mitchell model with triaxial creep correction applied to deep-sea sediments.
Jmse 14 00133 g008
Table 1. Basic material properties of the deep-sea sediment.
Water Depth h1/mDepth Below Seabed h2/mWater Content ω/%Specific Gravity GsVoid Ratio eDry Density ρd/g·cm−3Plastic Limit ωP/%Liquid Limit ωL/%Cohesion c/kPaAngle of Internal Friction φ
2060231103.22.552.690.5227.9753.9519.5827.32
Table 2. Triaxial creep test scheme for deep-sea sediments.
Serial NumberEffective Confining Pressure σ3/kPaTemperature T/°CDeviatoric Stress Path p/kPa
T-1100430-60-90-120-150
T-2200430-60-90-120-150-180
T-3300430-60-90-120-150-180-210
T-41002030-60-90-120-150
T-52002030-60-90-120-150-180
T-63002030-60-90-120-150-180-210
T-71004030-60-90-120-150
T-82004030-60-90-120-150-180
T-93004030-60-90-120-150-180-210
Table 3. Analysis of characteristics of different creep models.
Model NameModel
Modified Singh–Mitchell model ε ( t ) = A e α Dr · t t + l ( T )
Singh–Mitchell model [25] ε . t = A e α Dr t 1 t m
Burgerscreep model [35] ε ( t ) = σ E 1 + σ t η 1 + σ E 2 1 exp E 2 t η 2
Nishihara Creep Model [36] ε ( t ) = σ E 1 + σ E 2 ( 1 exp ( E 2 t η 2 ) ) + σ σ y η 3 · H
Modified Kelvin–Voigt Model [37] ε ( t ) = σ E 1 exp E t 1 D t η 0
D t = 1 − exp( ktn)
Table 4. Time parameter of modified Singh–Mitchell creep model.
Temperature/°CConfining Pressure σ3/kPaDeviatoric Stress p/kPa β Ea(T)/(kJ/mol)R2
4300300.0169239.36900.9998
600.0411203.67960.9642
900.5427229.42680.9915
1201.4014241.87310.9989
1502.1225245.97740.9998
1802.8103255.86910.9999
20200300.04171243.96810.9823
600.67941055.78140.9733
901.55891193.86250.9902
1202.16821231.25850.9946
1502.78571213.25030.9985
20300300.01761196.67570.9999
600.06001040.31330.9640
900.62831137.80640.9891
1201.52681208.03770.9987
1502.20081228.37860.9997
1802.87371300.43770.9999
40300300.02402393.45170.9997
600.08942111.02310.9705
901.60652369.56370.9889
1201.61802414.47330.9986
1502.25372454.38700.9997
1802.90882597.03730.9999
Disclaimer/Publisher’s Note: The statements, opinions and data contained in all publications are solely those of the individual author(s) and contributor(s) and not of MDPI and/or the editor(s). MDPI and/or the editor(s) disclaim responsibility for any injury to people or property resulting from any ideas, methods, instructions or products referred to in the content.