Article

Research on Calibration Methods and Experiments for Six-Component Force Sensors

1
Ocean College, Zhejiang University, Zhoushan 316021, China
2
Department of Applied Mathematics and Mathematical Modeling, Saint Petersburg State Marine Technical University, Saint Petersburg 190121, Russia
*
Author to whom correspondence should be addressed.
J. Mar. Sci. Eng. 2025, 13(9), 1811; https://doi.org/10.3390/jmse13091811
Submission received: 13 July 2025 / Revised: 15 September 2025 / Accepted: 17 September 2025 / Published: 18 September 2025
(This article belongs to the Section Ocean Engineering)

Abstract

The measurement accuracy of six-component force sensors is crucial for reliable hydrodynamic model test results. To enhance data precision, this study presents an efficient calibration device based on a dual-axis rotational mechanism, enabling multi-degree-of-freedom attitude adjustment of the sensor. By applying known forces and moments through various loading conditions and employing the least squares method to obtain a 6 × 6 calibration coefficient matrix, we effectively reduce system errors and external disturbances. The effectiveness of the proposed calibration method is validated using rotational arm tests with a KCS standard ship model. The results indicate that most calibration point errors are below 1%, with the maximum error not exceeding 7%, and the measured data show good agreement with international standards. This method offers high calibration efficiency and accuracy, making it well-suited for the calibration of multi-component force sensors and for use in hydrodynamic, wind tunnel, and other multi-disciplinary experimental applications, promising potential for wider use.

1. Introduction

In the field of ocean engineering, towing tank model tests serve as a fundamental approach for investigating the hydrodynamic performance of surface vessels, underwater vehicles, and offshore structures. These tests are also essential tools for validating the accuracy of theoretical methods, assessing the reliability of numerical simulations, and evaluating the feasibility of performance predictions [1,2,3]. Model experiments provide an effective means for studying the hydrodynamic characteristics of ships and marine engineering structures [4,5,6]. In the domains of shipbuilding, offshore structures, hydraulic engineering, and marine equipment, the results of model experiments not only serve as validation for theoretical and numerical approaches but also offer critical references for performance assessment and design optimization [7,8,9].
In hydrodynamic model testing, six-component force sensors are widely used as measurement instruments. Strain gauges arranged in Wheatstone bridge circuits convert elastic element strain into electrical signals [10,11], enabling precise measurement of longitudinal, transverse, and vertical forces, as well as roll, pitch, and yaw moments [12,13]. Force balances, as fundamental measurement devices in experiments, can be classified as single-component or multi-component balances based on the number of force directions measured. Single-component balances capture forces in only one direction, while multi-component balances can simultaneously measure forces in multiple directions. In practice, three-component and six-component balances are the most commonly employed types [10]. Additionally, multi-component force balances are extensively used in flow measurement and industrial flow control applications [14,15,16].
However, measurement systems in practical applications are inevitably affected by uncertainties such as system errors, external interference, and sensor component aging, resulting in a complex and nonlinear relationship between the sensor output signal and the applied load. Furthermore, crosstalk arising from sensor structural design and operational factors further reduces measurement accuracy [17]. Despite incorporating innovative concepts and meticulous optimization in the design, manufacturing, and application of sensors, crosstalk remains a challenging issue that is difficult to eliminate entirely. The combined influence of these factors further complicates the relationship between the actual output signal and the applied load [18,19]. Therefore, establishing an accurate mapping between the applied load and the output signal is crucial for improving the accuracy of measurement data.
Traditional calibration methods typically rely on regression analysis based on predefined models and least-squares optimization techniques. However, these methods require large volumes of experimental data, making the calibration process complex and time-consuming. In recent years, researchers have proposed a series of new calibration methods. For example, Reis et al. [20] developed advanced calibration techniques for dynamic force measurement; Booth et al. [21] proposed an air balance calibration procedure for dual airflow systems, significantly simplifying traditional processes; Huang et al. [22] designed an air-floating six-axis force measurement platform, achieving high-precision calibration for multi-axis force sensors; Ulbrich et al. [23] analyzed wind tunnel force balance strain gauge data using weighted least-squares fitting; and Parker et al. [24] developed a single-vector balance calibration system, combining formal experimental techniques to address data quality and productivity limitations. These studies indicate that enhancing the efficiency and accuracy of sensor calibration has become a research focus. Recent research also highlights an increasing demand for improved calibration and verification procedures. For instance, sensitivity studies of aerodynamic load prediction methods employ dynamic calibration of force balances [25], while in situ calibration methods for multi-component force balances have been applied in model tests of propellers in water tunnels [26]. Nevertheless, existing calibration methods still exhibit drawbacks such as procedural complexity, lengthy processes, and insufficient practical validation.
To address these issues, this paper proposes an efficient calibration method and develops a corresponding calibration device. The proposed method is validated through rotational arm tests using a KCS standard ship model, aiming to provide more accurate and reliable measurement tools and technical support for hydrodynamic model experiments. The main contributions are:
  • The innovative design and implementation of an efficient six-component force sensor calibration device and method based on a dual-rotation mechanism to improve the degrees of freedom, efficiency, and accuracy of calibration.
  • Systematic validation of the proposed calibration method’s high accuracy and engineering applicability through rotational arm tests with a KCS standard ship model, thereby providing reliable measurement support for hydrodynamic model testing.

2. Methodology

2.1. Calibration Device Design

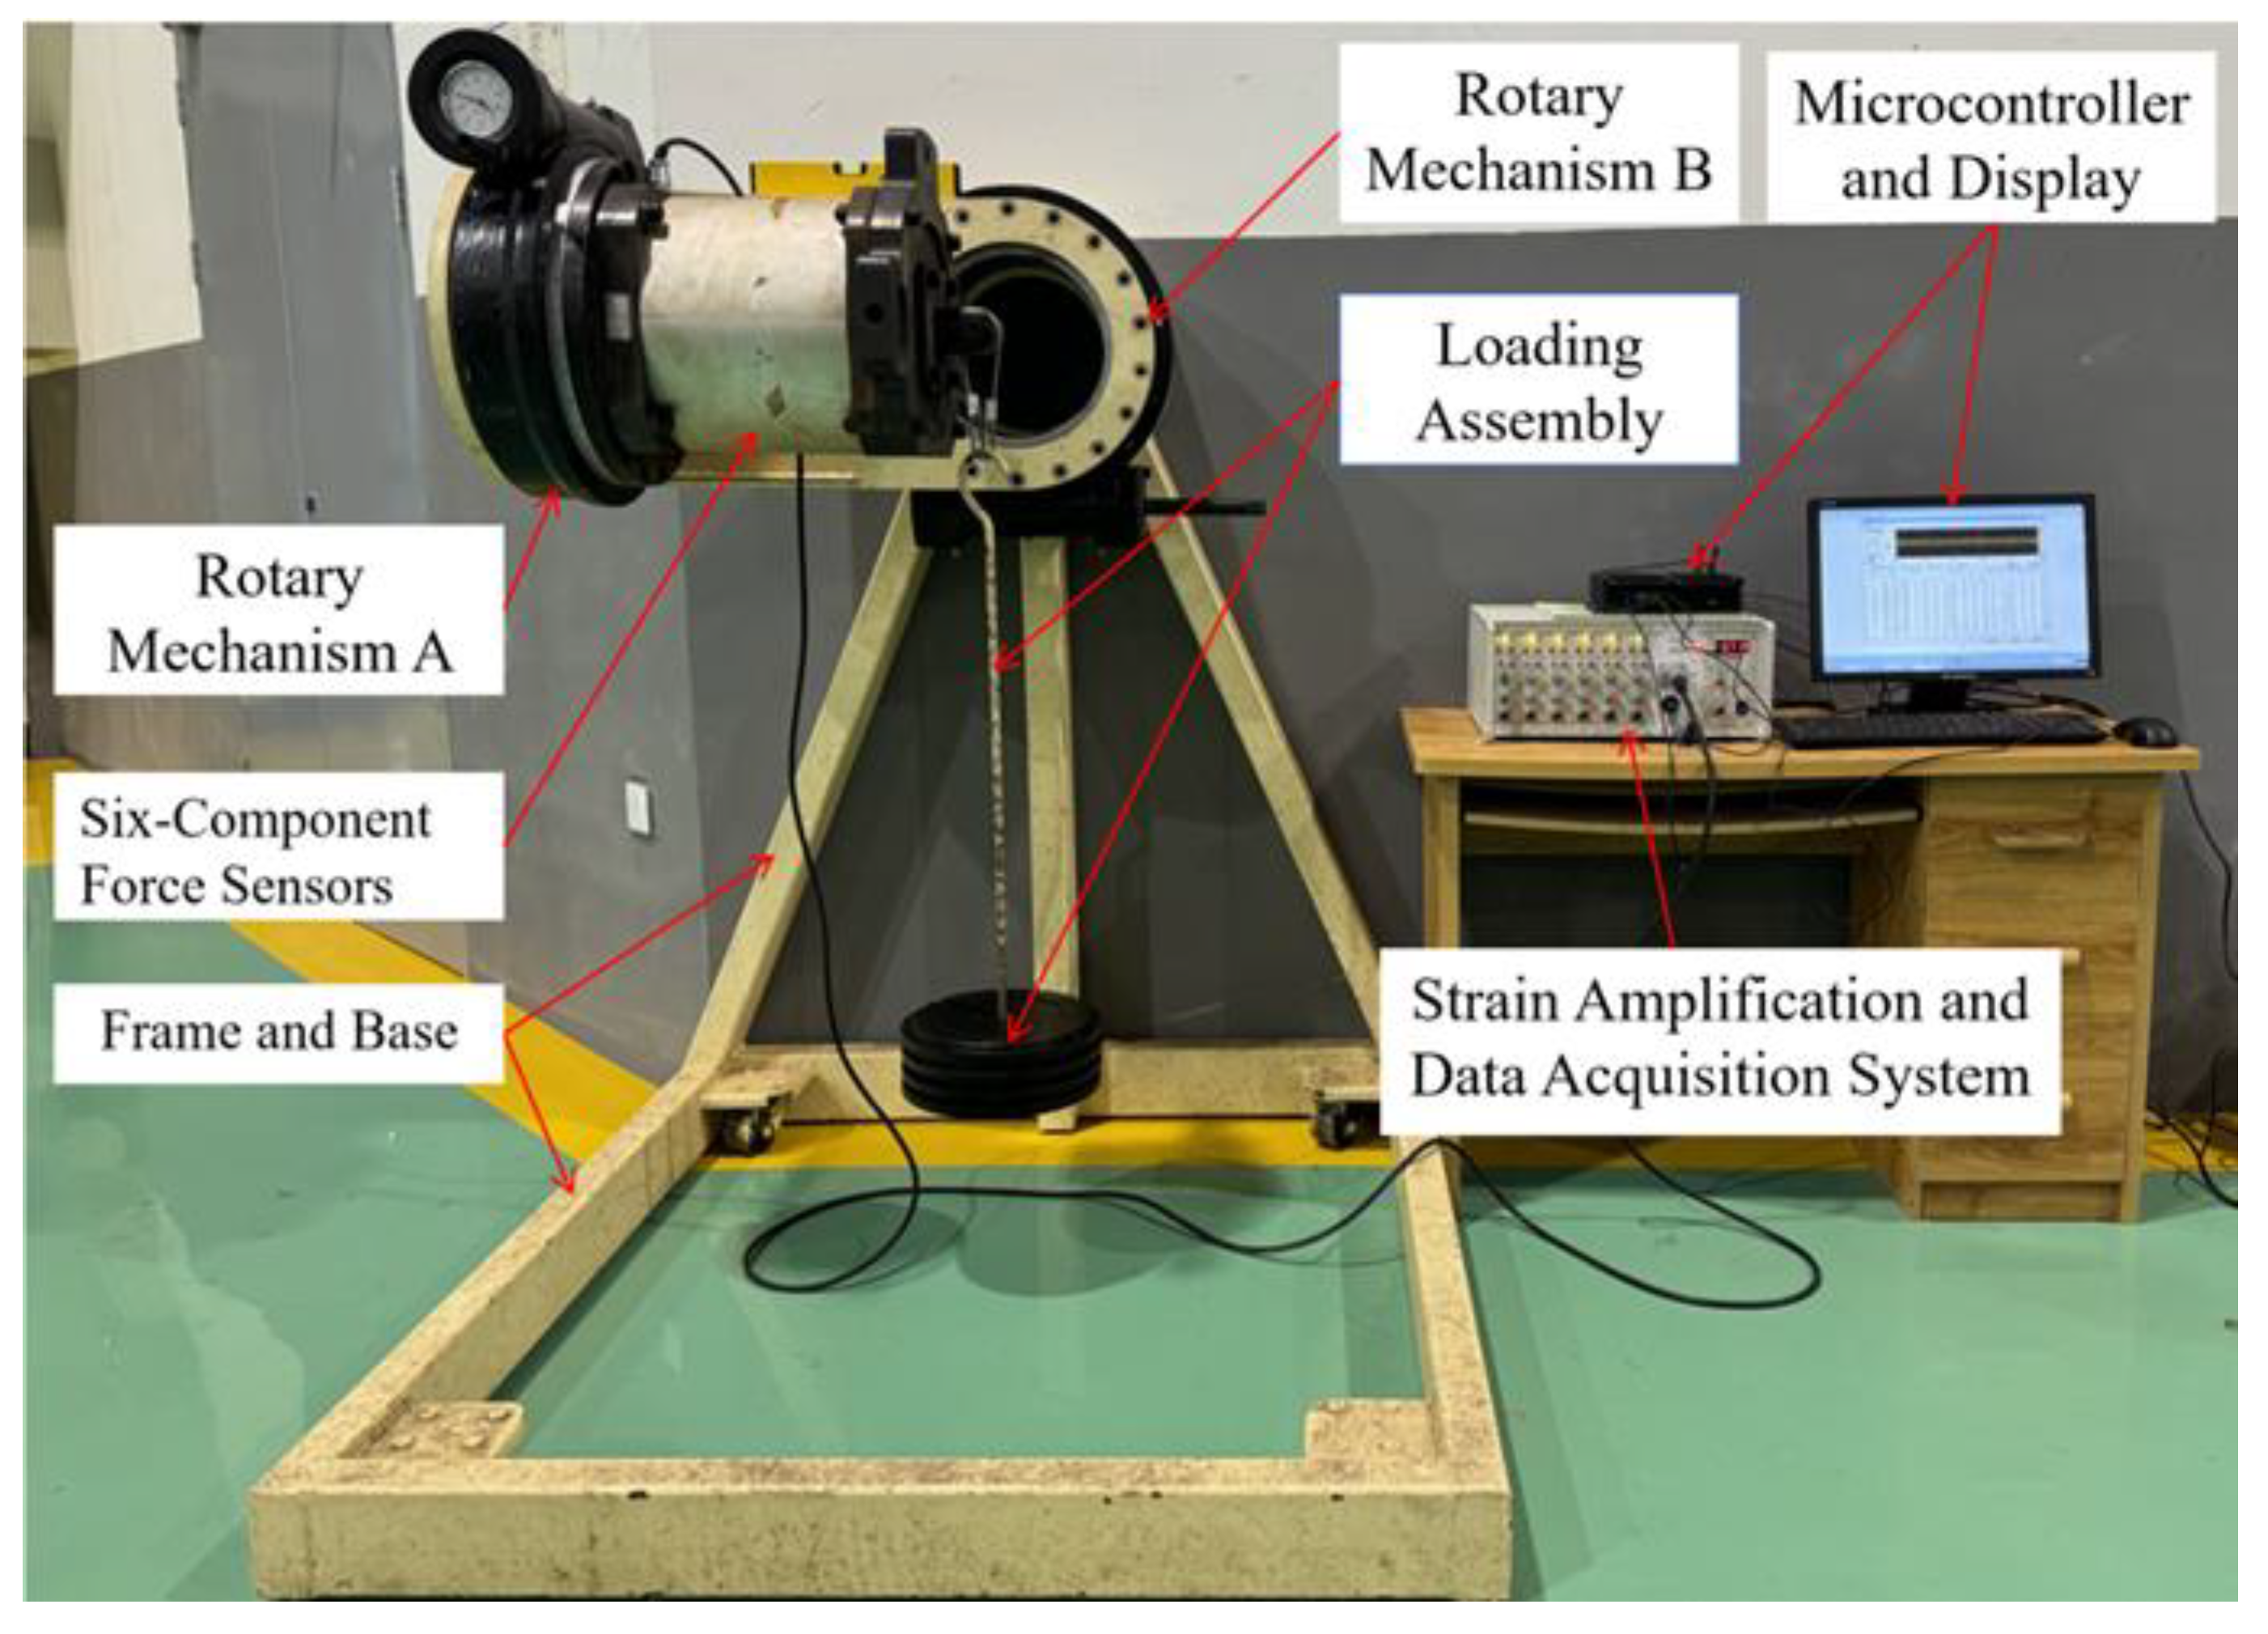
This paper presents the design of a calibration device suitable for both single-component and multi-component force sensors. The main structure of the device is illustrated in Figure 1. The device comprises a frame and base, two rotary mechanisms, an adapter flange, a rotating handle, and a ratchet handle. It is also equipped with auxiliary components such as a loading plate, loading rod, pulley bracket, hook, and tray for load application. Vertical forces are applied by suspending weights to utilize gravity, while the sensor’s orientation can be adjusted to enable precise measurement and calibration of forces in six directions.
The core design of the device centers on the precise orthogonal intersection of the axes of the two rotary mechanisms. Rotary Mechanism A is mounted on the frame and is capable of 360°rotation, with its angle precisely controlled by a ratchet handle. The rotating end of Rotary Mechanism A is connected to Rotary Mechanism B via an L-shaped adapter flange. The two perpendicular flange surfaces of the adapter are rigidly attached to the rotating end of Rotary Mechanism A and the fixed end of Rotary Mechanism B, respectively, ensuring that the two rotary mechanisms are arranged vertically in space. Rotary Mechanism B also allows for 360° rotation, with its angle finely adjusted using a rotating handle. A six-axis force sensor is installed at the rotating end of Rotary Mechanism B. With this configuration, Rotary Mechanism A can drive the adapter flange, Rotary Mechanism B, and the sensor to rotate as an integrated unit about its own axis, while Rotary Mechanism B can independently rotate the sensor about its own axis. This design enables multi-degree-of-freedom rotational control of the sensor. Based on this setup, by applying a vertical load to the sensor, precise measurement and calibration of the six directional force components can be achieved.

2.2. Calibration System Composition

The calibration system is a precision measurement device that integrates mechanical loading, data acquisition, and data processing. As illustrated in Figure 2, the system comprises a calibration apparatus and loading assembly, a six-axis force sensor, a strain amplification and data acquisition system, a microcontroller, and a display unit. The six-axis force sensor, equipped with internal strain gauges, is capable of accurately detecting changes in the three force components (Fx, Fy, Fz) and three moment components (Mx, My, Mz) during loading. The resulting signals are transmitted to the strain amplifier and data acquisition system. After processing by the microcontroller, the data can be displayed and recorded in real time.
Two rotary mechanisms define mutually perpendicular rotational planes, enabling multi-degree-of-freedom orientation adjustment of the sensor. The fixed end of the sensor is connected to the rotating end of Rotary Mechanism B, while the loading end is fitted with a loading assembly. Weights are placed on a tray to apply a vertical load. Both rotary mechanisms are equipped with 360° graduated dials, allowing for precise adjustment of the sensor’s rotation angles. In conjunction with a spirit level, the coordinate planes of the sensor can be calibrated to either horizontal or vertical positions, ensuring the accuracy of the loading direction. By adjusting the sensor’s orientation and the direction of loading, the system is capable of accurately acquiring force and moment data in all directions from the sensor.

2.3. Calibration Example

Prior to calibration, the device and sensor must be precisely assembled and thoroughly adjusted. Once the calibration apparatus has been positioned securely in an appropriate location, Rotary Mechanism A should be rotated to its lowest point. The sensor is then fixed in place using bolts, with the socket oriented outward. The loading plate and pulley bracket are attached to the loading end of the sensor, ensuring that the pulley axis is perpendicular to the axis of the sensor socket. Before each loading operation or configuration change, a spirit level is used to verify that the sensor plane is horizontal, and base shims are adjusted if needed to ensure loading direction accuracy.
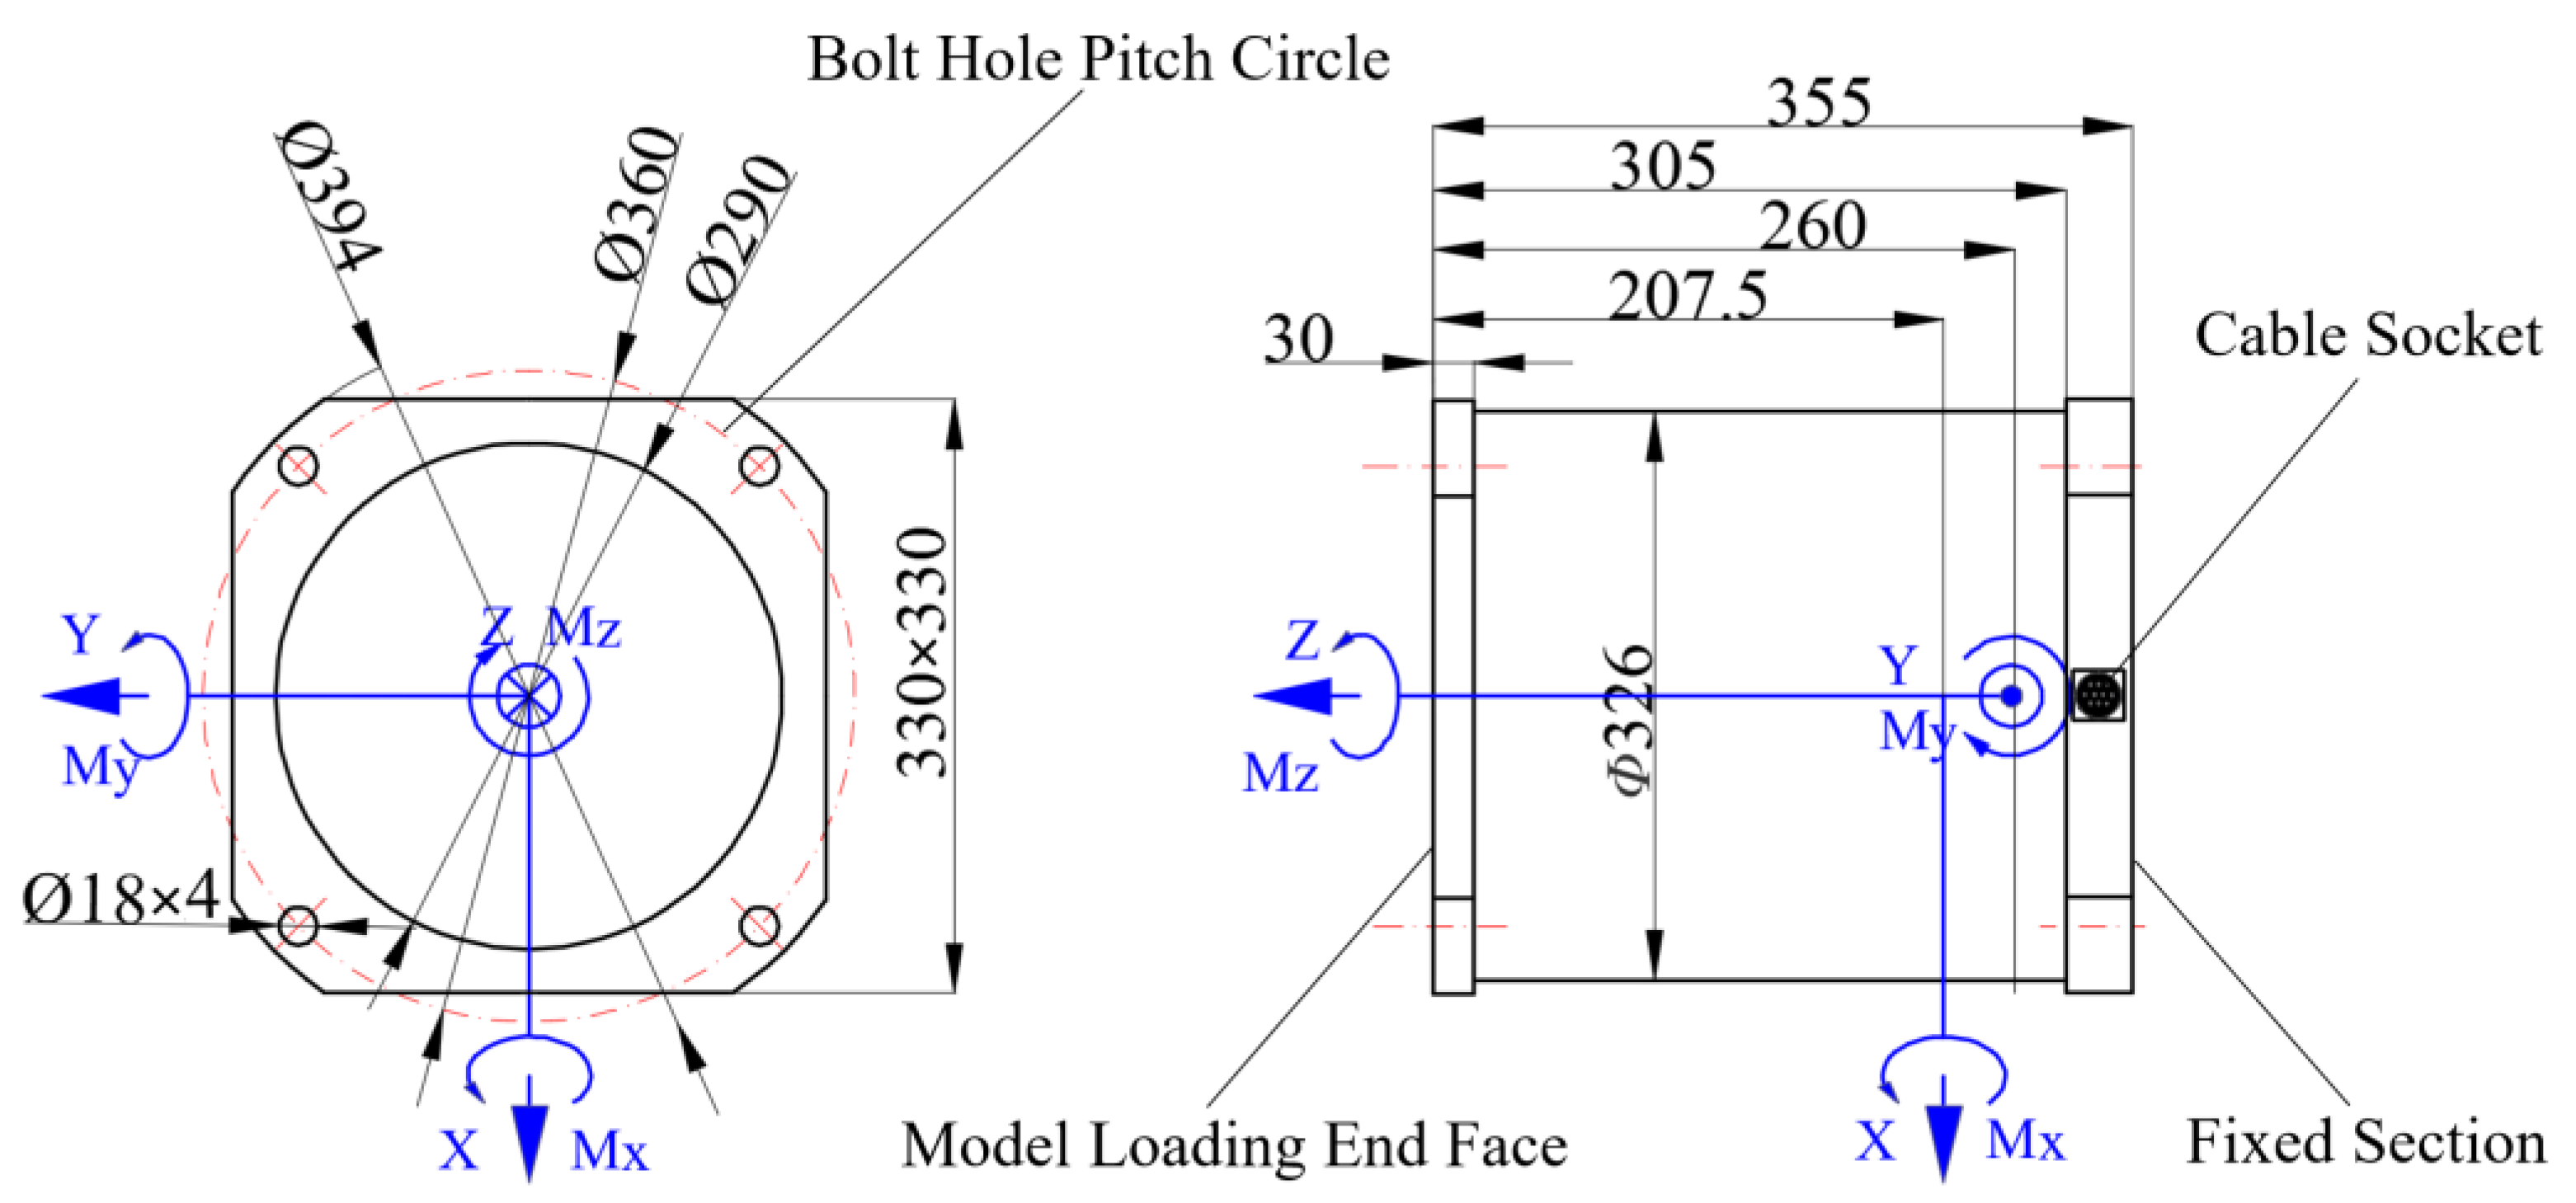
Multi-axis force sensor calibration depends on design considerations and data processing and is flexible and adaptable. Using a six-axis force sensor as an example, forces and moments are applied individually along the three Cartesian axes, resulting in six loading conditions. The installation dimensions and coordinate system of the sensor are illustrated in Figure 3. The measurement ranges are as follows: longitudinal force Fx, ±1400 N; lateral force Fy, ±4900 N; vertical force Fz, ±4900 N; roll moment Mx, ±1000 N·m; pitch moment My, ±3200 N·m; and yaw moment Mz, ±5000 N·m.
The loading states and corresponding operational procedures are as follows:
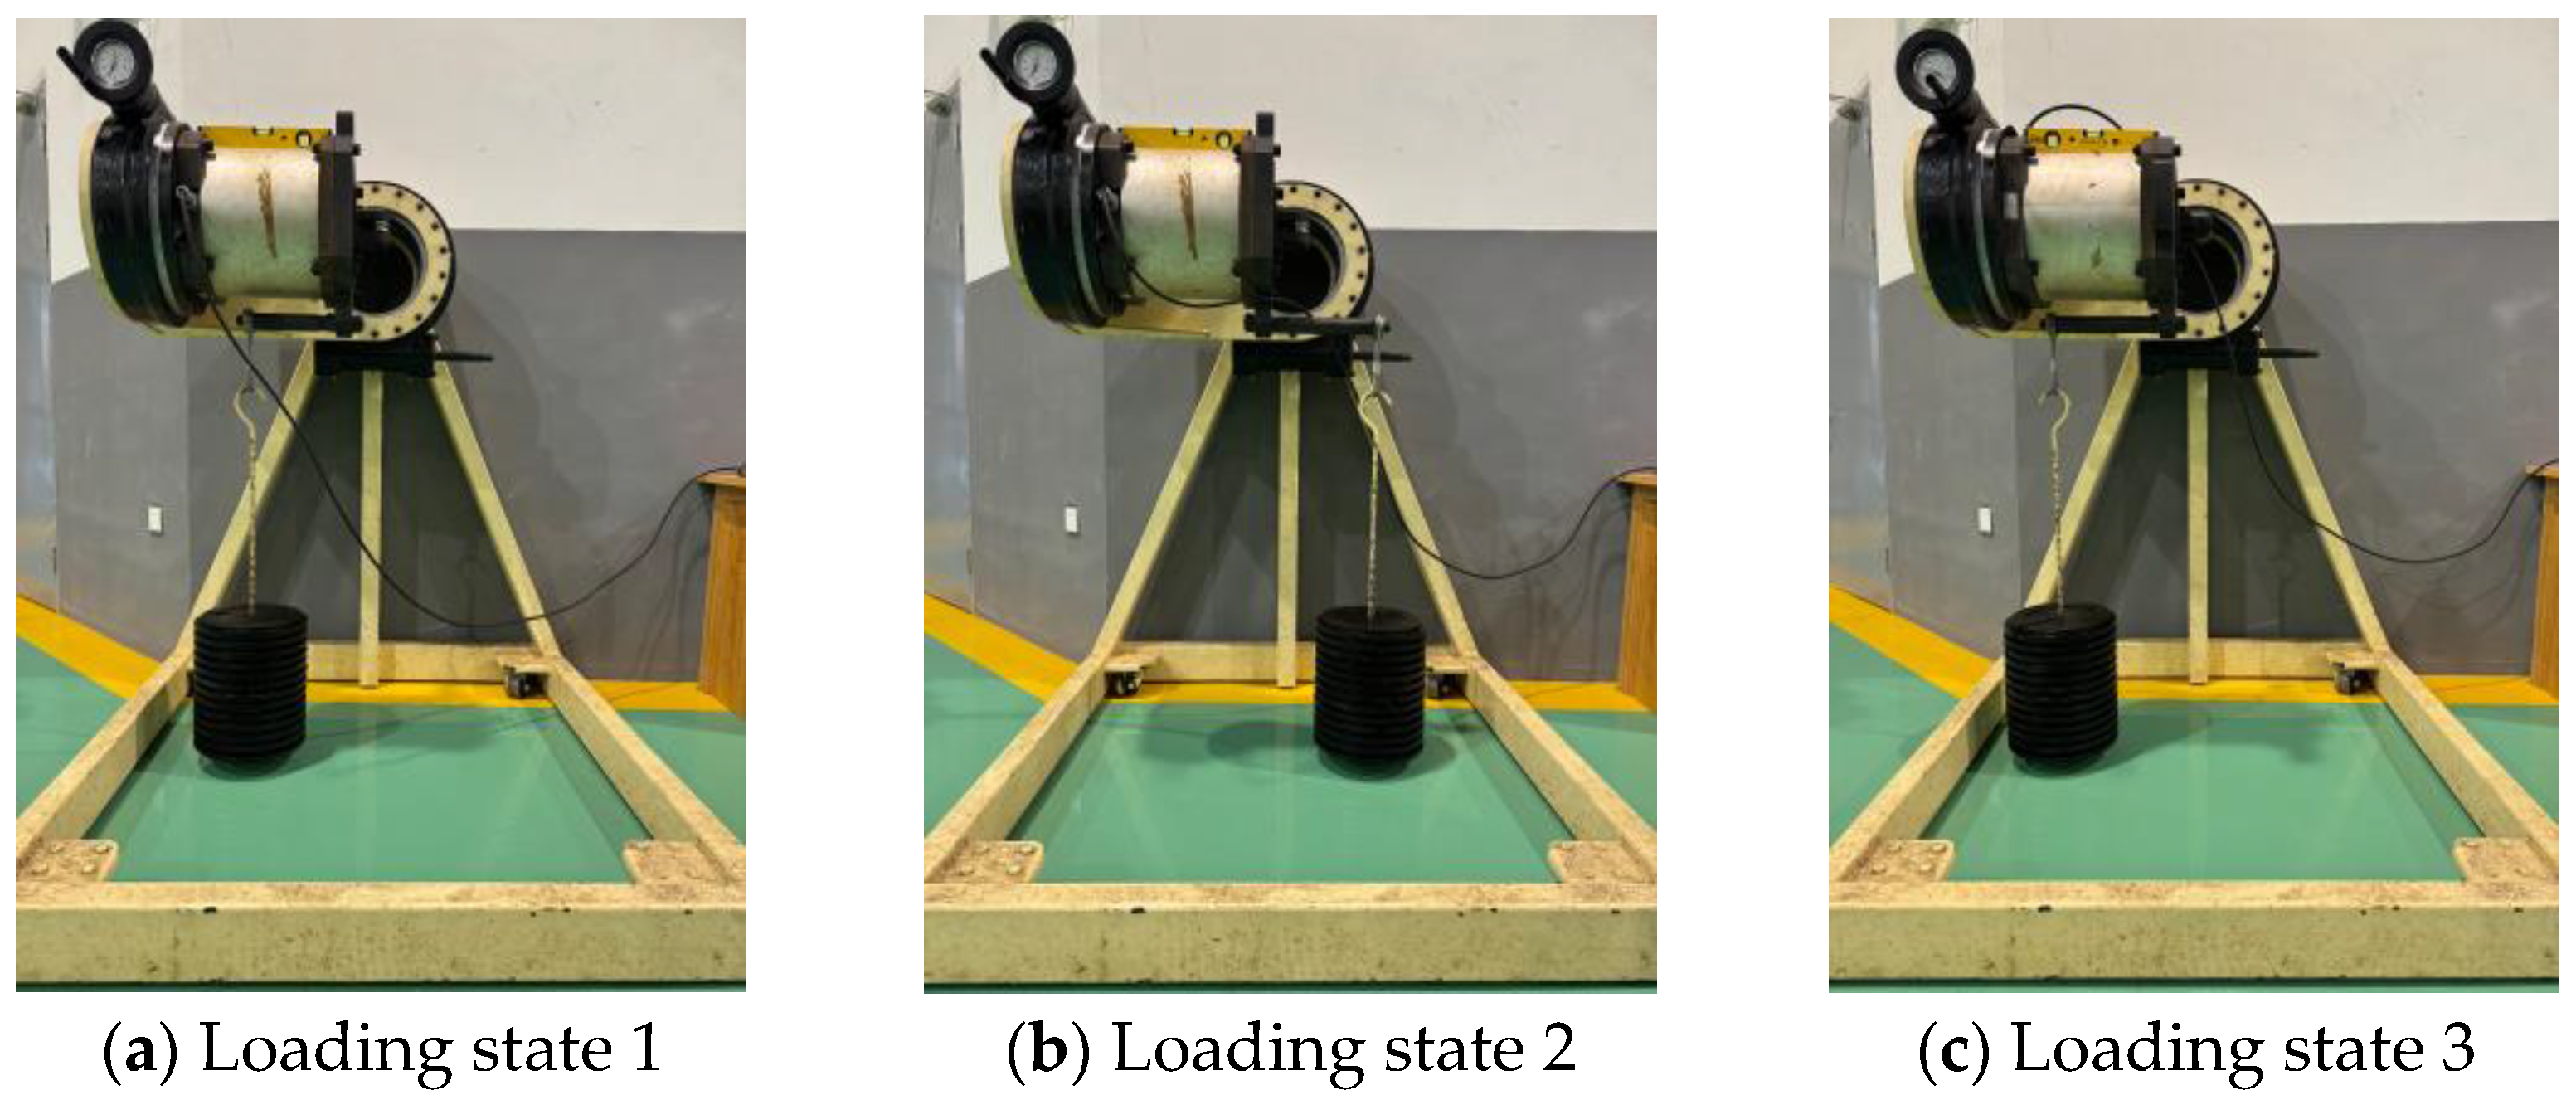
State 1: The sensor’s z-axis is oriented horizontally to the right, the y-axis is horizontal with the socket facing outward, and the x-axis points vertically upward. The short loading rod is mounted on the inner side of the loading plate, as shown in Figure 4a. The force application axis coincides with the x-axis, intersects the z-axis, and has a vertical distance of l1 = 0.0525 m from the y-axis.
State 2: The long loading rod is installed on the outer side of the loading plate, as shown in Figure 4b. The vertical distance between the force application axis and the y-axis is l2 = 0.56 m.
State 3: The sensor is adjusted so that the socket faces upward, and the long loading rod is mounted on the inner side of the loading plate, as illustrated in Figure 4c. The force application axis coincides with the y-axis, intersects the z-axis, and has a vertical distance of l3 = 0.0525 m from the x-axis.
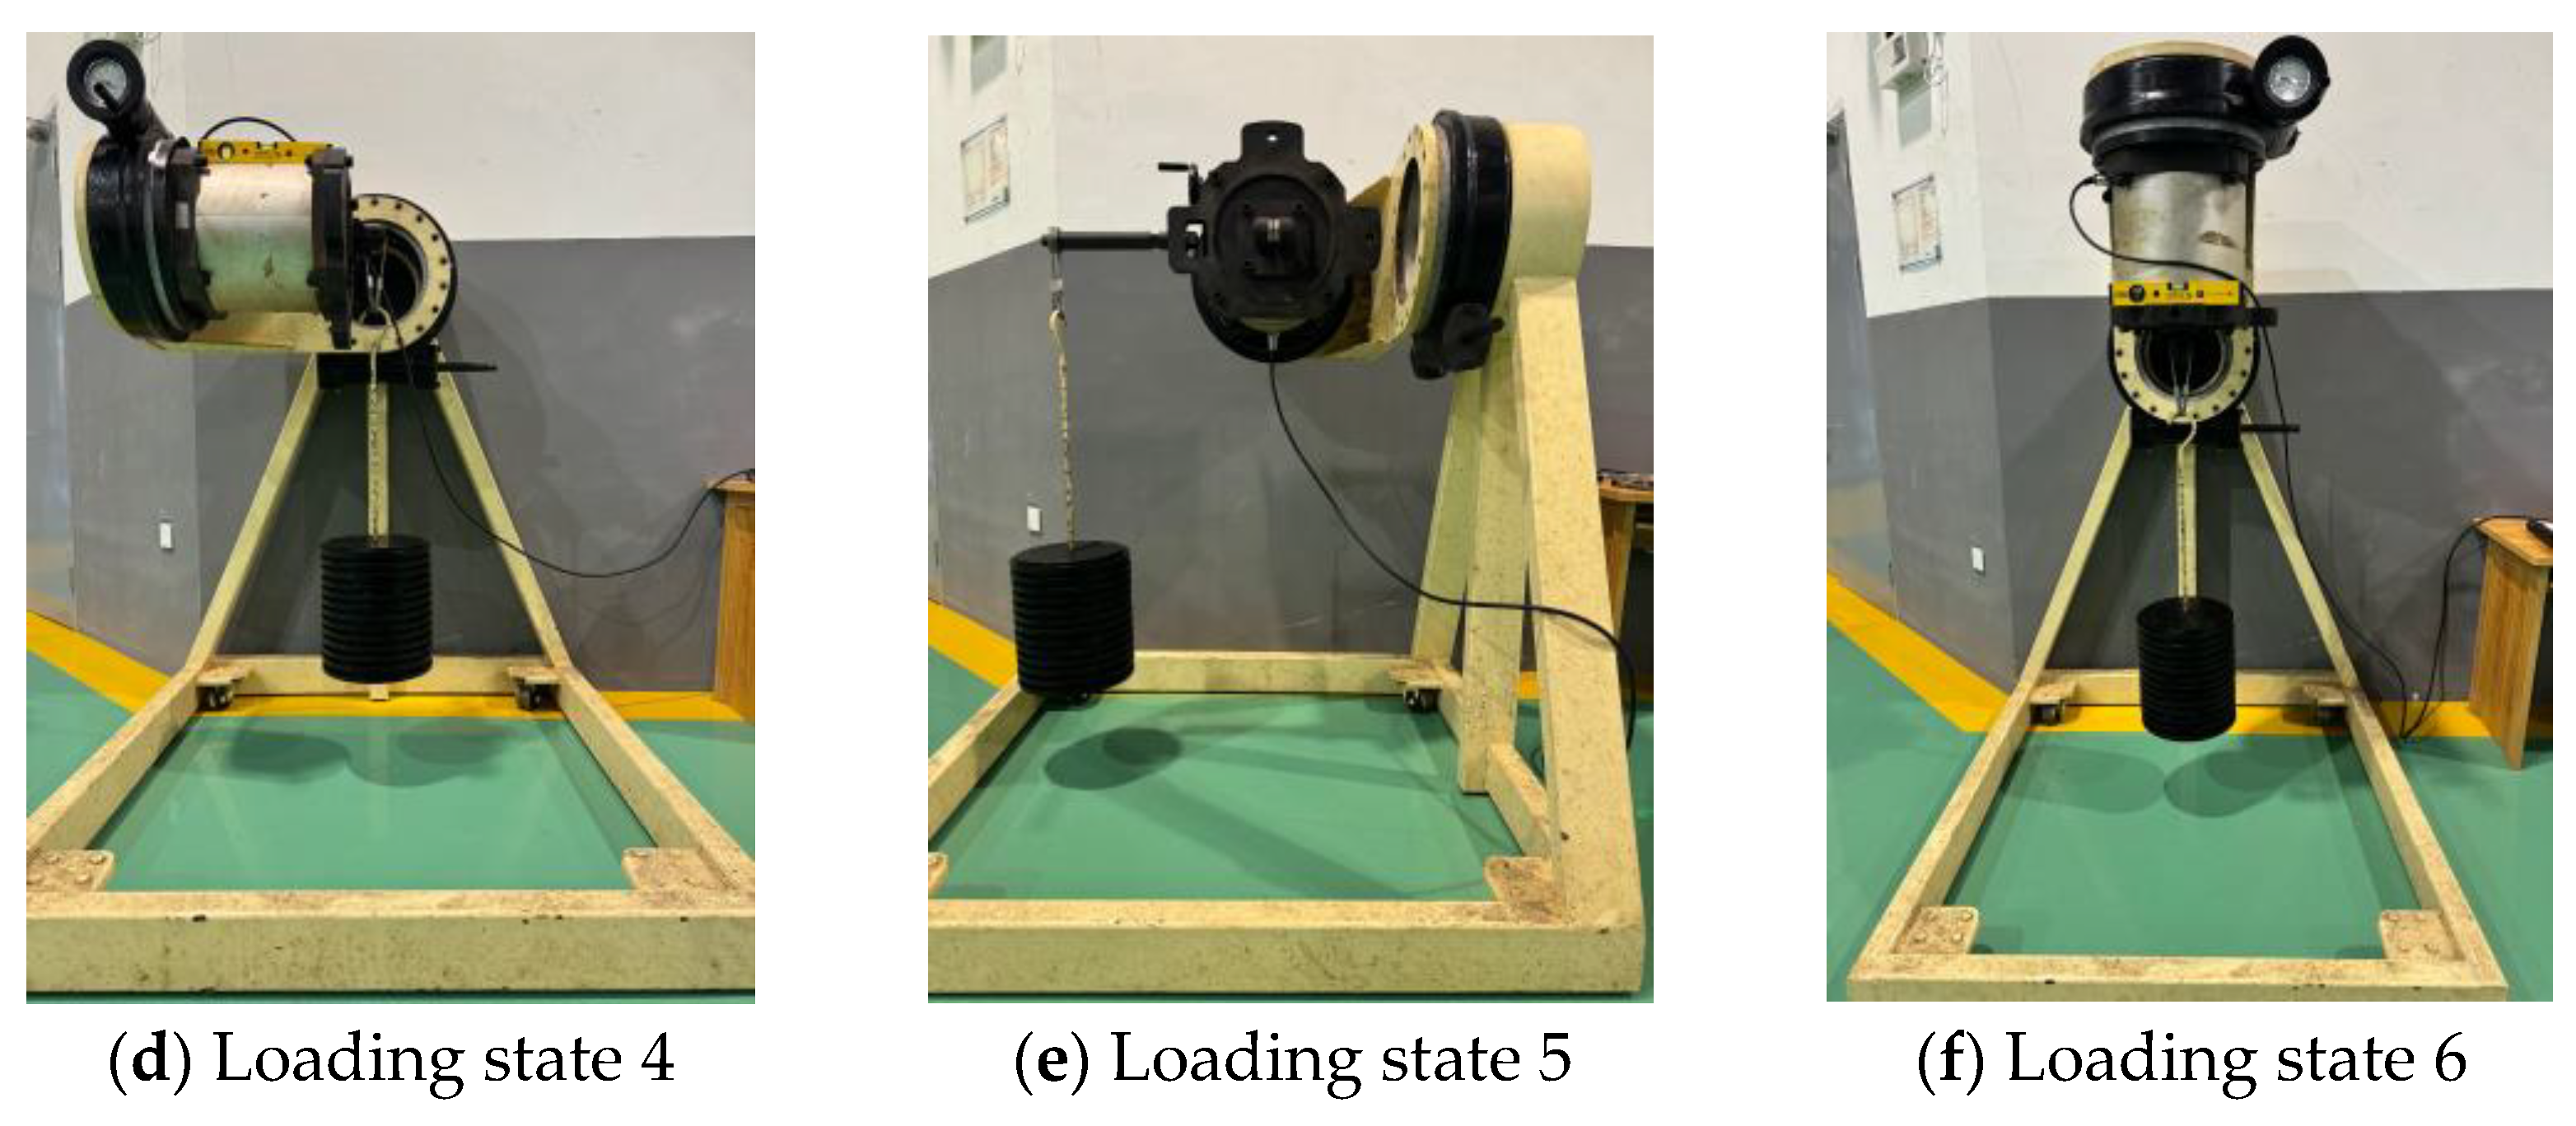
State 4: Weights are suspended directly under the pulley, as depicted in Figure 4d. The force application axis is parallel to the y-axis, intersects the z-axis, and has a vertical distance of l4 = 0.3075 m from the x-axis.
State 5: The sensor is adjusted so that the socket faces downward, and the long loading rod is mounted on the front side of the loading plate, as shown in Figure 4e. The force application axis is parallel to the y-axis, with a vertical distance of l5 = 0.2275 m from the x-axis and l6 = 0.5 m from the z-axis.
State 6: The rotary mechanism is rotated so that the z-axis points vertically downward, as illustrated in Figure 4f. The force application axis coincides with the z-axis.
Each loading state was calibrated by incrementally adding and removing weights, starting from 0 kg, increasing to the maximum load, and then returning to 0 kg. The maximum load for each state was determined according to the sensor’s load-bearing capacity in each direction. The six force components measured by the sensor under various loading states are presented in Table 1, where W denotes the mass of the weights and g = 9.8 m/s2.

3. Results

3.1. Data Processing

Calibration is performed by applying known forces and moments, measuring the corresponding output voltages from the sensor, and establishing a linear relationship between the output voltage and the applied forces or moments. This relationship is expressed as follows:
V = C   F
Here, V denotes the sensor output voltages (VFx, VFy, VFz, VMx, VMy, VMz); F represents the applied loads (the six force and moment components: Fx, Fy, Fz, Mx, My, Mz); and C is the calibration coefficient matrix of the sensor (a 6 × 6 matrix).
Each loading state comprises 15 loading points, resulting in a total of 90 loading points. Thus, 90 corresponding load-voltage data sets are collected for calibration. According to Equation (1), the matrix relationship between voltage and force/moment for loading points 1 through 90 is given by:
V F x 1 V F y 1 V F z 1 V M x 1 V M y 1 V M z 1 V F x 2 V F y 2 V F z 2 V M x 2 V M y 2 V M z 2 V F x 90 V F y 90 V F z 90 V M x 90 V M y 90 V M z 90 = C 11 C 21 C 31 C 41 C 51 C 61 C 12 C 22 C 32 C 42 C 52 C 62 C 13 C 23 C 33 C 43 C 53 C 63 C 14 C 24 C 34 C 44 C 54 C 64 C 15 C 25 C 35 C 45 C 55 C 65 C 16 C 26 C 36 C 46 C 56 C 66 F x 1 F y 1 F z 1 M x 1 M y 1 M z 1 F x 2 F y 2 F z 2 M x 2 M y 2 M z 2 F x 90 F y 90 F z 90 M x 90 M y 90 M z 90
Here, VFxi, VFyi, VFzi, VMxi, VMyi, and VMzi denote the sensor output voltages at the i-th loading point; Fxi, Fyi, Fzi, Mxi, Myi, and Mzi represent the loads applied to the sensor at the i-th loading point; and Cij indicates the relationship between the i-th voltage output and the j-th force or moment component.
To determine the coefficient matrix C, the least squares method is utilized for optimization. When experimental data contain errors, such as noise in the measured voltages, the least squares method yields the optimal C by minimizing the discrepancy between the experimental data and the theoretical model. The calculation formula is as follows:
C =   V F T ( F F T ) 1
Here, FT denotes the transpose of matrix F, and (F·FT)−1 represents the inverse of the matrix F·FT, which serves to eliminate redundant information. Thus, the coefficient matrix obtained through calibration is:
C   =   0.00221 0.00000 0.00000 0.00013 0.00000 0.00000 0.00000 0.00081 0.00000 0.00000 0.00000 0.00000 0.00010 0.00000 0.00094 0.00000 0.00000 0.00000 0.00000 0.00000 0.00013 0.00481 0.00000 0.00000 0.00060 0.00000 0.00000 0.00015 0.00072 0.00000 0.00010 0.00000 0.00000 0.00010 0.00000 0.00072

3.2. Coefficient Matrix Verification

Upon completion of calibration, the sensor can accurately determine the magnitudes of forces and moments under any operating condition using the calibrated coefficient matrix and the output voltages. Based on the coefficient matrix and output voltages, the calculation formulas for the sensor’s six force and moment components are as follows:
F = C   1 V
Here, C−1 denotes the inverse of the coefficient matrix C. Once C−1 has been determined, expanding Equation (5) yields the calculation formulas for the sensor’s six force and moment components as follows:
Fx   =   448.5 V F x + 1.7 V F y 39.1 V F z + 0.4 V M x + 377.2 V M y 41.6 V M z F y   =   4.1 V F x + 1298.7 V F y + 2.9 V F z 3.5 V M x 14.1 V M y 24.8 V M z F z   =   0.1 V F x + 6.5 V F y + 1054.6 V F z + 15.8 V M x + 1.3 V M y 33.7 V M z M x   =   9.3 V F x 4 V F y + 4.7 V F z + 206.8 V M x + 38.9 V M y 41.3 V M z M y   = 2.7 V F x + 13 V F y 4.7 V F z + 0.9 V M x + 1330.9 V M y 14.1 V M z M z   =   3.7 V F x 3.8 V F y + 10 V F z + 1.5 V M x + 18.7 V M y + 1412.7 V M z
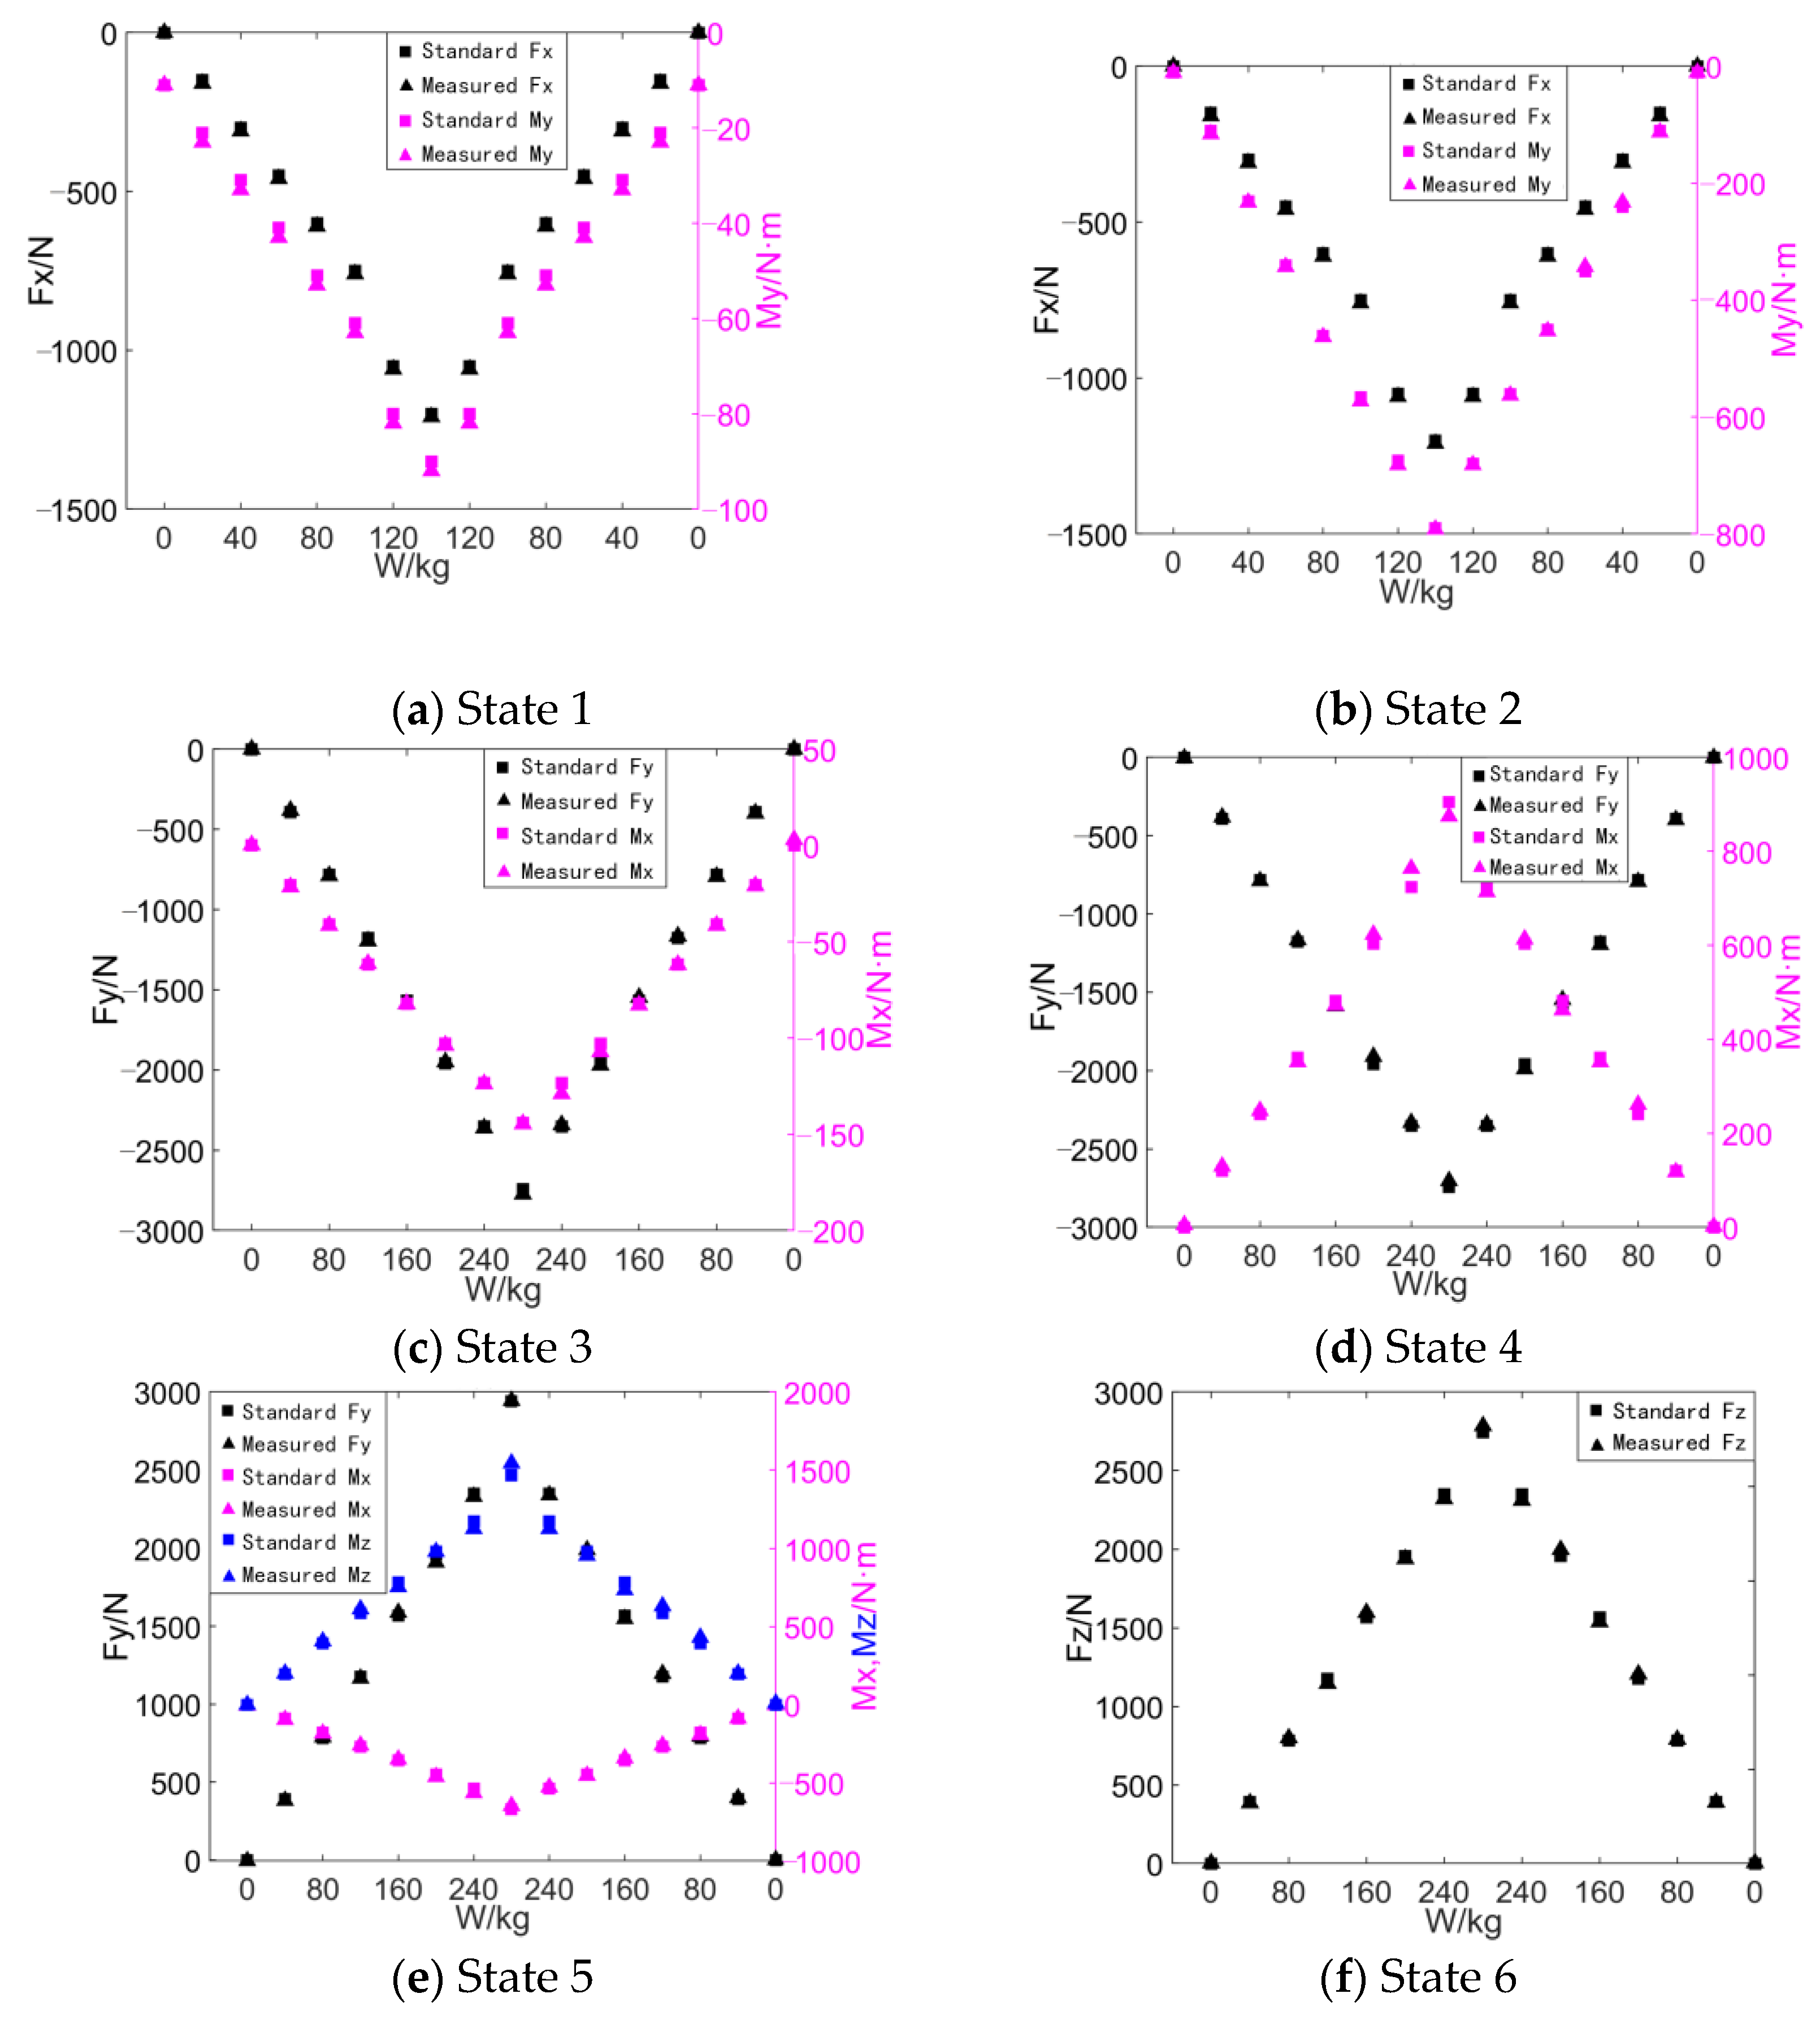
The calculation process described above has been incorporated into the sensor calibration system testing software. Following calibration, weights are re-applied under the specified conditions for loading states 1 through 6 using the same loading and unloading procedures. The forces and torques measured by the sensor are then compared with the standard loads, and the resulting errors are analyzed to verify the accuracy of the calibration coefficients. The verification results for the six loading states are shown in Figure 5.
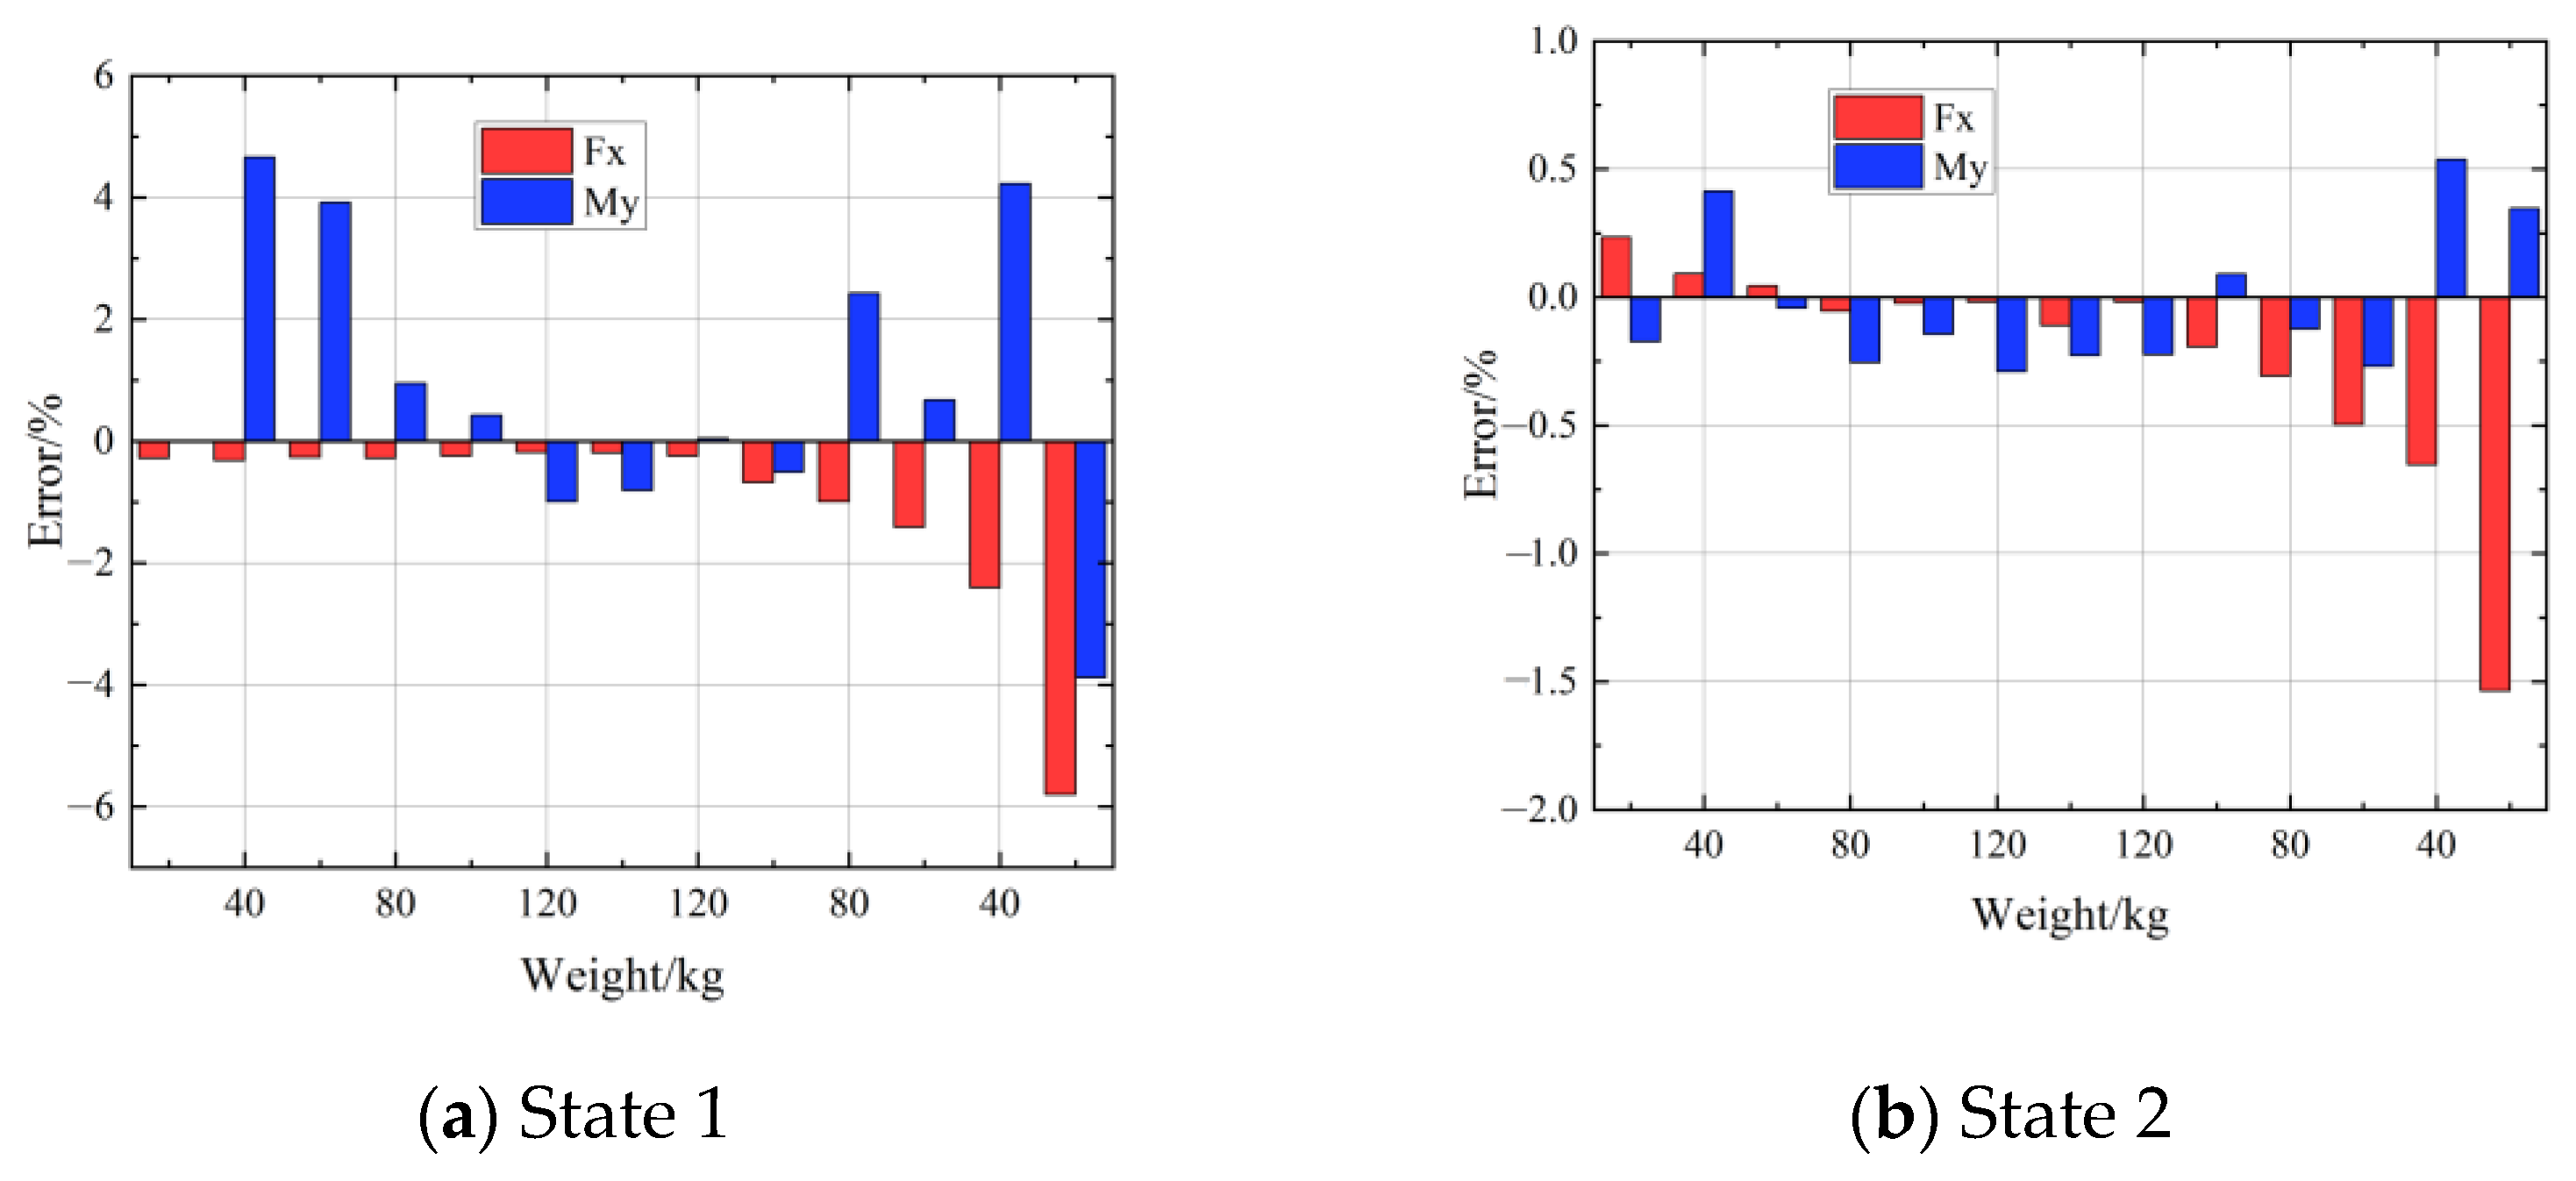
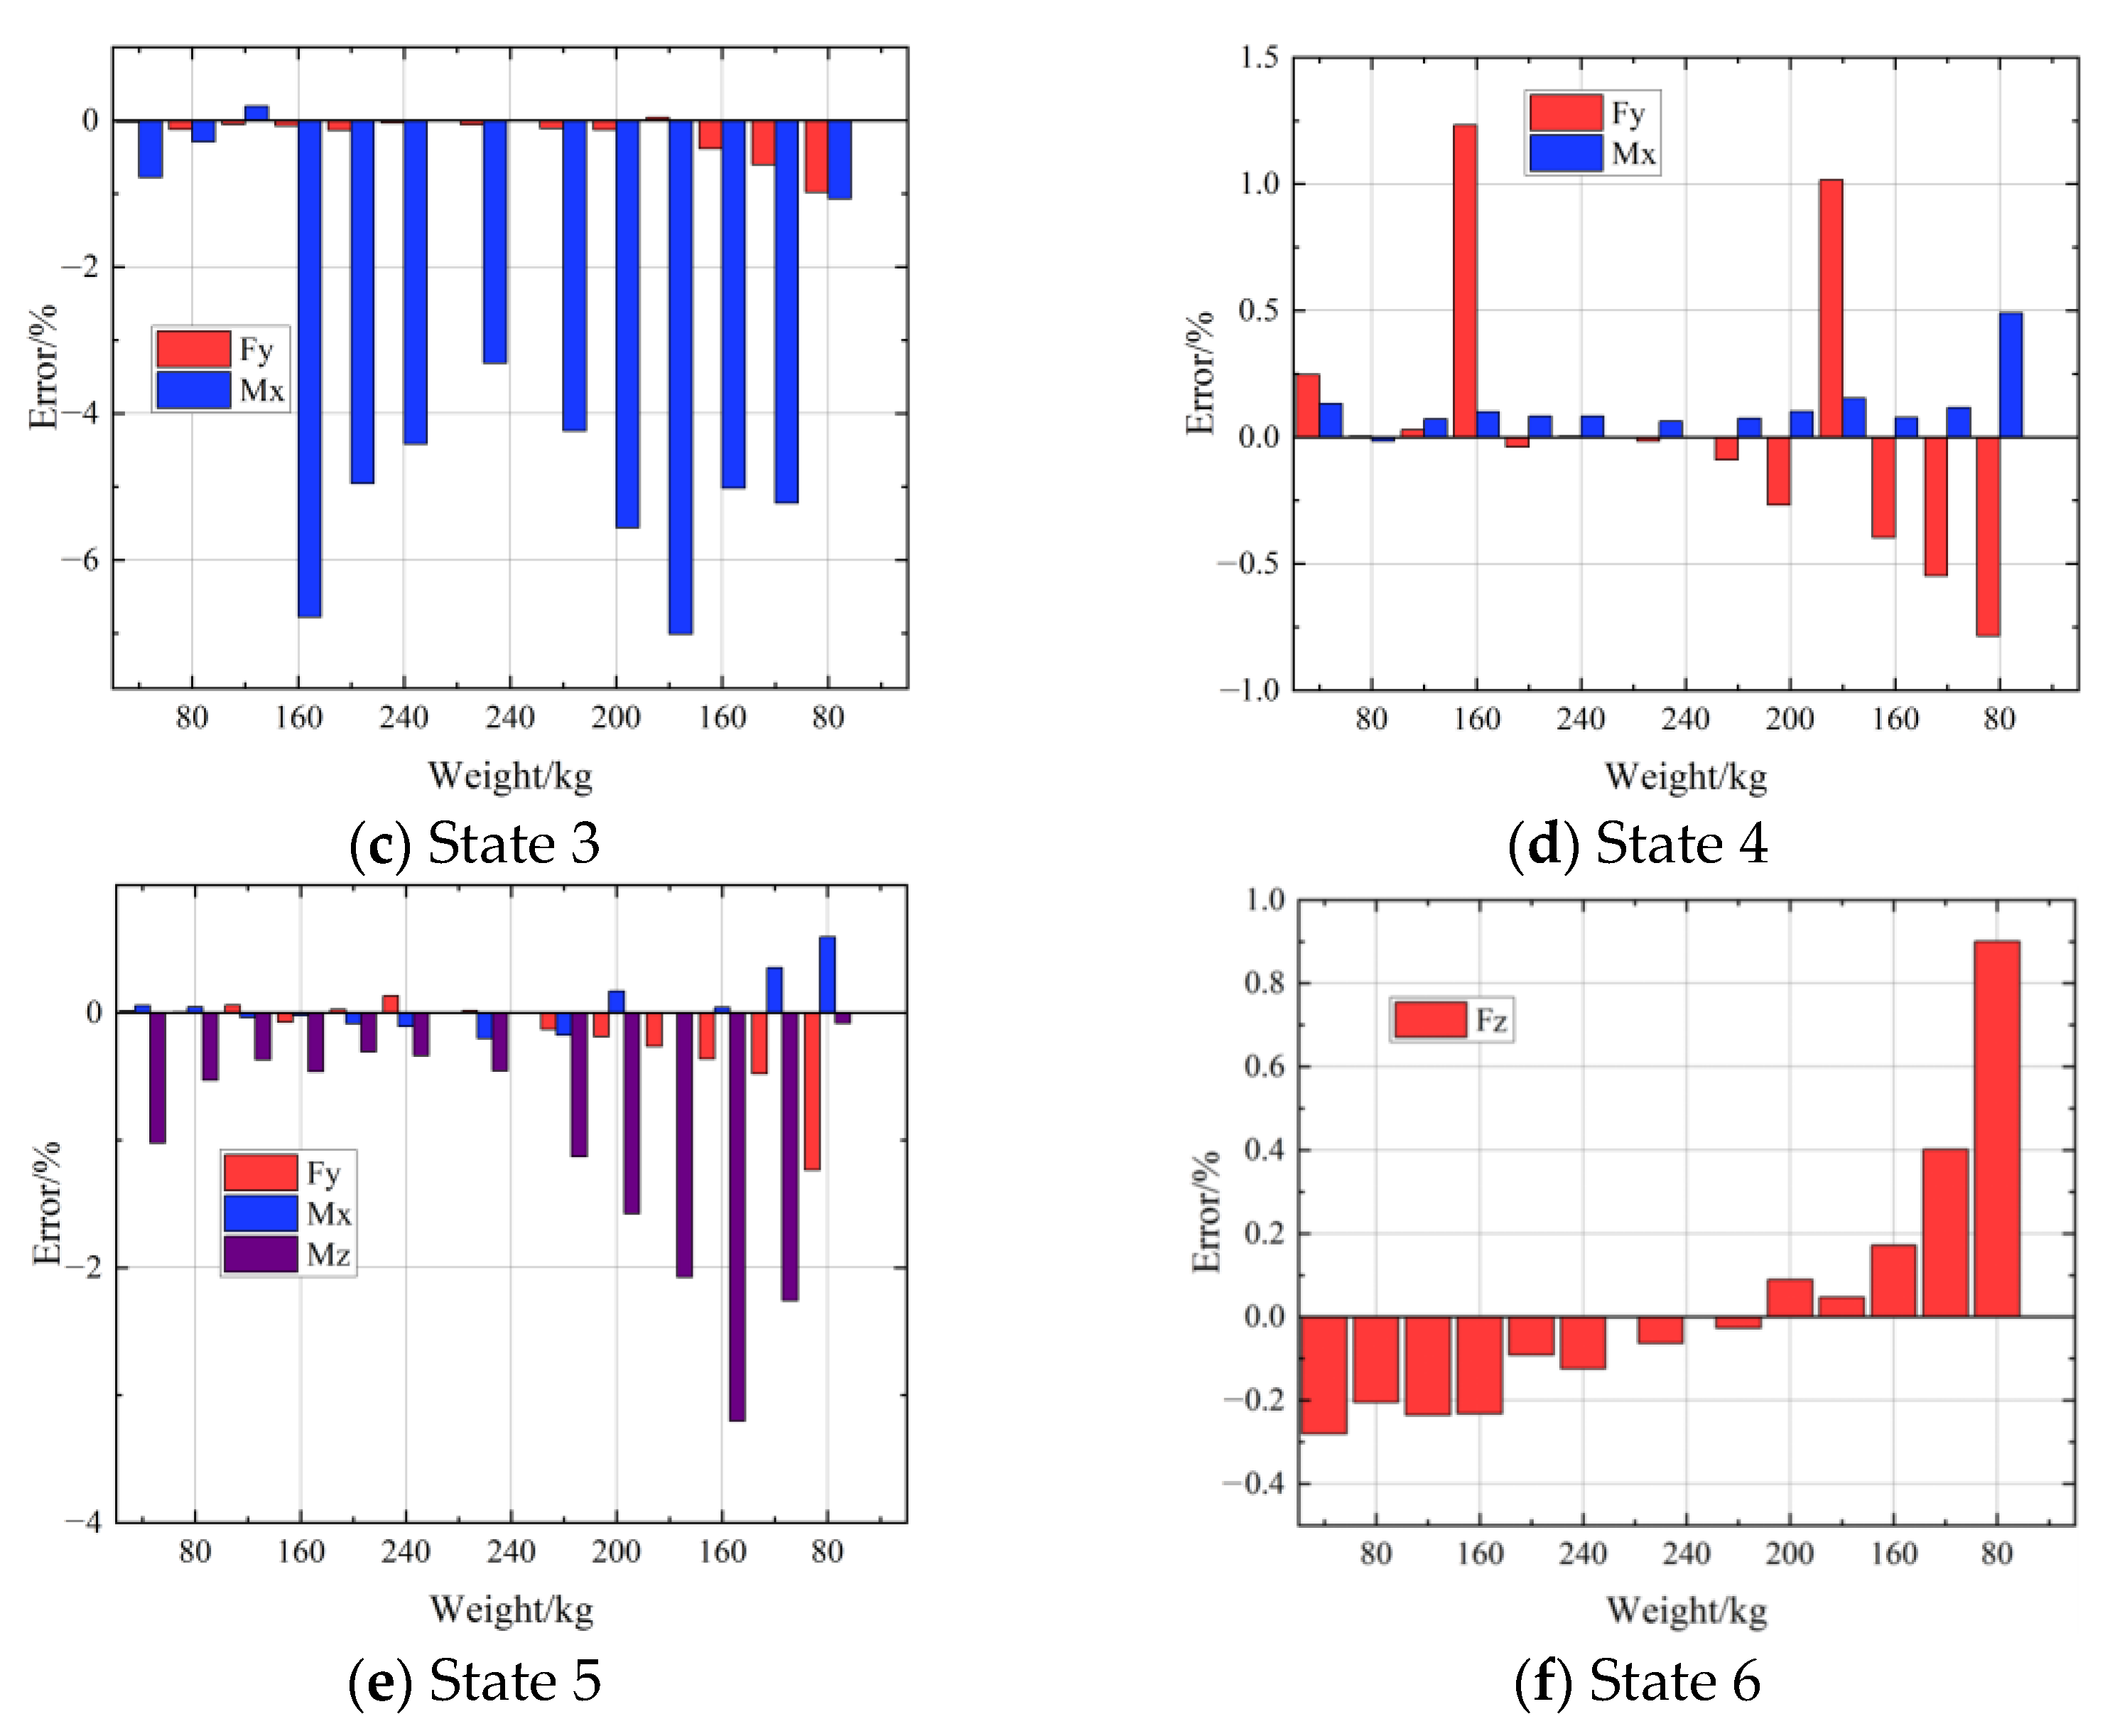
As illustrated in Figure 5, the forces and torques measured by the sensor closely match the standard loads, demonstrating the reliability of the coefficient matrix. Figure 6 shows that approximately 82.2% of the calibration points have percentage errors within 1%. The median error is 0.7%, and the 5th and 95th percentiles are 0.17% and 4.55%, respectively. A small number of calibration points exhibit errors greater than 5%, yet the maximum error does not exceed 7%. These results demonstrate the high accuracy of the identified coefficient matrix and confirm the reliable measurement performance of the six-axis force/torque sensor. The error is calculated as the difference between the measured value and the standard load, divided by the standard load and multiplied by 100%.

4. Experimental Cases

4.1. Experimental Design

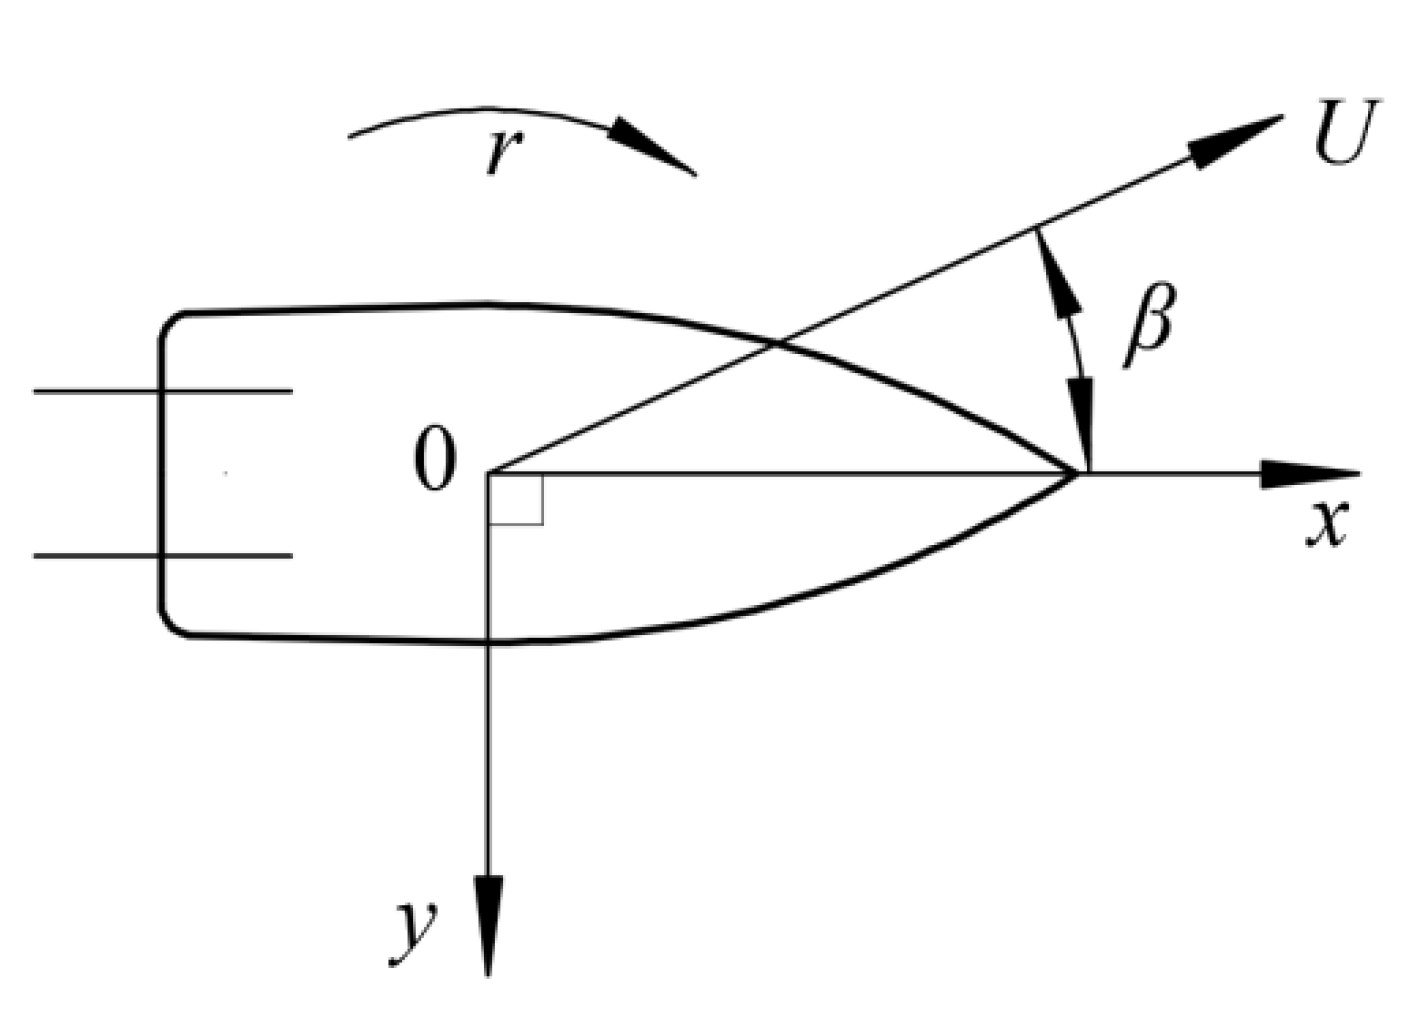
To verify the reliability of the sensor calibration, a turning arm test was conducted using a KCS standard ship model in this study. The accuracy of the measurement data can be thoroughly validated if the six-axis force sensor is applicable in actual model experiments. In research on ship maneuverability and turning arm tests, the origin of the motion coordinate system O-xyz is set at the ship’s center of gravity, with the x-axis pointing towards the bow, the y-axis towards the starboard, and the z-axis towards the bottom of the ship. The sensor is suspended beneath the towing carriage, and the model’s center of gravity is connected to the carriage through the sensor. Consequently, the directions of the forces and moments measured by the sensor are consistent with those of the ship. The positive direction of the drift angle is defined according to the right-hand screw rule, with the thumb pointing along the z-axis. The specific definitions are illustrated in Figure 7, where β denotes the drift angle, r denotes the yaw rate, and U denotes the ship’s linear velocity.
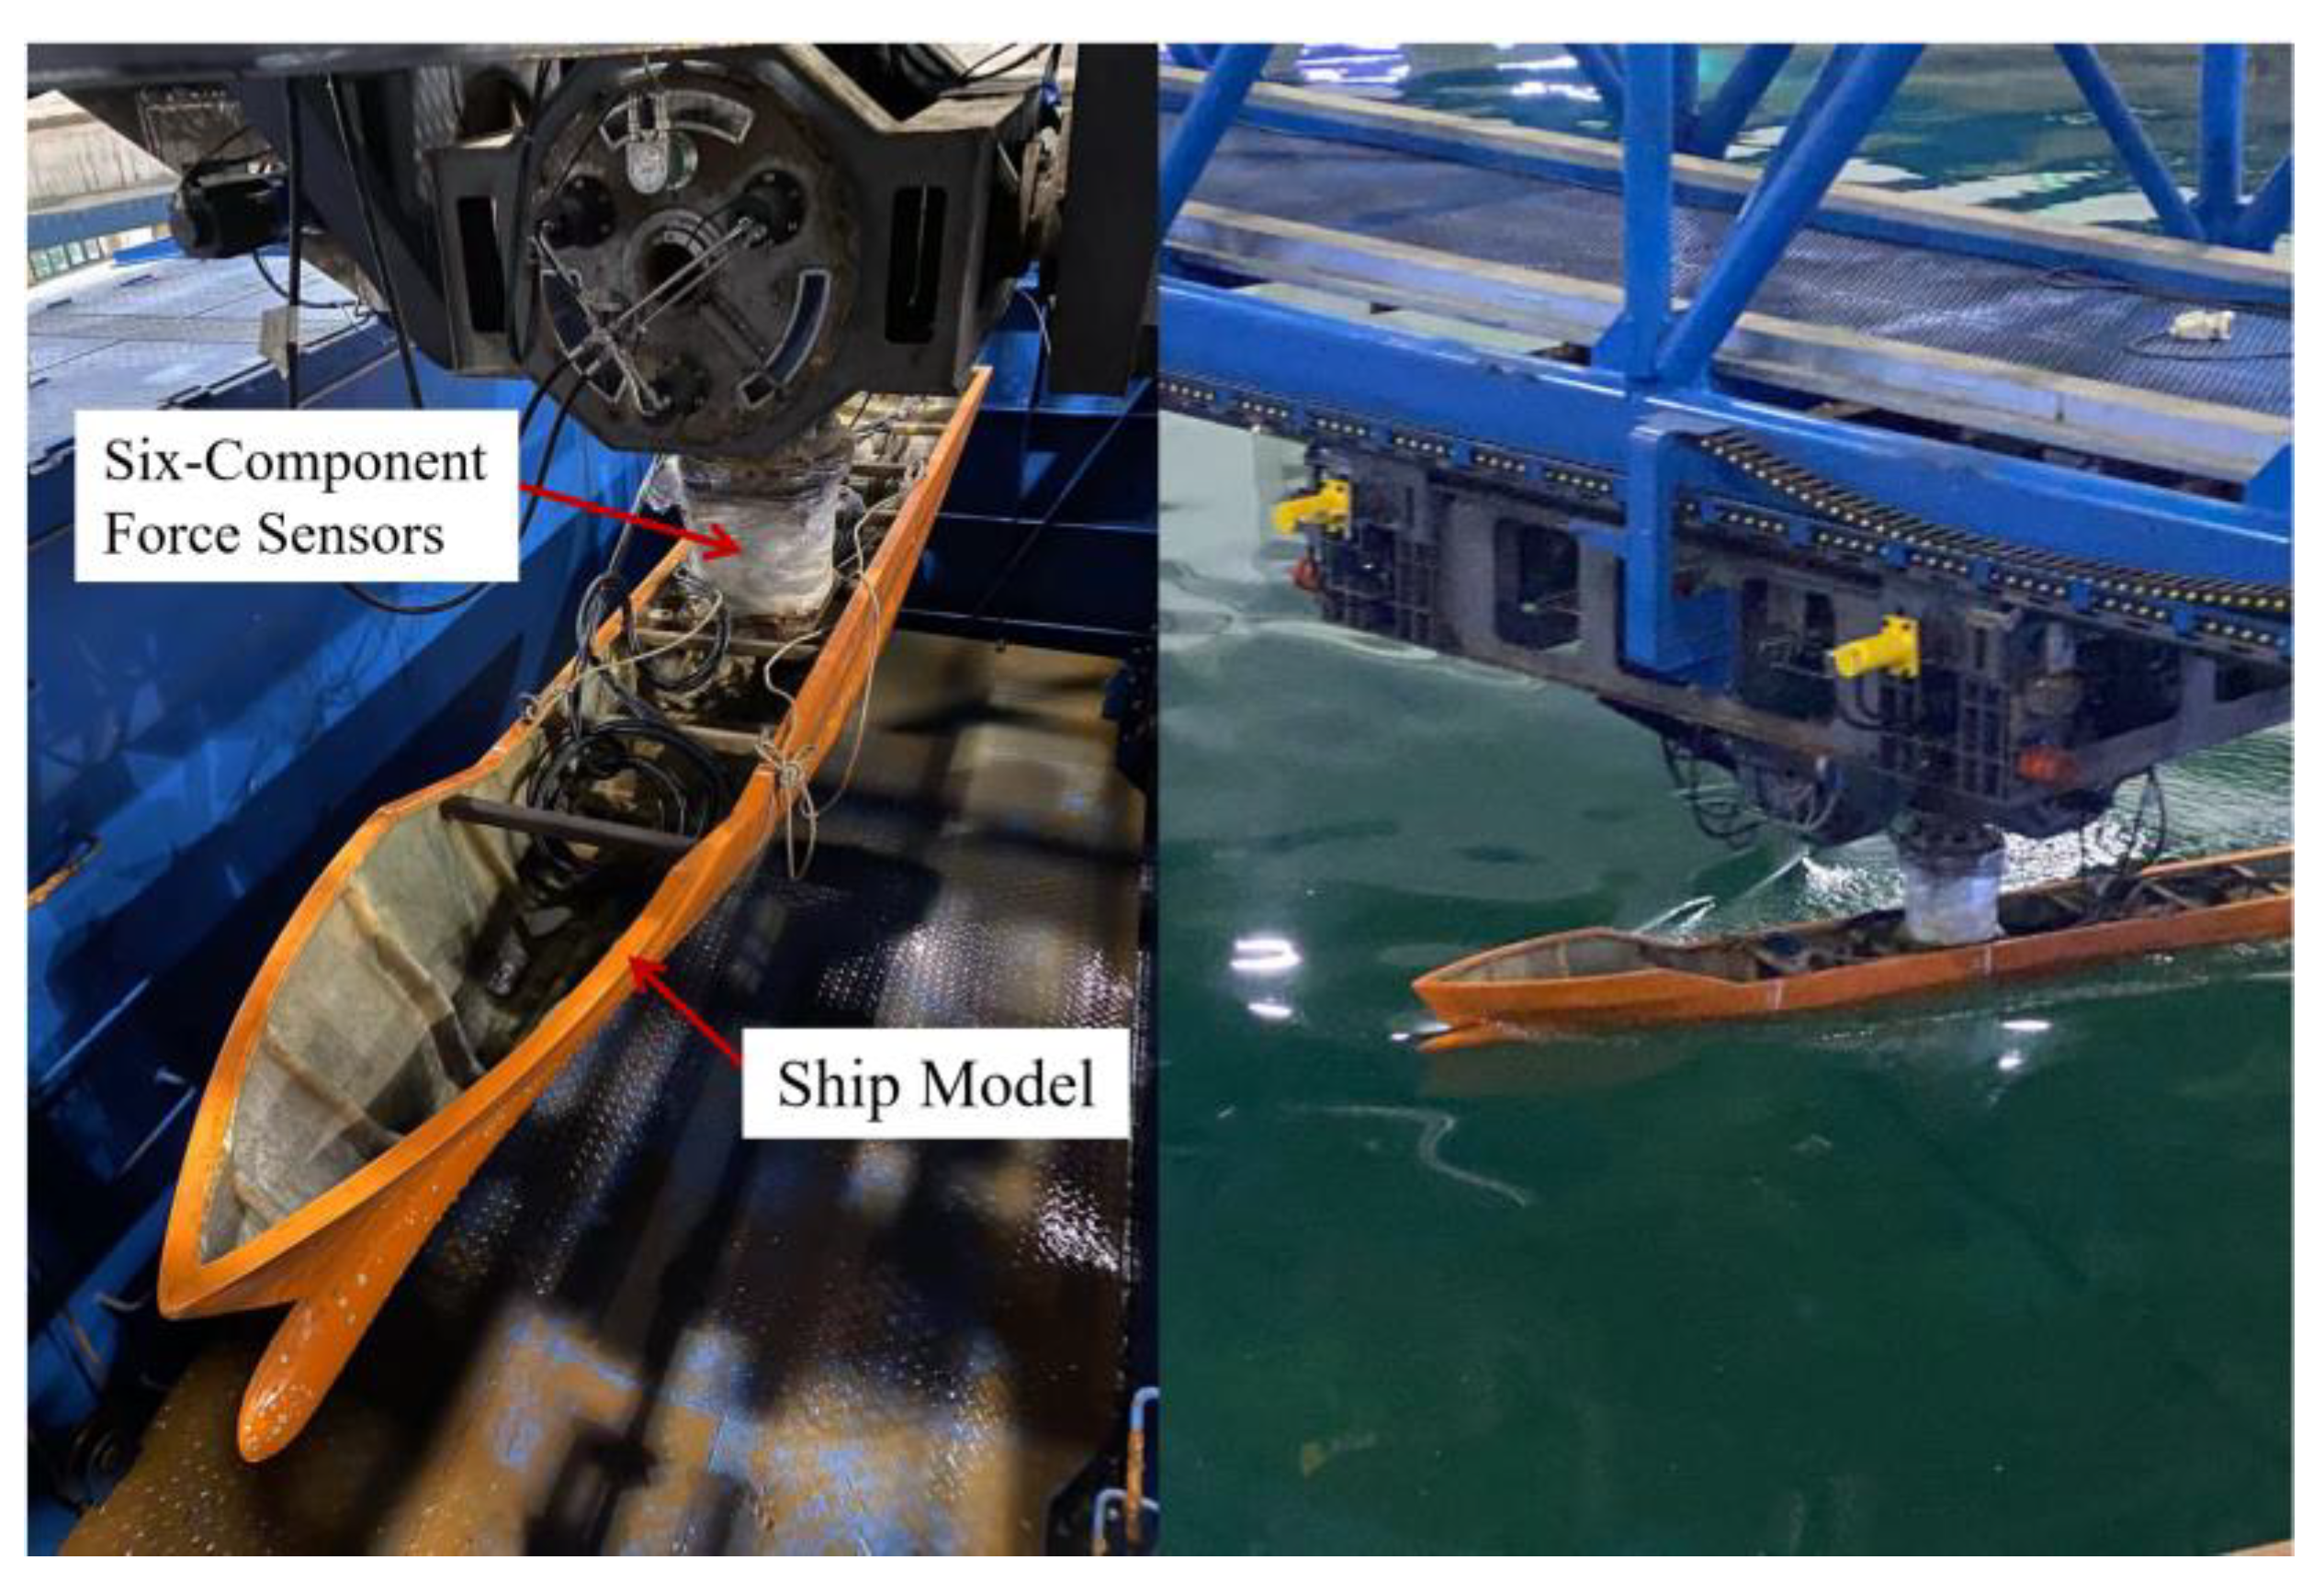
The experimental ship model is shown in Figure 8. The model has a length between perpendiculars of 3.93 m, a maximum beam of 0.55 m, a draft of 0.184 m, and is equipped with a KP505 propeller. Based on Froude number similarity (with the Froude number at the design speed, Fr = 0.26), the linear velocity U is set to 1.616 m/s. The turning radius is fixed at 8 m, resulting in an angular velocity of 0.202 rad/s. Six drift angles were selected for the test: 0°, 4°, 8°, 12°, 16°, and 20°.

4.2. Analysis of Experimental Results

Uncertainty analysis is employed to quantify experimental errors. Following the standard testing procedures recommended by the International Towing Tank Conference (ITTC) and relevant literature [27,28]. Assuming independent and identically distributed measurement noise with zero mean, and estimating its variance from the residual statistics, we invoke the Central Limit Theorem for the sample mean and then apply a probabilistic upper-bound (inequality) approach to obtain the exceedance probability expression given in Equation (7). Seven repeated tests were conducted under the condition of a drift angle of 0° to calculate the standard deviation (SDev). The accuracy limit, P(M), was subsequently determined using Equation (7).
P ( M ) = K × S D e v M
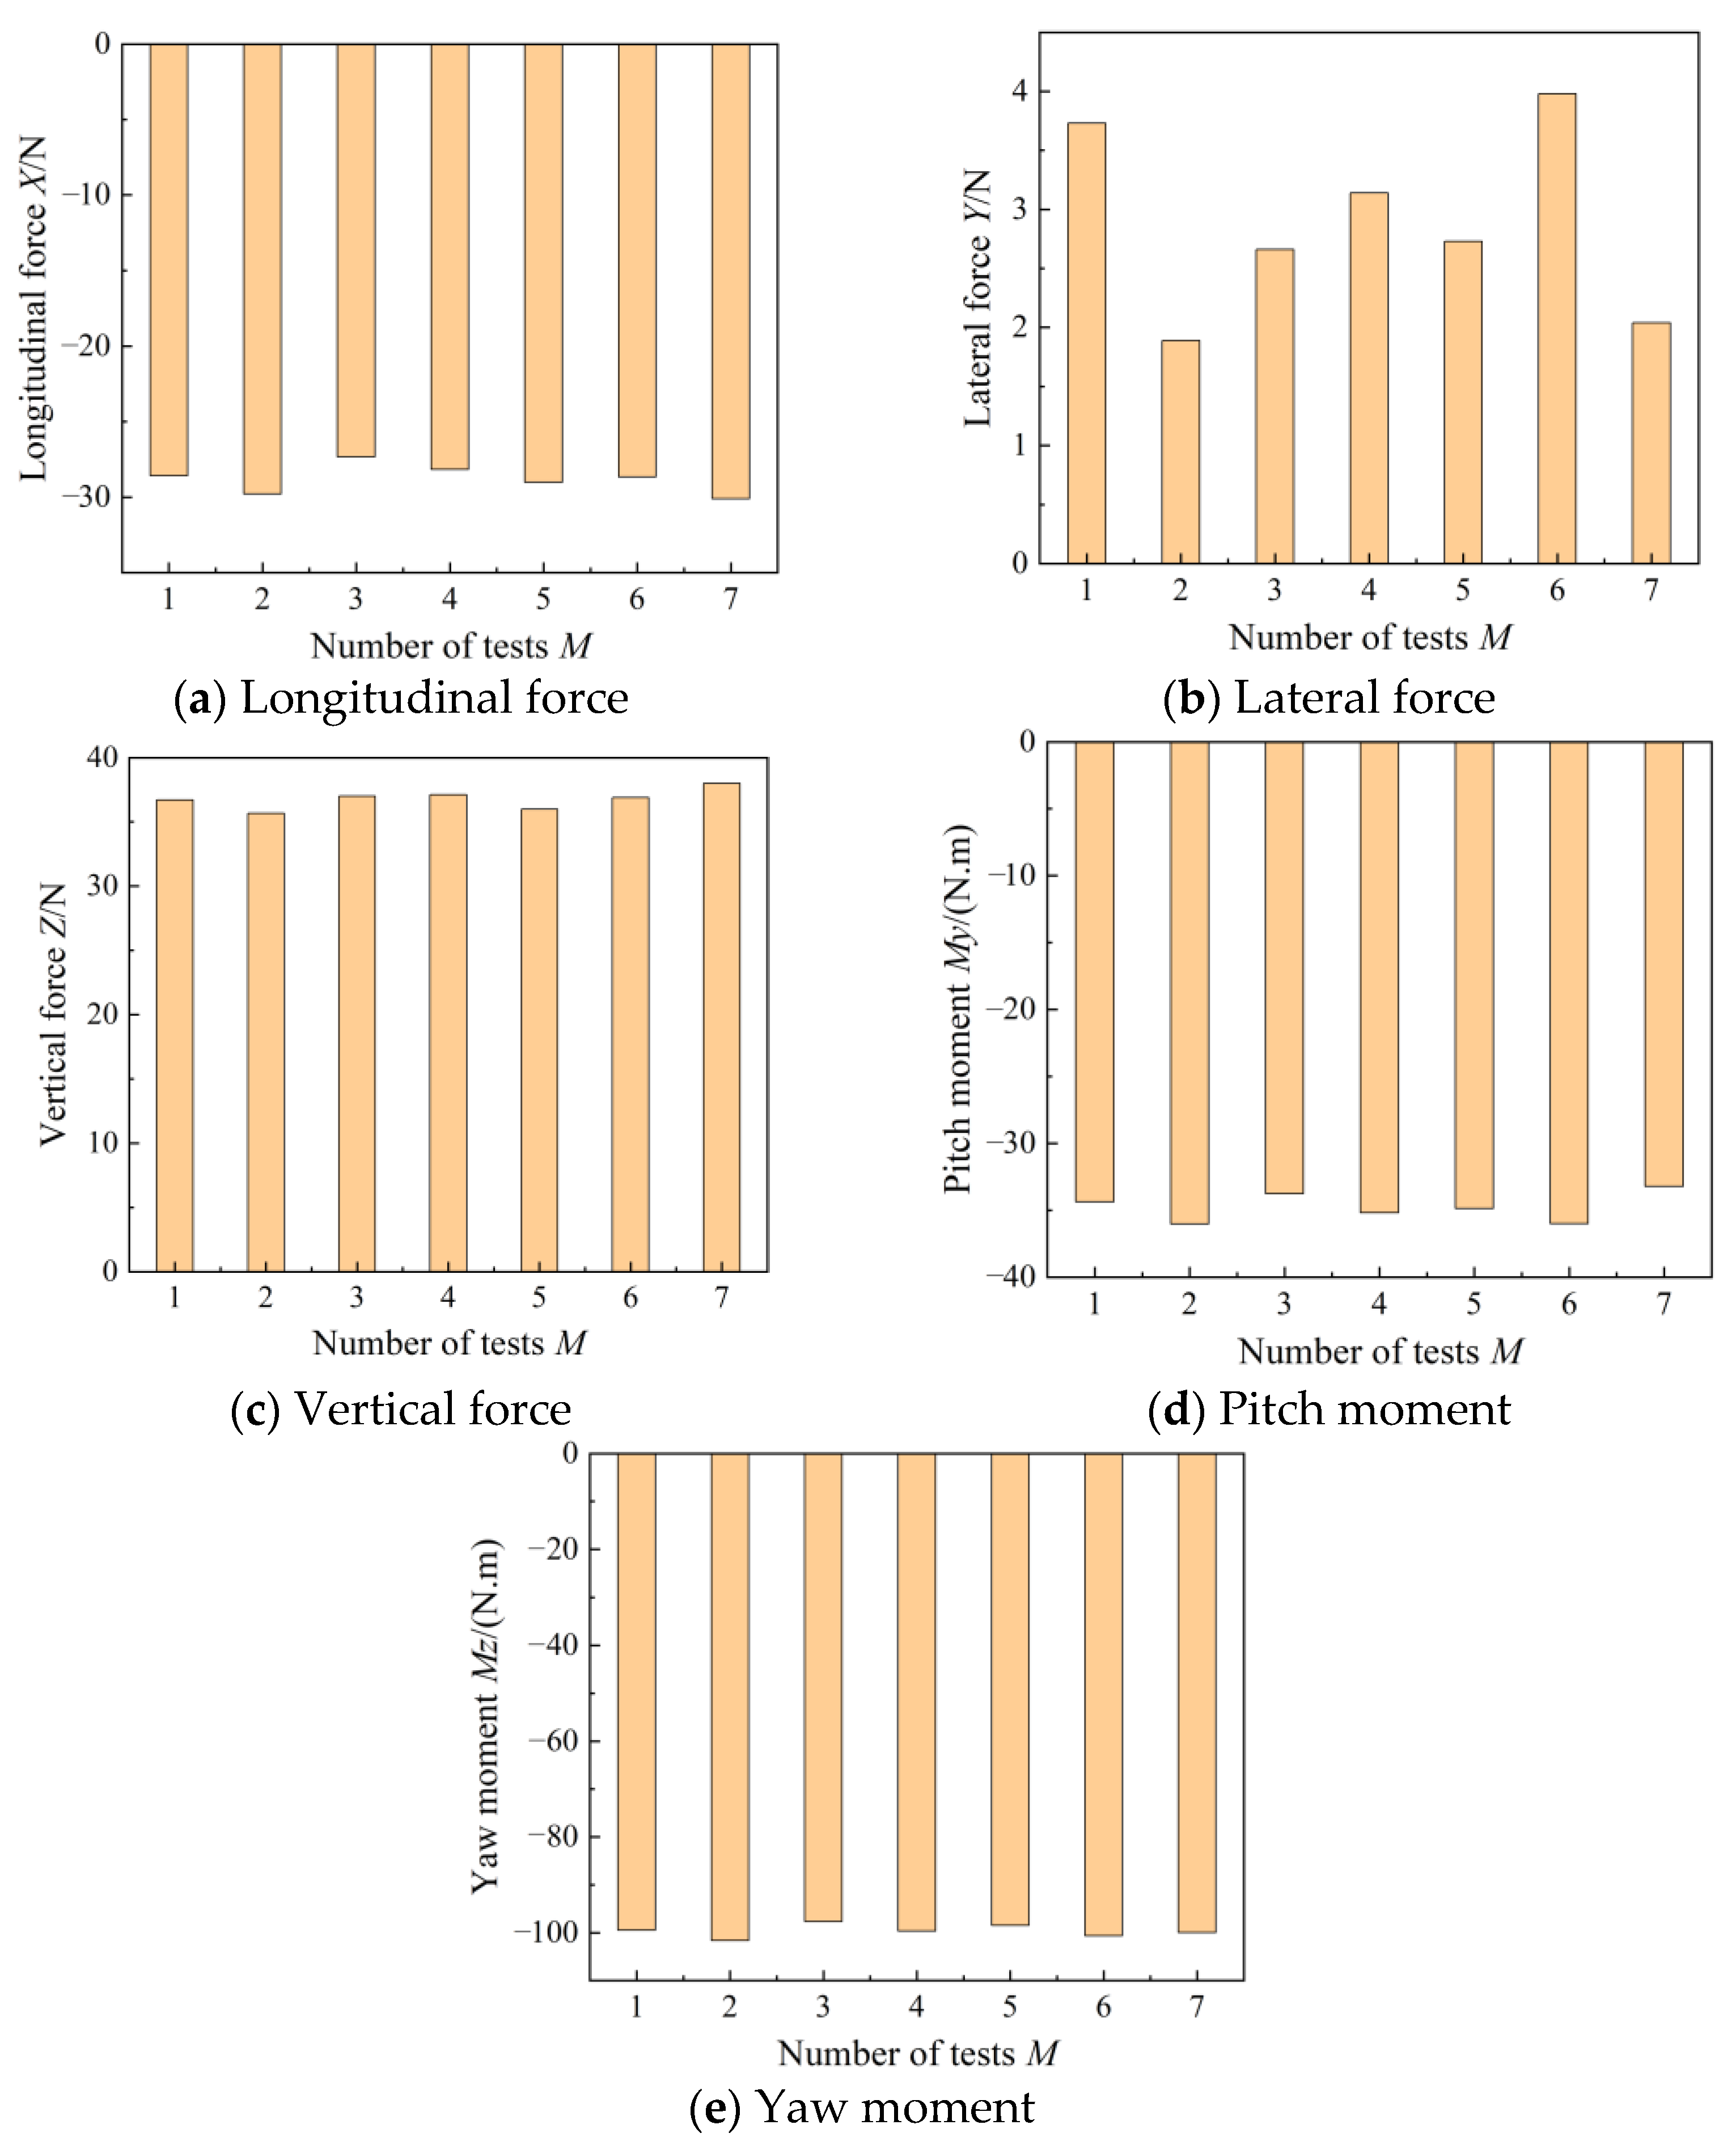
In this context, M represents the number of tests, and K is the precision coefficient, which is set to 2 in the ITTC uncertainty assessment approach. The precision limit P(M) decreases monotonically with the number of tests M; a smaller P(M) reflects greater stability (repeatability) of the measurement results. Figure 9 depicts the results of repeat tests under condition of 0° drift angle for KCS model. Table 2 summarizes the standard deviations and accuracy limits obtained from the repeated tests of the KCS ship model. All accuracy limits are less than 1, indicating that the experimental errors are small and the results exhibit good repeatability. These findings confirm the reliability of the turning arm test.
Under six different drift angles, the longitudinal force (Fx), transverse force (Fy), vertical force (Fz), roll moment (Mx), pitch moment (My), and yaw moment (Mz) of the ship model were measured. Among these, Mx was neglected due to its negligible magnitude. These forces and moments were directly measured by sensors and compared with the SIMMAN test results [29,30] (SIMMAN is the international Workshop on Verification and Validation of Ship Manoeuvring Simulation Methods, which provides publicly available standard hull geometries, experimental datasets, and reference hydrodynamic data, including the KCS), as shown in Figure 10. As illustrated in Figure 8, the experimental data are in close agreement with the SIMMAN results, demonstrating the reliability and accuracy of the six-component force sensors measurements and further confirming the feasibility of the calibration method proposed in this study.

5. Conclusions

This paper presents an efficient calibration method based on a six-component force sensor calibration device, whose reliability has been validated through turning arm tests using the KCS standard ship model. Experimental results demonstrate that the proposed method offers significant advantages in both calibration efficiency and data accuracy. The calibrated sensor exhibits high precision in measuring forces and moments, with most calibration point errors below 1%, a small number exceeding 4%, and the maximum error not exceeding 7%. Validation through turning arm tests confirms that the established calibration coefficient matrix effectively eliminates crosstalk and systematic errors, greatly enhancing the measurement stability and reliability of the sensor. This provides robust technical support and tools for hydrodynamic model testing. Moreover, the proposed method and device are also applicable to the calibration and testing of other multi-component force sensors, such as those used in wind tunnel experiments.
Future work will further optimize the calibration rig architecture, enhancing automation and modular scalability, while developing high-precision calibration methodologies for complex dynamic, multi-axis coupled loading. We will integrate AI-driven adaptive calibration and error-compensation algorithms that perform online learning-based correction of temperature drift, cross-axis coupling, and time-varying effects, and build a physics-informed digital twin for virtual commissioning, scenario simulation, sensor performance prediction, and iterative refinement of calibration strategies. A closed-loop synergy between the AI layer and the digital twin will accelerate model updating and decision-making, supporting multi-scenario, high-frequency, high-reliability measurement demands and establishing an intelligent, extensible multi-component loading and calibration ecosystem. Moreover, systematic quantitative evaluation and compensation of the sensor’s nonlinear response and hysteresis characteristics, not yet comprehensively undertaken, will be prioritized in subsequent research.

Author Contributions

Conceptualization, H.Z. and B.Z.; methodology, H.Z.; software, H.Z.; validation, B.Z., X.L. and Q.L.; formal analysis, H.Z.; investigation, H.Z.; resources, X.L.; data curation, H.Z.; writing—original draft preparation, H.Z.; writing—review and editing, H.Z.; visualization, H.Z.; supervision, H.Z.; project administration, H.Z.; funding acquisition, X.L. All authors have read and agreed to the published version of the manuscript.

Funding

This research was funded by National Natural Science Foundation of China (Grant No. 52471301), Experimental Technology Research Project of Zhejiang University (Grant No. SYBJS202310).

Data Availability Statement

The data presented in this study are available within the article.

Conflicts of Interest

The authors declare no conflicts of interest.

References

  1. Zhao, B.; Yun, Y.; Sun, J.; Yang, Z.; Huang, B. Rotating Arm Tank Test and Single-Plane Force Study of a Full-Form Submarine. J. Zhejiang Univ. (Eng. Ed.) 2023, 57, 773–783. [Google Scholar]
  2. Jiao, J.; Ren, H.; Soares, C.G. A review of large-scale model at-sea measurements for ship hydrodynamics and structural loads. Ocean Eng. 2021, 227, 108863. [Google Scholar] [CrossRef]
  3. Pranesh, S.B.; Rajput, N.S.; Sathianarayanan, D.; Palaniappan, M.; Ramadass, G.A. CFD analysis of the hull form of a manned submersible for minimizing resistance. J. Ocean Eng. Mar. Energy 2022, 9, 125–143. [Google Scholar] [CrossRef]
  4. Zhao, B.; Yun, Y.; Hu, F.; Sun, J.; Wu, D.; Huang, B. Hydrodynamic coefficients of the DARPA SUBOFF AFF-8 in rotating arm maneuver: Part I: Test technology and validation. Ocean Eng. 2022, 266, 113148. [Google Scholar] [CrossRef]
  5. Zhao, B.; Yun, Y.; Hu, F.; Sun, J.; Wu, D.; Huang, B. Hydrodynamic coefficients of the DARPA SUBOFF AFF-8 in rotating arm maneuver-Part II: Test results and discussion. Ocean Eng. 2023, 268, 113466. [Google Scholar] [CrossRef]
  6. Bhattacharya, S.; Adhikari, S. Experimental validation of soil-structure interaction of offshore wind turbines. Soil Dyn. Earthq. Eng. 2011, 31, 805–816. [Google Scholar] [CrossRef]
  7. Kim, W.J.; Van, S.H.; Kim, D.H. Measurement of flows around modern commercial ship models. Exp. Fluids 2001, 31, 567–578. [Google Scholar] [CrossRef]
  8. Yasukawa, H.; Hasnan, M.; Matsuda, A. Validation of 6-DOF motion simulations for ship turning in regular waves. J. Mar. Sci. Technol. 2021, 26, 1096–1111. [Google Scholar] [CrossRef]
  9. Zhao, B.; Jiang, H.; Sun, J.; Zhang, D. Research on the Hydrodynamic Performance of a Pentamaran in Calm Water and Regular Waves. Appl. Sci. 2023, 13, 4461. [Google Scholar] [CrossRef]
  10. Tavakolpour-Saleh, A.R.; Setoodeh, A.R.; Gholamzadeh, M. A novel multi-component strain-gauge external balance for wind tunnel tests: Simulation and experiment. Sens. Actuators A Phys. 2016, 247, 172–186. [Google Scholar] [CrossRef]
  11. Nouri, N.M.; Mostafapour, K.; Kamran, M.; Bohadori, R. Design methodology of a six-component balance for measuring forces and moments in water tunnel tests. Measurement 2014, 58, 544–555. [Google Scholar] [CrossRef]
  12. Butler, D.; Smith, S.M.; Brandner, P.A.; Clarke, D.B.; Pearce, B.W. Static calibration and dynamic behaviour of a six-component force balance for variable pressure water tunnel facilities. Exp. Tech. 2021, 45, 157–167. [Google Scholar] [CrossRef]
  13. Nouri, N.M.; Kamran, M.; Mostafapur, K.; Bahadori, R. Design and fabrication of a force-moment measurement system for testing of the models in a water tunnel. Modares Mech. Eng. 2015, 14, 291. [Google Scholar]
  14. Yan, N.; Kühnel, M.; Vasilyan, S.; Fröhlich, T. Torsion balance-based system for high-precision force measurement in horizontal plane: Part I. Development concept. Meas. Sci. Technol. 2018, 29, 84001. [Google Scholar] [CrossRef]
  15. Persi, E.; Petaccia, G.; Fenocchi, A.; Manenti, S.; Ghilardi, P.; Sibilla, S. Hydrodynamic coefficients of yawed cylinders in open-channel flow. Flow Meas. Instrum. 2019, 65, 288–296. [Google Scholar] [CrossRef]
  16. Avin, O.; Raveh, D.E.; Drachinsky, A.; Ben-Shmuel, Y.; Tur, M. An experimental benchmark of a very flexible wing. In Proceedings of the AIAA Scitech 2021 Forum, Virtual, 11–15 and 19–21 January 2021. [Google Scholar]
  17. Liang, Q.; Zhang, D.; Coppola, G.; Wang, Y.; Wei, S.; Ge, Y. Multi-dimensional MEMS/micro sensor for force and moment sensing: A review. IEEE Sens. J. 2014, 14, 2643–2657. [Google Scholar] [CrossRef]
  18. Boutemedjet, A.; Samardžić, M.; Ćurčić, D.; Rajić, Z.; Ocokoljić, G. Wind tunnel measurement of small values of rolling moment using six-component strain gauge balance. Measurement 2018, 116, 438–450. [Google Scholar] [CrossRef]
  19. Nanda, S.R.; Kulkarni, V.; Sahoo, N. Design of artificial neuro-fuzzy based methodology for six component force balance. Procedia Eng. 2016, 144, 528–536. [Google Scholar] [CrossRef]
  20. Reis, M.L.; Mello, O.; Uyeno, S. Calibration uncertainty of an external six-component wind tunnel balance. In Proceedings of the 33rd AIAA Fluid Dynamics Conference and Exhibit, Orlando, FL, USA, 23–26 June 2003. [Google Scholar]
  21. Booth, D.; King, D.; Galway, R.; Mole, P. Calibration of a six component air flow through balance. In Proceedings of the 45th AIAA Aerospace Sciences Meeting and Exhibit, Reno, NV, USA, 8–11 January 2007. [Google Scholar]
  22. Huang, B.; Wang, X.; Li, C.; Yi, J.; Lu, R.; Tao, J. Development and calibration of an air-floating six-axis force measurement platform using self-calibration. Rev. Sci. Instrum. 2016, 87, 095002. [Google Scholar] [CrossRef]
  23. Ulbrich, N.M.; Volden, T. Wind Tunnel Strain-Gage Balance Calibration Data Analysis using a Weighted Least Squares Approach. In Proceedings of the 33rd AIAA Aerodynamic Measurement Technology and Ground Testing Conference, Denver, CO, USA, 5–9 June 2017. [Google Scholar]
  24. Parker, P.; Morton, M.; Draper, N.; Line, W. A single-vector force calibration method featuring the modern design of experiments. In Proceedings of the 39th Aerospace Sciences Meeting and Exhibit, Reno, NV, USA, 8–11 January 2001. [Google Scholar]
  25. Nanda, S.R.; Kulkarni, V.; Sahoo, N.; Menezes, V. Sensitivity studies of ANFIS based force recovery technique towards prediction of aerodynamic load. Flow Meas. Instrum. 2021, 80, 101969. [Google Scholar] [CrossRef]
  26. Kamran, M.; Nouri, N.M. Model testing system for surface-piercing propellers in a water tunnel: Design and in situ calibration methodology. Measurement 2022, 199, 111200. [Google Scholar] [CrossRef]
  27. Yu, A.; Wan, D.; Chen, G. Verification and validation for the resistance of a KRISO container ship in calm water. In Proceedings of the 29th International Ocean and Polar Engineering Conference (ISOPE), Honolulu, HI, USA, 16–21 June 2019. [Google Scholar]
  28. ITTC-Recommended Procedures and Guidelines 7.5-02-02-02.1. Example for Uncertainty Analysis of Resistance Tests in Towing Tanks. 29th ITTC, Quality Systems Group. 2021. Available online: https://www.ittc.info/media/10176/75-02-02-021.pdf (accessed on 13 July 2024).
  29. SIMMAN 2014. Available online: https://simman2014.dk/about-simman2014/ (accessed on 13 July 2024).
  30. SIMMAN 2019. Available online: https://web.archive.org/web/20211021062834/http://simman2019.kr/contents/Purpose.php (accessed on 13 July 2024).
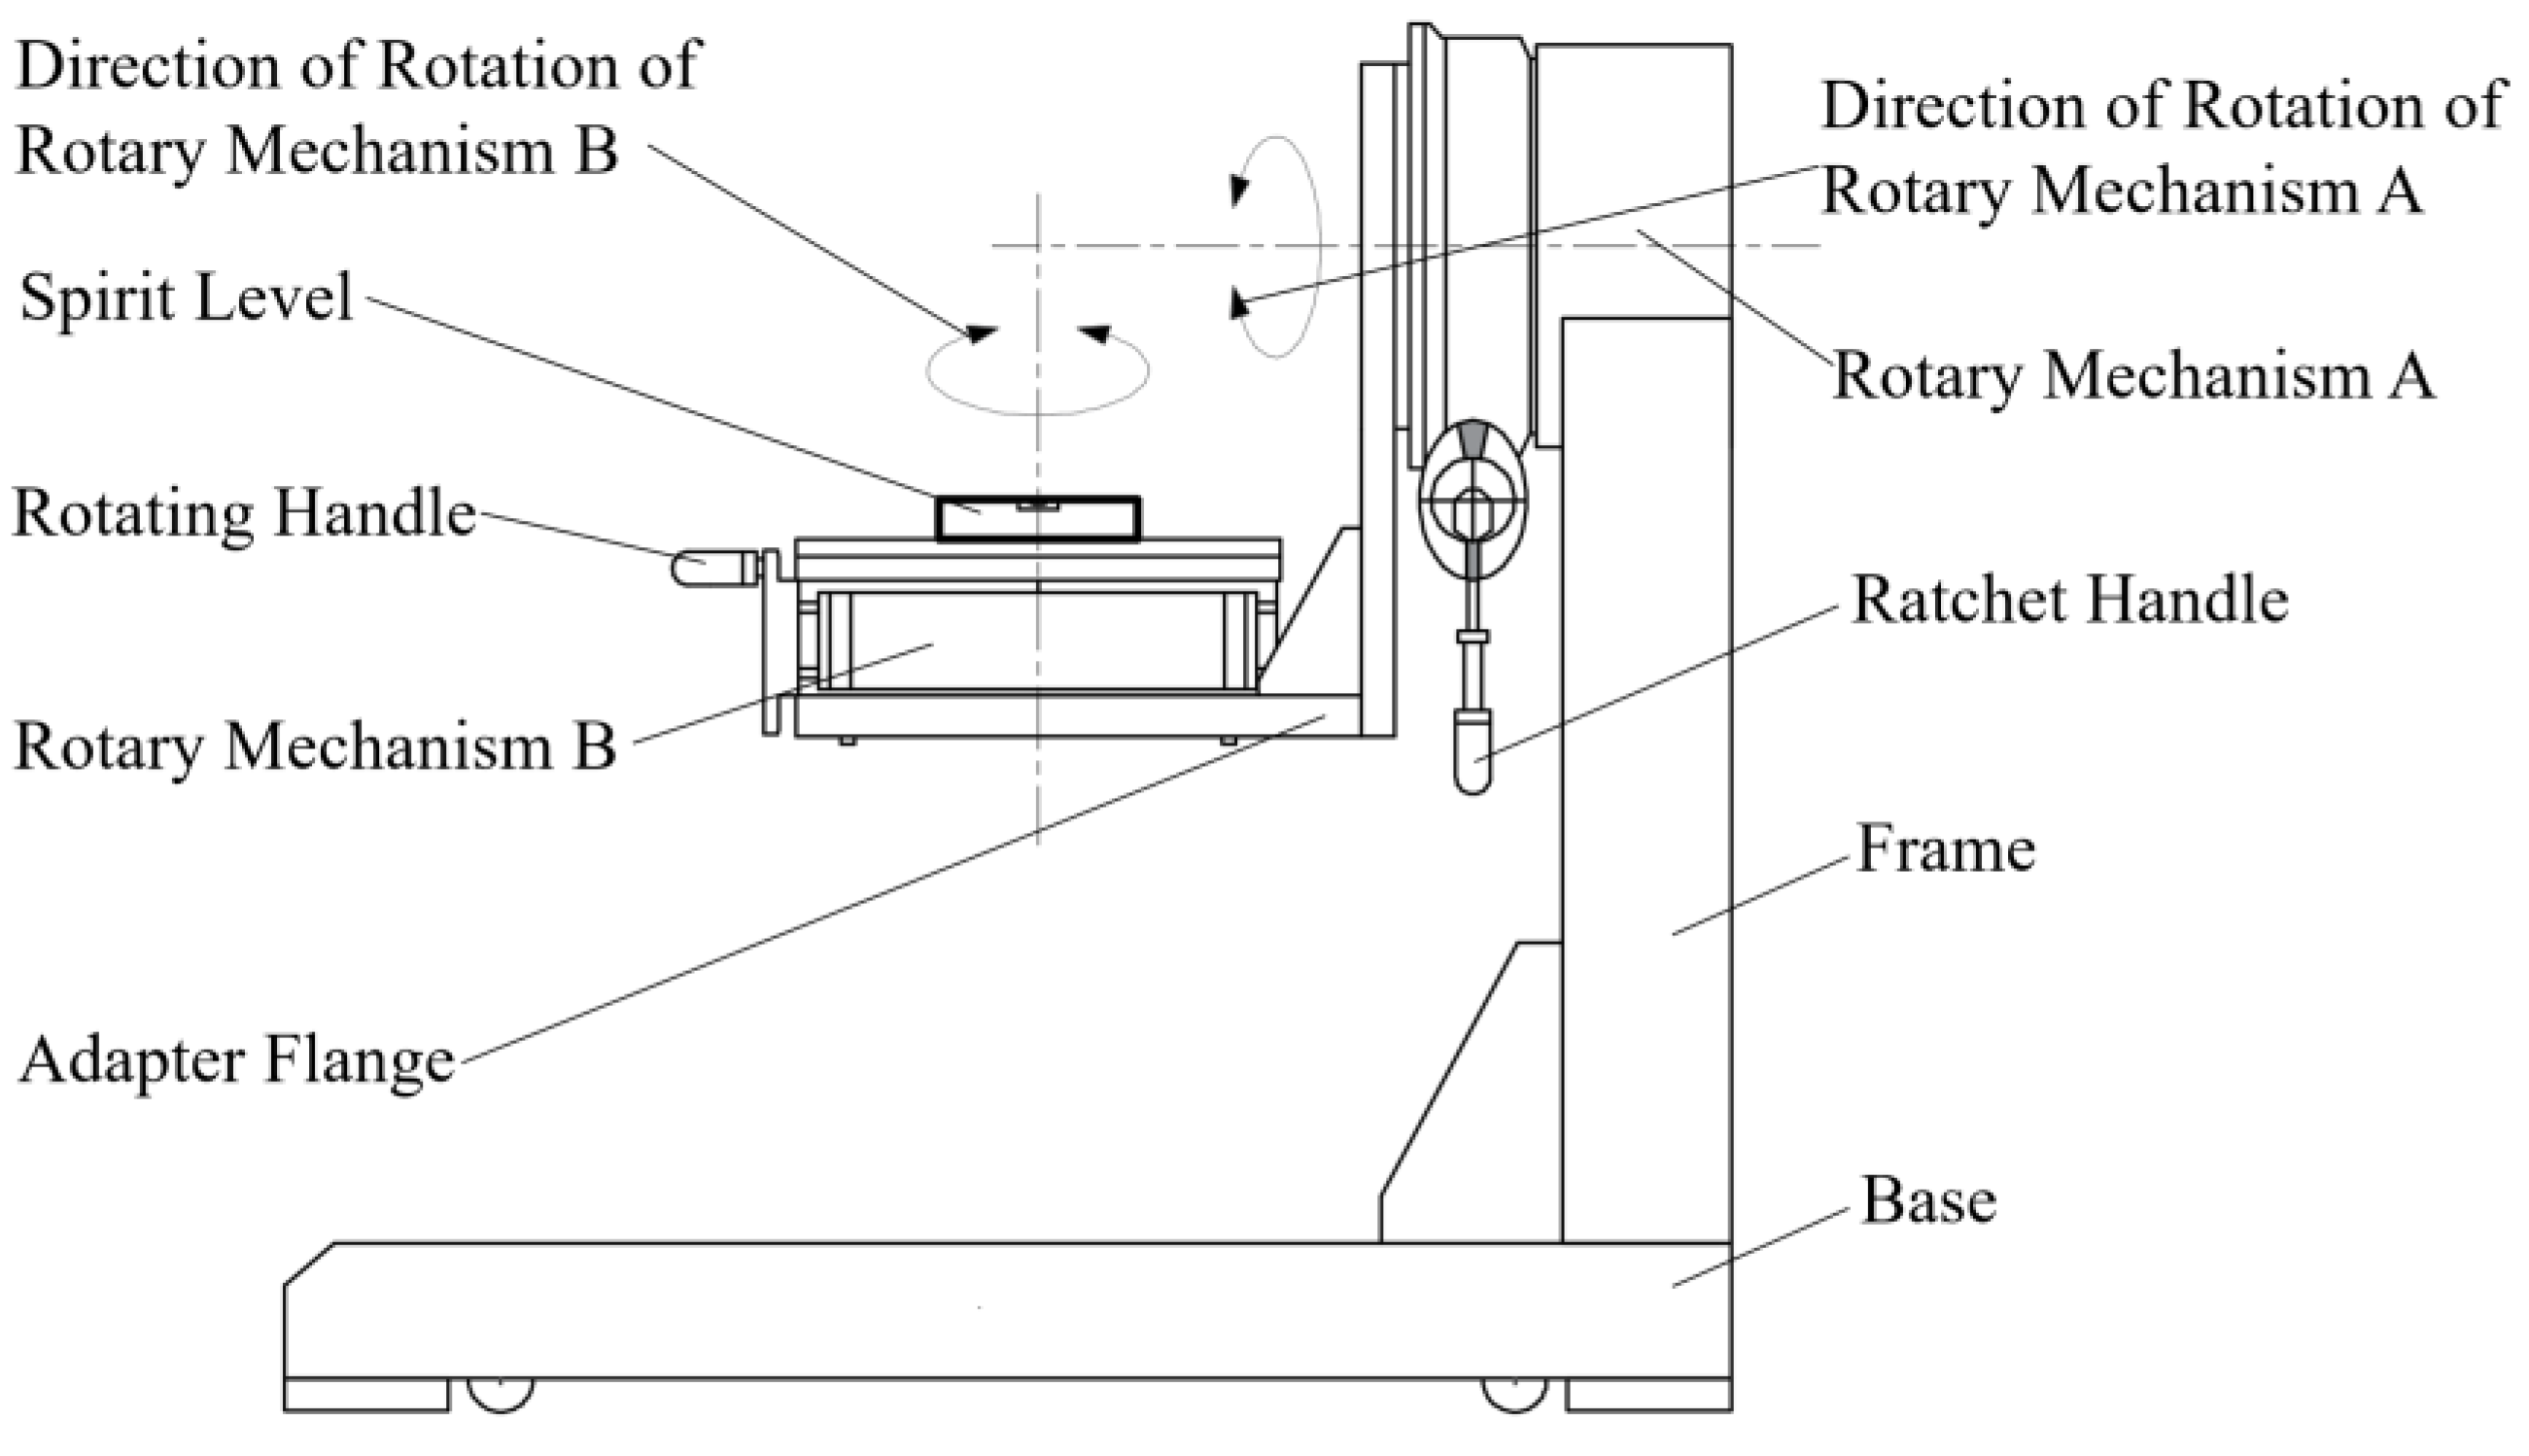
Figure 1. Structural diagram of the calibration device.
Jmse 13 01811 g001
Figure 2. Calibration system.
Jmse 13 01811 g002
Figure 3. Sensor installation dimensions and coordinates.
Jmse 13 01811 g003
Figure 4. Schematic diagram of loading states.
Jmse 13 01811 g004aJmse 13 01811 g004b
Figure 5. Calibration and verification results.
Jmse 13 01811 g005
Figure 6. Error of the calibration results.
Jmse 13 01811 g006aJmse 13 01811 g006b
Figure 7. Motion coordinate system.
Jmse 13 01811 g007
Figure 8. Model assembly and tank testing.
Jmse 13 01811 g008
Figure 9. Repeat tests under condition of 0° drift angle for KCS model.
Jmse 13 01811 g009
Figure 10. Comparison of KCS model test results.
Jmse 13 01811 g010
Table 1. Forces and moments in six Loading states.
StatesForces/NMoments/(N·m)W/kg
FxFyFzMxMyMz
1Wg000Wgl100~140
2Wg000Wgl200~140
30Wg0Wgl3000~300
40Wg0Wgl4000~300
50Wg0Wgl50Wgl60~300
600Wg0000~300
Table 2. Forces and moments in six loading states.
Force/MomentSDevP(M)
Fx0.8650.671
Fy0.7430.544
Fz0.7540.537
My0.9760.753
Mz1.2240.916
Disclaimer/Publisher’s Note: The statements, opinions and data contained in all publications are solely those of the individual author(s) and contributor(s) and not of MDPI and/or the editor(s). MDPI and/or the editor(s) disclaim responsibility for any injury to people or property resulting from any ideas, methods, instructions or products referred to in the content.