Article

Establishment of the Erosion Control Line from Long-Term Beach Survey Data on the Macro-Tidal Coast

1
Geosystem Research Corp., Gunpo 15807, Republic of Korea
2
Graduate School of Water Resources, Sungkyunkwan University, Suwon 16419, Republic of Korea
*
Author to whom correspondence should be addressed.
J. Mar. Sci. Eng. 2025, 13(9), 1784; https://doi.org/10.3390/jmse13091784
Submission received: 14 July 2025 / Revised: 8 September 2025 / Accepted: 13 September 2025 / Published: 16 September 2025

Abstract

The west coast of Korea is characterized by a macro-tidal environment, where beach exposure varies significantly with tidal levels, resulting in high spatial variability of beach width and erosion patterns. This study aims to establish an Erosion Control Line (ECL) for Mallipo Beach using long-term beach topographic data collected from 2009 to 2020. For each transect, beach width was statistically estimated for a 30-year return period by calculating the average and standard deviation of surveyed widths and applying the inverse function of the normal cumulative distribution. The variability of shoreline positions was analyzed as an indicator of shoreline sensitivity, allowing the identification of highly vulnerable sections. Based on these analyses, the ECL was derived for three tidal reference levels—Highest Water of Medium Tide (H.W.O.M.T), Highest Water of Neap Tide (H.W.O.N.T), and Mean Sea Level (M.S.L)—according to Korea Hydrographic and Oceanographic Agency (KHOA)’s tidal datums. When the H.W.O.N.T-based beach width was used to define the Target shoreLimit of Erosion Prevention (TLEP), several public facilities were found to fall within the erosion hazard zone. These findings underscore the need for institutionalized coastal setback policies in Korea and highlight the practical value of the proposed ECL method for managing erosion-prone zones.

1. Introduction

Coastal zones are increasingly under pressure, not only due to rapid and often unregulated development, but also because of ongoing changes in the climate system [1]. These combined stressors are contributing to heightened risks of shoreline erosion and associated socio-economic and ecological damage [2,3]. In the case of South Korea, such developments along its densely populated coastlines have led to a steady rise in erosion-related impacts, especially in sandy beach environments [4]. To sustainably manage these vulnerable regions, the concept of a coastal setback line has gained growing attention as a strategic spatial planning tool since the 1992 Rio Earth Summit [5], and recent studies have applied it using socio-economic risk assessment, probabilistic shoreline modeling, and historical erosion data (e.g., [6,7,8]). This concept is designed not only to protect critical infrastructure and human settlements, but also to preserve dynamic coastal ecosystems in the long term.
Globally, the establishment of scientifically grounded setback lines was emphasized during the 1992 Rio Earth Summit, which led to widespread policy adoption in countries with vulnerable coastlines [5,9]. For instance, in the United States, agencies such as NOAA’s Coastal Resource Management (CRM) and Office of Ocean and Coastal Resource Management provide guidance on defining no-building zones based on shoreline behavior [10]. The coastal U.S. states apply different setback policies, and Table 1 presents examples of no-building areas applied according to the terrain of major U.S. states.
Building on these international and national policy frameworks, empirical formulations have often served as a foundation for delineating setback zones. For example, Bruun’s rule (1962) established the rationale that sea-level rise induces coastal profile erosion, becoming a cornerstone of global erosion prediction models [18]. Similarly, wave run-up formulations, such as those proposed by Stockdon et al., are widely applied to estimate the maximum landward reach of extreme waves, thereby informing setback placement [19]. Recent studies have extended these empirical principles into practical applications: Karditsa and Poulos (2024) delineated a 100 m coastal setback zone for the Peloponnese coast of Greece based on maximum winter wave run-up [6], while Dastgheib et al. (2018) integrated stochastic retreat modeling with an Economically Optimal Setback Line (EOSL) to adaptively manage climate-related risks [7]. Likewise, Taveira Pinto et al. (2022) used historical shoreline change analysis along Portugal’s northern coast to project setback lines for 2050 and 2100, demonstrating a forward-looking approach to coastal zone management [8].
Australia’s Western Australian Planning Commission and Department for Planning and Infrastructure have taken a more proactive stance. Their Perth Coastal Planning Strategy adopted probabilistic and process-based models to project shoreline retreat over 10–15 years, integrating sea-level rise and storm events into decision-making tools for infrastructure and land-use planning [20]. Likewise, the European Union’s CONSCIENCE project (2010) recommended a multidimensional approach to setback planning, considering geomorphology, wave climate, socio-economic conditions, and stakeholder awareness [21]. In line with this, several European legislative frameworks also highlight the necessity of setback zones, including Article 8(2) of the Mediterranean ICZM Protocol, the Floods Directive (2007/60/EC), and the Water Framework Directive (2000/60/EC). These instruments collectively emphasize the integration of ecological protection, flood risk reduction, and sustainable land–sea management, thereby providing a strong policy basis for implementing setback zones as an adaptive response to climate change in coastal regions. These international cases illustrate a clear shift towards evidence-based, site-specific, and dynamic retreat strategies, rather than uniform or prescriptive zoning. China has introduced the so-called Coastal Building Setback Line (SBL) [22], and Florida has had a Coastal Construction Control Line (CCCL) since 1971 [17]. This is a prime example of the actual control of coastal development through legal constraints.
Meanwhile, coastline management research in Korea has steadily evolved, moving beyond coastal erosion monitoring and exploring diverse approaches. Government agencies such as the Ministry of Oceans and Fisheries (MOF) and the Korea Hydrographic and Oceanographic Agency (KHOA) have collected long-term coastline and beach data and monitored sedimentation trends. A more advanced attempt was made under the Coastal Disaster Vulnerability Assessment System, where erosion, inundation, and composite risk lines were proposed based on maximum observed values [23]. However, this approach has not yet been adapted or tested on the west coast of Korea, which features macro-tidal conditions and significantly wider tidal flats.
To promote coastal resilience and environmental sustainability, the Ministry of Oceans and Fisheries in Korea (MOF) has proposed a coastal zoning framework consisting of several shoreline-based management lines—namely the Mean Target Shoreline (MTS), Erosion Prevention Line (EPL), Equilibrium Shoreline (ESL), and Erosion Control Line (ECL) [3]. These delineations are intended to enhance the effectiveness of both environmental conservation and disaster mitigation strategies in vulnerable coastal zones (Table 2). Recent Korean studies have provided empirical support for this framework. In particular, Yoo et al. (2022) evaluated the implementation of control lines in response to hard coastal defense structures and confirmed the feasibility of setting evaluation shorelines that align with post-construction shoreline surveys, indicating practical policy applicability [24]. Similarly, Park et al. (2019) proposed an erosion width prediction model tailored to high-wave conditions, which allowed accurate establishment of ECLs in erosion-prone zones, illustrating the utility of predictive modeling for shoreline management [25]. These findings validate the MOF’s zoning framework and underscore its relevance in coastal planning practice.
In this study, the Erosion Control Line (ECL), as defined by the MOF, is adopted and implemented for the analysis. The ECL is based on long-term observational shoreline data and is statistically derived to reflect shoreline variability due to episodic and seasonal events. It functions as a dynamic coastal control line, distinct from planning-oriented or static zoning boundaries. Its primary objective is to provide a spatial buffer to protect critical coastal infrastructure—such as residential facilities, road networks, and vegetated buffer zones—from acute erosion events triggered by typhoons, storm surges, or anomalous wave actions.
The ECL is derived by first identifying the Equilibrium Shoreline (ESL), which represents the statistical average shoreline position under quasi-stable environmental conditions. Then, an erosion buffer width is added to the ESL to delineate the ECL, thereby accounting for short-term coastal retreat during extreme events. In contrast to the ESL, which reflects long-term average conditions, the ECL incorporates safety margins for disaster preparedness. Thus, the ECL plays a critical role in coastal spatial planning, especially in hazard-prone areas where shoreline changes are abrupt and recurrent. This approach is particularly relevant on the west coast of South Korea, where the influence of macro-tidal conditions results in substantial temporal and spatial variations in beach width depending on tidal levels.
To date, no systematic attempt has been made to establish probabilistically derived setback lines in this region, representing a critical research gap. The objective of this study is to develop a statistically grounded method for estimating erosion hazard lines in macro-tidal environments, using long-term beach topographic data from Mallipo Beach. Specifically, the study analyzes shoreline variability between 2009 and 2020, calculates beach width distributions relative to tidal benchmarks, and estimates a 30-year return period beach width to determine a scientifically justifiable erosion threshold line. The outcome of this research can serve as a foundational decision-making tool for local governments and coastal planners in Korea and may also contribute to broader methodological discussions on erosion hazard assessment in tide-dominated systems.

2. Materials and Methods

2.1. Study Area

The west coast of South Korea, including regions such as Mallipo Beach, represents a prototypical macro-tidal coastal environment, characterized by a large tidal range and extensive intertidal flats. Unlike the east coast, which is primarily wave-dominated [26], the west coast is tide-dominated [27]. In addition to these tides, wind-driven waves also influence coastal dynamics. Together, these hydrodynamic forces create a highly dynamic environment, necessitating a tailored methodological approach to accurately define Erosion Control Lines.
Figure 1a illustrates the range of high-water tidal levels derived from the Anheung tidal station, the closest site to Mallipo Beach. The recorded A.H.H.W was 709.4 cm, and the spring tidal range was 584.2 cm [28]. Such extreme tidal variability significantly affects beach morphology and complicates efforts to define a stable shoreline. Therefore, it is important to use various tidal reference points when estimating ECL.
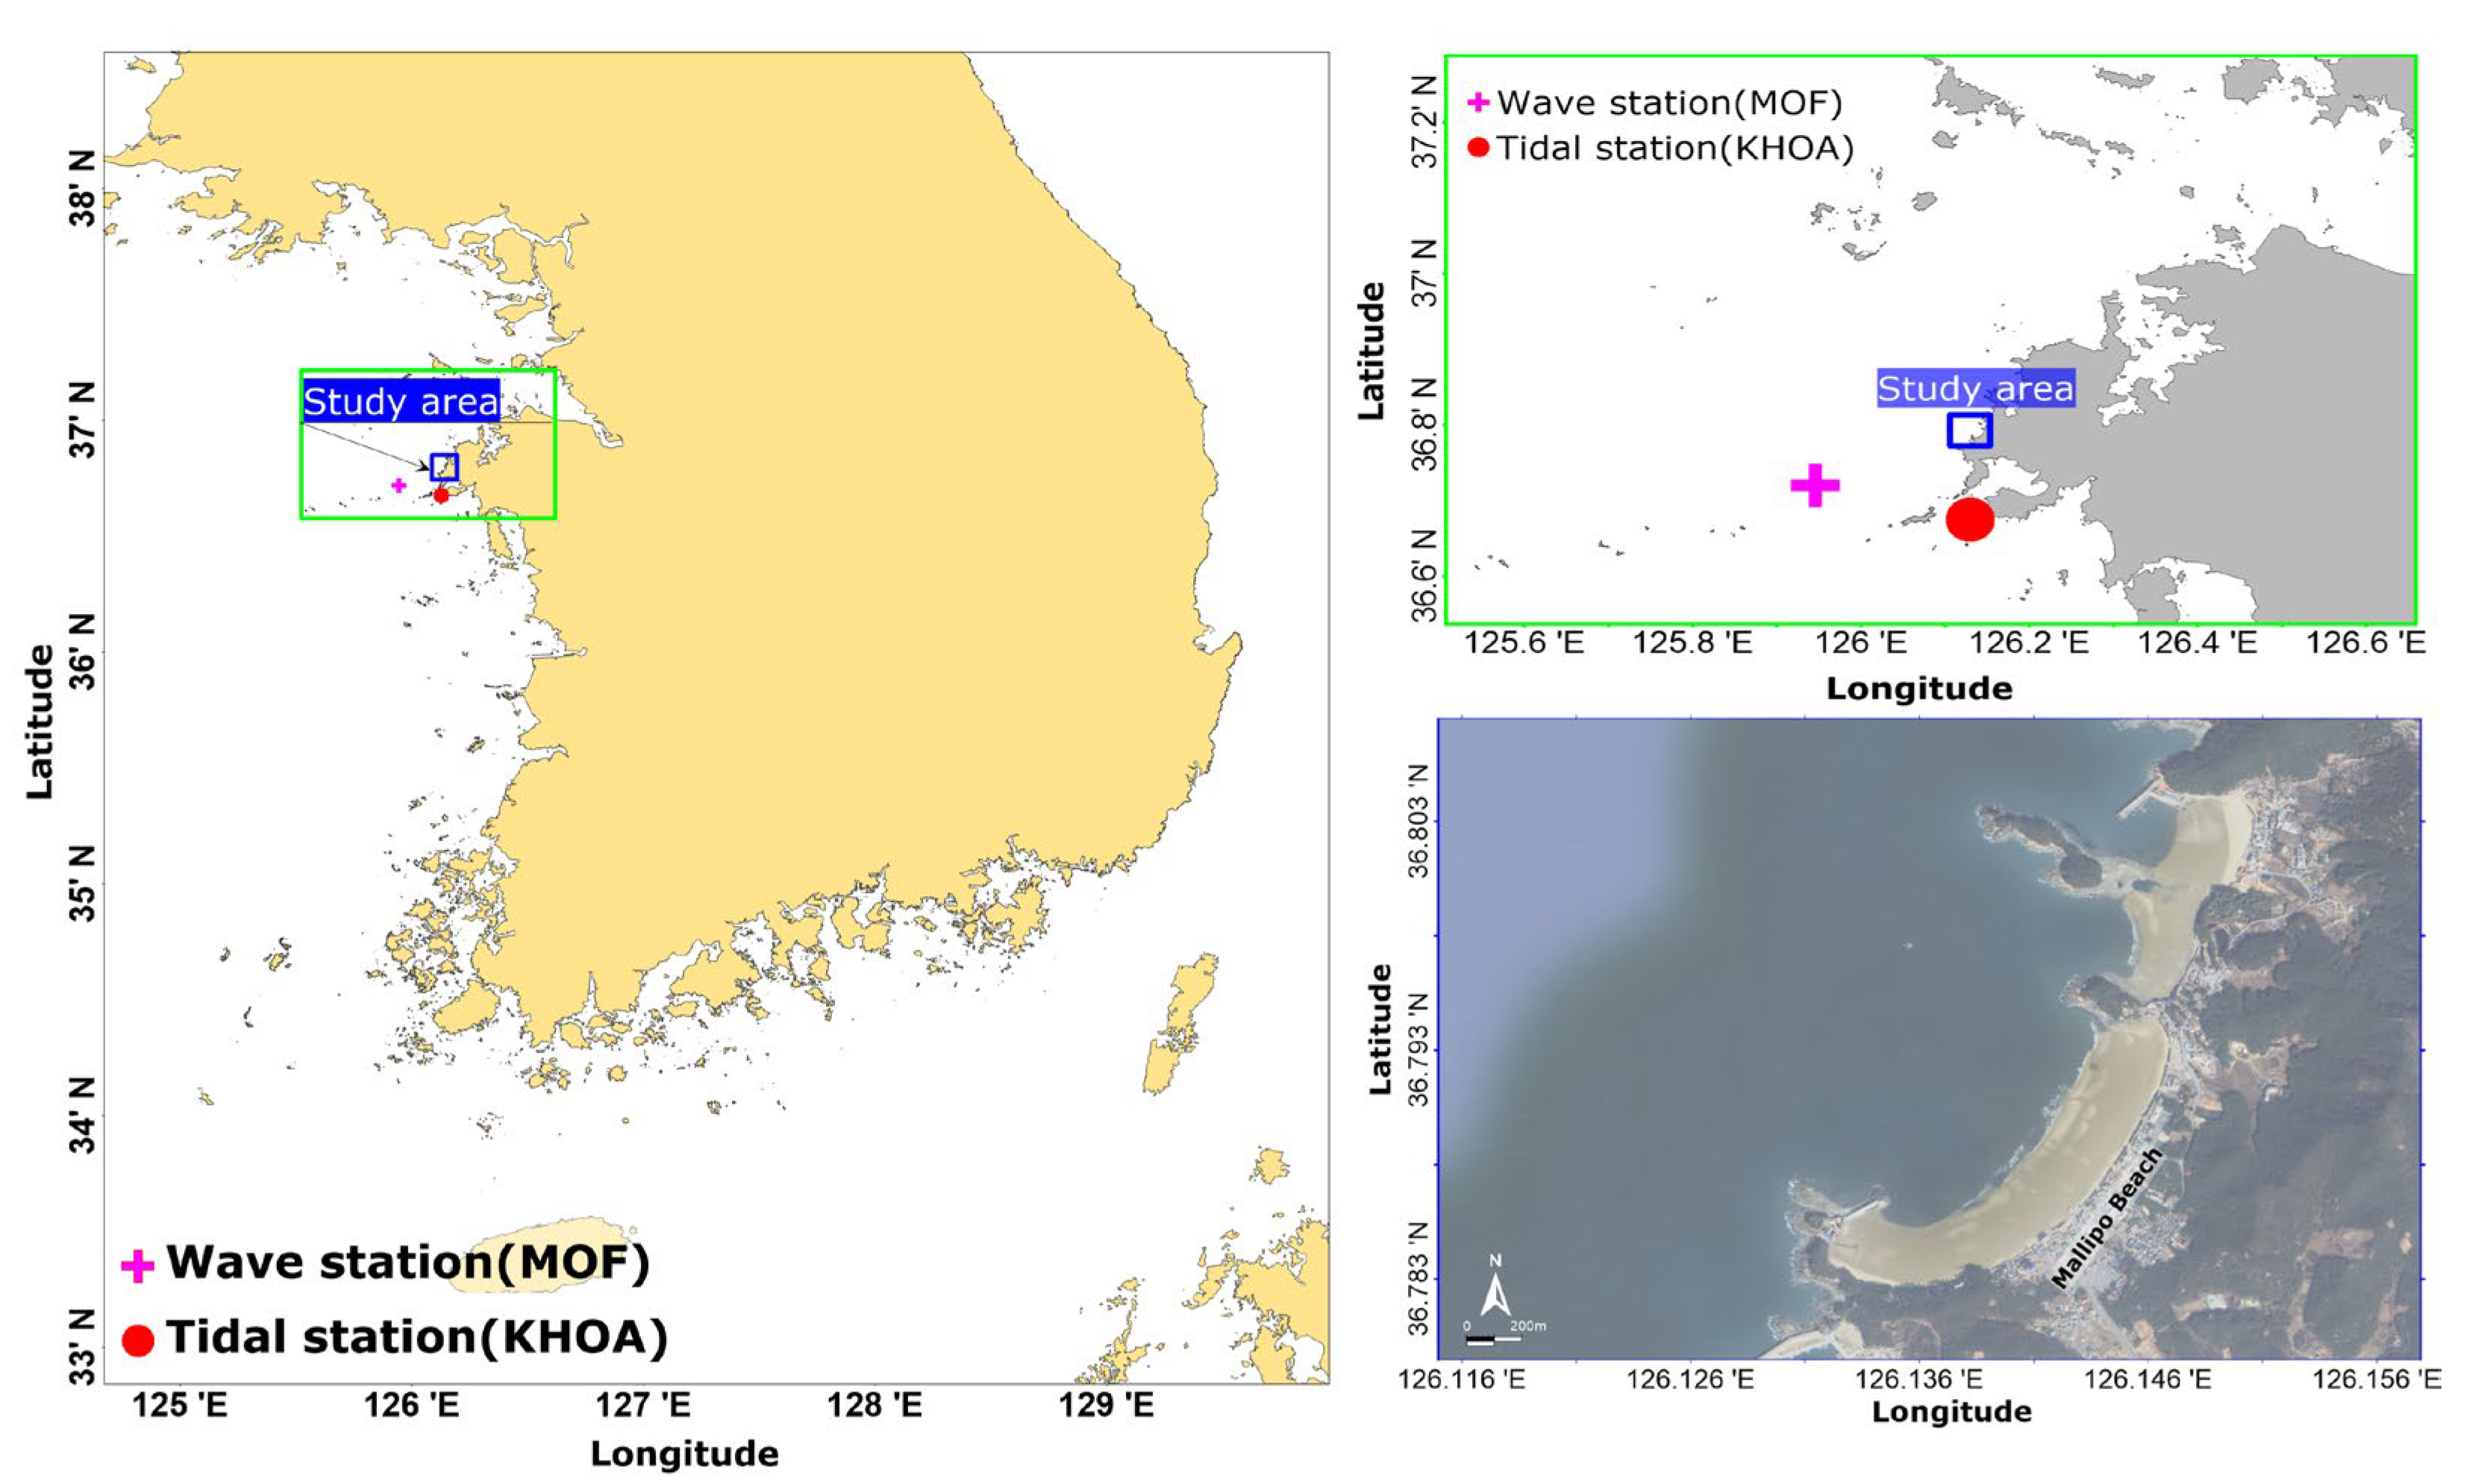
In addition, Figure 1b presents the analysis of significant wave height, peak period, and peak wave direction based on wave observation data collected over a three-year period (2018–2020) from the nearby Heukdo wave station. The results show an average significant wave height of 0.7 m and an average peak period of 5.54 s, with WNW and W directions being predominant. These observations are consistent with broader wave climate characteristics of the west coast of Korea, where the mean significant wave height generally ranges from 0.3 to 1.6 m, reaching its maximum in winter and minimum in late spring to early summer [29]. Seasonal monsoon winds drive these variations, with wave directions predominantly southward during winter and northward during summer. Furthermore, the region, including Mallipo, is frequently affected by extratropical cyclones in winter, which can rapidly increase significant wave heights from less than 1 m to storm conditions [26]. The locations of the tidal and wave observation sites are indicated in Figure 2.
The focal site of this study is Mallipo Beach, located in Taean County, Chungcheongnam-do, and designated as one of the three major beaches along the west coast. It is also a key recreational area within the Taeanhaean National Park, attracting substantial numbers of domestic and international tourists annually (Figure 2). The beach, with a shoreline length of approximately 2.1 km, consists primarily of medium to fine sand (mean grain size: 0.39 mm) and is flanked by headlands and rocky outcrops, forming a semi-enclosed embayment [30]. It is vulnerable to coastal erosion driven by both natural dynamics and anthropogenic impacts. According to the 2019 Coastal Erosion Monitoring Report by the Ministry of Oceans and Fisheries, Mallipo Beach was assigned a D-grade erosion rating—the lowest in the classification system—indicating a severe level of erosion risk [30]. This classification was primarily attributed to continuous sand loss and shoreline retreat, exacerbated by tourism infrastructure and coastal development near the beach. Despite the presence of breakwaters and revetments at the adjacent Mallipo Port, no major coastal engineering structures have been installed directly on the beach face since 2009, allowing for uninterrupted long-term monitoring of natural shoreline dynamics. This condition makes Mallipo Beach an ideal case study for applying Erosion Control Line (ECL) methodologies based on empirical observations.

2.2. Topographic Data

This study utilized long-term beach topographic data collected between 2009 and 2020 through the Coastal Erosion Monitoring Program led by the Ministry of Oceans and Fisheries (MOF). Considering the total length of Mallipo Beach (2.1 km) [30], reference points covering the entire shoreline were established at 200 m intervals, and each point was used as the baseline for cross-shore profile measurements extending seaward. The survey was conducted using a RTK-DGPS receiver (Leica GX1230), which provides a horizontal accuracy of approximately 10 mm and a vertical accuracy of 20 mm. Transects were established perpendicular to the coastline at each reference point, and the survey results were expressed as elevations relative to the distance from the reference point, facilitating the interpretation of changes in beach width and elevation. The survey included seaward areas accessible for measurement, including shallow zones where the water occasionally covered the ground.
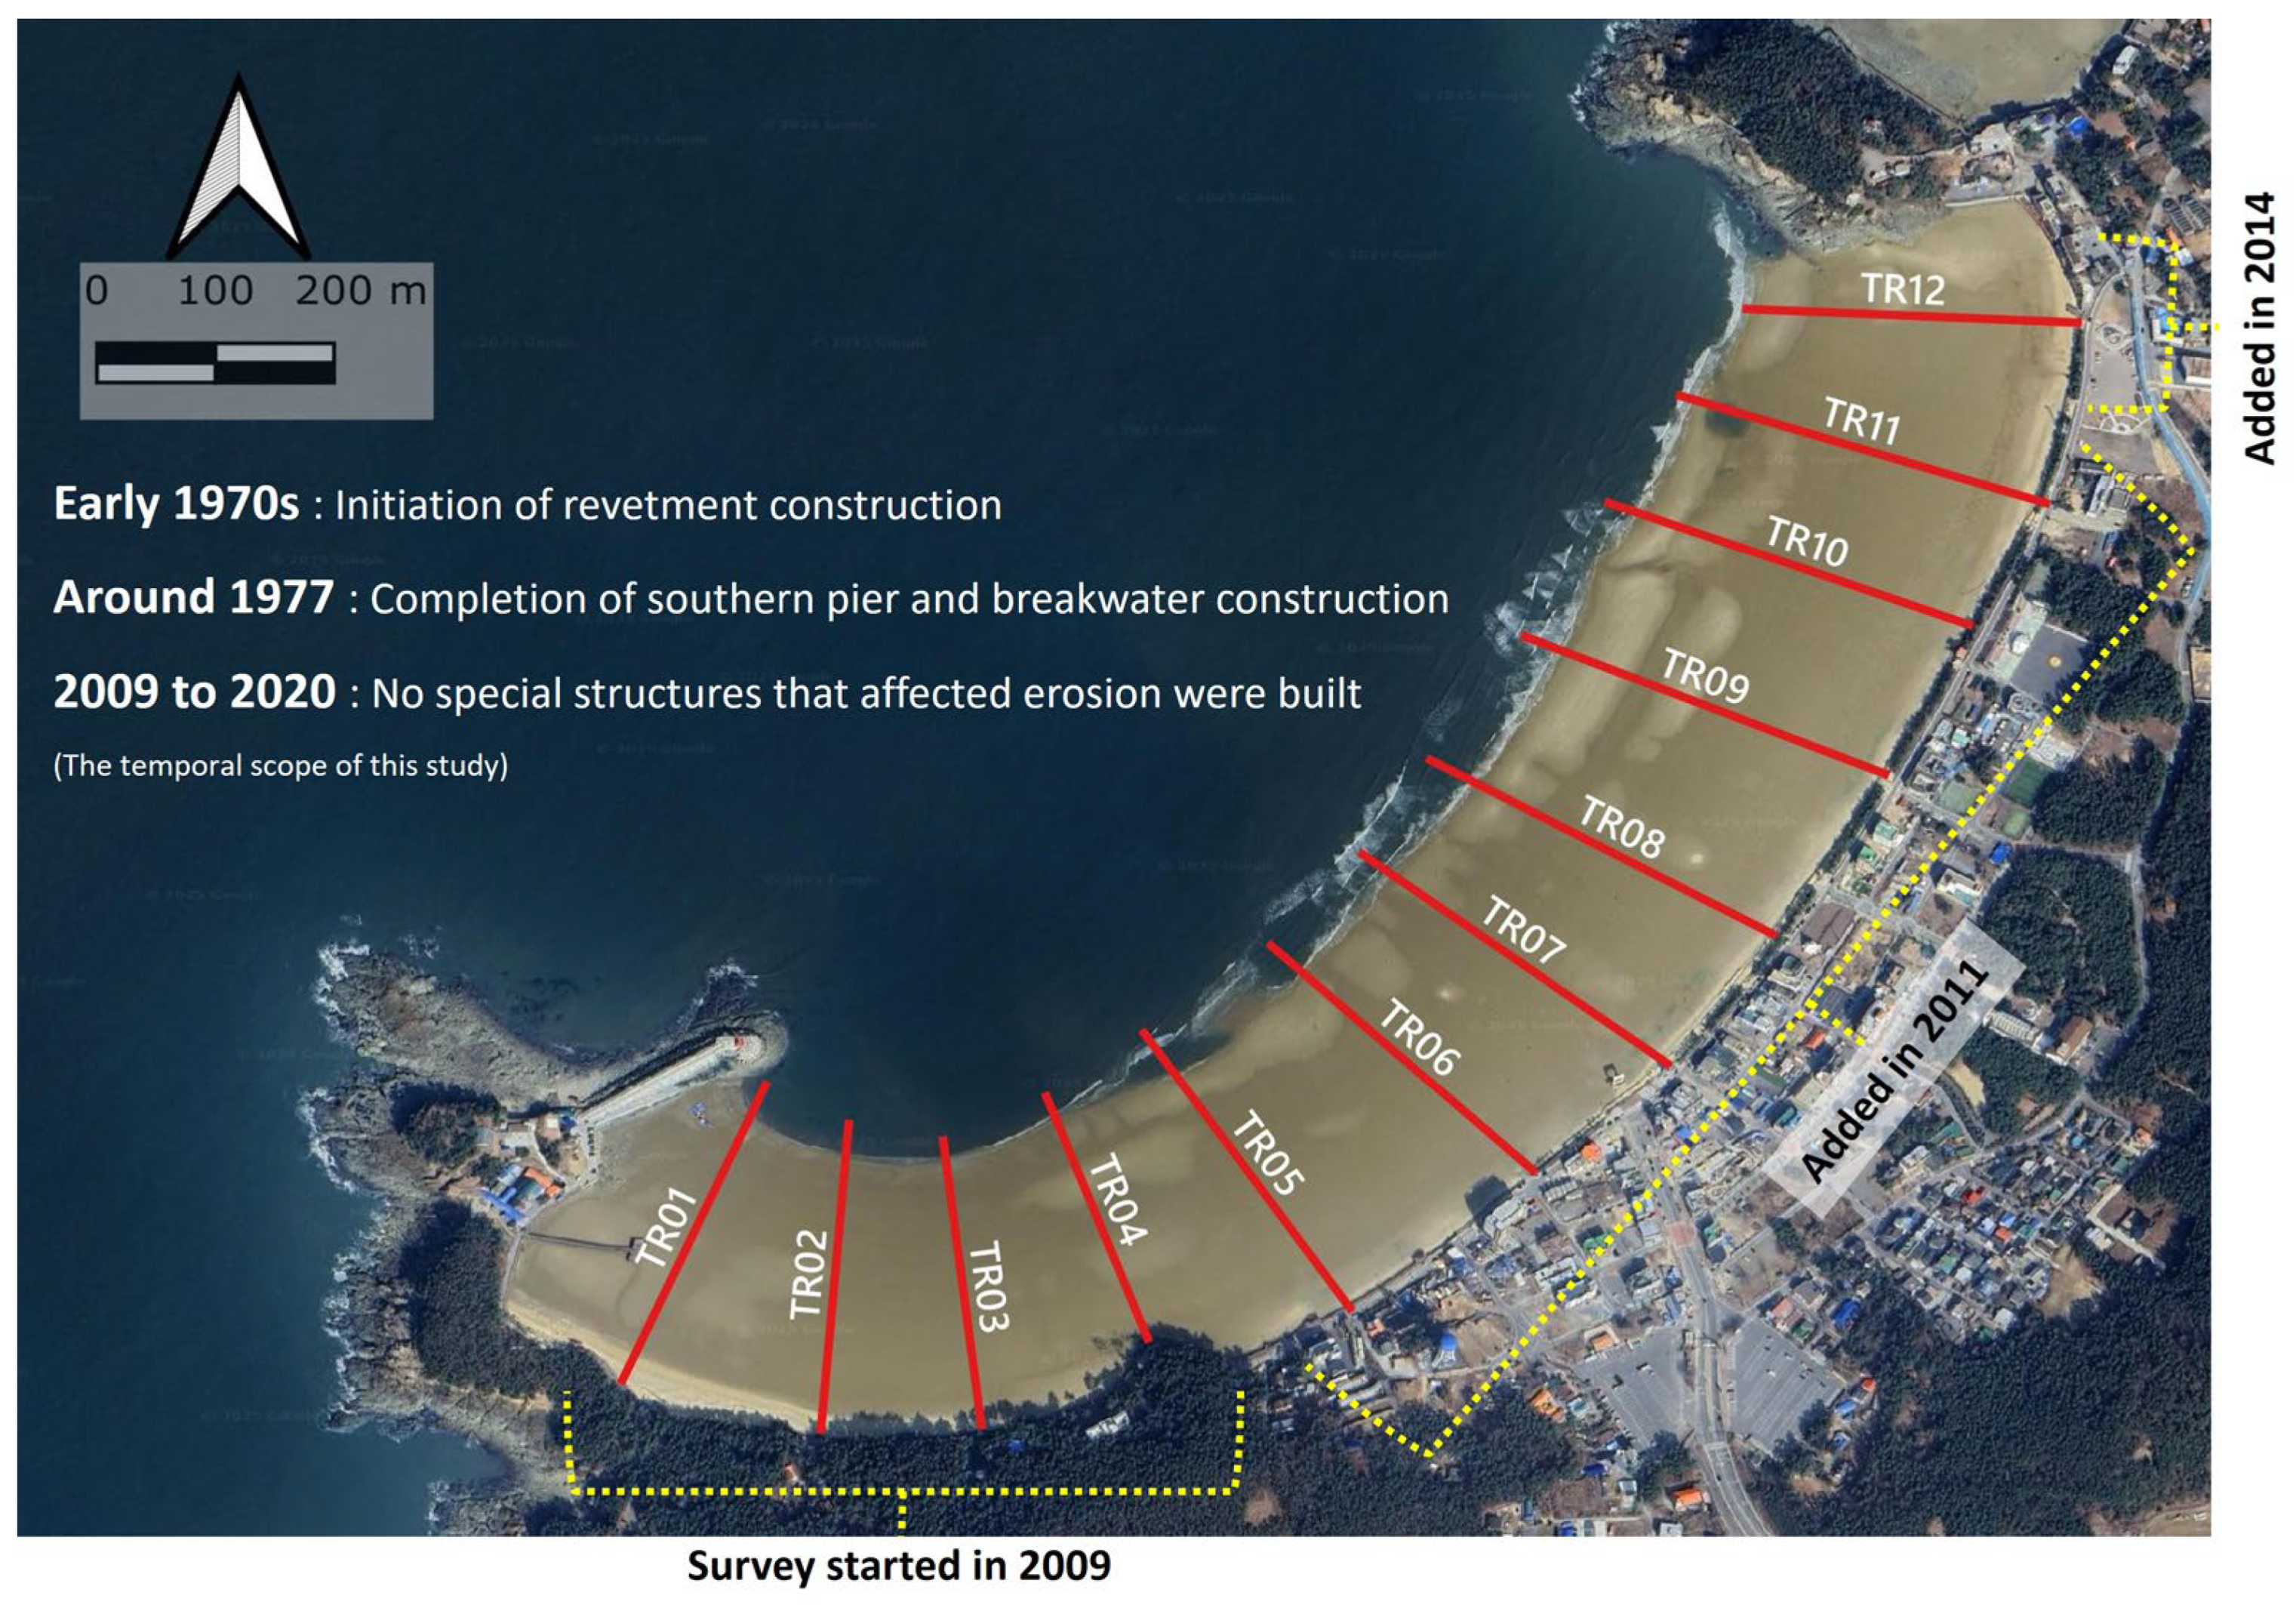
The data provide high-resolution, semi-annual topographic profiles for Mallipo Beach and serve as a rare longitudinal dataset for Korea’s macro-tidal coastlines. The surveys were conducted twice annually, during early spring (April–May) and autumn (September–October) periods. Based on the survey results, the transects were divided into 200 m intervals. Surveys initially began with four transects in 2009, and were expanded to 11 transects from 2011. From 2014 until April 2020, the number of surveyed transects increased to 12, as shown in Figure 3.
A review of the construction history of major coastal structures showed that a seawall to mitigate coastal erosion was initiated in the early 1970s, and the construction of the southern wharf and breakwater was completed around 1977. During the study period (2009–2020), no additional major coastal structures that could influence shoreline erosion were constructed.
The beach width was calculated based on nine reference tidal levels defined by the Korea Hydrographic and Oceanographic Agency (KHOA), using long-term tidal observations and harmonic analysis: Approximate Highest High Water (A.H.H.W), High Water Ordinary Spring Tide (H.W.O.S.T), High Water Ordinary Mean Tide (H.W.O.M.T), High Water Ordinary Neap Tide (H.W.O.N.T), Mean Sea Level (M.S.L), Low Water Ordinary Neap Tide (L.W.O.N.T), Low Water Ordinary Mean Tide (L.W.O.M.T), Low Water Ordinary Spring Tide (L.W.O.S.T), and Approximate Lowest Low Water (A.L.L.W). Each tidal datum represents a statistically derived reference level based on multi-year tidal records and is used to capture a wide range of tidal variability in beach morphology assessments.

2.3. Establishment of ECL

To ensure the practical application of the ECL, this study adopts a probabilistic approach, in which the maximum beach erosion width corresponding to a 30-year return period is estimated. Here, erosion width reflects the combined effects of extreme sea levels—including tides, storm surges, and wave conditions—thereby capturing the combined hydrodynamic forcing that drives coastal retreat. The selection of a 30-year design horizon is consistent with international engineering practices and policy standards. For instance, Japan uses a 30-year return period as the baseline for fishing ports, while most European countries adopt a similar standard ranging between 20 to 30 years for their coastal infrastructure [31,32]. The Ministry of Oceans and Fisheries (MOF) in South Korea also recommends considering design wave characteristics based on economic feasibility, damage potential, and maintenance accessibility [33]. Based on this context, the 30-year return period was selected as a reasonable basis for determining the ECL at Mallipo Beach.
In this study, long-term shoreline survey data collected twice annually between 2009 and 2020 were used to statistically estimate beach width variability. To assess the statistical distribution of the M.S.L-based beach width measurements, a Chi-squared goodness-of-fit test was employed. This test was used to evaluate whether the observed beach width data conform to a normal distribution. Since the data comprise semi-annual measurements, the direct use of the data yields an effective sample size of 60, corresponding to a 1/60 exceedance probability. However, this can underestimate the potential maximum erosion that could occur in reality, because short-term events, such as storm-induced erosion, may not be captured. To overcome this limitation, the analysis incorporated a correction by assuming a hypothetical daily survey frequency—365 times per year over 30 years—yielding a total of 10,950 surveys. For this dataset, the erosion width corresponding to a 1/10,950 exceedance probability was calculated using the inverse function of the normal cumulative distribution function, as shown in Equation (1). A confidence factor of 3.7417, corresponding to a 99.98% confidence level, was applied in alignment with extreme value analysis standards. Where μ refers to the average beach width and σ refers to the standard deviation of beach width.
F x = 1 2 1 + e r f x μ σ 2
Using the inverse function of Equation (1), the F 1 ( 1 / 10,950 ) value becomes the 30-year return period erosion width. The 30-year return period erosion width, Z, can be obtained using the Equation (2).
Z = X μ σ
The derived value, Z, serves as the boundary for the ECL, representing the beach width exceeded only in rare and extreme events. By adopting this statistical methodology, the study offers a conservative estimation of the erosion risk zone, thereby enabling proactive setback planning. This methodology aligns with international coastal risk assessment practices and may serve as a reference framework for other macro-tidal coasts under similar physical and observational constraints.
In addition to the ECL, this study introduces a supplementary spatial planning tool: the Target shoreLimit of Erosion Prevention (TLEP). The TLEP is proposed as a landward extension of the ECL and is designed to serve as a development exclusion zone, preventing inappropriate or unregulated construction activities in the immediate hinterland of the beach. The purpose of the TLEP is to uphold the “public value” of the coast—encompassing its ecological, recreational, and protective functions—by creating a statutory buffer between the dynamic shoreline and human development. This may be used to reinforce shoreline setback regulations and enable adaptive coastal zone management.

3. Results

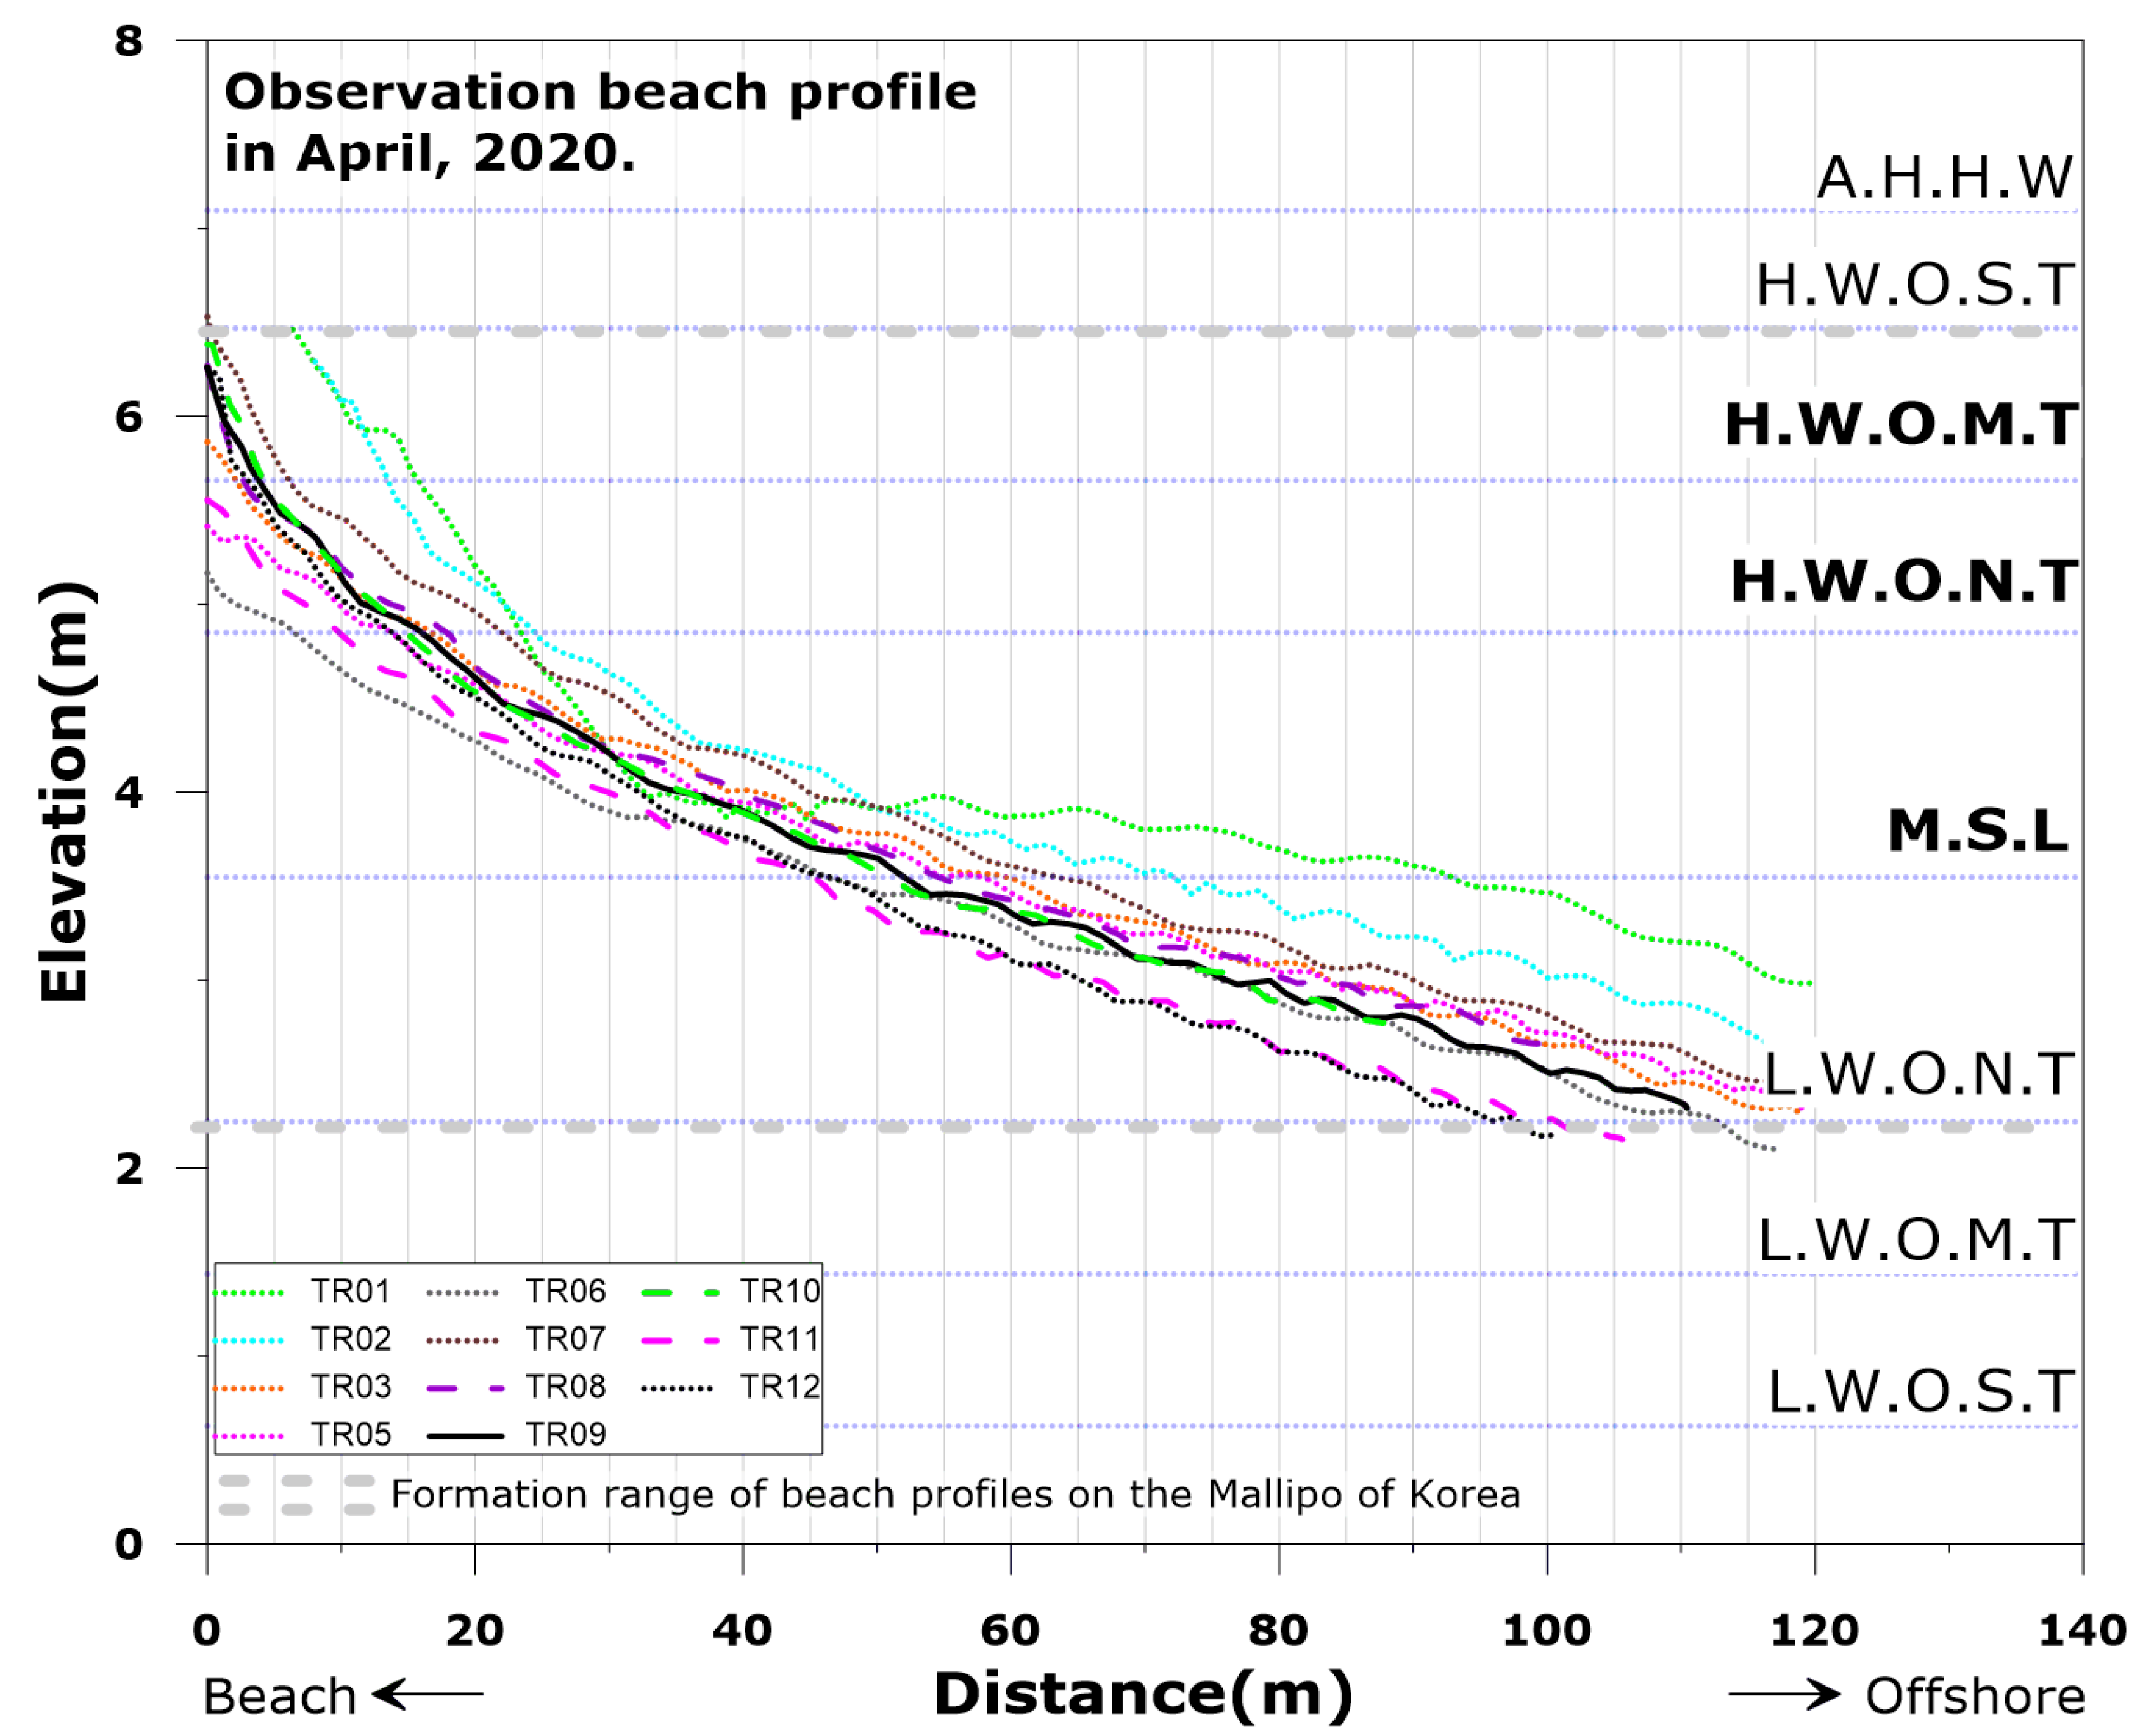
The Figure 4 presents the merged beach profiles of all transects surveyed in April 2020. Mallipo Beach is entirely backed by coastal revetments, and due to long-term erosional trends, the beach width based on higher tidal datums—such as A.H.H.W and H.W.O.S.T—recorded zero beach width values, as the shoreline had receded landward, leaving no measurable sandy area. On the contrary, measurements under lower tidal levels—such as L.W.O.M.T, L.W.O.S.T, and A.L.L.W—were often infeasible because the corresponding sections of the beach remained submerged during the survey period.
To ensure consistency and data reliability, this study selected three tidal reference levels—H.W.O.M.T, H.W.O.N.T, and M.S.L—as primary benchmarks for beach width calculation, since these levels yielded complete datasets across most transects.
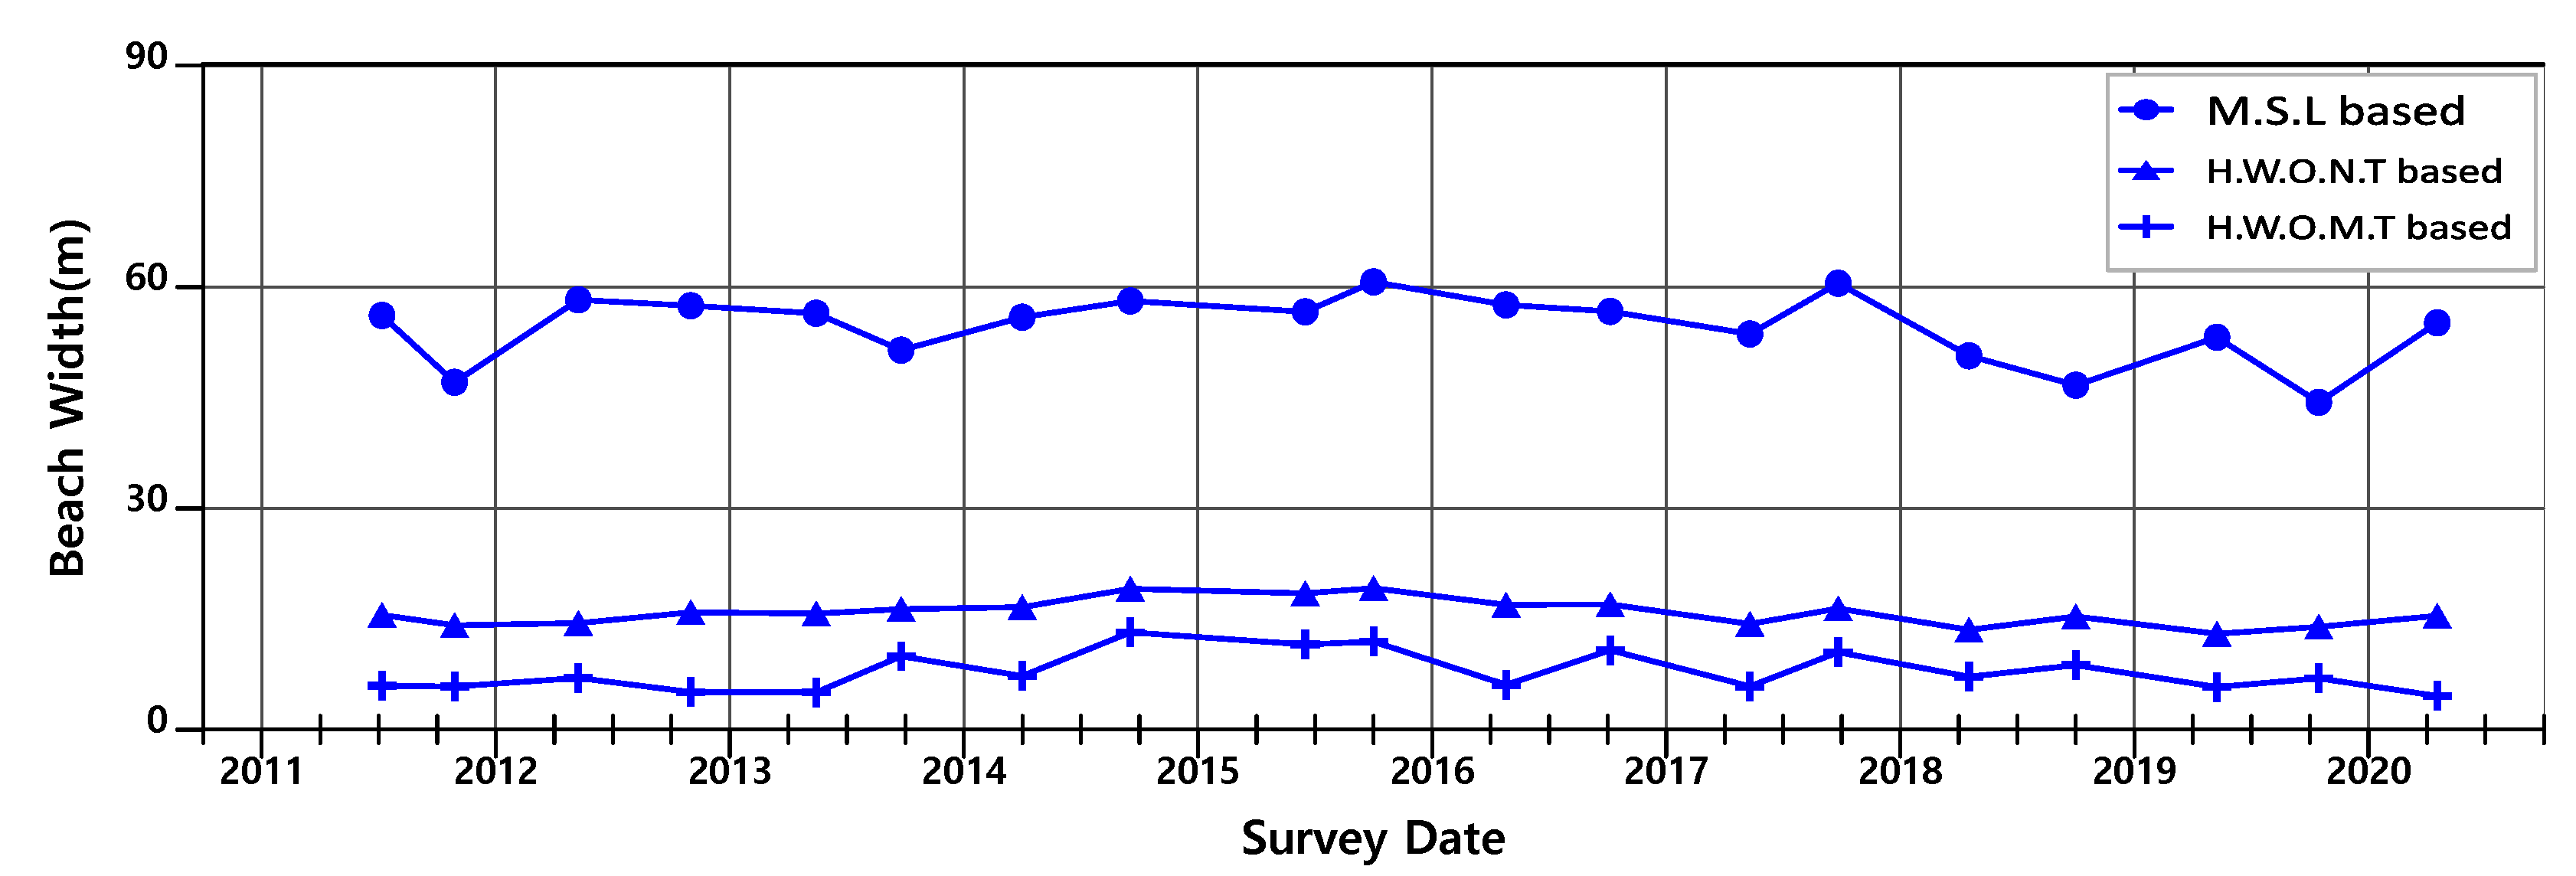
A time-series analysis was performed on beach width data from 2011 onward for each of the three tidal levels, as shown in Figure 5. The temporal patterns revealed alternating episodes of erosion and sedimentation, indicating dynamic morphological adjustments in the beach profile. These fluctuations were evident regardless of the tidal reference used, supporting the conclusion that Mallipo Beach maintains a general state of morphodynamic equilibrium despite ongoing erosional stress.
Table 3 presents the statistical summary of beach width across all transects for the selected tidal levels. Among the three, the beach width referenced to M.S.L exhibited the largest standard deviation, suggesting the greatest variability and sensitivity. This was followed by H.W.O.M.T and then H.W.O.N.T, implying that mean sea-level-based shoreline positions are more responsive to short-term environmental forces such as storm surges and seasonal wave changes.
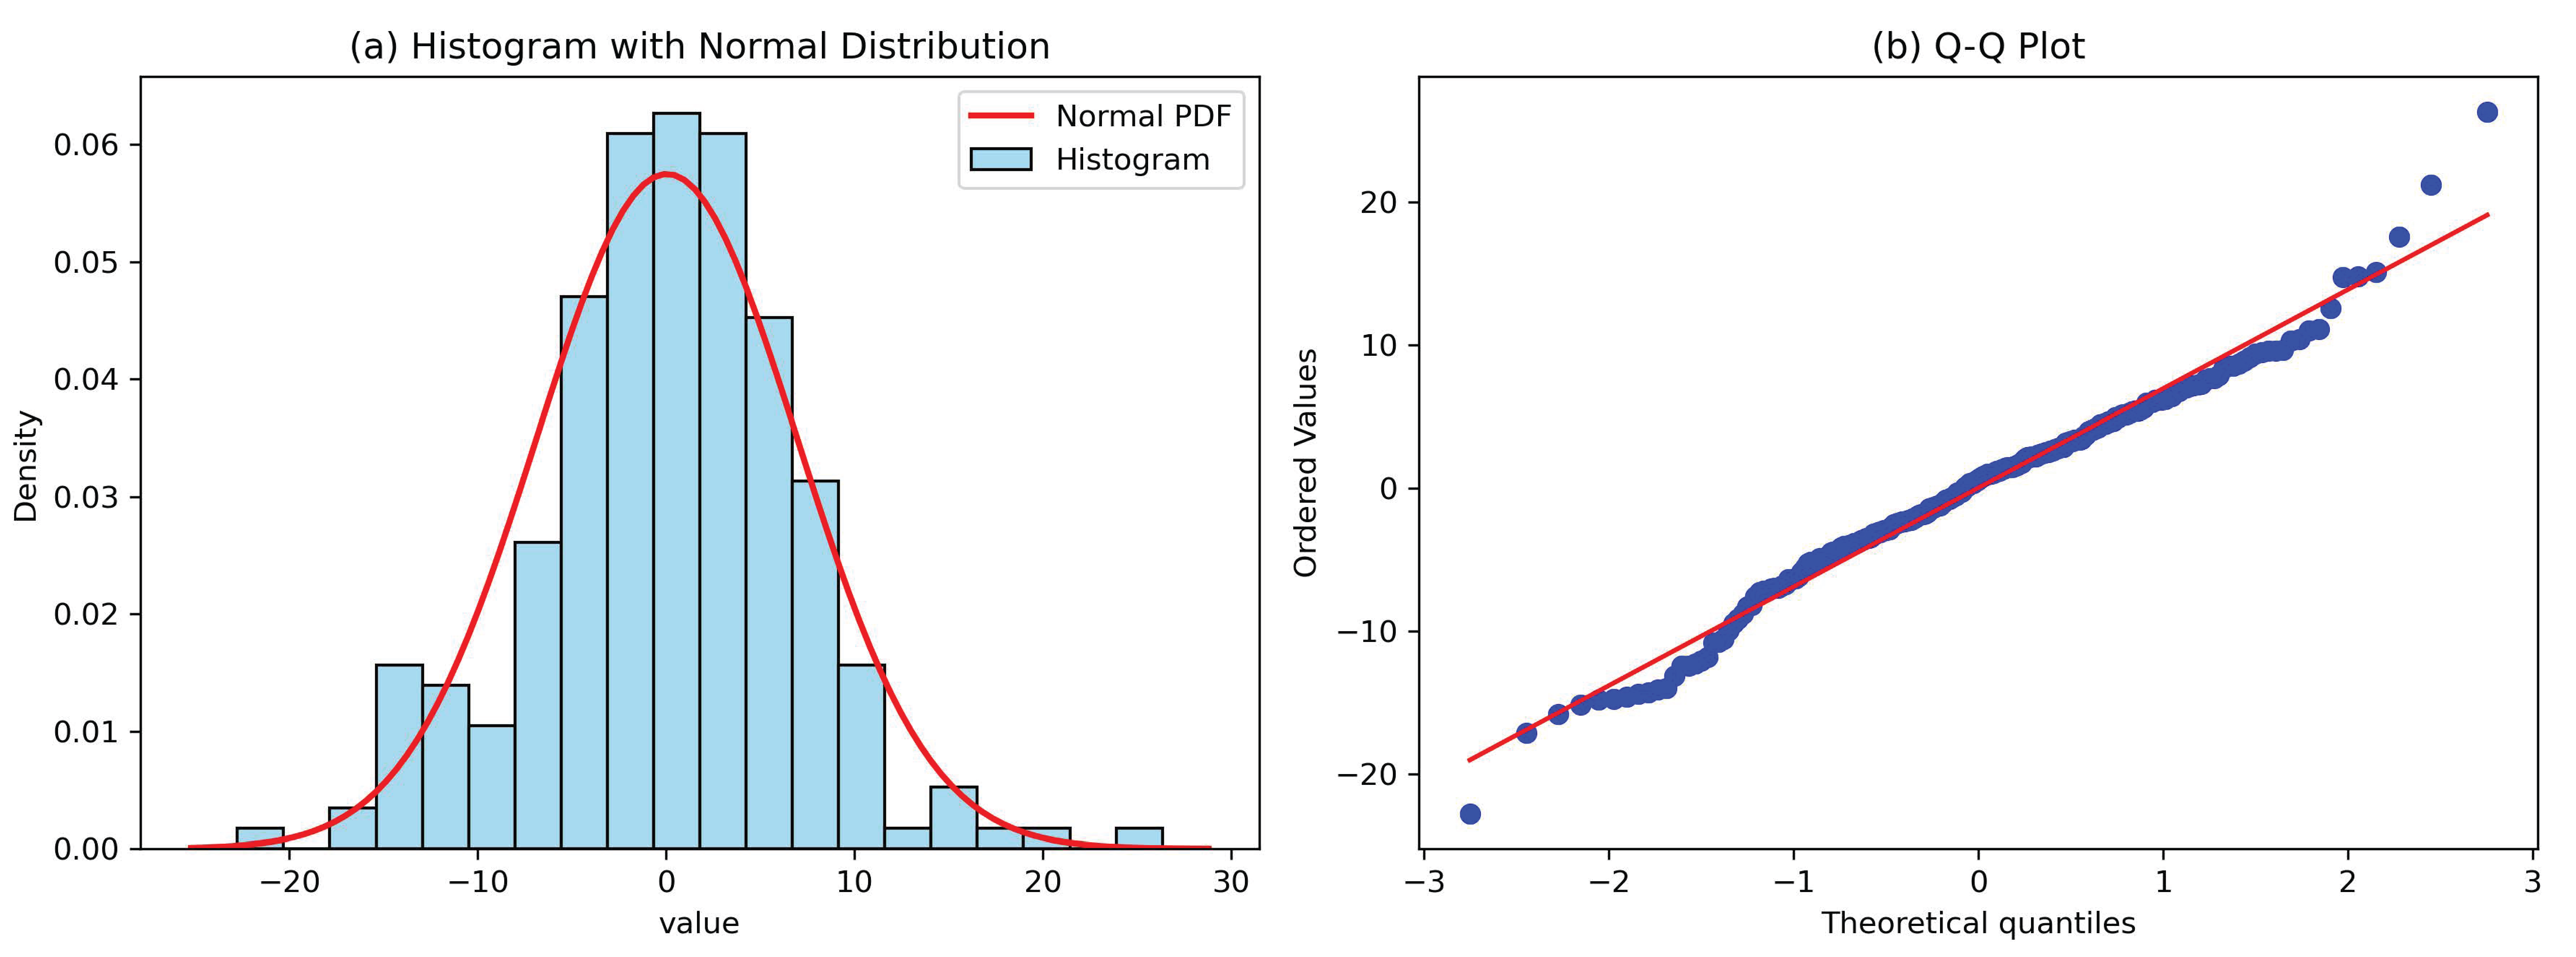
The Chi-squared test result indicated that the normality hypothesis was not rejected at the 5% significance level, suggesting that the M.S.L-based beach width measurements can be reasonably approximated by a normal distribution. This validation supports the use of parametric approaches in estimating return-period widths and determining the ECL. Figure 6a visualizes the distribution of the data using a histogram and overlays a normal distribution curve with the same mean and variance for comparison. Figure 6b presents a Q-Q plot constructed to assess the normality of the data.
Table 4, Table 5 and Table 6 present the calculated erosion widths corresponding to the 30-year return period, based on three tidal reference levels: High Water Ordinary Mean Tide (H.W.O.M.T), High Water Ordinary Neap Tide (H.W.O.N.T), and Mean Sea Level (M.S.L). These values were derived using statistical analysis based on shoreline survey data collected from 2009 to 2020.
Transect No. 4 is located in a rocky coastal area, not within the primary focus area of the study, which is sandy beach environments. The presence of protruding rocky topography led to persistent zero-width values at both H.W.O.N.T and H.W.O.M.T over the entire survey period. These values are not indicative of natural beach variability, but rather reflect a fundamentally different shoreline type. For this reason, transect No. 4 was excluded from the H.W.O.M.T- and H.W.O.N.T-based analyses.
The results reveal that 9 out of 11 transects under the H.W.O.M.T reference level and 2 transects under the H.W.O.N.T level yielded negative values for the 30-year return period beach width. These negative values suggest that erosion is so severe that the historical shoreline position is expected to retreat beyond the defined tidal reference point, indicating a critical level of coastal vulnerability in these sections.
Interestingly, for Transect No. 4, where calculations were not possible under H.W.O.M.T and H.W.O.N.T, the M.S.L-based calculation was possible. However, even under this tidal benchmark, the 30-year return period beach width was also derived as a negative value, reinforcing the erosional risk at this specific location.
In order to propose a TLEP that can serve as a development regulation boundary, this study selected H.W.O.N.T as the representative tidal reference level. This tidal level was chosen because it corresponds to a high tide condition that occurs at least twice a day throughout the year and reflects the realistic boundary of frequent inundation under typical tidal conditions.
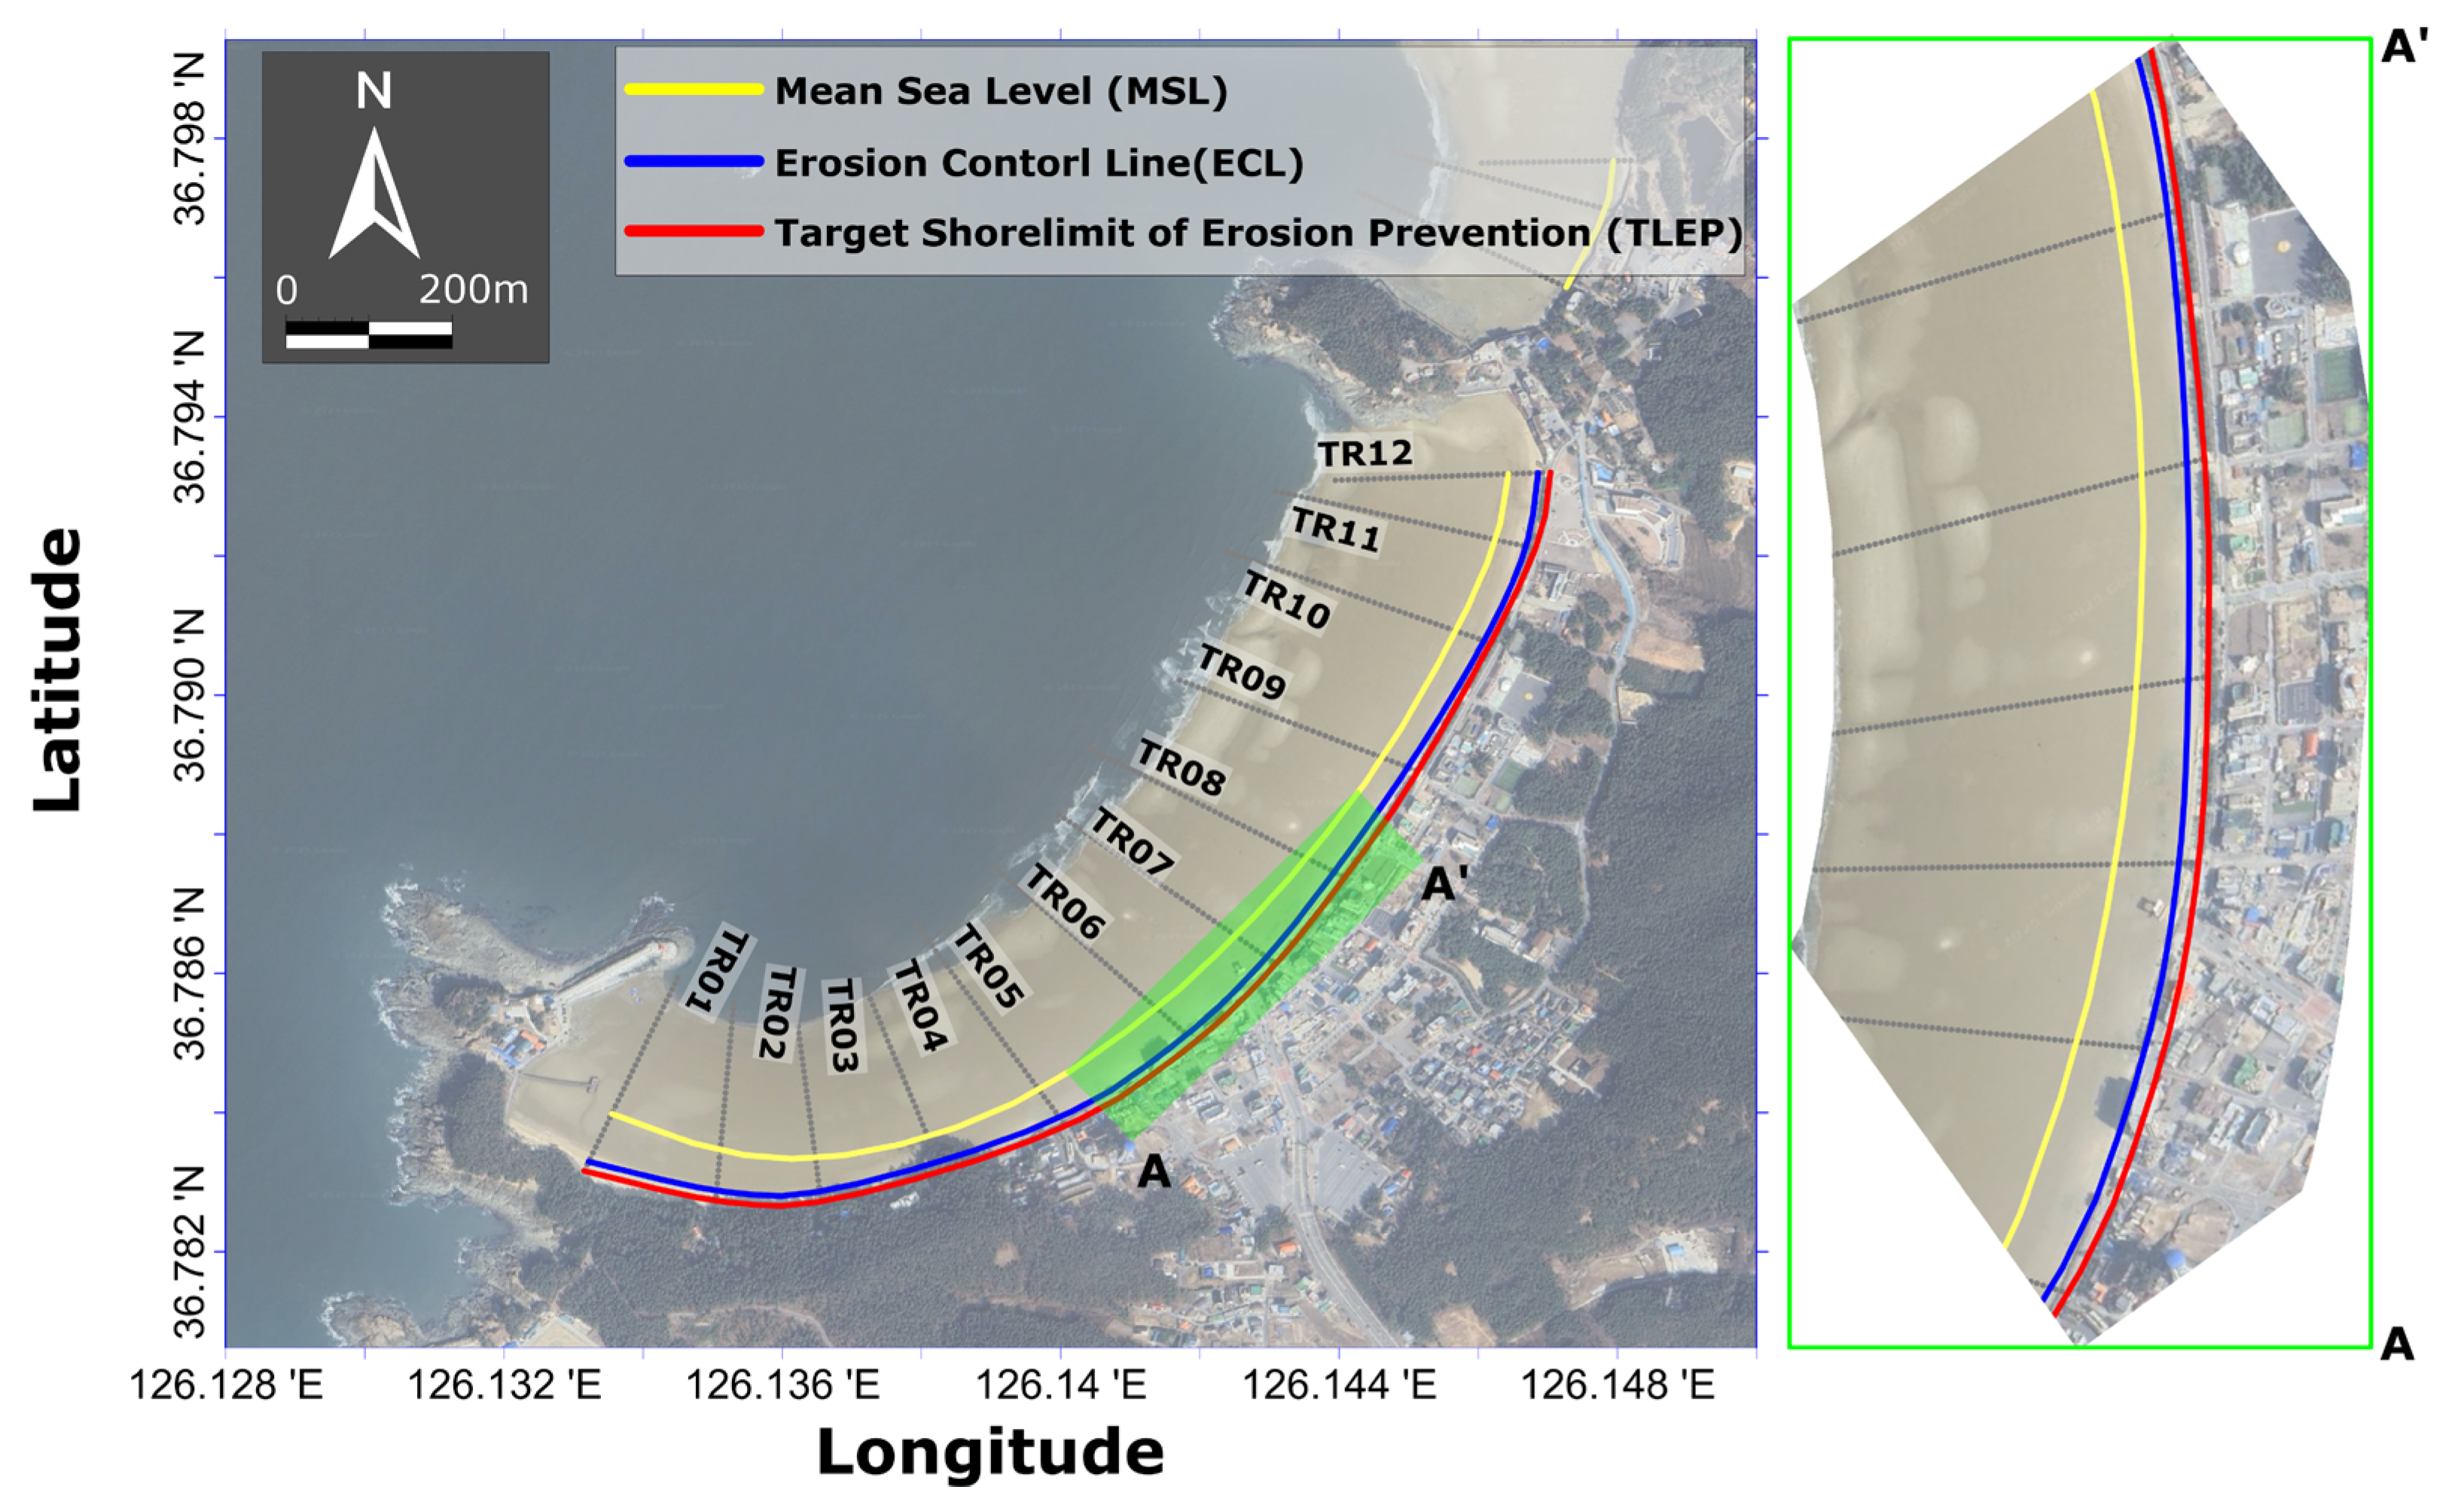
To define the buffer zone for the TLEP, the average beach width at H.W.O.N.T was adopted as the setback distance. This average was calculated as 16 m based on the long-term survey data (Figure 7). Thus, the TLEP was determined by retreating inland by 16 m from the shoreline corresponding to H.W.O.N.T.
However, the analysis results showed that the 30-year return period beach width, and even the average beach width, were negative at all transects under the H.W.O.N.T level, implying that the active shoreline has already retreated inland beyond this reference point. This means that all transects fall within the high-risk erosion zone and that any development in these areas would be directly exposed to coastal hazards. Therefore, the implementation of strict development controls and the enforcement of retreat policies in all transects is deemed necessary.
These findings emphasize the urgent need for coastal spatial planning that reflects empirical erosion dynamics, particularly in macro-tidal environments like Mallipo Beach. The use of statistically derived setback distances based on multiple tidal reference levels ensures that the ECL and TLEP are grounded in observable shoreline behavior, rather than arbitrary or fixed regulations.

4. Discussion

This study proposed a method to establish the Erosion Control Line (ECL) for Mallipo Beach by statistically analyzing long-term beach topographic data and estimating beach widths corresponding to a 30-year return period. By utilizing the average (μ) and standard deviation (σ) of shoreline changes over time, the analysis captures both the central tendency and variability of beach width evolution. The average value reflects the dominant trend of shoreline retreat or accretion, while the standard deviation indicates the magnitude of temporal fluctuation and can, thus, serve as a proxy for shoreline sensitivity to external forcing.
One of the unique aspects of this study is the application of multiple tidal reference levels—H.W.O.M.T, H.W.O.N.T, and M.S.L.—to derive multiple ECLs, providing nuanced insight into how erosion risk may vary depending on tidal conditions. This multi-level approach is particularly valuable in macro-tidal environments like Korea’s west coast, where tidal range significantly influences sediment dynamics, inundation patterns, and visible shoreline positions.
Notably, the analysis revealed that certain transects along Mallipo Beach have already experienced erosion, to the point where the 30-year return period beach width becomes negative, indicating that the sandy beach has effectively disappeared in these sections. This suggests that infrastructure and assets in the hinterland, such as roads and recreational zones, are highly exposed to direct wave impact during extreme weather events.
When the H.W.O.N.T-based ECL was applied as a proxy for defining the TLEP, it was discovered that numerous built-up areas fall within the designated erosion hazard zone, including residential facilities and tourist amenities. This underscores a significant policy gap in South Korea, where spatial buffers between the active beach zone and infrastructure are currently insufficient or non-existent. Countries such as the United States [7], Australia [15], and members of the European Union [16] have addressed similar issues by implementing legally enforceable setback zones to regulate coastal development, and the findings of this study strongly support the adoption of a similar policy framework in Korea.
From a governance standpoint, the introduction of the ECL offers multiple benefits. It can serve as a basis for zoning ordinances, insurance premium calculations, infrastructure placement decisions, and climate change adaptation planning at the municipal level. The fine-scale spatial insights derived from long-term shoreline data can support decision-making in the context of Integrated Coastal Zone Management (ICZM) [20,34].
However, the present study also has some methodological limitations. While the use of statistical return period analysis adds rigor, the approach focuses solely on shoreline movement across three tidal levels in the macro-tidal zone for coastal erosion management purposes, leaving out other morphodynamic variables of the intertidal zone, such as beach volume change, changes in sediment particle size, or nearshore bathymetry. These additional parameters would provide a more comprehensive understanding of coastal processes, especially during extreme conditions such as typhoons or sea-level anomalies [35].
Moreover, this study did not integrate wave climate data, including significant wave height, wave directionality, or storm surge recurrence. Such parameters play a critical role in determining sediment transport dynamics, and future research should explore coupling statistical shoreline analyses with numerical models such as SBEACH, XBeach, or DELFT3D to enhance the predictive capacity and physical accuracy of the ECL [36].
Finally, the integration of socio-economic vulnerability assessments—including asset exposure, land value, and population density—would enable policymakers to prioritize high-risk zones for managed retreat, structural defense, or ecosystem-based adaptation measures. This interdisciplinary approach has proven successful in European and Australian contexts and can be tailored to Korea’s policy landscape [31,32].

5. Conclusions

This study proposed a practical and statistically robust method for determining Erosion Control Lines (ECLs) and Target shoreLimit of Erosion Prevention (TLEP) tailored to Korea’s macro-tidal coastal environments. By analyzing historical shoreline changes and applying probabilistic thresholds, the method effectively captures spatial variability in shoreline retreat while minimizing overestimation in low-erosion zones. The approach also enhances transparency and replicability in setting coastal management boundaries, providing a scientifically grounded alternative to fixed buffer distances or overly conservative estimations. In conclusion, this study fills a significant research and policy gap regarding coastal erosion management in Korea’s macro-tidal zones by proposing a statistically sound and practically applicable method for defining ECL and TLEP. While improvements can be made through the inclusion of physical and socio-economic variables, the current framework presents a valuable foundation for evidence-based coastal planning and resilience building.

Author Contributions

Conceptualization, S.-M.H. and J.-L.L.; methodology, S.-M.H. and J.-L.L.; validation, H.-J.Y. and K.-H.K.; investigation, K.-H.K.; resources, K.-H.K. and T.-S.K.; data curation, H.-J.Y. and S.-M.H.; writing—original draft preparation, S.-M.H.; writing—review and editing, S.-M.H., H.-J.Y., T.-S.K. and J.-L.L.; visualization, S.-M.H. and H.-J.Y.; supervision, J.-L.L.; project administration, T.-S.K. All authors have read and agreed to the published version of the manuscript.

Funding

This research was supported by the Korea Institute of Marine Science and Technology Promotion (KIMST), funded by the Ministry of Oceans and Fisheries (RS-2023-00256687).

Data Availability Statement

The data presented in this study are available in article.

Acknowledgments

The authors gratefully appreciated the Korea Institute of Marine Science and Technology Promotion (KIMST) funded by the Ministry of Oceans and Fisheries (RS-2023-00256687).

Conflicts of Interest

Authors Soon-mi Hwang, Ho-Jun Yoo, Tae-Soon Kang, and Ki-Hyun Kim were employed by Geosystem Research Corp. The remaining authors declare that the research was conducted in the absence of any commercial or financial relationships that could be construed as potential conflicts of interest.

References

  1. Bijlsma, L.; Ehler, C.N.; Klein, R.J.T.; Kulshrestha, S.M.; McLean, R.F.; Mimura, N.; Nicholls, R.J.; Nurse, L.A.; Perez Nieto, H.; Stakhiv, E.Z.; et al. Coastal Zones and Small Islands. In Impacts, Adaptations and Mitigation of Climate Change: Scientific-Technical Analyses; Watson, R.T., Zinyowera, M.C., Moss, R.H., Eds.; Cambridge University Press: Cambridge, UK, 1996; pp. 289–324. [Google Scholar]
  2. Muzirafuti, A.; Cascio, M.; Lanza, S.; Randazzo, G. UAV photogrammetry-based mapping of pocket beaches in the Isola Bella Bay, Taormina (Eastern Sicily). In Proceedings of the 2021 IEEE International Workshop on Metrology for the Sea: Learning to Measure Sea Health Parameters (MetroSea), Reggio Calabria, Italy, 4–6 October 2021; pp. 418–422. [Google Scholar]
  3. Toumasi, P.; Petropoulos, G.P.; Detsikas, S.E.; Kalogeropoulos, K.; Tselos, N.G. Assessing the Impact of Climate Change on Coastal Vulnerability in the Arctic Coasts of Tromsø, Norway. Earth 2024, 5, 640–653. [Google Scholar] [CrossRef]
  4. Lim, C.; Kim, T.K.; Lee, S.; Yeon, Y.J.; Lee, J.L. Assessment of potential beach erosion risk and impact of coastal zone development: A case study on Bongpo–Cheonjin Beach. Nat. Hazards Earth Syst. Sci. 2021, 21, 3827–3842. [Google Scholar] [CrossRef]
  5. United Nations. Agenda 21—Chapter 17: Protection of the Oceans, All Kinds of Seas, Including Enclosed and Semi-Enclosed Seas, and Coastal Areas and the Protection, Rational Use and Development of Their Living Resources. Available online: https://www.un.org/depts/los/consultative_process/documents/A21-Ch17.htm (accessed on 8 September 2025).
  6. Karditsa, A.; Poulos, S.E. Socio economic risk assessment of the setback zone in beaches threatened by sea level rise induced retreat (Peloponnese coast–Eastern Mediterranean). Anthr. Coasts 2024, 7, 25. [Google Scholar] [CrossRef]
  7. Dastgheib, A.; Jongejan, R.; Wickramanayake, M.; Ranasinghe, R. Regional Scale Risk Informed Land Use Planning Using Probabilistic Coastline Recession Modelling and Economical Optimisation: East Coast of Sri Lanka. J. Mar. Sci. Eng. 2018, 6, 120. [Google Scholar] [CrossRef]
  8. Taveira Pinto, F.; Henriques, R.; Rosa Santos, P.; Fazeres Ferradosa, T.; das Neves, L.; Sarmento, M.F. Hazard Mapping Based on Observed Coastal Erosion Rates and Definition of Set Back Lines to Support Coastal Management Plans in the North Coast of Portugal. J. Integr. Coast. Zone Manag. 2022, 22, 225–239. [Google Scholar] [CrossRef]
  9. Inter-American Development Bank. Coastal Setbacks in Latin America and the Caribbean: A Study of Emerging Issues and Trends that Inform Guidelines for Coastal Planning and Development. Available online: https://webimages.iadb.org/publications/english/document/Coastal-Setbacks-in-Latin-America-and-the-Caribbean-A-Study-of-Emerging-Issues-and-Trends-that-Inform-Guidelines-for-Coastal-Planning-and-Development.pdf (accessed on 8 September 2025).
  10. NOAA. A Report of the National Coastal Zone Management Program: Protecting the Public Interest Through the National Coastal Zone Management Program: How Coastal States and Territories Use No-Build Areas along Ocean and Great Lake Shorefronts; National Oceanic and Atmospheric Administration: Silver Spring, MD, USA, 2012. [Google Scholar]
  11. American Samoa Bar Association. Coastal Hazards (26.0223). Available online: https://asbar.org/regulation/26-0223-coastal-hazards/ (accessed on 8 September 2025).
  12. Commonwealth of the Northern Mariana Islands (CNMI) Coastal Resources Management Office. Shoreline Setback Rules and Regulations; Commonwealth of the Northern Mariana Islands (CNMI) Coastal Resources Management Office: Saipan, Northern Mariana Islands, 2010. [Google Scholar]
  13. Bureau of Statistics and Plans, Government of Guam. Bluff Recession and Setback Act and Coastal Management Guidelines. Available online: https://bsp.guam.gov/wp-bsp-content/uploads/govarchieve/G10-12.118.pdf (accessed on 8 September 2025).
  14. Michigan Department of Environment, Great Lakes, and Energy (EGLE). Michigan Administrative Code R.281.22—High Risk Erosion Areas. Available online: https://www.law.cornell.edu/regulations/michigan/Mich-Admin-Code-R-281-22 (accessed on 12 September 2025).
  15. Pennsylvania Department of Environmental Protection. Bluff Recession and Setback Act (32 P.S. §§ 5201–5215) and Regulations; Pennsylvania Department of Environmental Protection: Harrisburg, PA, USA, Enacted 13 May 1980; Amended 7 July 2011 (Act 72). Available online: https://www.pacodeandbulletin.gov/Display/pacode?file=/secure/pacode/data/025/chapter85/chap85toc.html&d=reduce (accessed on 12 September 2025).
  16. National Oceanic and Atmospheric Administration (NOAA), Office for Coastal Management. Puerto Rico Coastal Zone Management Program: Final Evaluation Findings; U.S. Department of Commerce: Silver Spring, MD, USA, 2015. Available online: https://coast.noaa.gov/data/czm/media/puertorico-cmp.pdf (accessed on 12 September 2025).
  17. Florida Department of Environmental Protection. Coastal Construction Control Line Program. Available online: https://floridadep.gov/rcp/coastal-construction-control-line (accessed on 12 September 2025).
  18. Bruun, P. Sea-Level Rise as a Cause of Shore Erosion. J. Waterw. Harbors Div. 1962, 88, 117–130. [Google Scholar] [CrossRef]
  19. Stockdon, H.F.; Holman, R.A.; Howd, P.A.; Sallenger, A.H. Empirical parameterization of setup, swash, and runup. Coastal Eng. 2006, 53, 573–588. [Google Scholar] [CrossRef]
  20. Western Australian Planning Commission (WAPC). Coastal Planning and Management Manual: A Community Guide for Protecting and Conserving Western Australia’s Coastline; Government of Western Australia: Perth, Australia, 2003. [Google Scholar]
  21. EU CONSCIENCE Project. On the Use of Setback Lines for Coastal Protection in Europe and the Mediterranean: Practice, Problems and Perspectives; EU FP6 Integrated Project CONSCIENCE; EU: Brussels, Belgium, 2010. [Google Scholar]
  22. Ministry of Natural Resources of the People’s Republic of China. Technical Guidance for Implementing Coastal Setback Line; Ministry of Natural Resources: Beijing, China, 2021. [Google Scholar]
  23. Korea Hydrographic and Oceanographic Agency (KHOA). Coastal Disaster Vulnerability Assessment System; Ministry of Oceans and Fisheries: Busan, Republic of Korea, 2015. [Google Scholar]
  24. Yoo, Y.-J.; Moon, Y.-H.; Park, W.-K. An Empirical Study on the Setting and Evaluation Method of the Controlled Coastlines according to the Hard Defense of Coastal Improvement Project. J. Coast. Disaster Prev. 2022, 9, 1–11. [Google Scholar] [CrossRef]
  25. Park, S.M.; Park, S.H.; Lee, J.L.; Kim, T.-G. Erosion Control Line (ECL) Establishment Using Coastal Erosion Width Prediction Model by High Wave Height. J. Ocean Eng. Technol. 2019, 33, 526–534. [Google Scholar] [CrossRef]
  26. Jeong, S.-H.; Heo, K.-Y.; Son, J.-H.; Jo, Y.-H.; Choi, J.-Y.; Kwon, J.-I. Characteristics of Swell-like Waves in the East Coast of Korea Using Atmospheric and Wave Hindcast Data. Atmosphere 2022, 13, 286. [Google Scholar] [CrossRef]
  27. Koh, C.-H.; Khim, J.S. The Korean tidal flat of the Yellow Sea: Physical setting, ecosystem and management. Ocean Coast. Manag. 2014, 102, 398–414. [Google Scholar] [CrossRef]
  28. Korea Hydrographic and Oceanographic Agency (KHOA). Ocean Observation Data Service (Ocean Grid). Available online: http://www.khoa.go.kr/oceangrid/gis/category/observe/observeSearch.do?type=EYS (accessed on 14 July 2025).
  29. Oh, S.-H.; Jeong, W.-M.; Kim, S.-I. Analysis of the observation data for winter-season high waves occurred in the West Sea of Korea. J. Korean Soc. Coast. Ocean Eng. 2015, 27, 168–174. [Google Scholar] [CrossRef]
  30. Ministry of Oceans and Fisheries (MOF). 2019 Coastal Erosion Monitoring Report; MOF: Sejong, Republic of Korea, 2019. [Google Scholar]
  31. Ministry of Land, Infrastructure, Transport and Tourism (MLIT), Japan. Design Guidelines for Coastal Structures Based on Return Periods; MLIT: Tokyo, Japan, 2015. [Google Scholar]
  32. European Commission. European Code of Practice for Coastal Structures and Setback Design Standards; European Commission: Brussels, Belgium, 2012. [Google Scholar]
  33. Ministry of Oceans and Fisheries (MOF). Coastal Facility Design Standards and Explanation; MOF: Sejong, Republic of Korea, 2016. [Google Scholar]
  34. Kay, R.; Alder, J. Coastal Planning and Management, 2nd ed.; Routledge: London, UK, 2005. [Google Scholar]
  35. Cowell, P.J.; Thom, B.G. Morphodynamics of Coastal Evolution. In Handbook of Coastal and Ocean Engineering; Kim, Y.C., Ed.; World Scientific: Singapore, 2009; pp. 303–330. [Google Scholar]
  36. Roelvink, D.; Reniers, A. A Guide to Modeling Coastal Morphology; World Scientific: Singapore, 2012. [Google Scholar]
Figure 1. (a) Tide characteristics (observation location: Anheung), (b) wave climate (significant wave height— H s , peak wave period— T p , and wave direction) (observation location: Heukdo).
Jmse 13 01784 g001
Figure 2. Location of Mallipo Beach and wave/tidal station (Image source: Google Earth).
Jmse 13 01784 g002
Figure 3. Transect information and construction timeline of major coastal structures at Mallipo Beach.
Jmse 13 01784 g003
Figure 4. Beach profile example and tidal levels.
Jmse 13 01784 g004
Figure 5. 3 Time series of average beach width fluctuations for each tidal level.
Jmse 13 01784 g005
Figure 6. (a) Data histogram with normal distribution curve, (b) Q-Q plot of beach width data.
Jmse 13 01784 g006
Figure 7. ECL and TLEP of Mallipo Beach based on H.W.O.N.T.
Jmse 13 01784 g007
Table 1. Criteria for setting the no-building area by U.S. states [11,12,13,14,15,16,17].
RegionApplicable
Terrain
Details
SamoaBeach, bluffs, rocky shores
Within 200 feet from the mean high tide toward the land
Marian
Islands
Beach, bluffs, rocky shores
Within 75 feet from the mean high tide
Between 75 ft and 100 ft from mean high water for 12 feet or less single-story buildings
Within 100 feet for other structures
GuamBeach, bluffs, rocky shores
Within 35 feet from the mean high tide
within 75 feet from the mean high tide for Structures > 20 feet high
MichiganBeach, dunes, bluffs, rocky shores
Small structures: 30× erosion rate + 15 feet
Other structures: 60× erosion rate +15 feet
PennsylvaniaBeach, bluffs
Structure life span (residential area 50, commercial area 75, industrial area 100) × erosion rate
Puerto RicoBeach, dunes, bluffs, rocky shores
Selection of greater value between 50 m based on high tide, or 2.5 times the height of structure
FloridaBeach, dunes
Construction bans on major structures within the erosion line at 30-year return period
Erosion area: 30× erosion rate
Area without erosion: 30 feet
Table 2. Definition of control line [24].
CategoryDefinition
Coastal control line for coastal managementMean Target Shoreline (MTS)Shoreline for the purpose of conservation of sand beach (average shoreline before development)
Erosion Prevention Line (EPL)EPL for the purpose of protecting the hinterland infrastructures
Performance evaluation of coastal control lineEquilibrium Shoreline (ESL)Equilibrium shoreline that varies depending on changes in watershed and coastal environments
Erosion Control Line (ECL)ECL at 30-year return period according to high waves (shoreline that varies depending on wave environment)
Table 3. Beach width statistical analysis based on three tidal levels.
ClassificationH.W.O.M.TH.W.O.N.TM.S.L
Average Position(m)7.8715.8754.56
Standard Deviation(m)2.661.784.61
Table 4. H.W.O.M.T-based analysis of beach width.
Transect No.Average Position (m)Standard Deviation (m)30-Year Return Period
Erosion Width (m)
115.882.8910.81
215.672.488.63
36.073.2812.26
54.053.9614.83
60.932.057.66
710.745.1819.37
810.044.3616.33
99.313.6013.46
107.803.7614.06
116.614.7117.62
1210.774.4816.77
Table 5. H.W.O.N.T-based analysis of beach width.
Transect No.Average Position (m)Standard Deviation (m)30-Year Return Period
Erosion Width (m)
123.282.218.27
224.242.499.47
316.363.3512.54
513.623.8514.41
66.514.2415.85
722.323.8514.42
819.482.228.31
918.062.107.85
1016.302.408.96
1114.663.8314.32
1219.853.7213.91
Table 6. MSL-based analysis of beach width.
Transect No.Average Position (m)Standard Deviation (m)30-Year Return Period
Erosion Width (m)
196.776.0022.45
279.246.5824.61
362.836.3323.67
46.303.4312.84
557.035.8621.92
649.695.5820.90
761.657.1026.56
852.4210.1537.97
945.428.2330.80
1047.498.3331.15
1142.337.8929.53
1244.807.1026.57
Disclaimer/Publisher’s Note: The statements, opinions and data contained in all publications are solely those of the individual author(s) and contributor(s) and not of MDPI and/or the editor(s). MDPI and/or the editor(s) disclaim responsibility for any injury to people or property resulting from any ideas, methods, instructions or products referred to in the content.