Article

Morphodynamic of Tidal Flat Profiles in an Erosion-to-Accretion Transitional Coastal Segment Under Wave–Current Interaction: A Case Study of Dafeng Port, China

1
School of Marine Science and Engineering, Nanjing Normal University, Nanjing 210023, China
2
Coastal Zone Resources and Environment Engineering Research Center of Jiangsu Province, Nanjing 210023, China
3
Jiangsu Key Laboratory of Coast Ocean Resources Development and Environmental Security, Hohai University, Nanjing 210098, China
*
Authors to whom correspondence should be addressed.
J. Mar. Sci. Eng. 2025, 13(9), 1746; https://doi.org/10.3390/jmse13091746
Submission received: 4 August 2025 / Revised: 8 September 2025 / Accepted: 9 September 2025 / Published: 10 September 2025

Abstract

Understanding the morphodynamic evolution of muddy coasts under complex wave–tidal forcing is crucial for effective coastal management, particularly under the unstable hydrodynamic conditions associated with global climate change. This study employs a one-dimensional Delft3D model to investigate a tidal flat north of Dafeng Port, Jiangsu Province, China, validated with multi-year profile measurements. Under typical conditions, the profile consistently exhibits upper-flat accretion and lower-flat erosion, with threshold values of Hs ≈ 1.2 m and Tp ≈ 4.5 s triggering nonlinear bed-level changes. During storm tides, the profile displays a distinct upper flood-tide and lower ebb-tide response. Long-term simulations suggest that the profile will likely reach dynamic equilibrium by 2026. Overall, this study demonstrates the capability of one-dimensional modeling to capture nonlinear tidal flat evolution and provides valuable insights into the spatially variable morphodynamics of muddy coasts for adaptive management.

1. Introduction

Globally, muddy coasts account for about 14% of ice-free shorelines—mostly in the tropics [1]—and roughly 70% of tidal flats are concentrated on three continents (Asia 44%, North America 15.5%, and South America 11%), with nearly half (49.2%) located in just eight countries: Indonesia, China, Australia, the United States, Canada, India, Brazil, and Myanmar [2]. Muddy coastal morphology is strongly influenced by sea-level rise, waves, tides, currents, storm surges, and human activities. These factors drive alternating accretion and erosion, resulting in reduced shoreline stability and a gradual decline in global tidal flat area [3,4].
Previous studies have shown that tidal flat morphodynamics are commonly analyzed within the framework of equilibrium profile theory, which posits that under constant hydrodynamic conditions, morphology evolves toward a stable state [5]. For instance, Kirby [6] emphasized the relative stability of cross-shore profiles bounded by high and low water levels, while Pieterse et al. [7] highlighted the role of bed shear stress in predicting morphological change. Building on this insight, Wei et al. [8] further generalized profile structures by incorporating estuarine convergence effects. Overall, equilibrium profile theory has been widely applied in numerical models to investigate tidal flat evolution, particularly with respect to tidal parameters, sediment transport, and coastline adjustment [9,10].
Accreting tidal flats generally exhibit high, convex cross-shore profiles, whereas erosional flats are characterized by low, concave shapes [6]. Their long-term evolution is significantly influenced by sea-level rise. Slow sea-level rise promotes wave energy dissipation and sediment accumulation, thereby facilitating the seaward expansion of salt marshes. In contrast, rapid sea-level rise intensifies wave-induced erosion, potentially causing marsh retreat or degradation into bare tidal flats [11]. Such artificially expanded bare flats have been notably observed after the recent S. alterniflora eradication project in Jiangsu Province [12]. Relevant studies demonstrate that S. alterniflora-vegetated zones exhibit significant coastal protection functions: Chen et al. [13] confirmed that their wave attenuation capacity enhances with increasing water depth, with net alongshore sediment transport during flood tides being up to six times greater than during ebb tides; while Wang et al. [14] recorded sedimentation rates of 3–8 cm/yr in these areas. Beyond these bio-physical interactions, the inherent morphodynamics of tidal flats are governed by coupled hydro-sedimentary processes. Under the coupled influence of hydrodynamics and sediment transport, tidal flats typically exhibit a cross-shore zonation of sandy, mixed, and silty zones. The landward or seaward migration of these zones is primarily driven by mean tidal level variations and serves as an indicator of tidal flat sedimentary dynamics [15]. In long-term morphodynamic studies, accurately identifying the transition depth between erosional and non-erosional zones is crucial. When tidal flats consist entirely of cohesive sediments and external sediment supply is interrupted, vertical accretion ceases and coastline retreat commences. In such cases, wave action becomes the dominant driver of slope evolution, gradually overriding tidal influences [16]. During storm events, the middle and lower parts of the intertidal zone often undergo intense scouring and rapid tidal creek migration, primarily driven by increased water velocities and enhanced wave energy induced by storm surge [17]. Although regular tides and moderate waves cause relatively minor short-term disturbance, their cumulative effects over time may far exceed initial expectations [18].
Global climate change and rising sea levels have made the study of wave–tide impacts on muddy coastal profiles a central research focus. The typical muddy tidal flats of central Jiangsu have shown a transition from overall accretion to erosion in recent years. Although regional sediment supply is gradually declining, a residual replenishment capacity persists. In the nearshore shallow zones, erosion–deposition responses driven by various hydrodynamic factors exhibit pronounced spatial and temporal variability. However, current understanding of the segmental morphodynamic response of tidal flat profiles under wave–tide interactions remains limited. To better quantify these processes, this study employs Delft3D—a well-established, and flexible morphodynamic modeling platform. Delft3D has been widely applied and validated in complex sedimentary environments such as nearshore zones, estuaries, and deltas [19,20,21,22], and has accumulated a wealth of case studies in one-dimensional profile morphodynamic simulations [9,23,24,25]. Its modular architecture and parameter flexibility enable effective simulation of sediment transport and profile evolution under coupled wave–current dynamics. Moreover, a high-precision one-dimensional model can reduce computational costs, facilitating rapid prediction of profile erosion-deposition evolution over several decades.
In this study, a cross-shore tidal flat profile located approximately 1 km north of Dafeng Port, Jiangsu Province, is investigated numerically. The objectives are: (1) to reveal erosion–deposition mechanisms across different sections of the profile under varying wave and storm conditions; and (2) to predict its long-term morphodynamic evolution under prevailing hydrodynamics. The outcomes of this study contribute to systematically identifying erosion–deposition patterns along the profile, enhancing the understanding of how muddy tidal flats in Jiangsu may evolve under changing hydrodynamic conditions.

2. Materials and Methods

2.1. Study Area

Jiangsu’s tidal flat, a typical mud-dominated coast, has historically prograded seaward. However, the Yellow River’s avulsion in 1855 dramatically altered the regional sediment supply regime, causing tidal flats along the Jiangsu coast to shift from accretion to erosion, with over 20 km of retreat at the apex of the northern Yellow River Delta [26]. Over the past four decades, the central Jiangsu coast has generally shown upper-flat progradation but lower-flat retreat, accompanied by along-creek sandbar migration [27]. Between 1985 and 2002, significant accretion occurred from the Sheyang River estuary to Jianggang, with sediment transport predominantly directed southward [28]. Earlier studies identified the Sheyang–Dongzao sector as the critical transition zone [16], but recent findings suggest a southward shift toward Doulong Port [29]. More recent profile data (2017–2020) indicate that the transition has extended to the southern section of Dafeng Port [30]. This long-term shift from accretion to erosion underscores the need to quantify morphodynamic processes in this transitional zone under combined tidal and wave forcing.
Dafeng Port, a major harbor in Yancheng, central Jiangsu Province, lies on the western bank of the Xiyang Channel—the northernmost and deepest channel of the Jiangsu radial sand-ridge system. Situated between the tidal flats and the Dongsha Shoal, the channel opens seaward toward the north-northwest and is divided by the Yinsha and Piaosha sandbanks into eastern and western branches, with the eastern branch running parallel to the coastline. The channel reaches a maximum depth of ~10 m and width >5 km, extending offshore toward Dongtai. The 5 m, 10 m, and 14 m isobaths are located about 6.9 km, 8.5 km, and 9.35 km seaward from the seawall, respectively [31] (Figure 1a).
The study area experiences an irregular semidiurnal tidal regime with a mean tidal range of 3.68 m [32]. The dominant constituents are M2 (1.45 m) and S2 (0.52 m) [33]. Owing to sheltering by the offshore radial sand ridges, local waves are generally mild but show seasonal variability, with winter wind-wave heights reaching ~1.9 m and summer ~1.0 m. Nearshore significant wave heights typically remain below 1 m. Strong tidal currents prevail, with average spring velocities exceeding 3 kn, and flow is largely parallel to the coast, driving net southward sediment transport [11]. In addition, the Jiangsu coast is frequently affected by storm surges, with nearly one hundred typhoons recorded between 1950 and 1981, 93 of which impacted coastal areas [32].
The cross-shore profile investigated in this study is located within the intertidal zone, approximately 1 km north of the project terminal of Dafeng Port. Since 1973, the Dafeng coastline has advanced seaward through successive land reclamation projects involving artificial embankment construction, resulting in an average coastline progradation of approximately 9.2 km [34]. Influenced by coastal aquaculture development, port construction, and changing hydrodynamic conditions, the coastline advanced seaward in the study area by about 1.4 km between 2000 and 2025 (Figure 1a). Since 2014, our research team has conducted long-term monitoring of the cross-shore profile in this region (Figure 1b). Observations indicate that the profile has undergone significant morphological changes over the past decade: transitioning from a gently sloping form in 2014 to a well-defined “accreting upper–eroding lower” pattern by 2023. During each field campaign, cross-shore profile elevations were measured using high-precision Real-Time Kinematic (RTK) differential GPS (Figure 1c,d). Additionally, manual surveys and surface sediment sampling were conducted on the tidal flats during the spring and king tide periods in August and November each year, producing a continuous, high-quality dataset spanning multiple years (Table A1). All of these profile elevation data are referenced to the 1985 China National Elevation Datum. These long-term field observations provide a robust dataset for validating and calibrating the numerical simulations conducted in this study.

2.2. Model Description and Configuration

The Delft 3D numerical model, as a mature tool for simulating coastal morphodynamics, has been extensively detailed in numerous studies regarding its numerical methods and module principles [20,35]. This paper provides only a brief overview of its configuration in the present study. Following previous research [24,36] and assuming alongshore uniformity, a one-dimensional model based on the equilibrium profile concept was constructed to reduce computational complexity [37]. The model incorporates key processes including tidal flow, waves, sediment transport, and morphological evolution. The hydrodynamics are solved under the assumption of incompressible flow by numerically integrating the nonlinear shallow water equations [37]:
η t   + h u x = 0 ,
u t + u u x = g u t + v 2 u x 2 g n 2 u u h 4 3 .
Here, u is the depth -averaged flow velocity, h is the water depth, η is the water surface elevation, g is the gravitational acceleration, v is the horizontal eddy viscosity coefficient, and n is the Manning roughness coefficient. The values adopted in this study were: v = 1 m2/s, g = 9.81 m/s2, and n = 0.016.
The maximum bed shear stress ( τ m a x ) is calculated using a combined expression that accounts for both tidal currents and wave effects, as proposed by Mariotti & Fagherazzi [11]:
τ m a x = τ w + τ c 1 + 1.2 τ w τ w + τ c 3.2 ,
where τ w is the bed shear stress induced by waves (Pa), and τ c is the bed shear stress generated by tidal currents.
In this study, sediment is classified into two categories: cohesive mud and non-cohesive sand. Their transport processes are modeled independently using separate formulations, and mutual interactions are not considered. Sediment transport follows the mass conservation equation:
( c h ) t + ( u c h ) x = Q e Q d ,
Gao and Zhu [16] proposed that when a tidal flat is composed entirely of cohesive muddy sediments and subsequent sediment supply is cut off, the vertical growth of the tidal flat ceases. Therefore, in the present model setup, only the erosion and deposition processes of cohesive mud are considered to observe the morphological evolution trend of the tidal flat profile. To ensure continuous deposition of suspended sediment during the simulation, the critical shear stress for deposition τ c r , d was set to the default value of 1000 Pa. The erosion rate parameter M e was set to 0.0002 kg/m2/s, the settling velocity w s was set to 0.5 mm/s, and the critical shear stress for erosion τ c r , e was set to 0.5 Pa. The total thickness of the cohesive sediment bed was set to 4 m in this study to prevent complete erosion of the seabed.
The Delft3D-WAVE module is based on the nearshore wave simulation model SWAN. SWAN calculates the evolution of wave action density n in the two-dimensional geographic space x and time t by solving the action balance equation:
N t + x · C g + U N + ( C θ N ) θ = S t o t σ ,
The left-hand side of Equation (5) represents the kinematic components, including the temporal variation in wave action density, spatial propagation of action (where C g is the group velocity and U is the ambient current velocity), changes in relative frequency due to variations in depth and current velocity (with C σ as the propagation velocity in the σ   sigmaσ-space), and wave refraction caused by changes in depth and flow (with C θ as the propagation velocity in the θ -space). S t o t represents the source term, which accounts for the effects of wave generation, dissipation, and nonlinear interactions between waves, expressed in terms of energy density.

2.3. Model Setup and Wave Conditions

2.3.1. Model Domain and Grid Configuration

The modeled profile is located in the intertidal zone approximately 1 km north of the Phase I port of Dafeng Port, covering a cross-shore distance from 250 m to 1650 m offshore, with a total length of 1400 m. To avoid the area within 250 m of the coastline that is heavily influenced by long-term human activities, this zone was excluded from the model domain. The model grid consists of orthogonal rectangular cells measuring 10 × 10 m. The initial bathymetry is based on field measurements, and all elevations are referenced to the 1985 national vertical datum.

2.3.2. Model Parameters and Boundary Forcing

In this study, the wave boundary conditions were set as follows: the significant wave height was averaged to 0.8 m [38]; the peak period was set to 4.5 s based on long-term observational data; the wave direction (θ) was 90°; and the directional spreading angle (Δθ) was 25°. The corresponding experimental wave sensitivity parameters are detailed in Table A2 and Table A3. The effect of wind was neglected because the model focuses on very shallow waters, where wind-generated waves are negligible.
To establish the astronomical tidal open boundary at the nearshore model edge, this study incorporated harmonic constants of eight principal tidal constituents—semidiurnal tides M2, S2, N2, K2 and diurnal tides K1, O1, Q1, P1—as well as three representative shallow-water constituents (MN4, M4, MS4) as boundary forcing. Following the approach of Pan et al. [39], the improved MHACS method was used to derive harmonic constants for the eight major tidal constituents. Additionally, the S_TIDE toolbox was employed to perform non-stationary tidal harmonic analysis, extracting the three shallow-water constituents [40]. Figure 2 compares the tidal elevations and residuals derived from these methods against measured tide levels, demonstrating a strong fit with the observations.
All simulations were initialized using the August 2023 measured bathymetry and spanned a full spring-neap tidal cycle (~15 days). To evaluate model performance, morphological validations were conducted over two periods: a three-year period (from 1 August 2020 to 30 November 2023) and a four-month period (from 1 August 2023 to 30 November 2023).

2.3.3. Evaluation Metric

To quantify the nonlinear impact of significant wave height on the intensity of erosion and deposition along the profile, this study introduces the Sediment Flux Gradient (SFG) as an evaluation metric, defined as:
S F G = S H s
where S represents the change in sediment flux (erosion/deposition volume) over a specific wave height interval, and H s denotes the corresponding change in wave height. A larger absolute value of SFG indicates a more sensitive profile response to variations in wave height. The same indicator can be applied to the peak wave period by substituting H s with T p .

3. Results

3.1. Topographic Validation

Since the model is constructed in a nearshore shallow-water zone, to minimize errors in erosion and deposition caused by excessive hydrodynamic fluctuations and numerical distortions near the boundaries, the morphological results from the outermost three grid cells were excluded. The analysis focused on comparing erosion and deposition evolution along the profile between 250 m and 1620 m offshore.
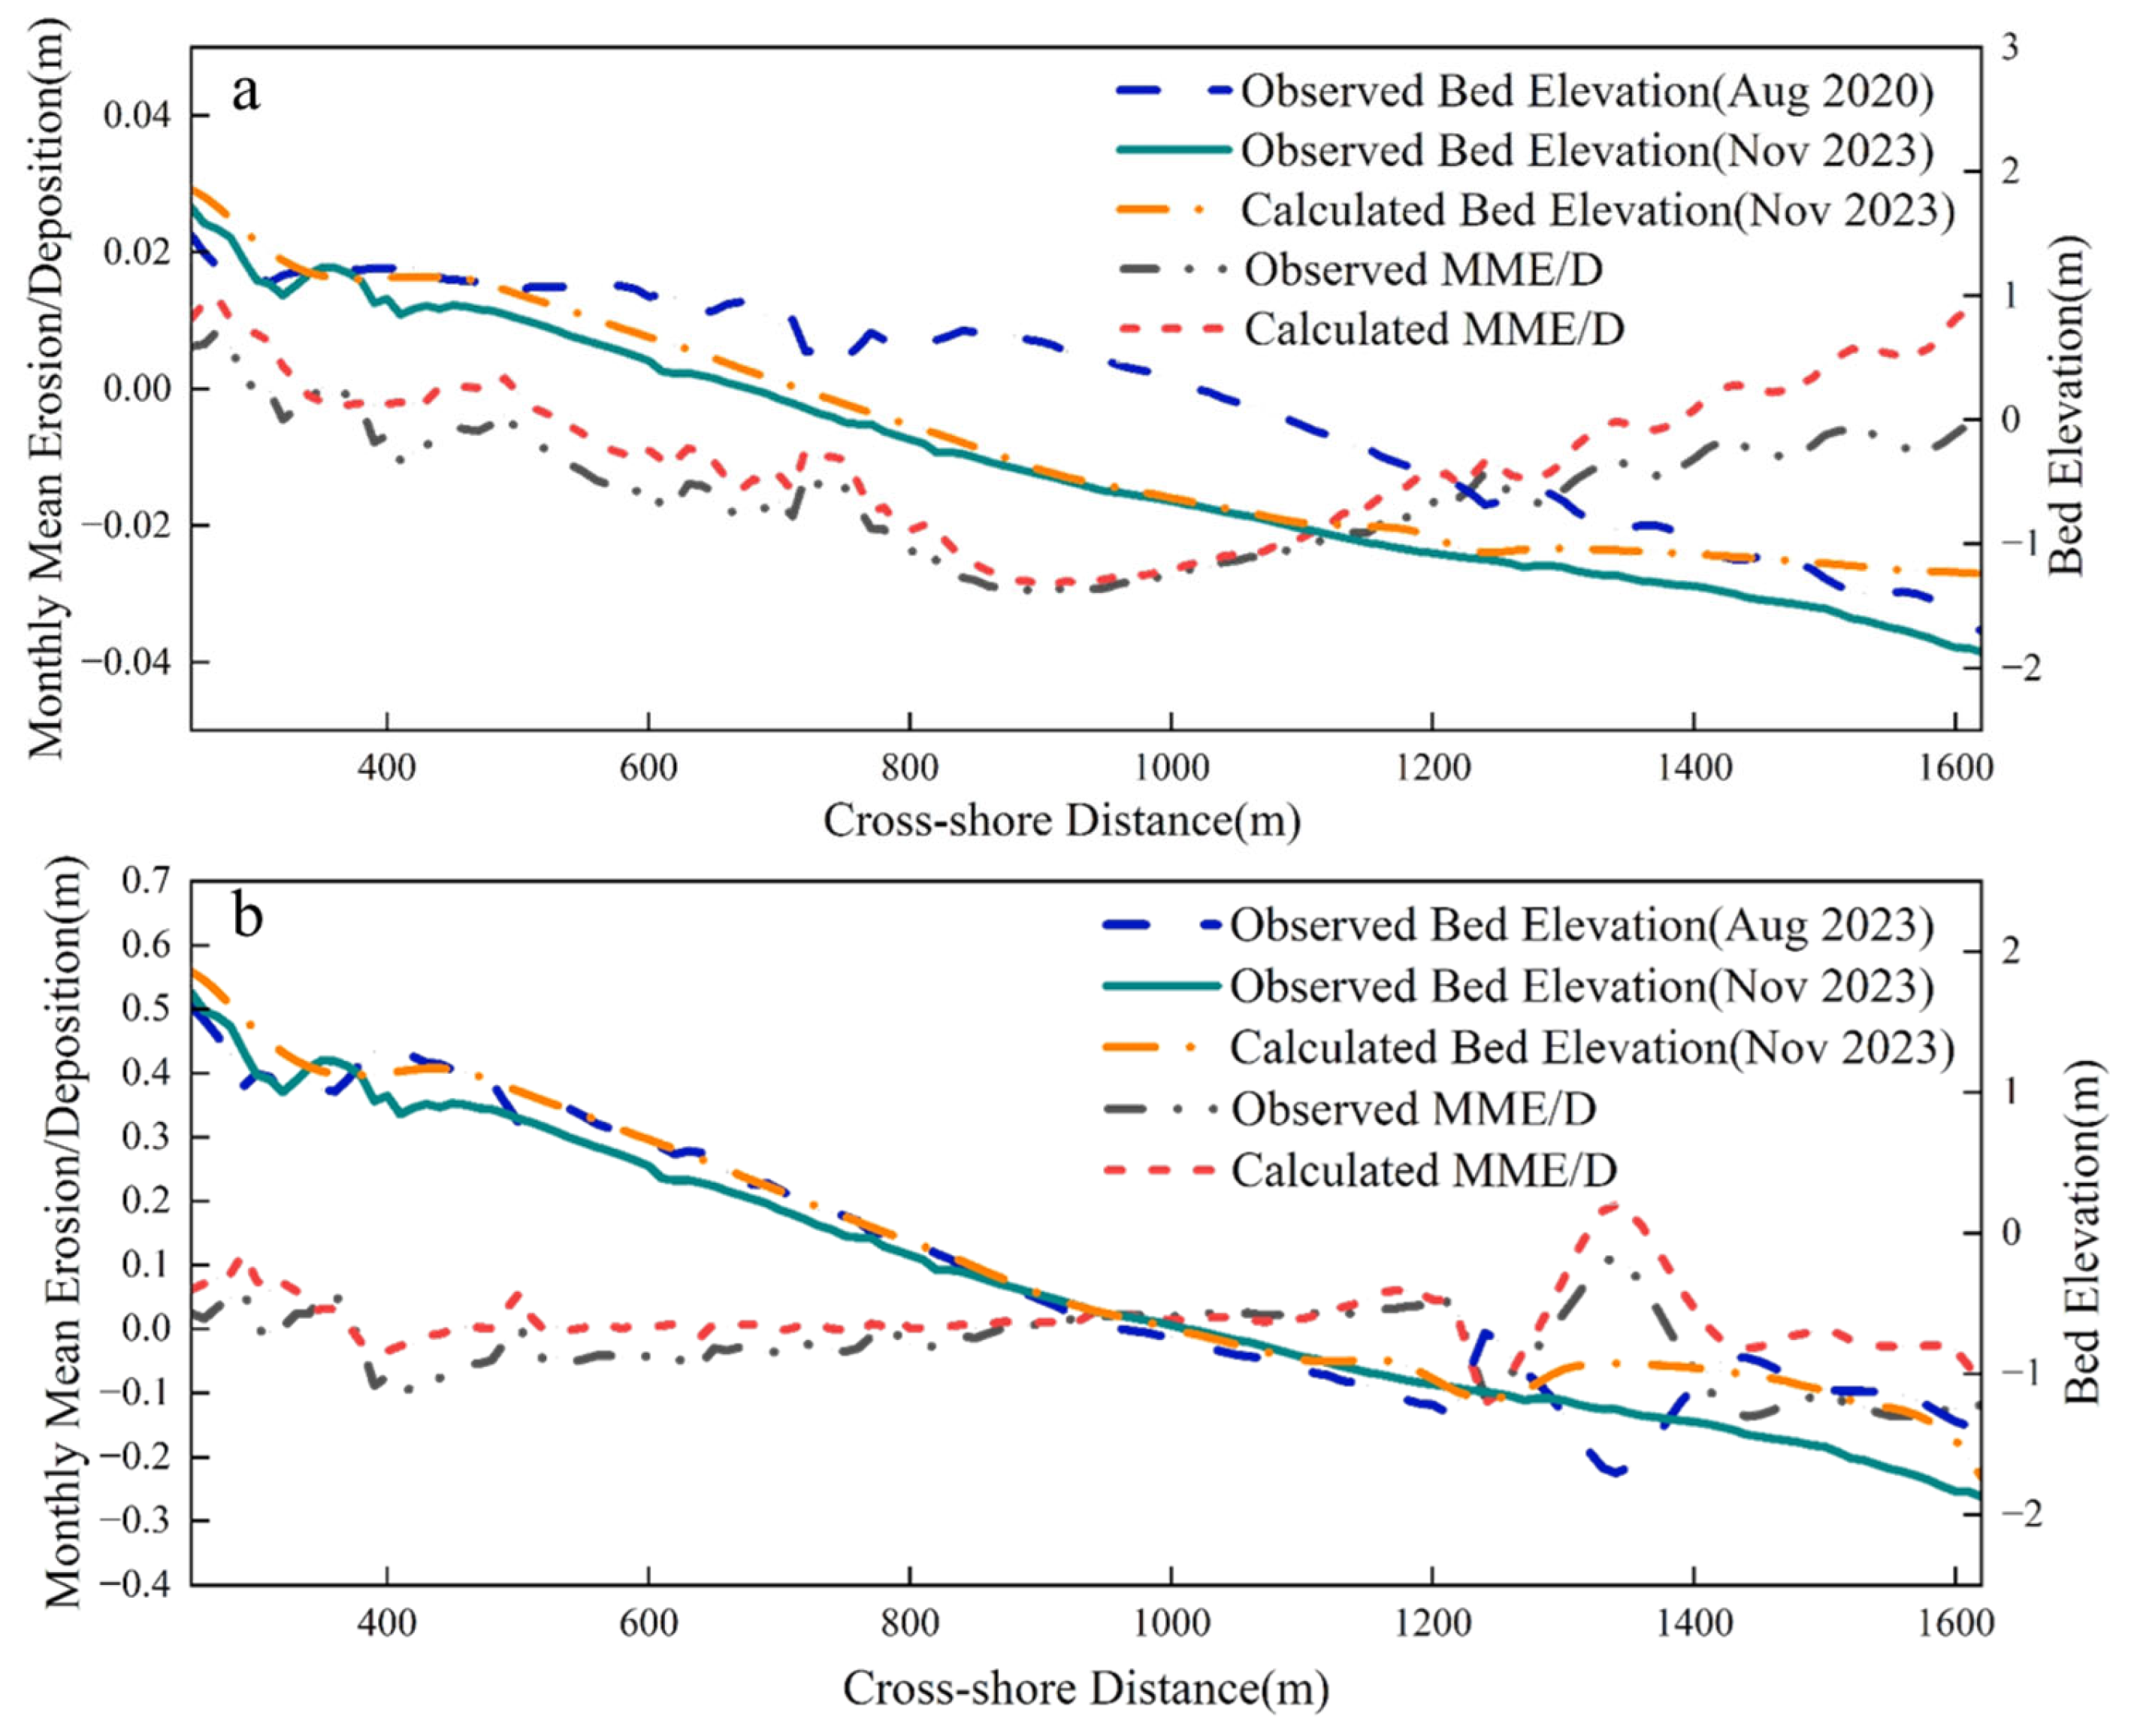
Figure 3 presents the profile elevations and monthly averaged erosion–deposition trends for the 3-year period (Figure 3a) and the 4-month period (Figure 4b). As shown in Figure 3a, field measurements from both periods indicate significant accretion in the upper intertidal zone (250–300 m), while the remaining areas generally experienced erosion. Model results correspond well, showing accretion in the upper intertidal zone and dominant erosion in the mid-intertidal zone (350–1400 m), demonstrating good model applicability in the intertidal and nearshore regions. However, in the lower intertidal zone beyond 1400 m, the model predicts weak accretion, which deviates somewhat from observations. Comparing monthly averaged erosion–deposition thicknesses reveals generally consistent magnitudes and stable morphological evolution, particularly in the mid-intertidal zone (700–1300 m), where the model matches observations closely. Except at 1400 m, where some discrepancies in trend and magnitude occur, erosion magnitudes largely align.
Analyzing Figure 3b, the two sets of field data indicate significant accretion in the upper intertidal zone (250–380 m), marked erosion in the mid-zone (400–850 m), and alternating erosion and accretion in the lower-mid zone. Model predictions align well with observed trends in the upper (250–380 m) and lower-mid intertidal zones, though discrepancies exist in erosion magnitude in the mid-zone (400–850 m). Despite some differences in the lower-mid zone, the overall monthly averaged erosion–deposition trend of the modeled profile remains largely consistent with field observations. The monthly averaged erosion–deposition magnitudes over the 3-year and 4-month periods exhibit noticeable differences in scale, consistent with the observations of Fan et al. [30]. This indicates that, at the annual scale, the profiles on the northern side of Dafeng Port remain relatively stable, whereas erosion intensifies during the autumn and winter seasons due to enhanced wind and wave activity.
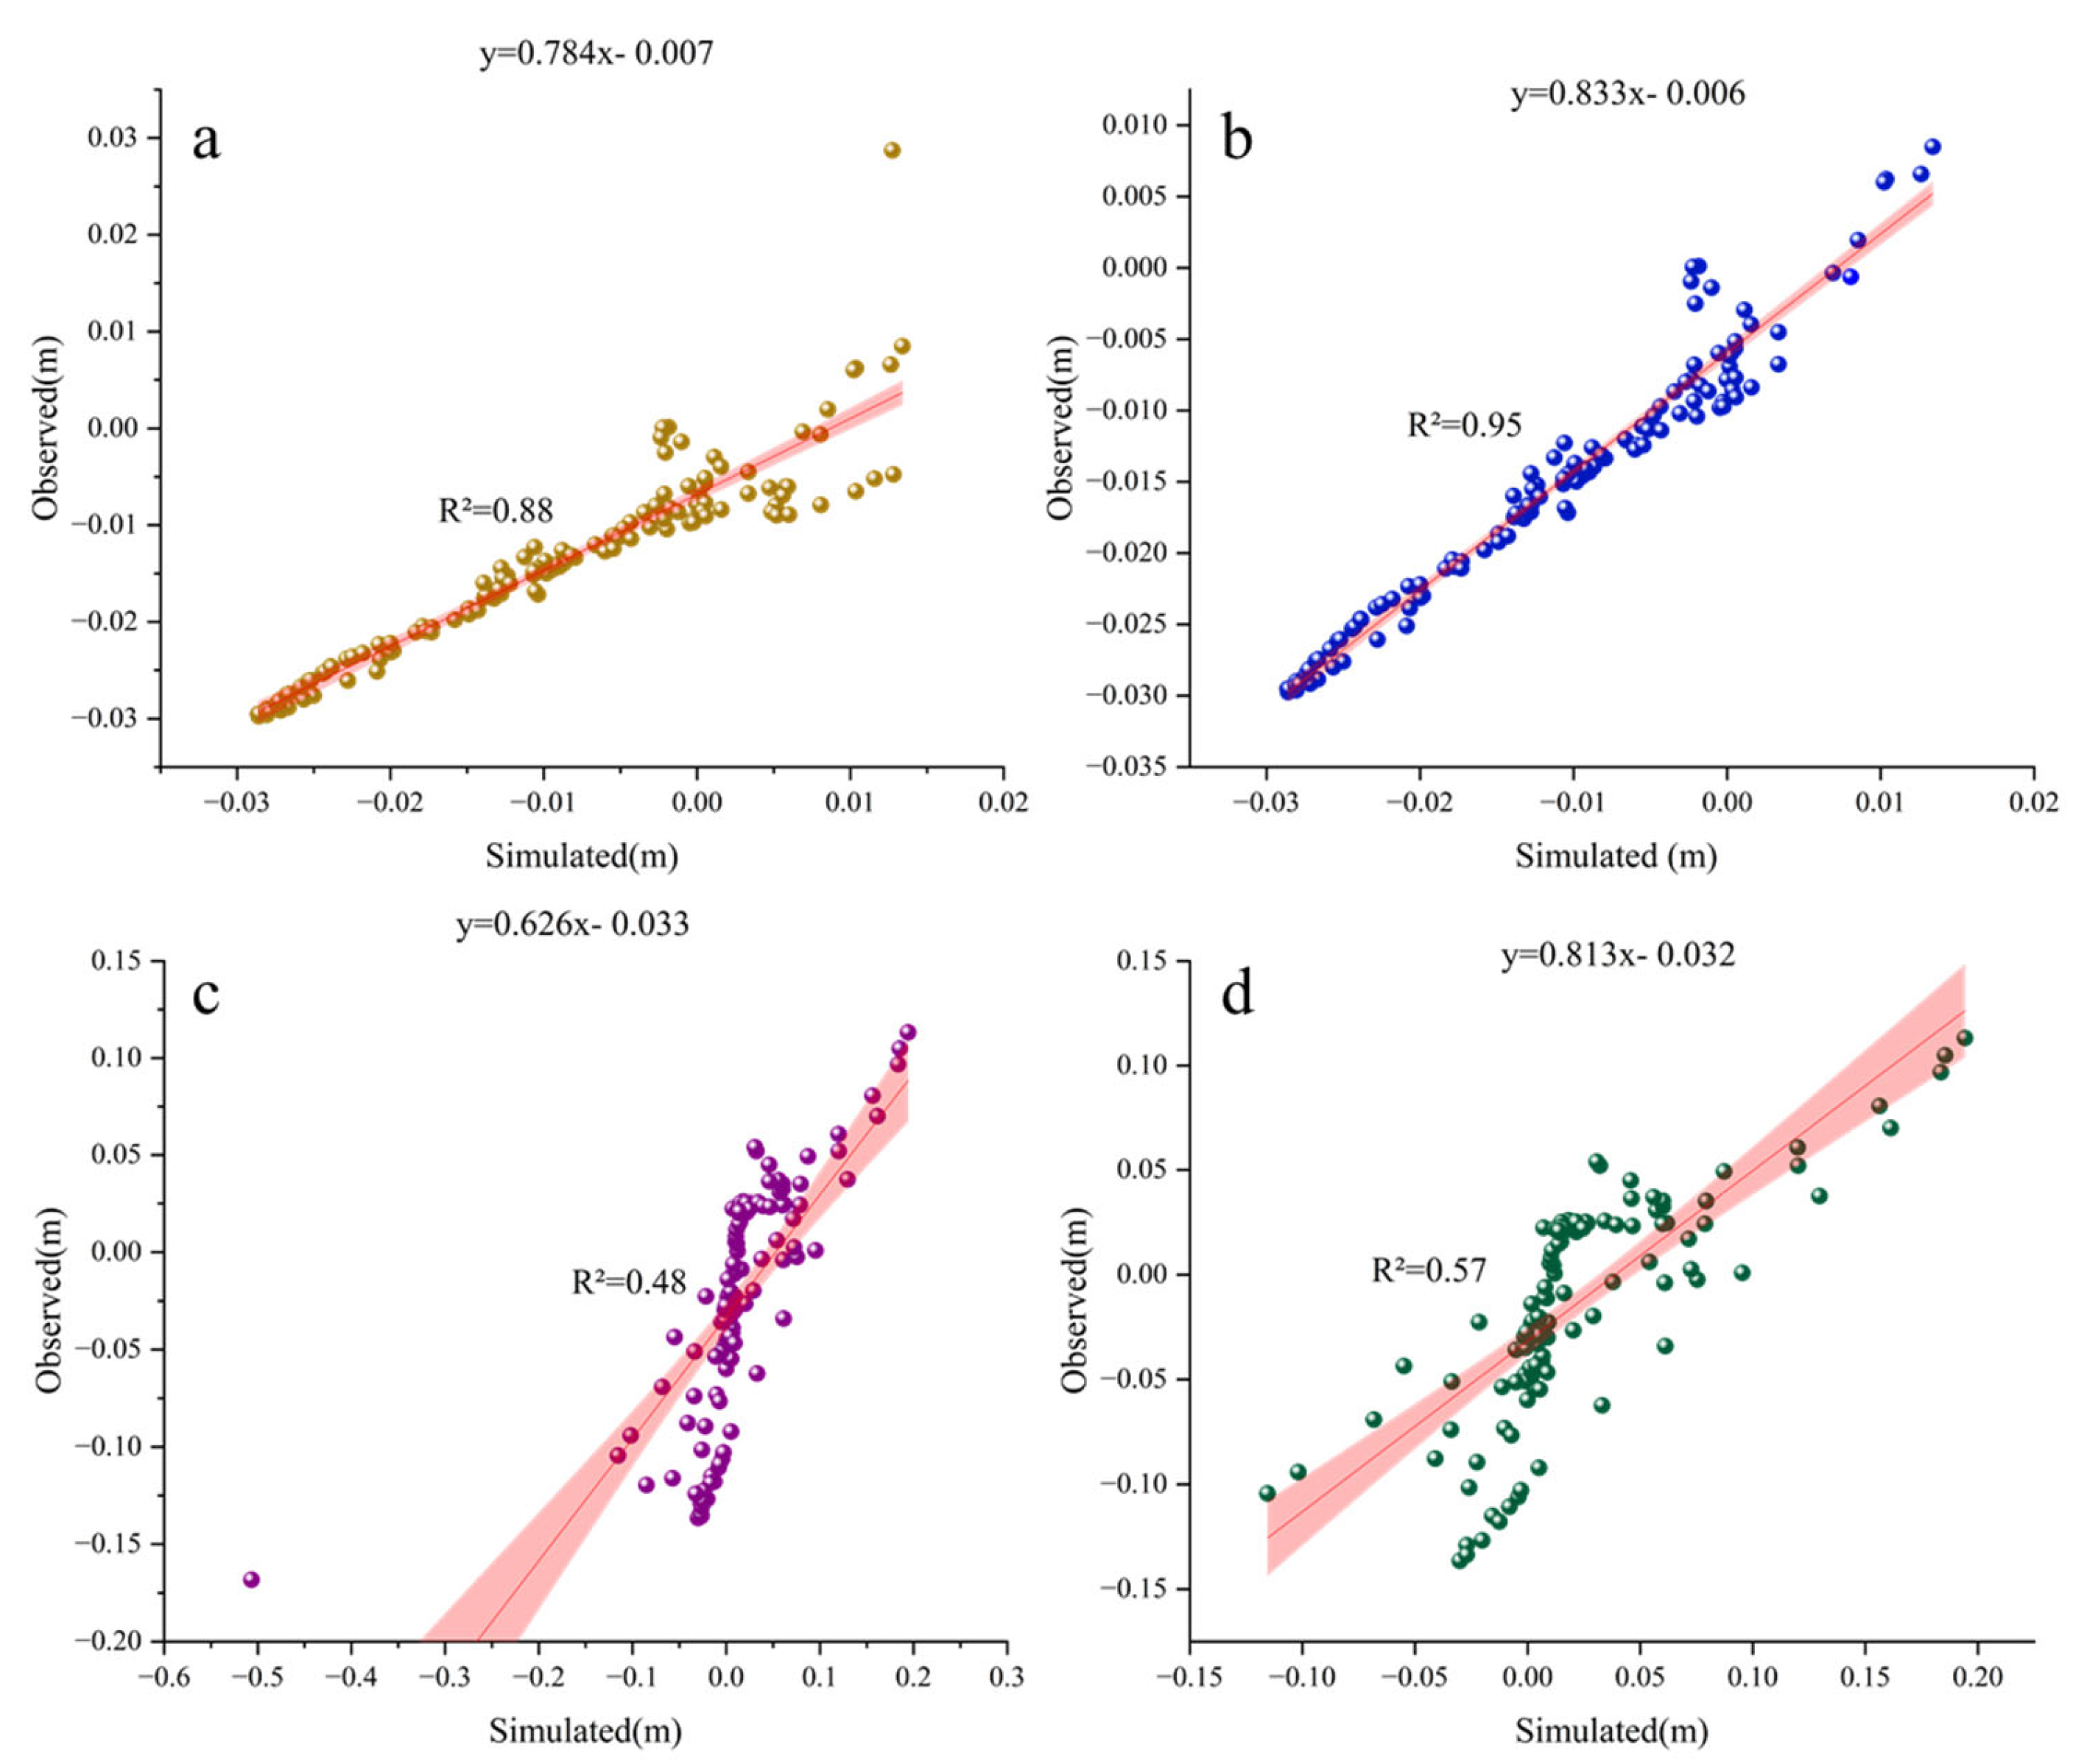
Figure 4 presents the linear regression results between simulated and measured monthly average erosion–deposition for the 3-year and 4-month periods. Figure 4a,b show the linear fits of monthly average erosion–deposition along the profiles from 250 to 1620 m and 250 to 1500 m during the 3-year period, with R2 values of 0.88 and 0.95, respectively. The strong linear relationship and narrow confidence intervals around the main data clusters indicate that the one-dimensional model developed in this study provides stable and reliable profile inversion results on an interannual scale, particularly with high accuracy in the 250–1500 m segment. Figure 4c,d represents the linear fits for the 4-month period at the same profile ranges (250–1620 m and 250–1500 m), with R2 values of 0.48 and 0.57, respectively. Similarly to the interannual results, the model performs better in the 250–1500 m segment. Although the seasonal-scale fit is less ideal compared to the interannual results, a clear linear correlation is still observed. The main discrepancies arise from seasonal variations in erosion–deposition magnitudes, reflecting the model’s relatively limited ability to capture seasonal-scale dynamics, which is associated with seasonal changes in wind and waves [30]. Nevertheless, the overall trends between simulations and observations remain well aligned.
Based on the results above, the one-dimensional profile model developed in this study exhibits robust and reliable simulation of erosion and deposition processes at the interannual scale, making it well-suited for long-term morphological change analysis and forecasting. While some deviations in magnitude are observed at the monthly scale, the model nonetheless offers valuable insights into the underlying mechanisms governing the evolution of profile erosion and deposition.

3.2. Influence of Significant Wave Height on Profile Erosion and Deposition

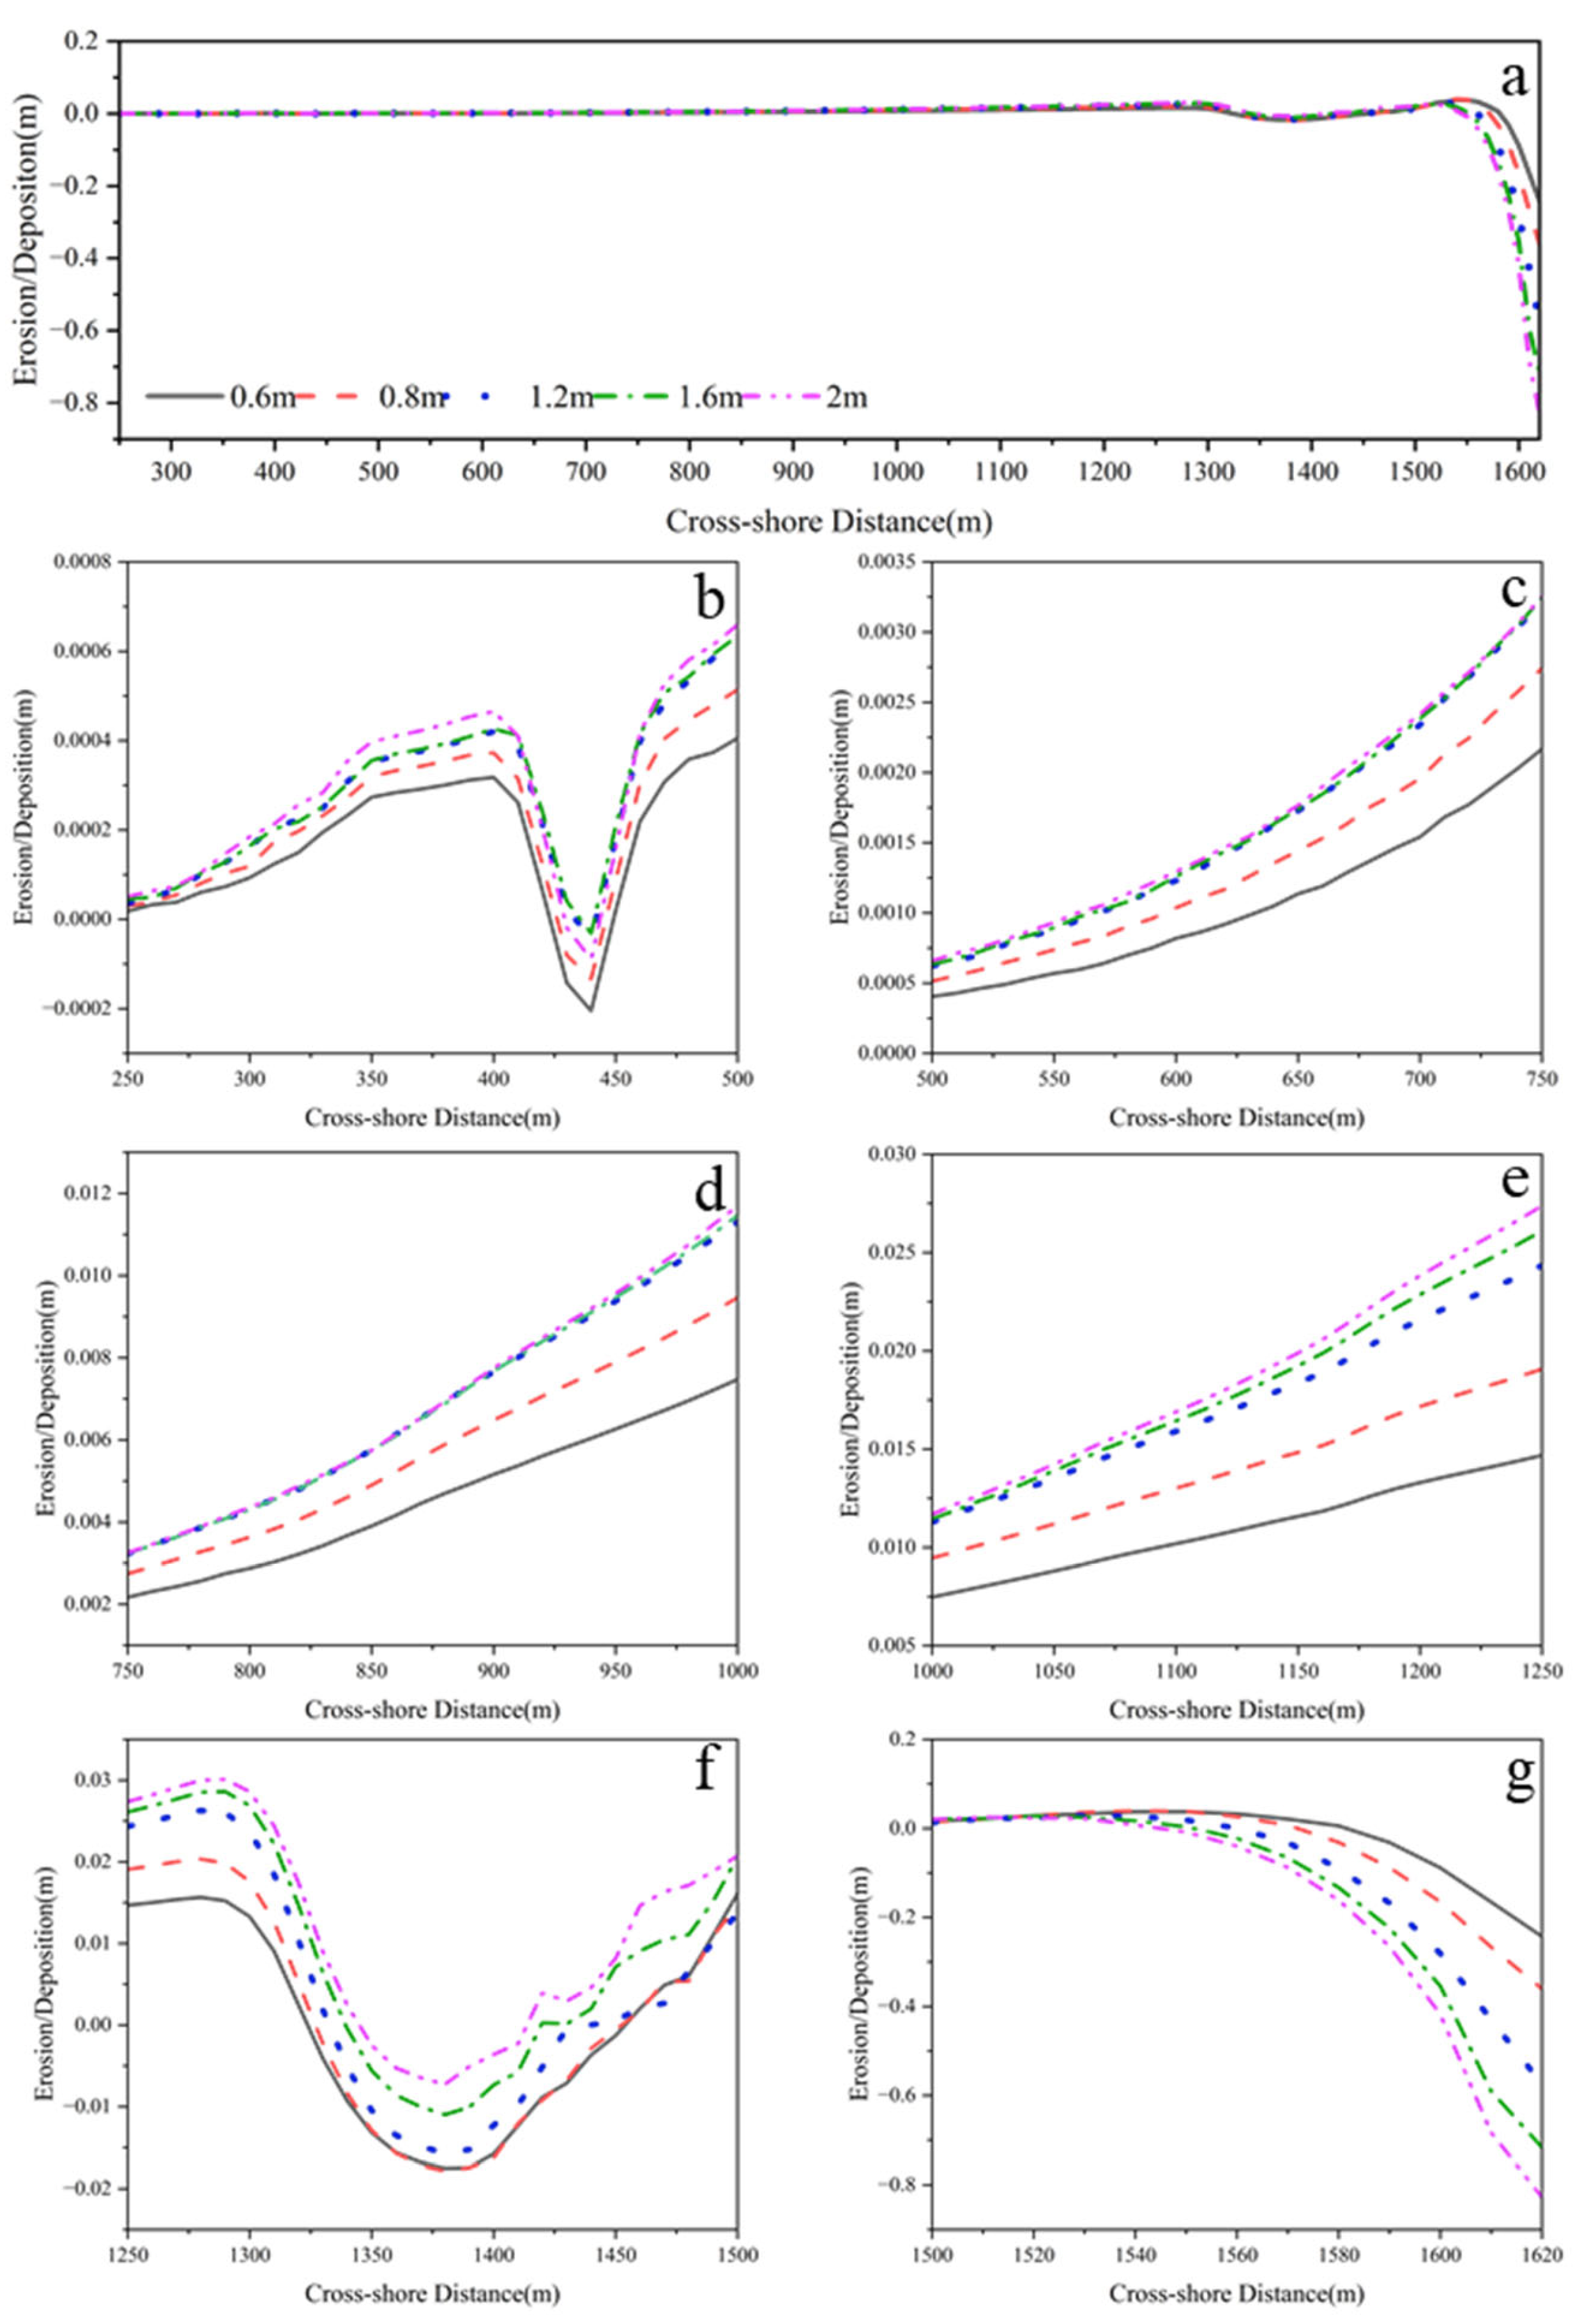
Figure 5a illustrates the overall trend of erosion and deposition along the profile under different significant wave heights. Generally, the shallow water zone beyond 1500 m offshore experiences pronounced erosion, with erosion intensity increasing as wave height rises. The middle section between 1100 m and 1500 m is dominated by deposition, although the magnitude of deposition here is noticeably weaker compared to the erosion in the shallow water zone. The upper section of the profile exhibits relatively minor changes in erosion and deposition, without any significant trend in either direction. Figure 5b–g provides zoomed-in views of the erosion and deposition patterns between 250 m and 1620 m along the profile. It is evident that the sections of 250–410 m, 470–1330 m, and 1440–1500 m consistently exhibit deposition, while the intervals 410–470 m, 1330–1440 m, and 1530–1620 m remain was dominated by erosion. Overall, both deposition and erosion intensities increase with wave height. However, in the upper to middle section of the profile (up to around 1320 m), deposition does not increase linearly with wave height. Notably, at H s = 1.2 m, a distinct “deposition threshold” emerges: beyond this wave height, the rate of increase in deposition slows down significantly. In contrast, the erosion zones in the upper-middle profile (410–470 m and 1330–1440 m) mostly show a trend where lower wave heights correspond to stronger erosion. Interestingly, the 410–470 m segment displays a non-monotonic erosion response to wave height ( H s = 0.6 m > 0.8 m > 2.0 m > 1.2 m > 1.6 m), indicating a complex nonlinear sediment transport mechanism in the upper intertidal zone. Additionally, the shallow water zone at the lower profile (1530–1620 m) remains erosional and exhibits a similar “erosion threshold” behavior around H s = 1.2 m: erosion intensifies rapidly with wave height below 1.2 m but continues to increase at a much slower rate beyond this value. These findings suggest that variations in wave height not only affect the magnitude of erosion and deposition but also trigger shifts in the profile’s response mechanisms.
The calculated results show that within the wave height range of 0.6–1.2 m, the SFG is −1.33; however, in the 1.2–2.0 m range, the SFG decreases to −0.91. This means that when the wave height exceeds 1.2 m, the sediment response efficiency drops by approximately 32%. These findings further confirm that 1.2 m is the critical significant wave height for sediment flux response along this profile.

3.3. Influence of Peak Wave Period on Profile Erosion and Deposition

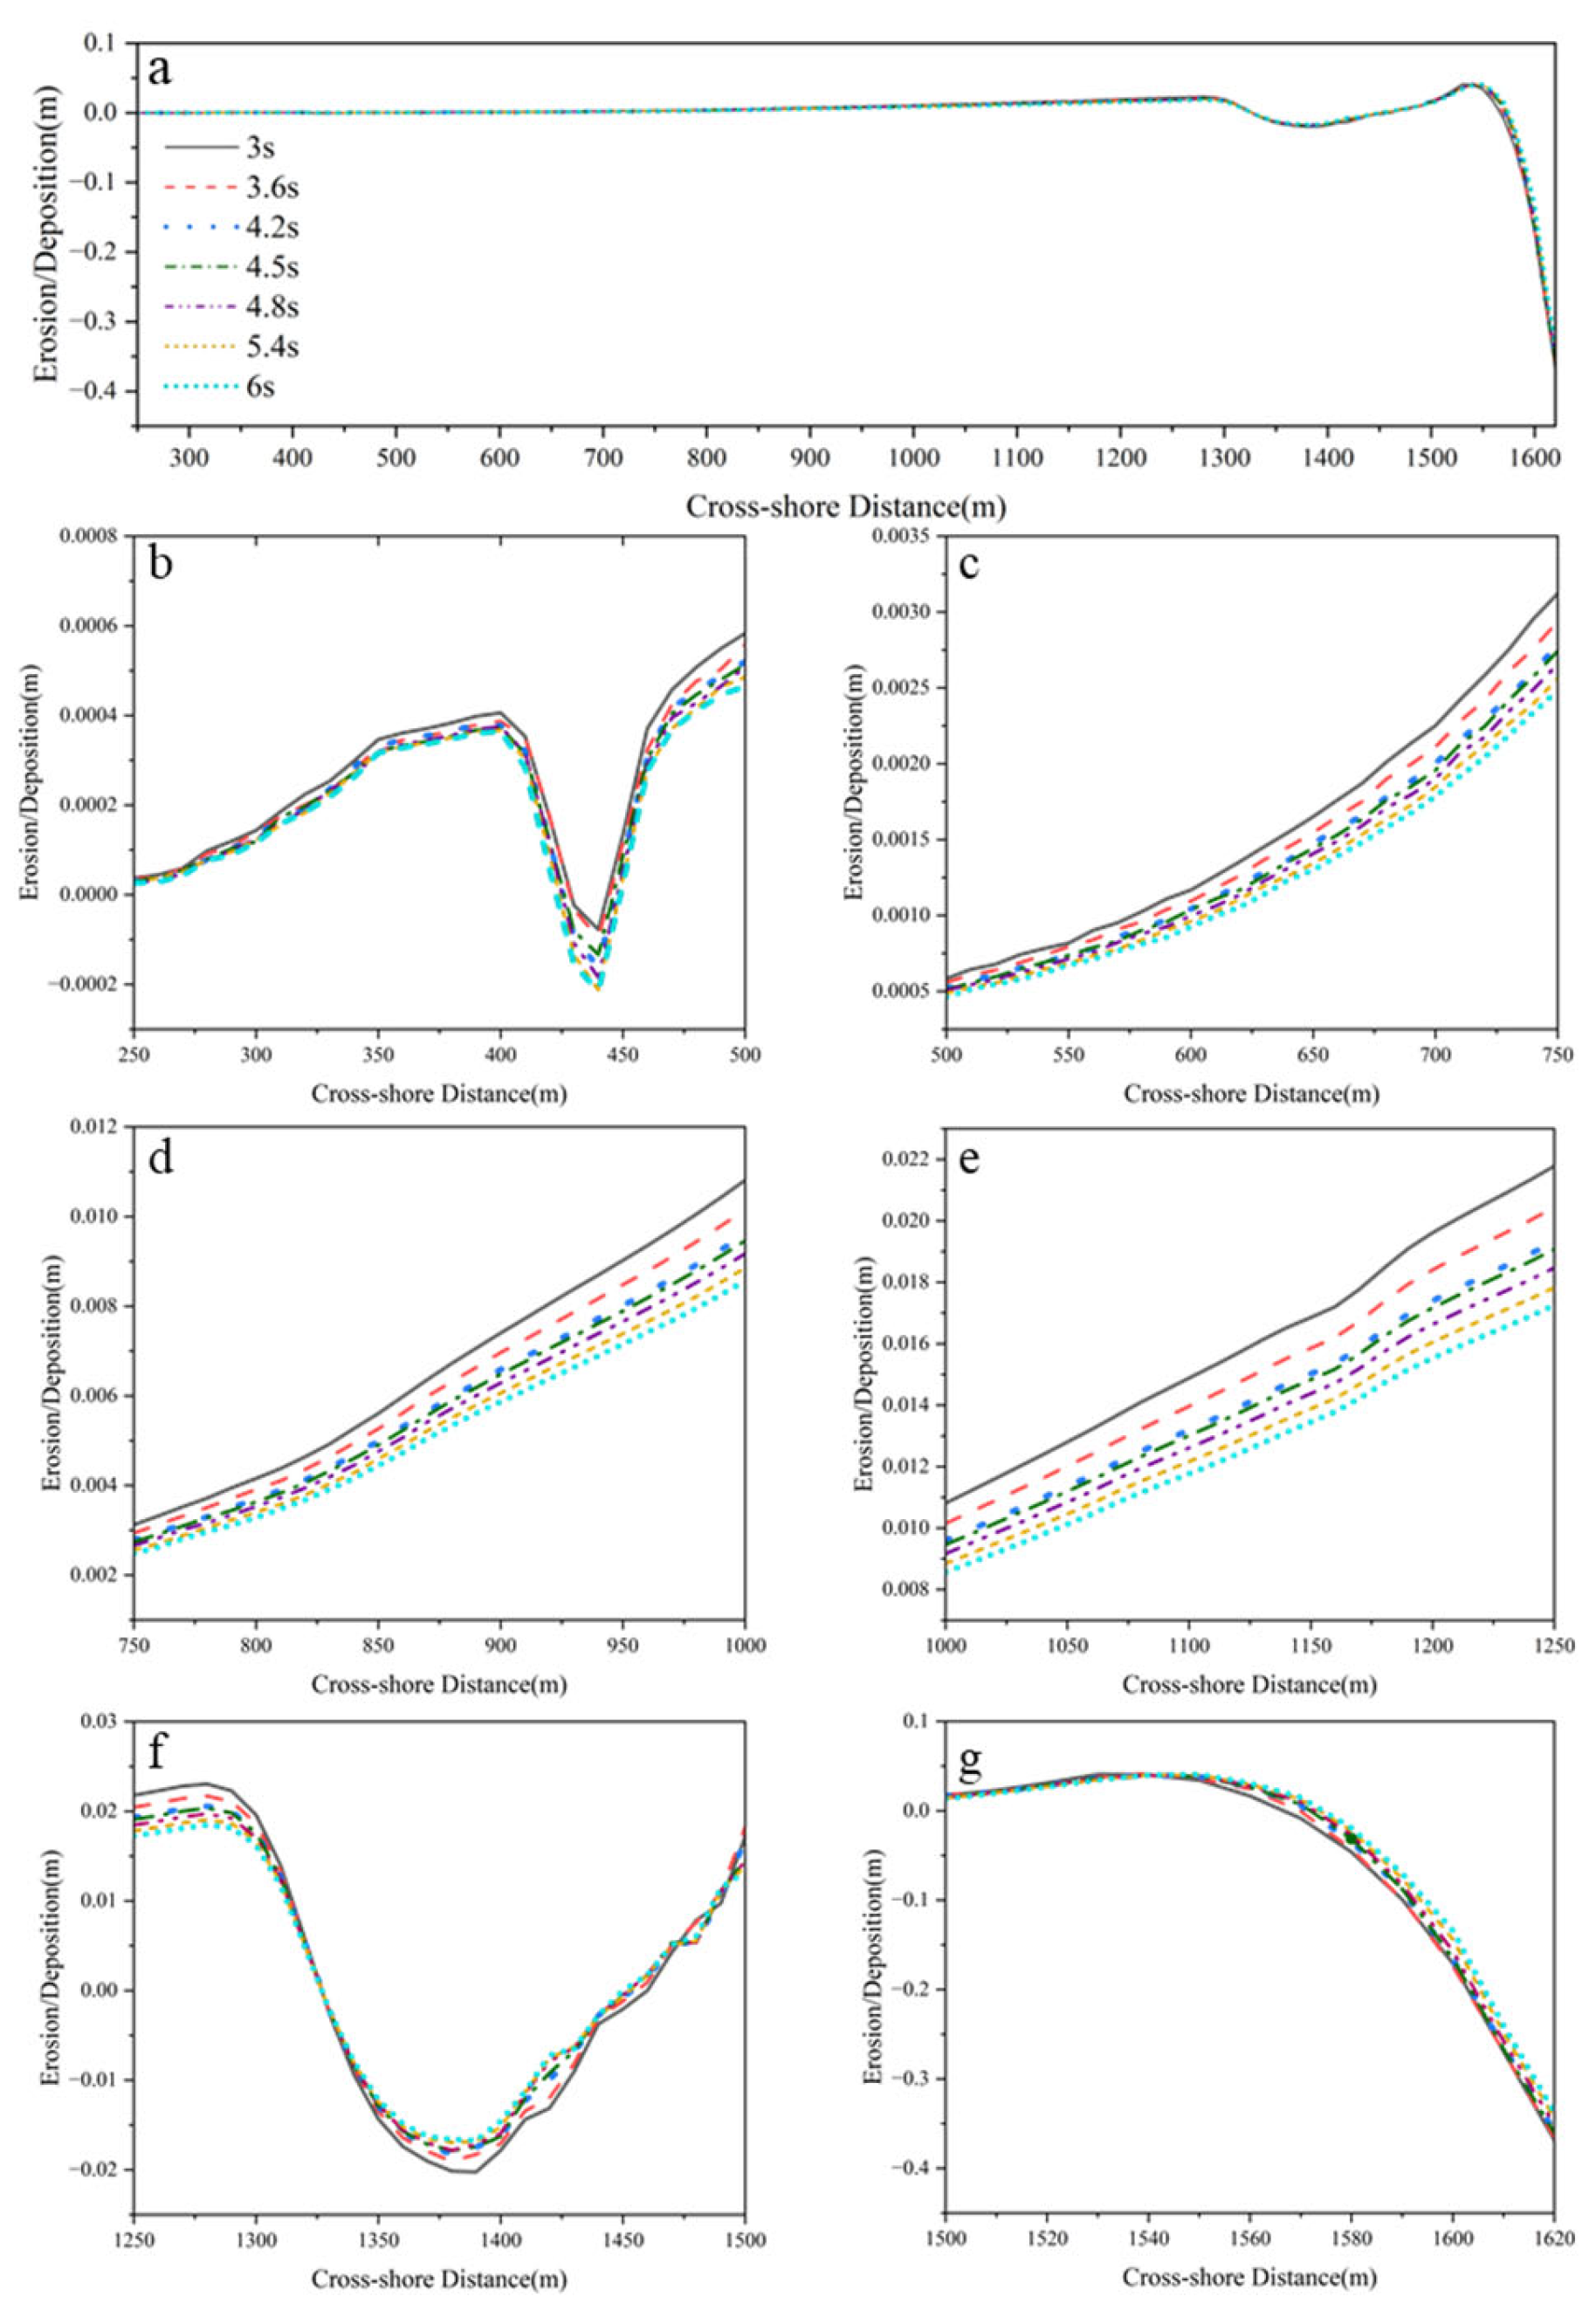
Figure 6a shows the overall trend of erosion and deposition along the profile. The shallow water zone exhibited a pronounced erosion trend, with maximum erosion depth reaching 0.35 m, while the mid-to-upper intertidal zone showed relatively minor variations in sediment flux across different wave periods. Figure 6b–g presents zoomed-in views of the profile at 250–420 m, 450–1330 m, and 1440–1570 m, all of which remained depositional zones where the sedimentation rate increased as the wave period decreased. In contrast, the segments between 420–450 m, 1330–1440 m, and 1570–1620 m were erosional zones, but exhibited distinct response mechanisms: erosion at the upper segment (420–450 m) intensified with increasing wave period, whereas erosion in the mid-lower segments (1330–1440 m and 1570–1620 m) strengthened as the wave period shortened.
Calculating the total sediment flux along the entire profile revealed that within the 3.0–4.5 s wave period range, the SFG was approximately zero, indicating little overall change in erosion and deposition intensity. However, in the 4.5–6.0 s range, the SFG increased to 0.04, showing that erosion weakened with increasing period and the sediment flux response exhibited a nonlinear behavior. Taken together, 4.5 s emerges as a critical “erosion-deposition threshold” period for the profile, with shorter periods correlating to greater sediment flux magnitudes—likely linked to the more frequent disturbances caused by higher-frequency waves.

3.4. Changes in Profile Erosion and Deposition During Storm Tide Periods

From 13 to 16 September 2022, Typhoon “Meihua” (No. 2212) impacted the Jiangsu coast. To simulate the influence of the storm tide on the tidal flat profile evolution, astronomical tide levels during 14 September, 08:00 to 15 September, 19:00, 2023, were raised based on publicly available measured astronomical tide and storm surge data from Dafeng Port. Meanwhile, the significant wave height was set to 3 m to represent the average wave height during the storm tide. The year 2023 was selected for the storm tide simulation because the baseline topography used corresponds to the measured profile data from August 2023 at Dafeng Port.
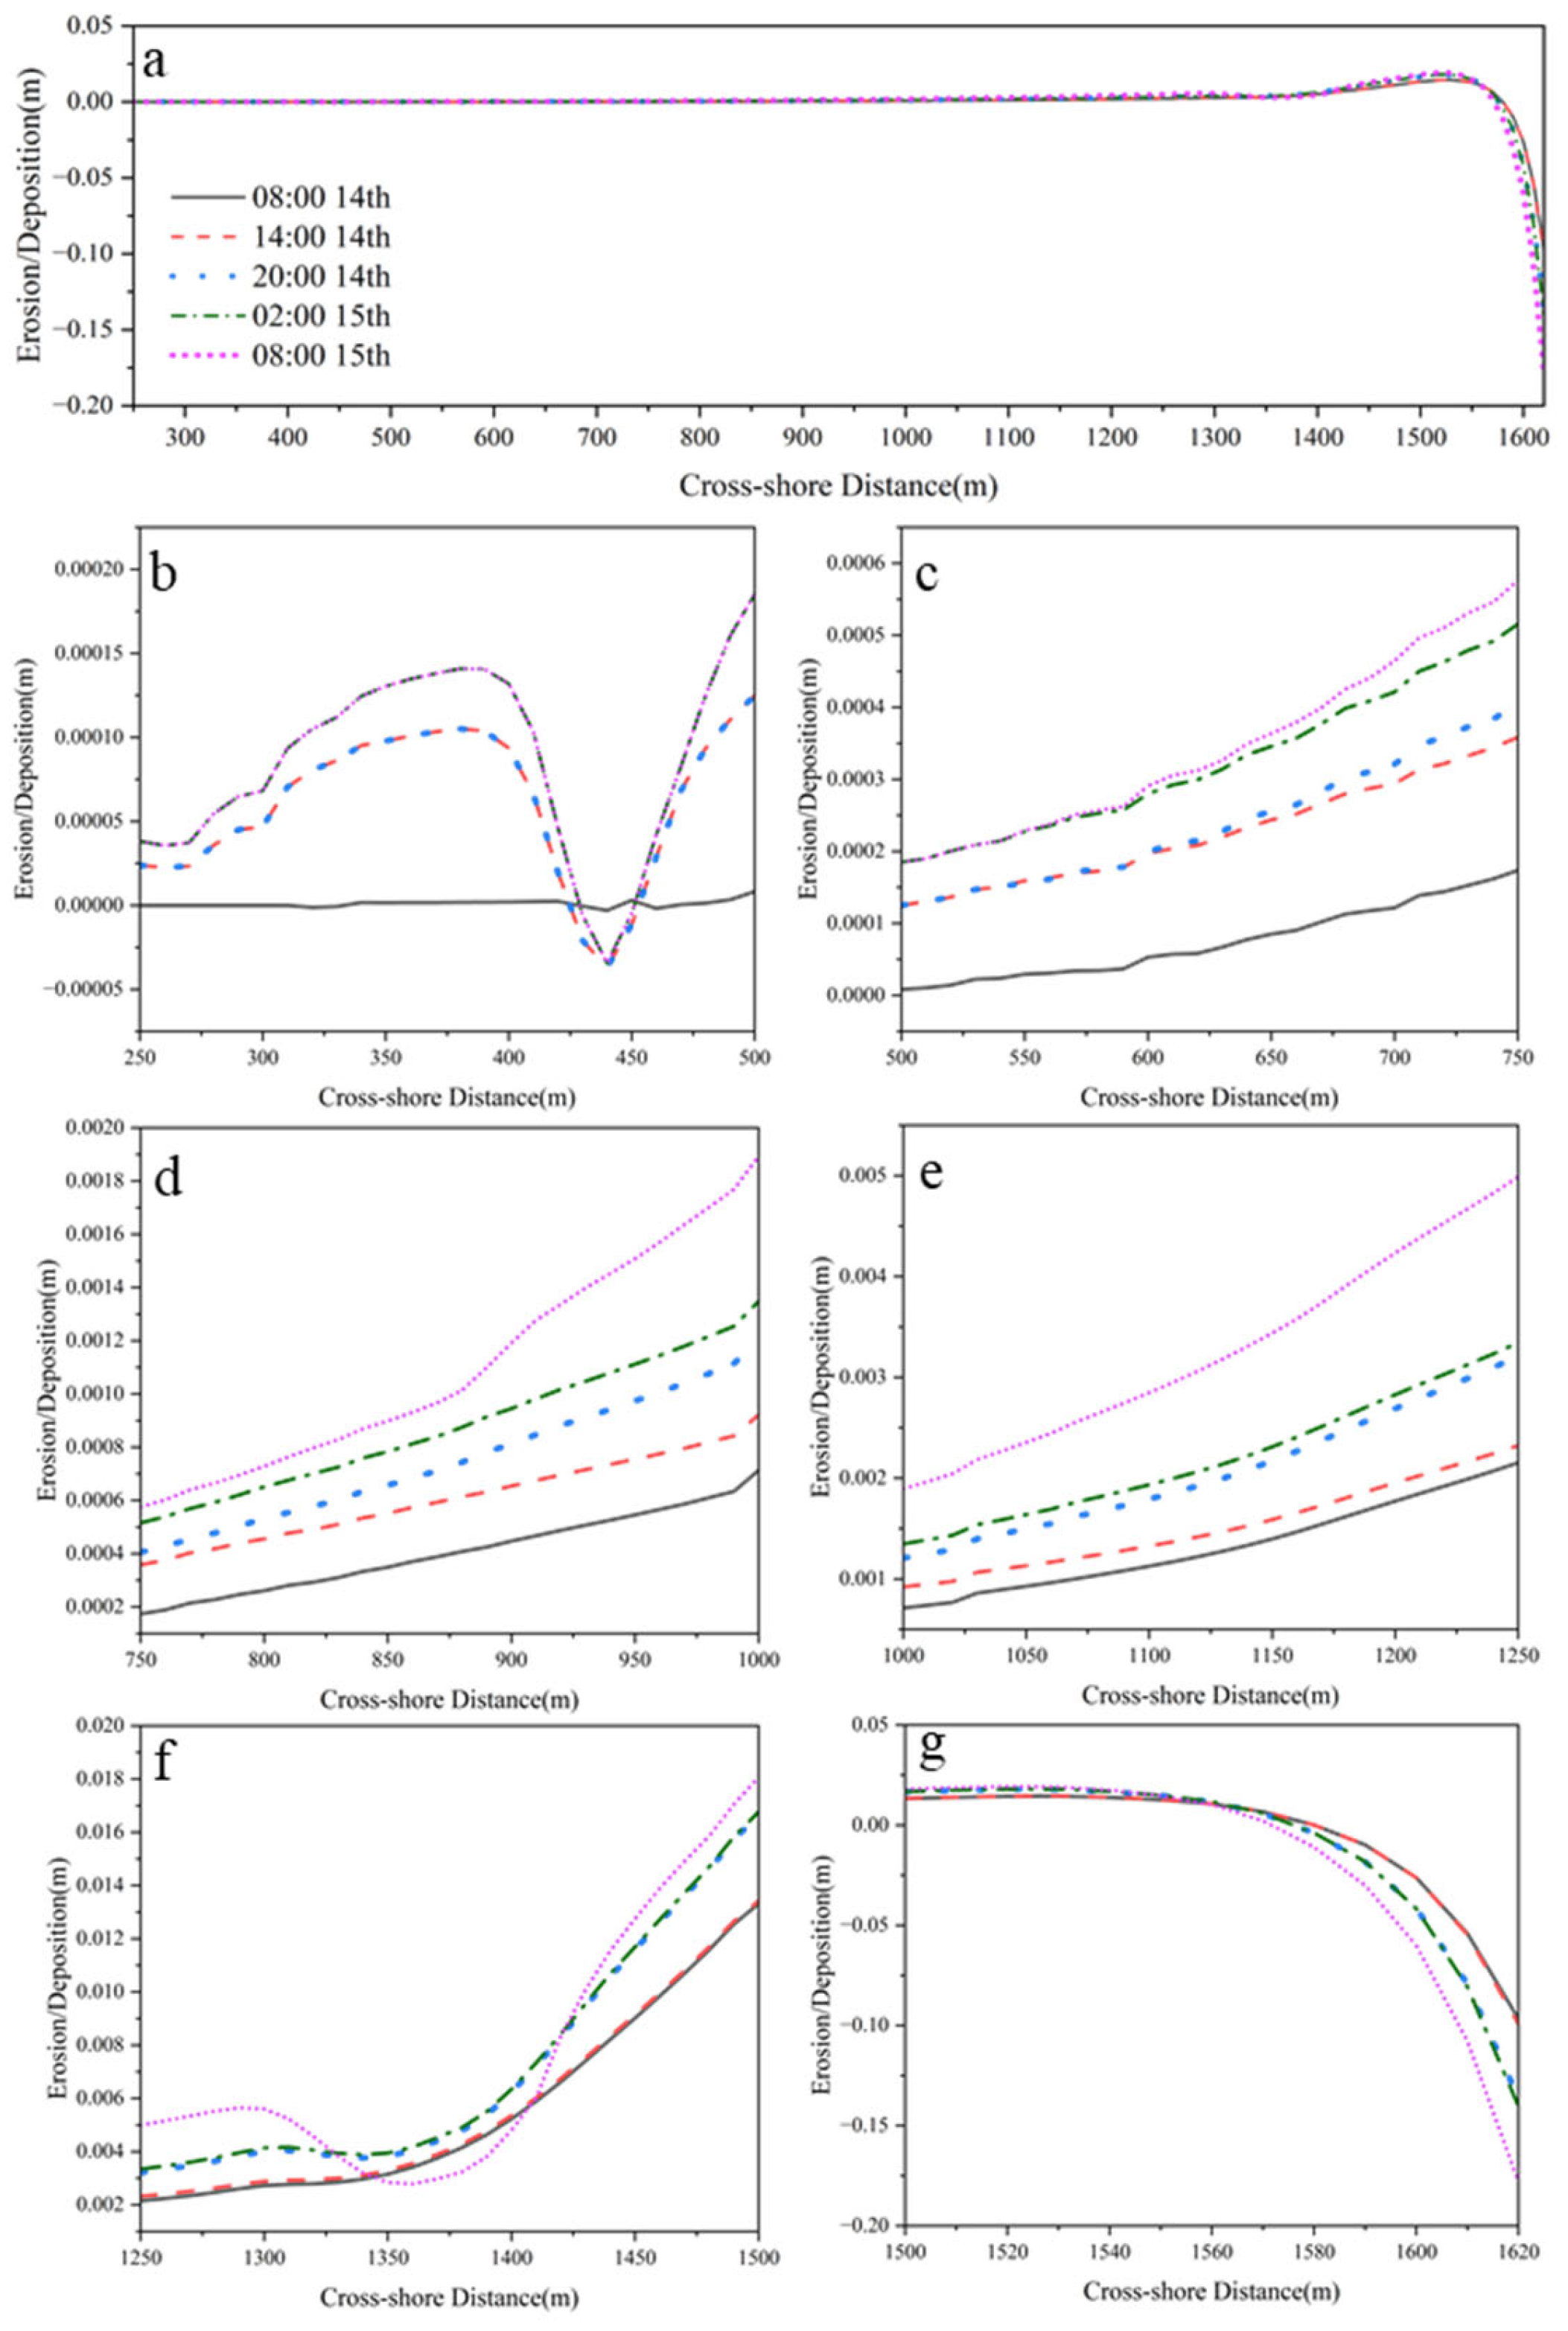
Starting from 08:00 on 14 September 2023 (Figure 7), five key time points were selected within the period up to 06:00 on 15 September, based on the actual tidal process and the critical stages of flood and ebb tides. Corresponding cross-shore profile erosion and accretion results were extracted. Figure 8a illustrates the overall morphological trend of the profile, showing significant erosion in the lower intertidal zone during the storm surge period, with a maximum erosion depth reaching 0.18 m. Figure 8b–g presents the segment-wise erosion and accretion trends along the profile. The results show that the upper intertidal zone between 250 and 600 m responds actively during the time intervals of 08:00–14:00 and 20:00–02:00, while the changes during 14:00–20:00 and 02:00–08:00 are relatively stable. As shown by the water level variations in Figure 7, this area’s morphological changes are mainly associated with the flood tide phase, whereas changes tend to stagnate during ebb tide. A similar pattern is observed in the 600–800 m segment, with significant erosion–accretion occurring during flood tide and relatively weaker changes during ebb tide. In contrast, the middle-to-lower intertidal zone (800–1620 m) exhibits the opposite trend: morphological responses decrease progressively during flood tide but increase significantly during ebb tide. Notably, in the shallow subtidal zone (1500–1620 m), erosion is almost negligible during flood tide, while maximum erosion of about 0.04 m occurs during ebb tide. The maximum erosion depth of 0.18 m in the shallow zone is comparable to observations by Kitamura et al. [41], who recorded storm-induced erosion depths of approximately 0.3 m on Japanese tidal flats, and by Gong et al. [32] who observed similar erosion magnitudes in the shallow zone of Chuandong Port, Jiangsu.
In this study, the simulated upper intertidal zone shows low-magnitude sediment changes. Accretion dominates during flood tide, while sediment movement is minimal during ebb tide. In contrast, the middle-to-lower intertidal and shallow subtidal zones respond more actively during ebb tide. Erosion is particularly strong in shallow areas. Overall, the profile exhibits a distinctive pattern: the middle-lower zone is ebb-dominant, with little activity during flood tide, whereas the upper zone is flood-dominant, with minimal change during ebb tide. This pattern is consistent with Gong et al. [32] who observed similar storm-induced morphodynamic behavior at Doulong Port tidal flat in Jiangsu, summarized as “erosion on the low flat, alongshore sediment transport, and stability on the high flat.”

3.5. Profile Morphology Prediction

Based on the morphological validation presented in Section 3.1, which showed a high degree of agreement between simulated and observed profile evolution within the 250–1500 m section this 15-year prediction primarily focuses on this segment to ensure the accuracy of the forecasted trends.
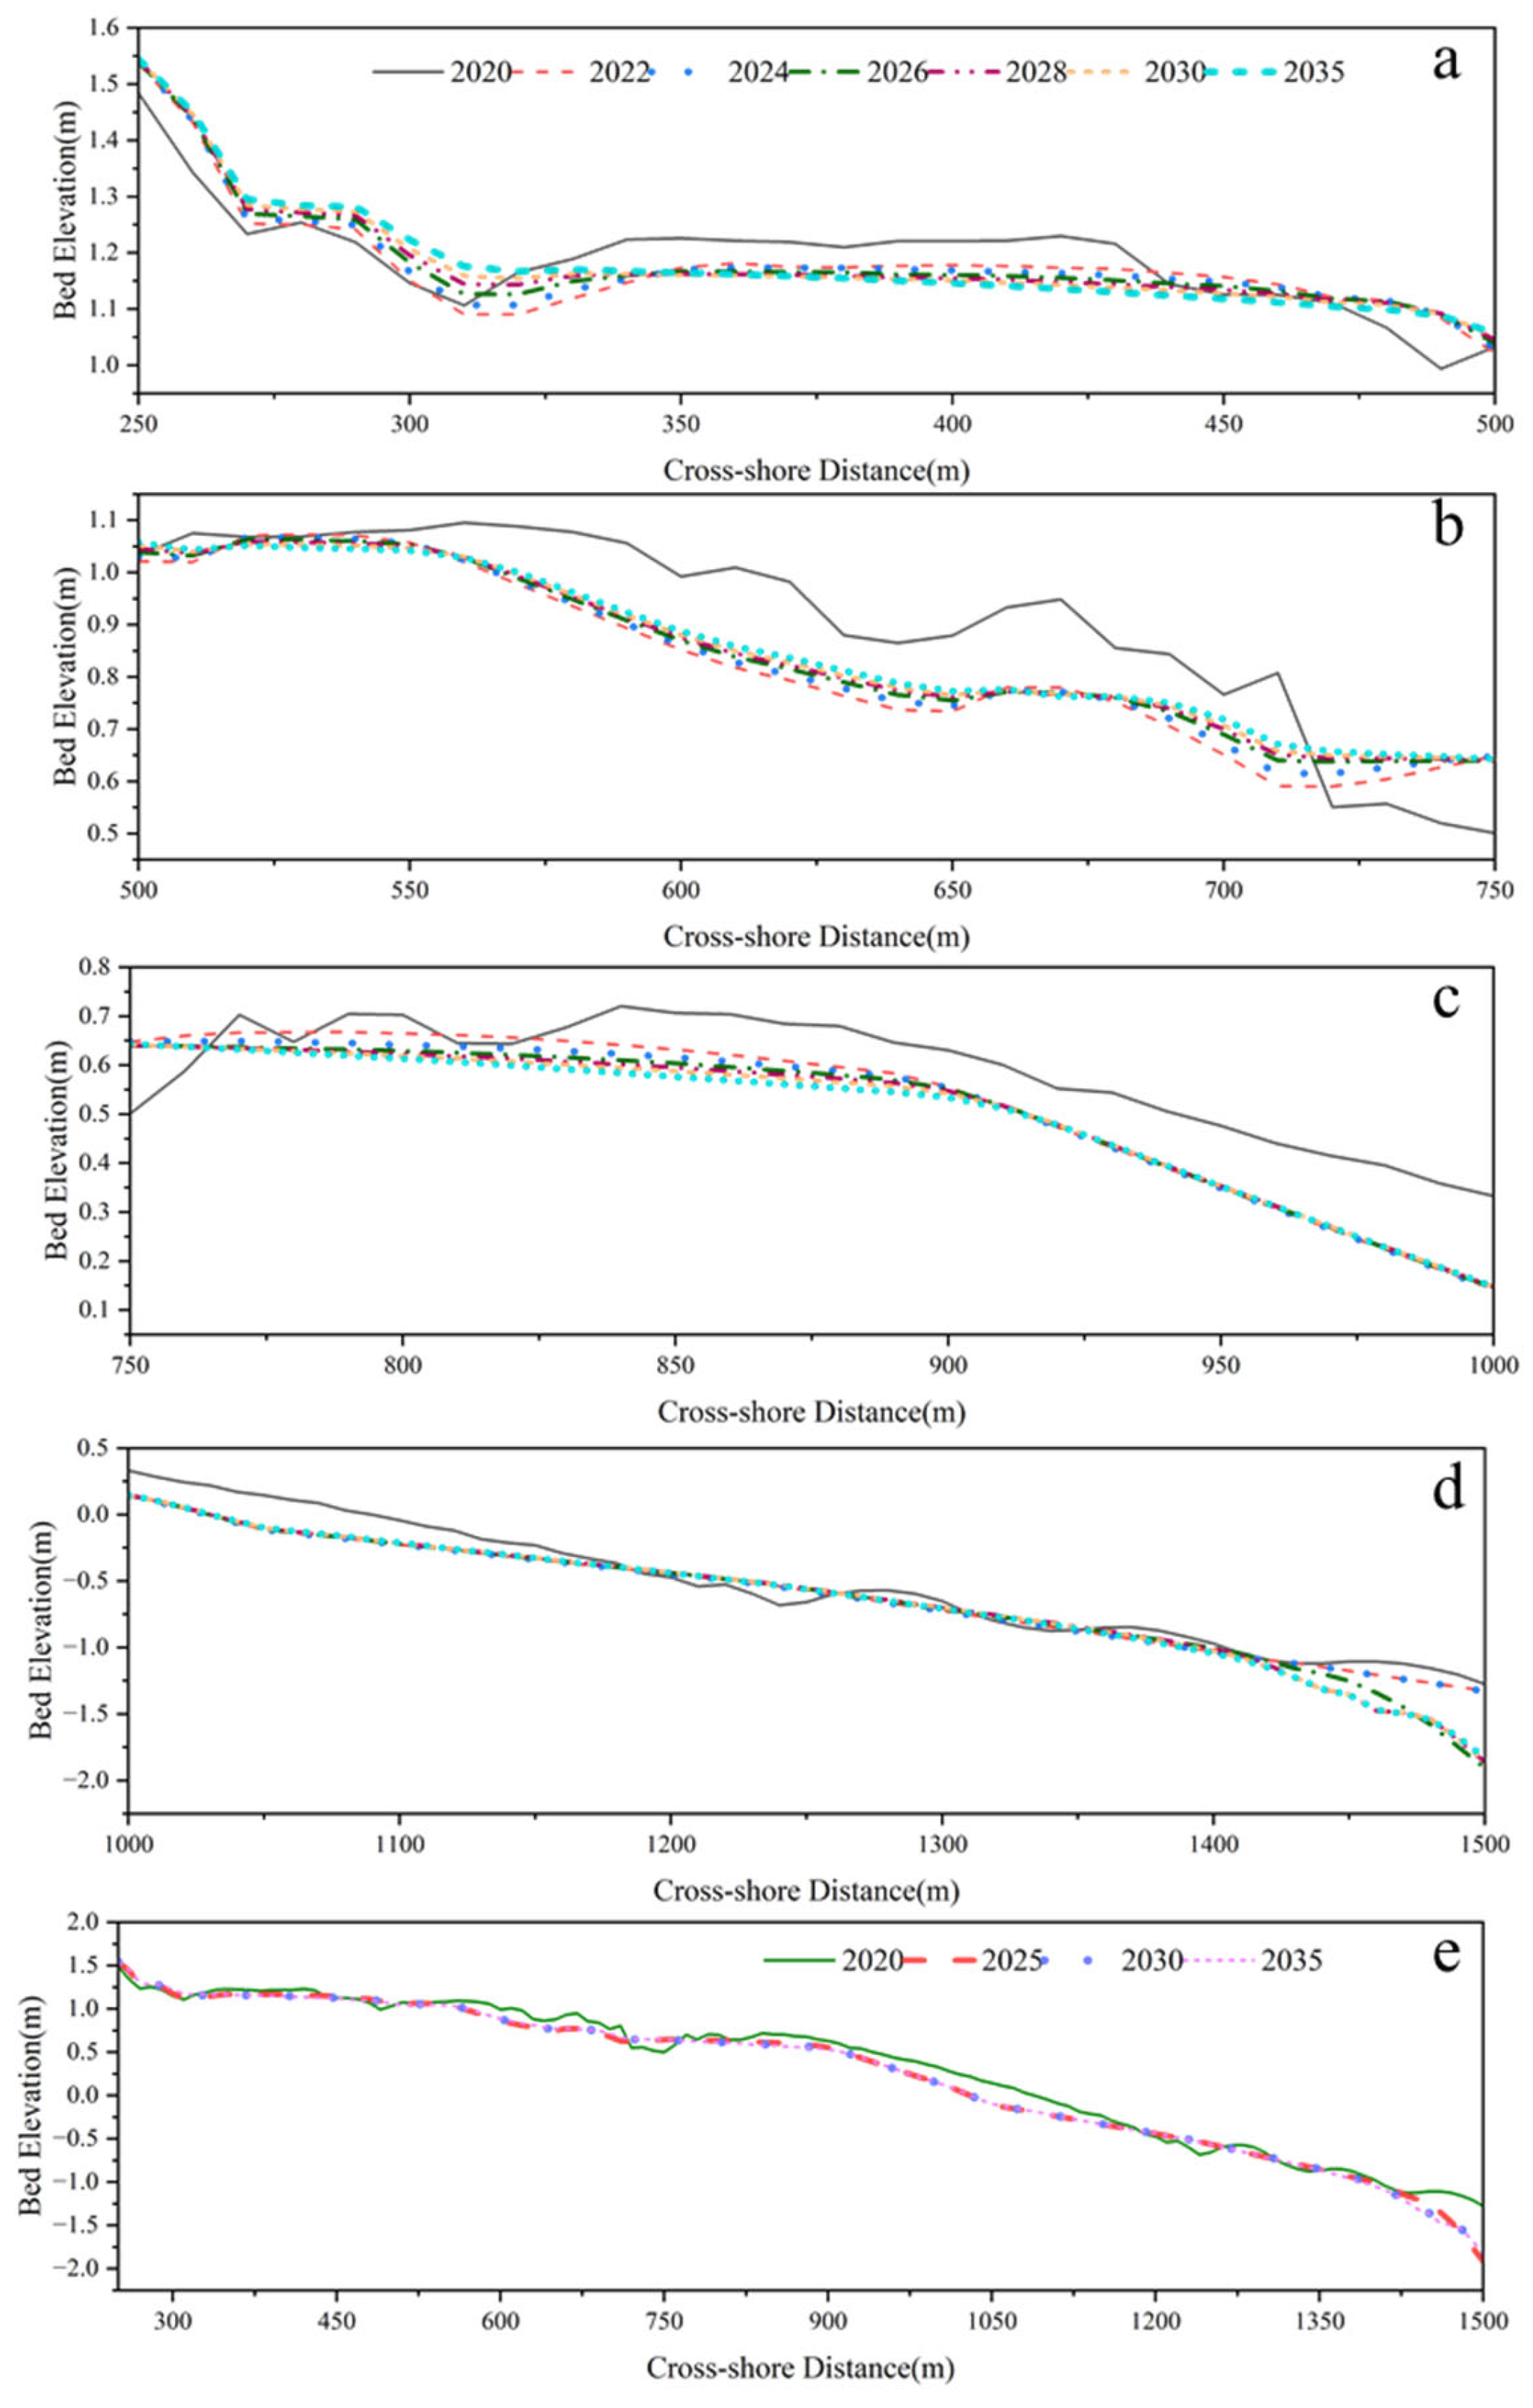
Figure 9a–d illustrates the elevation predictions for four sub-sections of the profile. In the uppermost intertidal zone (250–290 m), the profile remains largely stable over the 15 years, showing only slight accretion trends. The 290–340 m segment initially experiences erosion during the first two years, followed by gradual accretion, reaching a maximum deposition thickness of approximately 0.8 m. The 340–500 m section generally exhibits weak erosion with a decreasing erosion rate. Between 500 and 750 m, after initial erosion in the first two years, the profile shifts to a weak accretion state with a slowing accretion rate, peaking at about 0.6 m deposition. The 750–900 m area maintains weak erosion starting from 2024, with a maximum erosion depth around 0.5 m. The 900–1420 m section remains near dynamic equilibrium, showing no significant erosion or deposition changes. In the lower intertidal shallow zone (1420–1500 m), initial erosion occurs within the first two years, followed by approximately two years of relative stability. Erosion reoccurs around 2026, after which mild accretion from 2026 to 2028 leads to a stabilized state. Figure 9e presents the overall elevation trend for the 250–1500 m segment. Due to relatively small sediment changes in the mid-intertidal zone, its influence on the overall profile morphology is limited. The profile primarily shows sustained accretion at the uppermost intertidal zone and a transition from erosion to mild accretion at the lower intertidal zone. Additionally, the rate of morphological change decreases year by year, indicating that the profile is approaching a dynamic equilibrium.
Taken together, the results suggest that after 2026, no significant morphological changes will occur, and the profile will maintain relative stability. This aligns with Zhang et al. [42], who found that when the profile’s concave point shifts below the theoretical equilibrium depth, the profile tends to stabilize, reaching a balanced and stable state.
The cross-shore profile in this study exhibits a typical “accretion above, erosion below” pattern, characterized by sustained weak accretion in the upper section and a transition from erosion to accretion in the lower section, with overall stability projected after 2026. It is concluded that, under the premise of sediment self-balance within the region and assuming natural hydrodynamic conditions remain unchanged, the “accretion above, erosion below” profile will gradually evolve toward a more regionally smoothed form. The typical morphological features are expected to persist, with the long-term combined influence of tides and waves fostering a stable pattern of differentiated erosion and deposition zones. The erosion-deposition boundary is likely located around 900 m offshore (corresponding to the mean low tide level). This finding also supports Wang et al. [43]’s observation of the “accretion above, erosion below” pattern in the tidal flats near Donglong Port, Jiangsu, where the upper intertidal zone (shallower than −1.6 m) maintains accretion, while the subtidal slope experiences erosion.

4. Discussion

The one-dimensional morphodynamic numerical model developed in this study produces profile morphologies that are similar to the conclusions of previous studies. This is consistent with theoretical and observational conclusions suggesting that tidal flats gradually approach a steady-state profile under both equilibrium and non-equilibrium conditions [44]. By comparing two tidal flats with contrasting wave exposure, Hu et al. [45] found that tidal processes primarily control the overall morphological evolution, while waves mainly induce short-term bed-level fluctuations on wave-exposed flats, and the intensity of storm-induced erosion is strongly modulated by tidal stages. These findings echo the segmented pattern identified in this study—namely, stronger responses on the upper flat during rising tides and enhanced erosion on the lower flat during falling tides—highlighting tidal stage as a key mechanism driving spatial differentiation. Shi et al. [46] also reported that although very-shallow-water stages (<0.2 m) account for only ~11% of the tidal cycle duration, they contribute approximately 35% of total bed-level changes, indicating the critical role of VSWS in sediment dynamics. This aligns closely with the high sensitivity observed in the shallow zones in this study, suggesting that the dynamic effects of very shallow water should not be neglected when simulating and interpreting tidal flat morphodynamics.
Furthermore, this study identified a nonlinear threshold response of the profile to significant wave height (Hs ≈ 1.2 m) and peak period (Tp ≈ 4.5 s). Mechanistically, this result is consistent with the review by Green & Coco [44], who highlighted the strong nonlinearity and conditional dependence of wave-driven sediment transport; even a slight increase in wave energy under very shallow conditions can trigger substantial sediment resuspension and redistribution. The nonlinear threshold identified here indicates that pronounced segmented responses of the tidal flat (upper deposition, lower erosion) can occur even under sub-storm wave conditions. This extends previous understanding of wave–tide–sediment coupling: over long timescales, waves are the primary driver of tidal flat erosion, while tidal currents favor deposition [47]; yet, within a single tidal cycle, even moderate wave energy changes under VSWS and cohesive mud conditions can induce significant local bed adjustments.
On the other hand, the one-dimensional model used in this study decouples alongshore sediment transport from channel–sandbar interactions and thus cannot capture the regulatory effects of alongshore tidal currents on sediment composition and dynamics of the lower flat. Wang et al. [48] showed that even under wave-free conditions, alongshore tidal currents can dominate sand–mud zonation and bed dynamics on the lower flat, whereas the upper flat remains primarily controlled by cross-shore currents. Consequently, the timing and magnitude of local bed responses in this study differ from those derived from two-dimensional modeling or long-term field observations, particularly regarding sediment composition and the spatial distribution of erosion and deposition on the lower flat. Future studies should incorporate the characteristics of the study area, integrate sediment mixture effects to enhance the comprehensiveness of simulations, and further consider the evolutionary trends of salt marshes along the Jiangsu coast following large-scale Spartina alterniflora removal. Nonetheless, the successful application of this model in the intertidal zone provides a valuable reference for the Dafeng Port area, and the anticipated dynamic equilibrium around 2026 offers a scientific basis for coastal management and protection strategies. Looking ahead, developing a high-resolution, computationally efficient, and well-validated two-dimensional model of the central Jiangsu tidal flats will represent a more challenging and highly meaningful endeavor, particularly under scenarios of global climate change and anthropogenic interventions.

5. Conclusions

In this study, we develop a one-dimensional morphodynamic model to explore the future erosion–deposition evolution of the coastal profile under current hydrodynamic conditions. The segmented response mechanisms of the Dafeng Port coastal segment under altered hydrodynamic forcing are emphatically discussed. The main conclusions are as follows:
(1)
The topographic validation results indicate that the constructed one-dimensional morphodynamic model can reliably reproduce the erosion–deposition evolution of the tidal flat profile along the Dafeng Port coast—currently in an accretion-to-erosion transition—on an interannual scale. In the main profile section (250–1500 m), the simulated results are highly consistent with the measured elevations, demonstrating high accuracy and reliability, making the model suitable for long-term morphological trend analysis and prediction. Although some discrepancies in erosion–deposition magnitude are observed on the monthly scale—mainly due to the exclusion of seasonal wave variations—the overall trends and spatial responses align well with field observations, providing a solid foundation for identifying the mechanisms of profile evolution.
(2)
The erosion and deposition processes of the profile exhibit significant nonlinear responses to wave parameters. Among them, critical transition points in sediment response efficiency appear around an effective wave height of 1.2 m and a peak period of 4.5 s, reflecting phased changes in the profile’s reaction to wave disturbances. Additionally, different profile segments display strong spatial heterogeneity under wave forcing, with clearly defined accretion and erosion zones, and some areas exhibiting non-monotonic response trends.
(3)
The upper tidal flat primarily undergoes erosion and deposition changes dominated by accretion during flood tide during storm tide events, with weakened responses during ebb tide. In contrast, the middle to lower tidal flat and shallow water zones experience significantly enhanced erosion during ebb tide, while sediment changes during flood tide are comparatively subdued, forming a differentiated pattern of “upper flood tide response and lower ebb tide response.”
(4)
Predictive results show persistent weak accretion in the upper intertidal zone, with shallow water areas transitioning from early erosion to recovery accretion. The middle section largely maintains dynamic equilibrium or slight erosion, and the rate of sediment change decreases annually, indicating that the profile is expected to remain relatively stable after 2026. The profile retains the typical “accretion above, erosion below” pattern. The upper section shows continuous accretion. The lower section transitions from erosion to accretion. The erosion–accretion boundary is likely around 900 m offshore (mean low water level). Under long-term hydrodynamic forcing, local morphological undulations gradually diminish. Eventually, the profile approaches a stable shape with minimal resistance.
Overall, this study demonstrates that a one-dimensional morphodynamic model, grounded in equilibrium profile theory, can effectively simulate the long-term evolution of muddy tidal flats under sediment-limited, wave-dominated conditions. The model successfully captures key nonlinear and phase-dependent morphological responses, providing valuable insights into the mechanisms governing profile stability and transformation. These findings also offer a scientific basis for the adaptive management of Jiangsu’s muddy coasts.

Author Contributions

Conceptualization, T.L. and L.W.; methodology, T.L.; software, T.L.; validation, T.L., L.W. and J.C.; formal analysis, T.L. and L.W.; investigation, T.L.; resources, M.X. and Y.Z.; data curation, T.L.; writing—original draft preparation, T.L.; writing—review and editing, L.W., Y.Z., H.Z. and M.X.; visualization, T.L.; supervision, Y.Z., L.W. and M.X.; project administration, M.X.; funding acquisition, M.X. All authors have read and agreed to the published version of the manuscript.

Funding

This research was funded by the National Natural Science Foundation of China (42206168), Jiangsu Key Laboratory of Coast Ocean Resources Development and Environmental Security, Hohai University (JSCE202303) and Planning and Formulation of Erosive Coastal Management for Yancheng City (YCFS-2305-06).

Data Availability Statement

The raw data supporting the conclusions of this article will be made available by the authors on request.

Conflicts of Interest

The authors declare no conflicts of interest.

Appendix A

Table A1 presents the grain-size characteristics of surface sediment samples collected by the research team in August 2023. The samples were distributed along a 1400 m cross-shore profile at intervals of approximately 80–100 m, with coordinates provided for each sampling point. Based on the mean D50 value of approximately 55.8 µm calculated from the 14 samples, we chose to model the profile using a single cohesive sediment. The relatively fine D50 indicates that the sediment is dominated by silt, making a mixed sand–mud approach unnecessary and justifying the use of a uniform cohesive mud for the simulation.
Table A1. Sediment grain-size parameters of surface samples in the study area (used for model input).
Sample No.Dx (16) (μm)Dx (84) (μm)Dx (50) (μm)MZ (μm)Latitude (°)Longitude
(°)
DF 015.963.529.132.933.2838120.7738
DF 024.761.326.030.733.2841120.7745
DF 0326.073.247.748.933.2842120.7750
DF 0442.1108.073.174.433.2844120.7755
DF 0515.083.151.049.733.2846120.7763
DF 0643.2117.076.478.833.2848120.7771
DF 0738.4113.075.675.633.2851120.7780
DF 0837.7106.070.571.433.2855120.7788
DF 0946.5109.076.177.233.2859120.7796
DF 1037.2105.069.170.433.2865120.7802
DF 1131.188.357.759.033.2870120.7809
DF 1220.783.551.751.933.2874120.7816
DF 1314.586.254.951.833.2878120.7824
DF 144.770.823.432.633.2882120.7830
To analyze the influence of significant wave height ( H s ) on cross-shore erosion-deposition patterns, five wave parameter combinations were established (Table A2). All cases maintained constant values for peak period ( T p = 4.5 s), JONSWAP peak enhancement factor ( γ = 3.3), mean wave direction ( θ = 90°), and directional spreading coefficient ( Δ θ = 25°), while only varying the significant wave height (0.6–2.0 m). This experimental design quantifies the influence of wave height on morphodynamic processes through a gradient of wave conditions, from calm to stormy.
Table A2. Wave parameters for significant wave height sensitivity analysis.
T p (s) H s (m)Peak Enhancement FactorDirectional Spreading (°)Direction (°)
4.50.63.32590
0.8
1.2
1.6
2.0
To investigate the influence of peak period ( T p ) on cross-shore morphodynamics, seven simulation cases were established (Table A3). All scenarios maintained constant values for significant wave height ( H s = 0.8 m), JONSWAP peak enhancement factor ( γ = 3.3), mean wave direction ( θ = 90°), and directional spreading coefficient ( Δ θ = 25°), while systematically varying the peak period (3.0–6.0 s). This experimental design quantifies the influence of peak period on morphodynamic processes through a gradient of wave conditions, from calm to stormy.
Table A3. Wave parameters for peak period sensitivity analysis.
H s (m) T p (s) Peak Enhancement FactorDirectional Spreading (°)Direction (°)
0.83.03.32590
3.6
4.2
4.5
4.8
5.4
6.0

References

  1. Hulskamp, R.; Luijendijk, A.; van Maren, B.; Moreno-Rodenas, A.; Calkoen, F.; Kras, E.; Lhermitte, S.; Aarninkhof, S. Global distribution and dynamics of muddy coasts. Nat. Commun. 2023, 14, 8259. [Google Scholar] [CrossRef] [PubMed]
  2. Murray, N.J.; Phinn, S.R.; Dewitt, M.; Ferrari, R.; Johnston, R.; Lyons, M.B.; Clinton, N.; Thau, D.; Fuller, R.A. The global distribution and trajectory of tidal flats. Nature 2019, 565, 222–225. [Google Scholar] [CrossRef]
  3. Ma, H.; Xu, L.; Okon, S.U.; Hu, P.; Li, W.; Shi, H.; He, Z. Sediment transport and bed erosion during storm surge using a coupled hydrodynamic and morphodynamic model considering wave and current interaction. Coast. Eng. 2024, 187, 104409. [Google Scholar] [CrossRef]
  4. Li, X.; Bellerby, R.; Craft, C.; Widney, S.E. Coastal wetland loss, consequences, and challenges for restoration. Anthr. Coasts 2018, 1, 1–15. [Google Scholar] [CrossRef]
  5. Luque, P.; Gomez-Pujol, L.; Ribas, F.; Falqués, A.; Marcos, M.; Orfila, A. Shoreline response to sea-level rise according to equilibrium beach profiles. Sci. Rep. 2023, 13, 15789. [Google Scholar] [CrossRef]
  6. Kirby, R. Practical implications of tidal flat shape. Cont. Shelf Res. 2000, 20, 1061–1077. [Google Scholar] [CrossRef]
  7. Pieterse, A.; Puleo, J.A.; Mckenna, T.E. Hydrodynamics and sediment suspension in shallow tidal channels intersecting a tidal flat. Cont. Shelf Res. 2016, 119, 40–55. [Google Scholar] [CrossRef]
  8. Wei, W.; Dai, Z.; Pang, W.; Wang, J.; Gao, S. Sedimentary zonation shift of tidal flats in a meso-tidal estuary. Sediment. Geol. 2020, 407, 105749. [Google Scholar] [CrossRef]
  9. Igor, O.L. Sediment transport and beach equilibrium profile. Coast. Eng. 1985, 9, 277–291. [Google Scholar] [CrossRef]
  10. Jara, M.S.; González, M.; Medina, R. Shoreline evolution model from a dynamic equilibrium beach profile. Coast. Eng. 2015, 99, 1–14. [Google Scholar] [CrossRef]
  11. Mariotti, G.; Fagherazzi, S. A numerical model for the coupled long-term evolution of salt marshes and tidal flats. J. Geophys. Res. Earth Surf. 2010, 115, 2009JF001326. [Google Scholar] [CrossRef]
  12. Yang, L.; Chi, Y.; Lu, H.; Sun, G.; Lu, Y.; Li, H.; Luo, Y. Effects of the comprehensive elimination of Spartina alterniflora along China’s coast on blue carbon scenario prediction after ecological restoration. J. Environ. Manag. 2024, 369, 122283. [Google Scholar] [CrossRef] [PubMed]
  13. Chen, S.; Gu, W.; Shi, B.; Chen, Y.; Chatzipavlis, A.; Ding, J.; Zhang, W.; Chen, Q.; Wang, Y.P. Sediment dynamic responses of coastal salt marsh to wind waves swells in a semi-open tidal flat. Sci. Total Environ. 2024, 954, 176562. [Google Scholar] [CrossRef] [PubMed]
  14. Wang, D.; Gao, S.; Zhao, Y.; Chatzipavlis, A.; Chen, Y.; Gao, J.; Zhao, Y. An eco-parametric method to derive sedimentation rates for coastal saltmarshes. Sci. Total Environ. 2021, 770, 144756. [Google Scholar] [CrossRef]
  15. Hu, Z.; Wang, Z.B.; Zitman, T.J.; Stive, M.J.F.; Bouma, T.J. Predicting long-term short-term tidal flat morphodynamics using a dynamic equilibrium theory. JGR Earth Surf. 2015, 120, 1803–1823. [Google Scholar] [CrossRef]
  16. Gao, S.; Zhu, D. A Preliminary Study on the Profiles of the Muddy Coast in Jiangsu. J. Nanjing Univ. (Nat. Sci. Ed.) 1988, 24, 75–84. [Google Scholar]
  17. Gao, S.; Jia, J.; Yu, Q. Theoretical framework for coastal accretion-erosion analysis: Material budgeting, profile morphology, shoreline change. Mar. Geol. Quat. Geol. 2023, 43, 42–43. [Google Scholar] [CrossRef]
  18. Fan, D.; Li, C.; Archer, A.W. Temporal distribution of diastems in deposits of an open-coast tidal flat with high suspended sediment concentrations. Sediment. Geol. 2002, 152, 173–181. [Google Scholar] [CrossRef]
  19. Jiang, H.; Chai, C.; Zhang, M. Numerical study on the influence of salt marsh plants on coastal wetland hydrodynamics and suspended sediment transport. Front. Environ. Sci. 2023, 11, 1180457. [Google Scholar] [CrossRef]
  20. Wang, J.; Chu, A.; Dai, Z.; Nienhuis, J. Delft3D model-based estuarine suspended sediment budget with morphodynamic changes of the channel-shoal complex in a mega fluvial-tidal delta. Eng. Appl. Comput. Fluid Mech. 2024, 18, 2300763. [Google Scholar] [CrossRef]
  21. Xu, Z.; Wu, S.; Yue, D.; Zhao, J.; Deng, M.; Liu, Z.; Zhang, J.; Liu, M.; Feng, W. Effects of upstream conditions on digitate shallow-water delta morphology. Mar. Pet. Geol. 2021, 134, 105333. [Google Scholar] [CrossRef]
  22. Zhu, K.; Zeng, J.; Ge, Z.; Zuo, Y.; Li, S.-H.; Zhao, L.-H.; Han, Y.; Cheng, H.-F.; Xin, P. A model coupling ecological and hydrodynamic processes for simulating the biogeomorphology of a coastal salt marsh. Ecol. Model. 2024, 493, 110758. [Google Scholar] [CrossRef]
  23. Bakhtyar, R.; Maitaria, K.; Velissariou, P.; Trimble, B.; Mashriqui, H.; Moghimi, S.; Abdolali, A.; Van der Westhuysen, A.J.; Ma, Z.; Clark, E.P.; et al. A New 1D/2D Coupled Modeling Approach for a Riverine-Estuarine System Under Storm Events: Application to Delaware River Basin. J. Geophys. Res. Ocean. 2020, 125, e2019JC015822. [Google Scholar] [CrossRef]
  24. Cooper, C.; Eidam, E.; Seim, H.; Nienhuis, J. Effects of Sea Ice on Arctic Delta Evolution: A Modeling Study of the Colville River Delta, Alaska. J. Geophys. Res. Earth Surf. 2024, 129, e2024JF007742. [Google Scholar] [CrossRef]
  25. van der Wegen, M.; Jaffe, B.; Foxgrover, A.; Roelvink, D. Mudflat Morphodynamics and the Impact of Sea Level Rise in South San Francisco Bay. Estuaries Coasts 2017, 40, 37–49. [Google Scholar] [CrossRef]
  26. Chen, J.; Wang, Y.; Cai, H. Profile characteristics study of the Jiangsu coast. Ocean. Eng. 2010, 28, 90–96. [Google Scholar] [CrossRef]
  27. Wang, Y.; Liu, Y.; Jin, S.; Sun, C.; Wei, X. Evolution of the topography of tidal flats and sandbanks along the Jiangsu coast from 1973 to 2016 observed from satellites. ISPRS J. Photogramm. Remote Sens. 2019, 150, 27–43. [Google Scholar] [CrossRef]
  28. Zhou, Y.; Zhang, Z.; Lu, K. Evolution of the Silt-Muddy Coastline and Land Reclamation along the Jiangsu Coast, 1985–2002. Mar. Geol. Front. 2010, 26, 7–11. [Google Scholar] [CrossRef]
  29. Cao, J.; Liu, Q.; Yu, C.; Chen, Z.; Dong, X.; Xu, M.; Zhao, Y. Extracting waterline and inverting tidal flats topography based on Sentinel-2 remote sensing images: A case study of the northern part of the North Jiangsu radial sand ridges. Geomorphology 2024, 461, 109323. [Google Scholar] [CrossRef]
  30. Fan, Y.; Peng, Y.; Wang, Y. Seasonal and interannual evolution of geomorphology in middle Jiangsu tidal flat from 2017 to 2020. Mar. Geol. Quat. Geol. 2023, 43, 43–46. [Google Scholar] [CrossRef]
  31. Chen, Y.; Liu, Q.; Xu, M.; Wang, Z. Inter-annual variability of heavy metals pollution in surface sediments of Jiangsu coastal region, China: Case study of the Dafeng Port. Mar. Pollut. Bull. 2020, 150, 110720. [Google Scholar] [CrossRef]
  32. Gong, Z.; Huang, S.; Hu, B.; Zhu, S.; Zhang, Y.; Zhou, Z. Evolution of tidal flat in response to storm surges:a case study from the central Jiangsu Coast. Adv. Water Sci. 2019, 30, 243–254. [Google Scholar] [CrossRef]
  33. Wang, Y.; Wang, Y.; Yu, Q.; Cai, H.; Gao, S. Characteristics of tides and tidal currents at central Jiangsu coast, China. Mar. Sci. 2019, 43, 1–9. [Google Scholar]
  34. Li, F.; Zhao, J.; Zhao, P.; Wen, S.; Zhou, C. Comprehensive Evaluation of Coastline Development and Utilization Intensity-A case study of Dafeng China. IOP conference series. Earth Environ. Sci. 2018, 199, 22052. [Google Scholar] [CrossRef]
  35. Best, Ü.S.N.; Van der Wegen, M.; Dijkstra, J.; Willemsen, P.W.J.M.; Borsje, B.W.; Roelvink, D.J.A. Do salt marshes survive sea level rise? Modelling wave action, morphodynamics and vegetation dynamics. Environ. Model. Softw. 2018, 109, 152–166. [Google Scholar] [CrossRef]
  36. Hibma, A.; Schuttelaars, H.M.; Wang, Z.B. Comparison of longitudinal equilibrium profiles of estuaries in idealized and process-based models. Ocean. Dyn. 2003, 53, 252–269. [Google Scholar] [CrossRef]
  37. Zhou, Z.; Ye, Q.; Coco, G. A one-dimensional biomorphodynamic model of tidal flats; sediment sorting, marsh distribution, and carbon accumulation under sea level rise. Adv. Water Resour. 2016, 93, 288–302. [Google Scholar] [CrossRef]
  38. Gong, Z.; Jin, C.; Zhang, C.; Li, H.; Xin, P. Surface elevation variation of the Jiangsu mudflats: Field observation. Adv. Water Sci. 2014, 25, 880–887. [Google Scholar]
  39. Pan, H.; Xu, T.; Wei, Z. Improved tidal estimates from short water level records via the modified harmonic analysis model. Ocean. Model. 2024, 189, 102372. [Google Scholar] [CrossRef]
  40. Pan, H.; Lv, X.; Wang, Y.; Matte, P.; Chen, H.; Jin, G. Exploration of Tidal-Fluvial Interaction in the Columbia River Estuary Using S_TIDE. J. Geophys. Res. 2018, 123, 6598–6619. [Google Scholar] [CrossRef]
  41. Kitamura, A.; Yuka, Y.; Kenji, H.; Toyofuku, T. Identifying storm surge deposits in the muddy intertidal zone of Ena Bay, Central Japan. Mar. Geol. 2020, 426, 106228. [Google Scholar] [CrossRef]
  42. Zhang, Y.; Yu, Z.; Jin, L. Numerical Simulation of Muddy Beach Profile Erosion under Wave Action: A Case from Northern Jiangsu. Acta Oceanol. Sin. (Chin. Ed.) 1993, 4, 74–83. [Google Scholar]
  43. Wang, Y.; Wang, Y.; Deng, A.; Feng, H.-C.; Wang, D.-W.; Guo, C.-S. Emerging Downdrift Erosion by Twin Long-Range Jetties on an Open Mesotidal Muddy Coast, China. J. Mar. Sci. Eng. 2022, 10, 570. [Google Scholar] [CrossRef]
  44. Friedrichs, C.T. Tidal Flat Morphodynamics: A Synthesis. In Treatise on Estuarine and Coastal Science: Sedimentology and Geology; Flemming, B.W., Hansom, J.D., Eds.; Elsevier: Amsterdam, The Netherlands, 2011; pp. 137–170. [Google Scholar]
  45. Hu, Z.; Yao, P.; Van Der Wal, D.; Bouma, T.J. Patterns and drivers of daily bed-level dynamics on two tidal flats with contrasting wave exposure. Sci. Rep. 2017, 7, 7088. [Google Scholar] [CrossRef]
  46. Shi, B.; Cooper, J.R.; Pratolongo, P.D.; Gao, S.; Bouma, T.J.; Li, G.; Li, C.; Yang, S.L.; Wang, Y.P. Erosion and accretion on a mudflat: The importance of very shallow-water effects. J. Geophys. Res. Ocean. 2017, 122, 9476–9499. [Google Scholar] [CrossRef]
  47. Green, M.O.; Coco, G. Review of wave-driven sediment resuspension and transport in estuaries. Rev. Geophys. 2014, 52, 77–117. [Google Scholar] [CrossRef]
  48. Wang, Y.; Wang, Y.P.; Yu, Q.; Du, Z.; Wang, Z.B.; Gao, S. Sand-mud tidal flat morphodynamics influenced by alongshore tidal currents. J. Geophys. Res. Ocean. 2019, 124, 3818–3836. [Google Scholar] [CrossRef]
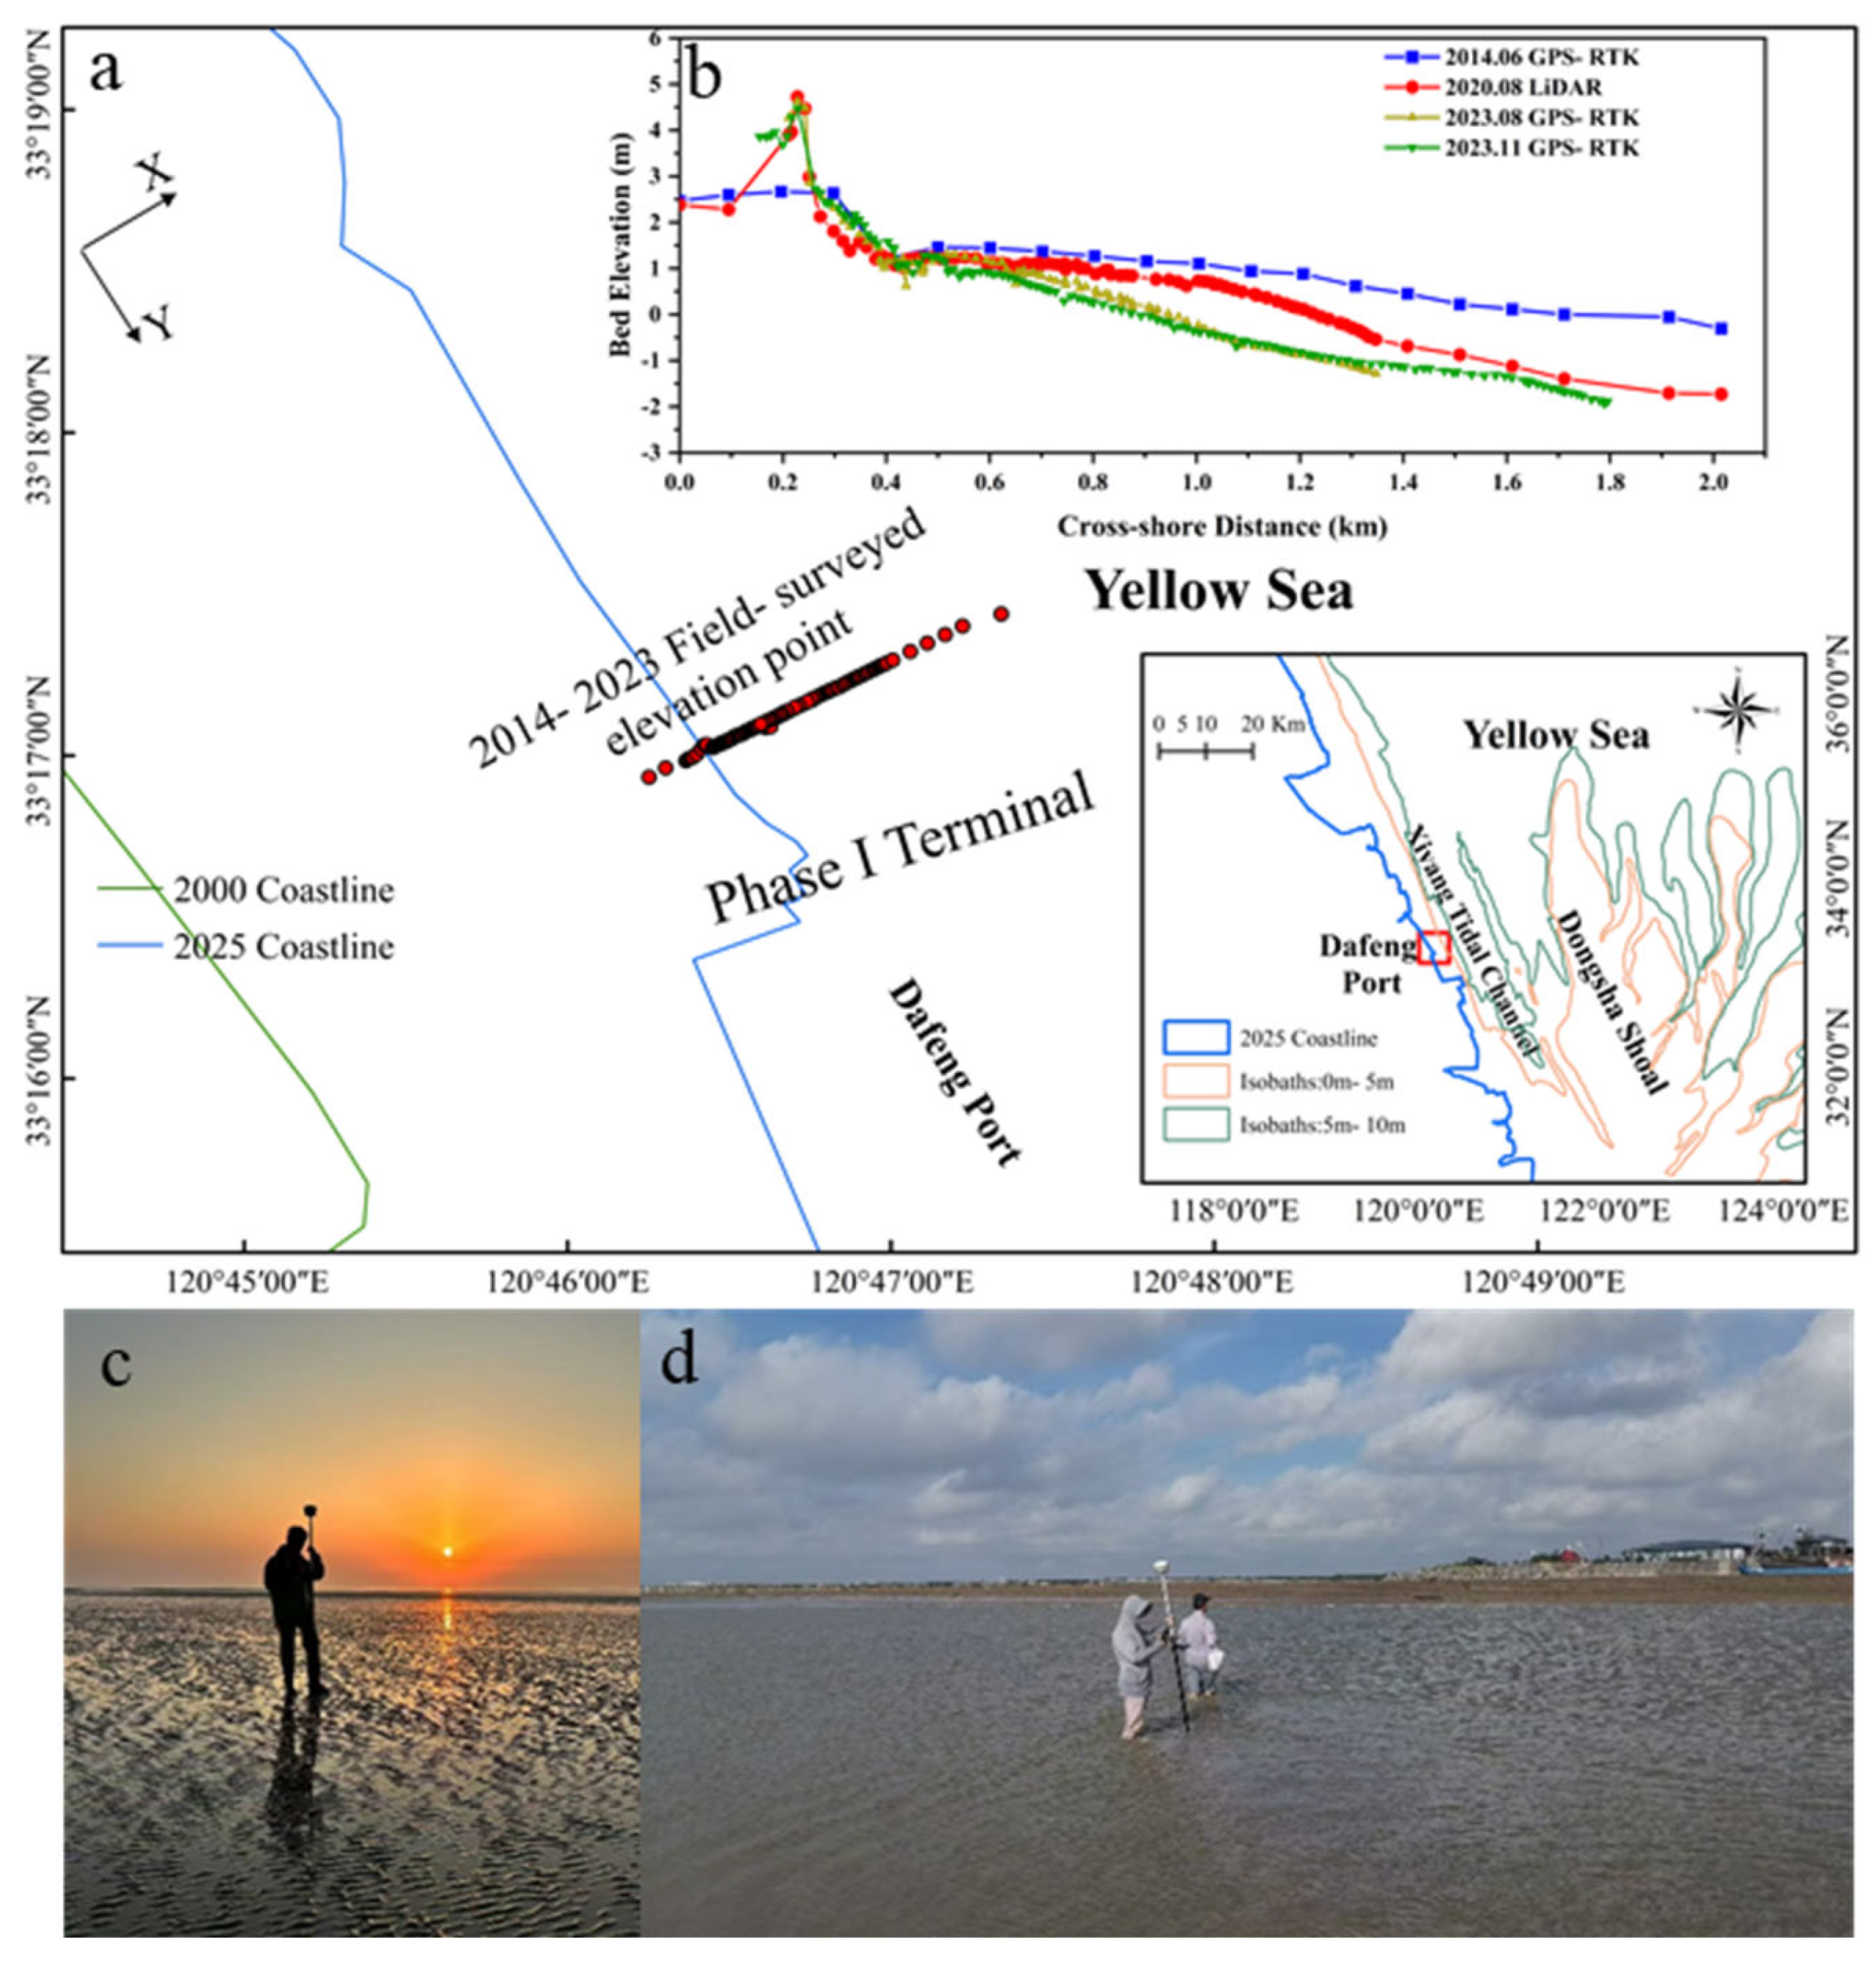
Figure 1. (a) Coastline changes along the Dafeng Port coast and the study area; (b) cross-shore profile morphology in the study area; and (c,d) intertidal elevation measurements.
Jmse 13 01746 g001
Figure 2. Measured and harmonic tidal levels.
Jmse 13 01746 g002
Figure 3. Profile elevations and monthly averaged erosion–deposition trends: (a) 3-year period; (b) 4-month period.
Jmse 13 01746 g003
Figure 4. Linear regression of simulated and measured monthly average erosion–deposition: (a) 3-year period at 250–1620 m; (b) 3-year period at 250–1500 m; (c) 4-month period at 250–1620 m; and (d) 4-month period at 250–1500 m.
Jmse 13 01746 g004
Figure 5. Sediment erosion and deposition trends along the profile under different significant wave heights: (a) overall erosion and deposition trends; (bg) zoomed-in views of specific sections.
Jmse 13 01746 g005
Figure 6. Trends of profile erosion and deposition under different peak periods: (a) overall sediment flux trend; (bg) zoomed-in views of specific segments.
Jmse 13 01746 g006
Figure 7. Water level from 00:00 on 13 September to 00:00 on 16 September.
Jmse 13 01746 g007
Figure 8. Erosion and deposition trends of the profile during the storm tide period: (a) overall erosion and deposition trend; (bg) enlarged views of specific areas.
Jmse 13 01746 g008
Figure 9. Profile growth trends over 15 years: (ad) enlarged views of 250–1500 m sections; (e) overall trend of the 250–1500 m section.
Jmse 13 01746 g009
Disclaimer/Publisher’s Note: The statements, opinions and data contained in all publications are solely those of the individual author(s) and contributor(s) and not of MDPI and/or the editor(s). MDPI and/or the editor(s) disclaim responsibility for any injury to people or property resulting from any ideas, methods, instructions or products referred to in the content.