Article

Accurate Extraction Method for Continental Margin FOS Line Considering Terrain Continuity

1
Department of Military Oceanography and Hydrography, Dalian Naval Academy, Dalian 116018, China
2
Unit 52, Force 92493, Huludao 125000, China
3
Force 92999, Tianjin 300450, China
*
Author to whom correspondence should be addressed.
J. Mar. Sci. Eng. 2025, 13(9), 1744; https://doi.org/10.3390/jmse13091744
Submission received: 8 August 2025 / Revised: 9 September 2025 / Accepted: 9 September 2025 / Published: 10 September 2025
(This article belongs to the Special Issue Data-Driven Methods for Marine Structures, Second Edition)

Abstract

This paper addresses the limitations and low efficiency of current methods for precise identification of continental margin break points in the delimitation of the outer continental shelf. From a three-dimensional perspective, it proposes a novel method for extracting the foot-of-slope (FOS) line of the continental margin that considers terrain continuity. First, the algorithm uses the rolling ball transform to classify the strength of the attributes of negative topographic feature lines of the seafloor. Then, it conducts experiments on two sets of negative topographic feature lines with strong and weak attributes. By calculating the proportion of the intersection of weak attribute lines with strong ones, it establishes a hierarchical pattern of importance for these lines. Subsequently, the algorithm integrates a multi-factor screening process for the continental margin FOS line. Finally, it achieves accurate and efficient extraction of the FOS line while preserving terrain continuity. The method’s effectiveness is verified through visual interpretation, comparison, and efficiency experiments in a real digital depth model. The results indicate that the algorithm can accurately extract the FOS line, effectively distinguish the continental margin, and maintain high efficiency.

1. Introduction

China’s extensive and continuous continental margin holds significant strategic importance for its political and military geography, while the abundant oil, natural gas, and mineral resources within it potentially have substantial economic benefits [1,2]. In 1982, the Chinese government signed the United Nations Convention on the Law of the Sea (UNCLOS) and formally ratified it in 1996 [3]. For coastal states, studying the geological evolution of the continental shelf and using quantifiable technical means to determine its outer limits, in line with the UNCLOS framework, is vital. Such research helps address national sovereignty issues, legally expand maritime jurisdiction [4,5], clarify resource development rights, reduce maritime disputes with neighboring countries, boost the marine economy, and enhance international cooperation, thus ensuring regional stability and security.
According to Article 76 of the UNCLOS [6,7], the outer limit of the extended continental margin is determined by the inner envelope of two lines: the outer envelope of the formula-defined line and that of the constraint line. The outer envelope of the formula-defined line is determined in two ways. First, under Article 76 (4) (a) (i) of the UNCLOS, each point on the line must have a sediment-thickness to distance ratio of at least 1% (i.e., the sedimentary thickness formula line). Second, under Article 76 (4) (a) (ii) of the UNCLOS, the line must be no more than 60 nautical miles from the foot of the continental slope (i.e., the 60 nautical mile formula line) [8,9]. Regardless of the method chosen, the foot of the continental slope is the benchmark for determining the outer envelope of the formula-defined line. As stated in Article 76 (4) (b) of the UNCLOS, in the absence of evidence to the contrary, the foot of the continental slope is the point of maximum change in the slope of the seabed [10]. The foot of the continental slope (FOS) is a key geographical concept with profound legal implications, and it is crucial for studying the delimitation of the outer continental shelf [10].
However, China’s adjacent seas feature a typical active continental margin with complex geological structures and highly variable seabed topography [11]. This makes it difficult to identify the FOS based on the definition in the UNCLOS. In China, FOS-identification research is still in its infancy, and limited methods are available. Wu et al. [12] analyzed seabed-profile changes and used the second derivative extremum method and the Douglas–Peucker (D–P) algorithm to identify the FOS. However, their approach lacks a clear standard for selecting seabed profiles and cannot directly utilize raw multibeam bathymetric data. Zhuang [13] proposed a method for calculating the FOS position based on depth-gradient variation and making a comprehensive judgment using contrary evidence. Yet, due to the limitations of seabed-profile objects, it is difficult to achieve comprehensive FOS identification.
Compared with research in China, foreign studies on the FOS started earlier and mainly focused on passive continental margins such as those bordering the Atlantic Ocean [14] where the seabed topography is relatively simple. CARIS LOTS, a common delimitation software [12], can extract the FOS from seabed-profile data, but its algorithm is not publicly available, hindering technical exchanges. Ou et al. [15] proposed converting depth-sounding data into a maximum-curvature surface and tracking ridge lines to extract the FOS. However, this method may misjudge the FOS in three-dimensional space. Pantland [16] improved the maximum-curvature-surface-based method by enhancing the gradient calculation and curvature analysis, but his research lacks experimental evaluation of FOS extraction results at multiple scales, as well as optimized experimental data, which affects the accuracy of the FOS extraction.
As line elements in a digital depth model (DDM) that depict significant terrain changes, topographic feature lines include ridges, valleys, saddles, and platforms [17]. The FOS line, which is located at the edge of the continental margin and connects points with the maximum slope change at the bottom of the continental slope, reflects the significant slope variations that occur where the seabed transitions from continental to oceanic crust. As it is essentially a special topographic feature line, it is logical to incorporate it into the general delineation system of topographic feature lines, which can improve the delineation efficiency and accuracy. In this field, the surface runoff simulation method [18,19,20] is a common technique for extracting topographic features such as ridges and valleys, but it cannot directly identify breaklines [21], limiting its application in FOS line research. Zhang et al. [22] explored the rolling ball transformation for terrain recognition and analyzed the relationship between terrain contact points and the rolling ball radius to achieve continuous terrain feature division. This provides a foundation for linking topographic feature lines with the rolling ball transformation. Dong and Zhang [17] proposed the concept of negative topographic feature points during automatic extraction of topographic feature lines from triangulated irregular network (TIN)-DDMs, distinguishing valley points and downhill break points. However, their method cannot differentiate the relationship between the foot of the continental slope point and negative topographic feature points, so it cannot directly delineate the continental slope foot line accurately.
In this study, we aimed to fulfill the task of identifying continental margin FOS points. We strove to precisely extract the continental margin FOS line, offering fresh solutions for continental margin delimitation. Building on conventional terrain feature line extraction methods, in this study, we leveraged the rolling ball transformation to take advantage of its accurate terrain recognition capabilities [23]. This approach enables precise extraction of negative topographic feature lines and clear differentiation of the feature attribute intensity. In this study, we also conducted experiments on two feature-attribute groups of negative topographic feature lines: a strong-feature group and a weak-feature group. Moreover, we incorporated the concept of connected components from graph theory to construct connected components for both the strong- and weak-feature groups. By calculating the intersection ratio of the weak- and strong-feature groups, we established an importance ranking model for negative topographic feature lines. By integrating multi-criteria filtering methods such as the slope-based, depth-based, and denoising approaches, we ultimately achieved precise extraction of the continental margin FOS line while considering topographic continuity.

2. Automatic Identification of Negative Topographic Feature Lines Based on Rolling Ball Transformation

According to the definition of the FOS provided by the UNCLCS, the FOS is the point where the maximum slope change occurs at the base of the continental slope. In 2-D space, the slope change in a topographic profile curve is indicated by its curvature. In 3-D space, terrain undulation is reflected by the terrain curvature [24]. Thus, the FOS corresponds to the point where the maximum terrain curvature occurs at the base of the continental slope [15,16], and it has the concave feature of a negative topographic feature point in geography.

2.1. Basic Principle of the Algorithm

2.1.1. Terrain Identification Using Rolling Ball Transformation and Extraction of Negative Topographic Feature Lines

As a common method for seafloor topography mapping, the rolling ball transformation can buffer terrain undulation while recognizing features. For any seafloor topography surface, the rolling ball radius is set to r. During positive rolling ball transformation, a smooth ball rolls over the terrain surface. The trajectory of the ball’s center forms the upper buffer zone surface. Then, the lower buffer zone surface of the upper surface is constructed, which is the lower edge of the positive rolling ball trajectory (Figure 1). This creates the transformed terrain surface. Negative rolling ball transformation works in the opposite manner [23,25,26,27]. By adjusting r in either transformation, we can amplify or diminish certain terrain features. This helps achieve terrain buffering goals such as preserving convexity while reducing concavity, or vice versa.
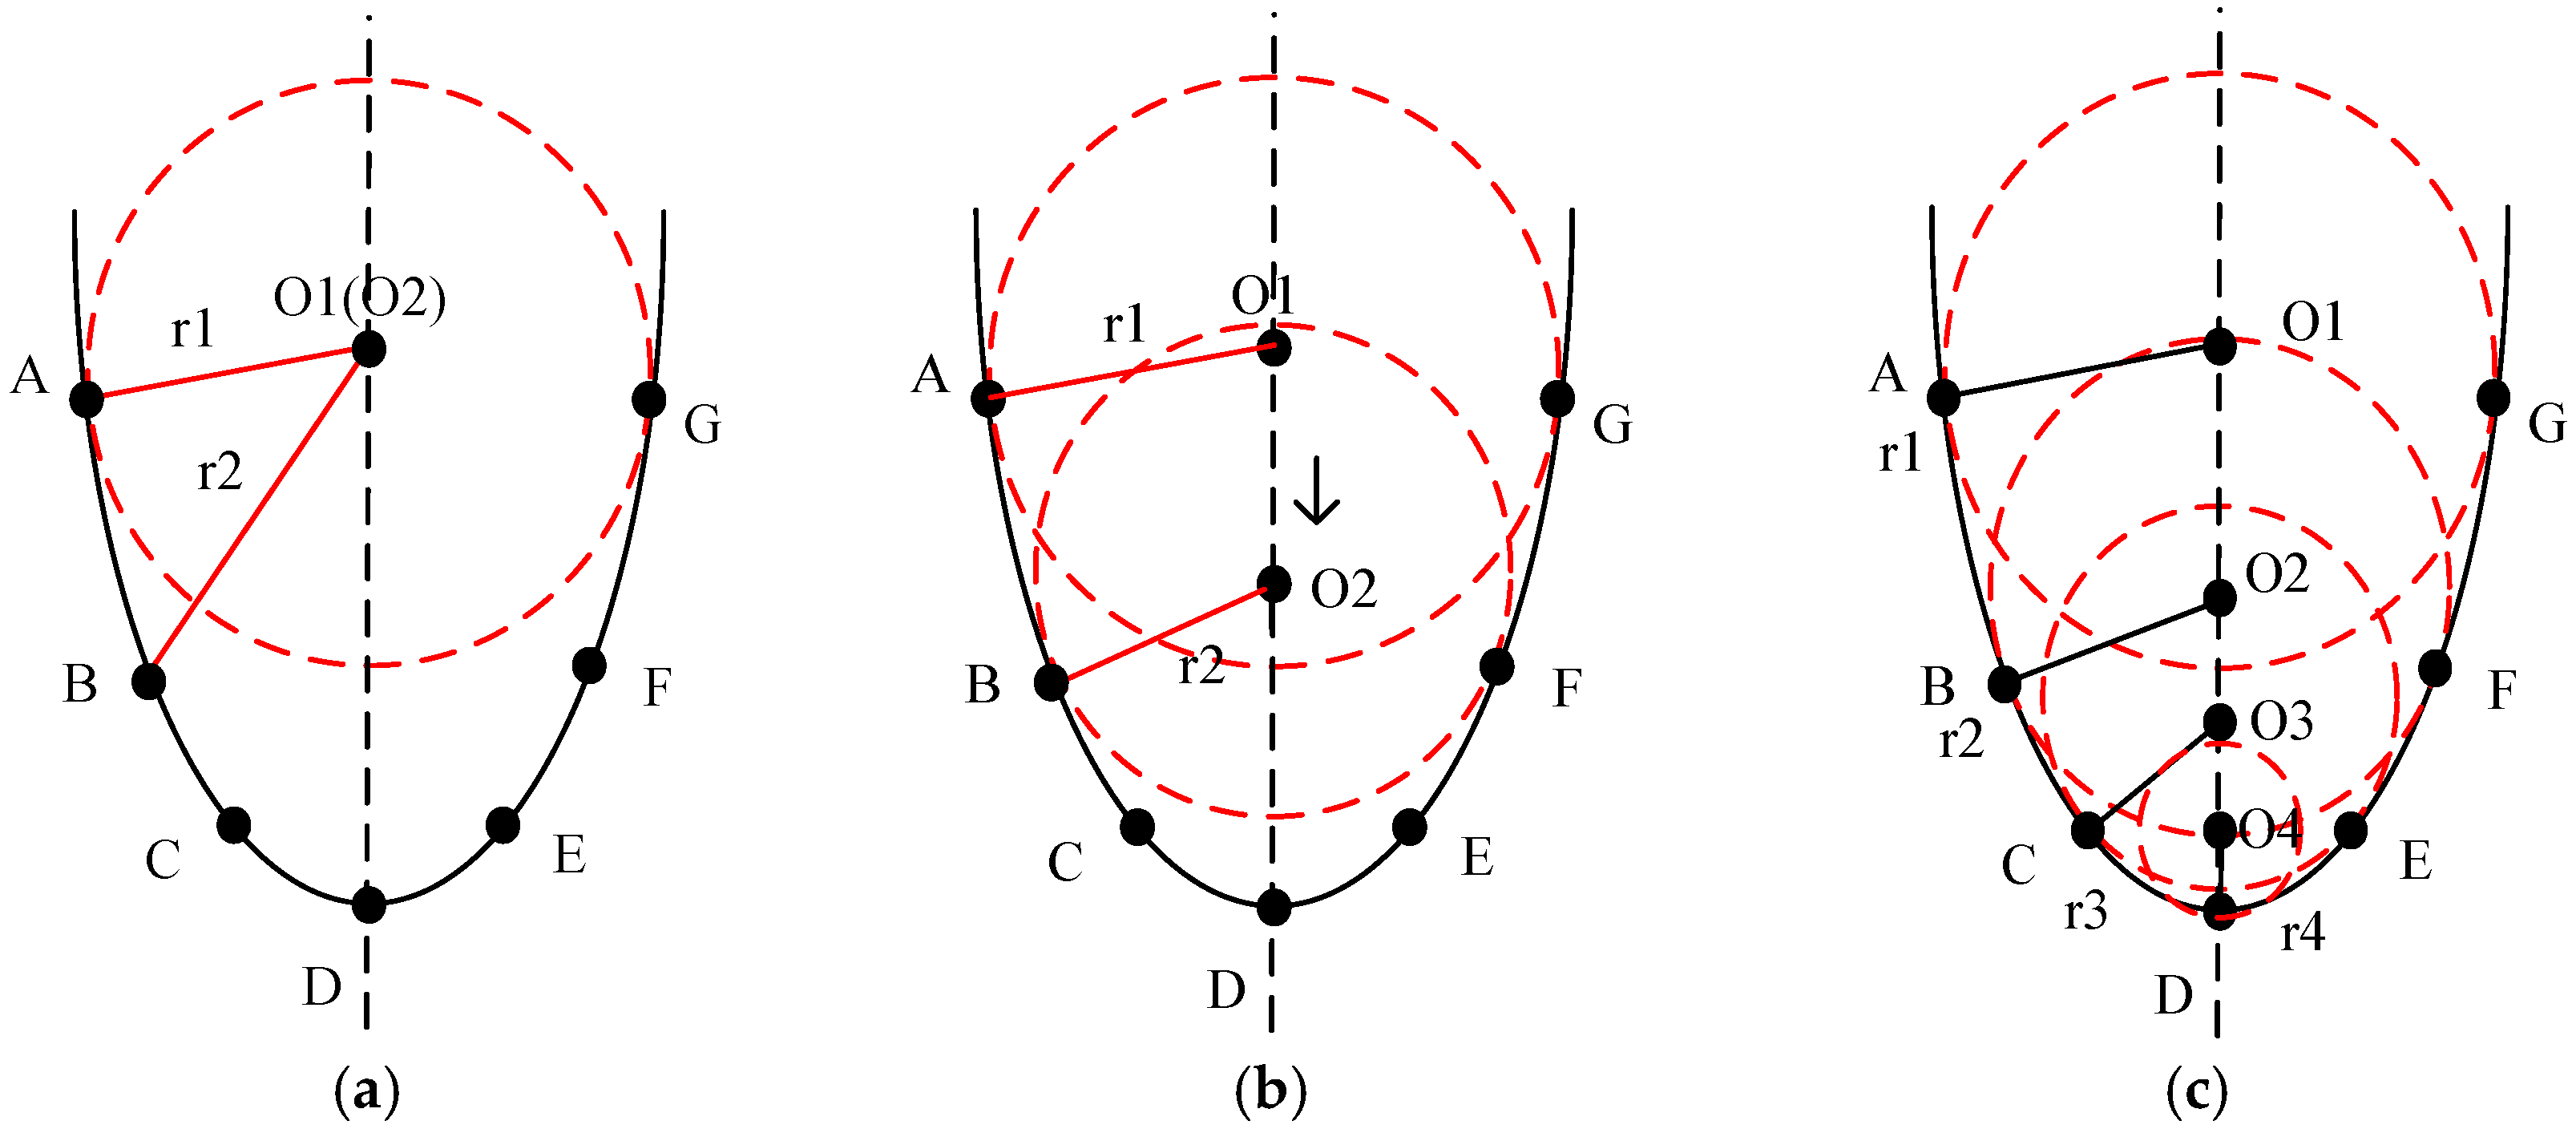
Building on this, Zhang et al. [22] proposed that the maximum rolling ball radius during the critical-point state transition in a rolling ball transformation is the critical radius for terrain feature identification. This is based on the data link relationship between the rolling ball contact points and the radius during the transformation. As shown in Figure 2, from sampling point A(G) to D, as the terrain slope and curvature gradients increase, the positive critical rolling ball radius decreases. At point D, the positive critical radius is smallest, indicating that point D is a negative topographic feature point.
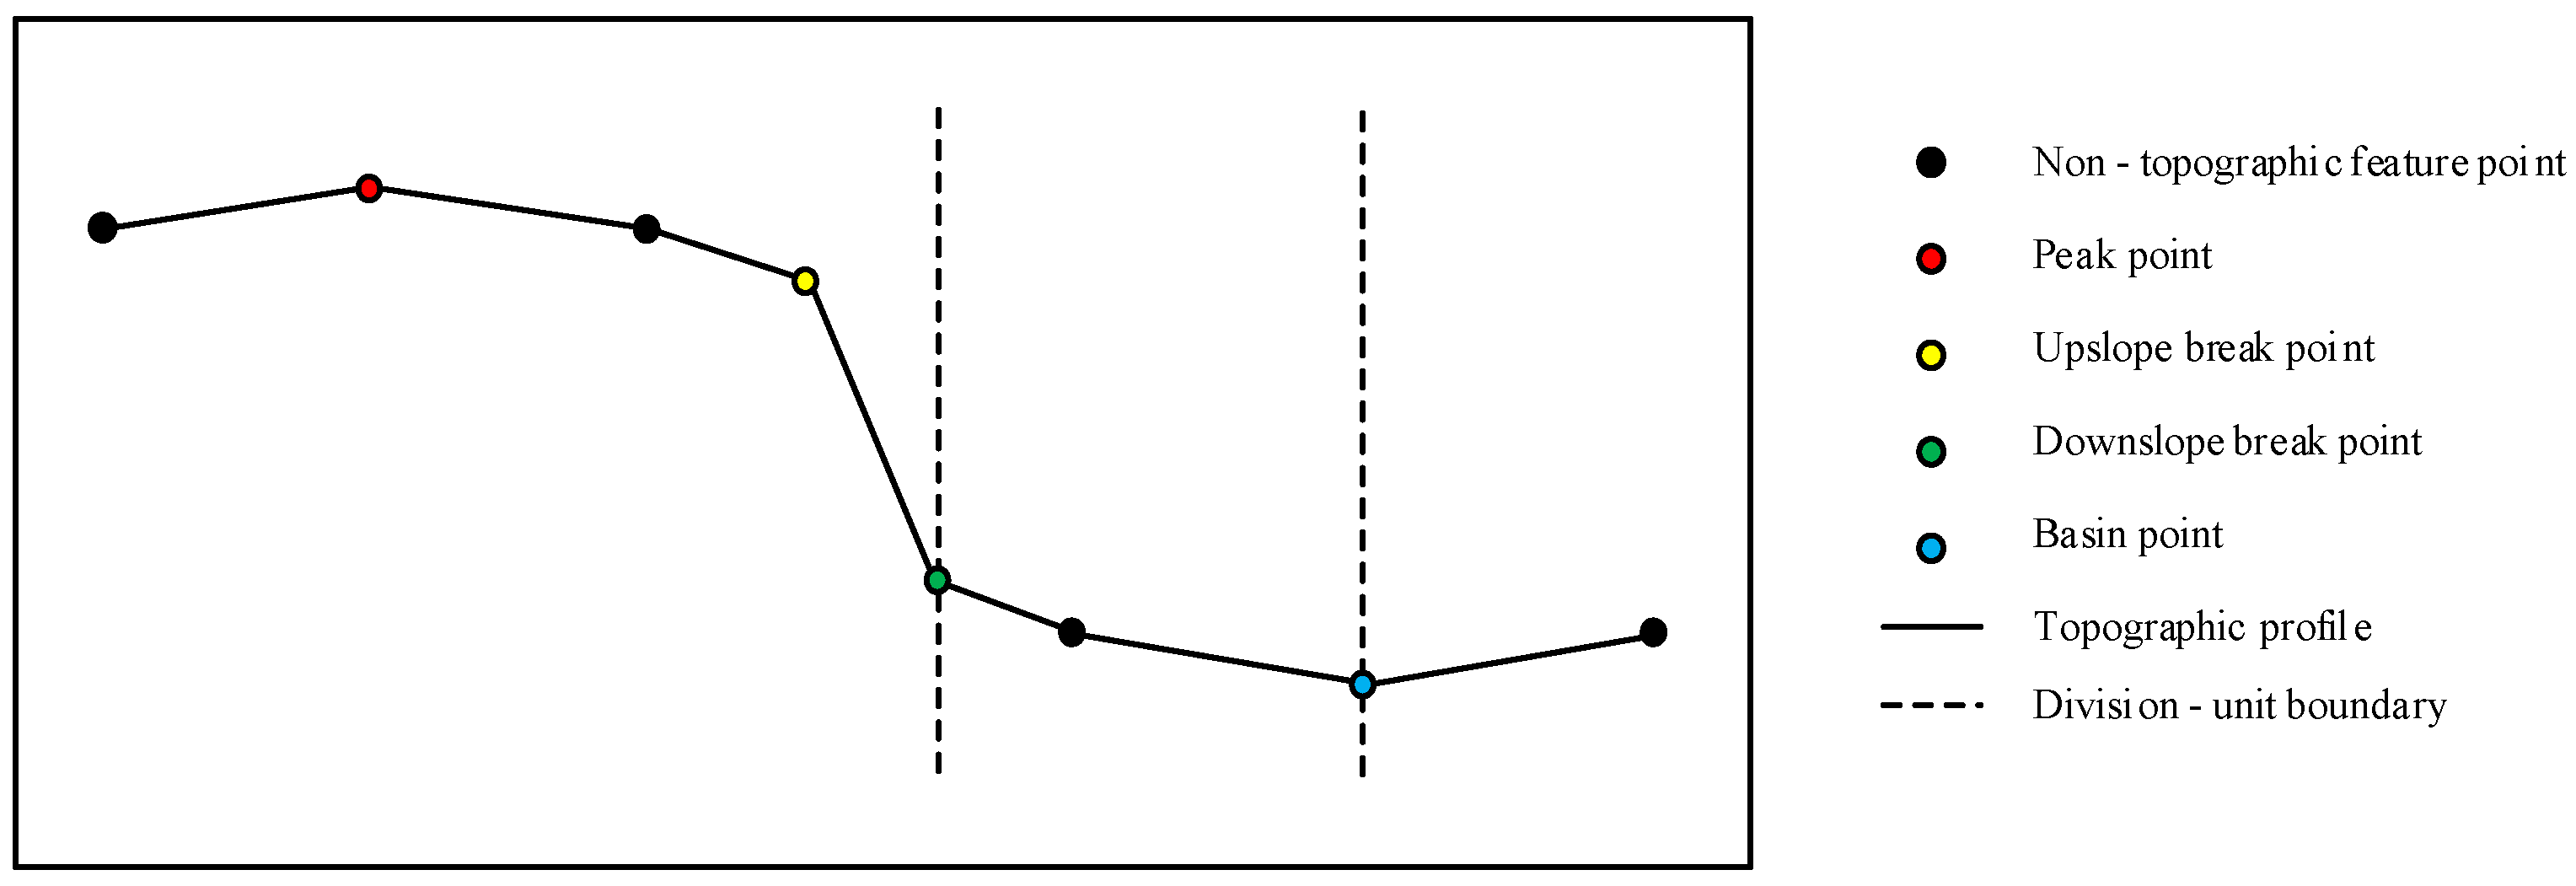
Given that the foot of the continental slope is located in the basal portion of the continental margin, where the slope gradient is greatest, we can use the terrain-recognition feature of the rolling ball transformation. First, we calculate the critical rolling ball radius for each depth point in the DDM. Then, we adopt a reverse engineering approach: we sort the positive critical rolling ball radii and use the point with the maximum positive critical radius as the center of the clustering division unit. Next, we compare the critical radii of this center point and the surrounding natural-neighborhood points to expand the clustering toward areas with negative terrain feature points (where the positive critical rolling ball radius is smallest). This constructs division units until the entire seabed topography area is divided. Finally, we perform intersection operations between the different division units. The resulting intersection lines of their boundaries form the negative topographic feature lines. Specific clustering division methods have been described by Dong et al. [17]. These lines, featuring the maximum terrain curvature on the seabed, consist of only negative topographic feature points, have concave features, and include all of the Basin points [28] and downslope break points. Figure 3 illustrates the types of seabed topography feature points.

2.1.2. Principle of Extracting Negative Topographic Feature Lines Based on Spatial-Scale Thresholds

Since the reverse engineering method retains all of the negative topographic feature lines in the seabed, and the seabed topography is intricate, with local terrain influencing feature line extraction, it is essential to set a spatial-scale threshold to filter the extracted negative feature lines. For the extracted negative topographic feature lines, the terrain type at each node is determined by its critical rolling ball radius. This filters out terrain points with specific geographical features and effectively categorizes the terrain feature attribute strength. The specific formula is as follows:
R r , R > r        t h e n        Q ( P i ) = 1 R > r , R r        t h e n        Q ( P i ) = 1 R r , R r        t h e n        Q ( P i ) = 0 R > r , R > r , r r        t h e n        Q ( P i ) = 2 R > r , R > r , r > r        t h e n        Q ( P i ) = 2 .
Using these criteria, we can filter out negative terrain feature points that meet the requirements. In Equation (1), R is the spatial-scale threshold; and r and r are the positive and negative critical rolling ball radii, respectively. Q ( P i ) is the terrain-type attribute corresponding to depth point P i . Q ( P i ) = 1 indicates positive terrain, Q ( P i ) = −1 indicates negative terrain, Q ( P i ) = 0 indicates flat terrain, Q ( P i ) = −2 indicates negative terrain nested within positive terrain, and Q ( P i ) = 2 indicates positive terrain nested within negative terrain.
In traditional rolling ball identification, for nested terrains such as concave-nested-convex and convex-nested-concave terrain points, the outer-packaging terrain type is used to determine the nested terrain type. Specifically, when R > r , R > r ,   and   r r , it is determined to be positive terrain ( Q ( P i ) = 2 ); and when R > r , R > r ,   and   r > r , it is determined to be negative terrain ( Q ( P i ) = 2 ). As the primary task of traditional rolling ball transformation in terrain identification is terrain generalization, it focuses on the overall outer-packaging terrain. Consequently, when the spatial-scale threshold is large, some terrain feature lines cannot be effectively extracted, making this criterion unsuitable for FOS line extraction.
Given that the rolling ball application utilized in this study focuses on collecting candidate FOS lines, it is crucial to ensure the integrity and accuracy of the extracted negative topographic feature lines. Therefore, the traditional rolling ball terrain identification criteria are modified to emphasize the identification of nested terrain area types. This modification makes it more suitable for continental margin FOS line extraction and improves the algorithm’s accuracy. Specifically, when R > r , R > r ,   and   r r , it is determined to be negative terrain ( Q ( P i ) = 2 ); and when R > r , R > r ,   and   r > r , it is determined to be positive terrain ( Q ( P i ) = 2 ).

2.2. Analysis of Algorithm Limitations

According to the definition of the foot of the continental slope in the UNCOLS, the negative topographic feature lines extracted using the rolling ball terrain-identification method lack the critical information about the maximum slope gradient change at the base of the continental slope. During negative topographic feature line extraction, the clustering division method uses the maximum positive critical rolling ball radius of the local terrain as the clustering center for outward extension. To extract a set of negative topographic feature lines that better meet the maximum curvature requirements, it is necessary to gradually reduce the spatial-scale threshold to decrease the positive rolling ball radius. However, when reducing the spatial-scale threshold, it is essential to ensure that the final set of negative topographic feature lines can distinguish different terrain types. This prevents local terrain slope variations from affecting the selection of the continental margin FOS line.
Dong et al. [17] proposed the concept of dividing the feature attribute intensity of terrain feature lines based on spatial-scale thresholds. By setting four different spatial-scale thresholds R from low to high, the extracted terrain feature lines can be categorized into strong, relatively strong, relatively weak, and weak feature attributes. As the feature attributes weaken, the number of corresponding terrain feature lines gradually increases, and their continuity gradually improves, but their ability to distinguish different terrain types gradually decreases.
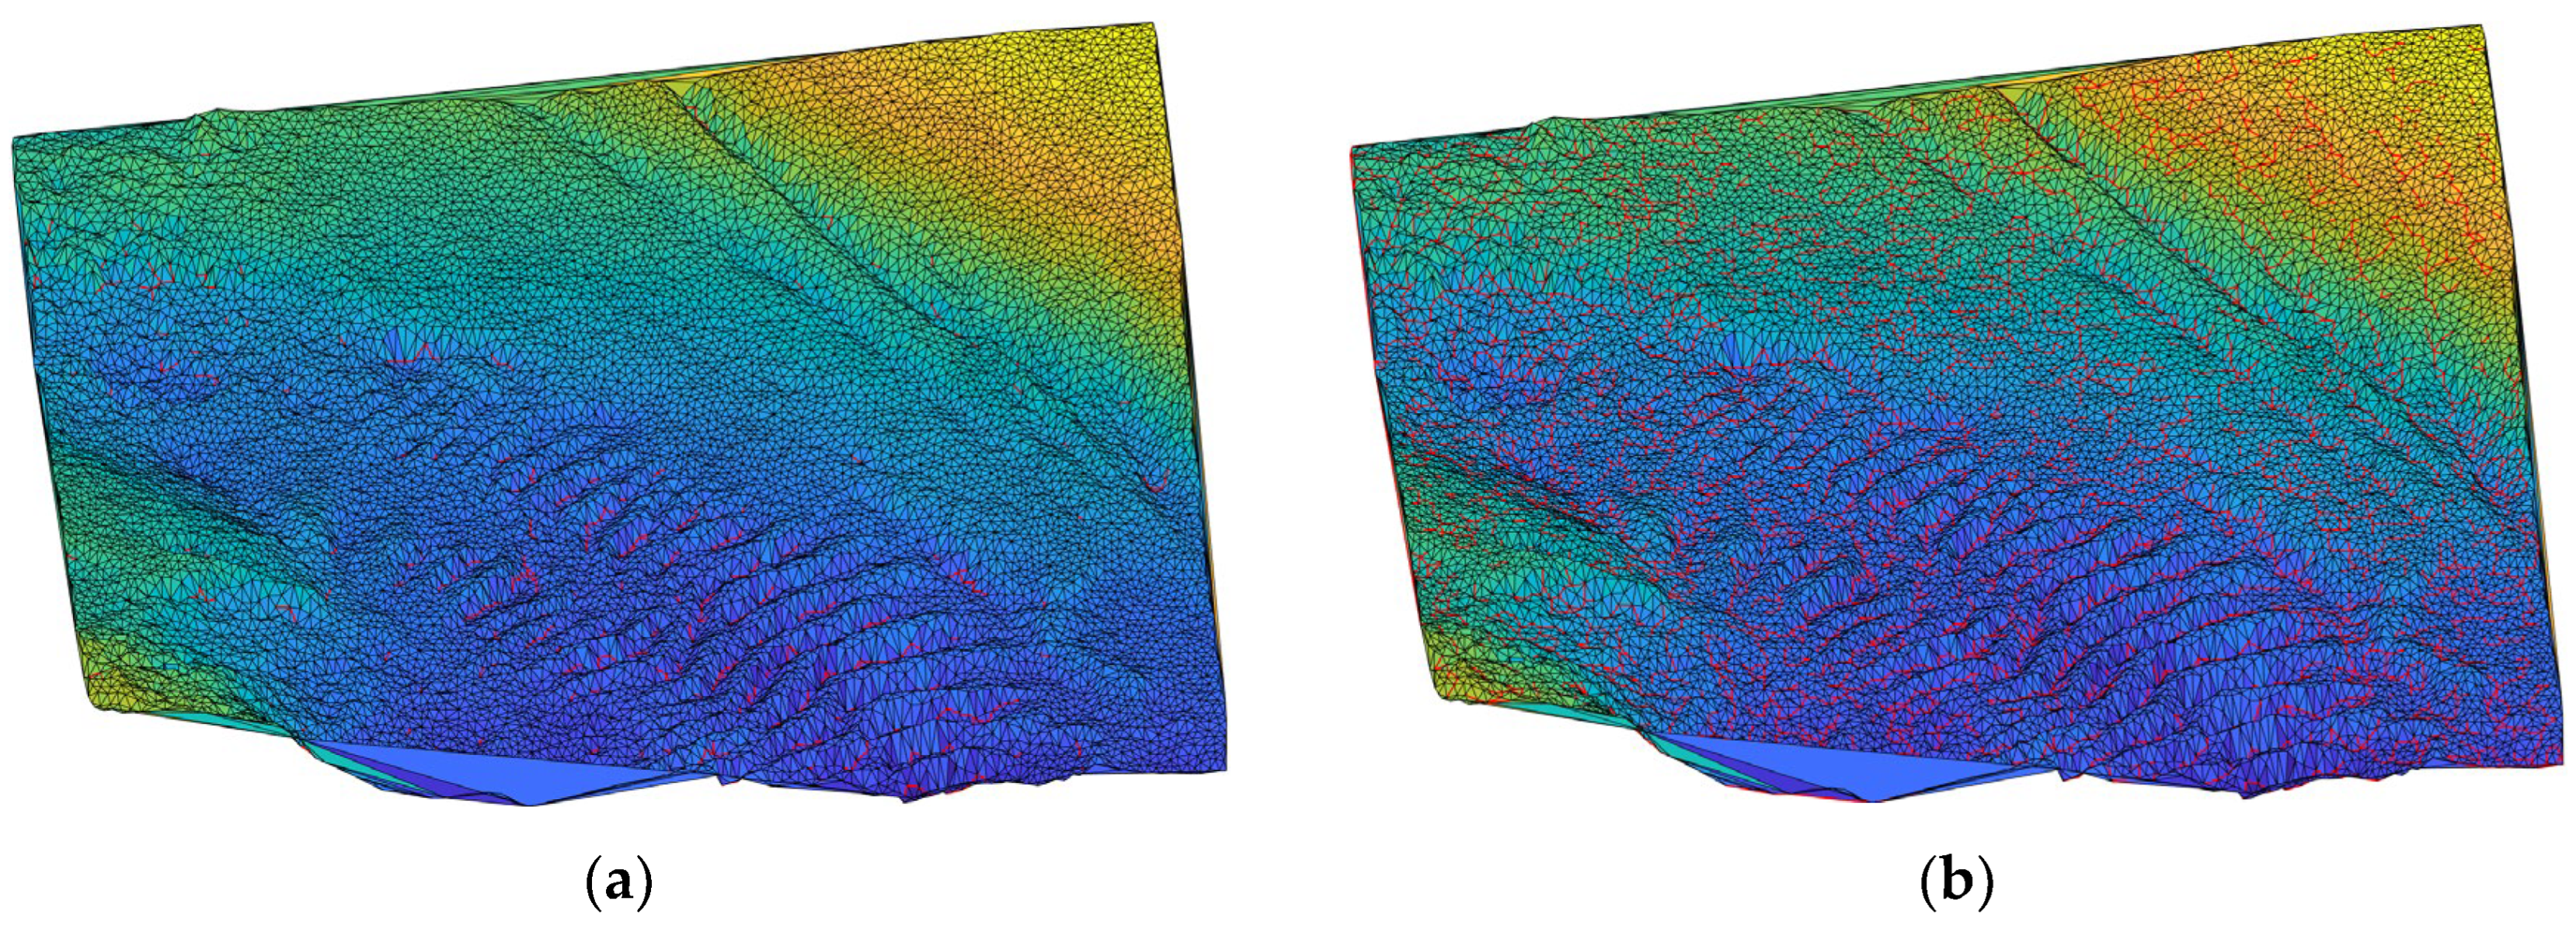
In this study, multibeam bathymetric data samples were used, and multiple extraction experiments were conducted by gradually reducing the spatial-scale threshold. Two types of negative topographic feature lines, as described by Dong et al. [17], were extracted: strong feature attribute negative topographic feature lines (with segment numbers controlled within 10% of the total negative topographic feature lines) and weak feature attribute negative topographic feature lines (with segment numbers controlled within 90% of the total negative topographic feature lines). Two experimental groups with typical feature attributes were retained to provide data for subsequent precise extraction experiments on the continental margin FOS line. Figure 4 illustrates the two typical negative topographic feature lines with distinct feature attributes.
In Figure 4, the red segments represent the negative topographic feature lines extracted based on the spatial-scale threshold. Figure 4a shows the strong feature attribute negative topographic feature lines (referred to as the strong-feature group) extracted at a lower spatial-scale threshold, while Figure 4b shows the weak feature attribute negative topographic feature lines (referred to as the weak-feature group) extracted at a higher spatial-scale threshold. It can be seen that when the spatial-scale threshold is lower, the strong-feature group extracts negative topographic feature lines that are closer to the maximum slope gradient requirement. However, these lines are short and scattered. When the spatial-scale threshold is higher, the weak-feature group extracts more continuous negative topographic feature lines that can distinguish different terrain types but have a more scattered distribution. Therefore, to extract an accurate and continuous continental margin FOS line that takes terrain variations into account, it is necessary to fully consider the differences between the two feature groups and to achieve complementary advantages in the final results.

3. Precise Extraction of Continental Margin FOS Line Considering Topographic Continuity

As indicated in Section 2.2, it is essential to take into account the variations and connections between different spatial-scale thresholds to identify a method for extracting an FOS line of the continental margin that is both legally valid and geometrically plausible. The primary issue with the weak-feature group results is that they are not legally compliant. Specifically, the extraction of negative topographic feature lines is not constrained to the area at the base of the continental slope, and numerous points of maximum slope change are extracted indiscriminately. This leads to an extraction outcome that appears as a disorganized network. Conversely, the strong-feature group nearly meets the rigid requirements of maximum slope change points. However, the excessively discontinuous FOS points lack topographic continuity, making them geometrically implausible. Consequently, in this study, we attempted to leverage the accuracy advantage of the strong-feature group in extracting continental margin FOS points and combined it with the topographic continuity advantage of the weak-feature group. By establishing an importance ranking model for the negative topographic feature lines within the weak-feature group and further integrating a multi-criteria filtering process for the continental margin FOS line, the goal was to prioritize the extraction of lines with high importance rankings. These lines should align with the selection criteria for continental margin FOS lines and take topographic continuity into account.

3.1. Importance Ranking of Negative Topographic Feature Lines

The negative topographic feature lines extracted using the rolling ball transformation principle serve as the candidate line set for the continental margin FOS line. Initially, this line set can be regarded as a disordered and directionless graph, making it difficult to assign an importance rank to each candidate line. Therefore, it is necessary to introduce the concept of connected components from graph theory [29]. The serial numbers of the negative topographic feature points included in each candidate line of the weak-feature group are recorded as connected arrays. The weak-feature group feature lines generated based on the rolling ball transformation are denoted as S , and the strong-feature group feature lines are denoted as I . p 1 ( i ) and p 2 ( i ) are the two endpoints of the i th negative topographic feature line segment. p 1 ( j ) and p 2 ( j ) are the two endpoints of the j th negative topographic feature line segment.
S = p 1 ( i ) , p 2 ( i ) i = 1 , 2 , , n I = p 1 ( j ) , p 2 ( j ) j = 1 , 2 , , m
Each edge ( u , v ) S represents a feature segment formed between feature point u and feature point v . The undirected graph G of the weak-feature group feature lines S is constructed as follows:
G = ( V , E ) ,   V = { p 1 ( 1 ) , p 2 ( 1 ) , p 1 ( 2 ) , p 2 ( 2 ) , } ,   E = p 1 ( i ) , p 2 ( i ) i = 1 , 2 , , n
where V is the set of points in the undirected graph and contains all of the feature points; and E (or S ) is the set of lines in the undirected graph. Each line segment is composed of a pair of feature points ( u , v ) and encompasses all of the feature segments. Each edge ( u , v ) S is traversed, and feature points u and v are added to the adjacency list of graph G . If feature points u or v are not present in the adjacency list of G , a new adjacency list is generated. Consequently, u V and v V , and the adjacency list A d j ( u ) for feature point u is formed as follows:
A d j ( u ) = { v ( u , v ) S }
The depth-first search (DFS) is a commonly used graph search method with low spatial complexity and easy implementation [30,31]. It has been frequently employed to address path connectivity issues. This method utilizes a DFS function to traverse all of the feature point adjacency lists until all of the feature points connected to the given feature point have been visited. As a result, the weak feature group terrain feature line set is clustered into k connected components C ( C = { C 1 , C 2 , C K } ). Within each connected component, the feature points are interconnected, forming a feature line (network).
C n is the n th connected component in the weak-feature group feature lines S (where 1 n k ). Given that I is the strong feature group feature line containing all of the FOS candidate points, the number of feature points from the strong feature group within the n th connected component can be expressed as follows:
m n = C n I
where C n I represents the size of the intersection between the connected component C n and candidate line I . Furthermore, the importance rank R n of connected component C n can be defined as follows:
R n = m n t n
where t n is the number of terrain feature points within connected component C n . Using the serial numbers of the points in each connected component as bathymetric point indices, calculate the proportion of strong-feature group points within each connected component of the weak-feature group. The higher the proportion, the higher the importance rank assigned to the connected component. This process further narrows down the selection of the continental margin FOS line while ensuring that the extracted line adequately accounts for the variations and continuity of the seabed terrain.

3.2. Multi-Criteria Continental Margin FOS Line Filtering Process

The continental margin FOS lines extracted in Section 3.1 essentially meet the criterion of maximum slope change. However, further refinement is necessary to ensure that the extracted lines satisfy the positional requirement of being at the base of the continental slope. Given that the concept of the base of the continental slope involves multiple factors such as water depth and slope, in this study, we established a multi-criteria filtering process for continental margin FOS lines from a geographical feature perspective.

3.2.1. Slope Method

The continental margin FOS line serves as the starting line for determining the outer limit of the continental margin and should be located at the base of the continental slope. The continental slope is a transitional zone between the continental crust and the oceanic crust and typically has a slope of 3–6°, with an average of 4° [32]. Therefore, starting from the slope criterion, first, we record the natural neighboring points [33] of each bathymetric point in the DDM. This involves constructing a TIN for the DDM and recording the set of neighboring bathymetric points directly connected to each bathymetric point. Then, we calculate the average slope of each bathymetric point relative to its natural neighboring points. Based on this, we compute the total average slope for each negative feature line segment.
Only segments with a total average slope that exceeds a certain threshold are retained. This approach helps mitigate the impact of boundary points in digital bathymetric models on FOS line extraction and aids in excluding the influence of rugged micro-terrains on the experimental results.
S l o p e ( i , j ) = z j z i ( x j x i ) 2 + ( y j y i ) 2 , T i = j N e i g h b o r s ( i ) S l o p e ( i , j ) n i , S k = k g r o u p ( k ) T k N k ,
where S l o p e ( i , j ) is the slope value of bathymetric point P i = ( x i , y i , z i ) relative to its neighboring point P j = ( x j , y j , z j ) , n i is the number of neighboring points of bathymetric point P i , T i is the average slope of bathymetric point P i , N k is the number of bathymetric points in connected component C K , and S k is the average slope value of connected component C K .
The quality of the continental margin FOS line extraction method proposed in this paper depends, to some extent, on the data quality of the weak- and strong-feature groups. Due to the absence of quantitative data quality assessment methods, there is a risk that the continental margin FOS line will retract toward the continental slope in the final extraction results. Therefore, in addition to screening negative topographic feature lines based on total average slope restrictions, it is also essential to ensure that the average slope at each bathymetric point within a natural neighborhood does not exceed the slope range of the base of the continental slope base. Therefore, for each connected component the mean slope must be ≥3°; in addition, every single node must exhibit a local slope between 1.5° and 6°. This further eliminates feature line segments inclined toward the slope area of the continental margin.

3.2.2. Water Depth Method

Since the base of the continental slope is located at the bottom of the continental slope, it is possible to analyze the terrain trends of DDM data from a water depth perspective and to set an appropriate water depth threshold range. For instance, by estimating the water depth range of the base of the slope area of the continental margin in DDM data through data visualization results from software such as MATLAB or Surfer. The depth upper bound is set to z max + z min × 1 2 computed over the entire continental-slope domain; only components lying below this horizon are retained. This helps eliminate some unreasonable negative topographic feature points.

3.2.3. Denoising Method

Given the complexity and variability of seabed topography, it is inevitable that rugged and intricate small-scale terrains will affect the final extraction of the continental margin FOS line. Theoretically, the continental margin FOS line should be a long segment that reflects the continuity of the slope terrain. Therefore, we propose a method to distinguish the negative topographic feature lines extracted using the rolling ball transformation. For example, we define non-continental margin FOS line segments as noise segments and impose restrictions on the strong-feature group used in the importance ranking process. Specifically, each segment in the strong-feature group must contain at least three bathymetric points to prevent the existence of noise segments in small-scale terrains from affecting the experimental results. In addition, each segment in the weak-feature group used in the importance ranking process must contain at least 10 bathymetric points. This prevents some noise segments in the weak-feature group from having a high FOS proportion due to a small number of nodes, which could lead to a high importance rank for their connected components and, consequently, inaccurate extraction results for the continental margin FOS line.
Furthermore, as the algorithm in this study targets bathymetric data in a spatial coordinate system and employs a feature line identification approach based on the intersection of boundaries of divided units, the final extraction results may contain fine-scale branch segments. To address this issue, the editing tools in MATLAB’s 3-D data visualization can be utilized. Referring to the relevant provisions of Article 76 of the UNCLOS, the scientific and aesthetic aspects of the FOS line identification results can be considered. Branch segments in the continental margin FOS line can be deleted, and only the main part of the line is retained. The implementation rules are as follows: Branches shorter than the longest connected component are flagged for deletion; when two branches diverge, the one whose mean distance to the continental-slope toe is shorter is automatically kept.
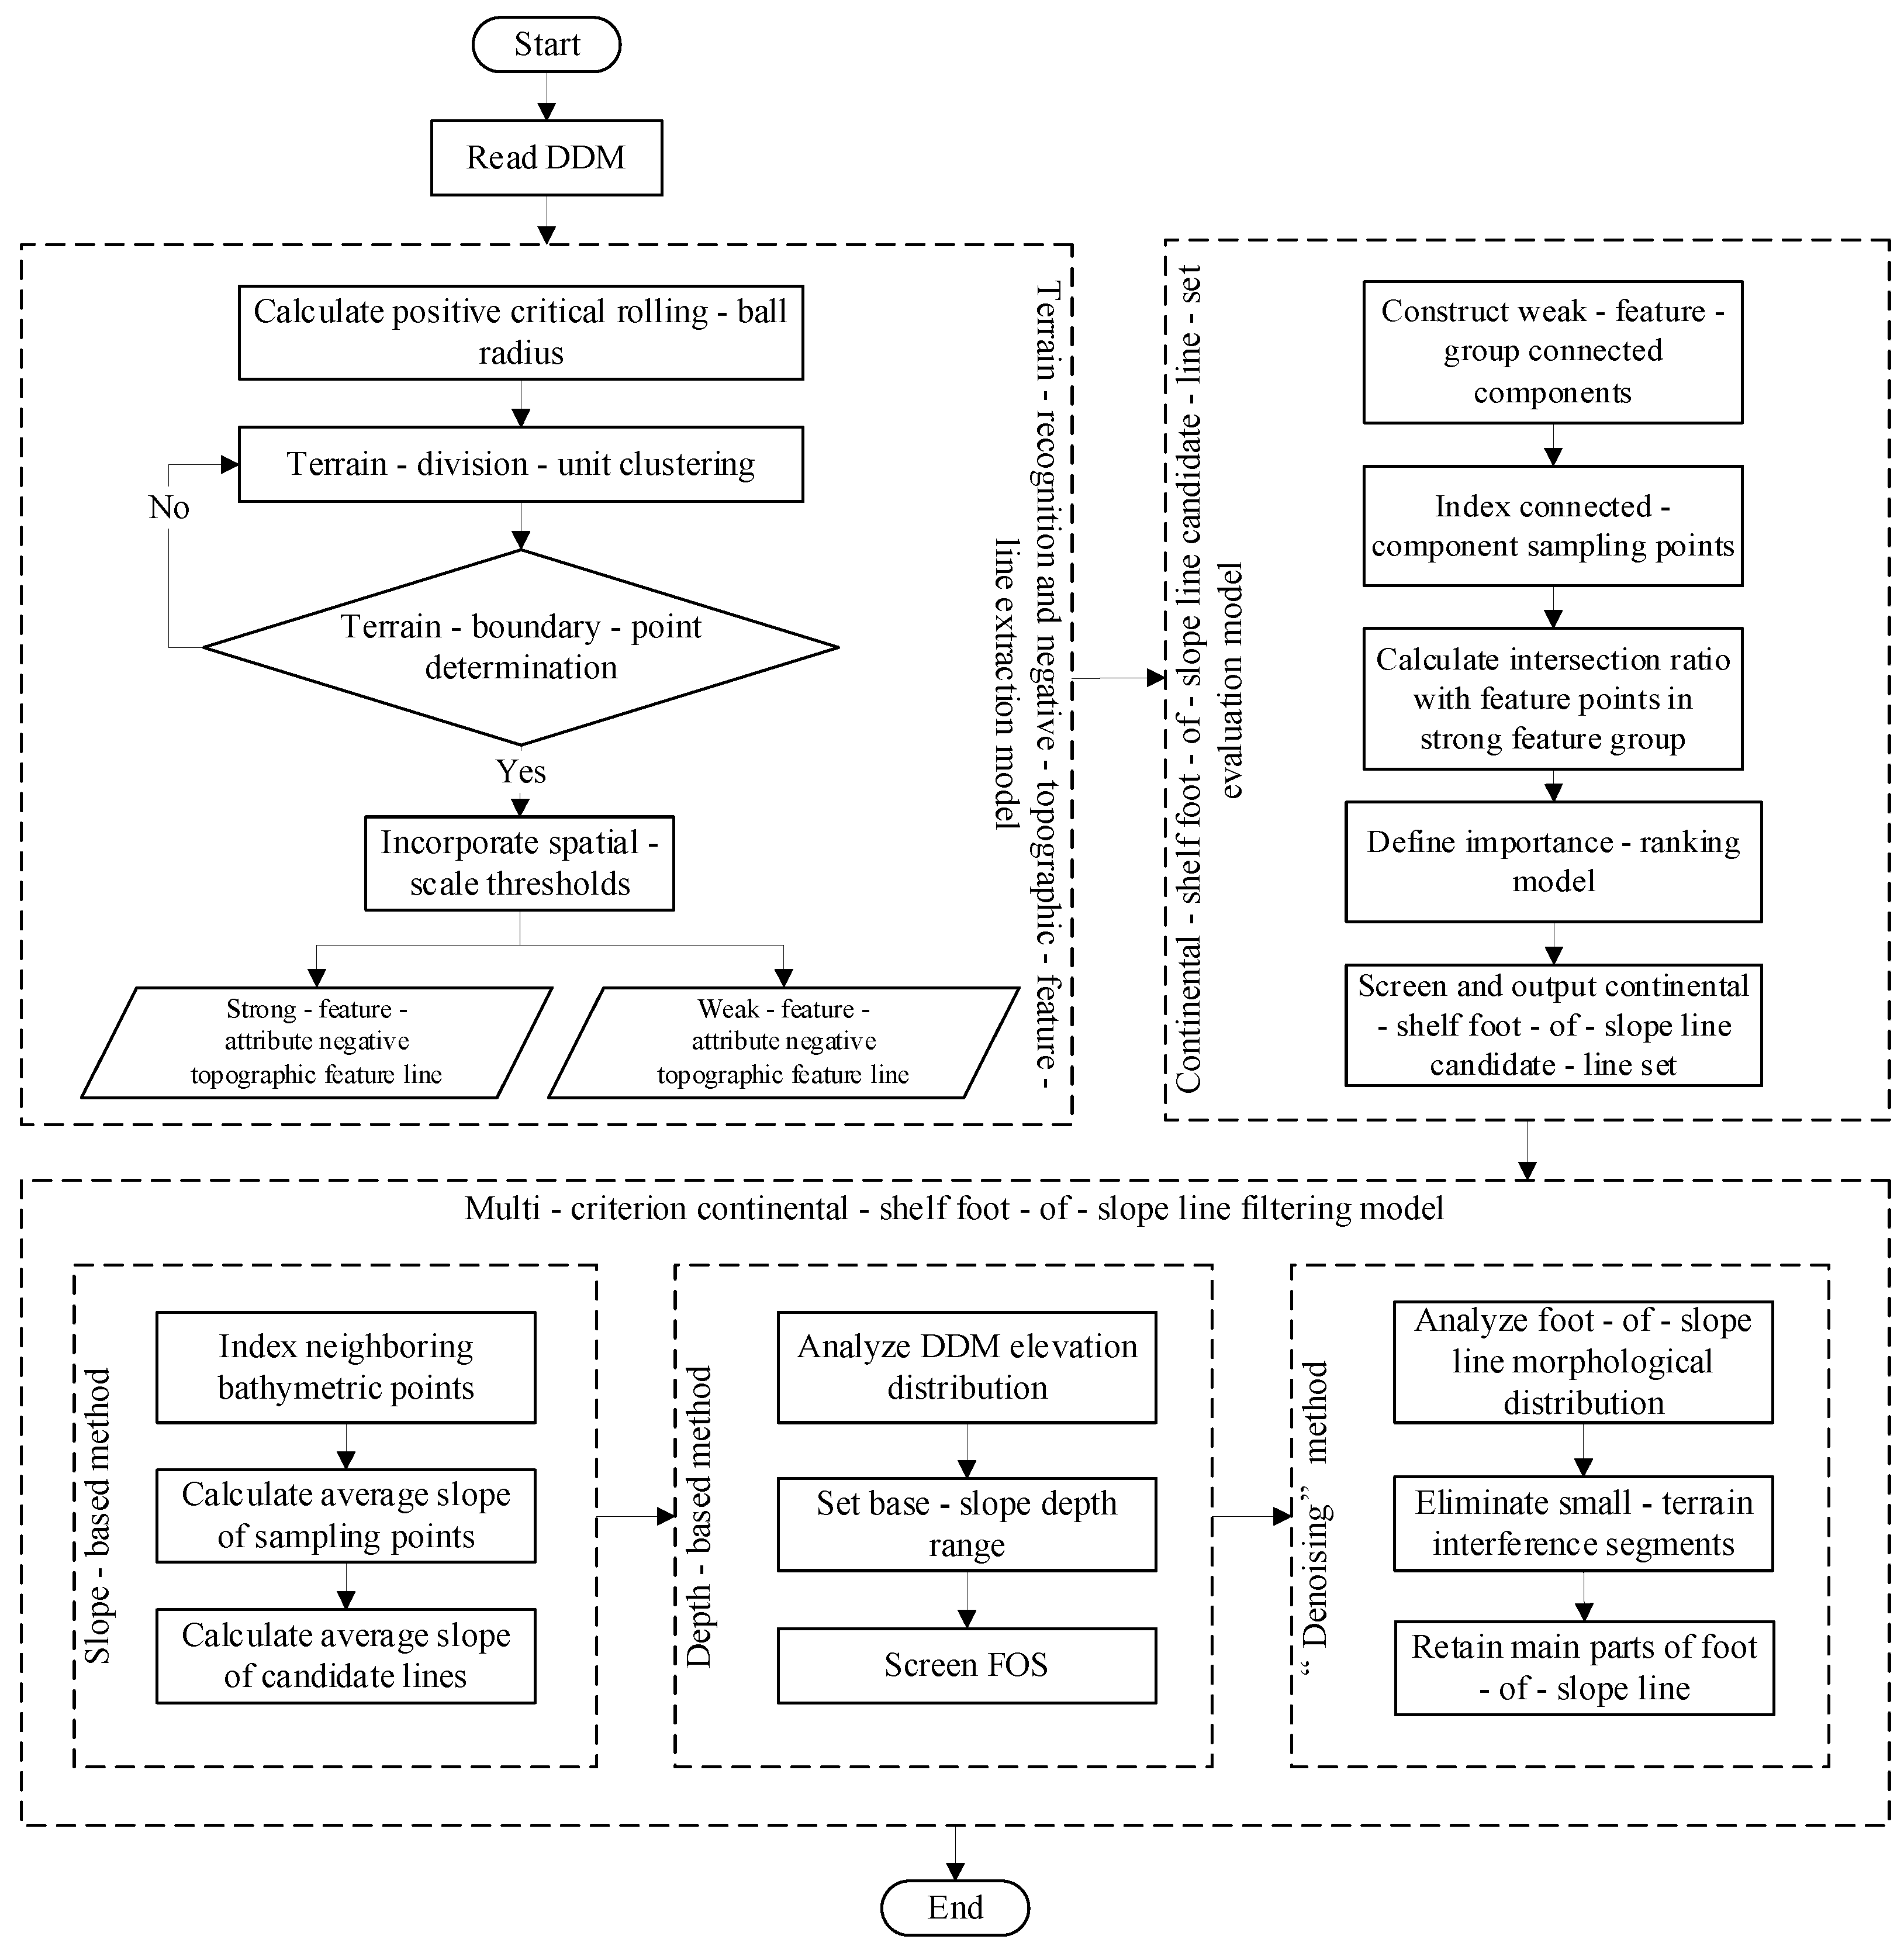
In summary, the proposed method for precise extraction of a continental margin FOS line that considers topographic continuity consists of two main components: the importance ranking of negative topographic feature lines and a multi-criteria filtering process for the continental margin FOS line. The multi-criteria filtering process includes methods such as the slope-based approach, depth-based approach, and denoising method. The main technical workflow of this method is illustrated in Figure 5.

4. Experimental Validation and Analysis

To demonstrate the efficacy of the proposed method for extracting the FOS line of the continental margin while considering topographic continuity, in this study, we conducted experimental validation and analysis. The algorithm was implemented in a C# environment using Visual Studio 2019. Remote sensing image data from the Earth Topography 2022 (etopo2022) dataset for the Atlantic Continental Margin off the U.S. East Coast 76.00–75.40° W, 33.60–34.20° N) were converted into a TIN format using the 3-D Analyst tool in ArcGIS Pro 3.0 version. The experiments were performed on a machine equipped with an AMD Ryzen 9 7945HX processor (2.5-GHz base clock) and 32 GB memory.

4.1. Visual Interpretation Evaluation

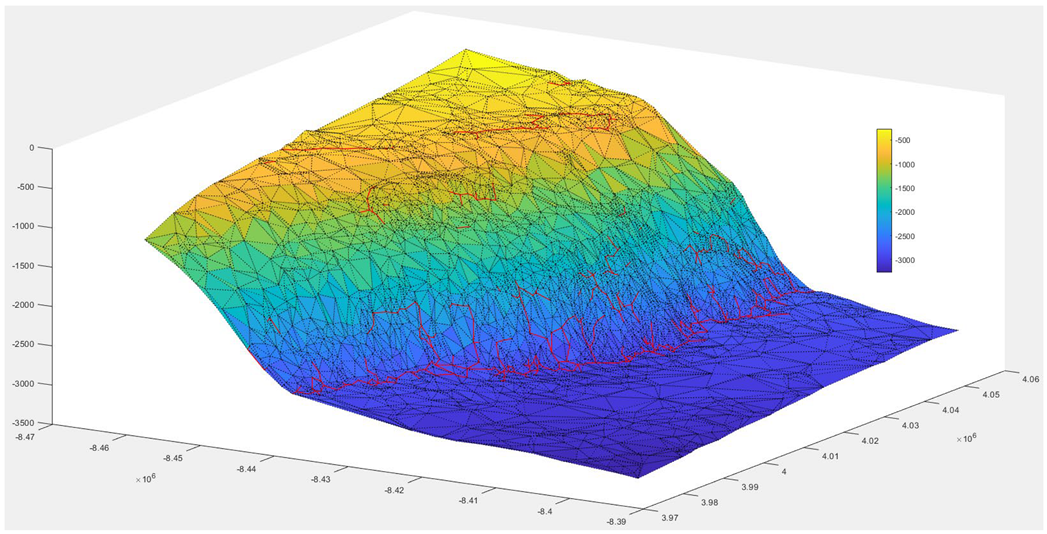
A visual interpretation evaluation was carried out to verify that the proposed method can effectively extract negative topographic feature lines and distinguish their importance ranking levels while capturing the continuous variations in the terrain. Using MATLAB R2023a, the extraction results of the negative topographic feature lines for test area A were visualized under varying importance ranking thresholds (Table 1). The threshold determines the minimum importance rank of the extracted lines. As the threshold increases, the extracted lines retain higher importance ranks, indicating greater terrain curvature and local slope gradient variation.
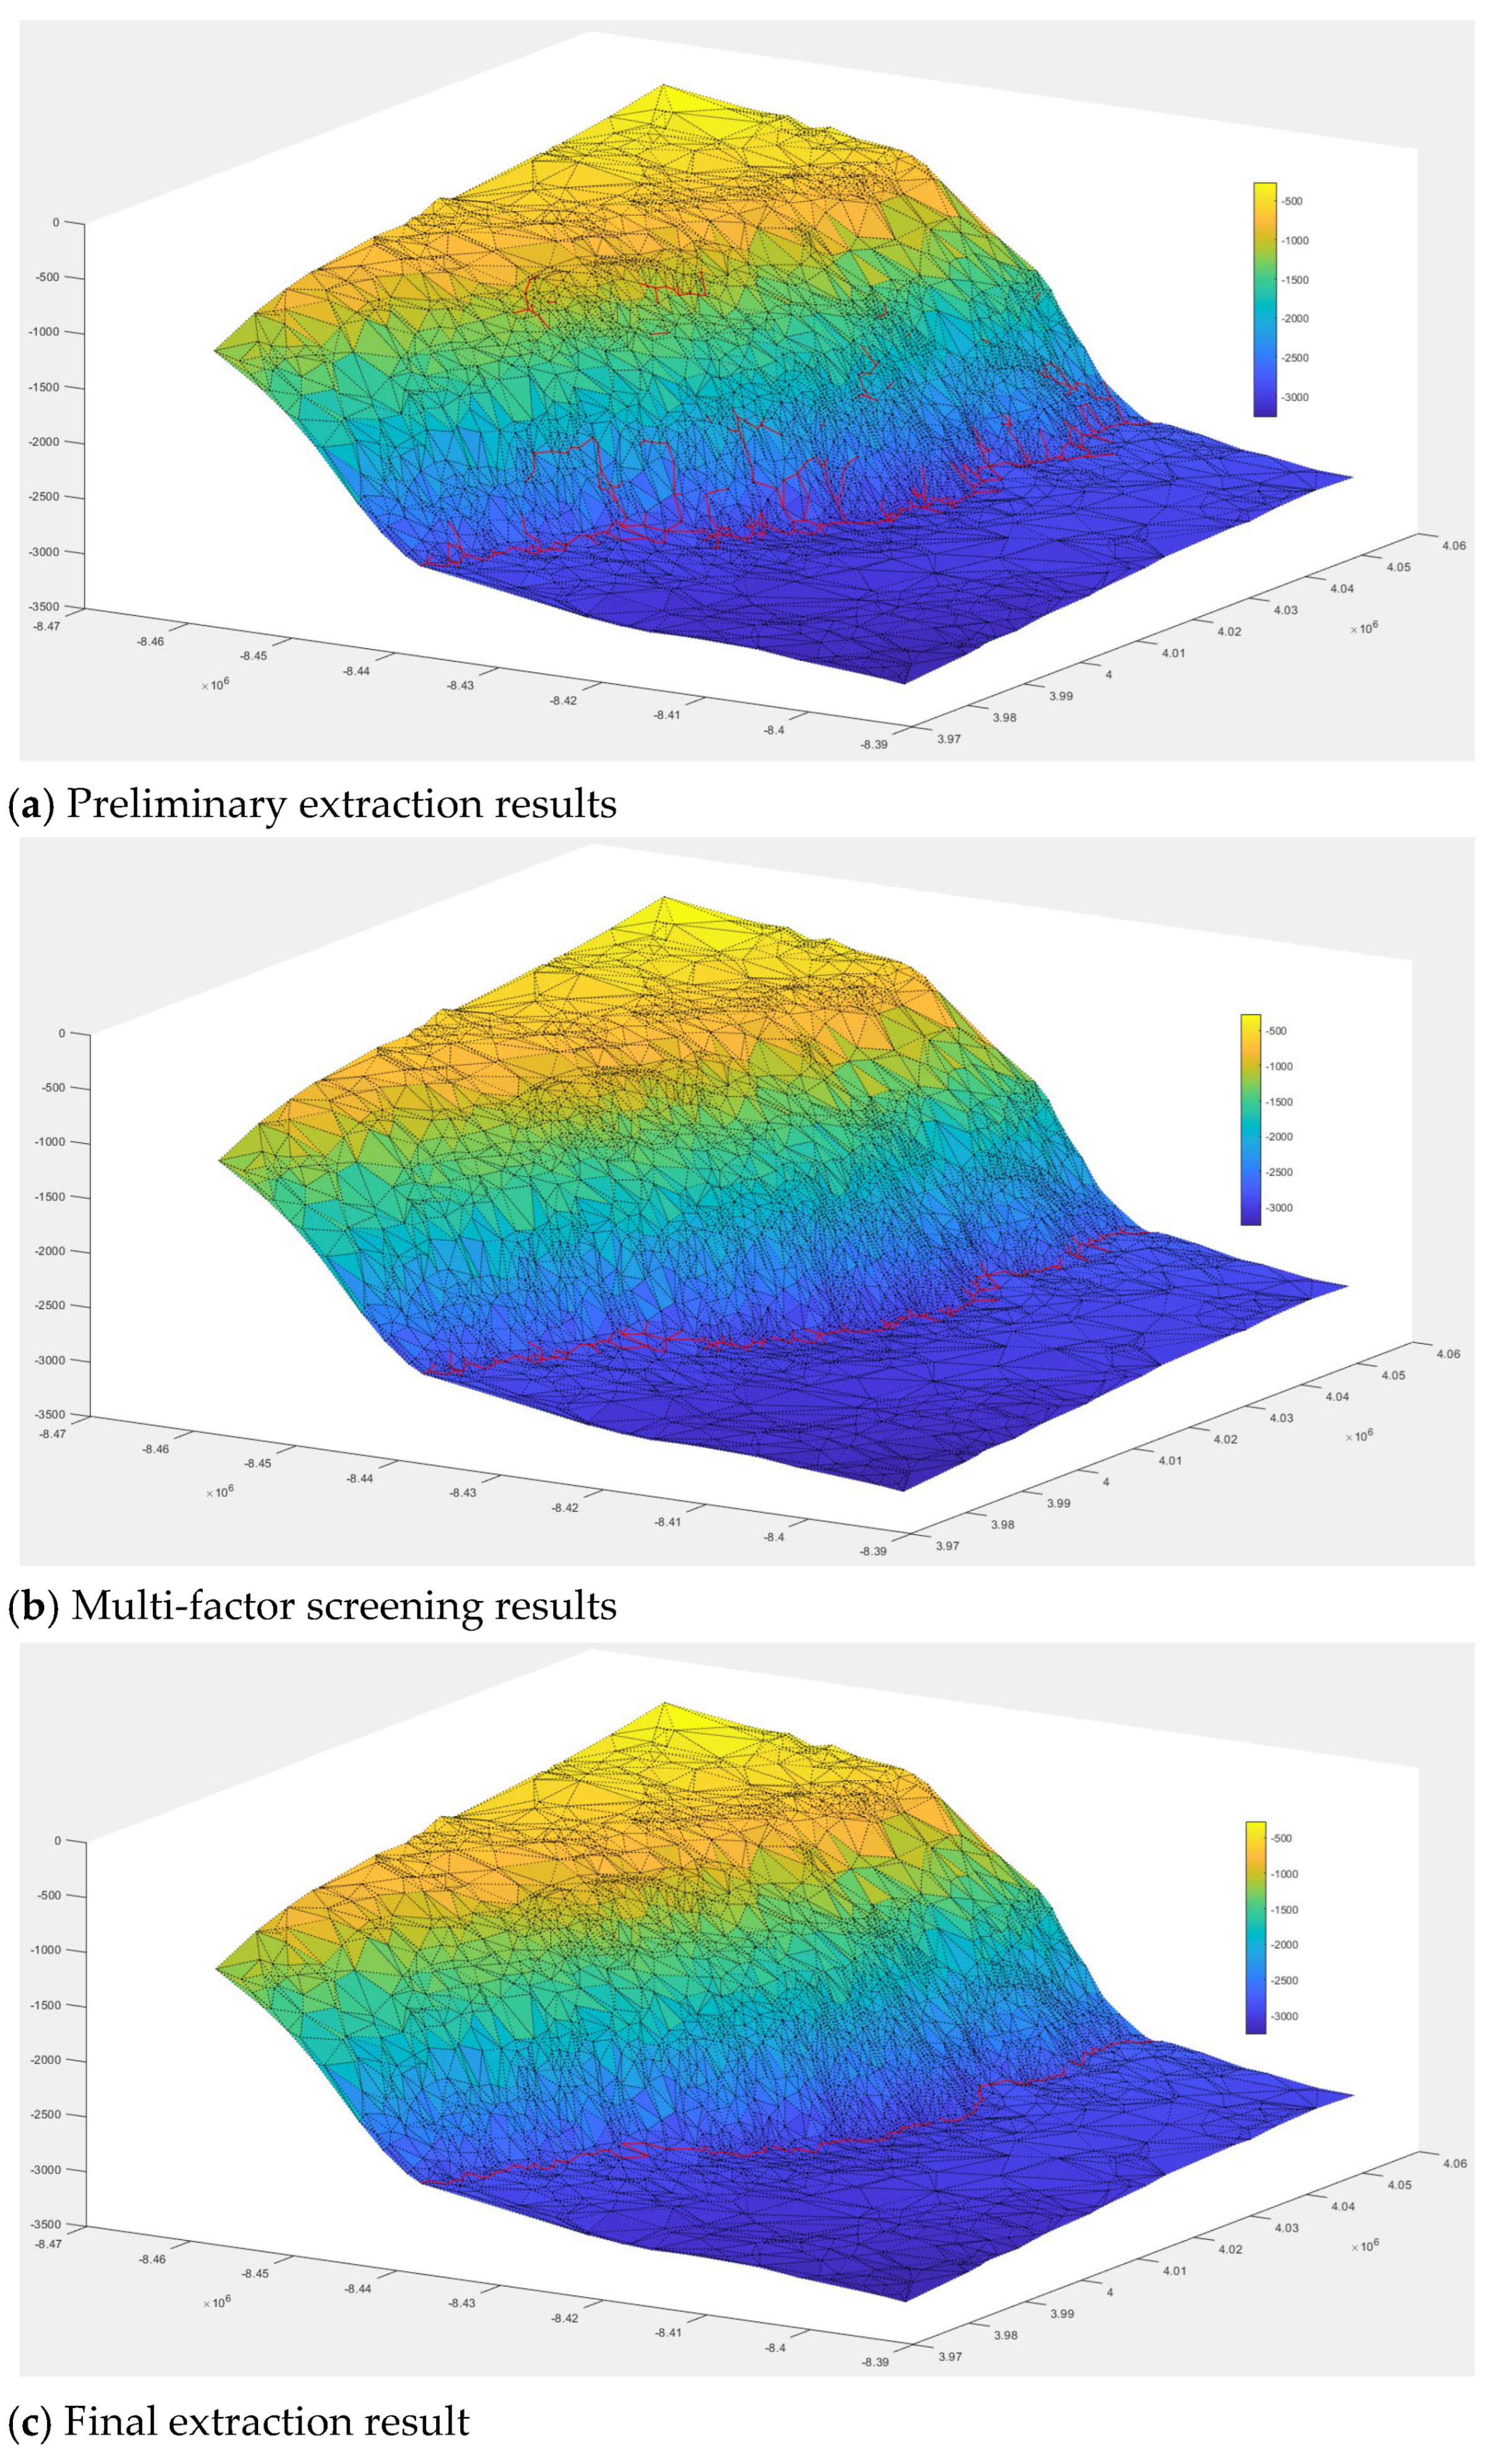
Figure 6 presents the results of the processing steps of the extraction obtained using an importance ranking threshold of 0.72 (Table 1). Figure 6a presents the preliminary results after importance ranking. Figure 6b presents the results after multi-criteria filtering (including slope-based, depth-based, and denoising methods). Figure 6c retains only the main part of the continental margin FOS line from Figure 6b. In Table 1 and Figure 6, the red segments denote the retained negative topographic feature lines.
The experimental results demonstrate the following:
  • When the screening threshold is r = 0, the extracted negative topographic feature lines are widely distributed in areas of the seafloor with significant slope changes and complex triangular-mesh structures. Each feature line segment is essentially located in the downslope breakline region of the local terrain and exhibits concave features. This demonstrates that the proposed method can effectively distinguish negative terrain areas, and the extracted negative topographic feature lines conform to the basic morphological characteristics of the continental margin FOS line.
  • As the importance ranking screening threshold increases, the number of negative topographic feature lines gradually decreases. The retained lines have higher importance ranks, with a greater proportion of points corresponding to the maximum local slope changes. This better aligns with the characteristics of the continental margin FOS line.
  • As the screening threshold increases from 0.72 to 0.8, although the extracted negative topographic feature lines exhibit greater local slope changes, they become scattered, short, and detached from the base of the continental slope. Hence, they do not meet the candidate requirements for continental margin FOS lines. Therefore, the negative topographic feature lines extracted using r = 0.72 should be used as the preliminary screening results for subsequent multi-criteria filtering of the continental margin FOS line.
  • As shown in Figure 6, by incorporating methods such as the slope-based approach, depth-based approach, and denoising method into the preliminary extraction results obtained through importance ranking, the extracted negative topographic feature lines can be effectively confined to the base-of-slope area of the continental margin. The final extracted negative feature lines are located in lower-elevation areas, delineate the continental slope terrain, and form continuous linear features. No single feature line spans multiple terrain types. This makes the extracted lines suitable as continental margin FOS lines, ensuring legal compliance and logical soundness.

4.2. Comparative Analysis Experiment

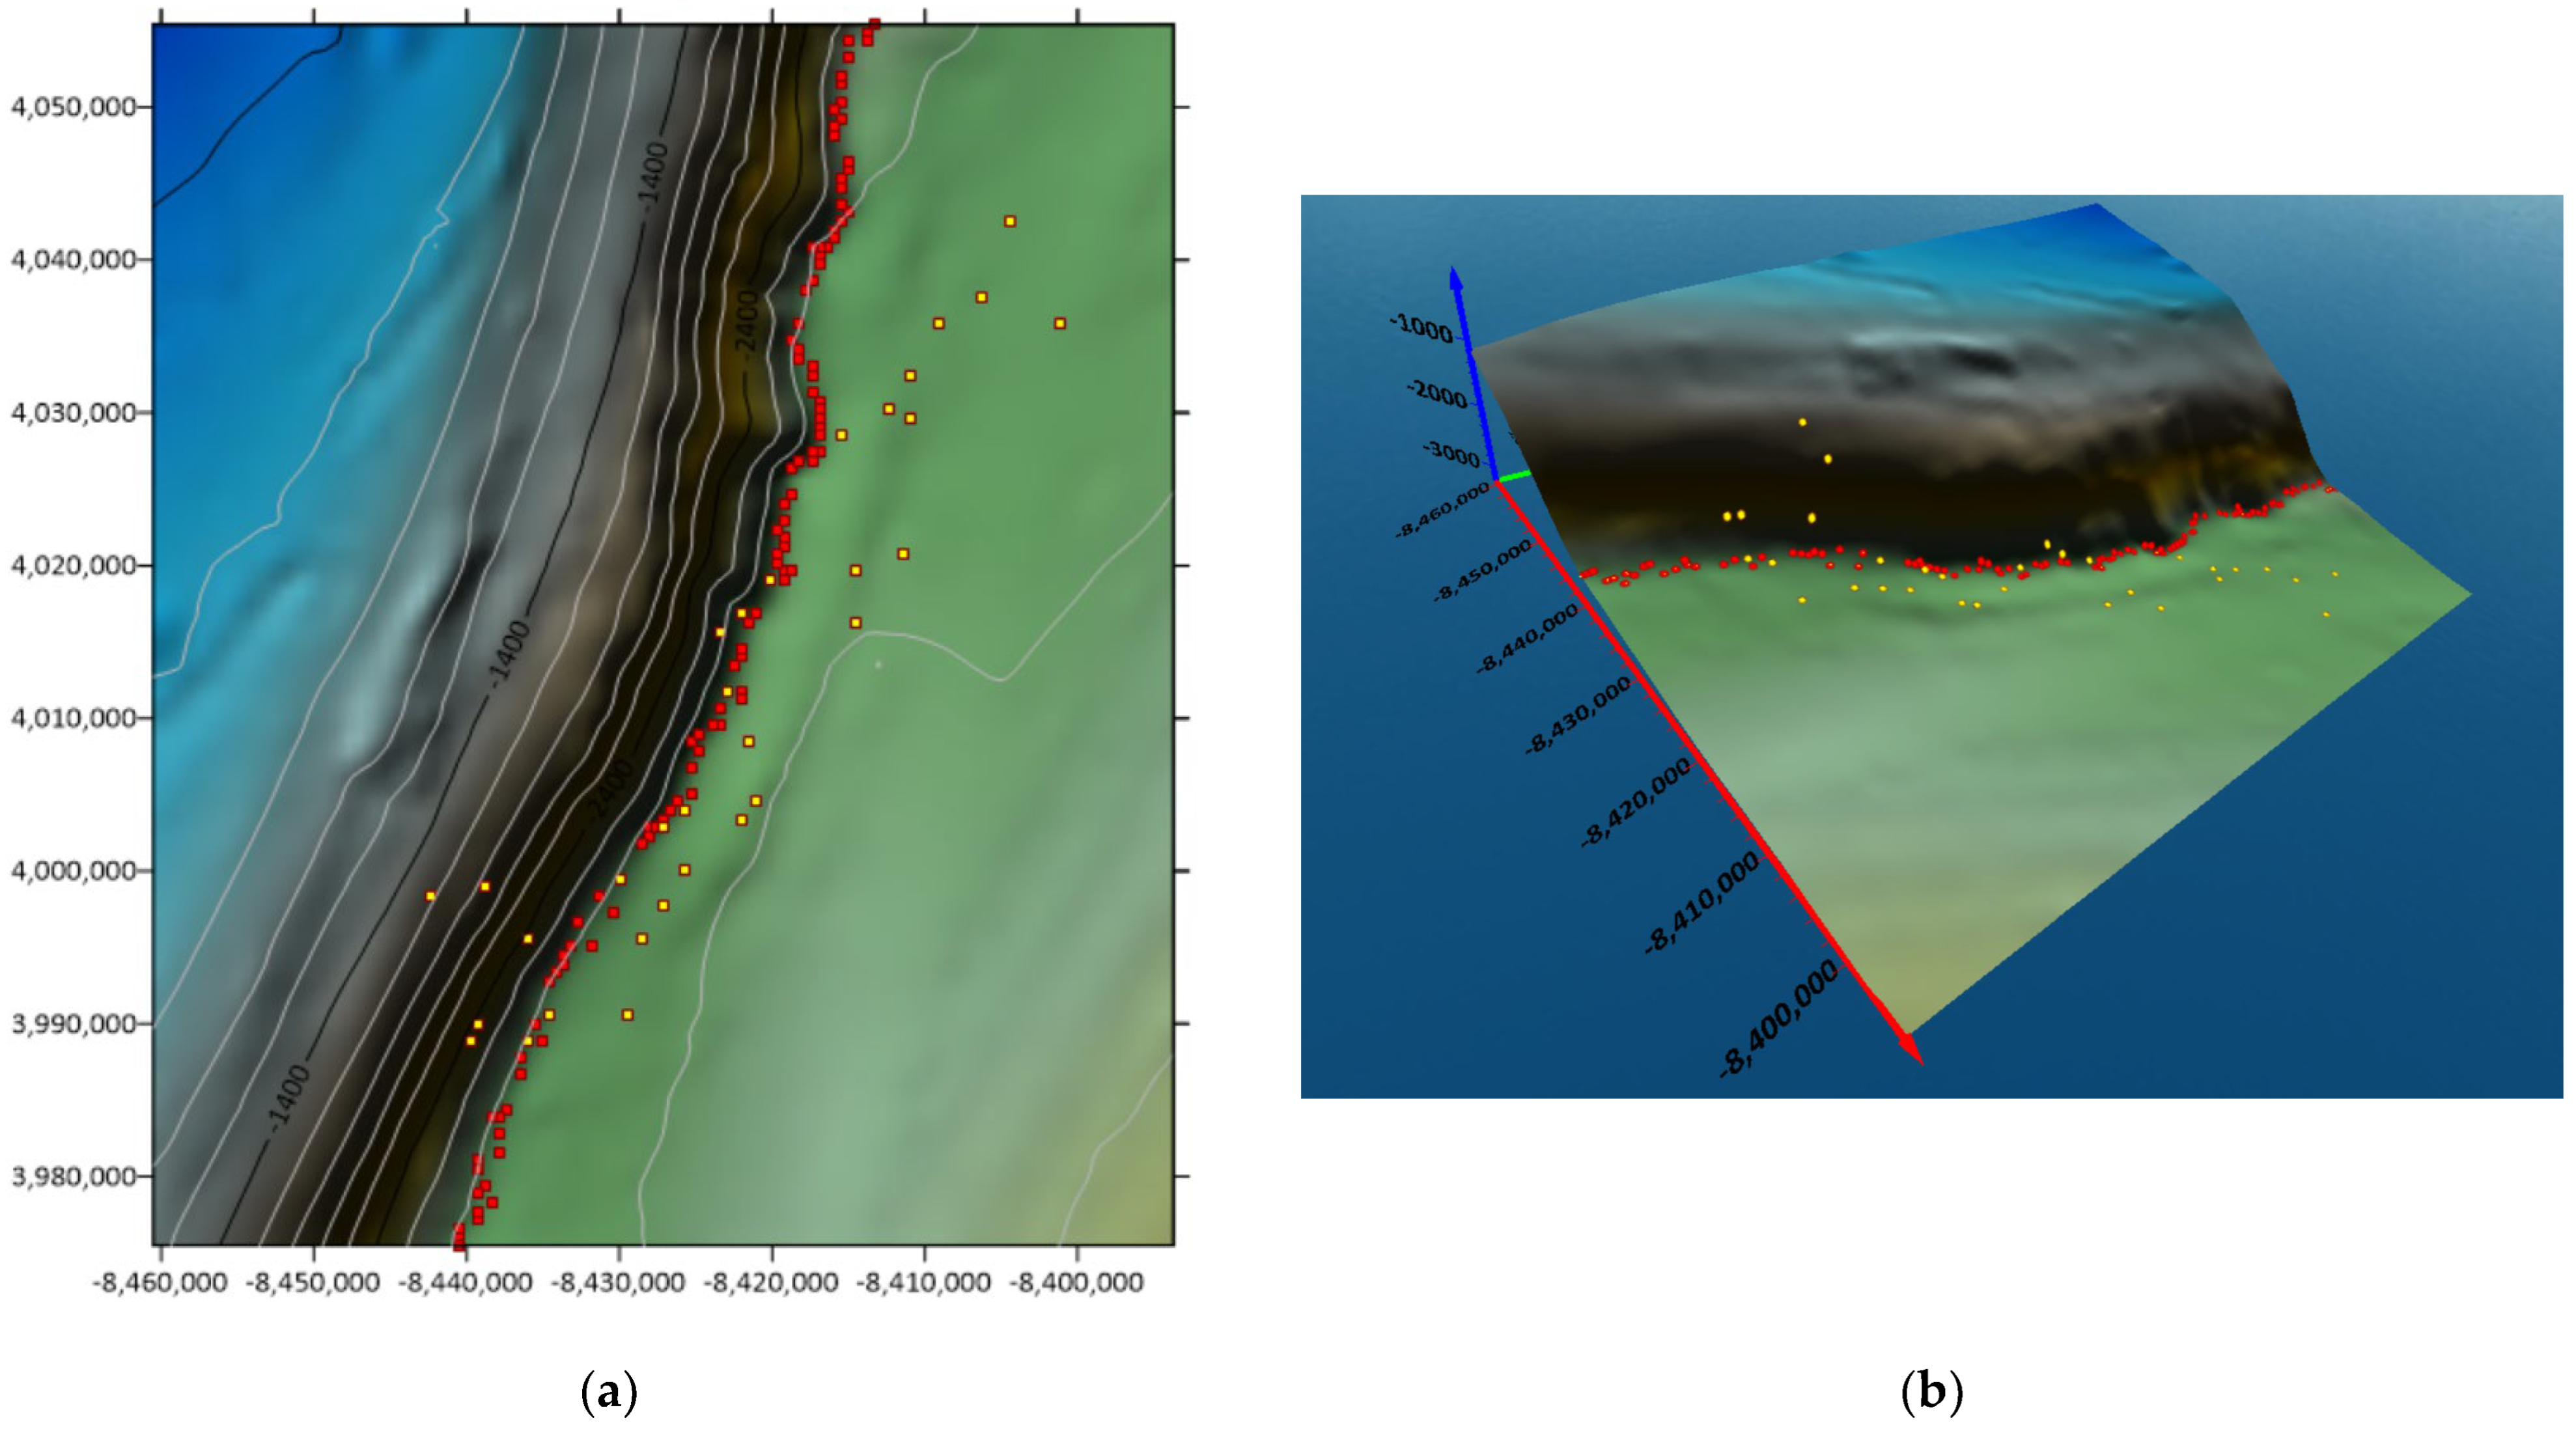
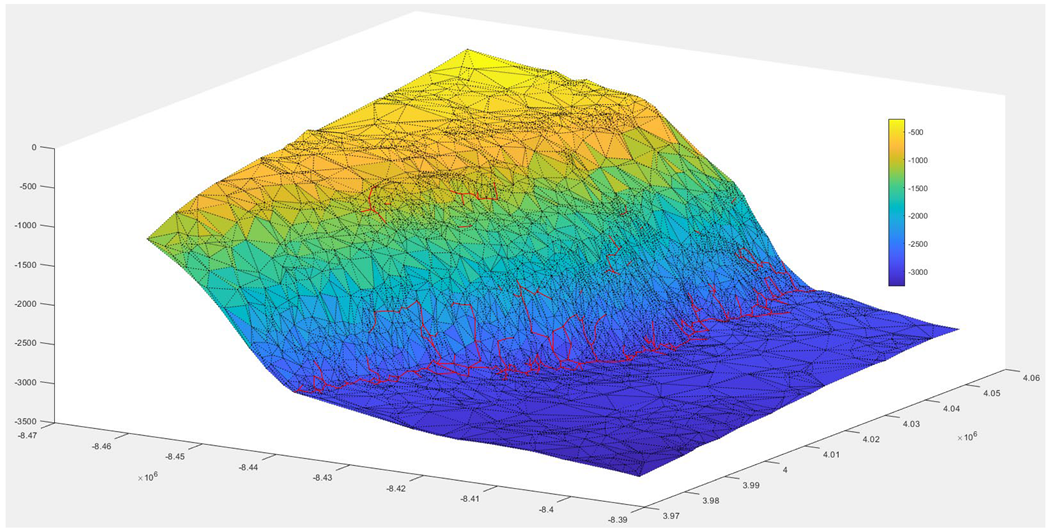
To verify the applicability of the proposed algorithm in delineating the outer limits of the continental margin and to achieve precise extraction of the continental margin FOS line while considering topographic continuity, we conducted a comparative analysis experiment. In this experiment, we used real continental margin terrain image dataset A. The extraction results were visualized using MATLAB R2023a and Surfer 23 software, and a comparative analysis was conducted using the FOS identification results obtained utilizing the widely used CARIS Law of the Sea 4.1.1.0 (Caris LOTS) boundary delimitation software (Figure 7 and Figure 8). The proposed method is referred to as Method I, and the process of identifying the FOS and drawing the FOS line in Caris LOTS is designated as Method II. Since Caris LOTS does not directly generate continental margin FOS lines, manual terrain-profile operations in the Caris LOTS software were required. The D–P algorithm was used to analyze the FOS points on the profile curves, followed by report generation and recording of the FOS point coordinates for result visualization in Surfer and MATLAB. It should be noted that Caris LOTS did not accurately identify the FOS positions in every profile. Therefore, during the FOS identification process conducted on profile curves in Caris LOTS, the D–P algorithm was primarily used, supplemented by the Fourier algorithm to ensure that corresponding FOS points were obtained in each selected profile. In the experiment, 33 continental margin terrain profiles and 33 FOS points were generated using Caris LOTS. In Figure 7, the water depth value increases in the direction from the yellow terrain to the blue terrain, and the extracted continental margin FOS line is indicated by a red solid line. In Figure 8, the blue area represents higher-elevation terrain, the green area represents lower-elevation terrain, the red dots indicate the results of Method I for identifying continental margin FOS points, and the yellow dots indicate the results of Method II. And the coordinate system used in Figure 8 is the Mercator projected coordinate system.
The experimental results demonstrate the following:
  • As shown in Figure 7, the FOS lines extracted using Method I are primarily located in the basal region of the continental slope, which is characterized by low elevations and local concave terrain features. This aligns with the provisions of Article 76 of the UNCLOS regarding the foot of the continental slope.
  • Method II’s results, derived from manually added terrain profiles, are relatively crude. While they generally follow the direction of the margin of the continental margin, their accuracy is poor, and some areas exhibit cross-terrain category extraction.
  • Comprehensive comparison of the FOS line extraction results obtained using the two methods revealed that Method I better preserves the topographic continuity, yielding more complete and continuous lines that conform to the actual geographical features.
  • Figure 8 demonstrates that unlike Method II, which relies on repeated manual collection of the FOS through terrain profiles, the FOS identified using Method I is more densely distributed and precise. For continental margin dataset A, Method I performs well, covering nearly the entire basal margin of the continental margin.
  • Compared with Method I, Method II lacks a multi-criteria filtering process for FOS identification. The manual selection of terrain profiles in Method II lacks standardized rules, significantly impacting the quality of the final FOS identification results. As shown in Figure 8b, Method II may misidentify the FOS, with some identified points located in the continental slope area, which is inconsistent with the geographic characteristics of the foot of the continental slope.

4.3. Efficiency Analysis

Given the often complex and extensive nature of continental margin boundaries, investigating the efficiency of the FOS line extraction process is of great significance. Method II identifies the FOS by repeatedly slicing terrain profiles using Caris LOTS. Its logic is essentially different from the automated FOS line extraction of Method I. Method II involves excessive manual operations, and the specific experimental time depends on the number of FOS identifications, i.e., how many continental margin longitudinal profiles are constructed. By contrast, Method I automatically generates the FOS line, and the extraction results are not limited by the operator’s proficiency. Therefore, from a logical analysis of the technical implementation process, Method I’s total process execution efficiency is bound to exceed that of Method II. To verify this inference, in this paper, the total timing of the comparative experiment process presented in Section 4.2 is used as an example to compare the total process time results of the two methods. The experimental data utilized are continental margin terrain dataset A, with a data size of 81 KB and 2752 bathymetric point coordinate data. In Method I, the negative topographic feature lines of the weak feature group and strong feature group are obtained by changing the spatial extraction threshold 10 times, and the continental margin FOS line is filtered out by changing the importance threshold six times. It should be noted that the number of experiments required to obtain the negative topographic feature lines and the continental margin FOS line depends on the specific situation, but it can generally be completed within 10 attempts. In addition, in Method I, the standard for manually deleting small branch segments is set to retain only the main trunk segments of the extraction results, and priority is given to retaining branch segments far away from the continental slope area. The results of the efficiency experiment are presented in Table 2.
The experimental results indicate the following:
  • Compared with Method II, Method I significantly reduces the overall time consumption. The proposed method for precise extraction of the continental margin FOS line considers the topographic continuity, and it also has a substantial efficiency advantage in delineating the outer limits of the continental margin. The process time efficiency improvement is approximately 63.2%.
  • The primary technical steps of Method I involve rolling ball transformation for generating buffer surfaces, extracting negative topographic feature lines, and extracting the continental margin FOS line. However, these steps account for only 1% of the total process time. For continental margin terrain dataset A, the main efficiency-limiting step of Method I is the multi-criteria FOS line filtering process. This is due to the involvement of manual operations in the denoising step of the multi-criteria filtering process, that is, operators need to manually delete some branch segments in the results and retain the main trunk of the continental margin FOS line.
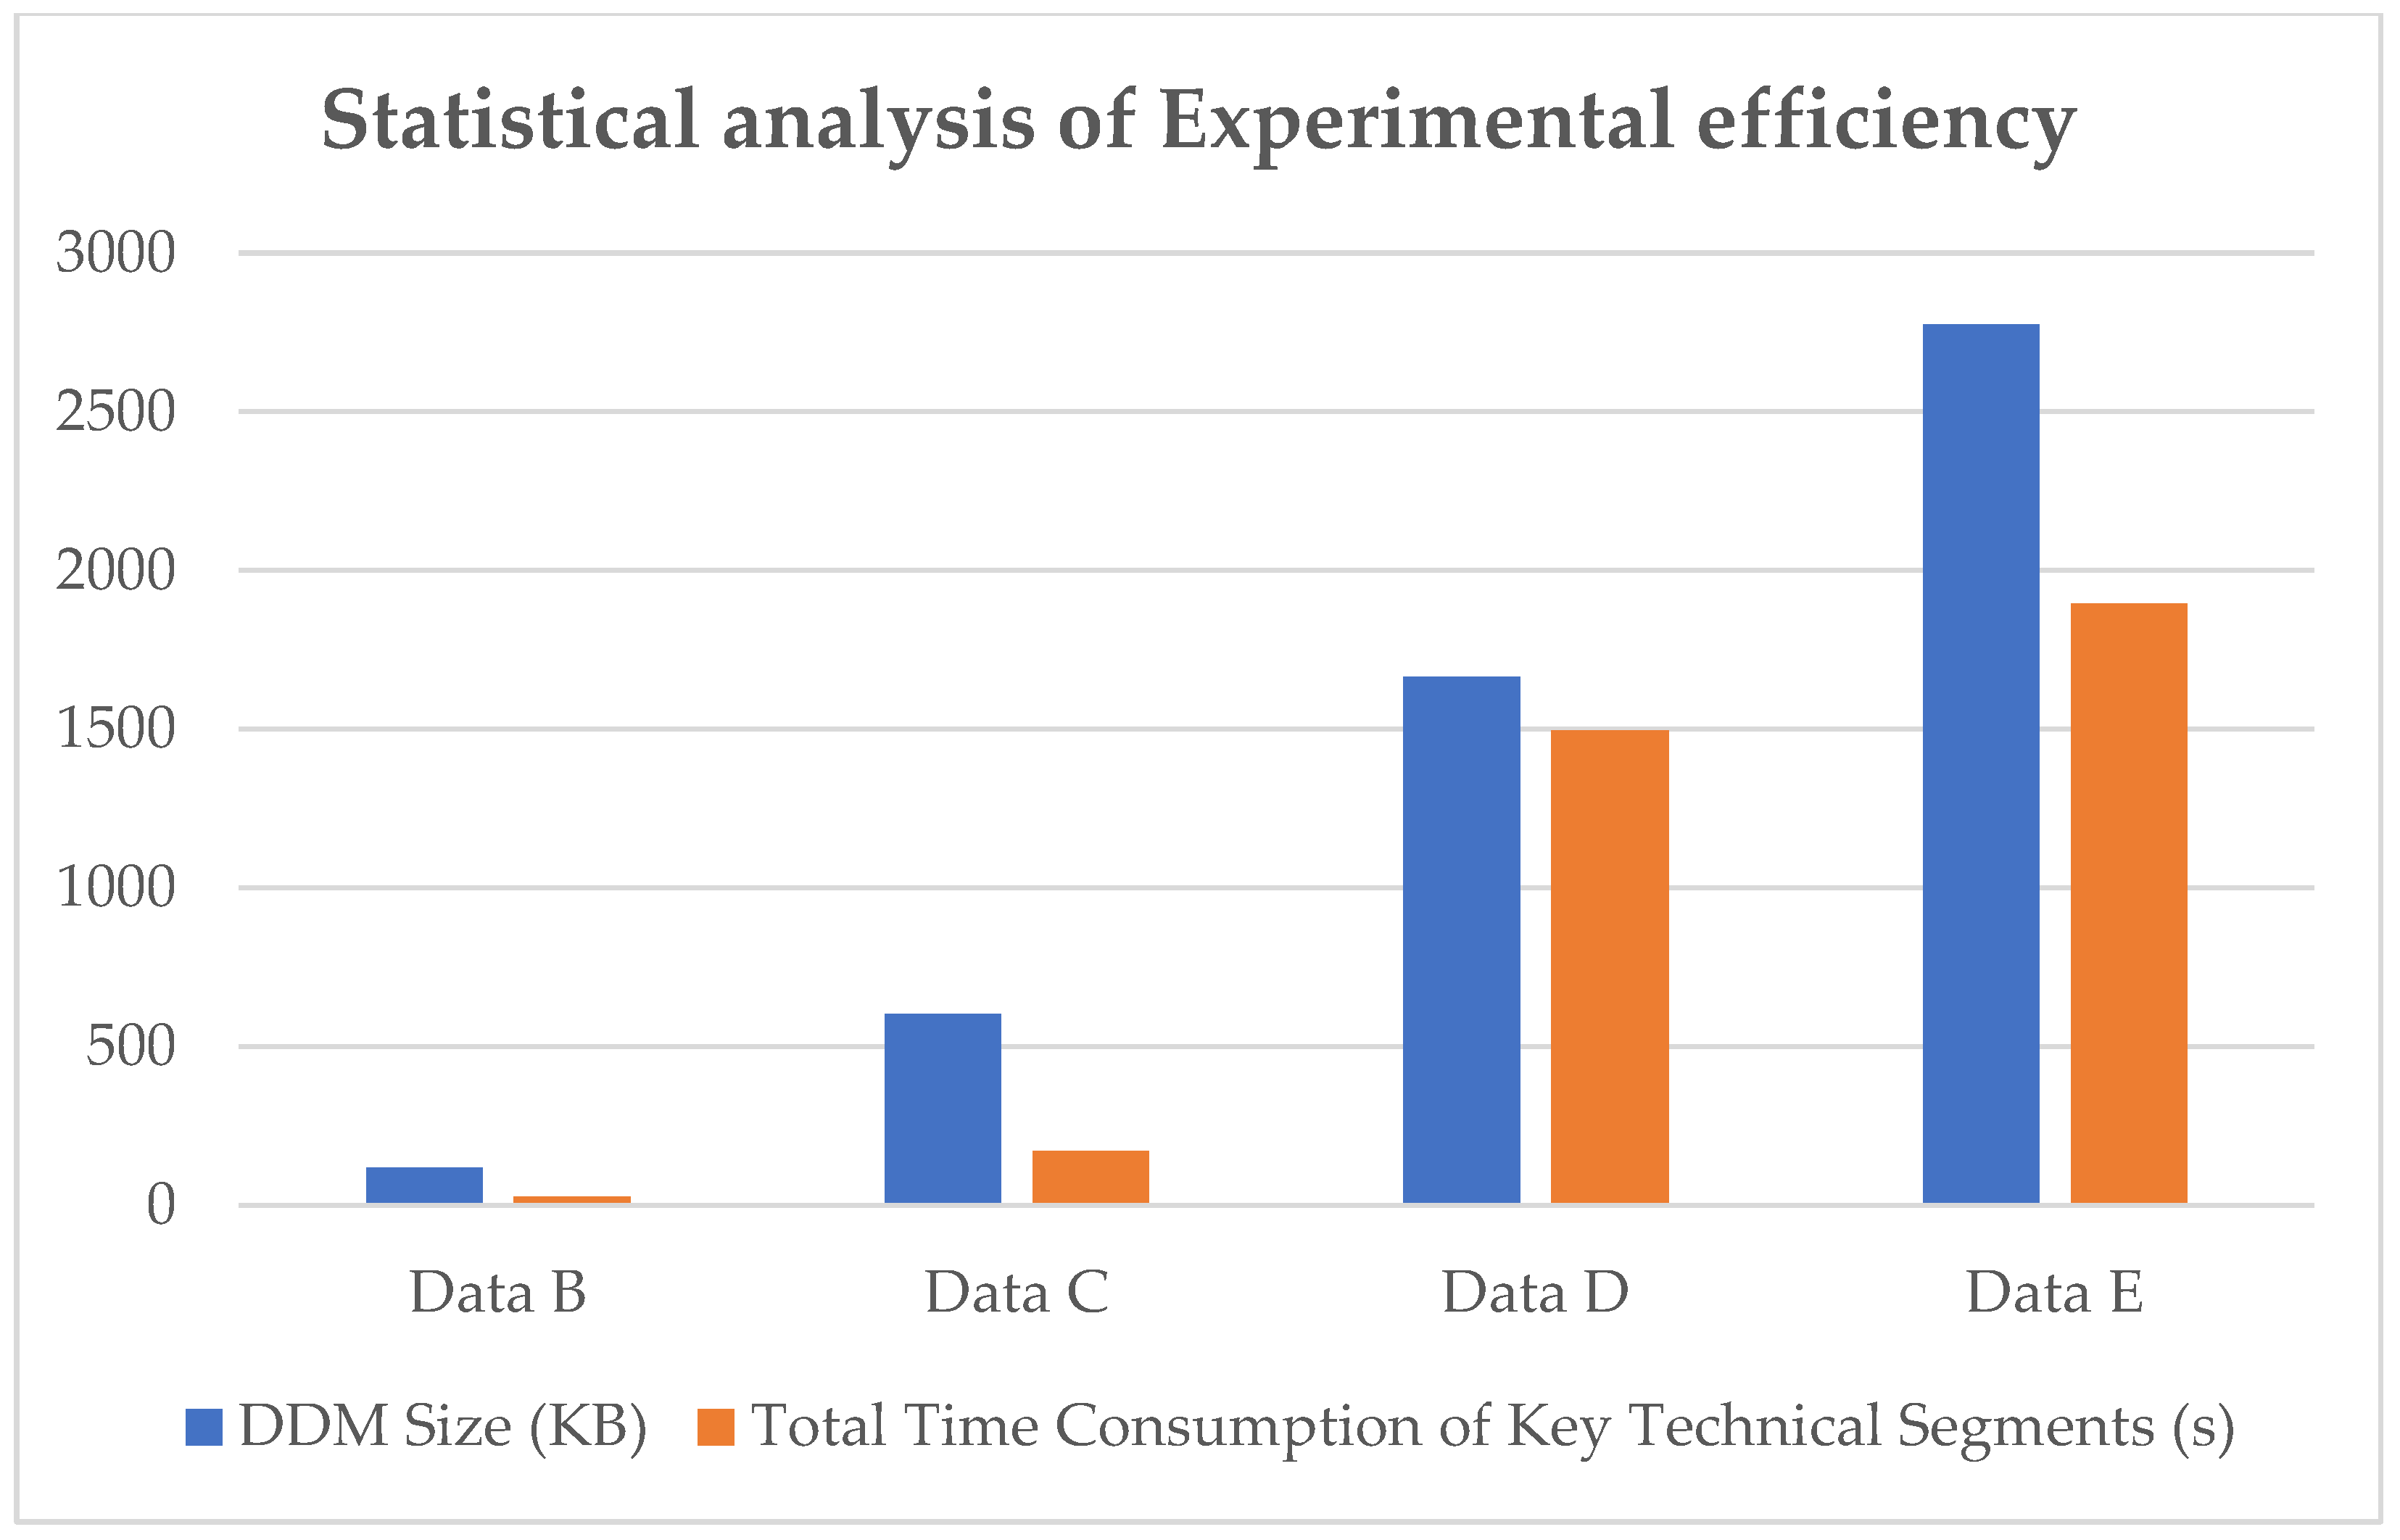
Since the data volume of continental margin terrain dataset A is not large, analyzing the efficiency of Method I based solely on dataset A is insufficient. Therefore, assuming that the time consumption of the multi-criteria FOS line filtering process remains constant, in each experiment, 10 adjustments of the spatial extraction threshold are conducted to obtain the negative topographic feature lines of the weak-feature group and strong-feature group, and 10 adjustments of the importance threshold are made to filter out the continental margin FOS line. A controlled-variables method is used to time the key technical steps of Method I for different experimental area data. The results of the efficiency analysis of the key technical steps of Method I are presented in Table 3, and a bar chart of the results of the efficiency analysis is presented in Figure 9. Datasets B, C, D, and E are from the etopo2022 real continental margin remote sensing image data for the East China Sea, the western Atlantic, and the eastern Indian Ocean.
Experimental results reveal the following:
  • As shown in Figure 9, for Method I, the total time consumption of the key technical steps is directly proportional to the size of the DDM data. The larger the DDM data to be processed, the longer the time required for the key technical steps.
  • As indicated in Table 3, among the key technical steps for the different continental margin terrain data, the most time-consuming step is the rolling ball buffer surface generation process, accounting for 88.4%, 69.1%, 53.9%, and 68.6% of the total time for datasets B, C, D, and E, respectively. This suggests that the rolling ball transformation for buffer surface generation is the primary efficiency-limiting step of the proposed method for precise extraction of the continental margin FOS line while considering topographic continuity. Future efforts to enhance the computational efficiency of this method should focus on this aspect.

5. Summary and Outlook

In this study, we developed a novel method for precisely extracting the FOS line of the continental margin while considering topographic continuity. The method is based on the rolling ball transformation for extracting negative topographic feature lines and the concept of feature attribute intensity division. By adjusting the spatial-scale threshold during the extraction process, strong-feature and weak-feature negative topographic feature lines are obtained. In this method, the concept of connected components from graph theory is introduced to establish an importance ranking model for negative topographic feature lines in the weak-feature group. Furthermore, a multi-criteria filtering process, designed around the geographic features of the FOS, is integrated to achieve a precise and efficient method for extracting the continental margin FOS line that considers topographic continuity. To validate the effectiveness, accuracy, and efficiency of the proposed method, we conducted visual interpretation evaluation, comparative analysis experiments, and efficiency analysis experiments based on relevant experimental data. The results demonstrate the advantages of the developed algorithm and achieve satisfactory experimental outcomes. However, it should be noted that there is still significant room for improving the efficiency of this method when processing global continental margin data. In addition, the applicability of the method to continental margin terrains with complex topographic variations and/or geological compositions requires further enhancement. This is particularly important in settings such as accretionary, weakly accretionary, and erosive active continental margins, as well as magma-poor, magma-rich, and shear-type passive continental margins. Delineating the continental-shelf FOS line in these contexts often involves interdisciplinary research in geology and other fields. Therefore, it is essential to develop adaptive solutions for extracting the continental margin FOS line from a multidisciplinary perspective.

Author Contributions

Conceptualization, D.W. and J.D.; Methodology, D.W. and Z.Z.; Resources, J.D. and T.X.; Data curation, T.X.; Writing—original draft, D.W.; Writing—review & editing, J.D., Z.Z., T.X. and X.M.; Visualization, X.M. and T.W.; Supervision, Z.Z. and T.W. All authors have read and agreed to the published version of the manuscript.

Funding

This research received no external funding.

Data Availability Statement

The original multibeam bathymetric datasets used in this study are publicly available in the National Oceanic and Atmospheric Administration (NOAA) National Centers for Environmental Information (NCEI) repository at https://www.ncei.noaa.gov/products/etopo-global-relief-model (accessed on 6 November 2024).

Conflicts of Interest

The authors declare no conflicts of interest.

References

  1. Fang, Y.X.; Li, J.B. Principles and Methods of the Commission’s Deliberation on the Continental Shelf Delimitation Cases—Case Analysis of the Commission’s Recommendations. J. Mar. Res. 2013, 31, 1–9. [Google Scholar]
  2. Sun, Q.C.; Fang, Y.X.; Li, J.B. Continental Shelf Delimitation Technology and Its Application Prospects in the Maritime Silk Road Cooperation. Adv. Earth Sci. 2018, 33, 1215–1222. [Google Scholar]
  3. Yang, Z.W. China and the United Nations Convention on the Law of the Sea (UNCLOS): Process, Impact, and Future Prospects. Contemp. Law 2022, 36, 29–40. [Google Scholar]
  4. Xie, T.; Dong, J.; Tang, L.; Ma, M.; Wang, D. Method for Delineating the Formula Limit of the Continental Shelf under the Maximum Area Principle Constraint. J. Mar. Sci. Eng. 2024, 12, 949. [Google Scholar] [CrossRef]
  5. Xie, T.; Dong, J.; Tang, L.; Ma, M.; Zhang, M.; Song, Z.; Wang, D. Mercator Projection Surface Geodetic Line Precise Development Algorithm with Scale Adaptive Adjustment. Acta Geod. Cartogr. Sin. 2024, 53, 2338–2348. [Google Scholar]
  6. United Nations. Technical Manual of the 1982 United Nations Convention on the Law of the Sea; Ocean Press: Beijing, China, 2019. [Google Scholar]
  7. United Nations. United Nations Conference on the Law of the Sea; Ocean Press: Montego Bay, Jamaica, 1983. [Google Scholar]
  8. Li, J.B.; Fang, Y.X.; Wu, Z.Y.; Tang, Y. Continental Shelf Delimitation Technology Beyond 200 Nautical Miles and Its Application. Prog. Geophys. 2013, 28, 531–539. [Google Scholar]
  9. Fang, Y.X.; Li, J.B. Key Scientific and Technological Issues of Continental Shelf Delimitation Beyond 200 Nautical Miles and Their Applications. In Chinese Geophysical Society Information Technology Professional Committee “Internet + Geophysics” Research Forum Abstract Collection; Chinese Geophysical Society: Beijing, China, 2016. [Google Scholar]
  10. Fang, Y.X.; Li, J.B.; Yin, J.; Liu, W.; Tahn, Y. Principles and Methods for Determining the Foot of the Continental Slope. J. Mar. Res. 2022, 40, 1–9. [Google Scholar]
  11. Cao, C.; Cai, F.; Li, Y.; Zheng, Y.; Wu, C.; Lu, H.; Bao, J.; Xu, Y. Characteristics of the Submarine Topography and its Profile Type of the Coast of China. Acta Geol. Sin. Engl. Ed. 2013, 87, 1724–1742. [Google Scholar] [CrossRef]
  12. Wu, Z.Y.; Li, J.B.; Yang, F.L.; Shang, J.H.; Li, S.J.; Jin, S.B. An Automatic Identification and Comprehensive Judgment Method for the Foot of the Continental Slope. Acta Geod. Cartogr. Sin. 2014, 43, 170–177. [Google Scholar]
  13. Zhuang, B.J.; Tang, Y.; Lv, Q.H.; Yang, C.; Wu, Z.; Li, H. A Method for Determining the Foot of the Continental Slope in Complex Geological Backgrounds: A Case Study of the Southern Mozambique Margin. J. Mar. Res. 2024, 42, 13–22. [Google Scholar]
  14. He, J.; He, D.F.; Li, S.L.; Zhang, G. Formation Conditions and Distribution Patterns of Giant Oil and Gas Fields on the South Atlantic Passive Continental Margin—A Case Study of the Santos Basin, Brazil. China Pet. Explor. 2011, 16, 57–67+8. [Google Scholar]
  15. Ou, Z.; Vaníček, P. Automatic tracing of the foot of the continental slope. Mar. Geod. 1996, 19, 181–195. [Google Scholar] [CrossRef]
  16. Pantland, N.A. 3D Numerical Techniques for Determining the Foot of a Continental Slope. Master’s Thesis, Stellenbosch University, Stellenbosch, South Africa, 2004. [Google Scholar]
  17. Dong, J.; Zhang, Z.Q.; Peng, R.C.; Zhou, W.; Ji, H. Automatic Extraction Method of TIN-DDM Topographic Feature Lines Based on Rolling Ball Transformation. J. Natl. Univ. Def. Technol. 2024, 46, 167–179. [Google Scholar]
  18. Guo, W.Q.; Liu, S.Y.; Yu, P.C.; Xu, J.L. Automatically extract ridgeline using watershed boundary and aspect difference. Sci. Surv. Mapp. 2011, 36, 210–212+191. [Google Scholar]
  19. Li, J.J. Research and Implementation of Terrain Feature Recognition Method Based on Flowing Process. Master’s Thesis, Xidian University, Xi’an, China, 2019. [Google Scholar]
  20. Wang, W.J. Topographic Feature Line Extraction of Regular Grid DDM. Master’s Thesis, Chang’an University, Xi’an, China, 2018. [Google Scholar]
  21. Hu, Q.M. Research Progress on Extraction Method of Terrain Features Lines. Geogr. Spat. Inf. Technol. 2017, 40, 47–50+54. [Google Scholar]
  22. Zhang, Z.H.; Dong, J.; Peng, R.; Lu, Y.; Chen, Q.; Zhu, Q. Division of TIN_DDM topographic forms and continuous scale representation based on rolling ball transformation. Acta Geod. Cartogr. Sin. 2020, 49, 644–655. [Google Scholar]
  23. Dong, J.; Peng, R.C.; Zhang, L.H.; Li, N.; Jia, S.D. Multi-Scale Expression of Digital Depth Model Based on Rolling Ball Transformation. J. Earth Inf. Sci. 2012, 14, 704–711. [Google Scholar]
  24. Wang, D.; Dong, J.; Tang, L.; Ma, M.; Xie, T. An Automatic Generalization Method of a Block-Based Digital Depth Model Based on Surface Curvature Features. J. Mar. Sci. Eng. 2024, 12, 2299. [Google Scholar] [CrossRef]
  25. Dong, J.; Peng, R.C.; Zheng, Y.D.; Zhang, L.H. Boundary Generation Algorithm for Single-Valued Surface Buffer Body Based on Rolling Ball Model. J. Comput. Aided Des. Comput. Graph. 2013, 25, 996–1004. [Google Scholar]
  26. Dong, J.; Peng, R.C.; Zhang, L.H.; Liu, G.H.; Zhu, Q. Bidirectional Rolling Ball Transformation Algorithm for Multi-Scale Expression of DDM Considering “Fidelity” Principle. Acta Geod. Cartogr. Sin. 2017, 46, 789–801. [Google Scholar]
  27. Dong, J.; Zhang, Z.H.; Peng, R.C.; Li, G.X.; Wang, M. Rolling Ball Accelerated Optimization Algorithm for Rapid Construction of Buffer Surface of TIN Digital Depth Model. Acta Geod. Cartogr. Sin. 2019, 48, 654–667. [Google Scholar]
  28. Ma, L.M.; Xu, Y.; Li, Z.X. Feature Point Extraction of Scattered Point Cloud Data Based on Gaussian Curvature Extreme Points. J. Syst. Simul. 2008, 20, 2341–2344. [Google Scholar]
  29. Chen, Y.; Jiang, K.Q. Implementation and Analysis of Several Algorithms for Finding Strongly Connected Components. Comput. Knowl. Technol. Acad. Ed. 2011, 7, 2140–2142. [Google Scholar]
  30. Ouyang, S.; Hu, W.Y. Research and Application of Several Classical Search Algorithms. Comput. Syst. Appl. 2011, 20, 243–247. [Google Scholar]
  31. Liu, P.; Feng, G.L. Analysis and application for depth-first search algorithm of graph. J. Qinghai Norm. Univ. (Nat. Sci. Ed.) 2007, 29, 41–44. [Google Scholar]
  32. Brownlie, I.; Cook, P.J.; Carleton, C.M. Continental Shelf Limits: The Scientific and Legal Interface. Am. J. Int. Law 2000, 96, 286. [Google Scholar] [CrossRef]
  33. Ma, D.; Fan, M.; Yan, X.P.; Sun, Y.; Ma, Y. An Improved Thinning Algorithm for Multibeam Bathymetric Data Based on TIN. Ocean Technol. 2019, 38, 49–54. [Google Scholar]
Figure 1. Schematic diagram of the physical description of the rolling ball transformation.
Jmse 13 01744 g001
Figure 2. (ac) Schematic diagram of terrain feature identification based on the critical rolling ball radius.
Jmse 13 01744 g002
Figure 3. Classification of seafloor surface terrain feature points.
Jmse 13 01744 g003
Figure 4. Schematic diagram of two typical negative topographic feature lines with distinct feature attributes. (a) strong feature attribute negative topographic feature lines, (b) weak feature attribute negative topographic feature lines.
Jmse 13 01744 g004
Figure 5. General technical workflow of the precise extraction method of continental margin FOS line considering terrain continuity.
Jmse 13 01744 g005
Figure 6. Results of multi-factor screening process for continental margin FOS line.
Jmse 13 01744 g006
Figure 7. MATLAB visualization of extraction results obtained using Methods I and II.
Jmse 13 01744 g007
Figure 8. SURFER visualization of extraction results obtained using Methods I and II. (a) Two-dimensional graph of the FOS extraction results. (b) Three-dimensional graph of the FOS extraction results.
Jmse 13 01744 g008
Figure 9. Statistical analysis of Method I’s efficiency.
Jmse 13 01744 g009
Table 1. Extraction images of negative topographic feature lines in area a under different screening thresholds.
Screening Result
r = 0.0Jmse 13 01744 i001
r = 0.5Jmse 13 01744 i002
r = 0.72Jmse 13 01744 i003
r = 0.8Jmse 13 01744 i004
Table 2. Comparative analysis of extraction efficiencies of Methods I and II.
MethodMethod IMethod II
Technical SegmentRolling Ball Transformation for Generating Buffer SurfaceExtracting Negative Topographic Feature LinesExtracting Continental Margin FOS Line SegmentsMulti-Criteria Continental Margin FOS Line Filtering ProcessOperator Process
Segment Timing (s)2.085 + 2.0730.278 × 100.144 × 6726.81994.6
Total Process Time (s)734.61994.6
Table 3. Efficiency analysis of key technical components of method I.
Continental Margin Terrain DataData BData CData DData E
DDM Size (KB)11960316642775
Quantity of Bathymetric Points360020,73657,601100,890
Rolling Ball Buffer Surface Generation Time (s)Upper Buffer Surface1.45259.564638.511379.513
Lower Buffer Surface23.02857.685167.304920.106
Negative Topographic Feature Line Extraction Time (s)0.209 × 103.977 × 1034.812 × 1056.744 × 10
Continental Margin Foot-of-Slope Line Extraction Time (s)0.113 × 101.288 × 103.41 × 102.846 × 10
Total Time Consumption of Key Technical steps (s)27.700169.8991494.9351895.519
Disclaimer/Publisher’s Note: The statements, opinions and data contained in all publications are solely those of the individual author(s) and contributor(s) and not of MDPI and/or the editor(s). MDPI and/or the editor(s) disclaim responsibility for any injury to people or property resulting from any ideas, methods, instructions or products referred to in the content.