Article

Autonomous Inspection Strategies and Simulation for Large Aquaculture Net Cages Based on Deep Visual Perception

1
State Key Laboratory of Ocean Engineering, Shanghai Jiao Tong University, Shanghai 200240, China
2
School of Naval Architecture, Ocean & Civil Engineering, Shanghai Jiao Tong University, Shanghai 200240, China
3
School of Electronic Information and Electrical Engineering, Shanghai Jiao Tong University, Shanghai 200240, China
*
Author to whom correspondence should be addressed.
J. Mar. Sci. Eng. 2025, 13(9), 1736; https://doi.org/10.3390/jmse13091736
Submission received: 31 May 2025 / Revised: 1 September 2025 / Accepted: 3 September 2025 / Published: 9 September 2025

Abstract

In China, a single large deep-sea net cage can raise nearly one million fish. If the fish net is damaged and the fish escape, it can lead to significant economic losses and ecological damage. Therefore, the inspection and maintenance of deep-sea aquaculture net cages are very important. Currently, the inspection of fish nets relies primarily on manual remote control, and underwater positioning often uses ultra-short baseline systems, which depend on specialized personnel and have high costs. This paper proposes an autonomous inspection strategy for large aquaculture net cages based on deep visual perception. It utilizes stereo cameras to identify the relative distance and attitude angles between the robot and the sides of fish net as well as the fish net ahead. A PID method is employed to control the underwater autonomous net patrol robot to conduct operations with fixed depth, fixed distance, and attitude holding around the net. By integrating the Gazebo physical simulation platform with the ROS (Robot Operating System), a simulation environment for the underwater autonomous net patrol robot was constructed. The study investigated the inspection performance of the robot under different speed conditions, both in still water and considering current conditions. By comparing the actual operating trajectory with the expected trajectory, the proposed autonomous inspection strategy was validated. Moreover, the study examined the operation state under sudden disturbance forces, where the robot deviated six meters from the net cage and rotated 70 degrees. The simulation results indicate that under this control strategy, the robot can quickly recover its desired pose and continue executing the inspection task.

1. Introduction

In recent years, China’s marine aquaculture industry has experienced rapid growth [1,2]. As issues with coastal aquaculture intensify and aquaculture operations scale up, deep-sea net cage farming has emerged as a key trend in the marine aquaculture sector. A single large deep-sea net cage can reach a volume of 100,000 cubic meters [3]. However, prolonged exposure to complex marine environments, such as impacts from seawater and biological fouling, makes these cages susceptible to damage. If the fish net tears and fish escape, it could result in significant economic losses and severe ecological consequences [4,5]. Therefore, regular inspection and maintenance of large deep-sea net cages are critical for ensuring the sustainability of deep-sea aquaculture. Current methods for net cage inspection can be categorized into traditional manual diving inspections, fixed-point sensor-based inspections, remote-operated vehicle (ROV) inspections, and autonomous underwater vehicle (AUV) inspections. Traditional manual diving requires highly skilled divers and specialized equipment, posing significant risks to personnel and operational challenges, particularly in deep-sea operations. Fixed-point sensor-based methods, such as fixed camera imaging and buried wire detection, reduce human risks but suffer from limited flexibility. They are also prone to issues such as equipment corrosion and maintenance difficulties. ROV-based inspections are more flexible, yet they rely on a cable-based power supply and communication, which restrict their operational depth. Excessively long cables can also become entangled, disrupting ROV operations. Moreover, ROV inspections require a certain degree of manual control. In contrast, AUVs offer high flexibility and the ability to navigate and make decisions autonomously without human intervention. However, underwater perception and autonomous navigation remain significant technical challenges.
In recent years, autonomous inspection strategies with underwater robots have attracted wide attention [6,7,8,9,10,11]. Researchers have proposed various methods to enhance the positioning and navigation capabilities of these robots. Stian et al. [12] installed acoustic responders near the surface of aquaculture net cages to assist ROV localization and employed an extended Kalman filter (EKF) with wave motion compensation to mitigate the impact of wave disturbances on system accuracy, which proved effective in improving positioning performance in fish-free environments. Herman et al. [13] utilized a Doppler Velocity Log (DVL) to estimate the local geometry of the fish net ahead of the ROV, thereby determining the ROV’s relative orientation. The data were then used in a line-of-sight (LOS)-based nonlinear navigation rate to guide the ROV in net inspection. However, experiments revealed that DVL velocity measurements were susceptible to noise, and fish passing through the DVL signal beam interfered with distance measurements. Olav et al. [14] combined DVL with other sensors to develop an underwater robot positioning system for aquaculture farms, which included an inertial measurement unit (IMU), DVL, and ultra-short baseline (USBL). They modeled pressure sensor bias and incorporated the estimates into a multiplicative EKF. Results showed that USBL and DVL had limited measurement accuracy in aquaculture environments, highlighting the need for higher-quality IMUs to enhance ROV functionality. Recently, with advancements in computer vision and neural networks, many researchers, both domestically and internationally, have explored vision-based methods for underwater robot net inspection. For instance, Magnu et al. [15] projected lasers onto the fish net, using a monocular camera to capture images and fit net planes to estimate ROV pose relative to the net cage. Comparative tests of laser-based and DVL-based measurements yielded similar results. While this method provided an economical alternative to DVL, it was limited by weak and noisy laser signals when the robot moved more than 2.5 m from the net. Salvador et al. [16] trained a convolutional neural network (CNN) to control the distance between the underwater robot and fish net using net image data and further implemented net mesh detection and positioning through YOLO and QR codes. While CNN-based methods eliminate the need for manually designed distance extraction algorithms and demonstrate high adaptability, their control performance is highly dependent on the quality of the dataset. Yan [17] developed a reinforcement learning system employing coordinated wide-angle side-view and downward-facing cameras, which achieved robust navigation performance in simulation environments by utilizing the distinctive bottom-ring features of gravity-type cages for visual reference. While this configuration demonstrates high effectiveness for its target application scenario, the methodology’s performance consistency across structurally dissimilar cage types warrants further investigation to enhance its broader applicability.
This paper proposes an autonomous inspection strategy for large aquaculture net cages based on deep visual perception. It utilizes stereo cameras for fish net distance measurement and an IMU for attitude information acquisition. A Proportional-Integral-Derivative (PID) control method is employed to regulate the AUV’s motion. PID control is a widely used feedback mechanism that calculates the error between a desired setpoint (e.g., target distance/attitude) and measured process variables, then applies corrections based on three terms: the Proportional (P) term for present error, the Integral (I) term for accumulated past errors, and the Derivative (D) term for predicted future errors. This ensures stable and precise tracking of the reference trajectory while compensating for disturbances. By integrating the open-source UUV_simulator [18] and the Robot Operating System (ROS) on the Gazebo physical simulation platform, a simulation environment for the proposed strategy was constructed. The study investigated the inspection performance of the robot under different speed conditions, both in still water and considering current conditions. By comparing the actual operating trajectory with the expected trajectory, the proposed autonomous inspection strategy was validated. Moreover, the study examined the operation state under sudden disturbance forces. The simulation results indicate that under this control strategy, the robot can quickly recover its desired pose and continue executing the inspection task.

2. Simulation Scenarios and Underwater Robots

2.1. Simulation Scenarios

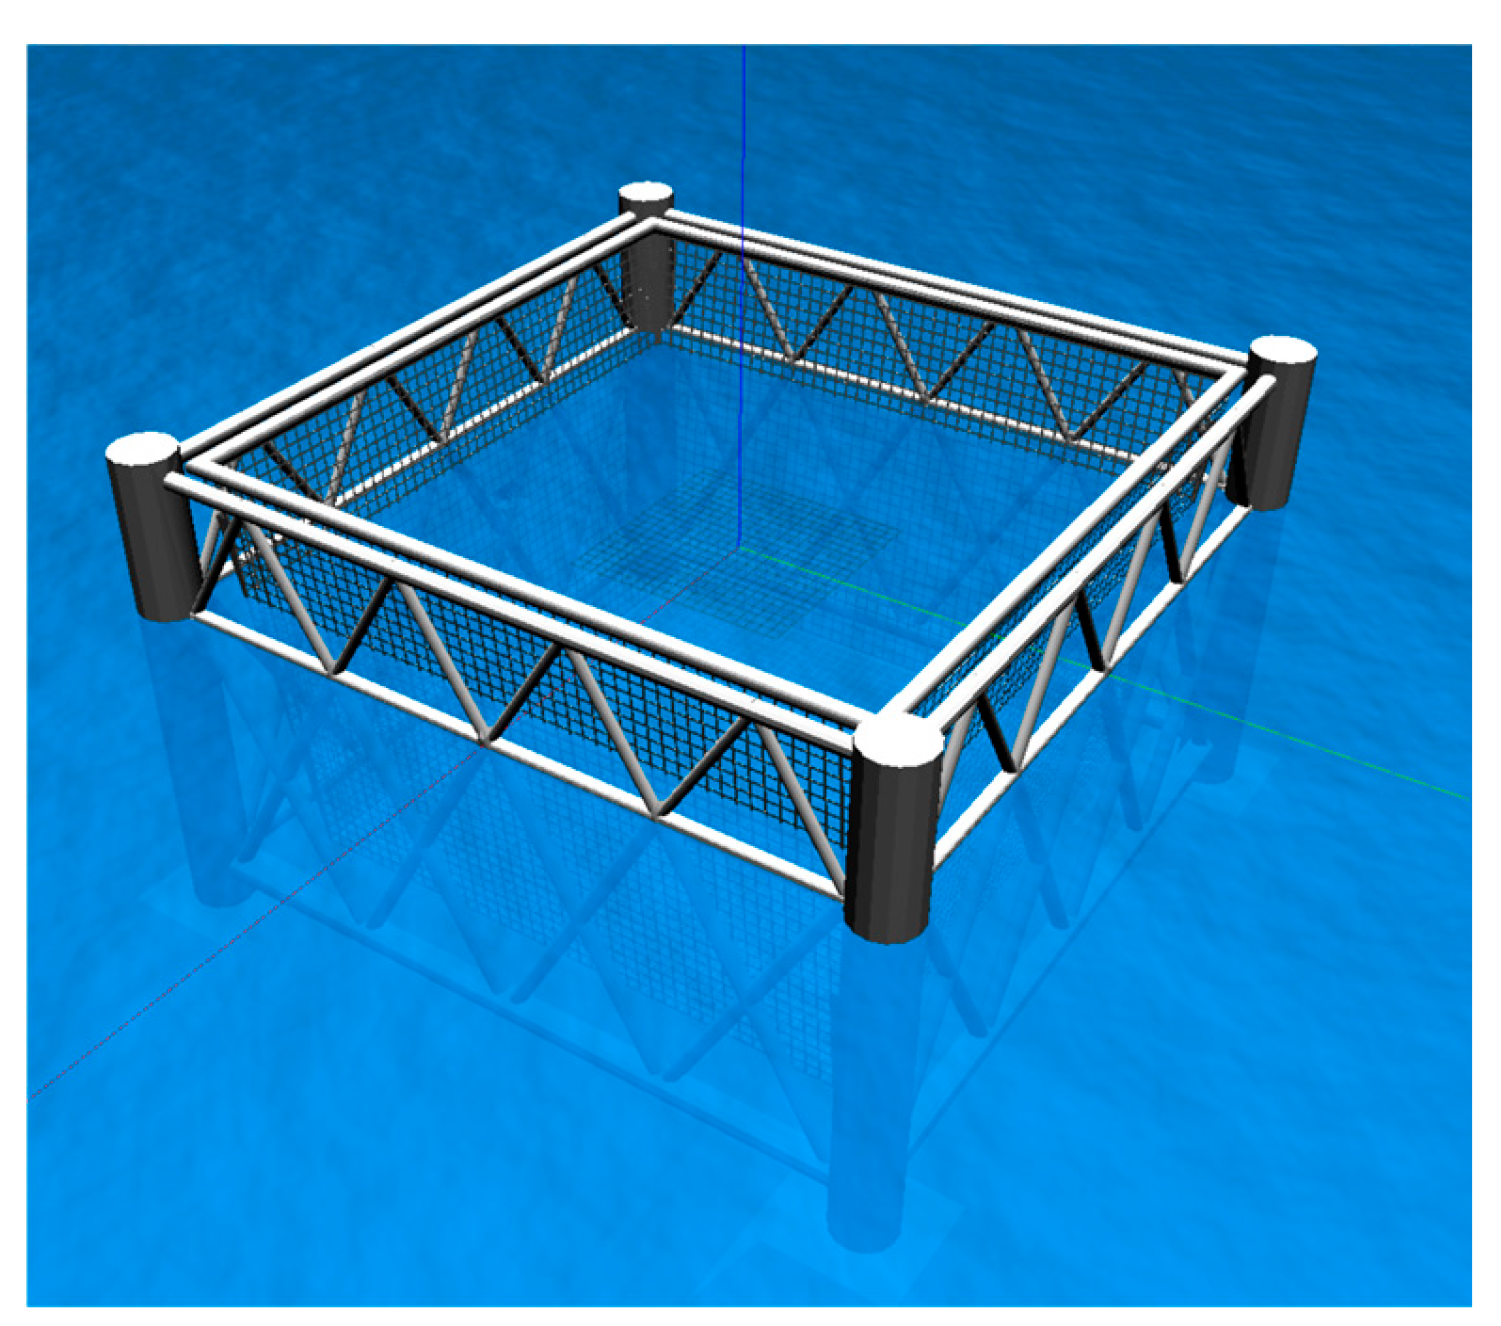
This study employs the AUV_Underwater_World, an underwater environment module integrated within the UUV Simulator, to simulate realistic ocean conditions. The inspection target is a bottom-set net cage, with its 3D model shown in Figure 1. The fish net features a square opening at the top with a side length of 60 m and a square bottom with a side length of 52 m. The fish net extends to a depth of 37.25 m. The simulation environment configured for net cage inspection is further illustrated in Figure 2.

2.2. Underwater Robots

2.2.1. Main Parameters and Sensors

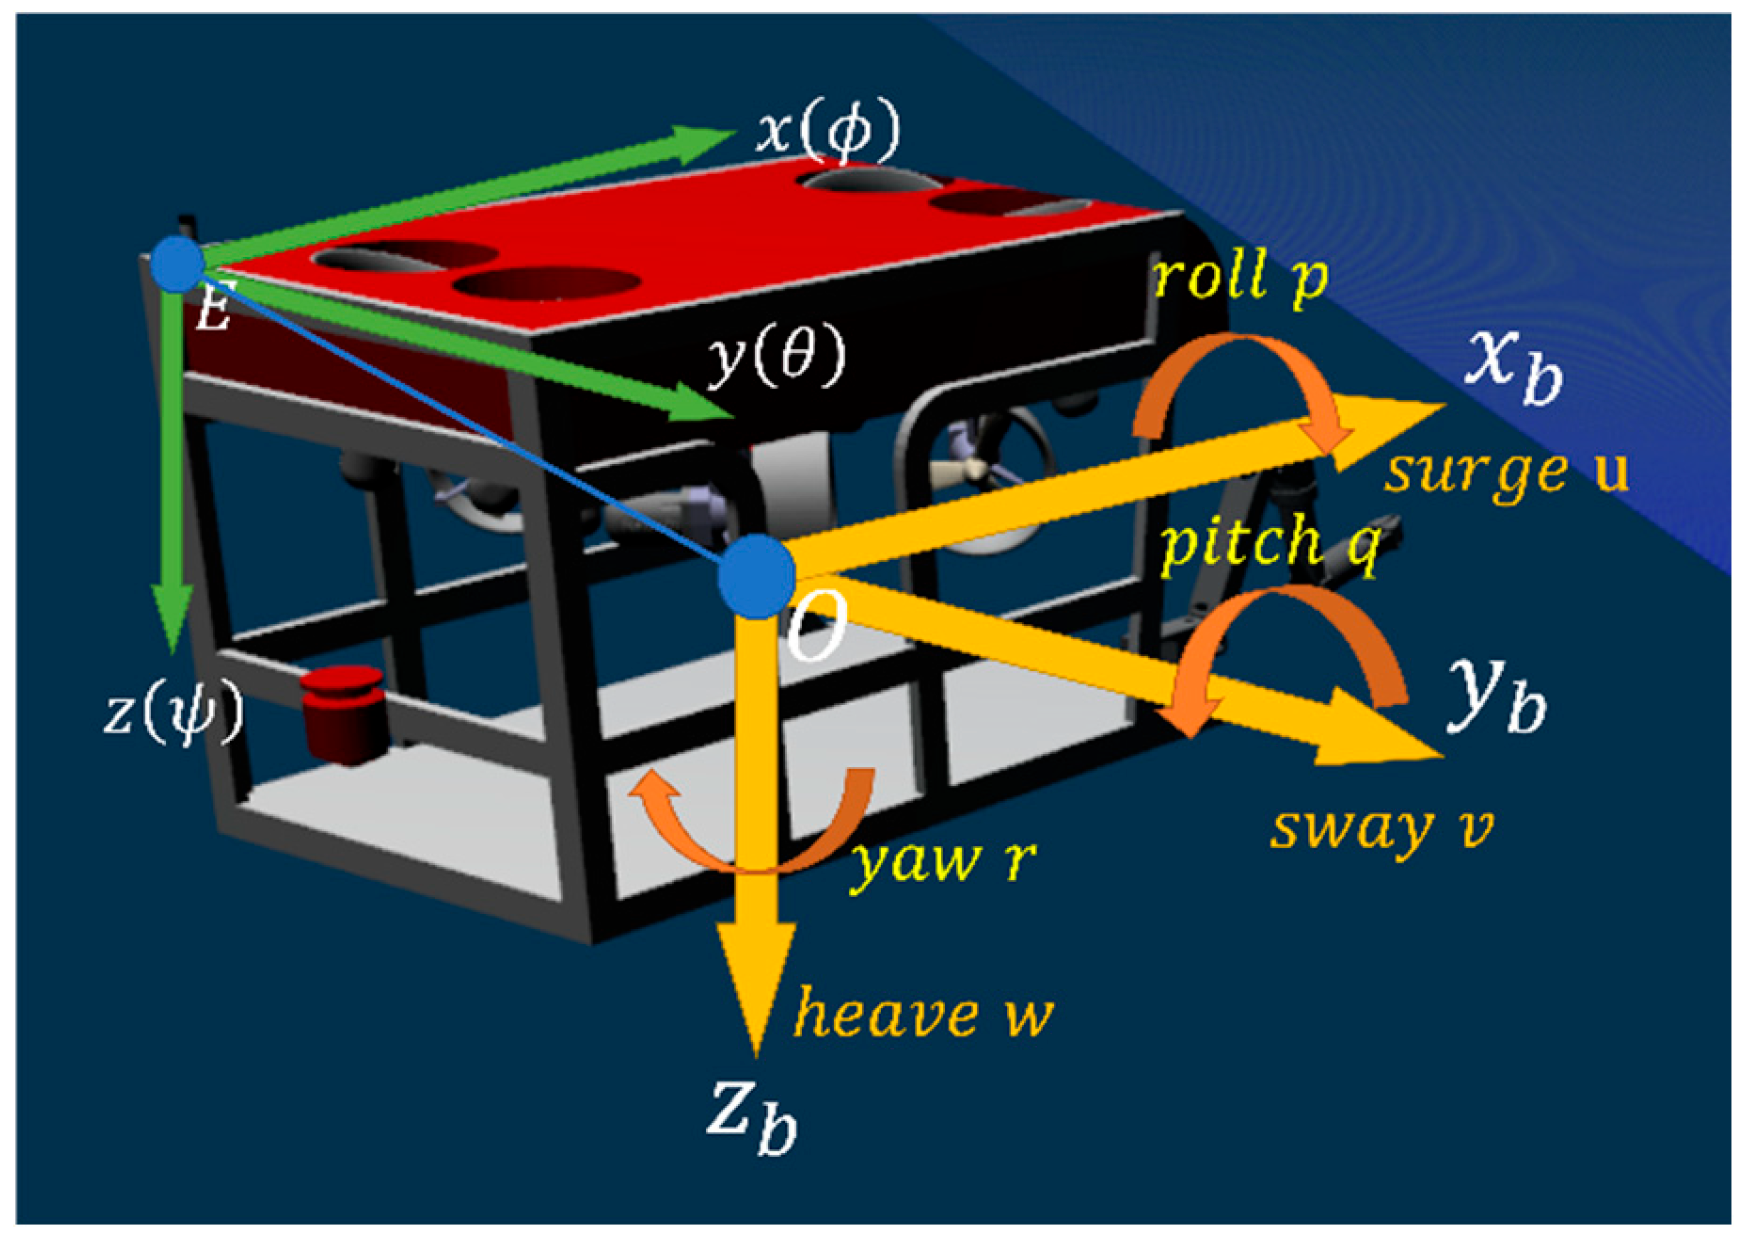
The underwater robot used in this simulation is the RexROV model from the UUV Simulator, which is illustrated in Figure 3. The RexROV has dimensions of 2.6 m in length, 1.5 m in width, and 1.6 m in height. It is equipped with a total of eight thrusters: four aligned along the z-axis and four oriented at a 45° angle relative to both the x- and y-axes During the net inspection process, the underwater robot is fitted with two Kinect depth cameras, mounted on the front and right sides, to capture depth image data. These data are used to calculate the distance and angle between the robot and the fish net, enabling precise constant-distance inspection, attitude control, and corner-turning decisions at net cage intersections. Additionally, the robot is equipped with an inertial measurement unit (IMU) to monitor and record parameters such as the yaw angle. The configuration of the sensors and thrusters is further detailed in the component diagram presented in Figure 4.

2.2.2. Hydrodynamic Load and Motion Equation of the Underwater Robot

This study adopts the hydrodynamic load and motion response model for the RexROV underwater robot. The inertial coordinate system follows the NED (North-East-Down) frame. The definitions of the motion and poses of the ROV during operation are shown in Figure 3.
The numerical model considers forces induced by acceleration F M ν ˙ , forces induced by velocity F D ν r , restoring forces caused by buoyancy-gravity imbalance F R Θ n b , and thruster forces F T h r . The motion control equation is expressed as
F M ν ˙ + F D ν r = F R Θ n b + F T h r
where ν ˙ and ν r represent the RexROV’s acceleration and relative velocity to ocean currents in the body frame, respectively, while Θ n b denotes the Euler angles of the body frame relative to the NED frame. The inertial force term F M ( ν ˙ ) accounts for the structure mass M R B and added the mass M A , and is expressed as
F M ν ˙ = M R B + M A ν ˙ = M ν ˙
The viscous force term F D ν r includes both linear and nonlinear components:
F D ν r = D L + D N L ν r ν r = D ν r
where D L and D N L ν r are the linear and nonlinear damping coefficient matrices.
The restoring force term F R Θ n b is expressed as
F R Θ n b = G B s θ G B c θ s ϕ G B c θ c ϕ y C G G y C B B c θ c ϕ + z C G G z C B B c θ s ϕ z C G G z C B B s θ + x C G G x C B B c θ c ϕ x C G G x C B B c θ s ϕ y C G G y C B B s θ
where G and B represent gravity and buoyancy, respectively. The terms c = c o s and s = s i n . The vectors x C G y C G z C G and x C B y C B z C B   denote the positions of the center of gravity and center of buoyancy in the body frame, respectively.
Detailed parameters such as the structure mass matrix M R B , the added mass matrix M A , and the linear and nonlinear damping coefficient matrices, along with other relevant coefficients, are provided in Appendix A.

3. Autonomous Inspection Strategy

3.1. Simulators for Autonomous Inspection with Underwater Robots

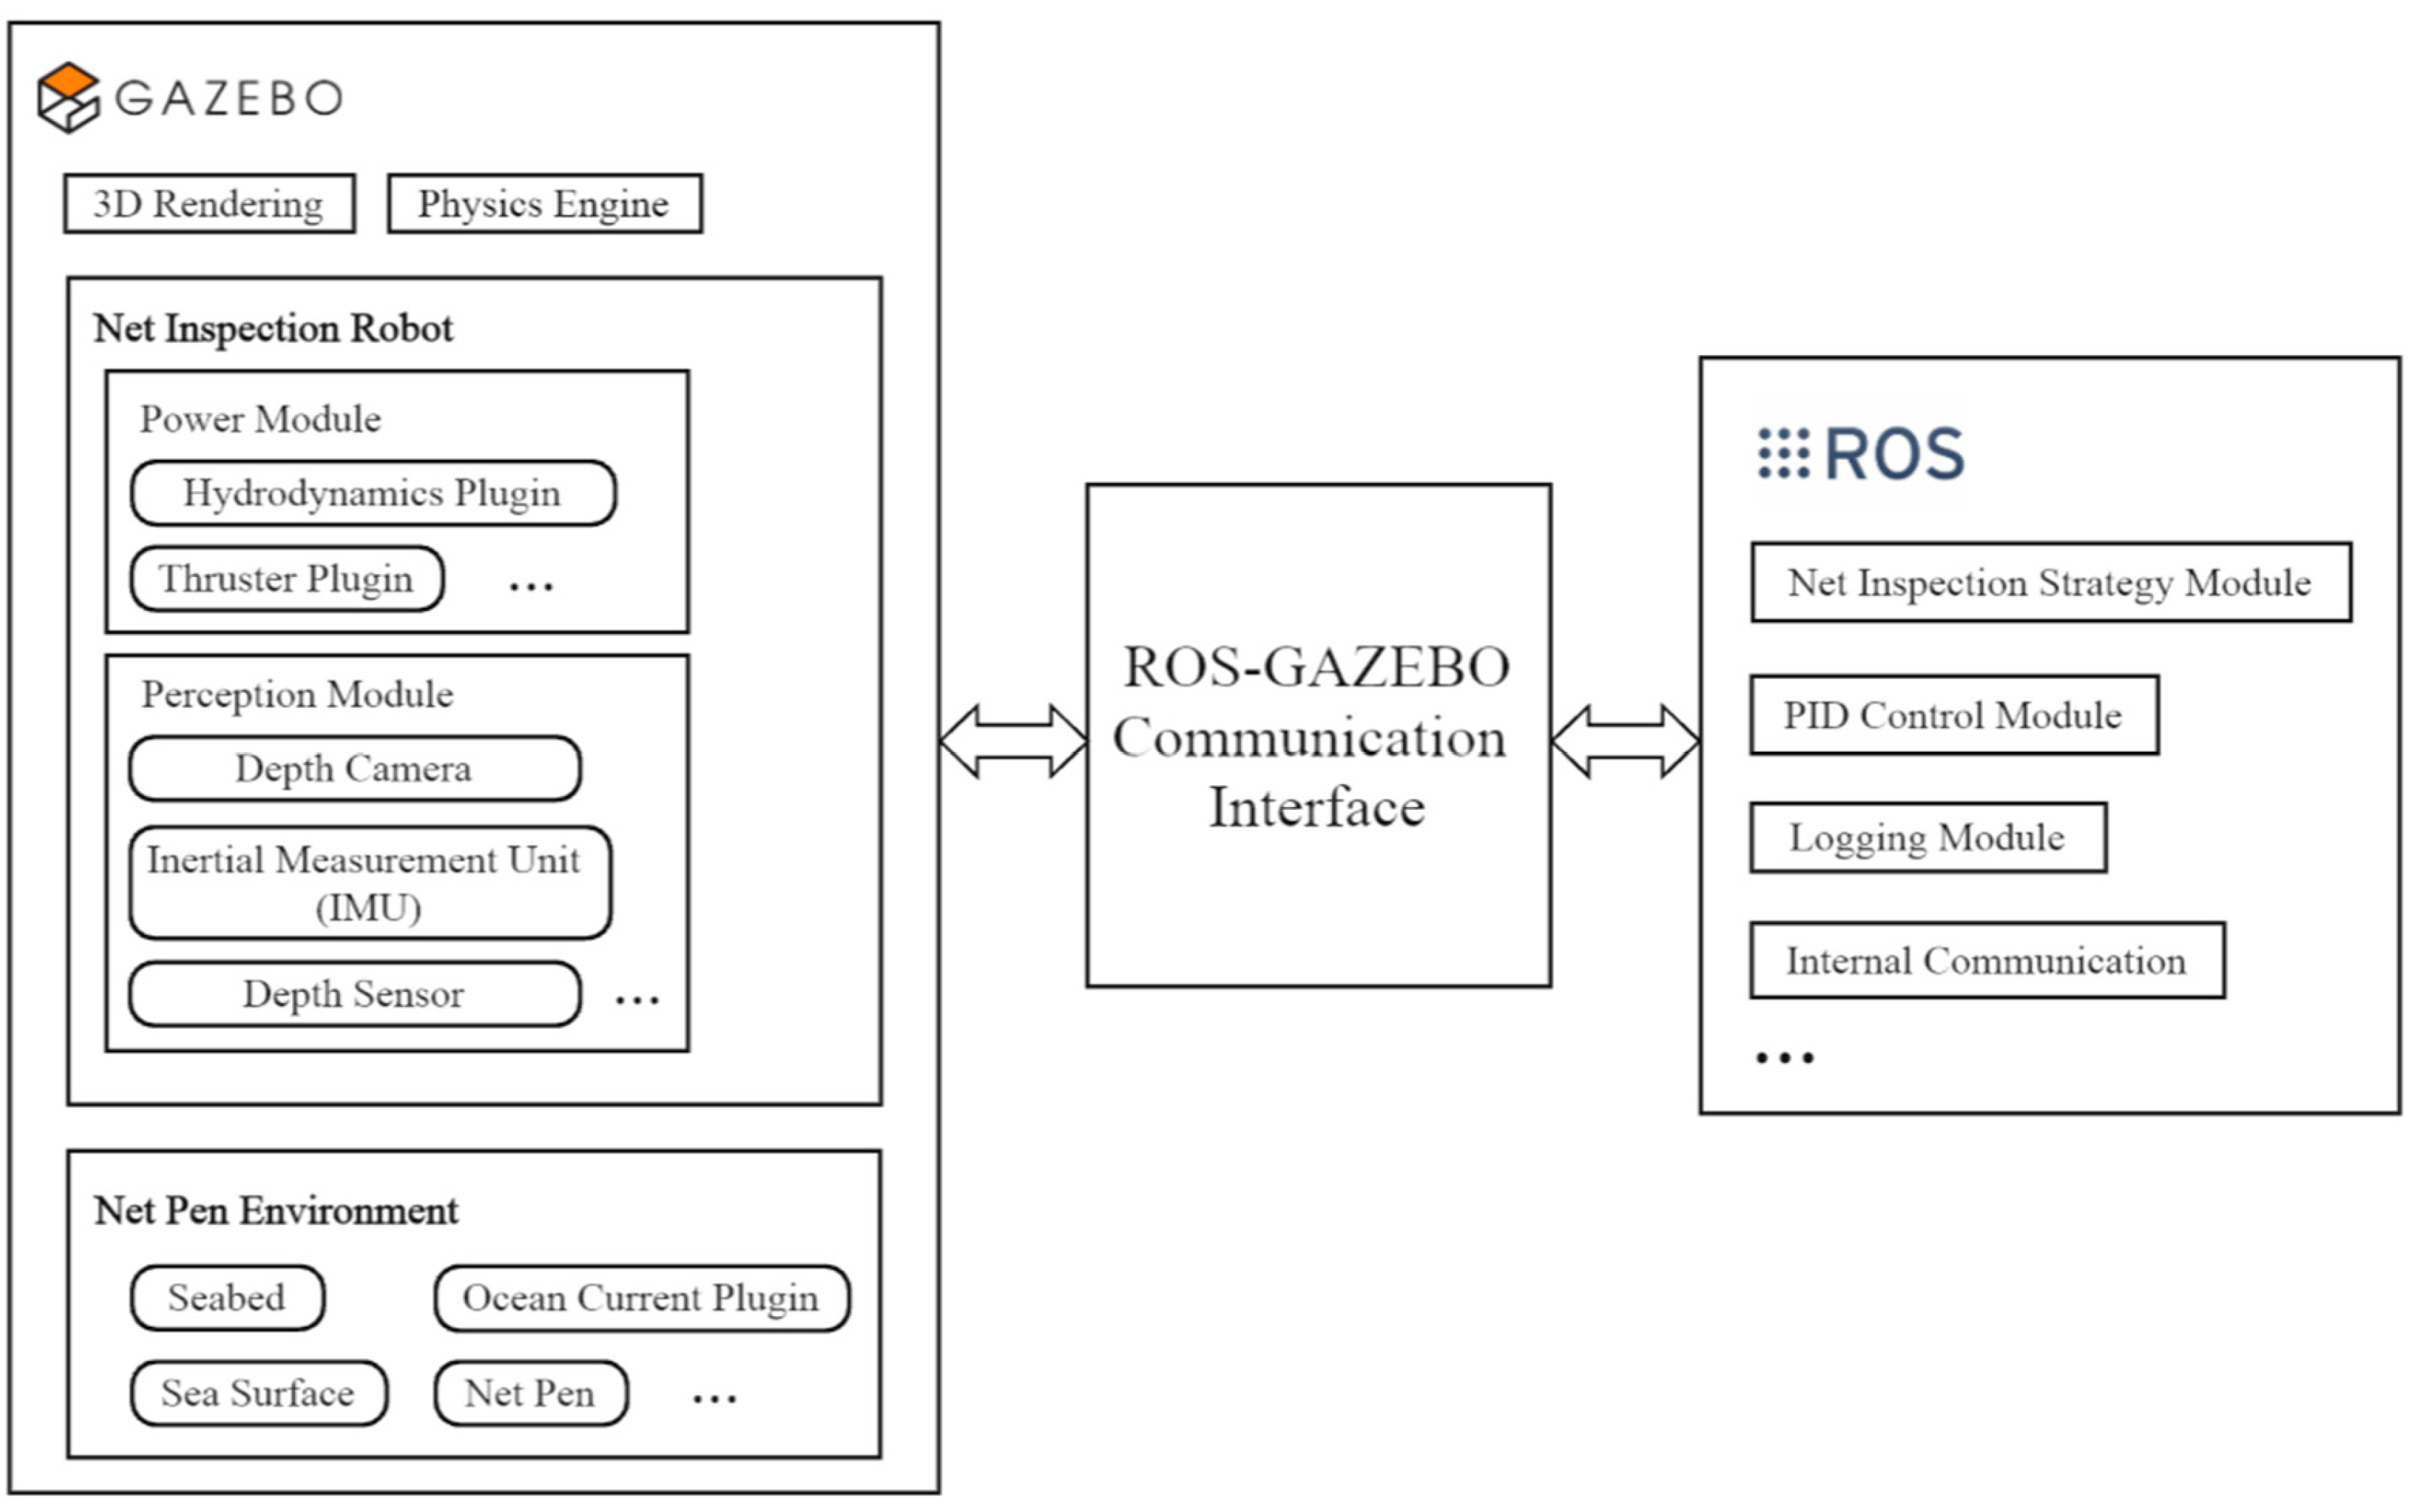
Commonly used 3D physical simulators in the current research include Gazebo, Mujoco, Webots, and CoppeliaSim [19]. Among these, Gazebo is a highly extensible, open-source simulator that supports various physics engines, such as ODE, Bullet, and Dart. It integrates seamlessly with ROS [20] and includes the open-source UUV Simulator, which provides an underwater environment simulation platform suitable for this study [21]. As a result, Gazebo was chosen as the physical simulator to model the deep-sea net-cage environment, the underwater robot, and its required sensors in this study. The inspection strategies and control logic were developed within the ROS framework, with information transmission enabled via the ROS–Gazebo interface. The detailed architecture is shown in Figure 5.

3.2. Autonomous Inspection Strategy for Underwater Robots

This study proposes an autonomous inspection strategy for large aquaculture net cages using an AUV equipped with deep vision capabilities. Specifically, the AUV operates at a designated depth, maintaining a certain distance and angle relative to the fish net, and performs circular inspections around the net. Upon completing one inspection cycle, the AUV descends to the next depth level and begins a new round of inspection, iteratively achieving layer-by-layer coverage of the net. The strategy incorporates anti-interference mechanisms to ensure robustness. If the AUV is significantly displaced by strong currents or loses visual data from its camera, it will automatically locate the net and resume normal inspection operations. To facilitate this layer-by-layer inspection and recovery from significant disturbances, the AUV operates under three predefined modes: Forward State, Turning State, and Reset State. Furthermore, the AUV is equipped with four PID controllers: a Depth Controller, a Net Distance Controller (right side), a Net Angle Controller (right side), and a Yaw Controller. The detailed workflow is illustrated in Figure 6.
(1)
The Forward State is the AUV’s primary inspection mode. In this state, the right-side depth camera collects depth information from the fish net. Using the Net Distance Controller, Net Angle Controller, and Depth Controller, the AUV maintains a constant depth and follows a trajectory parallel to the net, advancing at a fixed speed along a path at a specified distance from the net.
(2)
The Turning State is triggered when the AUV needs to make a large-angle rotation. The Yaw Controller compares the current yaw angle with the desired angle and adjusts the AUV’s orientation accordingly. Once the target angle is reached, the AUV transitions back to the Forward State to continue its inspection.
(3)
The Reset State is the AUV’s automatic net-search mode, activated in the event of strong interference. The Yaw Controller uses data from the IMU to reorient the AUV and return it to the vicinity of the net. Once the AUV determines its coordinates relative to the net, it seamlessly resumes the Forward State.
Figure 6. Finite state machine architecture for autonomous underwater vehicle net-cage inspection system.
Jmse 13 01736 g006

3.3. Distance and Orientation Measurement via Deep Vision

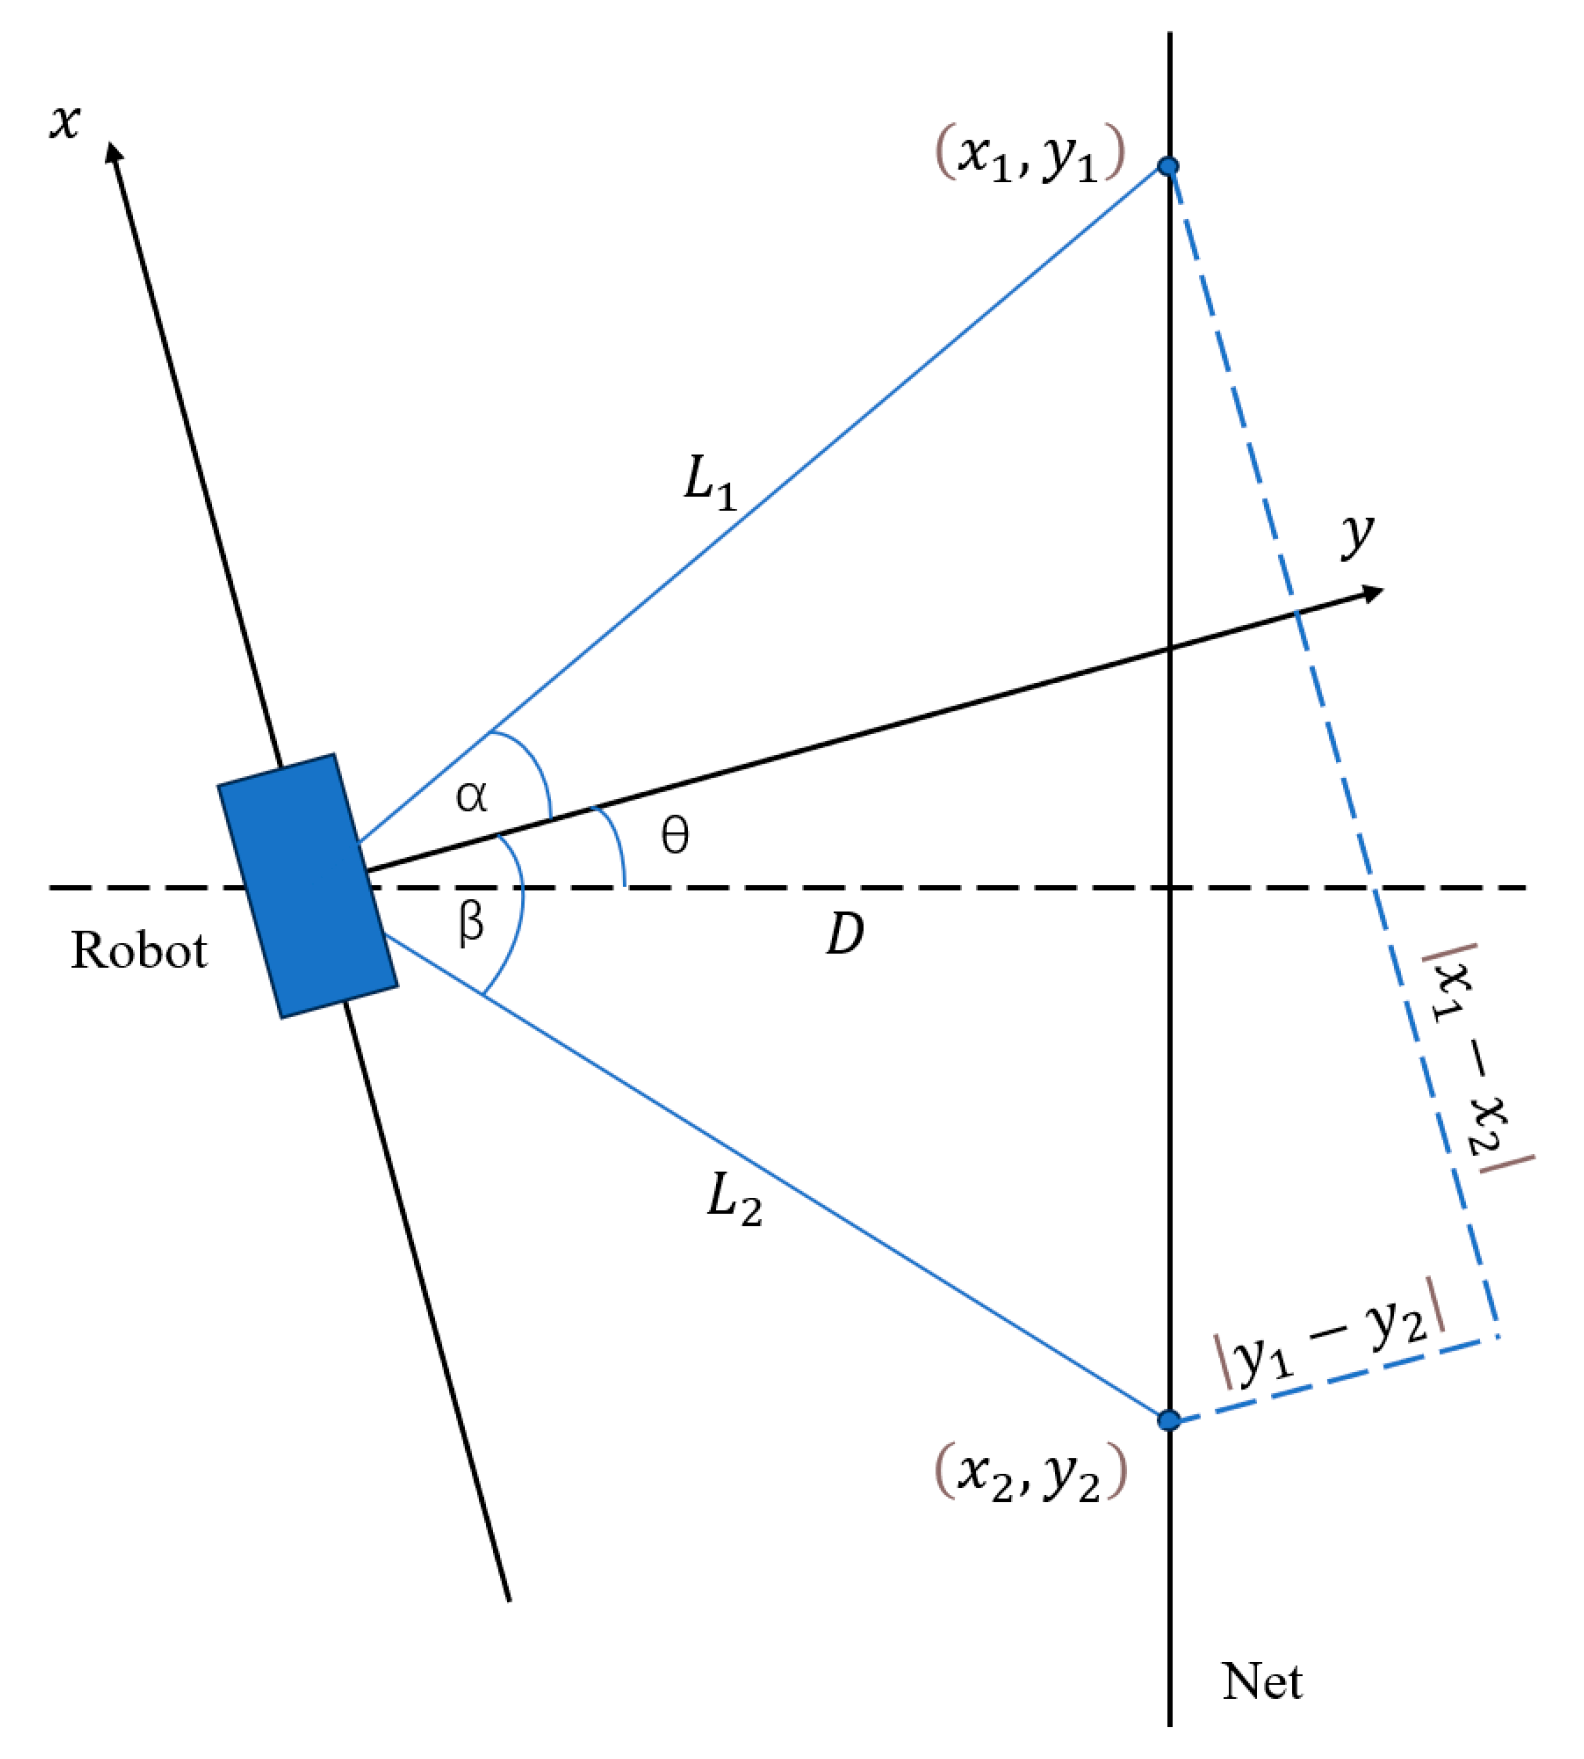
In this study, the AUV employs a depth vision method to determine its distance and orientation relative to the net by leveraging depth data and geometric relationships. In the Gazebo simulation environment, the Kinect camera mounted on the right side of the AUV publishes depth image information, which is then converted into a laser scan data format using the depthimage_to_laserscan package. For the generated scan data, a bidirectional traversal strategy is employed: the data is parsed from both the starting and ending ends of the scan. By skipping invalid and missing values, two valid feature points can ultimately be extracted. Using the right-side depth camera as an example, the calculation of the AUV’s distance and relative orientation angle to the net is described as follows.
As shown in Figure 7, within the AUV’s body coordinate system, assume that two effective depth data points are detected at distances L1 and L2 at angles α and −β relative to the camera. The coordinates of the two effective points, x 1 , y 1 and x 2 , y 2 , can be expressed as
x 1 = L 1 s i n α y 1 = L 1 c o s α x 2 = L 2 sin β y 2 = L 2 c o s ( β )
Using geometric relationships, the distance D and relative orientation angle θ are calculated as
D = x 1 y 2 x 2 y 1 ( y 1 y 2 ) 2 + ( x 1 x 2 ) 2
θ = a r c t a n y 1 y 2 x 1 x 2

3.4. PID-Based Autonomous Inspection Control Method

In this study, PID algorithms are applied in two stages. The first stage involves velocity PID control, where errors between the actual and target positions determine the target velocity in the AUV’s body-fixed coordinate system. The second stage involves thrust PID control, which calculates the six degrees of freedom (DOF) thrust required by the AUV based on the target velocity.

3.4.1. Velocity PID Control

The velocity PID control system includes four controllers: the Depth Controller, the Net Distance Controller, the Net Angle Controller, and the Yaw Controller. Each controller’s output is constrained within predefined upper and lower bounds to ensure stability and prevent excessive speed. The upper bound is set to a value of the same magnitude as the fixed forward speed. If the controller output exceeds this upper bound, it is reset to the maximum limit. This constraint maintains the responsiveness while preventing speeds that exceed the thrust PID’s control capacity. The lower bound is set to a minimal threshold. If the controller output falls below this threshold, it is reset to zero. This design reduces the effects of noise and prevents unnecessary oscillations.
The direct output of each controller at time t, denoted as ν o t , is given by
ν o t = K E t  
where E t represents the error set of the controller at time t, expressed as a row vector consisting of the errors between the observation x t and the target x t * , including the proportional error e p t , the integral error e i t , and the derivative error e d t . K represents the column vector of the PID controller parameters. These two are expressed as follows:
E t = e p t e i t e d t = e p t e i t 1 + e p t e p t e p t 1 Δ t T
K = K p K i K d
Here, Δt is defined as the time interval between two consecutive velocity control actions.
For the direct output v o t of each controller, before it is input into the thrust PID controller, it must be subject to upper and lower bounds, expressed as
ν t =   0 ,   i f   ν o t < min   1 ,   i f   ν o t > max   ν o t ,   i f   m i n ν o t m a x  
In the Forward State, the velocity PID controller outputs a fixed velocity u F O R W A R D in the positive x-axis direction. In the Reset State, it outputs a fixed velocity v R E S E T in the positive y-axis direction. Considering the types of PID controllers used in the three working states, the final output of the velocity PID controller V t can be expressed as
V t = u F O R W A R D v t w t 0 0 q t T ,   i f   s t a t e = F O R W A R D 0 0 0 0 0 q t T ,                 i f   s t a t e = T U R N 0 v R E S E T 0 0 0 q t T ,   i f   s t a t e = R E S E T
The parameter settings for the four velocity PID controllers are detailed in Table A1 of Appendix A.

3.4.2. Thrust PID Control

In this study, the six degrees of freedom (DOF) error acquisition for thrust PID control is divided into two components: position error and attitude error. The attitude error is used to compensate for roll and pitch control. The position error e ν t is calculated based on the input of the velocity PID controller and is expressed as follows:
e ν t = J Θ η V t Δ t = x ν t y ν t z ν t ϕ ν t θ ν t ψ ν t T
where J Θ η is the rotation matrix that transforms coordinates from the ROV body-fixed coordinate system to the world coordinate system, V t is the output of the velocity PID controller at time t, and Δ t is the time interval between two thrust PID control actions. Since the desired values for roll and pitch are always set to zero, the roll and pitch angles ϕ p t and θ p t can be directly treated as error terms. Consequently, the error e t input into the thrust PID controller at time t can be expressed as
e t = x ν t y ν t z ν t ϕ p t θ p t ψ ν t T
Substituting the error e t into the PID controller yields the thrust f t in the world coordinate system. For each degree of freedom, the thrust f t i corresponds to the error E t i of the same degree of freedom. Let K i be the PID controller parameters for the corresponding degree of freedom, and E t i the error set for that degree of freedom. Then,
f t i = K i E t i
where
K i = K p i K i i K d i
E t i = e p t i e i t i e d t i T = e p t i e i t 1 i + e p t i + e p t 1 i 2 e p t i e p t 1 i Δ t T
In calculating the integral term of the error, the increase in the integral term is averaged using the current control error e p t i and the previous control error e p t 1 i to better approximate the actual velocity during the time interval Δt. In practical control, e i 0 i and e p 0 i are initialized to 0. The resulting f t represents the thrust and torque required in the world coordinate system. τ t denotes the thrust and torque in the ROV body-fixed coordinate system. The relationship is as follows:
τ t = J Θ η 1 f t
By incorporating the calculated thrust τ t and the positions of the thrusters, the thrust output can be distributed using the pseudo-inverse matrix method. The specific control parameters for the thrust PID controller are detailed in Table A2 of Appendix A.

4. Results and Discussion

This chapter presents simulation experiments conducted in the Gazebo environment to evaluate the performance of the proposed AUV inspection strategy. The simulations examine various scenarios, including static water conditions, ocean currents, different cruising speeds, and sudden external force disturbances. The actual and desired paths are compared, and key parameters during the Forward State, such as the AUV’s distance from the net, relative angle of attack, operating depth throughout the mission, and yaw angle variations, are observed and recorded.

4.1. AUV Inspection Simulation Results in Static Water

4.1.1. AUV Inspection Path

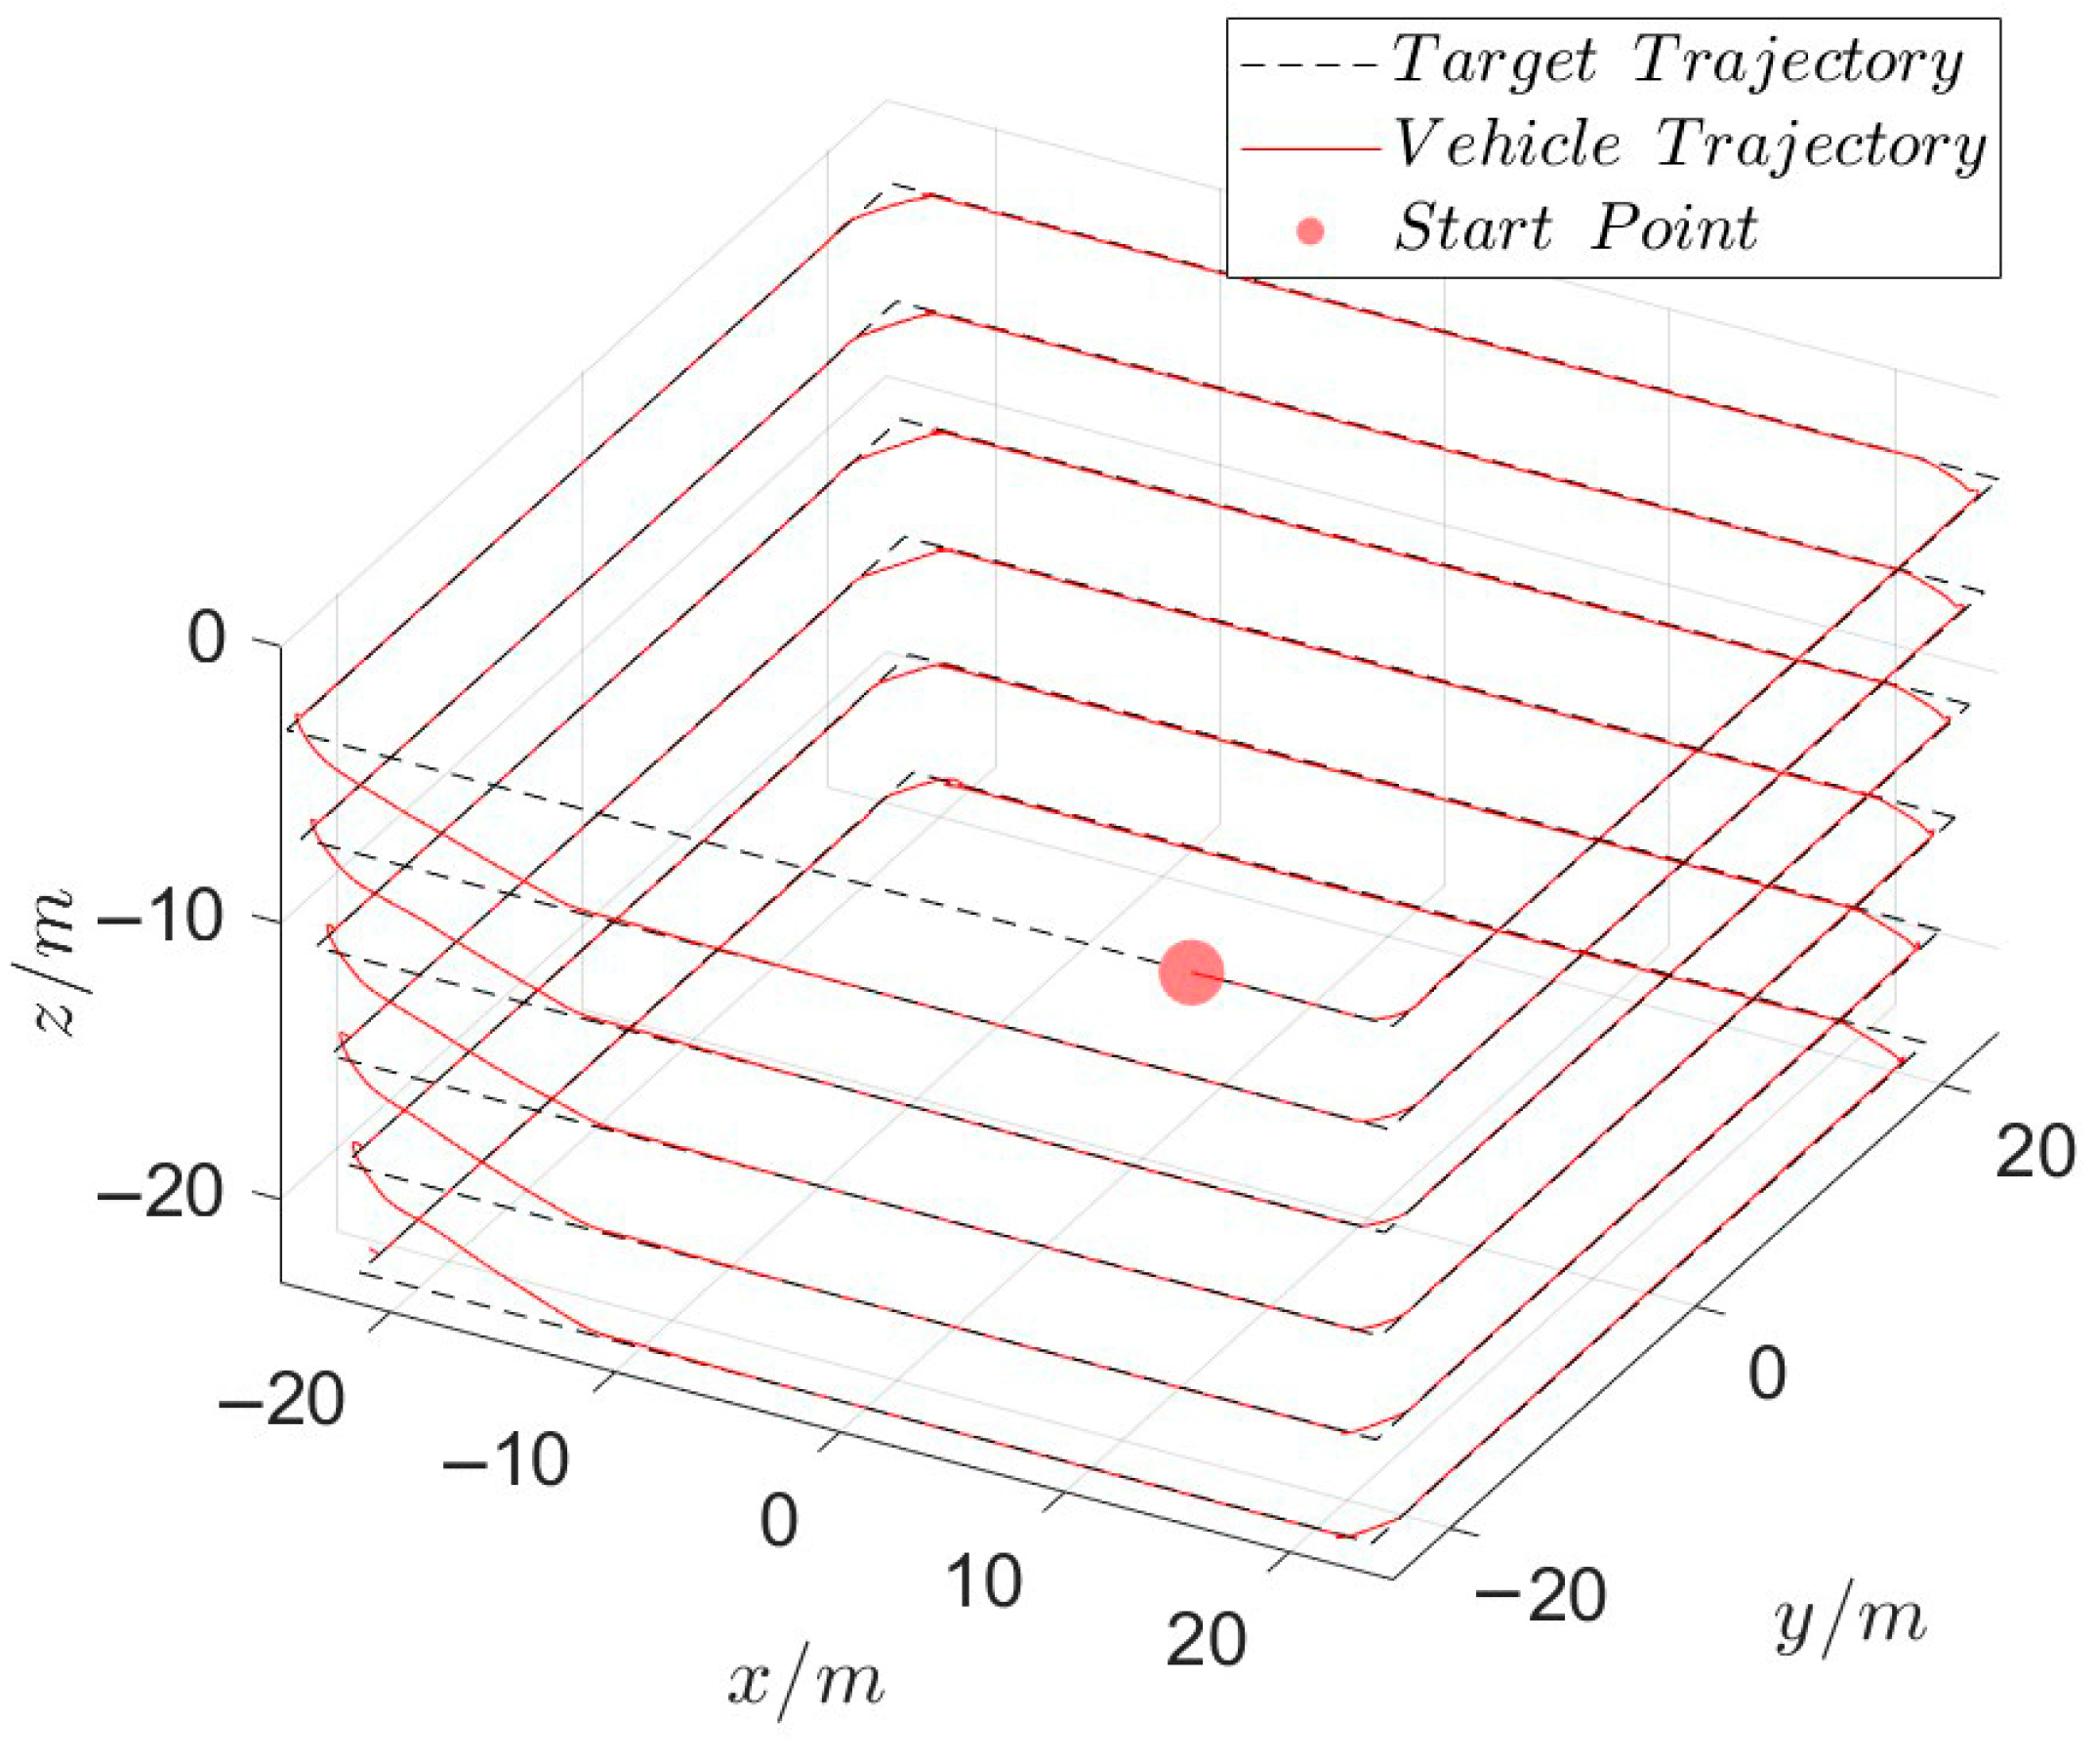
The desired inspection path for the AUV follows a square-shaped spiral descent, maintaining a specified angle and distance from the net throughout the process. In the simulation, the AUV is set to cruise at a speed of 1.0 m/s in static water. The comparison between the actual path and desired path is presented in Figure 8. As shown, the actual inspection path of the AUV aligns almost perfectly with the desired path.

4.1.2. Yaw Angle, Depth, Net Distance, and Relative Angle of Attack

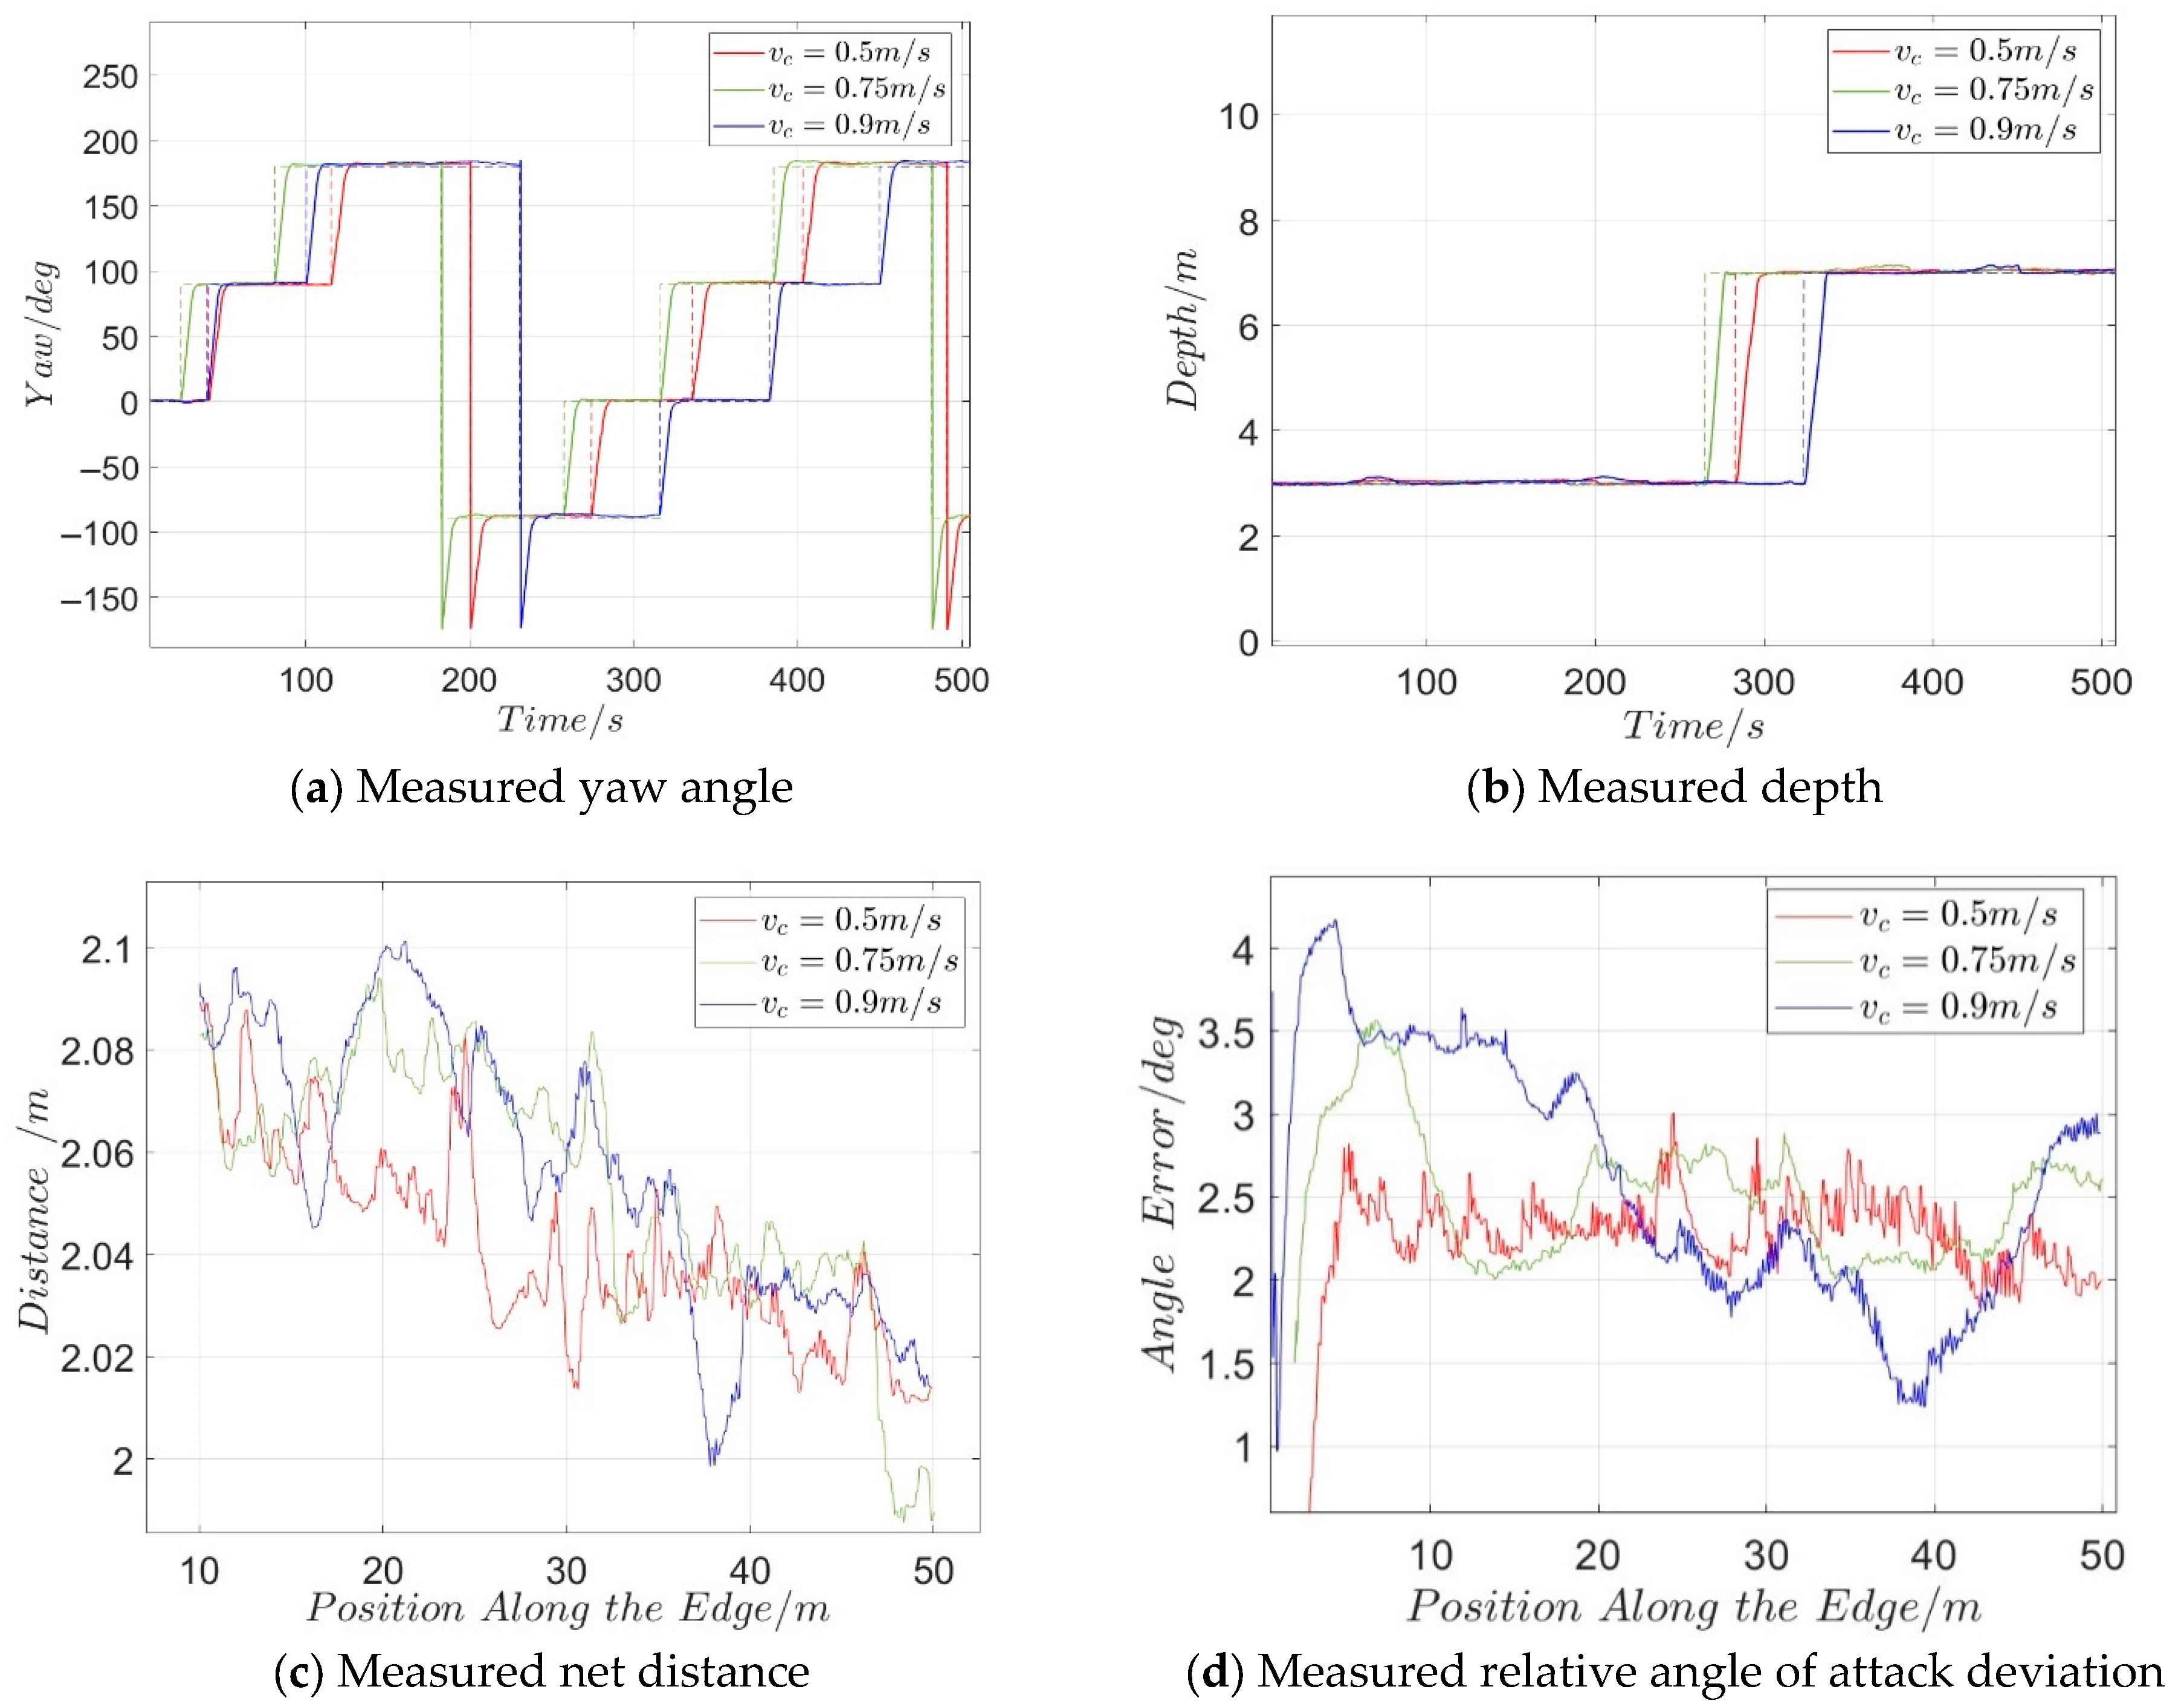
The experimental results demonstrate effective control of the AUV’s yaw angle and depth during inspection operations (Figure 9a,b). The right-side depth camera measurements show the net distance deviation remains within 0.15 m of the target value, with the relative angle of attack deviation constrained to within 5.1° during normal Forward State operation (Figure 9c,d), indicating satisfactory control performance. Compared with the 0.06 m prediction accuracy achieved at 0.2 m/s navigation speed in a prior DVL-based study by Amundsen [13], our implementation maintains a 0.15 m total control error at 1.0 m/s operational speed, which remains reasonable, given the different operating conditions and sensor configurations.

4.2. AUV Inspection Simulation Results Under Different Ocean Currents

To investigate the impact of varying ocean current speeds on the AUV’s inspection performance, simulations were conducted in the Gazebo environment with modeled ocean current conditions. In these simulations, the AUV’s desired cruising speed was set to 1.0 m/s, and ocean currents were applied in the horizontal direction or at a 45° angle to the x-axis, with speeds of 0.5 m/s, 0.75 m/s, and 0.9 m/s. The AUV’s trajectory within the net cage and the corresponding control parameter errors are shown in Table 1 and Figure 10 and Figure 11. The results demonstrate that as the ocean current speed increases, the net distance error remains relatively stable. However, the relative angle of attack deviation and its fluctuation amplitude increase. Notably, when the current speed reaches 0.9 m/s, the AUV’s trajectory at the corners of the net cage is significantly affected by the current.

4.3. AUV Inspection Simulation Results at Different Speeds

To evaluate the impact of different speeds on the AUV’s inspection performance, simulations were conducted under an ocean current speed of 0.5 m/s. The AUV was assigned desired speeds of 0.75 m/s, 1.0 m/s, and 1.25 m/s, and its inspection trajectory and relevant control parameters were recorded. The results are illustrated in Table 2 and Figure 12 and Figure 13. The findings show that as the speed increases, the amplitude and MSE of fluctuations in the relative angle of attack deviation become more pronounced. Furthermore, due to the constraints imposed by control frequency and communication delays, higher cruising speeds significantly increase the difficulty in maintaining effective control.

4.4. AUV Inspection Simulation Results Under Sudden External Forces

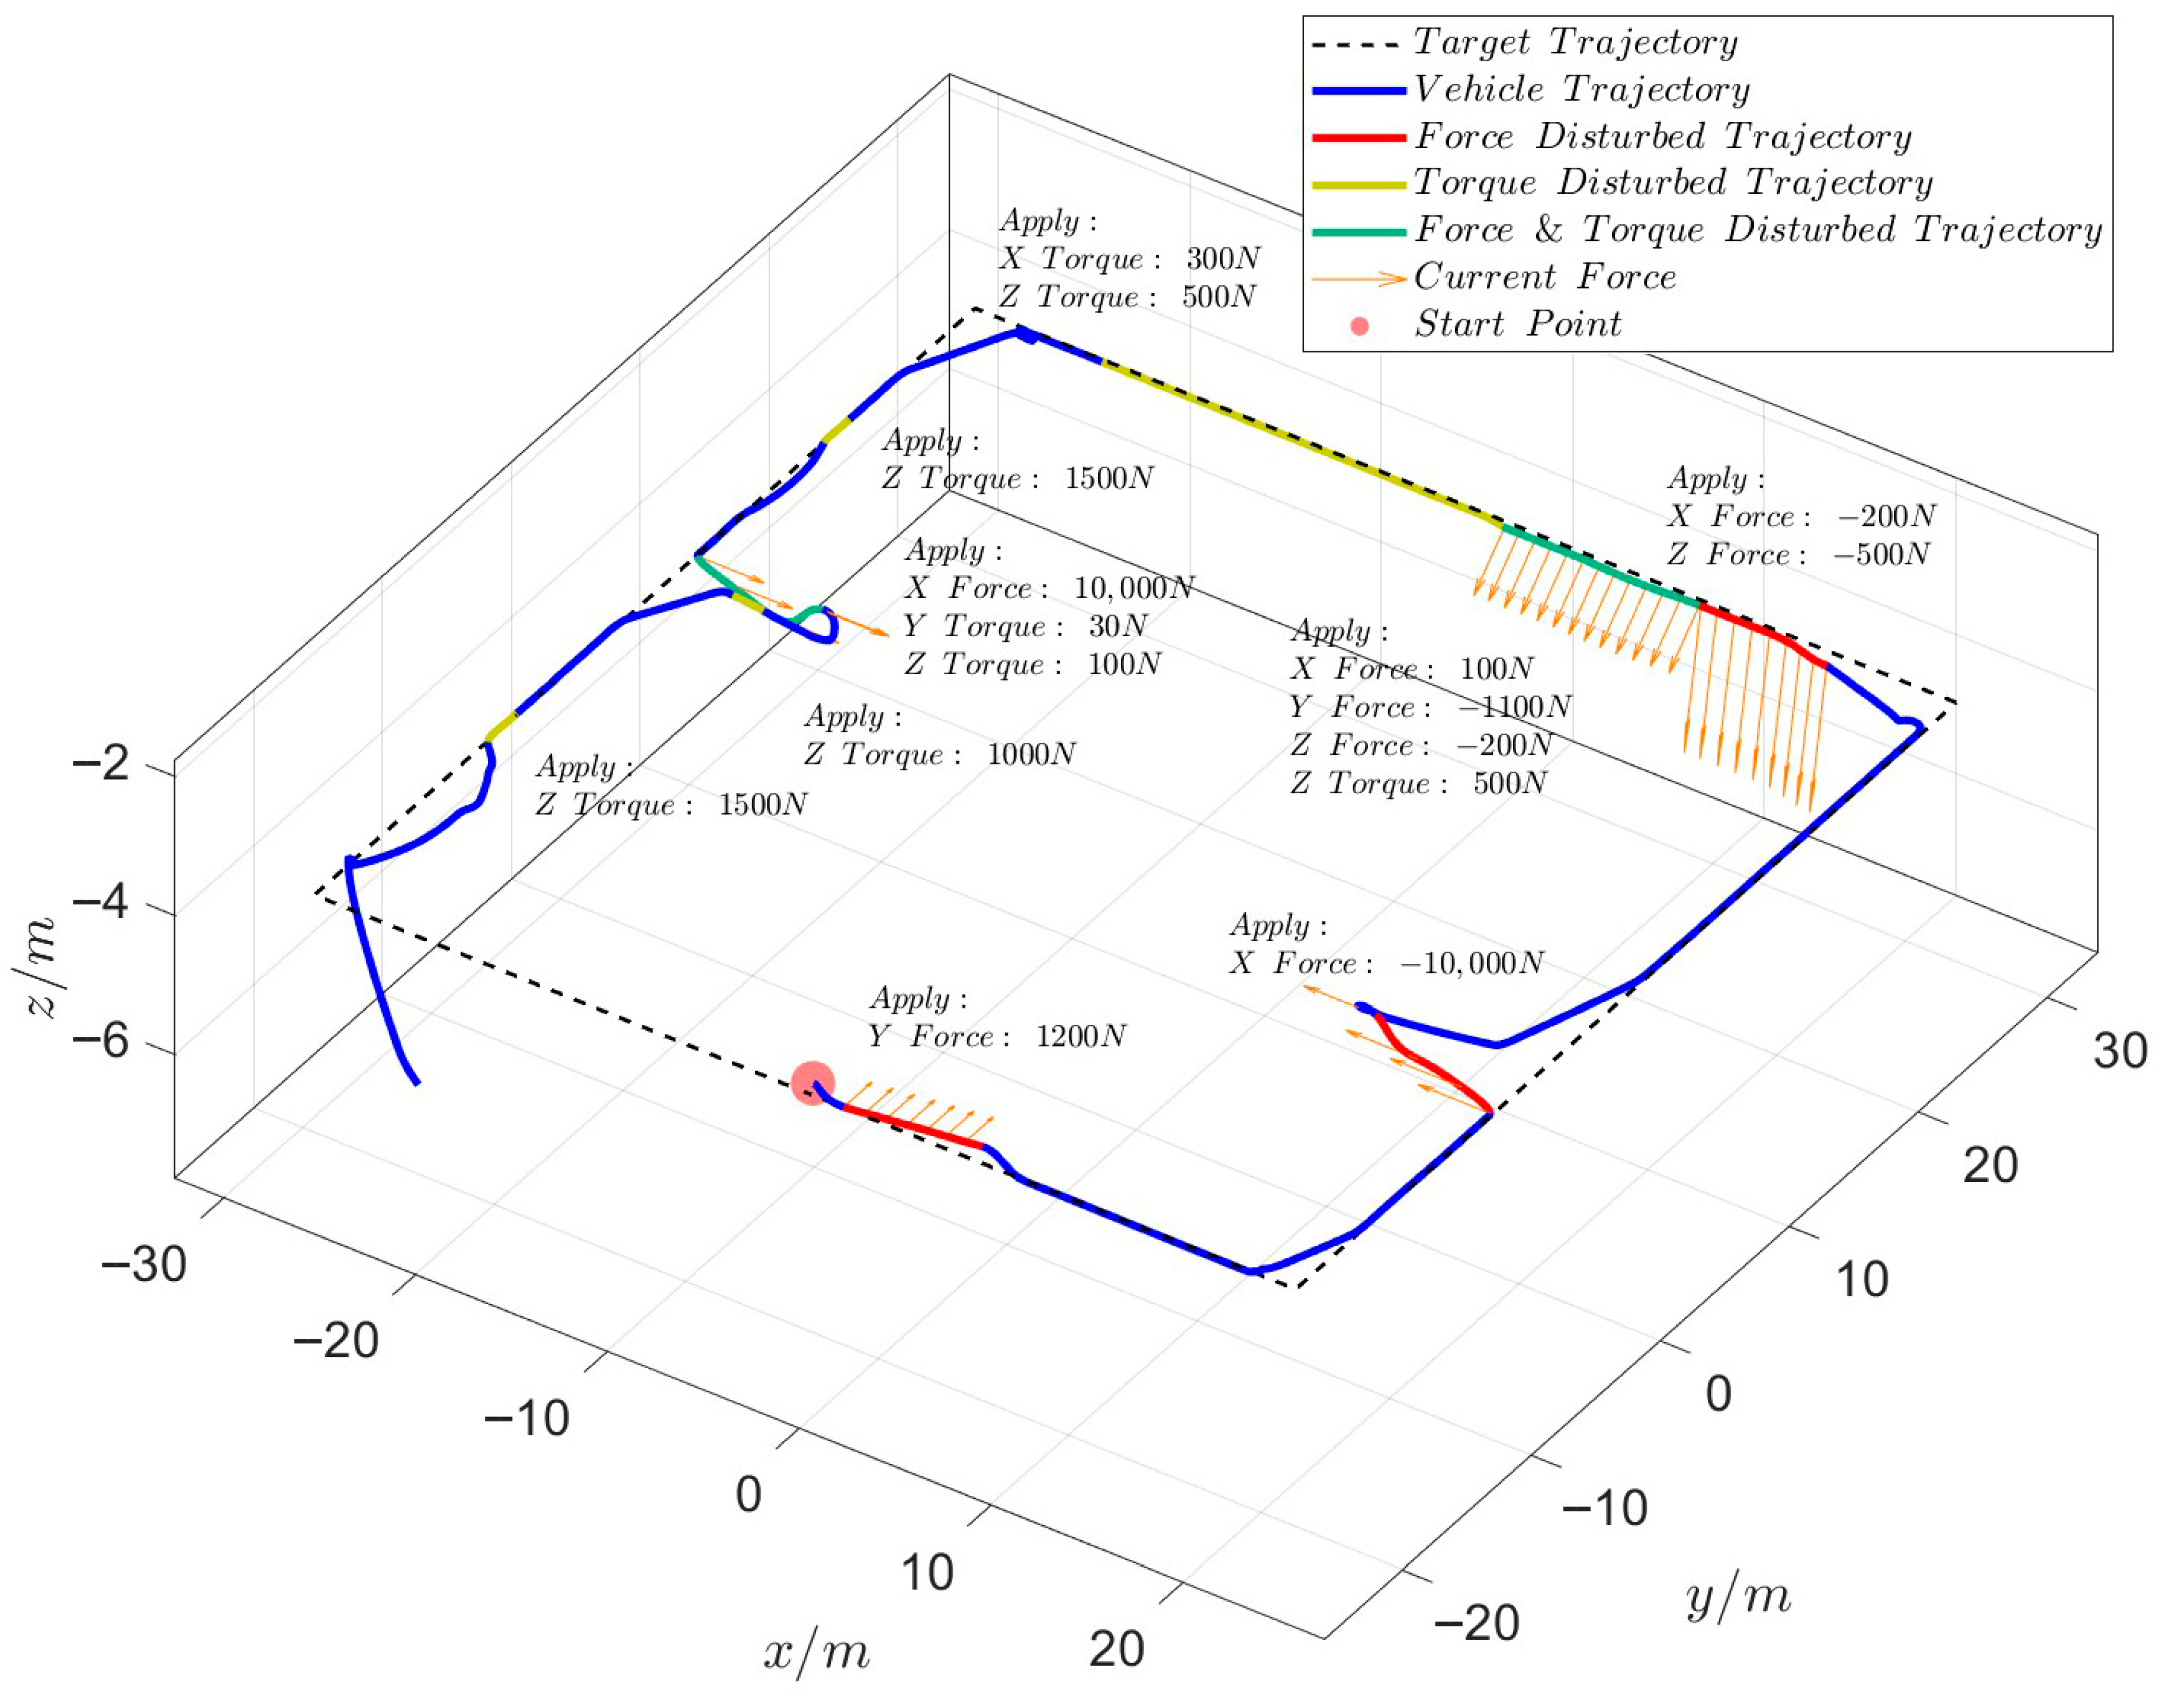
To verify the stability of the proposed AUV inspection strategy under sudden external force disturbances, simulations were conducted in the Gazebo environment, where intermittent forces and torques were applied to the AUV. The resulting AUV inspection paths are shown in Figure 14. In this figure, the magnitudes and directions of the external forces and torques are annotated alongside the corresponding trajectories, with the forces represented by 3D arrows. The results demonstrate that the AUV can autonomously return to the net edge and resume normal inspection despite external disturbances within a certain range, exhibiting a degree of resilience to external forces.

5. Conclusions

This paper represents an AUV inspection strategy for large-scale deep-sea net cages based on deep visual perception. By utilizing sensors such as depth cameras and IMUs to capture the relative pose information of the AUV, the strategy employs a PID algorithm to maintain constant depth and distance during the inspection relative to the net cage. The simulation experiments conducted in the Gazebo environment demonstrate the effectiveness and robustness of the proposed AUV inspection strategy under various conditions. In static water, the AUV maintained a net distance deviation within 0.15 m and a relative angle of attack deviation below 5.1° at a cruising speed of 1.0 m/s. Under ocean currents of 0.5 m/s, the distance error remained stable, while the angle deviation fluctuated within 5°; however, at higher currents (0.9 m/s), trajectory disturbances became notable, especially at net cage corners. During speed tests, the strategy achieved stable control at 0.75 m/s, but the MSE of angle deviation grew twofold when speed reached 1.25 m/s. While higher ocean currents and cruising speeds increase control challenges, the AUV exhibits resilience to external disturbances, autonomously recovering and resuming inspection tasks. These results validate the strategy’s potential for reliable underwater net inspection in dynamic environments.
While the simulation results support the feasibility and robustness of the proposed strategy, potential future work directions include physical implementation and testing. Key areas could encompass (1) controlled tank experiments with net panel mock-ups to validate camera depth and IMU performance, along with distance/angle measurement and PID-based control, under realistic hydrodynamic conditions; (2) field trials at operational aquaculture sites to assess system robustness against real-world challenges, including dynamic currents, biofouling, and turbidity variations; (3) real-world scenario testing to evaluate vision-based perception and state machine logic against net deformations, occlusions, and other unanticipated disturbances.

Supplementary Materials

The code developed for this study is available in a public repository at: https://github.com/Y-EM232/NetCageInspection (accessed on 1 September 2025).

Author Contributions

Conceptualization, Y.X.; Methodology, Y.X.; Investigation, K.C., C.L., Q.S., Y.L. and H.Y.; Writing—original draft, K.C., C.L., Q.S., Y.L. and H.Y. All authors have read and agreed to the published version of the manuscript.

Funding

The authors gratefully acknowledge the National Natural Science Foundation of China (Grant No. 52271283).

Institutional Review Board Statement

Not applicable.

Informed Consent Statement

Not applicable.

Data Availability Statement

The original contributions presented in this study are included in the article/Supplementary Materials. Further inquiries can be directed to the corresponding author.

Conflicts of Interest

The authors declare no conflict of interest.

Appendix A

Appendix A.1. Hydrodynamic Parameters of RexROV [22]

(1) Mass matrix M R B and added mass matrix M A
M R B = 1862.87 0 0 0 0 0 0 1862.87 0 0 0 0 0 0 1862.87 0 0 0 0 0 0 525.39 1.44 33.41 0 0 0 1.44 794.20 2.60 0 0 0 33.41 2.60 691.23
M A = 779.79 1.3053 94.244 14.652 165.06 6.7288 12.449 1222 124.5 436.34 20.566 59.971 112.4 21.919 3659.9 33.129 382.17 12.571 2.433 382.55 45.351 534.9 13.53 7.9038 166.02 8.868 190.67 6.5248 842.69 0.16383 8.8778 65.481 34.121 34.133 2.4007 224.32
(2) Linear viscous hydrodynamic matrix D L and nonlinear viscous hydrodynamic matrix D N L ν r
D L = 74.82 0 0 0 0 0 0 69.48 0 0 0 0 0 0 728.40 0 0 0 0 0 0 268.80 0 0 0 0 0 0 309.77 0 0 0 0 0 0 105.00
D N L ν r = 748.22 u r 0 0 0 0 0 0 992.53 v r 0 0 0 0 0 0 1821.01 w r 0 0 0 0 0 0 672 p 0 0 0 0 0 0 774.44 q 0 0 0 0 0 0 532.27 r
(3) Rotation matrix from body-fixed coordinate system to inertial (world) coordinate system J Θ η
J Θ η = R b n Θ n b 0 3 × 3 0 3 × 3 T b n Θ n b
where
R b n Θ n b = c ψ c θ s ψ c ϕ + c ψ s θ s ϕ s ψ s ϕ + c ψ c ϕ s θ s ψ c θ c ψ c ϕ + s ϕ s θ s ψ c ψ s ϕ + s θ s ψ c ϕ s θ c θ s ϕ c θ c ϕ
T b n Θ n b = 1 s ϕ t θ c ϕ t θ 0 c ϕ s ϕ 0 s ϕ c θ c ϕ c θ ,   θ 2 k + 1 π 2 k Z

Appendix A.2. Pid Controller Parameter

Table A1. Control parameters of the velocity PID controller.
Controller Names K p K i K d Lower LimitUpper Limit
Depth controller 1 0.001 0.005 0.01 0.5
Right net panel controller 1 0.001 0.005 0.01 0.5
Net panel angle controller 0.01 0.00001 0.00005 0.01 0.1
Yaw angle controller 0.01 0.00001 0.00005 0.01 0.2
Table A2. Control parameters of the thrust PID controller.
DOFxyzϕθψ
K p 11,993.888 11,993.888 11,993.888 19,460.069 19,460.069 19,460.069
K i 9077.459 9077.459 9077.459 1088.925 1088.925 1088.925
K d 321.417 321.417 321.417 2096.951 2096.951 2096.951

References

  1. Yu, J.; Wang, Y. Evolution of Deep-Sea Fisheries Policies in China: Review, Performance and Prospects. Fish. Manag. Ecol. 2023, 30, 109–120. [Google Scholar] [CrossRef]
  2. Yu, J.; Yan, T. Analyzing Industrialization of Deep-Sea Cage Mariculture in China: Review and Performance. Rev. Fish. Sci. Aquac. 2023, 31, 483–496. [Google Scholar] [CrossRef]
  3. Dong, S.-L.; Dong, Y.W.; Huang, L.-Y.; Zhou, Y.-G.; Cao, L.; Tian, X.-L.; Han, L.-M.; Li, D.-H. Advancements and Hurdles of Deeper-Offshore Aquaculture in China. Rev. Aquac. 2024, 16, 644–655. [Google Scholar] [CrossRef]
  4. Atalah, J.; Sanchez-Jerez, P. Global Assessment of Ecological Risks Associated with Farmed Fish Escapes. Glob. Ecol. Conserv. 2020, 21, e00842. [Google Scholar] [CrossRef]
  5. Gao, Q.F.; Dong, S.L. Cage Farming of Fish in Open Waters. In Aquaculture Ecology; Dong, S.L., Tian, X.L., Gao, Q.F., Dong, Y.W., Eds.; Springer: Singapore, 2023. [Google Scholar]
  6. Akram, W.; Casavola, A.; Kapetanović, N.; Miškovic, N. A Visual Servoing Scheme for Autonomous Aquaculture Net Pens Inspection Using ROV. Sensors 2022, 22, 3525. [Google Scholar] [CrossRef] [PubMed]
  7. Cho, Y.; Kim, A. Visibility Enhancement for Underwater Visual SLAM Based on Underwater Light Scattering Model. In Proceedings of the 2017 IEEE International Conference on Robotics and Automation (ICRA), Singapore, 29 May–3 June 2017; pp. 710–717. [Google Scholar] [CrossRef]
  8. Nauert, F.; Kampmann, P. Inspection and Maintenance of Industrial Infrastructure with Autonomous Underwater Robots. Front. Robot. AI 2023, 10, 1240276. [Google Scholar] [CrossRef] [PubMed]
  9. Ioannou, G.; Forti, N.; Millefiori, L.M.; Carniel, S.; Renga, A.; Tomasicchio, G.; Binda, S.; Braca, P. Underwater Inspection and Monitoring: Technologies for Autonomous Operations. IEEE Aerosp. Electron. Syst. Mag. 2024, 39, 4–16. [Google Scholar] [CrossRef]
  10. Yang, J.; Ni, J.; Xi, M.; Wen, J.; Li, Y. Intelligent Path Planning of Underwater Robot Based on Reinforcement Learning. IEEE Trans. Autom. Sci. Eng. 2023, 20, 1983–1996. [Google Scholar] [CrossRef]
  11. Cepeda, M.F.S.; Machado, M.d.S.F.; Barbosa, F.H.S.; Moreira, D.S.S.; Almansa, M.J.L.; de Souza, M.I.L.; Caprace, J.-D. Exploring Autonomous and Remotely Operated Vehicles in Offshore Structure Inspections. J. Mar. Sci. Eng. 2023, 11, 2172. [Google Scholar] [CrossRef]
  12. Sandoy, S.S.; Schjolberg, I. Experimental Verification of Underwater Positioning System in Aquaculture. In Proceedings of the OCEANS 2017-Aberdeen, Aberdeen, UK, 19–22 June 2017; pp. 1–7. [Google Scholar] [CrossRef]
  13. Amundsen, H.B.; Caharija, W.; Pettersen, K.Y. Autonomous ROV Inspections of Aquaculture Net Pens Using DVL. IEEE J. Ocean. Eng. 2022, 47, 1–19. [Google Scholar] [CrossRef]
  14. Stenså, O.A. Choice and Design of 6 Degree-of-Freedom Observer for ROVs Operating in Fish Farms in the Presence of Time-Varying Environmental Disturbances; Norwegian University of Science and Technology: Trondheim, Noorwegen, 2023. [Google Scholar]
  15. Bjerkeng, M.; Kirkhus, T.; Caharija, W.; Thielemann, J.T.; Amundsen, H.B.; Ohrem, S.J.; Grøtli, E.I. ROV Navigation in a Fish Cage with Laser-Camera Triangulation. J. Mar. Sci. Eng. 2021, 9, 79. [Google Scholar] [CrossRef]
  16. López-Barajas, S.; Sanz, P.J.; Marín-Prades, R.; Gómez-Espinosa, A.; González-García, J.; Echagüe, J. Inspection Operations and Hole Detection in Fish Net Cages through a Hybrid Underwater Intervention System Using Deep Learning Techniques. J. Mar. Sci. Eng. 2024, 12, 80. [Google Scholar] [CrossRef]
  17. Yan, C. Research on Autonomous Net Inspection of Marine Pastures Based on Reinforcement Learning. Master’s Thesis, Dalian Ocean University, Dalian, China, 2023. [Google Scholar]
  18. Manhaes, M.M.M.; Scherer, S.A.; Voss, M.; Douat, L.R.; Rauschenbach, T. UUV Simulator: A Gazebo-Based Package for Underwater Intervention and Multi-Robot Simulation. In Proceedings of the OCEANS 2016 MTS/IEEE Monterey, Monterey, CA, USA, 19–23 September 2016; pp. 1–8. [Google Scholar] [CrossRef]
  19. Farley, A.; Wang, J.; Marshall, J.A. How to Pick a Mobile Robot Simulator: A Quantitative Comparison of CoppeliaSim, Gazebo, MORSE and Webots with a Focus on Accuracy of Motion. Simul. Model. Pract. Theory 2022, 120, 102629. [Google Scholar] [CrossRef]
  20. Koenig, N.; Howard, A. Design and Use Paradigms for Gazebo, an Open-Source Multi-Robot Simulator. In Proceedings of the 2004 IEEE/RSJ International Conference on Intelligent Robots and Systems (IROS), Sendai, Japan, 28 September–2 October 2004; Volume 3, pp. 2149–2154. [Google Scholar]
  21. Xing, W.; Huang, X.; Li, G.; Pang, G.; Yuan, T. Construction of a Dynamics Simulation System for Net Cleaning Robot Based on Gazebo. South China Fish. Sci. 2024, 20, 1–10. [Google Scholar] [CrossRef]
  22. Berg, V. Development and Commissioning of a DP System for ROV SF 30k. Master’s Thesis, Department of Marine Technology, Institutt for Marin Teknikk, Trondheim, Norway, 2012. [Google Scholar]
Figure 1. Deep-sea aquaculture net cage model.
Jmse 13 01736 g001
Figure 2. Net cage inspection simulation environment.
Jmse 13 01736 g002
Figure 3. RexROV model.
Jmse 13 01736 g003
Figure 4. Diagram of sensors and thrusters mounted on the underwater robot.
Jmse 13 01736 g004
Figure 5. Simulation system architecture for autonomous underwater net-cage inspection: a gazebo and ROS integrated platform.
Jmse 13 01736 g005
Figure 7. Schematic of distance and angle calculation.
Jmse 13 01736 g007
Figure 8. Comparison of actual and desired AUV inspection paths in static water.
Jmse 13 01736 g008
Figure 9. AUV inspection simulation results in static water.
Jmse 13 01736 g009
Figure 10. Comparison of AUV inspection paths under different current speeds.
Jmse 13 01736 g010
Figure 11. AUV inspection simulation results under different current speeds.
Jmse 13 01736 g011
Figure 12. Comparison of AUV inspection paths at different cruising speeds.
Jmse 13 01736 g012
Figure 13. AUV inspection simulation results at different cruising speeds.
Jmse 13 01736 g013
Figure 14. AUV inspection paths under external force disturbances.
Jmse 13 01736 g014
Table 1. MSE (mean squared error) of measured net distance and relative angle of attack deviation under different current speeds.
Current SpeedsMSE of Measured Net Distance MSE of Measured Relative Angle of Attack Deviation
0.5 m/s 0.00073391 1.847
0.75 m/s 0.0019685 1.1459
0.9 m/s 0.0020891 2.1192
Table 2. MSE (mean squared error) of measured net distance and relative angle of attack deviation under different cruising speeds.
Cruising SpeedsMSE of Measured Net Distance MSE of Measured Relative Angle of Attack Deviation
0.75 m/s 0.0025305 0.44681
1.0 m/s 0.0016461 0.68244
1.25 m/s 0.0023919 1.2394
Disclaimer/Publisher’s Note: The statements, opinions and data contained in all publications are solely those of the individual author(s) and contributor(s) and not of MDPI and/or the editor(s). MDPI and/or the editor(s) disclaim responsibility for any injury to people or property resulting from any ideas, methods, instructions or products referred to in the content.