1. Introduction
The Northwest Pacific and South China Sea (The territorial scope of the South China Sea covers the maritime areas within the U-shaped Nine-Dash Line. It includes the Xisha, Nansha, and Zhongsha Islands under the jurisdiction of Sansha City, Hainan Province, located between 03°35′ N and 17°08′ N.
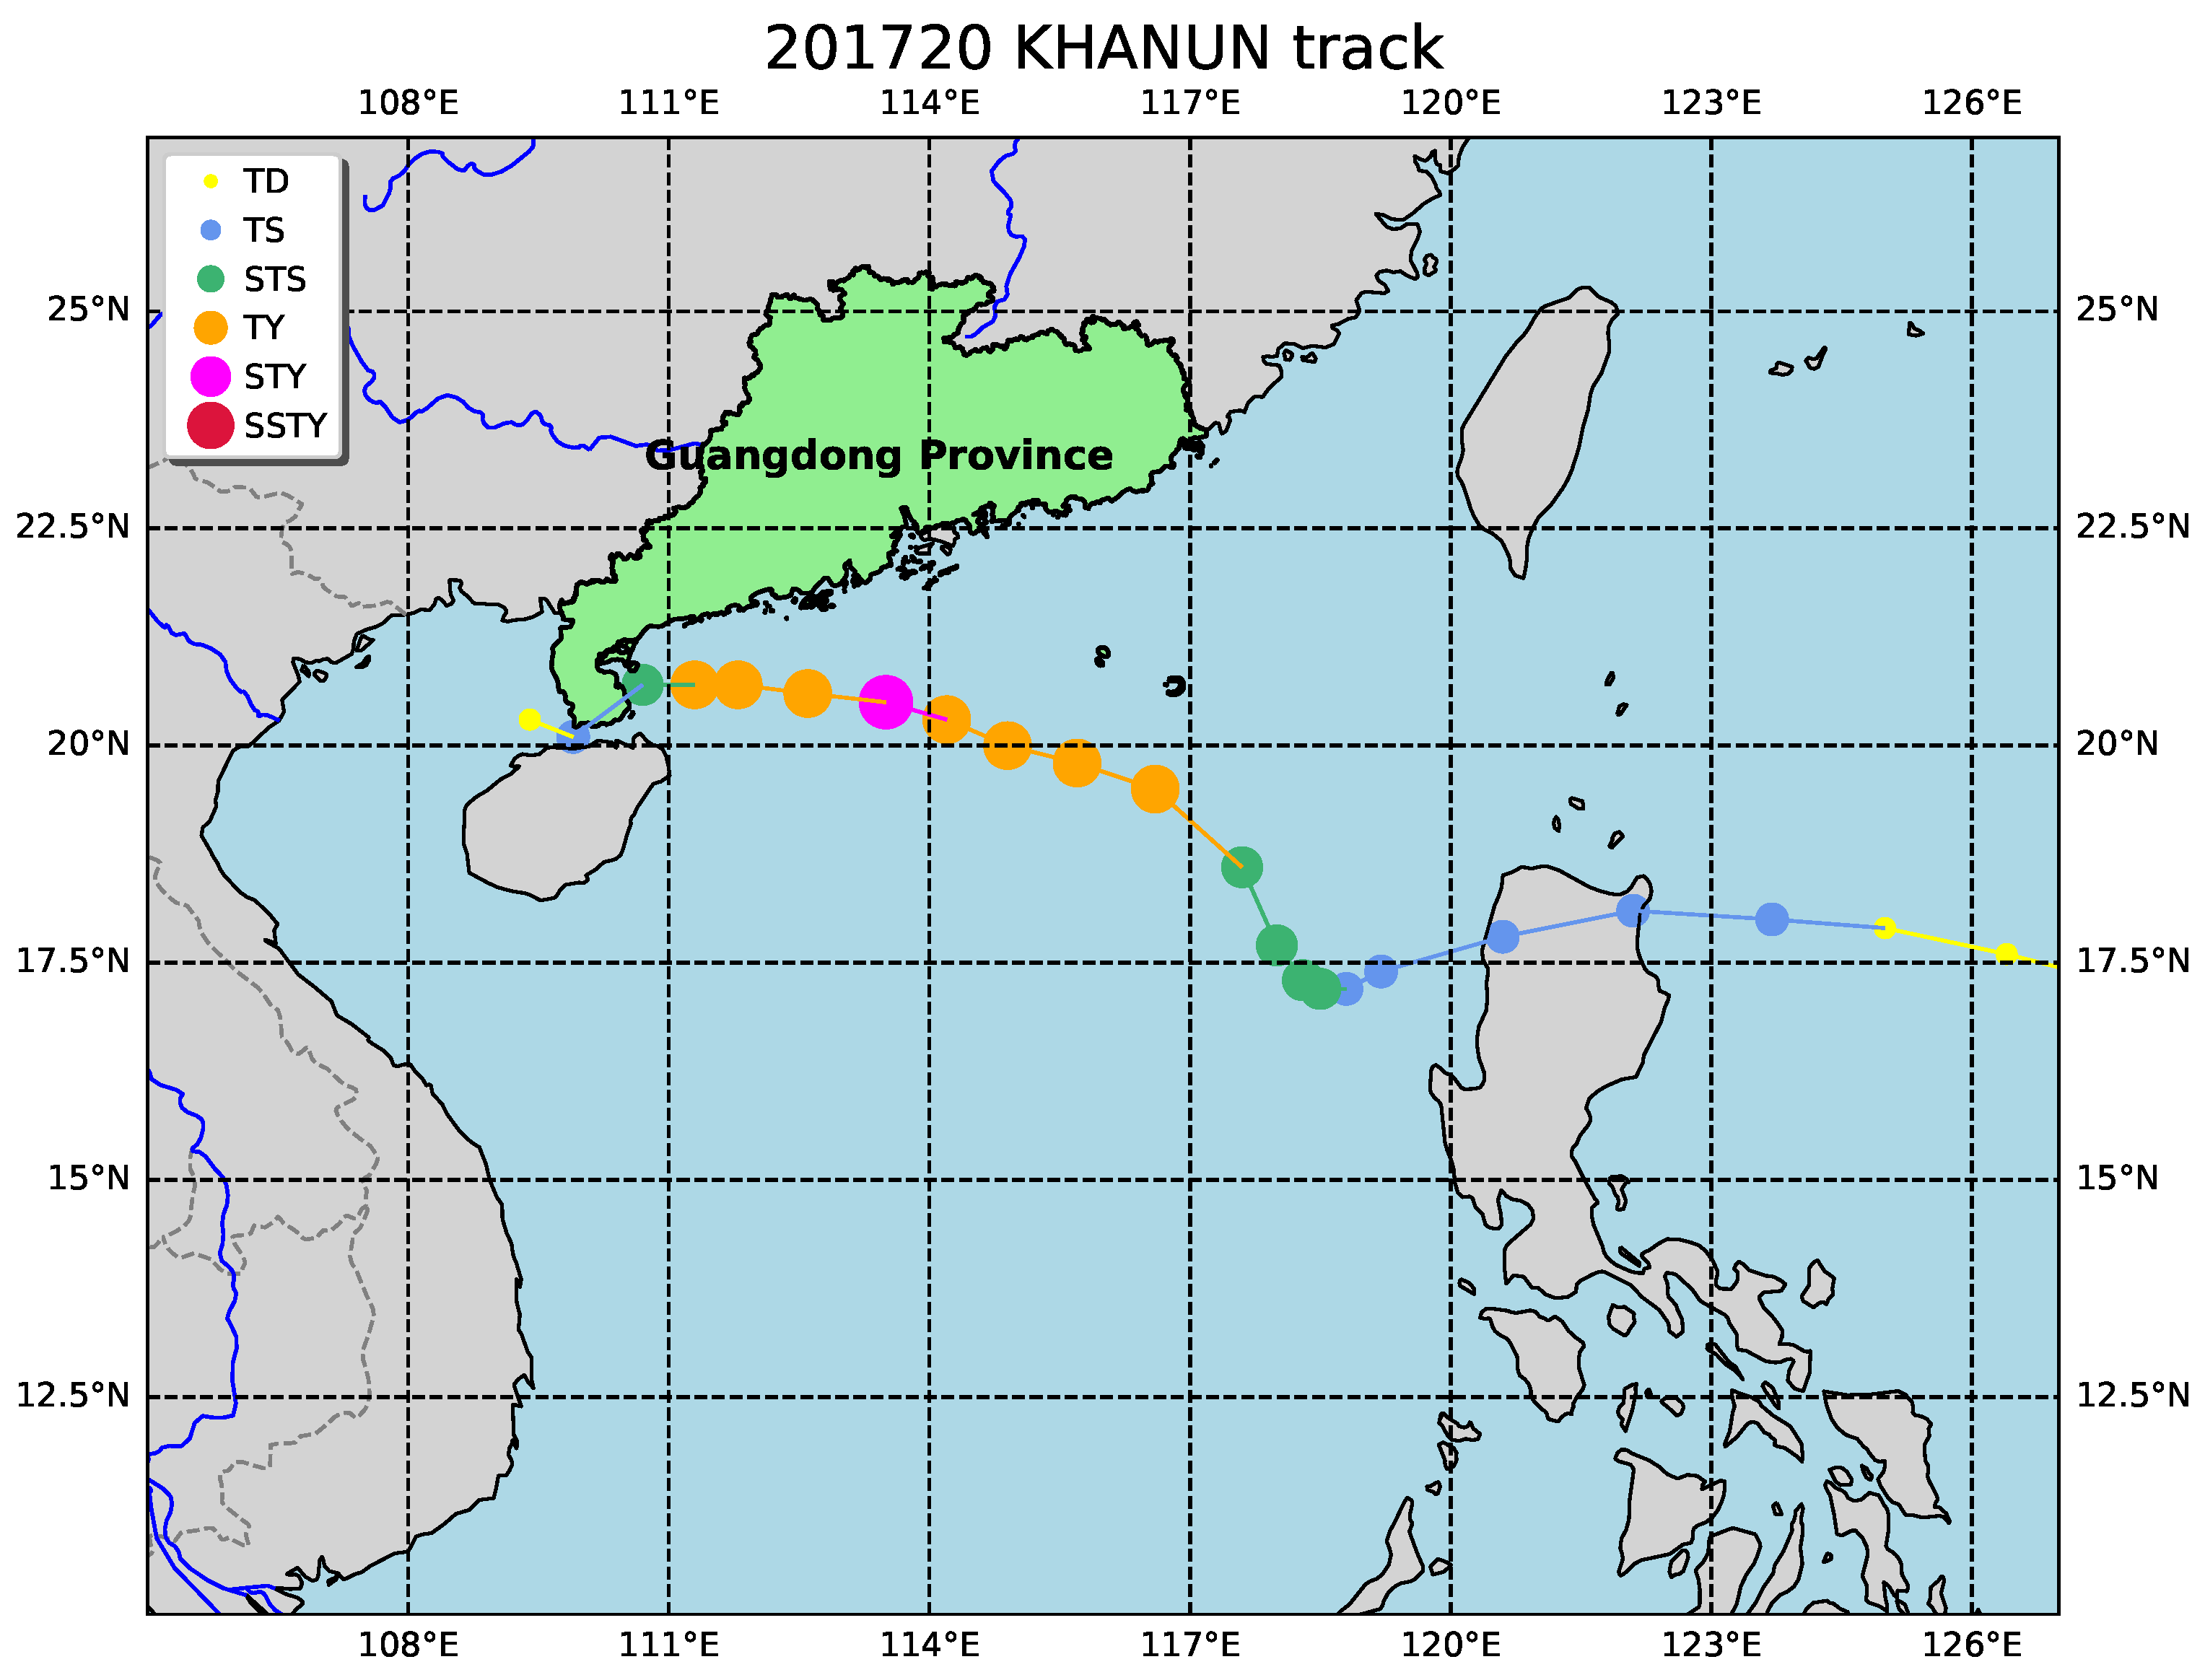
Figure 1 shows the main area traversed by the typhoon, including a part of the South China Sea area.) are primary regions for tropical cyclone formation, significantly influencing regional climate dynamics and moisture transport [
1]. As key pathways for monsoonal flows, these regions play a vital role in global climate regulation [
2]. Typhoons, known for their high destructive potential, frequently cause heavy precipitation, storm surges, and coastal flooding, profoundly affecting ecosystems, economic activities, and societal stability [
3]. In China, Guangdong Province experiences an average of 3.6 typhoon landfalls annually, making it one of the most typhoon-affected regions globally [
4]. Recent studies indicate that global warming, by increasing sea surface temperatures (SST), may enhance typhoon frequency and intensity, prolonging their lifecycles and exacerbating ecological and socio-economic impacts in coastal areas [
5]. Accurate characterization of typhoon–ocean interactions is essential for improving forecast accuracy and evaluating long-term ecological changes in the context of climate change [
6].
Typhoons trigger complex upper-ocean responses through physical processes such as Ekman transport, upwelling, and downwelling, which are influenced by the storm’s trajectory relative to coastlines [
7]. These processes significantly alter sea surface temperature (SST), sea surface salinity (SSS), and ocean current structures [
8]. For instance, typhoon-induced vertical mixing and upwelling can reduce SST by several degrees Celsius, particularly on the right side of the storm track, thereby reducing heat and moisture fluxes to the atmosphere and weakening storm intensity [
9]. Similarly, heavy rainfall and vertical mixing modify SSS distributions, creating asymmetric spatial patterns—freshening on the left side due to precipitation and salinification on the right due to upwelled saline water [
10]. These physical changes also drive ecological responses, such as nutrient upwelling, which promotes phytoplankton blooms, enhancing marine productivity and carbon sequestration [
11,
12,
13]. The complexity of these interactions highlights the need for advanced observational and modeling tools to accurately capture their spatial and temporal variability [
14].
The Regional Ocean Modeling System (ROMS), coupled with satellite remote sensing, provides a robust framework for studying typhoon–ocean interactions. Satellite remote sensing delivers high spatiotemporal resolution data for parameters such as sea surface temperature (SST), sea surface salinity (SSS), and surface wind fields [
15]. However, its effectiveness is limited by cloud cover and atmospheric interference during extreme weather, which obstructs direct observation of vertical ocean structures [
16]. In contrast, ROMS, a three-dimensional, free-surface, hydrostatic ocean model, simulates critical processes such as mixed-layer deepening, upwelling, and regional current dynamics at high resolution, effectively compensating for these observational gaps [
17]. For example, the Coupled Ocean-Atmosphere-Wave-Sediment Transport (COAWST) system, integrating ROMS with the Weather Research and Forecasting (WRF) model and the Simulating Waves Nearshore (SWAN) model, was used to simulate Typhoon Kalmaegi (2014) in the South China Sea, accurately reproducing an SST cooling of approximately 3 °C, driven by vertical mixing and horizontal advection, which improved air–sea feedback and typhoon intensity forecasts [
18]. Similarly, studies on Typhoon Krosa in the Northwest Pacific combined ROMS with satellite remote sensing and Argo float data, revealing enhanced cyclonic eddy circulation and nutrient upwelling, which triggered a fivefold increase in chlorophyll-a concentrations and a phytoplankton bloom persisting for about two weeks, underscoring the ecological impacts of typhoons [
19].
Building on this integrated approach, numerous studies have employed ROMS and satellite remote sensing to systematically analyze upper-ocean responses to typhoons. For instance, Yue et al. combined multi-sensor satellite data with ROMS simulations to study Typhoons Kalmaegi and Sarika, documenting SST reductions of up to 2 °C on the right side of storm tracks and asymmetric SSS patterns, with freshening on the left due to rainfall and salinification on the right due to upwelling [
9]. Similarly, investigations of Typhoon Mala in the Bay of Bengal confirmed that ROMS effectively reproduced mixed-layer deepening and upwelling, which influenced ocean stability [
20]. Guan et al. explored the role of internal tides in modulating typhoon-induced responses in the South China Sea, demonstrating enhanced vertical mixing and SST cooling, validated by satellite microwave SST observations [
21]. Additionally, Wu et al. applied the COAWST system to study super Typhoon Mangkhut, analyzing spatial asymmetries in SST cooling and subsurface thermal structures, corroborated by satellite and buoy data [
22]. Collectively, these studies validate the reliability of ROMS, coupled with satellite remote sensing, in simulating typhoon-driven physical processes and elucidating complex air-sea interactions [
23].
This study employs ROMS to numerically simulate Typhoon Khanun (2017) and investigate its track, intensity, and upper-ocean responses in the South China Sea. Occurring in October 2017, Typhoon Khanun affected both coastal and open-ocean regions, generating strong winds and heavy precipitation that induced significant ocean dynamic changes. By simulating variations in SST, SSS, and ocean currents, this research aims to clarify the physical mechanisms driving typhoon–ocean interactions, including vertical mixing and upwelling [
24]. Compared to prior studies, Typhoon Khanun presents a unique case due to its extensive spatial influence and pronounced ocean responses, offering valuable insights into typhoon behavior under diverse environmental conditions. The findings are expected to improve the accuracy of typhoon forecasts in the South China Sea, thereby enhancing disaster preparedness and mitigation strategies.
Compared with previous studies that mainly focused on individual typhoon events such as Kalmaegi or Mangkhut using either ROMS or satellite data, this study makes two key improvements. First, it investigates Typhoon Khanun (2017), a relatively underexplored case that exhibited a broad spatial impact in the northern South China Sea. Second, a higher-resolution ROMS configuration (~4 km, 40 -layers) is coupled with the SWAN wave model via the COAWST system, enabling a more accurate representation of typhoon processes.
The subsequent sections are structured as follows:
Section 2 describes the datasets, including satellite remote sensing and reanalysis products, and the ROMS simulation methodology;
Section 3 presents the simulated ocean responses induced by Typhoon Khanun and discusses their driving mechanisms;
Section 4 summarizes the key findings and their implications for typhoon and oceanographic research.
3. Results and Discussion
3.1. Model Validation
Model performance was evaluated using three statistical metrics: correlation coefficient (R), mean absolute bias (MAB), and root mean square error (RMSE). The Pearson correlation coefficient (R) measures the linear relationship between simulated and observed values, indicating the model’s ability to capture spatiotemporal trends.
The ROMS model was used to simulate sea surface temperature (SST) and sea surface height (SSH) variations induced by Typhoon Khanun (October 2017) in the South China Sea, validated against GHRSSST, Jason-2/3, and HY-2 satellite observations (see
Figure 2 and
Figure 3). The simulations revealed significant SST cooling on the right side of the storm track (approximately 2.0 °C, see
Figure 2), closely aligning with satellite observations (
, RMSE = 0.424 °C, MAB = 0.370 °C;
Table 1). However, SST cooling was slightly underestimated during the typhoon’s peak intensity on 15 October (RMSE = 0.641 °C;
Table 1).
SSH simulations showed higher consistency with observations (
, RMSE = 0.076 m, MAB = 0.076 m;
Figure 3 and
Table 1), with optimal performance during the peak intensity (
on 15 October). Wind-driven vertical mixing and upwelling primarily drove SST cooling, while wave–current interactions modulated SSH variations, with the model improving accuracy by accounting for surface roughness.
Although the model effectively reproduced spatiotemporal variations in SST and SSH, with SSH simulations outperforming SST, discrepancies during peak SST cooling and SSH dissipation phases suggest the need for refined vertical mixing parameterization and higher-resolution bathymetry and tidal data.
3.2. Wind Variation During the Movement of Typhoon Khanun
Khanun formed in the northwest Pacific Ocean and dissipated over the South China Sea. It had the characteristics of “strong landing intensity, long land retention time, and wide impact area,” which caused serious casualties and economic losses to many coastal provinces of China. Additionally,
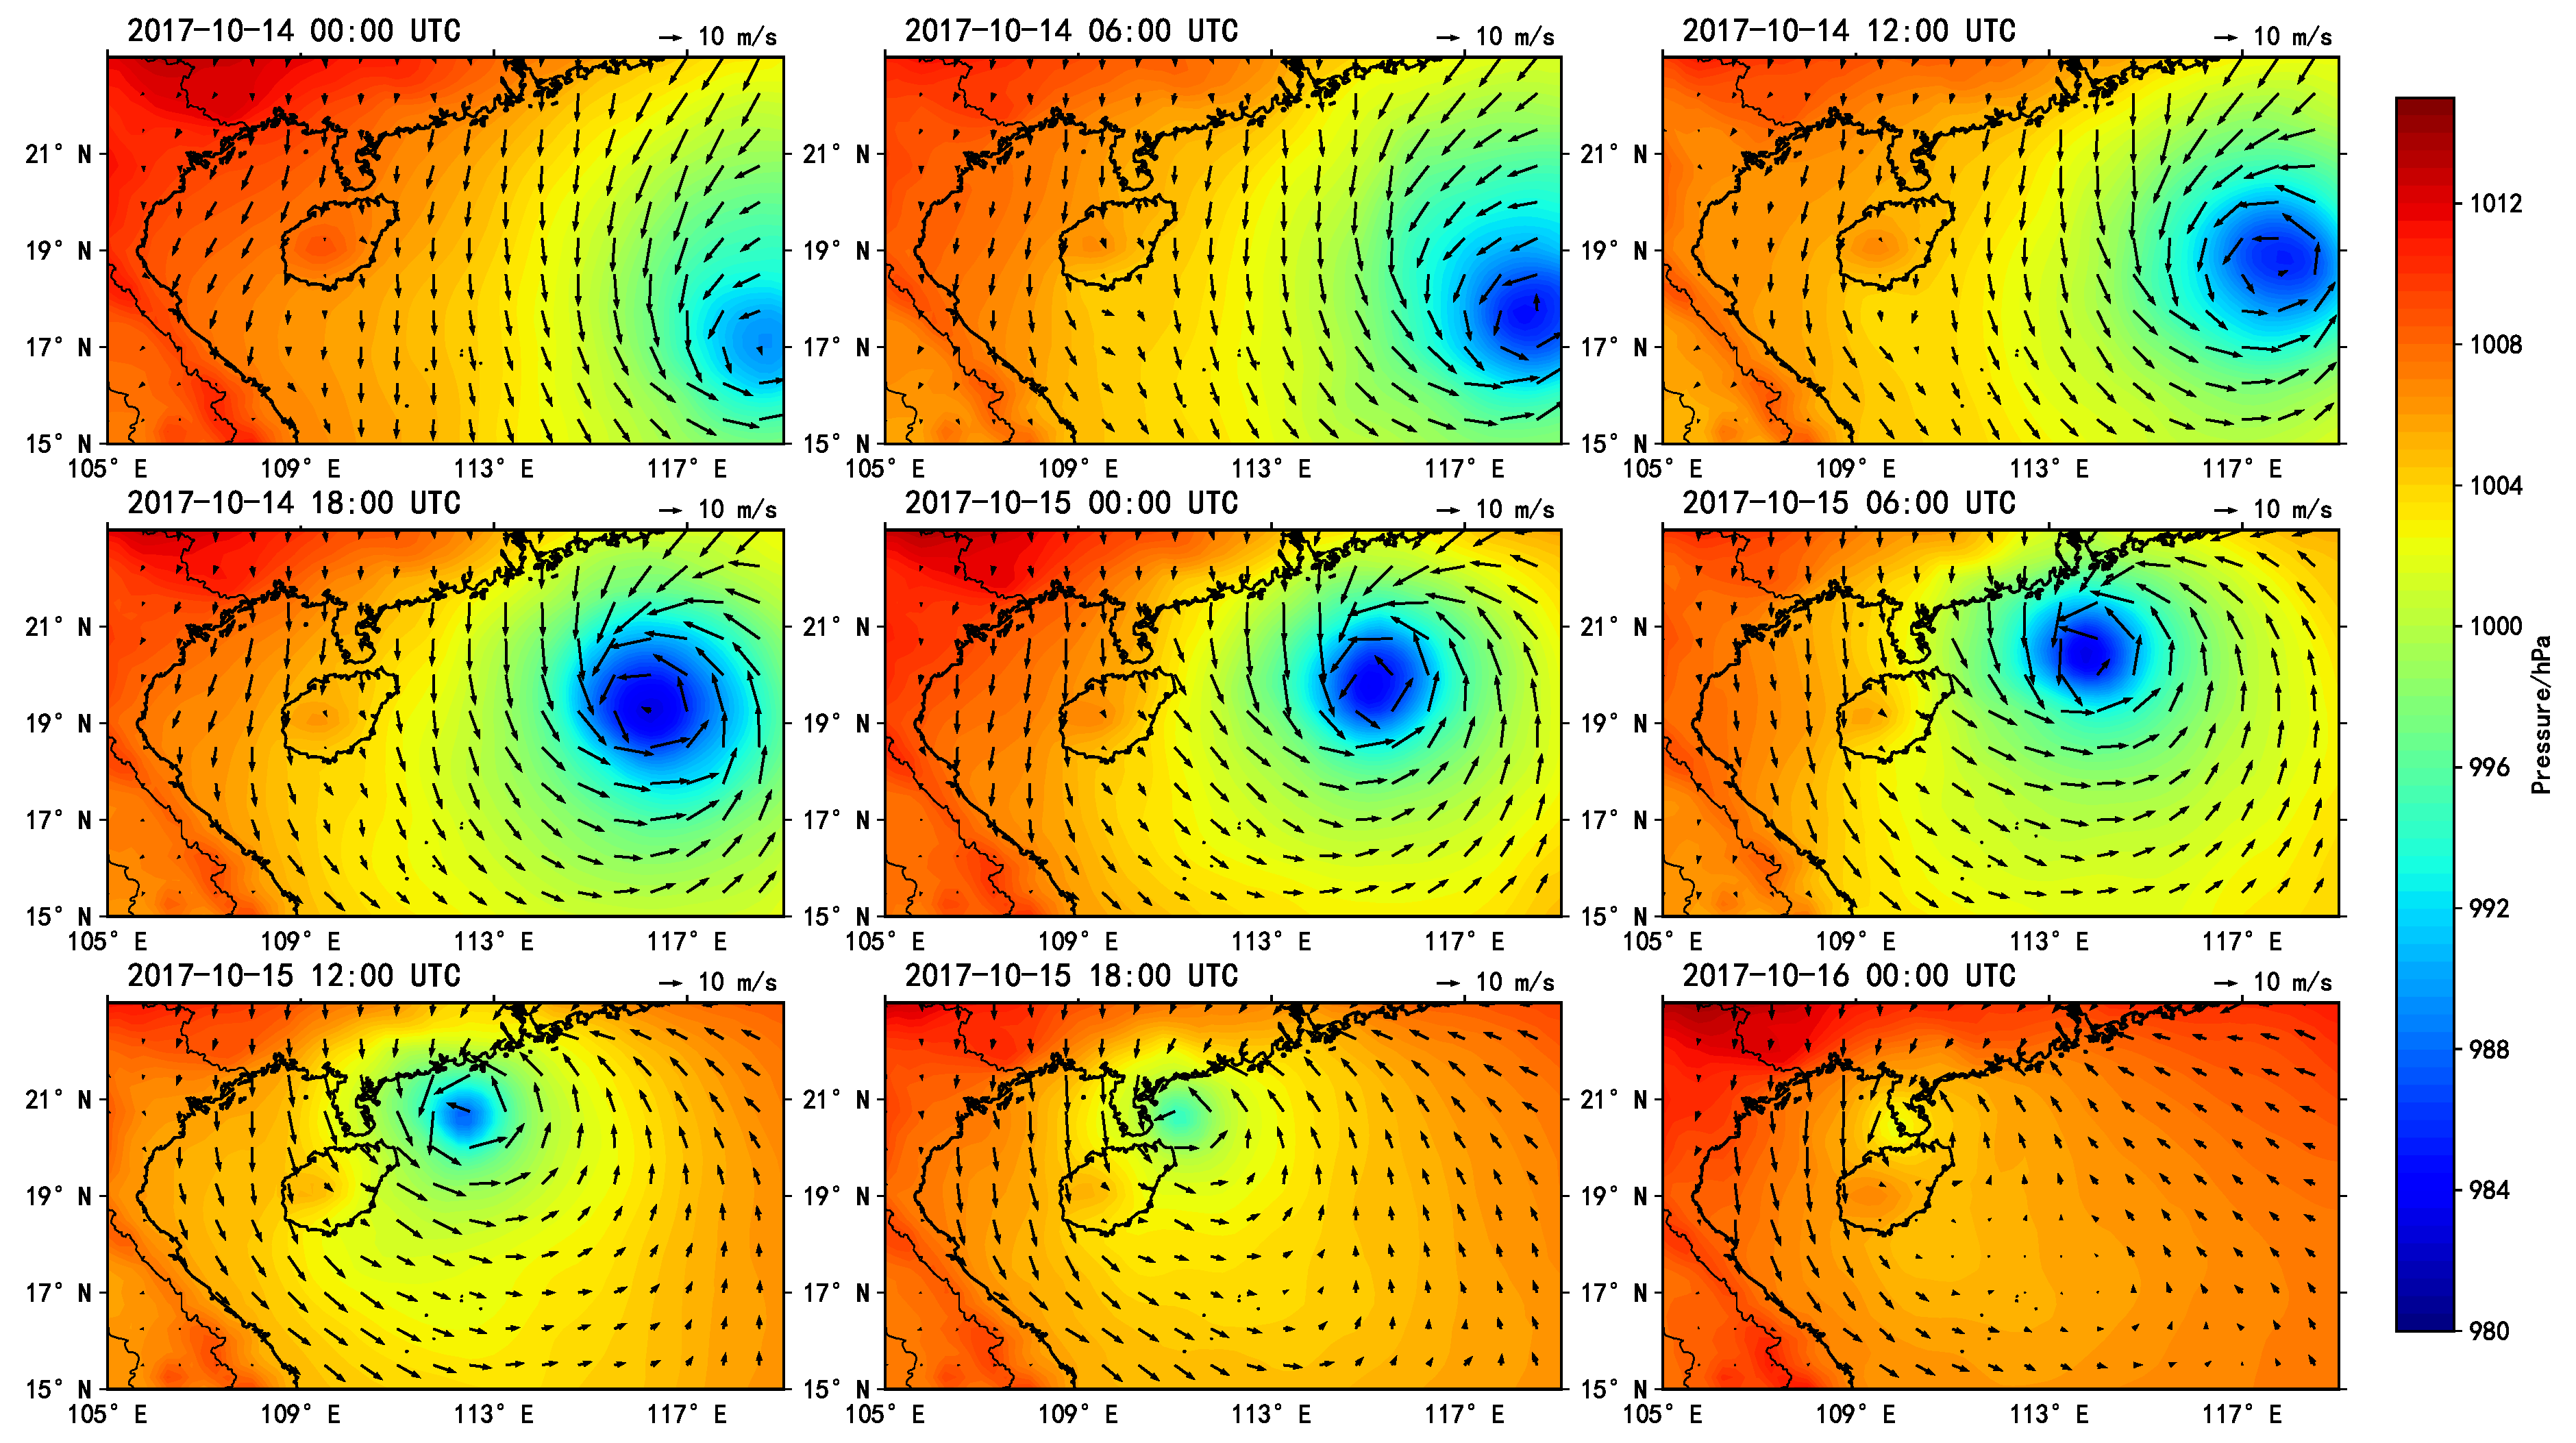
Figure 4 and
Figure 5 depict the 6-hourly sea surface wind field and pressure distribution in the South China Sea during Khanun’s passage, derived from ERA5 reanalysis data, with black arrows representing 10 m wind speed vectors and colors indicating sea level pressure.
Based on the hourly wind speed data at a 10 m height above the sea surface, the Ekman Pumping Velocity (EPV) and its spatial distribution were computed using MATLAB through Equations (
6) and (
7).
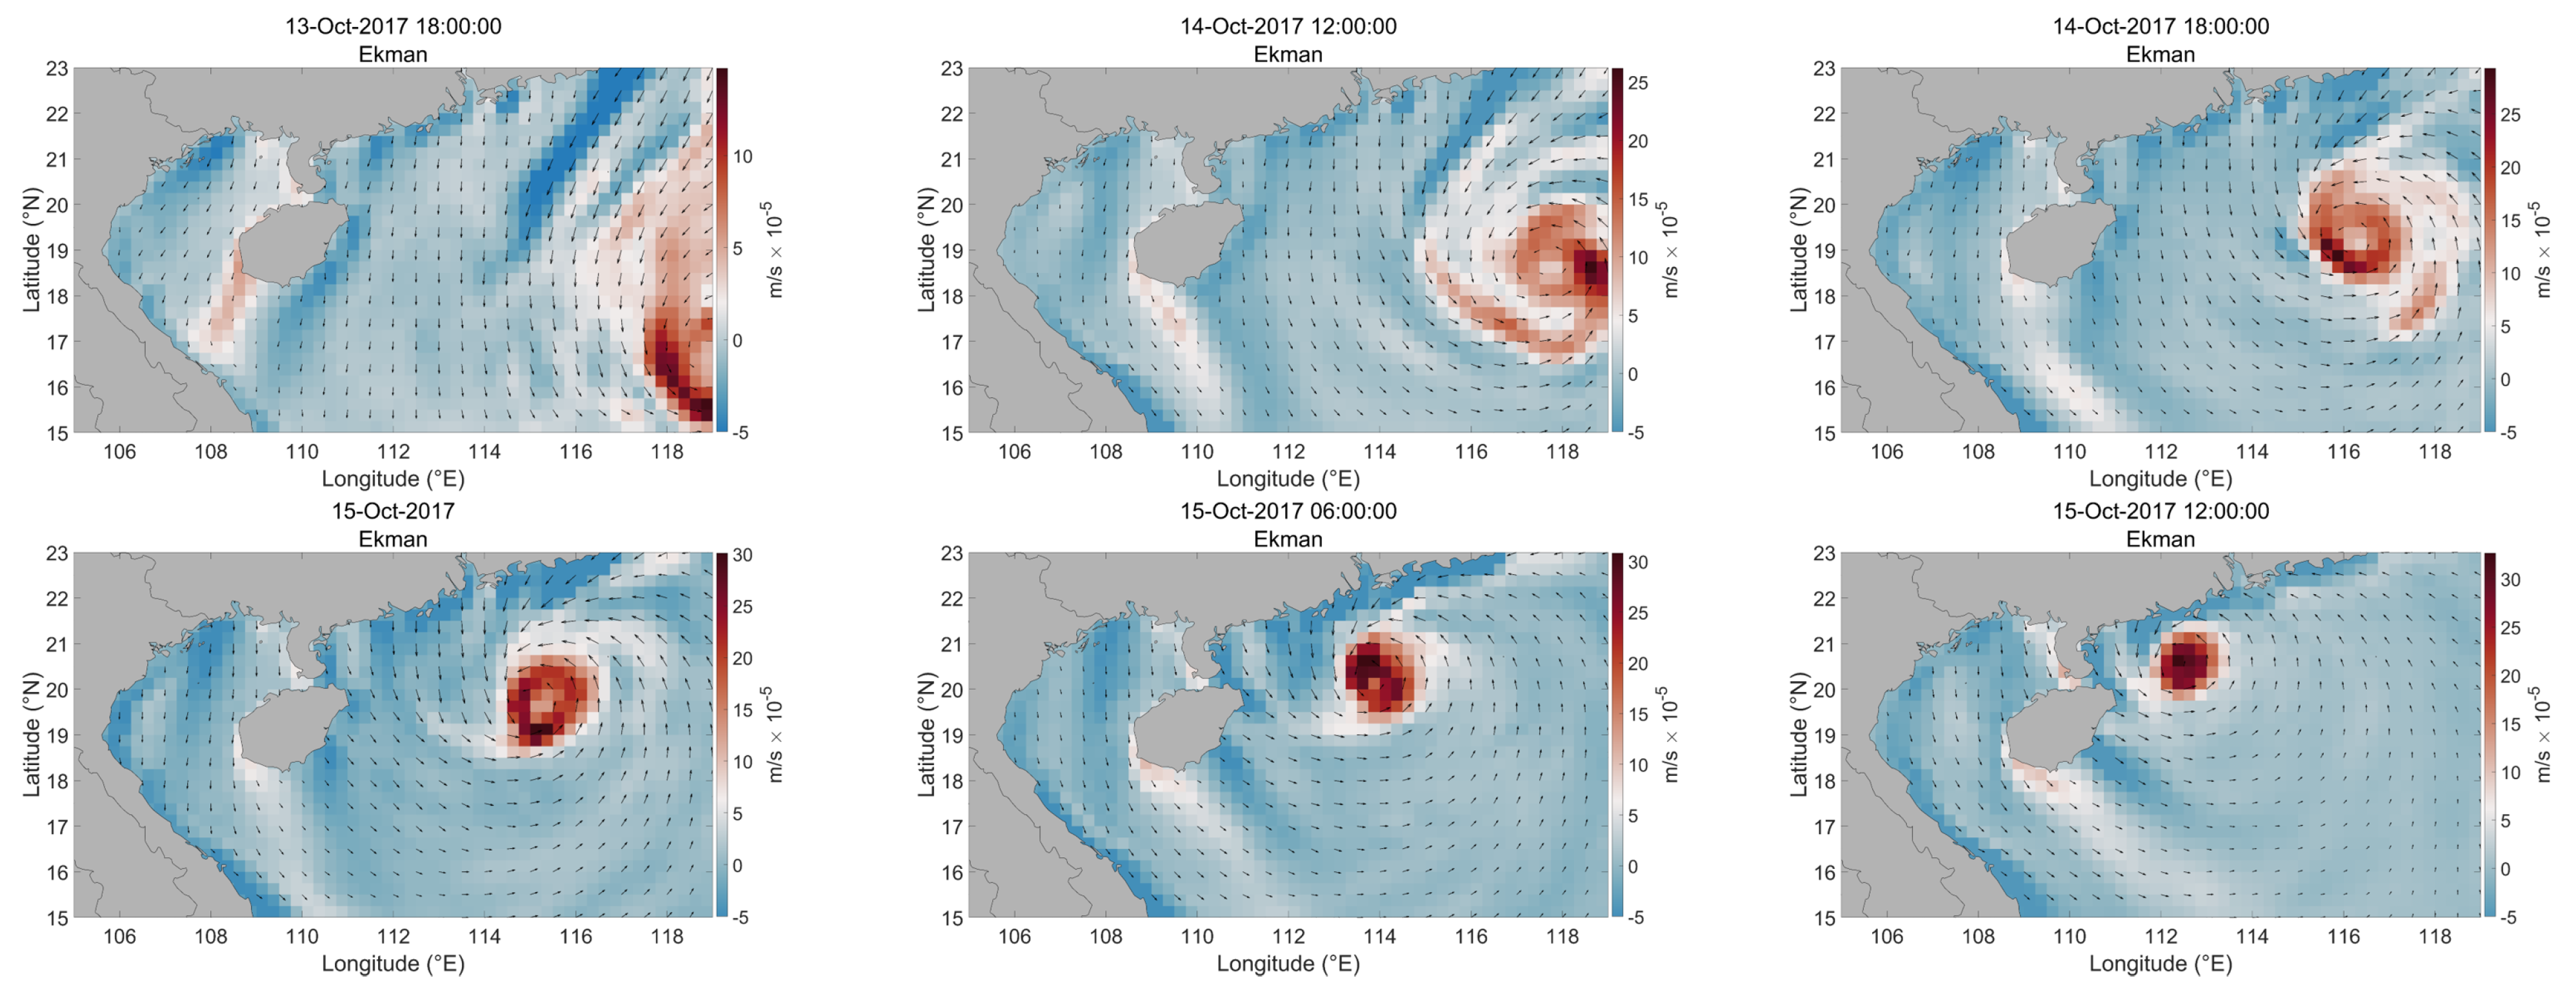
Figure 6 illustrates the EPV variations across the region during the passage of Typhoon Khanun. A positive EPV signifies upward movement, while a negative value indicates downward motion, as depicted in the images. The EPV is notably prominent over the ocean near the typhoon’s center. As the typhoon approached the coastline, the EPV became more evident along the coastal areas to the right of the storm, influenced by the typhoon’s wind patterns.
The strong winds and low-pressure centers associated with Typhoon Khanun were primary drivers of enhanced ocean mixing, significantly altering the upper ocean’s dynamic response. The high wind speeds near the typhoon’s center, as derived from ERA5 reanalysis data, generated substantial wind stress on the ocean surface, deepening the mixed layer through intense vertical mixing. Specifically, within the regional domain bounded by latitudes 19° N–20° N and longitudes 111° E–112° E, the density-based ocean mixed layer thickness exhibited a notable deepening trend during the typhoon influence period: approximately 28 m on the 11th and approximately 46 m on the 15th. This process facilitated the convergence and divergence of surface waters, driving key ocean dynamic processes such as upwelling and downwelling. The spatial distribution of Ekman Pumping Velocity (EPV), calculated using Equations (
6) and (
7), revealed pronounced vertical motion in regions of intense atmospheric forcing, particularly near the typhoon’s core, where high positive EPV values indicated strong upward Ekman suction [
22]. As Khanun approached the coastline, the EPV intensified along the coastal areas, where the proximity of the coastline enhanced asymmetry in the wind stress field. This effect was particularly evident to the right of the storm’s path near the coast, whereas over the open ocean the EPV distribution was more spatially symmetric, with less pronounced right–left differences. These patterns underscore the critical role of wind stress in modulating upper ocean responses during the typhoon’s transit.
The temporal evolution of Ekman Pumping Velocity (EPV), as presented in
Table 2, elucidates the dynamic interplay between Typhoon Khanun’s wind field and oceanic responses. EPV values, derived from 10 m wind speed data using MATLAB through Equations (
6) and (
7), scale with the square of wind speed, underscoring the direct relationship between atmospheric forcing and oceanic vertical motion. On 13 October 2017 at 18:00, the EPV reached a maximum of
m/s, a minimum of
m/s, and a mean of
m/s, indicating moderate vertical motion during the typhoon’s early passage over the South China Sea. As the typhoon intensified, the maximum EPV increased to
m/s on 14 October 2017 at 12:00, with a minimum of
m/s and a mean of
m/s, reflecting heightened atmospheric forcing. By 15 October 2017, the EPV peaked at 00:00 with a maximum of
m/s, followed by
m/s at 06:00, and reached
m/s at 12:00, with corresponding minima of
m/s,
m/s, and
m/s, and means of
m/s,
m/s, and
m/s, respectively. These fluctuations highlight the strong winds and low-pressure centers of Typhoon Khanun as key drivers of enhanced ocean mixing, with high EPV values near the storm’s center signifying intense upward Ekman suction, while negative values indicated downward motion in adjacent areas. This dynamic response, driven by the typhoon’s atmospheric forcing, significantly influenced upper ocean mixing processes, potentially redistributing heat and nutrients. Such changes may enhance regional marine productivity by upwelling nutrient-rich deep waters or alter local weather patterns through modifications in sea surface temperature, warranting further investigation into the long-term ecological and climatic impacts [
22].
3.3. SST Changes During Typhoon Khanun’s Passage
Typhoon Khanun significantly altered sea surface temperature (SST) through wind-driven vertical mixing and upwelling, resulting in pronounced cooling across the northern South China Sea [
33]. This study evaluated the spatial extent and magnitude of SST cooling by comparing GHRSSST global operational SST data with ROMS simulations [
34]. GHRSSST observations revealed a maximum cooling of 1.50 °C along the storm track, while ROMS simulations in
Figure 7 indicated a slightly greater cooling of 1.94 °C. The most significant cooling occurred ahead of the storm track and in coastal regions, where the proximity to land and strong winds enhanced vertical mixing and upwelling, bringing colder deep water to the surface [
35]. While a rightward bias in mixing is often reported for tropical cyclones in the open ocean, in this case the coastal influence played a dominant role in shaping the cooling pattern. The higher variability in ROMS cooling patterns, compared to the more uniform GHRSSST data, likely stems from the model’s higher resolution, which better captures localized upwelling events.
Local SST responses were examined at 25 points along Typhoon Khanun’s track, spanning its evolution from a tropical depression to a severe typhoon and its subsequent weakening. GHRSSST data indicated cooling ranging from 0.53 °C to 1.50 °C, with the maximum at point 23 (110.70° E, 20.70° N) during the severe tropical storm phase, likely due to enhanced mixing near land. Cooling was more pronounced during the tropical storm and severe tropical storm phases than during the typhoon phase, possibly influenced by variations in storm translation speed or mixed-layer depth. In contrast, ROMS simulations showed cooling ranging from 0.07 °C to 1.94 °C, reflecting stronger mixing in high-wind regions. The spatial cooling pattern was concentrated in coastal areas and ahead of the storm track, reflecting the combined effects of storm forcing and coastal modulation, rather than a purely rightward mixing bias. The pronounced local cooling in ROMS suggests effective parameterization of wind-driven mixing, while the smoother GHRSSST response may result from satellite data averaging.
Ocean heat content (OHC) is a critical metric of upper-ocean thermal energy, directly influencing tropical cyclone intensity and duration. OHC quantifies the heat stored above the 26 °C isotherm, providing energy for typhoon intensification, while its reduction may weaken storms. The high-resolution ROMS configuration captures fine-scale regional responses, offering insights into heat redistribution processes.
OHC was calculated using the formula
where
is the reference seawater density,
is the specific heat capacity,
T is the temperature profile, and
is the 26 °C isotherm depth, with a scaling factor of
to convert units to MJ/cm
2. Before Khanun’s passage, the study region exhibited an average OHC of 49.08 MJ/cm
2. Post-passage, the average OHC decreased to 37.94 MJ/cm
2, a loss of 11.14 MJ/cm
2.
The OHC reduction was primarily driven by typhoon-induced vertical mixing and upwelling. The strong winds of Typhoon Khanun triggered Ekman pumping, lifting colder, nutrient-rich deep water to the surface. The wave–current coupled model revealed that wave-induced mixing, including wave breaking and Stokes drift, contributed an additional 0.3–0.5 °C to cooling, underscoring the role of waves in heat redistribution [
36,
37]. The shallow autumn thermocline in the northern South China Sea facilitated cold-water entrainment, amplifying OHC loss. Recent comprehensive analyses corroborate that, on the short timescale of storm passage (hours–days), vertical redistribution (turbulent entrainment and upwelling) provides the dominant contribution to rapid SST cooling, whereas atmospheric enthalpy fluxes typically play a secondary role in the initial cooling but can be important for the subsequent evolution of the cold wake [
38]. This high-resolution model provides a detailed regional analysis of OHC changes. For instance, reported significant OHC reductions in the Gulf of Mexico during Hurricane Gilbert (1988), attributed to vertical mixing and upwelling, aligning with our findings [
39]. OHC reductions can weaken typhoon energy supply, potentially reducing intensity.
3.4. Sea Surface Salinity Response
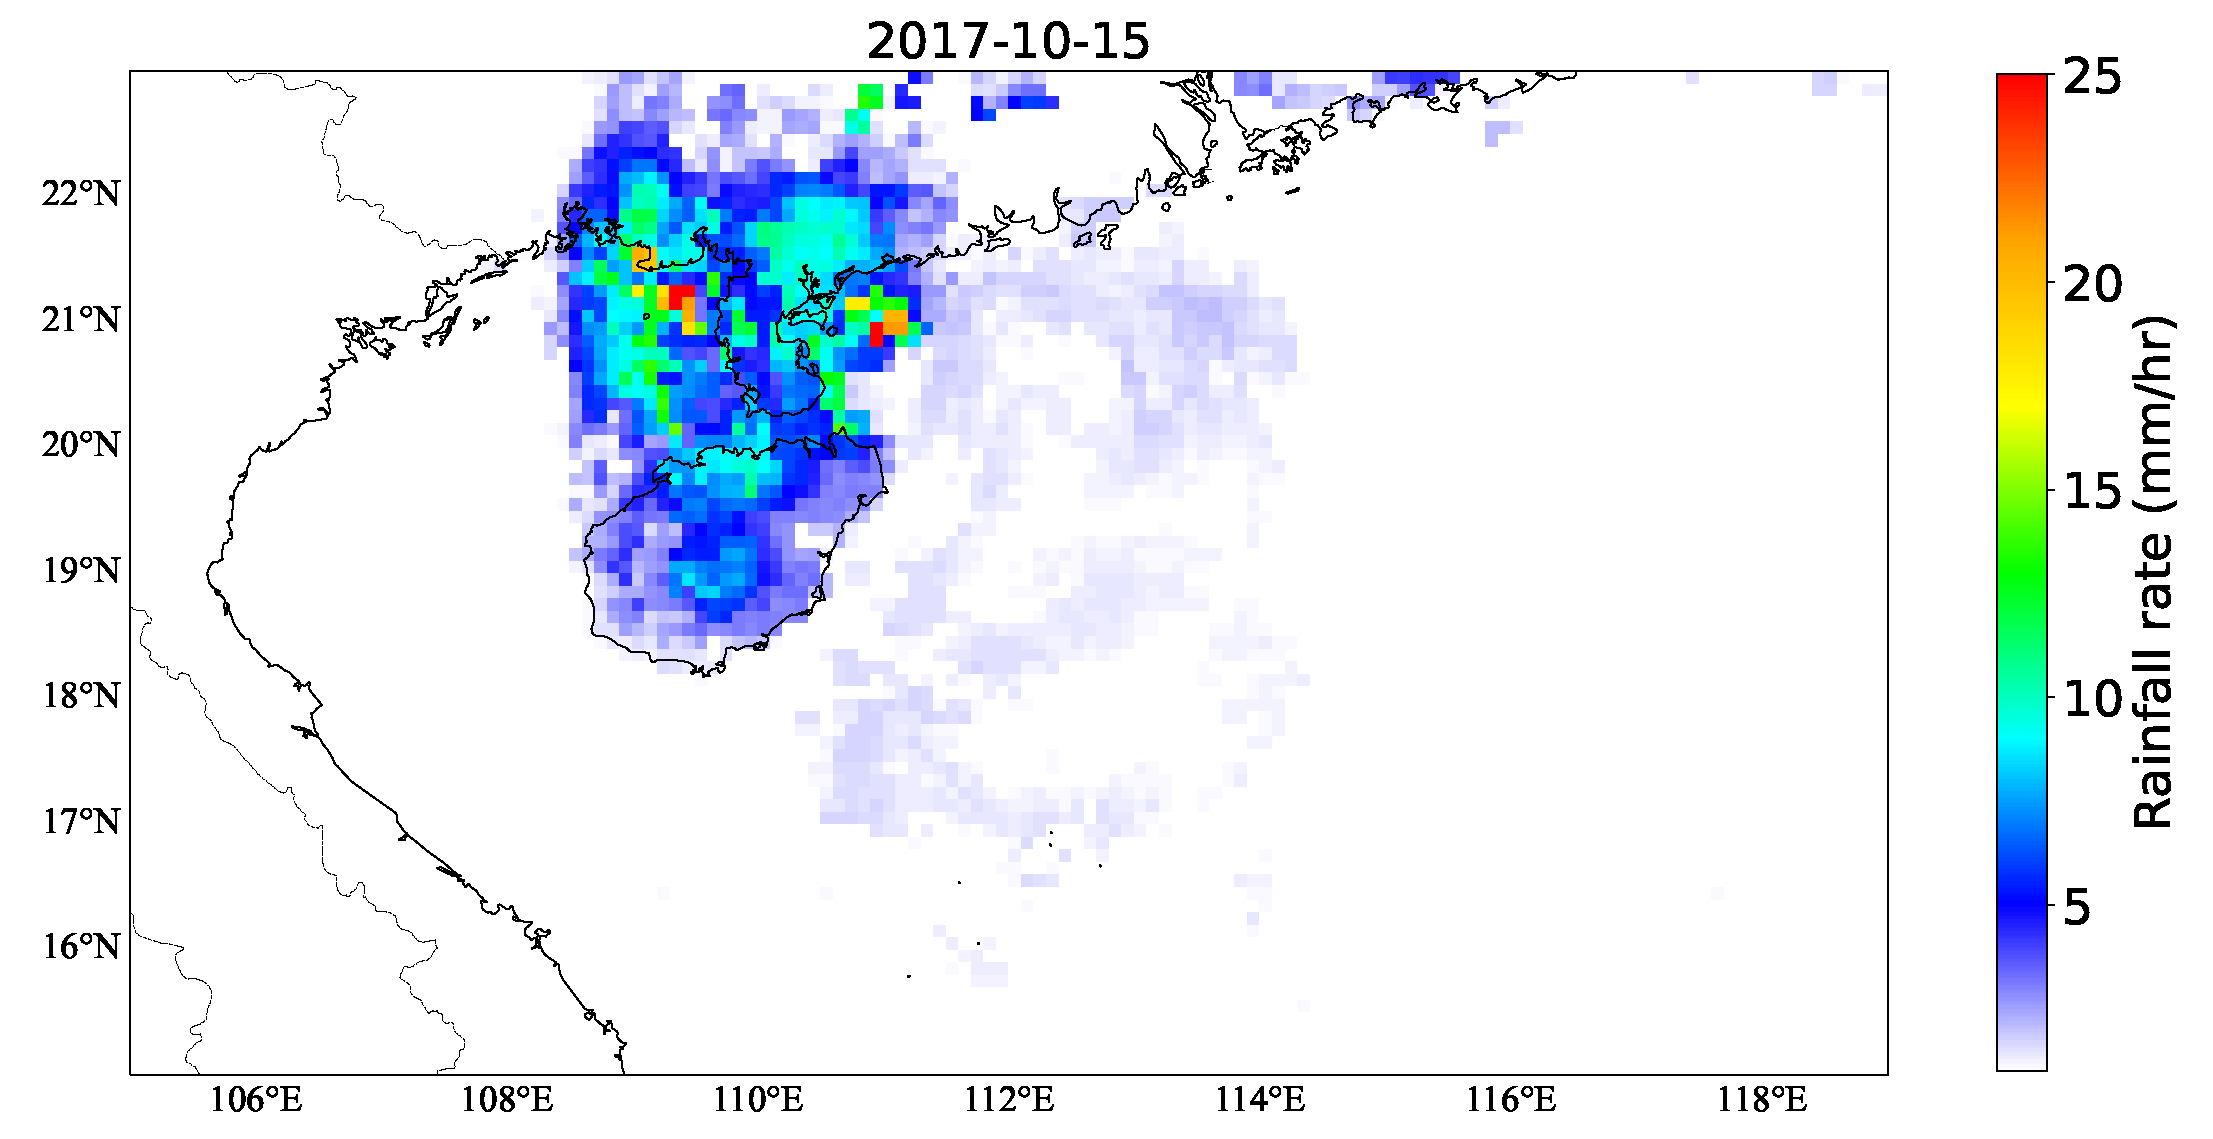
This study utilized NASA’s Soil Moisture Active Passive (SMAP) satellite data and the Regional Ocean Modeling System (ROMS) to investigate sea surface salinity (SSS) reductions in the northern South China Sea during Typhoon Khanun, with Global Precipitation Measurement (GPM) Integrated Multi-satellitE Retrievals (IMERG) rainfall data used to analyze the driving mechanisms. SMAP daily salinity data, complemented by high-resolution ROMS simulations, effectively captured spatiotemporal SSS variations, revealing a significant typhoon-induced freshening effect. GPM IMERG half-hourly rainfall data, derived from a multi-satellite retrieval algorithm, provided detailed precipitation distributions, enabling a robust analysis of the relationship between rainfall and SSS changes [
40,
41]. The strong winds and low-pressure centers of Typhoon Khanun, as derived from ERA5 reanalysis data, drove enhanced ocean mixing, with high Ekman Pumping Velocity (EPV) indicating areas of intense atmospheric forcing that influenced upper ocean responses, including salinity distribution. Initial SMAP (
Figure 8) observations suggested a notable SSS reduction during the typhoon; however, due to the satellite’s coarser resolution, it struggled to accurately capture fine-scale variations, particularly in nearshore regions. Thus, ROMS simulations (
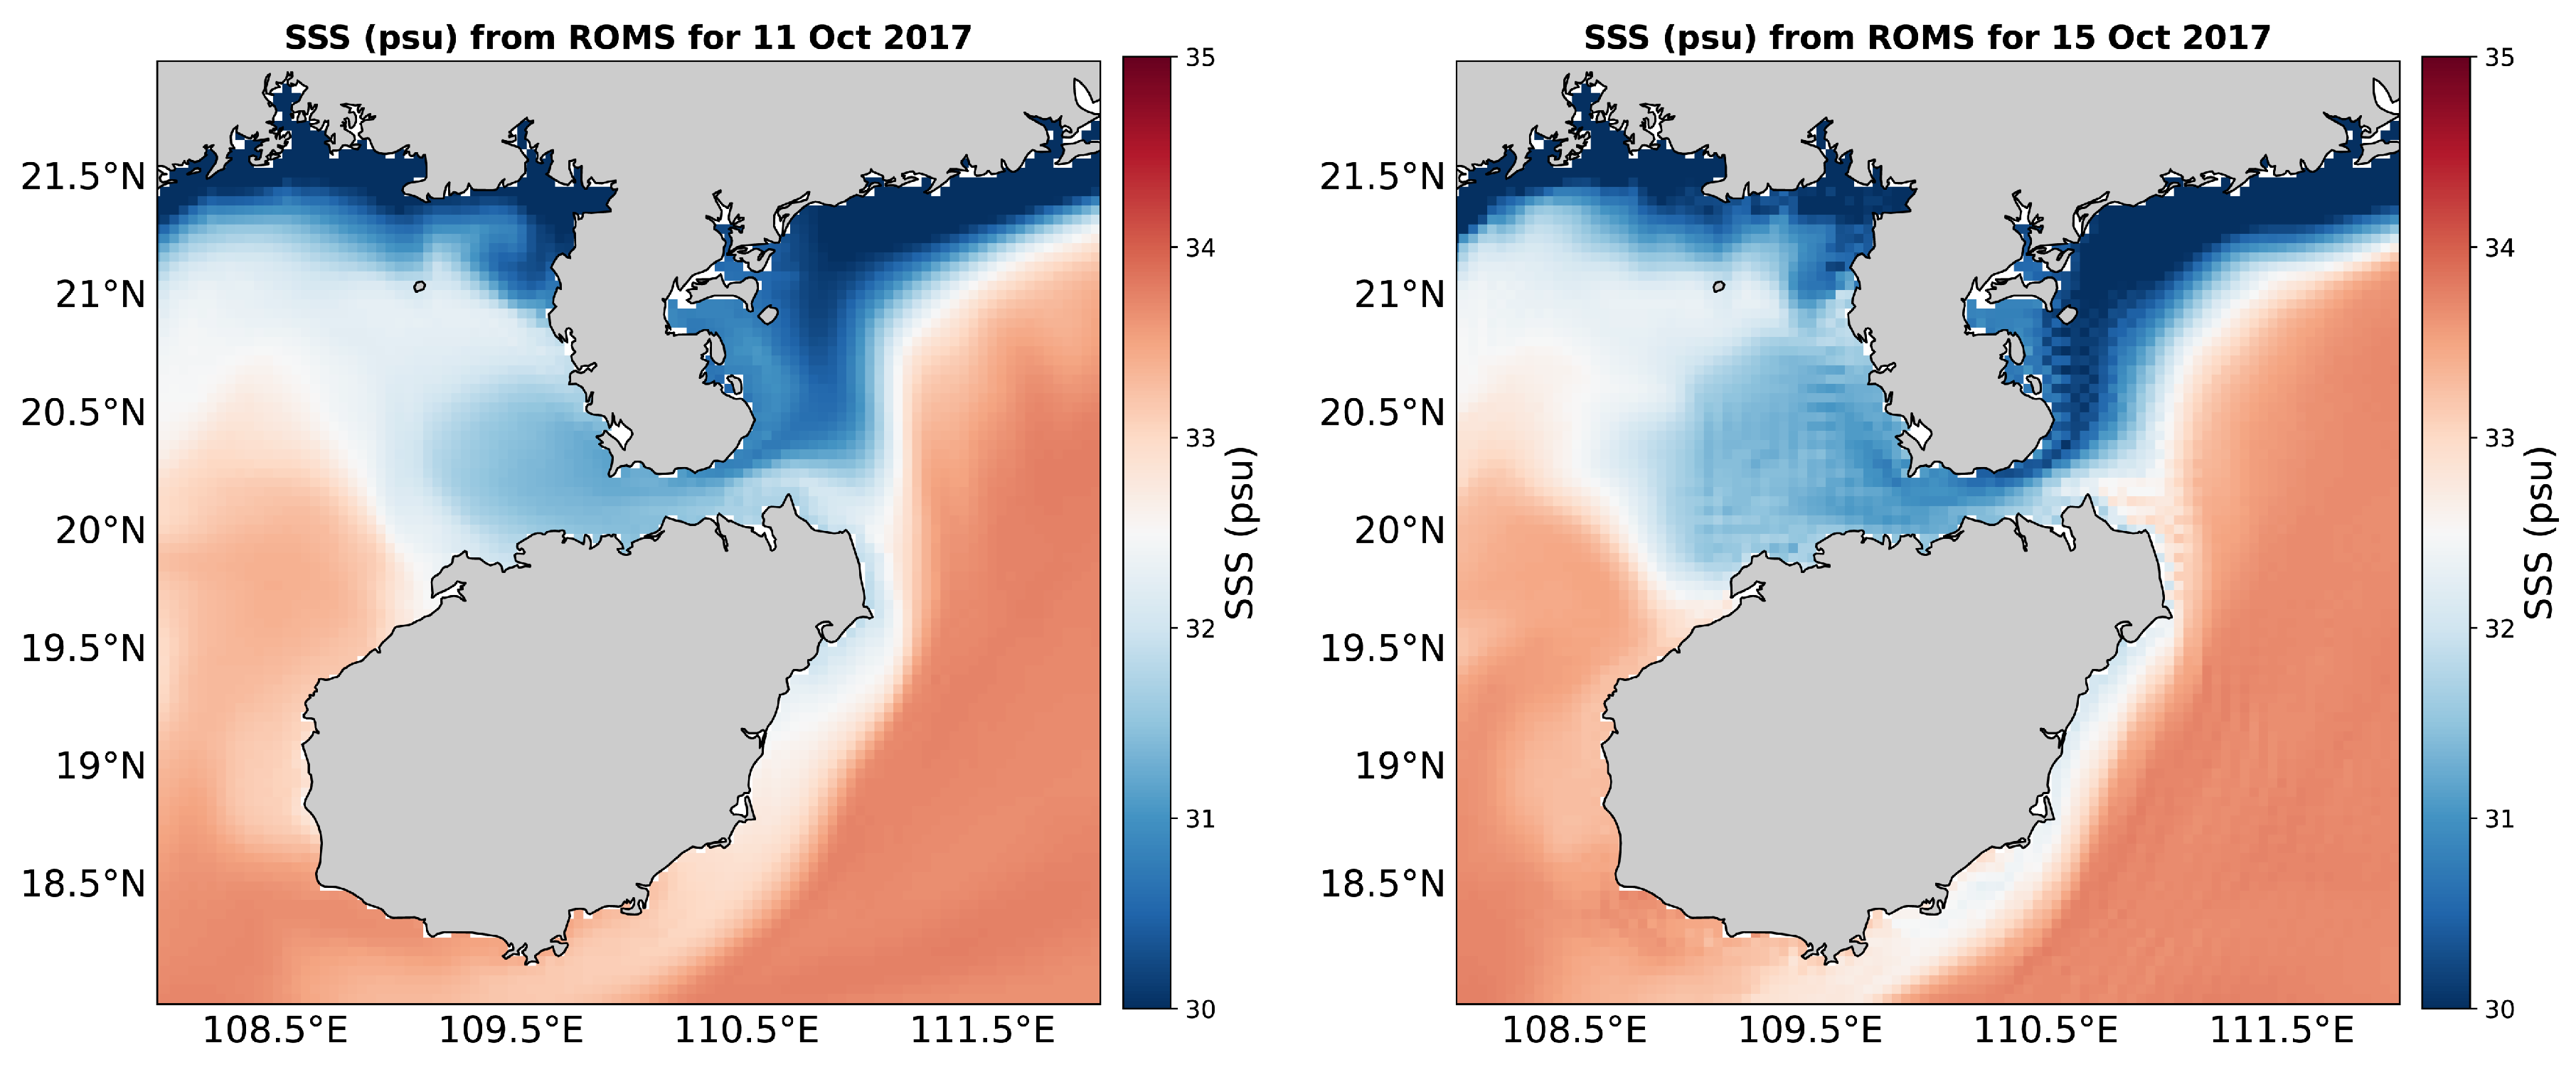
Figure 9) revealed a more precise SSS reduction of up to 0.1 psu, most notably in the Leizhou Peninsula and Beibu Gulf, where GPM data (
Figure 10) confirmed heavy rainfall as a primary driver. Discrepancies between SMAP and ROMS were attributed to resolution differences, with SMAP’s limitations highlighting the need for high-resolution modeling to elucidate localized salinity dynamics. This section elucidates the dynamic characteristics of SSS during Typhoon Khanun and its linkage to rainfall and wind-driven mixing through integrated SMAP, ROMS, and GPM data analysis.
SMAP and ROMS data revealed distinct spatiotemporal SSS variations during Typhoon Khanun, categorized into three phases: pre-typhoon, typhoon, and post-typhoon. Before 11 October (pre-typhoon), SSS in the northern South China Sea was stable, averaging 33 psu, indicative of a uniform autumn oceanic background. During the typhoon (12–16 October), SSS decreased significantly in high-rainfall areas, with the largest reductions observed in nearshore regions, particularly the Beibu Gulf, coinciding with heavy rainfall and landfall on October 16. ROMS simulations, with higher spatial resolution, captured finer-scale SSS reductions in the Beibu Gulf compared to SMAP, highlighting resolution-driven discrepancies. A low-salinity zone emerged in the Beibu Gulf between 14 and 15 October, closely aligned with peak rainfall and high EPV values, which indicated intense wind-driven mixing near the typhoon’s core. Post-typhoon (after 16 October), SSS gradually recovered, though nearshore areas exhibited slower recovery, likely due to regional oceanic dynamics, such as coastal currents, and freshwater retention. The strong winds and low-pressure centers, as evidenced by ERA5 data, amplified upper ocean mixing, contributing to the observed SSS reductions alongside rainfall. These findings suggest that typhoon-induced freshening was most pronounced in coastal regions, modulated by both atmospheric forcing and oceanic processes.
The SSS reduction was primarily driven by rainfall-induced freshening, modulated by mixed-layer dynamics, upwelling, and wave action, with significant contributions from wind-driven mixing. In shallow nearshore regions like the Beibu Gulf, limited vertical mixing caused rainfall-derived freshwater to remain in the surface layer, forming pronounced low-salinity zones, as captured by both SMAP and ROMS. Strong winds and low-pressure centers, generating high EPV values (e.g., m/s on 15 October at 12:00), deepened the mixed-layer depth through intense turbulent mixing, facilitating the downward transport of freshwater and amplifying the freshening effect vertically. However, along the outer edges of the typhoon path, Ekman pumping induced upwelling, bringing saltier deep water to the surface, partially counteracting the freshening, as observed in ROMS simulations. Discrepancies between SMAP and ROMS salinity data were attributed to resolution differences, with ROMS resolving finer-scale features, such as localized upwelling, that SMAP’s coarser resolution could not capture. Additionally, wave breaking and wind stress in nearshore areas intensified surface turbulence, promoting horizontal freshwater diffusion and enhancing low-salinity characteristics in the Beibu Gulf. These combined processes underscore the critical role of wind-driven mixing and rainfall in shaping SSS distributions during Typhoon Khanun.
In conclusion, GPM IMERG data provided detailed insights into the spatiotemporal distribution of rainfall and its relationship with SSS reduction during Typhoon Khanun, supported by SMAP and ROMS comparisons. Heavy rainfall occurred primarily between 13 and 15 October, aligning closely with the period of significant SSS decline, particularly in the Beibu Gulf, where peak rainfall intensity formed a prominent high-rainfall belt. A strong spatial correlation was observed between low-salinity zones and high-rainfall areas, as evidenced by SMAP and ROMS data, confirming freshwater input from heavy rainfall as the primary driver of SSS reduction. ROMS simulations further revealed finer-scale salinity gradients in nearshore regions compared to SMAP, highlighting the impact of resolution differences on capturing localized freshening. The intense atmospheric forcing, indicated by high EPV values near the typhoon’s core, enhanced upper ocean mixing, amplifying the effects of rainfall-induced freshening. This synergistic interaction between wind-driven mixing and freshwater input likely influenced regional marine ecosystems by redistributing nutrients, potentially stimulating phytoplankton growth in nutrient-rich upwelled waters. Additionally, SSS and sea surface temperature (SST) changes may have altered local climate patterns by modifying evaporation and heat fluxes, suggesting broader implications for regional climate dynamics. Further studies are needed to quantify the long-term ecological and climatic impacts of these typhoon-induced processes [
41].
3.5. Sea Current Response
The oceanographic impacts of Typhoon Khanun in October 2017 in the northern South China Sea were simulated using the Regional Ocean Modeling System (ROMS), with current speed distributions, vertical velocity profiles, and sea surface salinity (SSS) changes providing comprehensive insights. Before the typhoon, background circulation, driven by monsoons and seabed topography, exhibited stable alongshore flows with uniform current speeds of 0.1–0.3 m/s near Hainan Island and the Guangdong coast (
Figure 11). During the typhoon, current fields intensified significantly, with speeds near the Guangdong coast rising to 0.5–0.7 m/s and flow directions strengthening, reflecting robust water mass dynamics driven by typhoon winds and wave activity. At the typhoon’s peak intensity on 15 October 2017, current speeds southeast of Hainan Island reached a maximum of approximately 1 m/s, underscoring the storm’s peak disturbance.
The Regional Ocean Modeling System (ROMS) revealed vertical velocity (
w) fields indicating pronounced upwelling regions (
Figure 12), particularly on the right side of the storm track, where strong winds and low-pressure centers drove enhanced ocean mixing [
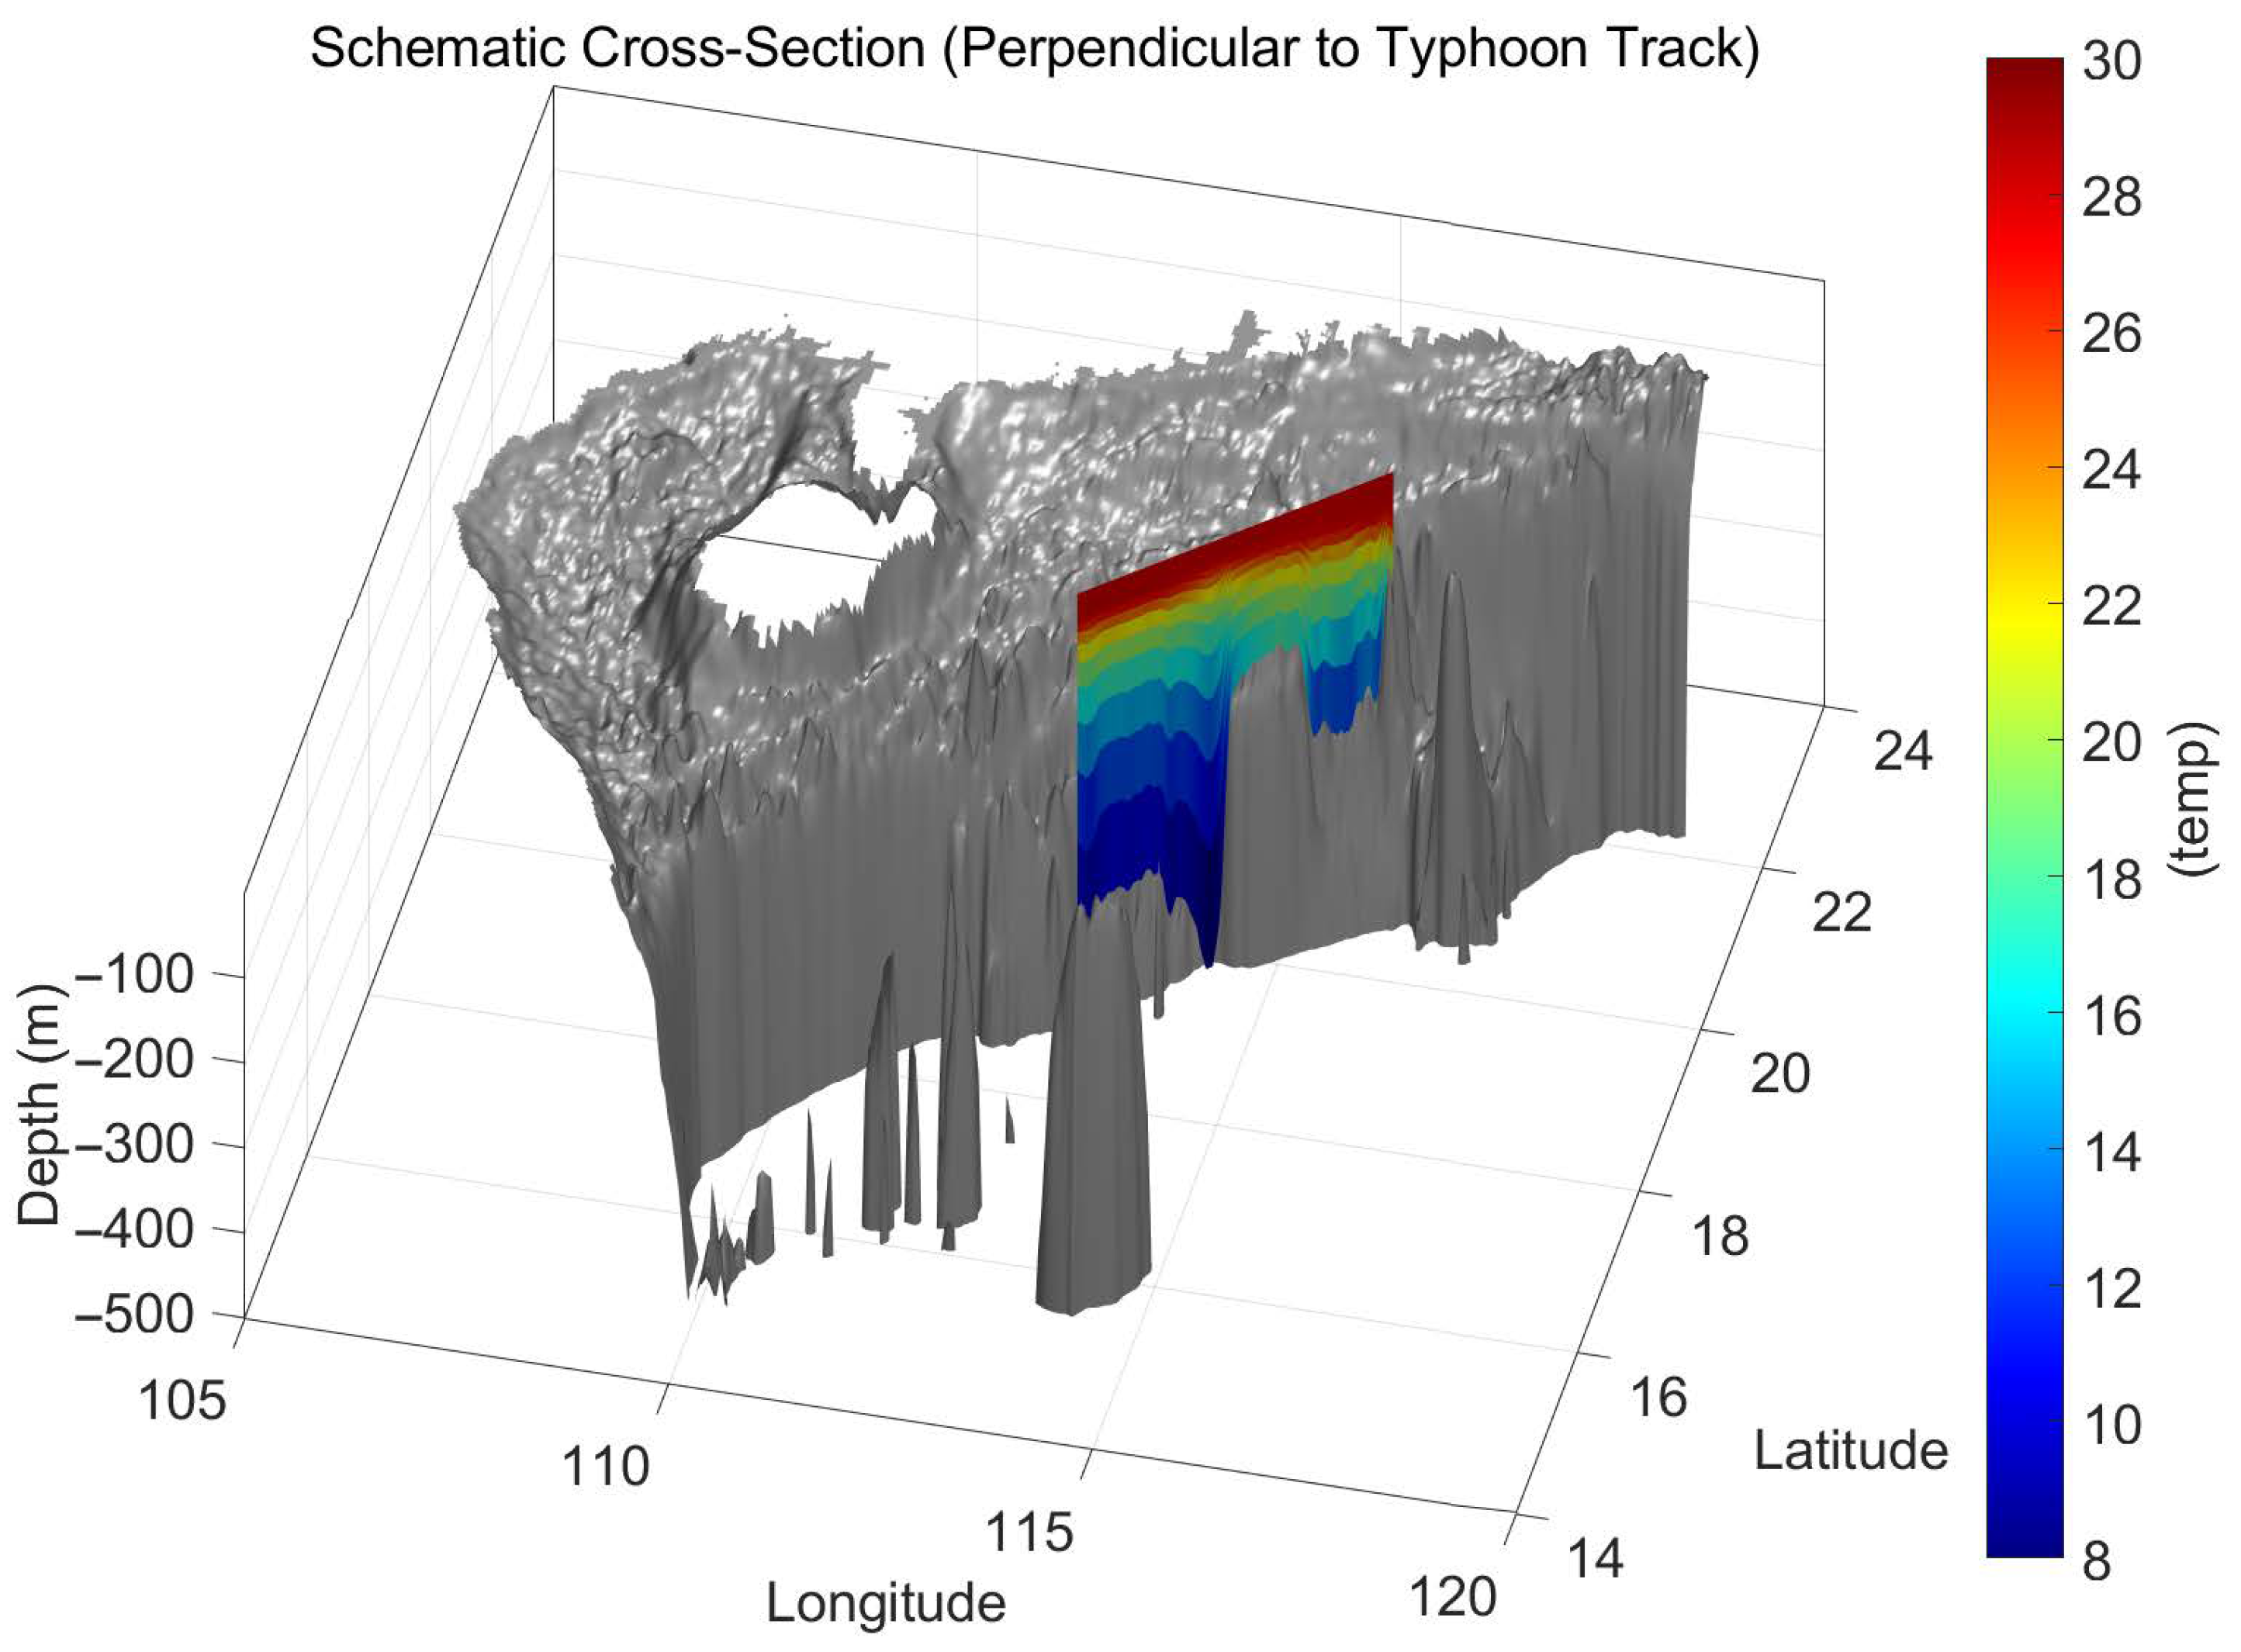
4]. From 11 to 15 October 2017, a transect perpendicular to Typhoon Khanun’s track in the northern South China Sea revealed significant upper-ocean cooling (0–70 m) and SST variations, driven by wind-induced upwelling, enhanced turbulent mixing, and freshwater input from rainfall. ROMS-derived vertical velocity profiles indicated pronounced upward and downward motions, confirming active vertical dynamics within the upper 70 m, with upwelling bringing colder, nutrient-rich deep water to the surface. We constructed a temperature profile perpendicular to the typhoon track (
Figure 13 and
Figure 14); Temperature profiles from ROMS showed substantial subsurface cooling and homogenization of the thermal structure, particularly in upwelling regions on the right side of the storm track, where cyclonic wind stress vorticity was strongest. The strongest cooling peaked 2–7 days post-passage, consistent with observations on 18 October. Upward motions facilitated cold-water upwelling, while downward motions likely represented compensatory flows or near-inertial oscillations, displacing isopycnals and the thermocline. The shallow autumn thermocline in the northern South China Sea amplified cold-water entrainment and freshwater retention, intensifying both cooling and freshening effects.
Significant sea surface temperature (SST) cooling and SSS reduction during Typhoon Khanun’s passage resulted from the synergistic effects of Ekman pumping, wave-induced mixing, and rainfall-induced freshening, all amplified by the typhoon’s strong wind field and low-pressure centers. Ekman pumping, driven by cyclonic wind stress and quantified by high Ekman Pumping Velocity (EPV) values (e.g.,
m/s on 15 October at 12:00), promoted upwelling of colder deep water, particularly on the right side of the storm track where wind stress aligned with Coriolis forcing [
22]. ROMS-derived vertical velocity fields confirmed these upwelling regions, with temperature profiles indicating subsurface cooling and enhanced mixing within the upper 70 m. The strong winds and wave action deepened the mixed layer, leading to cold-water entrainment and freshwater subduction, both of which contributed to enhanced SST cooling. These processes likely influenced regional marine ecosystems by redistributing nutrients, potentially stimulating phytoplankton growth.
During Typhoon Khanun’s passage, intense winds on the right side of the storm track generated significantly higher Ekman transport velocities compared to the left, driving pronounced Ekman pumping and upwelling in the northern South China Sea. ROMS simulations indicated vertical velocities peaking in upwelling regions beneath and slightly to the right of the typhoon center, transporting colder, nutrient-rich deep water to the surface, which contributed to SST cooling. The upwelling, most prominent on the right due to enhanced cyclonic wind stress vorticity in the Northern Hemisphere, intensified upper-ocean mixing, homogenizing the thermal and salinity structures. The synergistic effects of wind-driven Ekman processes and rainfall-induced freshening amplified the observed oceanic responses, with high EPV values indicating intense atmospheric forcing that deepened the mixed layer and enhanced nutrient upwelling. These dynamics likely stimulated phytoplankton productivity, potentially impacting regional fisheries, while SST changes may have altered local evaporation and heat fluxes, influencing regional weather patterns.
4. Conclusions
This study investigates the atmospheric and oceanic responses to Typhoon Khanun in the northern South China Sea, revealing that wind-induced mixing, upwelling, and localized precipitation were pivotal drivers of significant sea surface temperature (SST) cooling and salinity (SSS) reduction. Strong winds and low-pressure centers intensified mixing, leading to SST cooling of up to 2 °C, with spatially heterogeneous responses along the typhoon’s path. The most pronounced cooling occurred near the coastline, where bathymetric constraints amplified mixing and upwelling. Nevertheless, in certain offshore regions (e.g., 20–21° N, 115–116° E), ROMS simulations also revealed enhanced cooling on the right side of the track, consistent with the classical rightward bias of tropical cyclone–ocean interactions. This suggests that the observed asymmetry in Typhoon Khanun was shaped by both coastal modulation and intrinsic rightward enhancement, with coastal effects playing the dominant role in nearshore areas. The Regional Ocean Modeling System (ROMS) simulated vertical velocity (w) fields indicated peak upwelling rates of approximately m/s on 15 October 2017, corroborated by vertical temperature profiles that confirmed the upwelling of colder, nutrient-rich deep water to the surface, directly contributing to SST cooling. Global Precipitation Measurement (GPM) IMERG data recorded concentrated rainfall between 13 and 15 October, correlating with SSS reductions of up to 0.1 psu, as observed by NASA’s Soil Moisture Active Passive (SMAP) and ROMS data, especially in nearshore regions like the Beibu Gulf. The analysis of the ocean boundary layer revealed inertial oscillations with a period of approximately 1 day at 0–75 m depth, enhancing turbulent mixing on the right side of the track and amplifying SST cooling. Furthermore, the reduced SST influenced atmospheric energy exchange, with a 1–3 °C SST drop in the typhoon inner-core region decreasing heat flux and increasing central pressure by an estimated 9 hPa. The spatial distribution of wind speed and heat flux showed consistency, though heat flux exhibited greater sensitivity to SST variations, underscoring the critical role of ocean–atmosphere interactions. ROMS simulations demonstrated high alignment with SMAP SST and CMEMS sea surface height (SSH) data, validating the model’s accuracy in capturing typhoon-induced thermal and dynamic processes.
This research advances the understanding of typhoon–ocean interactions by integrating satellite remote sensing (SMAP, GPM) with high-resolution numerical modeling (ROMS, CMEMS), providing a comprehensive analysis of Typhoon Khanun’s impact on the thermal, salinity, and dynamic structures of the northern South China Sea. Unlike many earlier typhoon studies that employed coarser grids or uncoupled models, this work demonstrates the benefits of a 4 km horizontal grid with 40 -layers, explicit tidal forcing, and online ROMS–SWAN coupling. These advances enabled a more realistic representation of wave–current interactions, vertical mixing, and coastal modulation, which were crucial to reproducing the observed SST/SSS responses during Typhoon Khanun. The study refines the theoretical framework of typhoon–ocean coupling, particularly the synergistic effects of wind-driven inertial oscillations, precipitation, and Ekman pumping, establishing a data-driven foundation for assessing the modulation of typhoon intensity and air–sea feedback mechanisms.
The findings of this study provide robust scientific support for optimizing ocean models, particularly through the precise simulation of sea surface temperature (SST) cooling and sea surface salinity (SSS) changes induced by Typhoon Khanun in the northern South China Sea. Upwelling-induced nutrient supply may stimulate phytoplankton growth, bolstering marine productivity and informing fisheries management and ecological conservation strategies in the South China Sea. The observed SST and SSS reductions, coupled with decreased heat flux and moist static energy, weakened typhoon intensity, highlighting the pivotal role of ocean–atmosphere interactions in modulating storm dynamics. These changes also influence regional climate patterns by altering sea surface heat fluxes and evaporation rates, offering valuable insights for climate research and adaptation to extreme weather events. Future research should focus on long-term data assimilation and coupled modeling to quantify the ecological, climatic, and intensity-related consequences of typhoon-induced processes, further enhancing disaster prevention and resilience strategies.
