Article

A High-Efficiency Task Allocation Algorithm for Multiple Unmanned Aerial Vehicles in Offshore Wind Power Under Energy Constraints

College of Automation Engineering, Shanghai University of Electric Power, Shanghai 200090, China
*
Author to whom correspondence should be addressed.
J. Mar. Sci. Eng. 2025, 13(9), 1711; https://doi.org/10.3390/jmse13091711
Submission received: 4 August 2025 / Revised: 1 September 2025 / Accepted: 3 September 2025 / Published: 4 September 2025

Abstract

As wind turbines are affected by the harsh marine environment, inspection is crucial for the continuous operation of offshore wind farms. Nowadays, the main method of inspection is manual inspection, which has significant limitations in terms of safety, economy, and labor. With the advancement of technology, unmanned inspection systems have attracted more attention from researchers and the industry. This study proposes a novel framework to enable Unmanned Aerial Vehicles (UAVs) to improve their adaptability in autonomous inspection tasks on offshore wind farms, which includes multi-UAVs, inspection task nodes, and multiple charging stations. The main contributions of this paper are as follows: we propose an improved PSO algorithm to improve the location of charging stations; based on the multi-depot traveling salesman problem, we establish a multi-station UAV cooperative task allocation model with energy constraints, with the inspection time consumption of UAVs as the optimization objective; we also propose the Dynamic elite Double population Genetic Algorithm (DDGA) to aid in the cooperative task allocation of UAVs. The simulation results show that, compared with other algorithms, the proposed framework has higher universality and superiority. This paper provides a specific method for the application of unmanned inspection systems in the inspection of wind turbines in offshore wind farms.

1. Introduction

With the acceleration of the global energy transition process, offshore wind power, as an important pillar of clean energy, continues to expand in terms of installed capacity and coverage. However, offshore wind turbines (OWTs) are often deployed in harsh sea areas far from the land and are exposed to extreme environments such as strong winds, high humidity, and salt spray corrosion for a long time, which leads to frequent hidden dangers such as blade damage and mechanical failures, posing a severe challenge to the traditional manual inspection method [1]. Against this background, unmanned aerial vehicles (UAVs) have gradually become the core technical means for the detection and maintenance of offshore wind farms due to their high maneuverability, wide-area coverage capability, low operating cost, and advantage of autonomous task execution [2]. Especially the multi-drone collaborative inspection mode, through task parallelization and dynamic resource scheduling, can significantly improve the operation, maintenance efficiency, and safety of large-scale wind power clusters. However, how to achieve intelligent task allocation, path planning, and energy collaborative management of multiple UAVs in the complex and dynamic marine environment remains a key bottleneck restricting their large-scale application.
Consistent evidence has accumulated from recent reviews and case studies: Liu et al. (2022) summarized robot-based damage assessment pipelines for offshore turbines and argued that hazardous manual inspection should be substituted by robotic workflows [3]; Gohar et al. (2025) identified data quality, illumination, and class-imbalance as primary hurdles for aerial blade-defect analytics [4]; Tremps, Yeter, and Kolios (2024) highlighted monitoring-driven failure-risk mitigation on monopile OWTs [5]; Hooft Graafland and Jovanova (2024) surveyed robots interacting with offshore structures and stressed unified safety envelopes for large infrastructure [6]; within floating wind, Zhang et al. (2024) reviewed multirotor inspections and reported time/cost benefits when weather windows permit [7]; and Omara et al. (2025) advocated for multimodal drone ecosystems to consolidate visual, non-destructive testing (NDT), and logistics tasks [8]. These trends align with domain reviews that position multi-UAV coverage/path planning as the core of scalable inspection in offshore farms (Rahman et al., 2025; Foster et al., 2024) [9,10].
The particularity of offshore wind farms poses multi-dimensional constraints on UAV systems. Limited by battery capacity, the endurance of a single UAV is not high. Moreover, offshore wind farms often cover tens of square kilometers, and a single inspection requires covering multiple wind turbines. Energy supply has become the core issue restricting the continuity of the task [11]. The marine environment is highly dynamic. Sudden weather conditions (such as strong winds and heavy rain) and bird activity may interfere with the flight path of UAVs [12]. Dense nacelle–tower–blade geometries create unstructured three-dimensional spaces where UAVs must avoid static obstacles while keeping safe distances from other UAVs and temporary facilities (such as maintenance vessels). Communications and airspace constraints—well documented in wireless network deployment surveys—further shape trajectories and safe envelopes [13]. To this end, scholars have proposed deploying multiple charging stations in wind farms to enable on-farm docking or battery swapping, thereby extending operation time and reducing downtime waiting; practical docking/charging prototypes have also been reported [14,15]. However, there is a strong coupling between charging station layout and multi-UAV task allocation and path planning: poor siting induces detours that erode efficiency, while allocation strategies that ignore energy and station locations risk task interruption.
To quantify endurance–latency trade-offs, Diller and Han (2025) formulated an energy-aware fixed-trajectory planner that minimizes energy while meeting service deadlines [16]; for persistent monitoring at the farm scale, Guo et al. (2024) jointly optimized long-horizon paths and the spatial placement of charging stations—an approach transferrable to offshore farms [17]; and Salameh et al. (2024) co-optimized charging station layout with UAV trajectories and improved detection under tight energy budgets [18]. On environmental dynamics, Ma and Chen (2022) proposed an adaptive path-planning method for complex, time-varying environments [19], while Tufano et al. (2025) addressed multi-UAV coordination in dynamic, cluttered settings [20]. At the mission-system level, Fontenla-Carrera et al. (2025) showed that pairing support vessels with UAV swarms yields efficient turbine-to-turbine scheduling under sea-state and access constraints [21].
Two broad surveys—by Ghambari and Kumar (2024) and Kumar and Kumar (2023)—reported that graph-based planners scale poorly as the number of turbines and safety buffers grows, motivating learning/metaheuristics and event-driven replanning [22,23]; in response, Xia et al. (2025) proposed DyTAM, which accelerates inspections via on-the-fly trajectory reshaping under wind and queue changes [24].
The multi-UAV task allocation problem is a typical instance of multi-robot task allocation (MRTA) that seeks optimal or near-optimal schedules under safety, timing, and energy constraints; the classical MRTA literature provides the decision framework for mapping component visits to agent routes [25]. Traditional methods often model the environment as a graph G = ( V , E , W ) , where the vertices V represent task points or charging stations, the edges E represent feasible paths, and the weights W capture distance, energy consumption, or risk. Shortest or admissible paths are then obtained using Dijkstra’s algorithm and the A* algorithm [26,27]. Beyond these baselines, exact and approximate solvers for constrained vehicle routing have been adapted or are readily transferable to offshore inspection, including branch-and-cut for split deliveries [28], hybrid genetic algorithms for the multi-traveling-salesman routing [29], hybrid auction mechanisms for dynamic multi-UAV assignment [30], and cross-domain multicopter mission allocation for large-scale coverage (agriculture) [31].
For offshore inspection routing at the farm scale, practical heuristics combine spatial clustering and evolutionary search to shorten inter-turbine transfers while balancing coverage [32]. Energy and computation constraints can be incorporated via mobile-edge-computing formulations to reduce consumption without sacrificing success rates [33]. Planning is also being treated as a coupled siting–routing problem where charging/inspection waypoints and routes are co-optimized [34], and, for repetitive tasks around nacelles, towers, and blades, complete coverage path planning (CPP) provides safe and repeatable navigation patterns [35]. Cross-domain sea–air cooperation has matured: USV-assisted coverage planning has been validated with lake trials [36], and co-scheduling of USV routing with UAV swarms has been shown to reduce makespan in offshore blade inspection [37]; service-vessel deployment strategies materially affect availability and operations and maintenance (O and M) cost [38]. From an O and M perspective, Fox et al. (2022) contrasted predictive versus prescriptive doctrines and called for tighter integration of live sensing with logistics planning [39]. Sector overviews and ecosystem surveys further clarify where collaborative unmanned systems add the most value [40,41,42], while installation reviews summarize floating-wind challenges and access implications [43]. At the controller level, robust extreme learning machine (ELM)-based control improves nacelle inspection tracking of sea–air cooperative vehicles under marine disturbances [44]. Learning-based coverage can further reduce overlap in unknown layouts [45].
In recent years, intelligent optimization algorithms have provided new ideas for multi-objective dynamic optimization by simulating natural evolution or group behavior. For example, the genetic algorithm (GA) explores the solution space through selection, crossover, and mutation operations, and can effectively handle the discrete task allocation problem [46]. Particle swarm optimization (PSO) utilizes the group collaboration mechanism to optimize the parameters of continuous paths and performs outstandingly in dynamic obstacle avoidance scenarios [47]. Furthermore, scholars have proposed a hybrid strategy that integrates multiple algorithms to enhance robustness: Dudeja and Kumar combined fuzzy logic with Dijkstra’s algorithm to handle uncertainties in path planning [48], and Yao et al. improved the artificial bee colony (ABC) algorithm and introduced the time-window constraint, significantly enhancing the solution quality of the vehicle routing problem [49]. Sequence-to-sequence multi-agent reinforcement learning has also been explored for multi-UAV task planning in three-dimensional dynamic environments [50].
In terms of energy constraints, Zhu et al. [46] proposed an energy consumption balance model for the task allocation of multiple unmanned vessels. He et al. [47] explored a joint optimization framework for UAV task unloading and charging, providing an important reference for energy collaborative management. In response to the real-time response requirements of emergent tasks (such as wind turbine failure alarms) in offshore wind farms, Xiaojun Duan et al. [48] proposed a hybrid auction algorithm, which combines the traditional auction mechanism with the distributed coordination strategy to achieve dynamic task allocation for multiple UAVs. The multi-UAV task allocation and path planning model proposed by Huang et al. [49] for pesticide spraying tasks provides a cross-domain reference for wind farm inspection. Aiming at the high complexity problem of task allocation in large-scale wind farms, the branch cutting algorithm proposed by Archetti et al. [51] provides a new idea for a precise solution. Nevertheless, there are still significant gaps in the existing research: 1. There is insufficient research on the collaborative optimization of power station layout and task allocation. Most models assume that the locations of charging stations are fixed and known, but in actual scenarios, both need to be jointly optimized to maximize system efficiency. 2. The algorithm has limited adaptability to the dynamics of the marine environment and lacks adaptability to different numbers of UAVs.
To solve the coordination problems of multiple UAV energy constraints and multiple charging stations, a task allocation strategy for the inspection of offshore wind farms based on multiple charging stations is proposed. The main contributions of this article include the following:
  • An improved Particle Swarm optimization algorithm (IPSO) is proposed to optimize the location of charging stations. An innovative UAV task allocation optimization algorithm is developed by adopting the dynamic elite group double population mechanism genetic algorithm (DDGA), which has good high-quality disorientation and excellent global search ability.
  • The location optimization function of the charging station and the task allocation optimization model of UAVs with multiple charging stations under energy constraints are established, enabling UAVs to charge dynamically at different locations and optimize task execution. This model balances factors such as task completion time, workload allocation among UAVs, and energy consumption, ensuring that UAVs effectively perform tasks while maintaining the optimal battery power through the strategic use of the charging station.
  • We conduct simulation experiments on the position optimization of charging stations and the task allocation of UAVs with multiple charging stations under energy constraints to verify the proposed task allocation model and optimization algorithm. These experiments proved the effectiveness of the proposed solution in real-world scenarios and compared the performance of the UAV system under different conditions.
The rest of this article is organized as follows. Section 2 analyzes the construction of the objective function for optimizing the location of charging stations and the inspection allocation model of multi-charging stations under energy constraints, and constructs a mathematical model. Section 3 summarizes the methods proposed in this paper, specifically introducing IPSO and DDGA. Section 4 designs specific experimental cases to conduct simulation experiments on the proposed algorithms and models. Section 5 designs specific simulation experiments to verify the validity and universality of the model, while Section 6 summarizes the work of the entire paper.

2. Multi-Station UAV Cooperative Task Allocation Model

In this section, we proposed a multi-station UAV cooperative task allocation model to optimize task allocations for UAVs during offshore wind farm inspections. The core objective of this model is to ensure that UAVs successfully complete allocated tasks and safely return to charging stations without depleting their battery power. This is accomplished through the multiple charging stations distributed across the task area, enabling UAVs to recharge as needed during missions.
The point set S is used to represent the key points in the task area and is denoted as S = { s 1 , s 2 , s m , s m + 1 , s m + 2 , , s n + m } , where S 0 = s 1 , s 2 , S m represents the charging station set and S p = s m + 1 , s m + 2 , , s m + m represents the task point set. The set of UAVs is represented as A = { a k | j = 1 , 2 , , K } , where K represents the number of UAVs. UAVs conduct inspection missions in a two-dimensional plane. Each vehicle carries a receiver to acquire sensor data from wind power base stations and travels at speed v. Let S R 2 be the set of points and a k the k-th UAV. Define a binary routing variable x i j k { 0 , 1 } for i , j S with i j . The assignment x i j k = 1 indicates that a k visits point i immediately before point j. For kinematic modeling, when a k traverses the arc i j , we discretize this segment into waypoints n 1 , n 2 , , n h , n h + 1 , n h + 2 , , n N k ,
Assuming that the flight altitude of the UAV remains constant, the task area is modeled as a two-dimensional (2D) sea surface area. Uncertainty due to wind or turbulence is introduced only in the simulation layer as a multiplicative perturbation on the energy-equivalent consumption, while kinematic travel time remains deterministic. For a flight leg i j with baseline time t ¯ i j , the realized consumption used to update the endurance budget is
t ˜ i j flight = t ¯ i j max { 0 , 1 + ξ i j } , ξ i j N 0 , σ flight 2 ,
The travel time itself is kept as t i j = t ¯ i j , where i , j S index spatial nodes; t i j denotes the deterministic kinematic travel time; t ¯ i j is its baseline value; t ˜ i j flight is the energy-equivalent consumption used to update the endurance budget; ξ i j N ( 0 , σ flight 2 ) are i.i.d. Gaussian factors with standard deviation σ flight ; and the operator max { · , 0 } prevents negative consumption.
Each task node incurs a fixed inspection dwell time t ins = 5 min to receive the stage data from the fan sensor that is added deterministically to the makespan. At the same time, take a simple photo of the condition of the wind turbine blades. Its energy-equivalent consumption is perturbed as
t ˜ ins = t ins max { 0 , 1 + ζ } , ζ N 0 , σ ins 2 ,
which enters the endurance update as w i k = y i k t ˜ ins when i S p is inspected. We use σ ins = 0.05 by default. Random factors are independent across legs, tasks, and runs.
Figure 1 illustrates the mission execution process, in which the charging stations act as the take-off and landing points for the UAVs. They arrive at the task points in sequence and use the receivers they carry to collect wind turbine data.The red arrows in the figure indicate the path of the drone before charging, while the blue arrows indicate the path of the drone after charging and its return to the non-fixed charging compartment.

2.1. Optimization of Charging Station Locations

Considering the need for timely data acquisition and cost-effective autonomy, this study focuses on optimizing charging station placement, improving inspection performance, and ensuring the safety of UAV operations.
For the sea surface area, the wind turbine task points are distributed within the two-dimensional task area. S 0 = { s 1 , s 2 , s m } represents the charging stations and S p = { s m + 1 , s m + 2 , , s n + m } represents the task points. The Euclidean distance between all points is denoted as D i s ( i , j ) .
The construction of the objective function needs to comprehensively consider multiple aspects, such as the execution efficiency of the inspection task, the reasonable location of the charging stations, and the balance of the task. To ensure the smooth execution of inspection tasks and optimize the overall operational efficiency, this paper constructs the objective function from the following three aspects:

2.1.1. Minimize the Safe Charging Distance

Optimize the location of the charging station to fully consider the endurance safety of the UAVs, enabling the UAVs to access the charging station optimally during the inspection task execution and reduce unnecessary range loss.
f 1 = d i
where d i represents the flight distance from point s i to the nearest charging station. i S .

2.1.2. The Balance of the Pre-Allocated Task Distance of the Charging Station

Optimize the charging station’s location, fully consider the balance of the inspection distance of the surrounding wind turbine task points, and prevent the situation where the pre-allocated tasks of a single UAV are too heavy.
f 2 = max ( D i )
where D i represents the total pre-inspection distance from the i-th charging station to the nearest wind turbine task point.
D i = d a , b · x a , b
where a , b S i . S i represents the set of task points closest to the charging station i. d a , b represents the Euclidean distance between task point a and task point b. x a , b is a binary decision variable. When conducting the pre-inspection, the UAV selected this path, x a , b = 1 . Otherwise, it is 0.

2.1.3. The Balance of the Pre-Allocation of the Number of Task Points

Optimize the location of charging stations to ensure the balance of the number of surrounding fan task points, prevent the accumulation of task points near the charging station, and avoid unreasonable charging station location.
f 3 = 1 m i = 1 m ( g i g ¯ ) 2
where G i is a set representing the set of task points that are closest to the i-th charging station. g i = G i represents the number of task points that are closest to all charging stations. g ¯ represents the average value of all g i . m represents the number of charging stations.
Based on the above three optimization directions, the final weighted multi-objective optimization function is constructed as
min F = w 1 f 1 + w 2 f 2 + w 3 f 3
where F is the overall objective function. w 1 , w 2 , and w 3 are the weight coefficients of each sub-item and satisfy
w 1 + w 2 + w 3 = 1 , w i [ 0 , 1 ]

2.2. Kinematics Model and Performance Constraints of Four-Rotor UAV

2.2.1. Kinematic Model

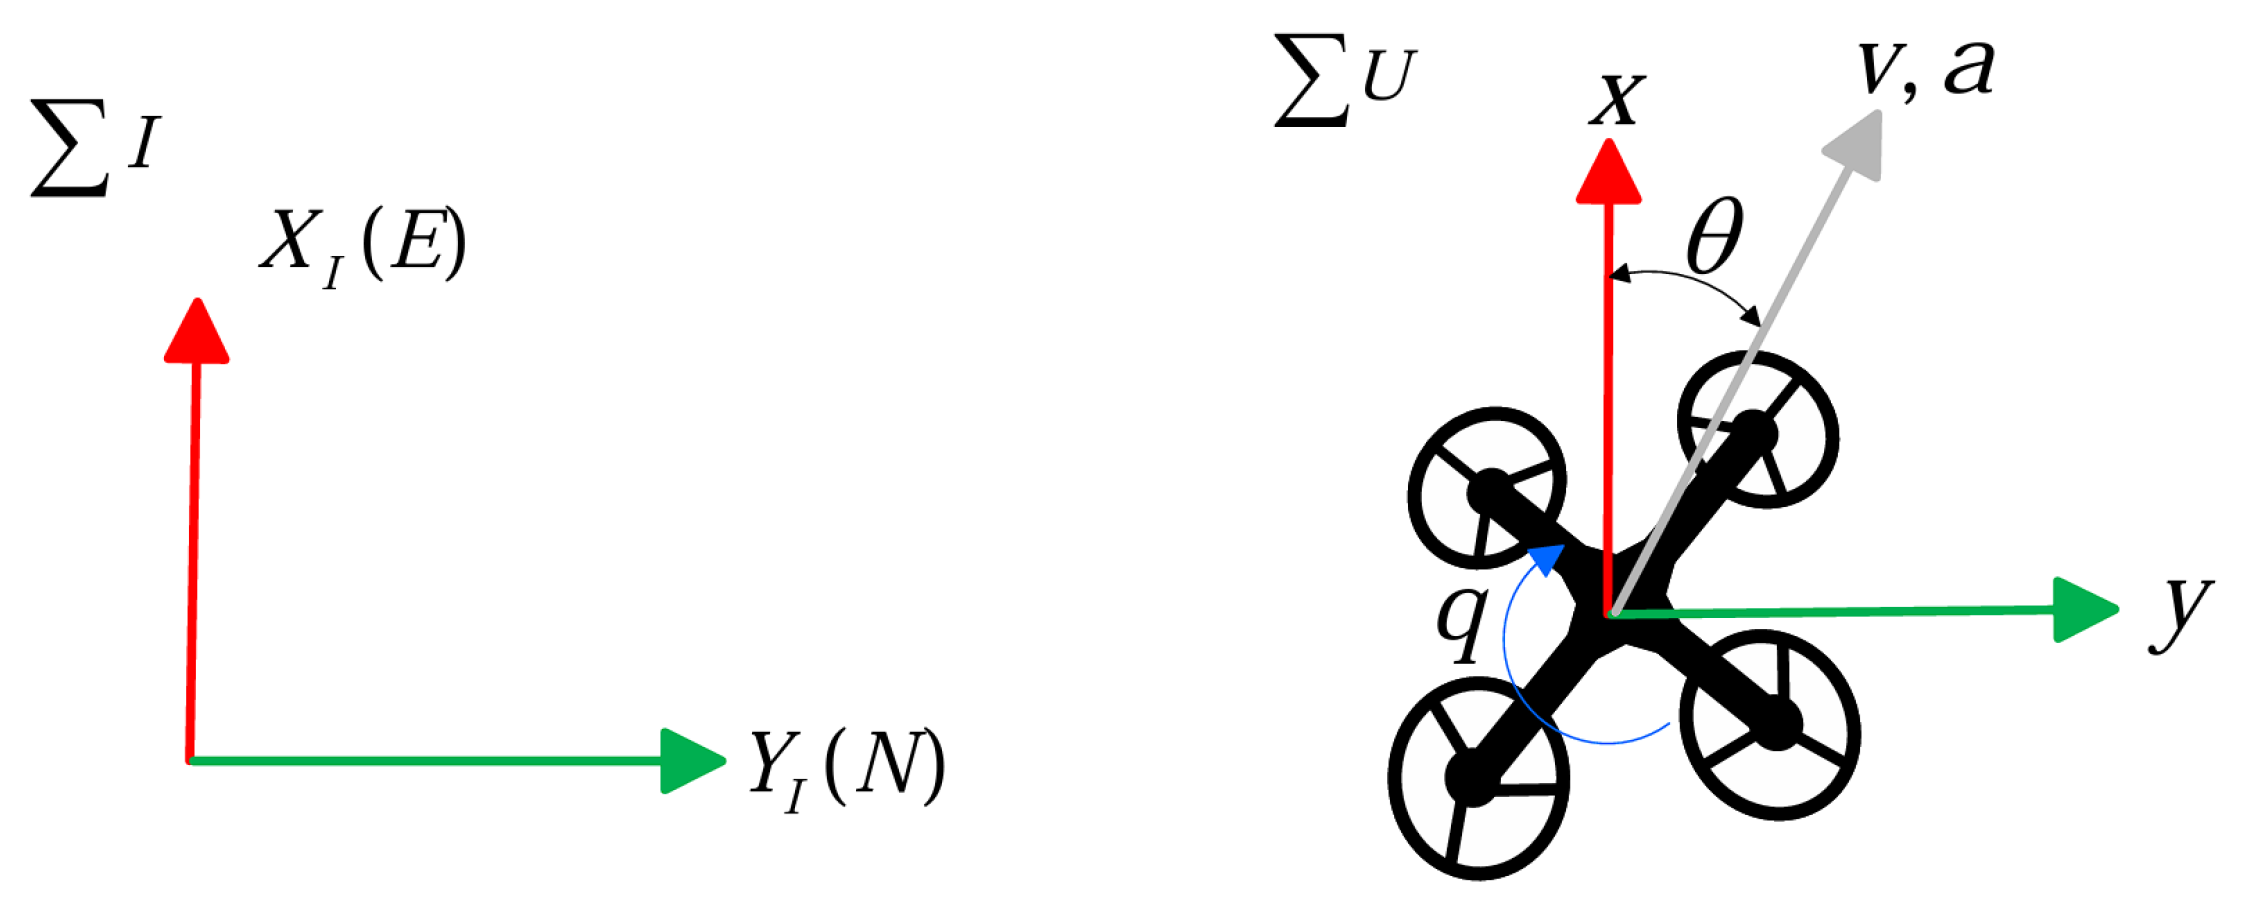
The UAV kinematics are formulated under a constant–altitude assumption, so motion is confined to a two-dimensional plane. Let Σ I denote the inertial (earth-fixed) frame and Σ U the quadrotor body frame. As illustrated in Figure 2, the vehicle’s position in Σ I is ( x , y ) . Equation (9) specifies the relation among the linear speed v, yaw angle θ , yaw rate q, and linear acceleration a.
x ˙ = v cos θ y ˙ = v sin θ v ˙ = a θ ˙ = q

2.2.2. Constraint Conditions

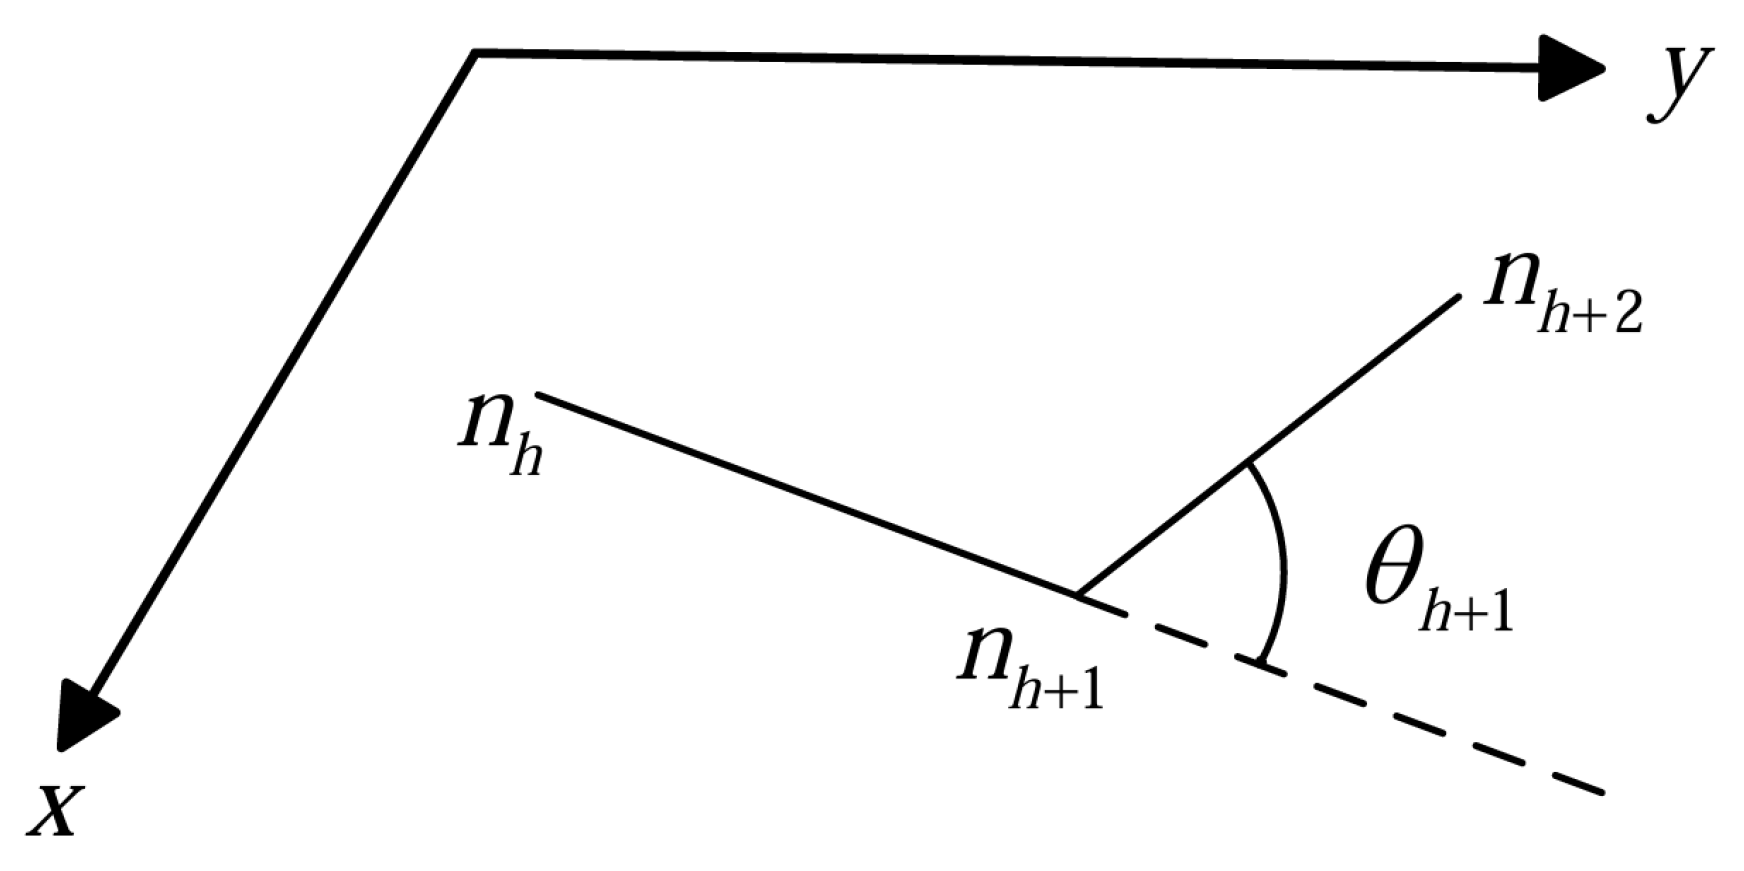
As mentioned at the beginning of Section 2, when the UAV travels from point i to point j, n h , n h + 1 , and n h + 2 are any three consecutive waypoints that the UAV passes through along this path, and it is assumed that there are a total of N u waypoints. The distance from i to j of the UAV is expressed as d i , j , and its calculation equation is as follows:
d i , j = l = 1 N u n h n h + 1
Figure 3 shows the yaw angle of the UAV. The performance constraints are as follows:
θ h = arctan ( n h 1 n h × n h n h + 1 n h 1 n h · n h n h + 1 )
Equation (11) constrains the maximum yaw angle of the UAV to prevent it from deviating from the preset direction.

2.2.3. Nonlinear Charging Time Model

Let the arrival state-of-charge (SoC) be s 0 = y i k / E [ 0 , 1 ) . The time to charge from s 0 to the target SoC s T ( 0 , 1 ] is
t chg ( s 0 ) = 0 , s 0 s T , α cc ( s T s 0 ) , s T s cv and s 0 < s T , α cc ( s cv s 0 ) + k cv ln 1 s cv 1 s T , s 0 < s cv < s T , k cv ln 1 s 0 1 s T , s cv s 0 < s T ,
where α cc is the CC-stage time per unit SoC, k cv is the CV-stage time constant, and s cv ( 0 , 1 ) is the CC→CV threshold. After charging, the endurance budget is reset to s T = E . E represents the maximum battery life.

2.3. UAV Inspection Model with Charging Constraint

In this section, we introduce a multi-charging station inspection allocation model, aiming to optimize the task allocation of UAVs in the inspection of offshore wind farms. The core objective of this model is to ensure that the UAVs can successfully complete the allocated tasks and safely return to the charging station without running out of battery power. This is accomplished through the multiple charging stations distributed across the task area, allowing the UAV to charge as needed during the mission.
This model takes into account key operational constraints, including the capacity of the charging station, which determines the number of UAVs that can take off or land on each point, as well as the limited battery power of the UAVs, which affects the maximum flight time and task coverage. By ensuring that the UAV can always reach the charging station after completing the allocated tasks, this model effectively balances task execution and battery power management, thereby optimizing the operational efficiency and safety of the UAV in the marine environment.
This method enables the UAV to perform inspection tasks for a long time without the risk of power depletion, while maintaining effective task allocation, taking into account battery consumption and charging station availability.
If only set theory and natural language are used to describe the problem, it will be difficult to capture its characteristics comprehensively and accurately. To solve this problem, the authors of the references in this paper (Dudeja and Kumar [48], Al-Furhud and Ahmed [29], Yao et al. [49]) constructed the mathematical models of the multi-charging station traveling salesman problem and the unmanned aerial vehicle routing problem. In this study, the influence of the capacity limitation of the charging station and the endurance capacity of UAVs on the optimization problem of the collaborative inspection path of multiple UAVs was considered. The evaluation settings minimize the time required to complete all tasks.
In order to construct an optimization model for multi-UAV collaborative inspection and charging scheduling, the basic set and parameters are defined first. Let A = { a k | k = 1 , 2 , , K } represent the set of UAVs, and each element a k represents a UAV. The set of charging stations is denoted as S 0 = { s 1 , s 2 , s m } , where m is the number of charging stations. The set of task points is S p = { s m + 1 , s m + 2 , , s n + m } , where n represents the total number of task points. The complete set composed of all spatial points is S = S 0 S p = { s 1 , s 2 , , s m + n } , and the path set is P = { ( s i , s j ) | s i , s j S , i j } , representing all possible flight routes. The parameters involved in the model include the maximum capacity C of each charging station, that is, the maximum number of UAVs that can be accommodated simultaneously. The maximum endurance time of each UAV is E, the flight speed is v, the distance the UAV travels from point s i to point s j is d i j , and the time it takes for the UAV to fly from point s i to point s j is t i j = d i j v . Let d i represent the shortest distance from point s i to the nearest charging station, and τ 0 represent the time required for each charge. To facilitate the linearization of constraints, a sufficiently large constant M is introduced.
In terms of decision variables, let x i j k { 0 , 1 } represent whether the UAV a k flies from point s i to point s j . If so, it is 1. Otherwise, it is 0. Let u k represent the total task completion time of drone a k . c i k { 0 , 1 } indicates whether the UAV is being charged at charging station s i . z k S 0 is the charging station where the UAV eventually returns. T i k represents the time when UAV a k arrives at point s i . y i k represents the remaining endurance time of UAV a k when it reaches point s i .
This model aims to optimize the collaborative task allocation of multiple UAVs, minimizing the maximum task completion time among all UAVs, thereby achieving task load balancing and efficient resource utilization. The objective function is as follows:
min P = max ( u 1 , u 2 , u 3 , , u k )
To ensure the unique allocation of tasks, the connectivity of paths, and the rationality of endurance and charging constraints, the model introduces the following linear constraints. The task access constraint requires that each task point can only be accessed once by a unique UAV.
k = 1 K s i S , s i s j x i j k = 1 , s j S p
The path continuity constraint ensures that the number of entries of each UAV at each task point is equal to the number of departures:
s j S x i j k = s j S x j i k , s i S , a k A
To avoid congestion at charging stations, the number of drones that each charging station can serve simultaneously shall not exceed its capacity limit:
k = 1 K c i k C , s i S 0
In terms of energy constraints, when the UAV flies from s i to s j , the remaining battery power upon its arrival must meet the flight requirements of this segment:
t i j · x i j k y i k + M · ( 1 x i j k ) , k A , ( s i , s j ) P
Meanwhile, to ensure the emergency return capability, the remaining battery power at point s j should be at least greater than the shortest distance that flies back to the nearest charging station from this point:
y j k d j M ( 1 x i j k ) , k A , ( s i , s j ) P
When each UAV departs from its initial charging station, the battery level is at the maximum endurance value:
y i k = E , s i S 0 , k A
If the drone is charged at a certain charging station, its battery power should be reset to the fully charged state:
y i k E · c i k , s i S 0 , k A
Conversely, if it is not charged, the upper limit of its battery capacity cannot exceed the maximum value:
y i k E + M ( 1 c i k ) , s i S 0 , k A
The power update constraint ensures the logic of decreasing power of the UAV after flight:
y j k y i k t i j · x i j k + M ( 1 x i j k ) , k A , ( s i , s j ) P
y j k y i k t i j · x i j k , k A , ( s i , s j ) P
The working time is defined as the time when the UAV reaches its final return charging station z k :
u k = T z k , k A
Furthermore, to ensure the rationality of variable values, the model sets clear value ranges for different variables. The path selection variable x i j k { 0 , 1 } , indicating whether to fly from point s i to point s j , is a Boolean variable. The charging decision variable c i k { 0 , 1 } indicates whether to charge at the charging station s i and is also a Boolean variable. The charging station variable z k finally returned by the UAV is a discrete variable, and its value range is limited within the charging station set S 0 , that is, z k S 0 .
Other variables such as the time t i j required for the UAV to fly from point s i to s j , the time T i k to reach a certain point, and the remaining endurance time y i k , etc., are all non-negative real number variables, which are used to precisely describe the mission execution process and battery power changes of the UAV. The working time variable u k is also a non-negative real number, representing the total time required for the execution of the UAV task.

3. Proposed Method

The collaborative task allocation scheme for the maritime multi-warehouse unmanned system is executed in two phases. Phase I determines the point set S 0 using the charging station placement optimization model introduced in Section 2.1. To ensure the feasibility of the task allocation model and the reproducibility of the experiments, the task area and wind turbine task points were predefined before simulation, simulating the spatial distribution characteristics of a typical offshore wind farm. n represents the number of two-dimensional task points. The set S 0 contains the coordinate information of the charging stations. The coordinates of the charging stations are determined using the IPSO algorithm, as described in Section 3.1.

3.1. Optimized Charging Station Location Algorithm Based on IPSO

We enhance conventional PSO by incorporating an elite reverse-learning component. The choice of PSO reflects its minimal tuning demands, simple update structure, practical implementation, and rapid computation. At each step, based on the previous generation, node coordinates are updated through the velocity and position Equations (25) and (26).
v i d i t e r = ω v i d i t e r 1 + c 1 r 1 ( p b e s t i d x i d i t e r 1 ) + c 2 r 2 ( g b e s t i d x i d i t e r 1 )
x i d i t e r = x i d i t e r 1 + v i d i t e r
where x i d ( iter ) and v i d ( iter ) denote the position and velocity of particle i on dimension d after iter iterations. The terms p b e s t i d and g b e s t i d are the particle’s personal best and the swarm’s global best, respectively. The acceleration coefficients c 1 (cognitive) and c 2 (social) are real scalars, typically chosen in the range 1 c 1 , c 2 4 . The random factors r 1 and r 2 are diagonal matrices whose diagonal entries are i.i.d. samples from the uniform distribution on [ 0 , 1 ] . In the velocity update, the term ω v i d ( iter 1 ) is the inertia component that preserves the previous motion, the second term is the cognitive component drawing particle i toward its personal best, and the third term is the social component attracting it toward the swarm’s global best.
However, in the instances considered here, vanilla PSO is prone to premature convergence. The cognitive component has limited influence, and in the absence of a mutation mechanism, the swarm’s search is dominated by interaction and competition, allowing particles to settle in local optima. We address this by introducing an elite reverse-learning scheme that enhances global search capability.
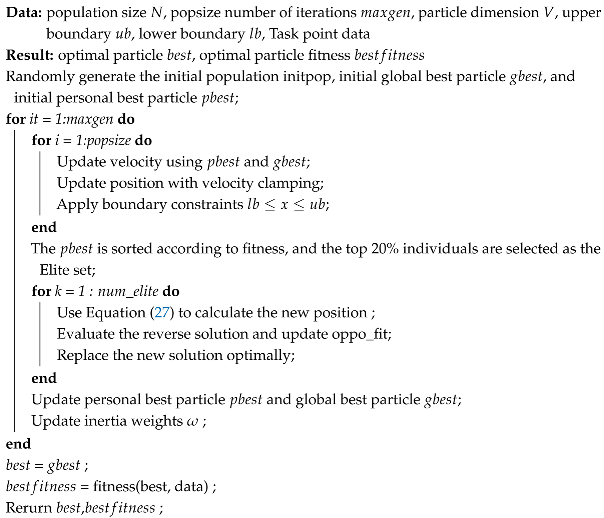
After each update of the particle population, the top 20 percent of the optimal individuals in the population will be selected to implement the search strategy based on elite reverse learning. Each coordinate in each particle is regarded as a charging station representing a particle point distribution. When implementing the search strategy based on elite reverse learning, the coordinates of the particles are updated according to Equation (27).
x e k = x min + x max x i d k
where x e k represents the position of the particle after reverse learning, and x min and x max are the upper and lower limits of the range.
The pseudo-code of the IPSO algorithm is shown as Algorithm 1.
Algorithm 1: IPSO algorithm
Jmse 13 01711 i001

3.2. Multi-Uav Task Allocation Algorithm Based on DDGA

GA is a classic heuristic optimization algorithm based on the principle of biological evolution, which simulates the genetic mechanism of “survival of the fittest” in nature. The algorithm simulates the process of chromosome selection, crossover, and mutation, screens individuals with high fitness in the iteration, and reorganizes their genetic information, gradually evolving towards the global optimal solution. The algorithm balances global exploration and local development through the roulette selection mechanism, achieving refined search of the solution space while preserving the diversity of the population.
DDGA adopts the dynamic elite group strategy and the dual-population mechanism, and has a good ability to guide high-quality solutions and a very good global search ability. For the problems in this paper, the encoding, crossover, and mutation methods of the algorithm are considered first.

3.2.1. Coding

Chromosome encoding constitutes a key aspect of GA, representing the solution to a given problem in the form of chromosomes. Common encoding methods include integer encoding and piecewise encoding. When representing the solution space of a problem, the selection of encoding methods must take into account description completeness, legality, and feasibility. In integer encoding, each gene in a chromosome corresponds to a task, and the contained information is represented by ( x , y ) . This indicates that task x was allocated to drone y for execution. The length n represents the total sum of the total number of tasks required to be executed. This encoding method is helpful for direct expression, but it lacks certain information. In this study, the piecewise coding method was utilized to divide the chromosomes into segments A and B for multi-dimensional optimization. It regards the collaborative task allocation problem within unmanned systems as two sub-problems: the task of each UAV (A) and the task execution sequence of each UAV (B).
As shown in Figure 4, segment A, as the core structure of the chromosome, provides the main task allocation plan. Segment B is an auxiliary structure, which supplements the missing path information and provides a path solution. Their lengths are specified as X A and X B . Both segment A and segment B have lengths equal to the total number of tasks, with segment A containing the identifiers of the UAVs. Segment B is a random permutation of n consecutive integers. The task execution order of the UAVs in segment A is determined by sorting A according to the corresponding values in segment B.
As illustrated in Figure 5, assuming n = 8 and the number of task points is also 8, the total chromosome length is 16. According to segment A, task points 2, 5, and 6 are assigned to UAV 1. Their corresponding values in segment B are 1, 8, and 7, respectively. Sorting these values yields the task execution sequence as 2, 6, 5. Similarly, task points 1 and 7 are assigned to UAV 2, with corresponding values 4 and 6 in segment B, resulting in the execution order 1, 7. Task points 3 and 8 are assigned to UAV 3, with B values 5 and 3, leading to the execution order 8, 3. Task point 4 is assigned to UAV 4, and since its corresponding B value is 2, the execution order is simply 4.

3.2.2. Crossover Operation

Crossover serves to transmit high-quality loci from parents, making it critical for overall performance. In this study, chromosomes are piecewise coded, and segment-dependent crossover operators are chosen based on gene attributes. After crossing, every offspring is checked to remain entirely valid.
  • The A segment of the chromosome contains information about the task allocation of UAVs. For this segment, after the initial crossover, genetic testing ensures that each UAV identifier exists in the chromosome. Avoid the situation where UAVs have no task. In the crossover operation, a uniform crossover strategy is adopted, guided by a predefined crossover probability P. For each gene position, a chaotic random number is generated to determine whether a crossover should occur. If the chaotic random number exceeds P, the genes at the corresponding position in the two parent chromosomes are exchanged; otherwise, the genes remain unchanged. An illustrative example of this uniform crossover process is presented in Figure 6.
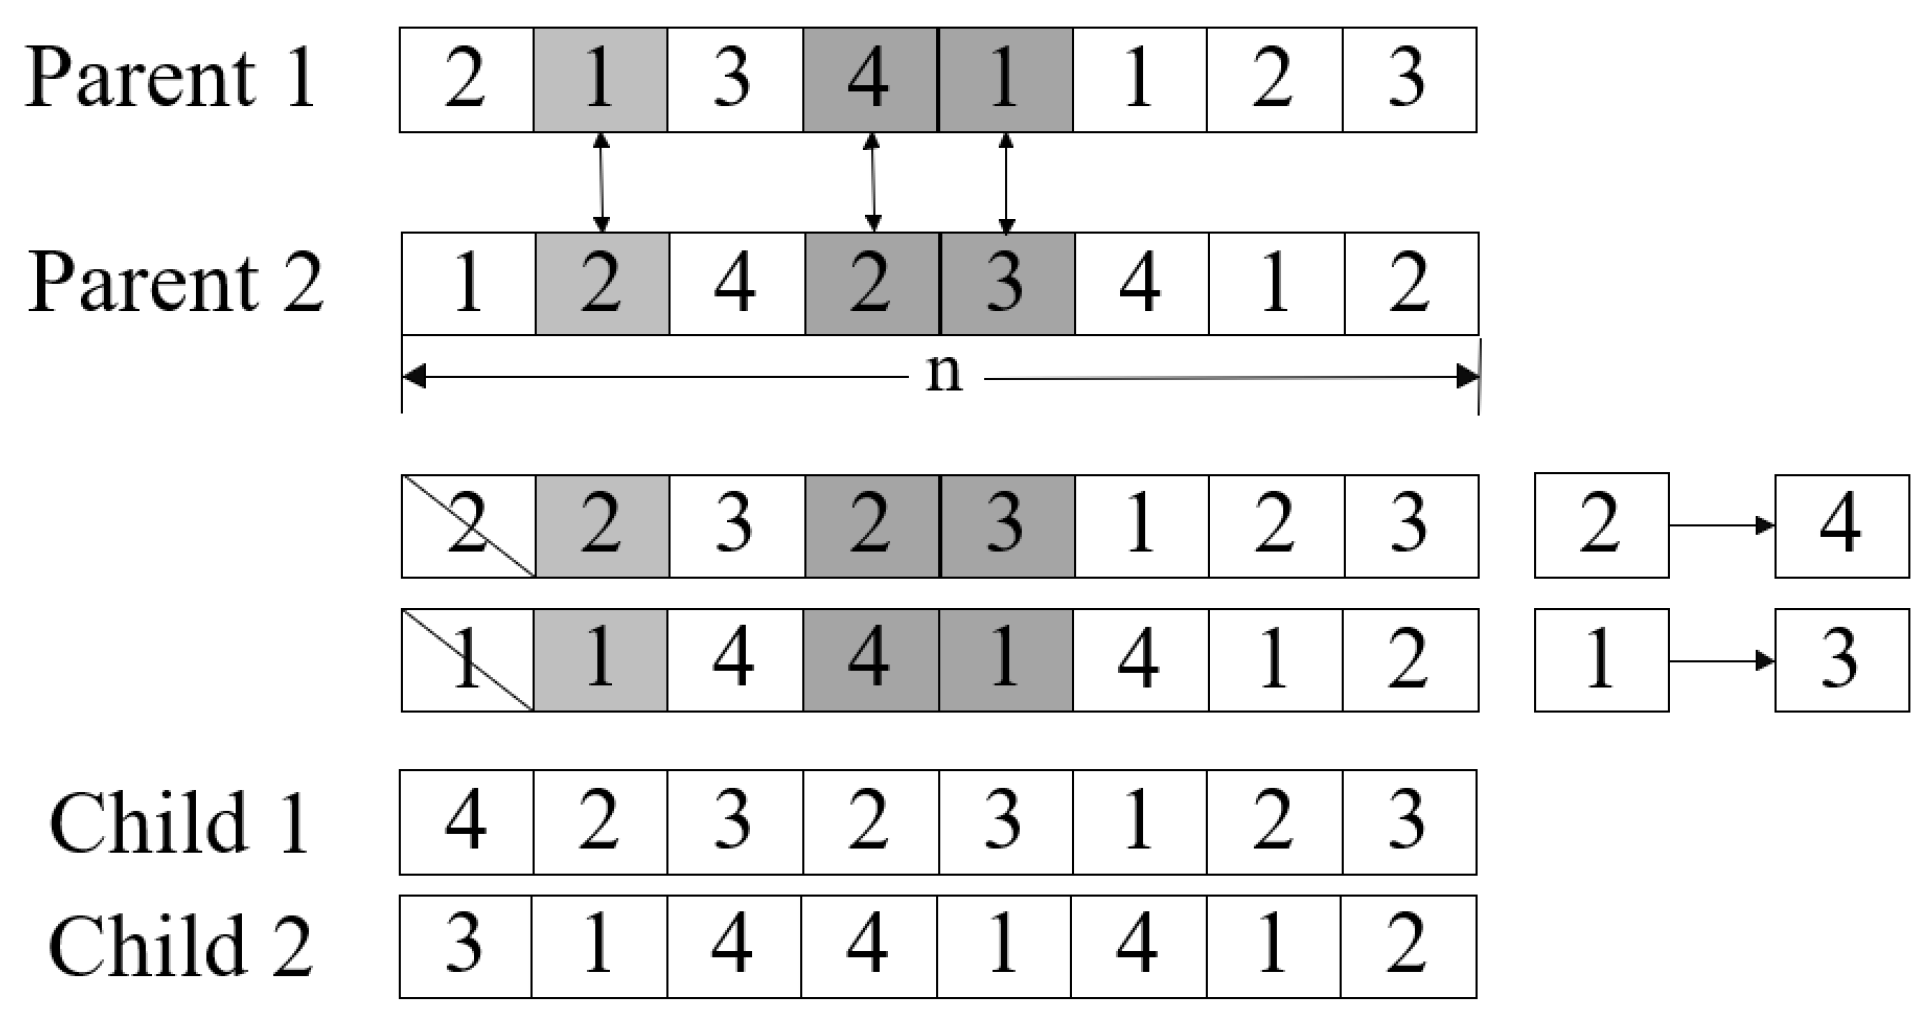
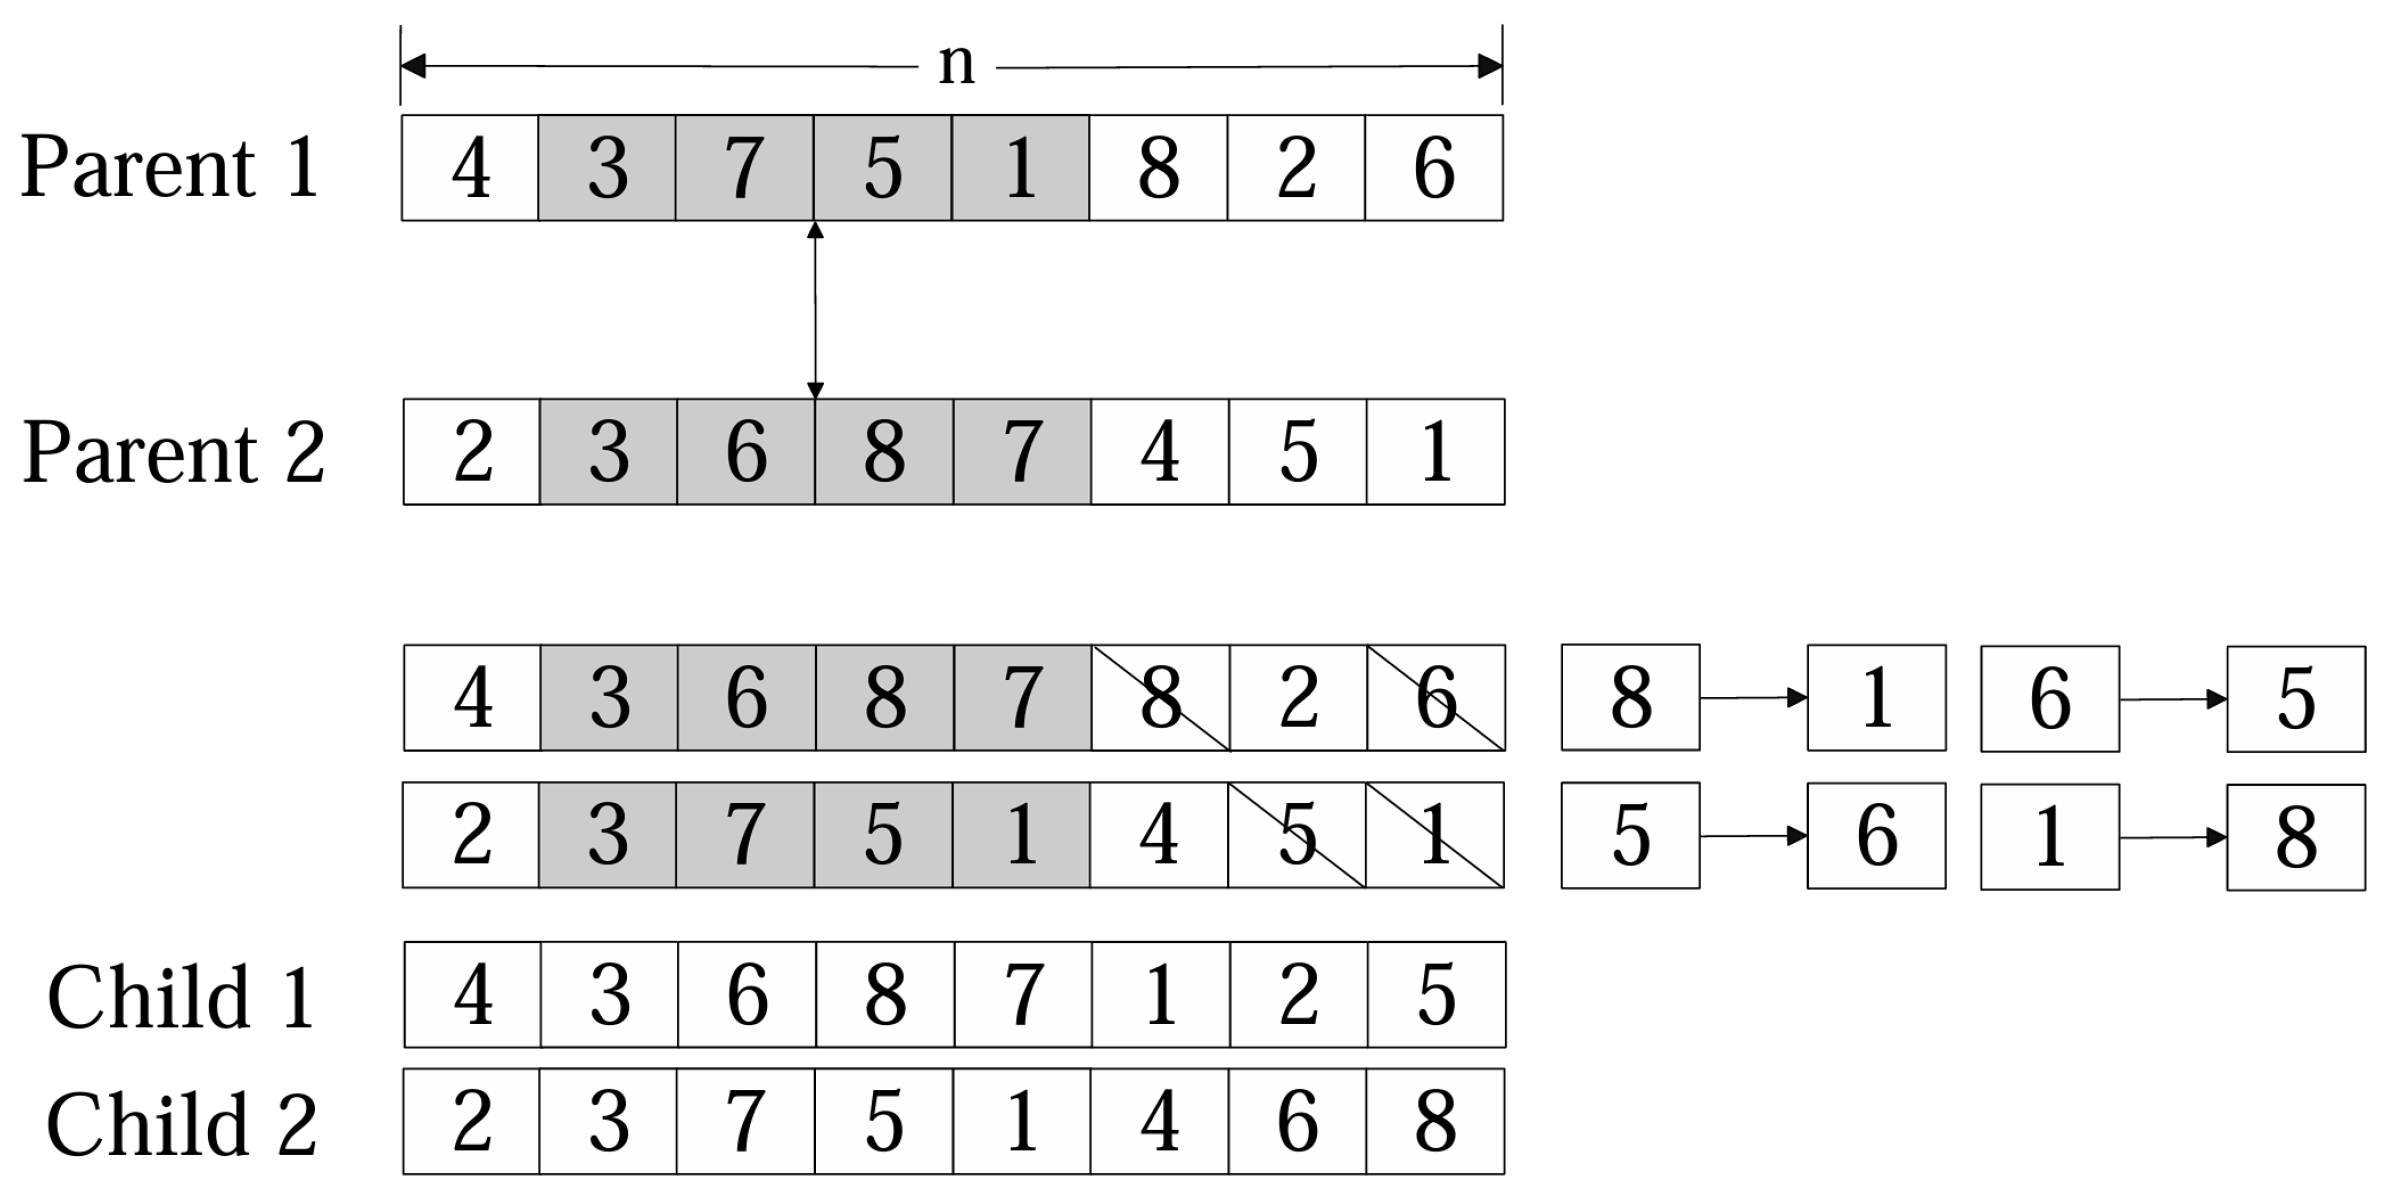
  • The B segment of the chromosome contains information about the execution sequence of the task points of the UAV. For chromosome B, we use PMX to ensure that every gene occurs once and only once, preventing intra-chromosome repetition. A sample partial crossover is depicted in Figure 7.

3.2.3. Mutation Operation

  • In segment A, mutation is carried out using a random scheme (Figure 8): x gene positions are sampled uniformly and replaced with admissible unmanned system identifiers.
  • For segment B, insertion mutation is used, as illustrated in Figure 9; one gene is randomly selected from the segment and reinserted at a different random index within that segment.

3.2.4. Proposed DDGA

To enhance population diversity and improve the global search capability, the DDGA incorporates a dual-population mechanism. Population N a and population N b are, respectively, responsible for the development and exploration of the algorithm, ensuring that the population can take into account both global and local search capabilities. Meanwhile, in the context of using unmanned systems for inspection task allocation, due to the large number of task points, the demand for diversity is relatively important in order to quickly find high-quality solutions. In this study, a higher probability variation P m 2 was adopted for the population N b responsible for exploration to ensure higher diversity. Meanwhile, N a uses the mutation probability P m 1 of the traditional GA.
Meanwhile, this study integrates a dynamic elite set mechanism into the GA. The main function of the elite group is to guide the search direction, thereby accelerating the approach to the global optimal direction. However, in the traditional GA, the parent individuals lack the diversity of high-quality solutions, and the number of individuals in the usual elite group does not change, which limits the diversity of the population to a certain extent. In this study, the dynamic elite set mechanism was used. With the increase in the number of iterations, the proportion of elite individuals was gradually reduced. The method for calculating the number of elite groups is as follows:
N e l i t e ( t ) = N p o p × ( 1 t T max ) × γ
where N p o p represents the total population size, T max represents the maximum number of iterations, and γ represents the elite decay factor. Retain a large number of elites in the early stage to enhance the overall exploration ability. In the later stage, reduce the number of elites and focus on local development and convergence.

3.2.5. Algorithm Step

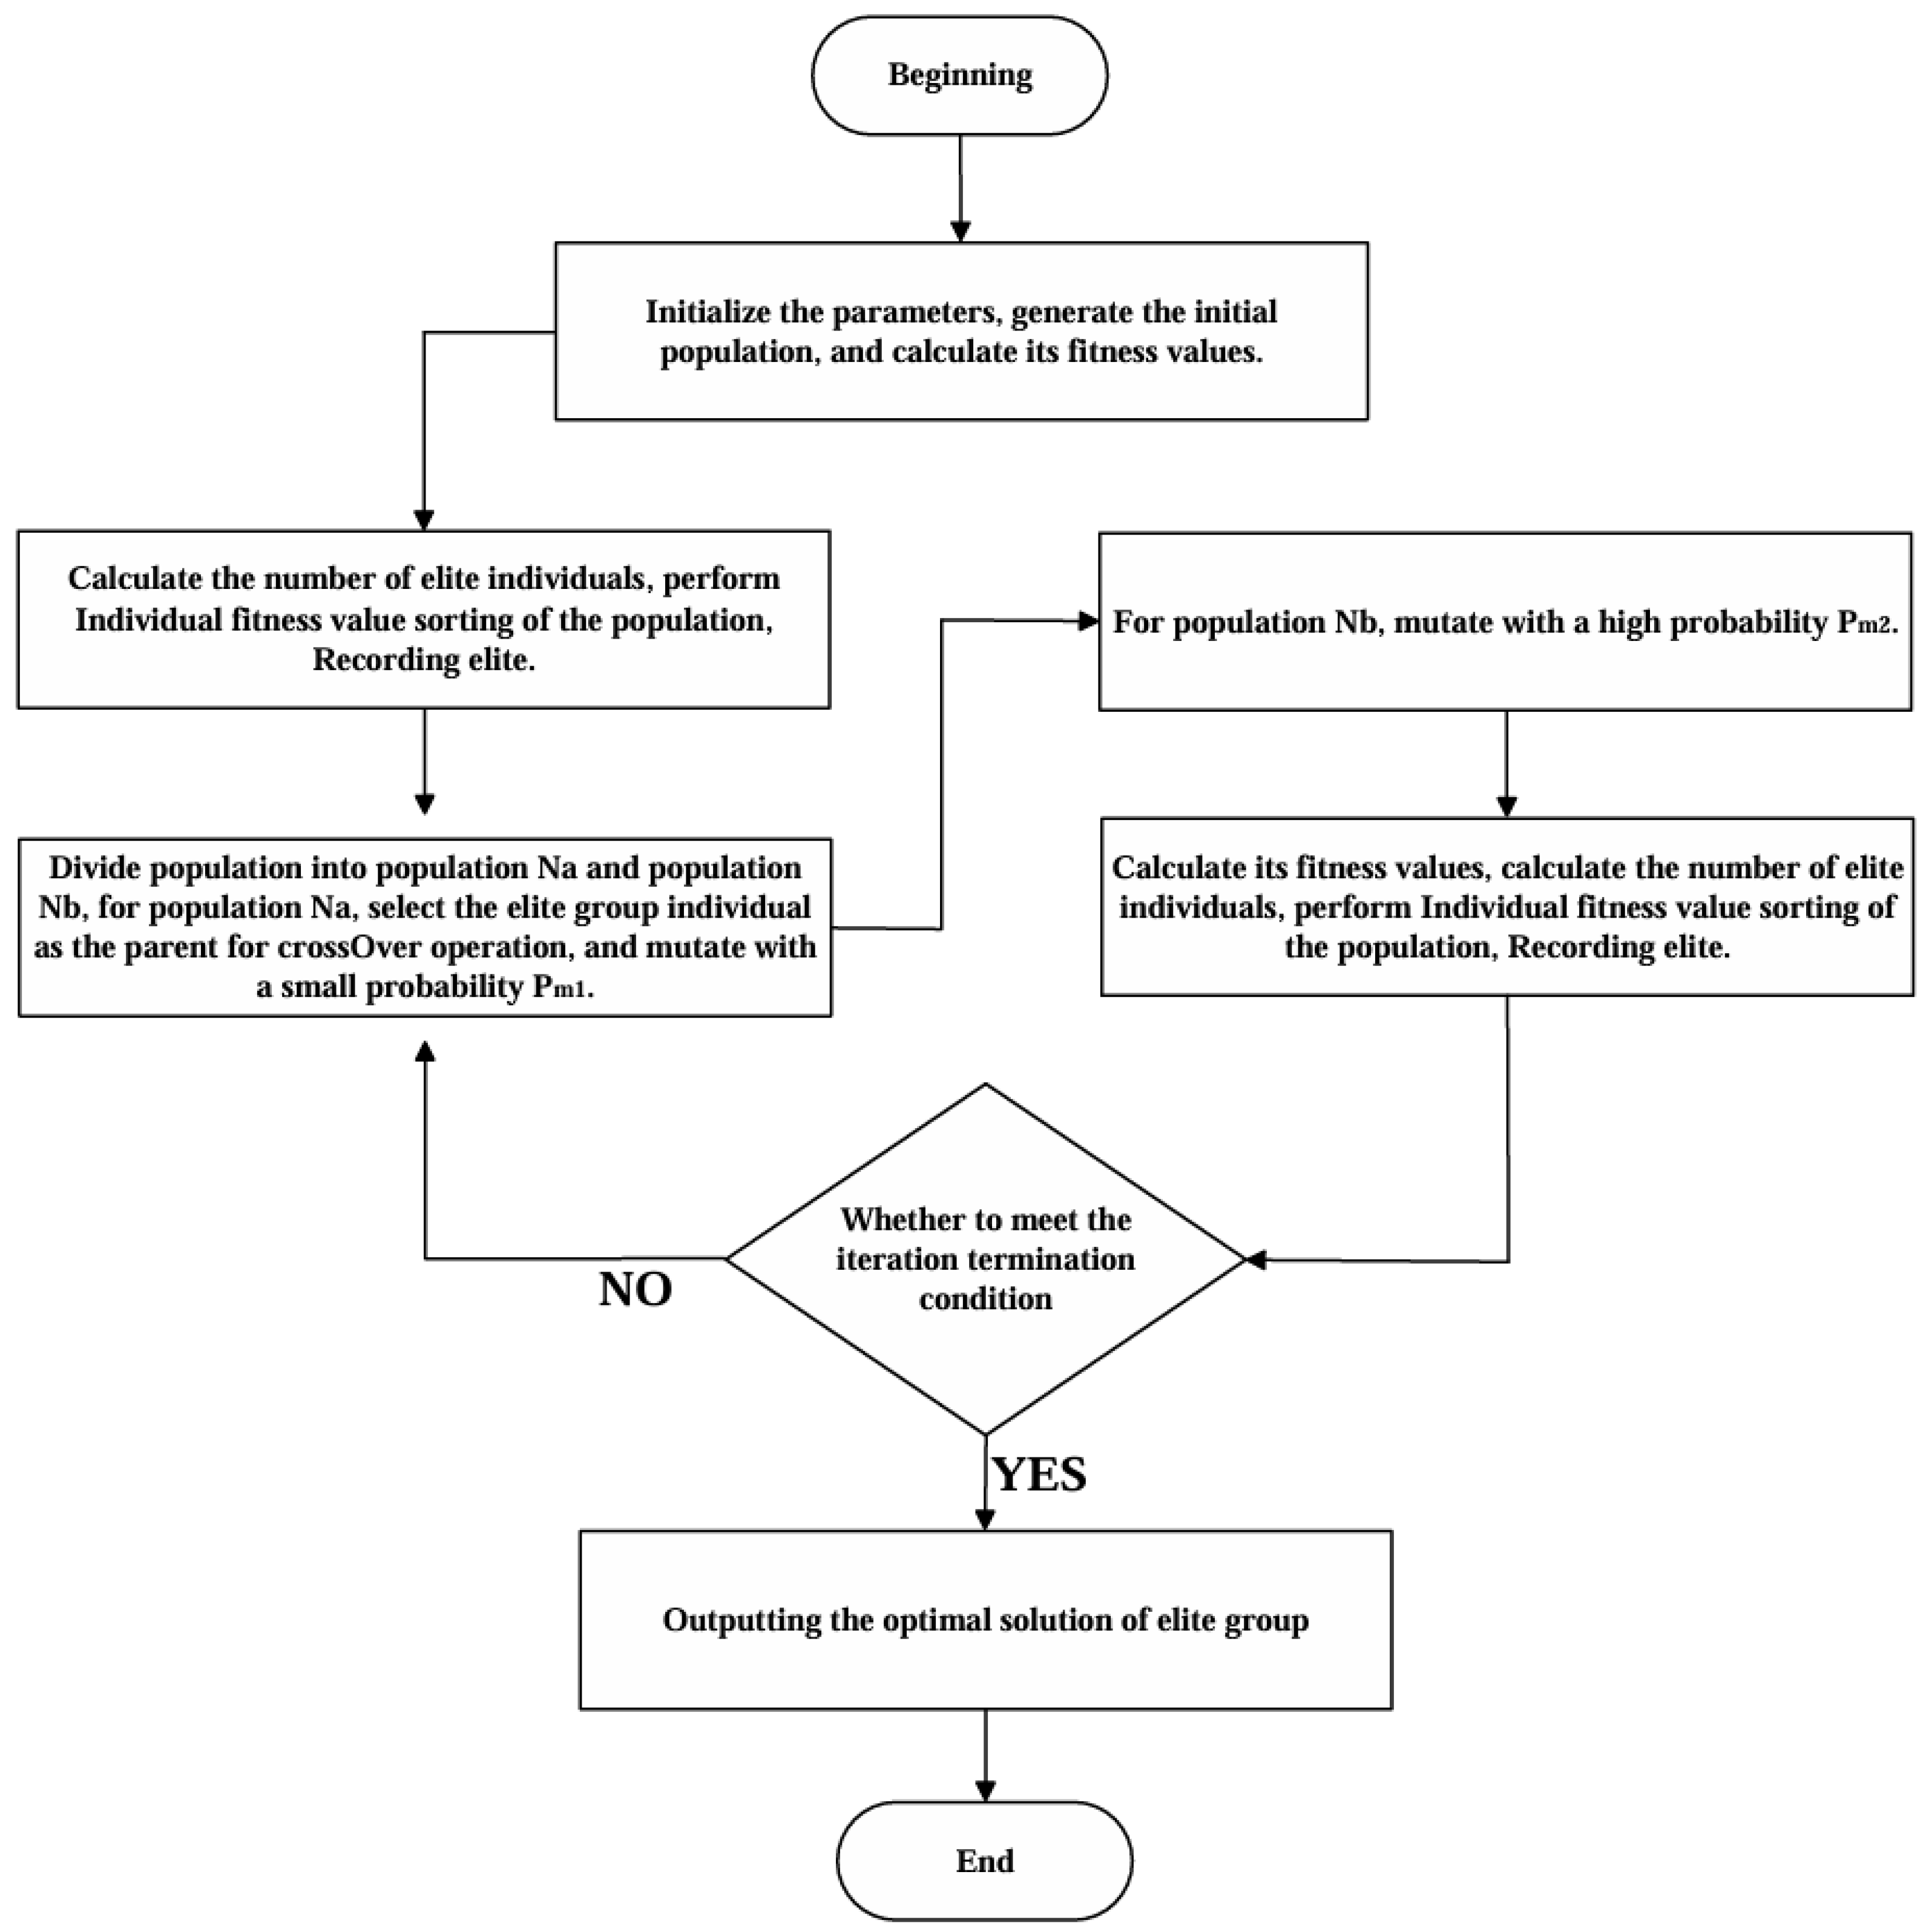
The specific process of DDGA is shown in Figure 10.
Step 1: Initialize the relevant parameters of the task area and the DDGA, generate the initial population, and calculate its fitness value.
Step 2: Calculate the number of individuals in the elite group, sort the fitness values of all individuals, and record the elite group.
Step 3: Divide population N a and population N b . Select the elite group individuals from population N a as the parents for cross-operation, and perform mutation operation with a relatively small probability P m 1 .
Step 4: Conduct mutation operations on the Nb individuals of the population with a relatively high probability P m 2 .
Step 5: Recalculate the population fitness values, calculate the number of individuals in the elite group, sort the fitness values of all individuals, and record the new elite group.
Step 6: Determine whether the iteration termination condition is met; if not, return to Step 3.

4. Case Study

To verify the proposed method, this section provides four simulation cases. All cases were carried out using MATLAB R2022b on a computer equipped with AMD Ryzen 7 6800HS 3.20 GHz and 16 GB RAM (Asus Computer Co., Ltd., Shanghai, China).

4.1. Simulation Cases for Charging Station Location

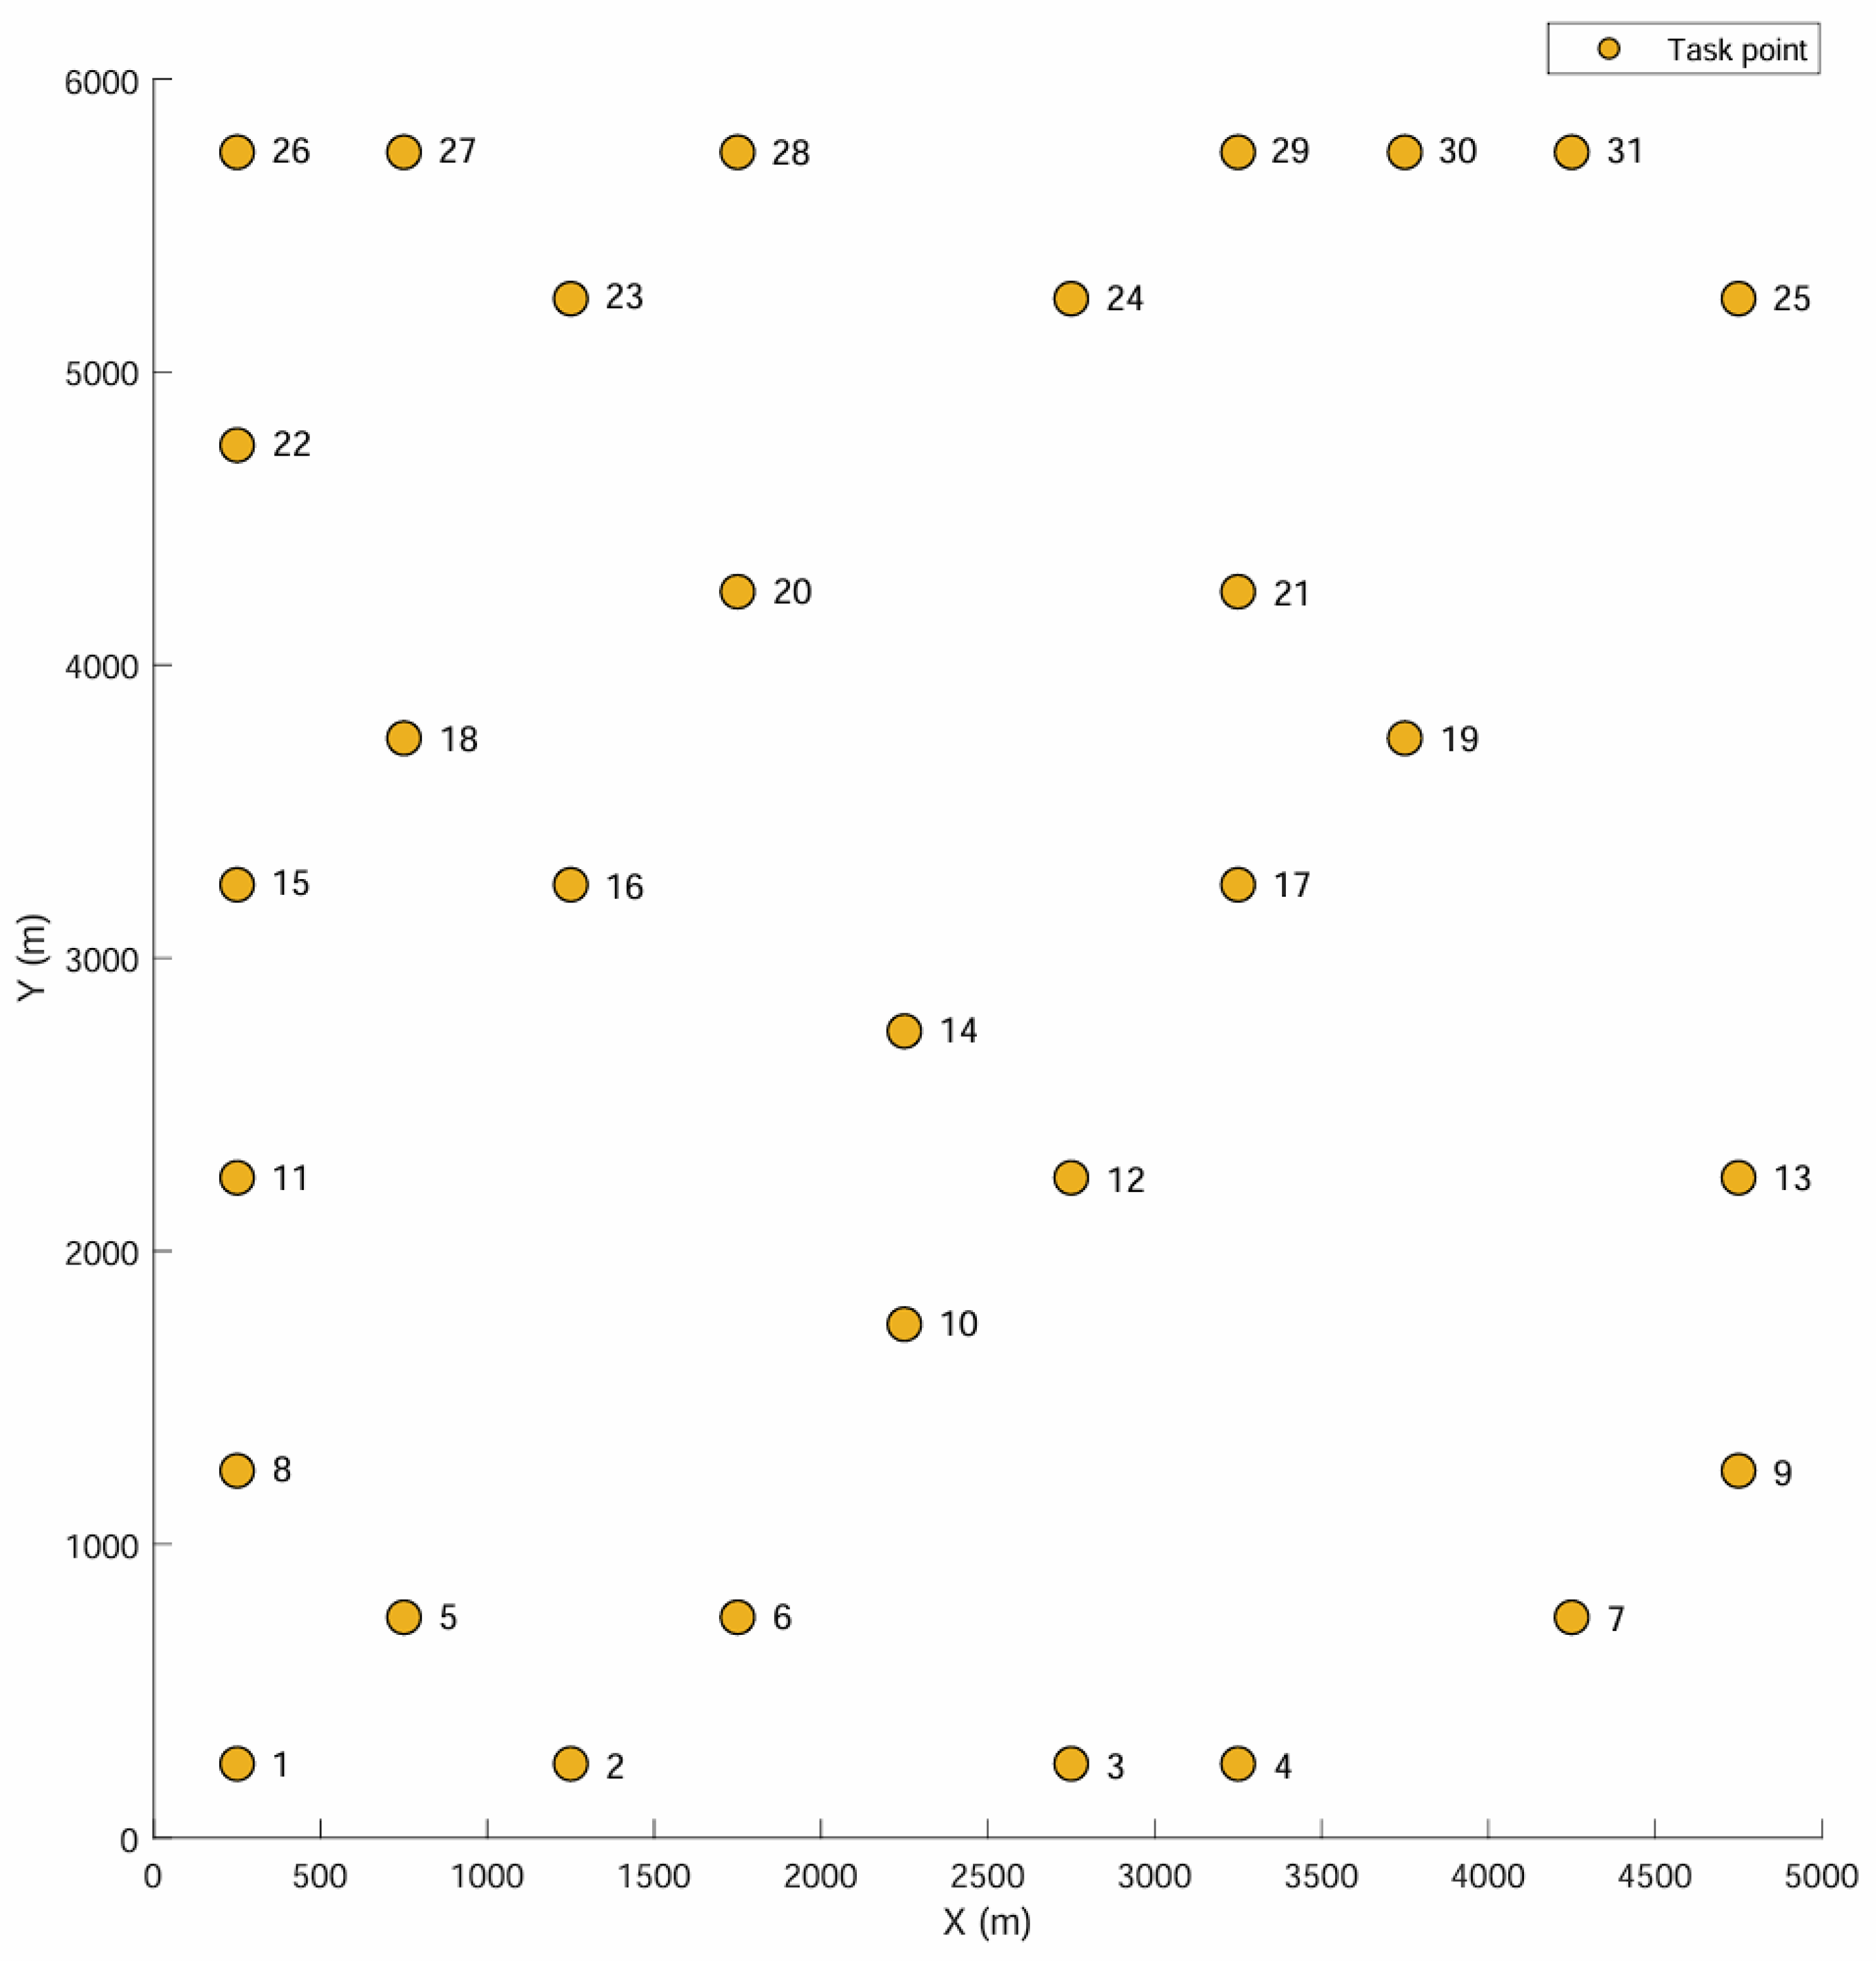
The task point distribution scenario designed in this study covers an area of 6 km × 5 km, aiming to simulate the operating environment of an actual offshore wind farm. The task point is regarded as a simulated wind power base station point, used to represent the target area that the UAV needs to complete the inspection. In order to more truly reflect the complexity of the multi-UAV task allocation problem, this paper constructs several discrete task points in this area as the inspection targets of the UAVs, as shown in Figure 11.
The distribution method of task points relies on the modeling idea of graph theory. Each task point is regarded as a point in the graph. The edges connecting the points represent the possible paths for the UAV to fly between the task points, and the weights of the edges are set according to the required flight time.
Case 1. To verify the feasibility of deploying and optimizing the IPSO algorithm, the following case was studied. Suppose there is a two-dimensional task area of 6 km × 5 km, and the task point of the wind turbine is known. The IPSO algorithm is employed to optimize the placement of charging stations, with the objective of minimizing the cost function defined in Equation (7).
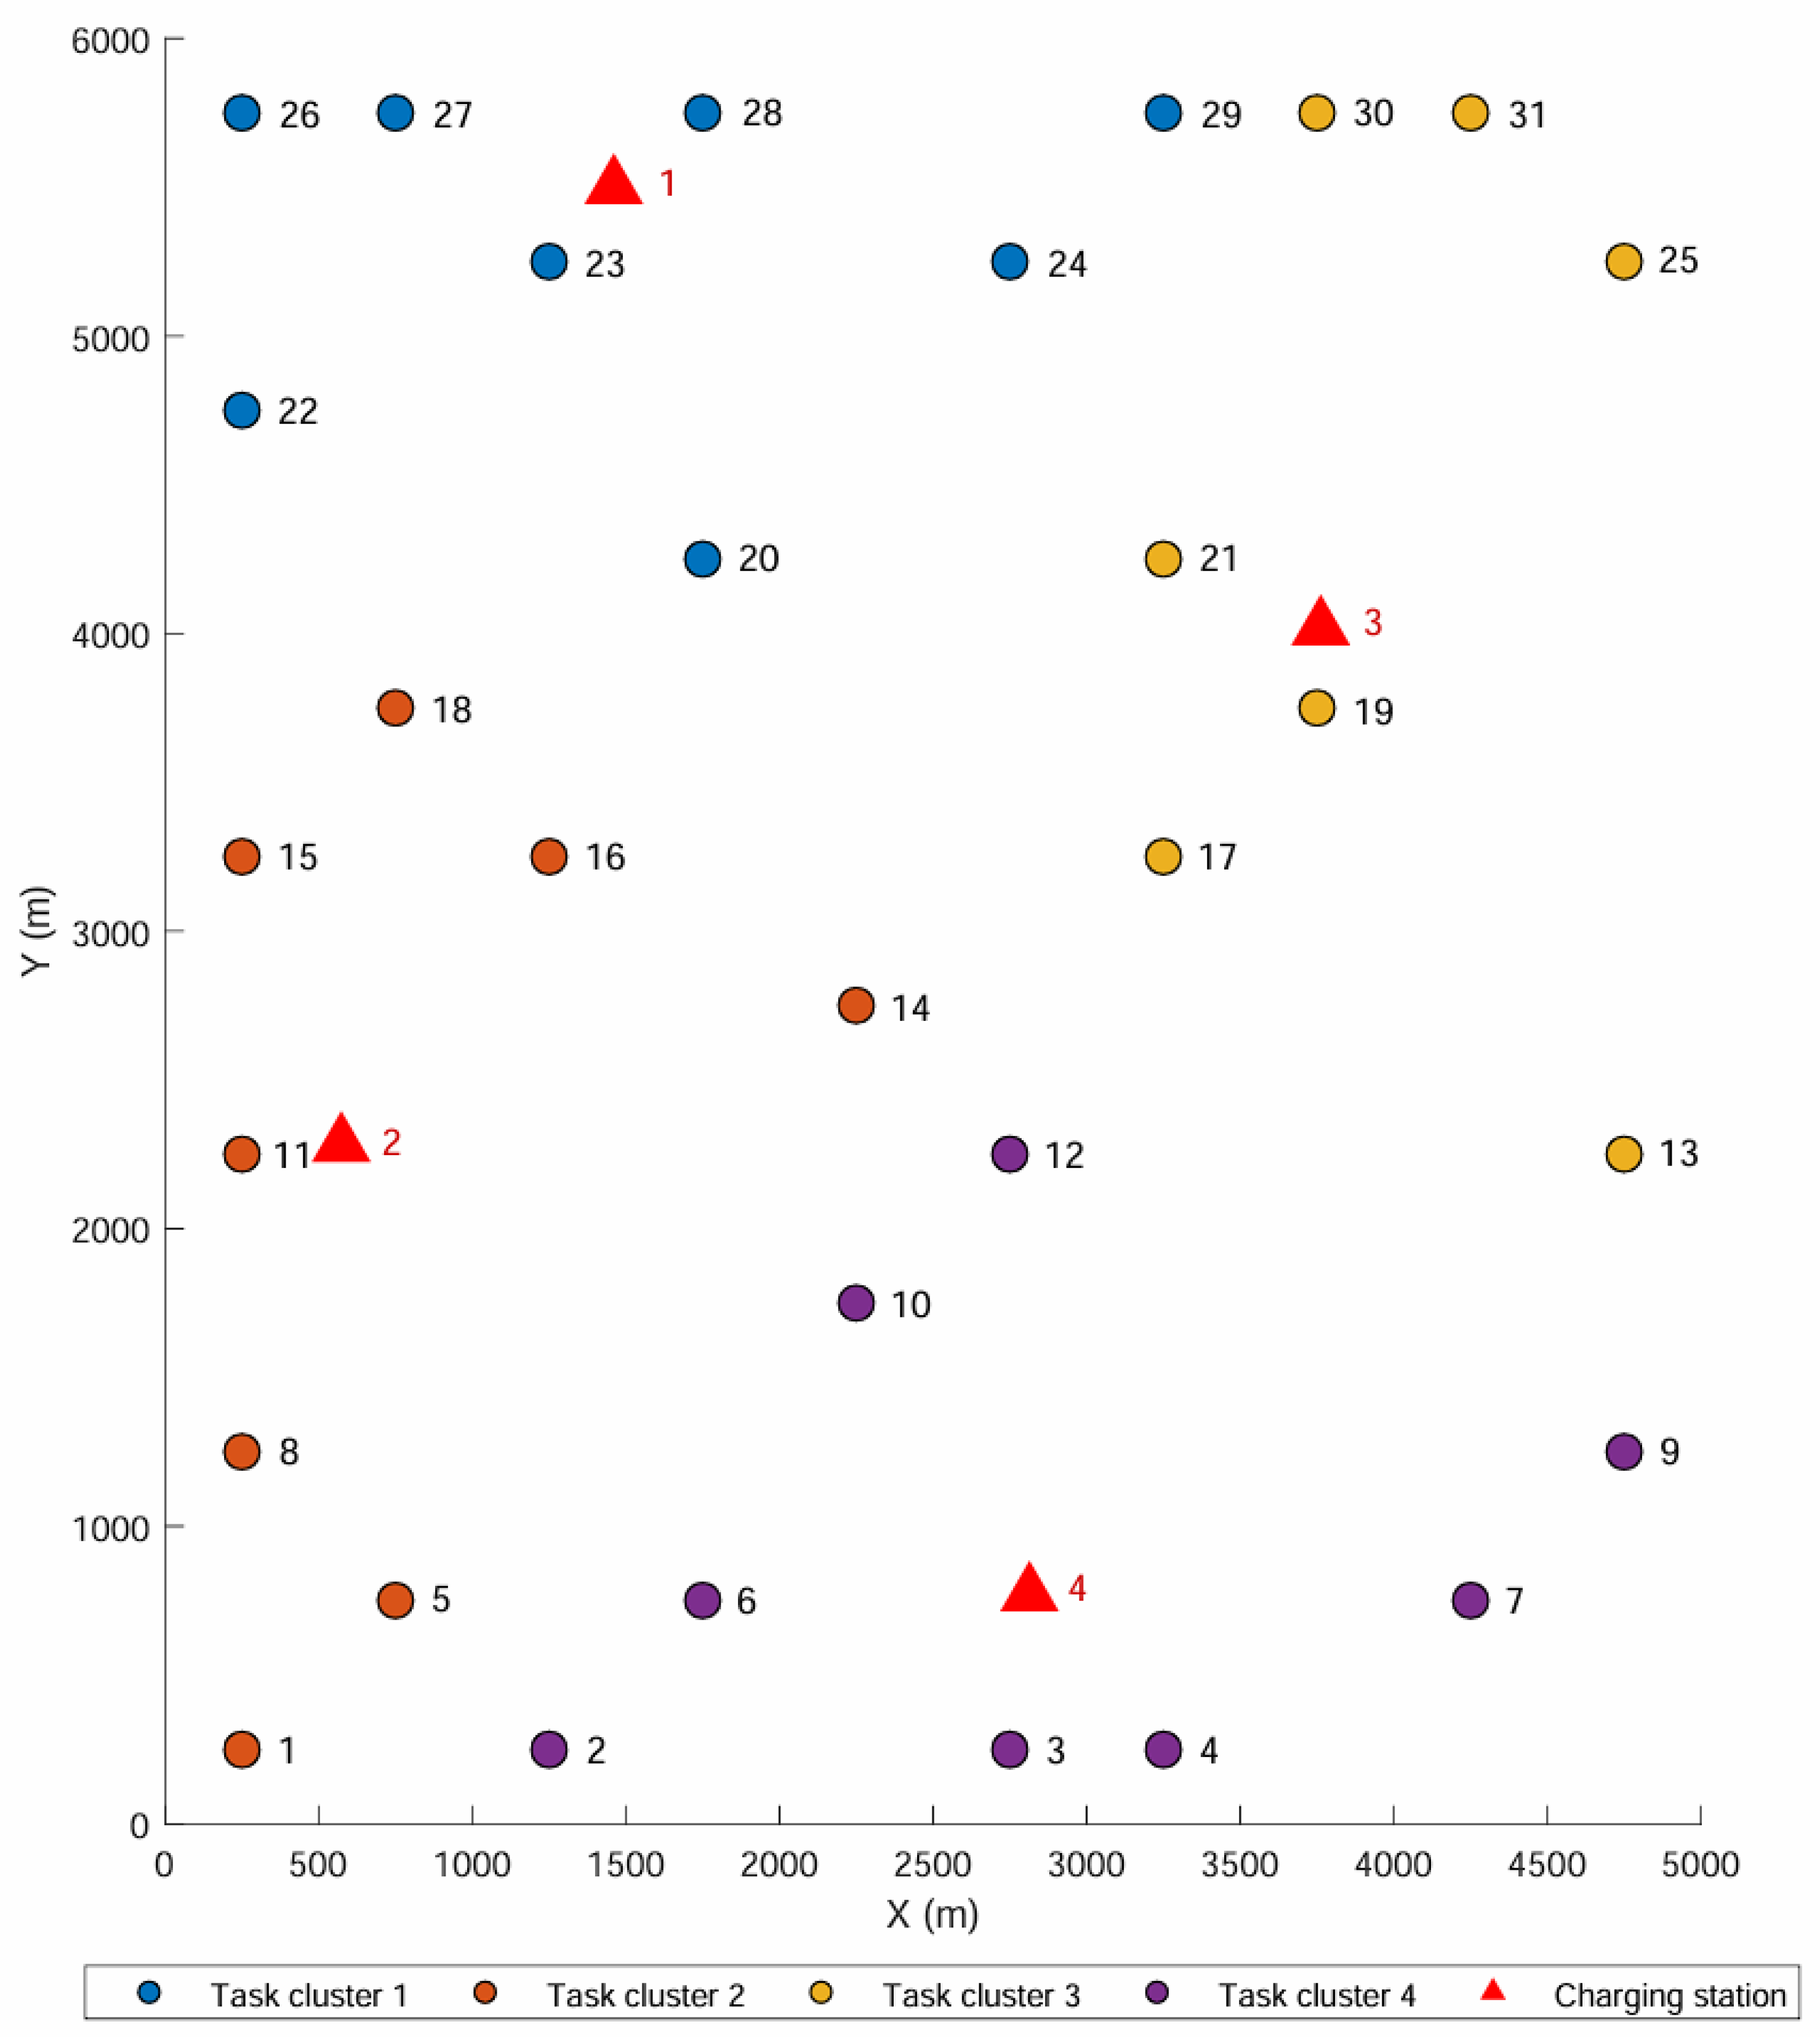
In Figure 12, the red triangles represent the charging stations, and the four colored circles represent the task points. Each color indicates the set of task points that are closest to a specific charging station. The total number of task points is 31. A total of four charging stations are configured in this scenario. The reason for choosing this number is elaborated on in Case 2, where the impact of the number of charging stations on optimization performance is analyzed. After optimization, the location of charging stations in the figure is relatively uniform, ensuring that the distance from most task points to charging stations is minimized, and the load of task points is balanced, meeting the safety requirements. The feasibility of the location of optimization charging stations for the IPSO algorithm was verified.
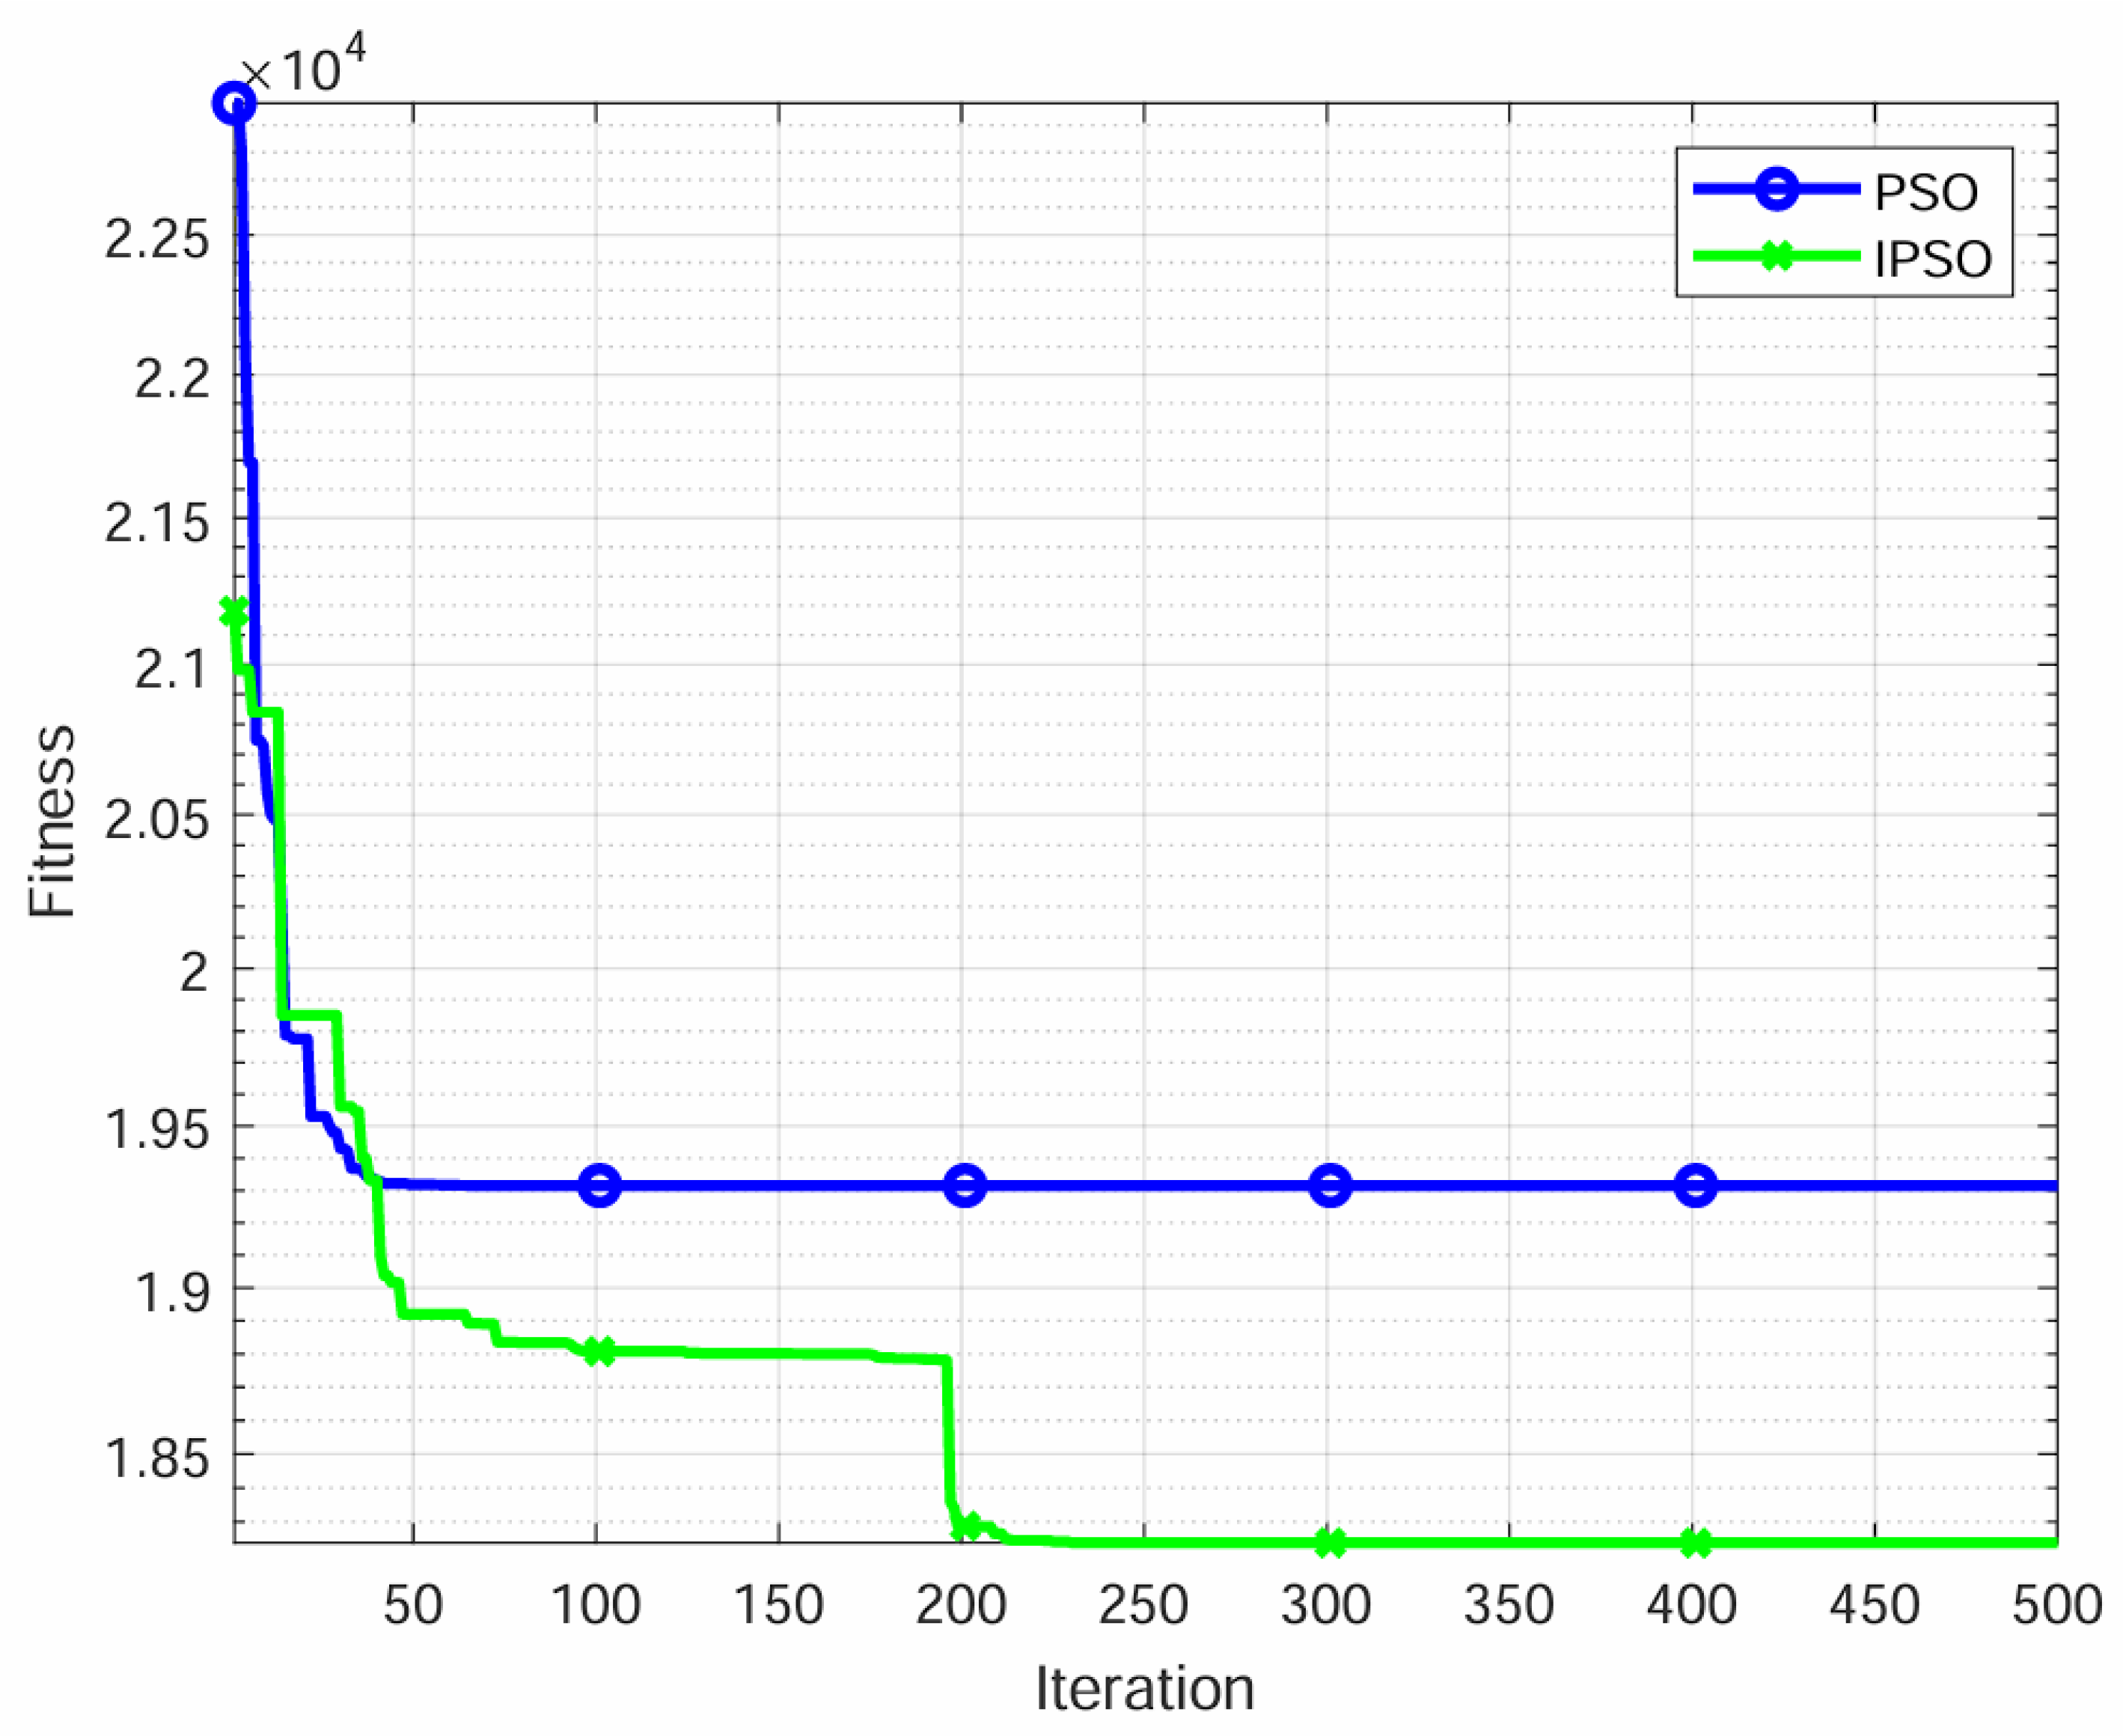
Figure 13 presents a side-by-side comparison of IPSO and traditional PSO: the blue curve corresponds to PSO and the green curve to IPSO. The fitness of charging station configurations over iterations is shown. Initially the two are similar, after which IPSO’s fitness drops sharply in the early iterations. However, during the optimization process of the location of charging stations, the improved IPSO algorithm always maintains a fitness lower than that of the traditional PSO algorithm in each iteration. IPSO not only converges faster but also reaches a better final objective, underscoring its superiority in solution quality.
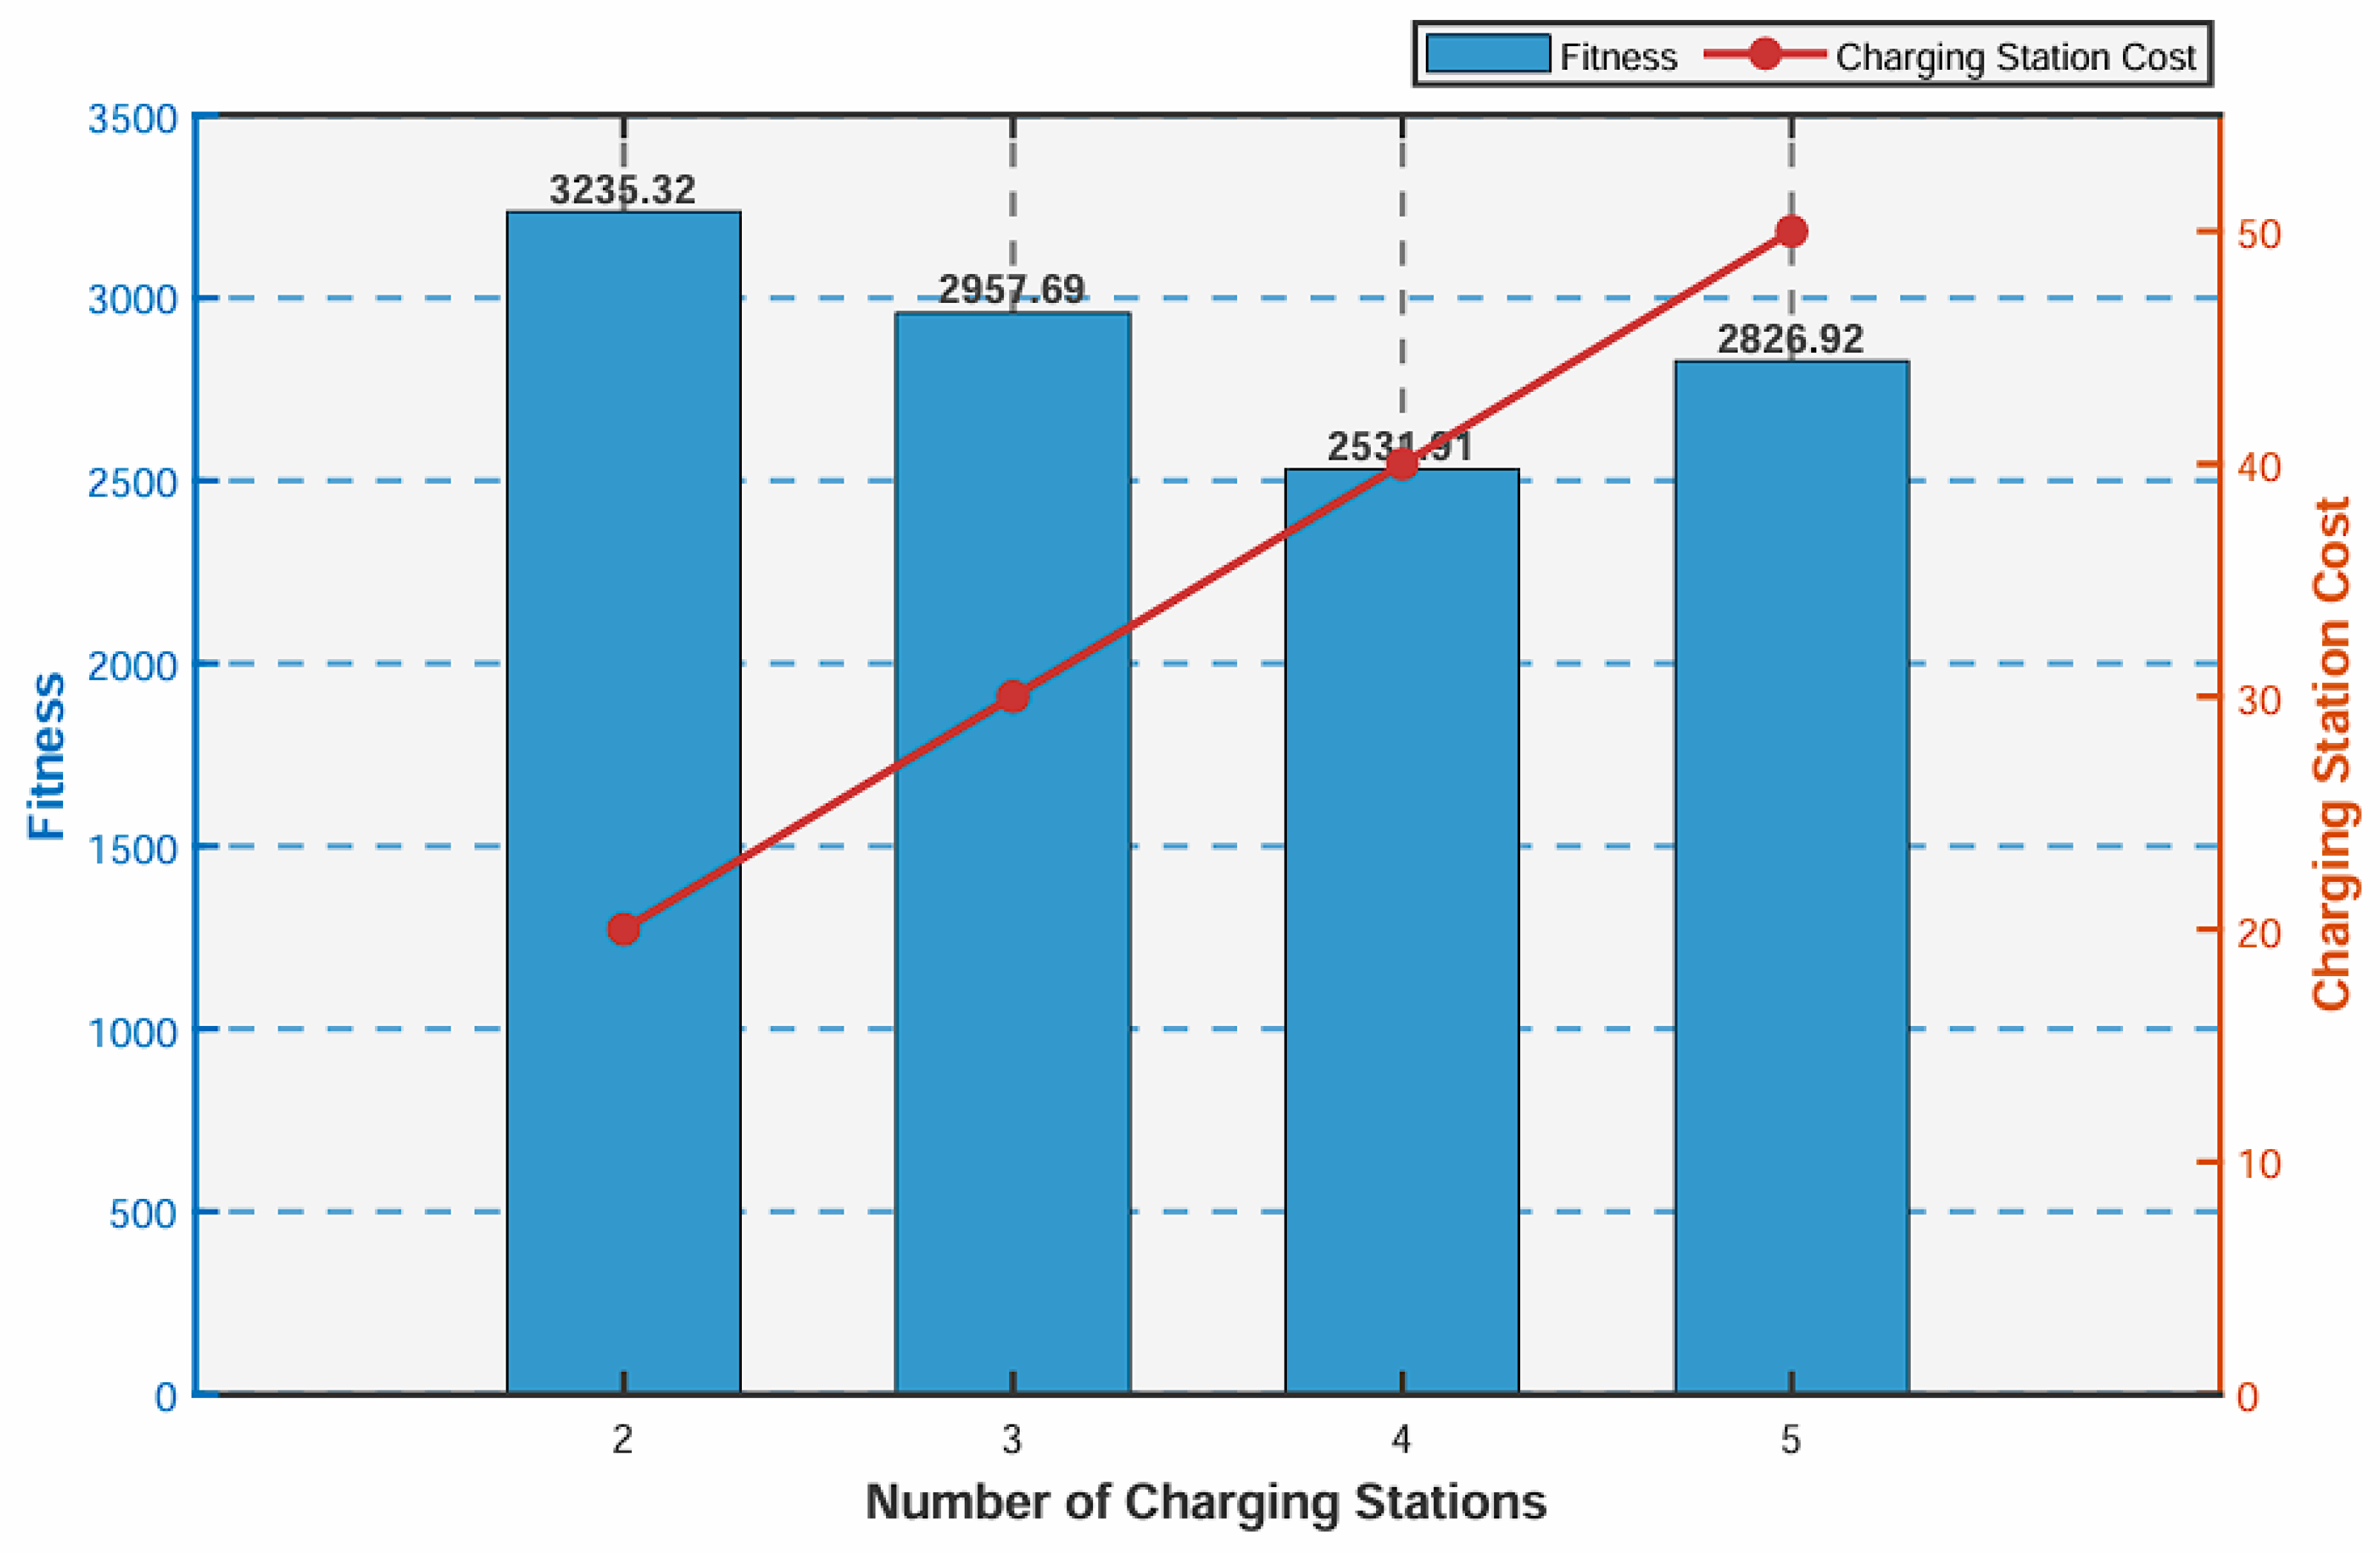
Case 2. Case 2 aims to verify the ability of the IPSO algorithm to find the best location within the specified 6 km × 5 km task area, that is, to determine the number of charging stations and their coordinates. In order to identify the optimal number of charging stations, experiments are performed by setting the number of stations to 2, 3, 4, and 5, respectively. The construction cost of charging stations is also taken into consideration, which generally increases linearly with the number of charging stations. As shown in Figure 14, when the number of charging stations is relatively small, the fitness value of the objective function is higher. As the number of charging stations increases, the fitness value gradually decreases, reaching its lowest point when four stations are deployed. Meanwhile, the construction cost increases with the number of stations. To achieve a balance between performance and cost-effectiveness, and to avoid excessive construction expenses, four charging stations are selected as the optimal configuration. Subsequent simulation experiments on task allocation are conducted based on this configuration. The simulation parameters of the charging stations are listed in Table 1.

4.2. Simulation Cases for Cooperative Task Allocation

The simulation parameters of the unmanned aerial vehicle used in this study are based on the DJI Matrice 350 RTK (Shenzhen DJI Innovation Technology Co., Ltd., Shenzhen, China). The maximum flight endurance time is 55 min. Equipped with a 5880 mAh battery. The total weight of the machine is 6.47 kg. Table 2 reports the parameter choices for task allocation and the principal UAV attributes. The fixed inspection time for each task point is five minutes. To simulate the impact of other factors such as the environment on energy consumption, Gaussian noise is added to the inspection time to calculate the inspection energy consumption, without affecting the inspection time.
Case 3. Case 3 evaluated the feasibility of the DDGA in solving the task allocation problem in scenarios where one UAV corresponds to one charging station and the number of UAVs is equal to the number of charging stations. Suppose the number of UAVs is four. The UAV system performs inspection tasks within a 6 km × 5 km scene and has 31 wind turbine task points.
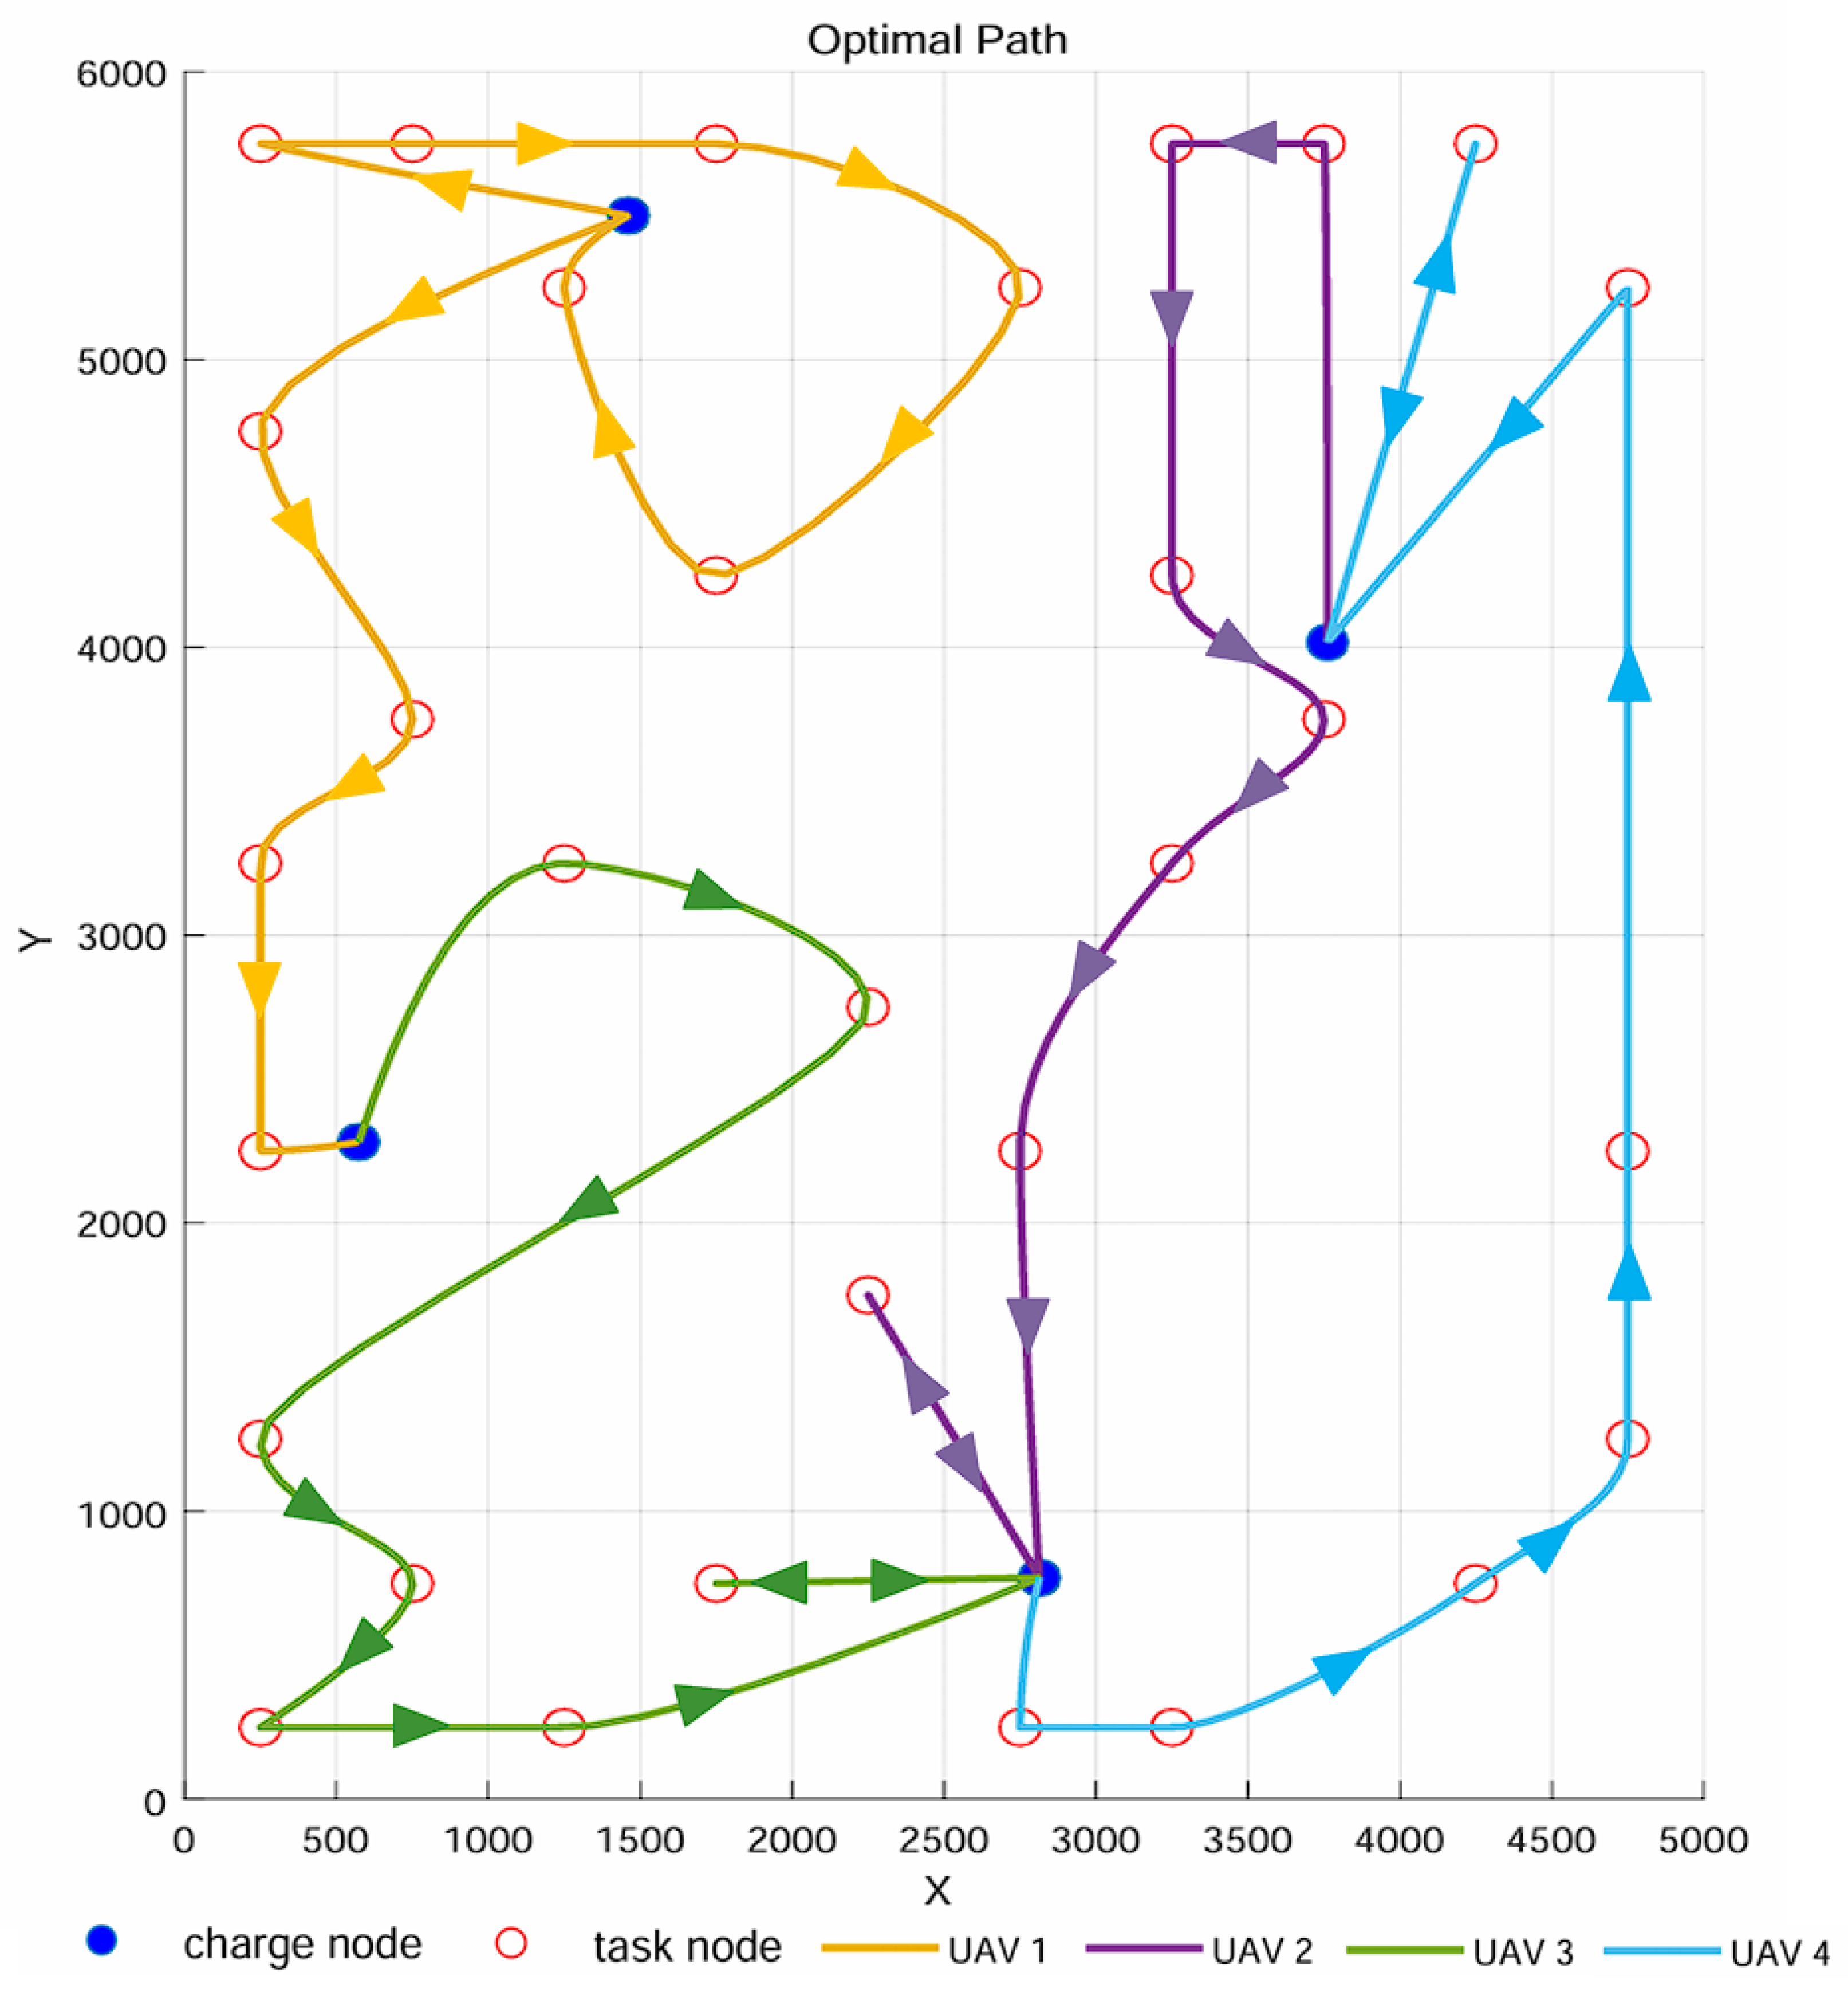
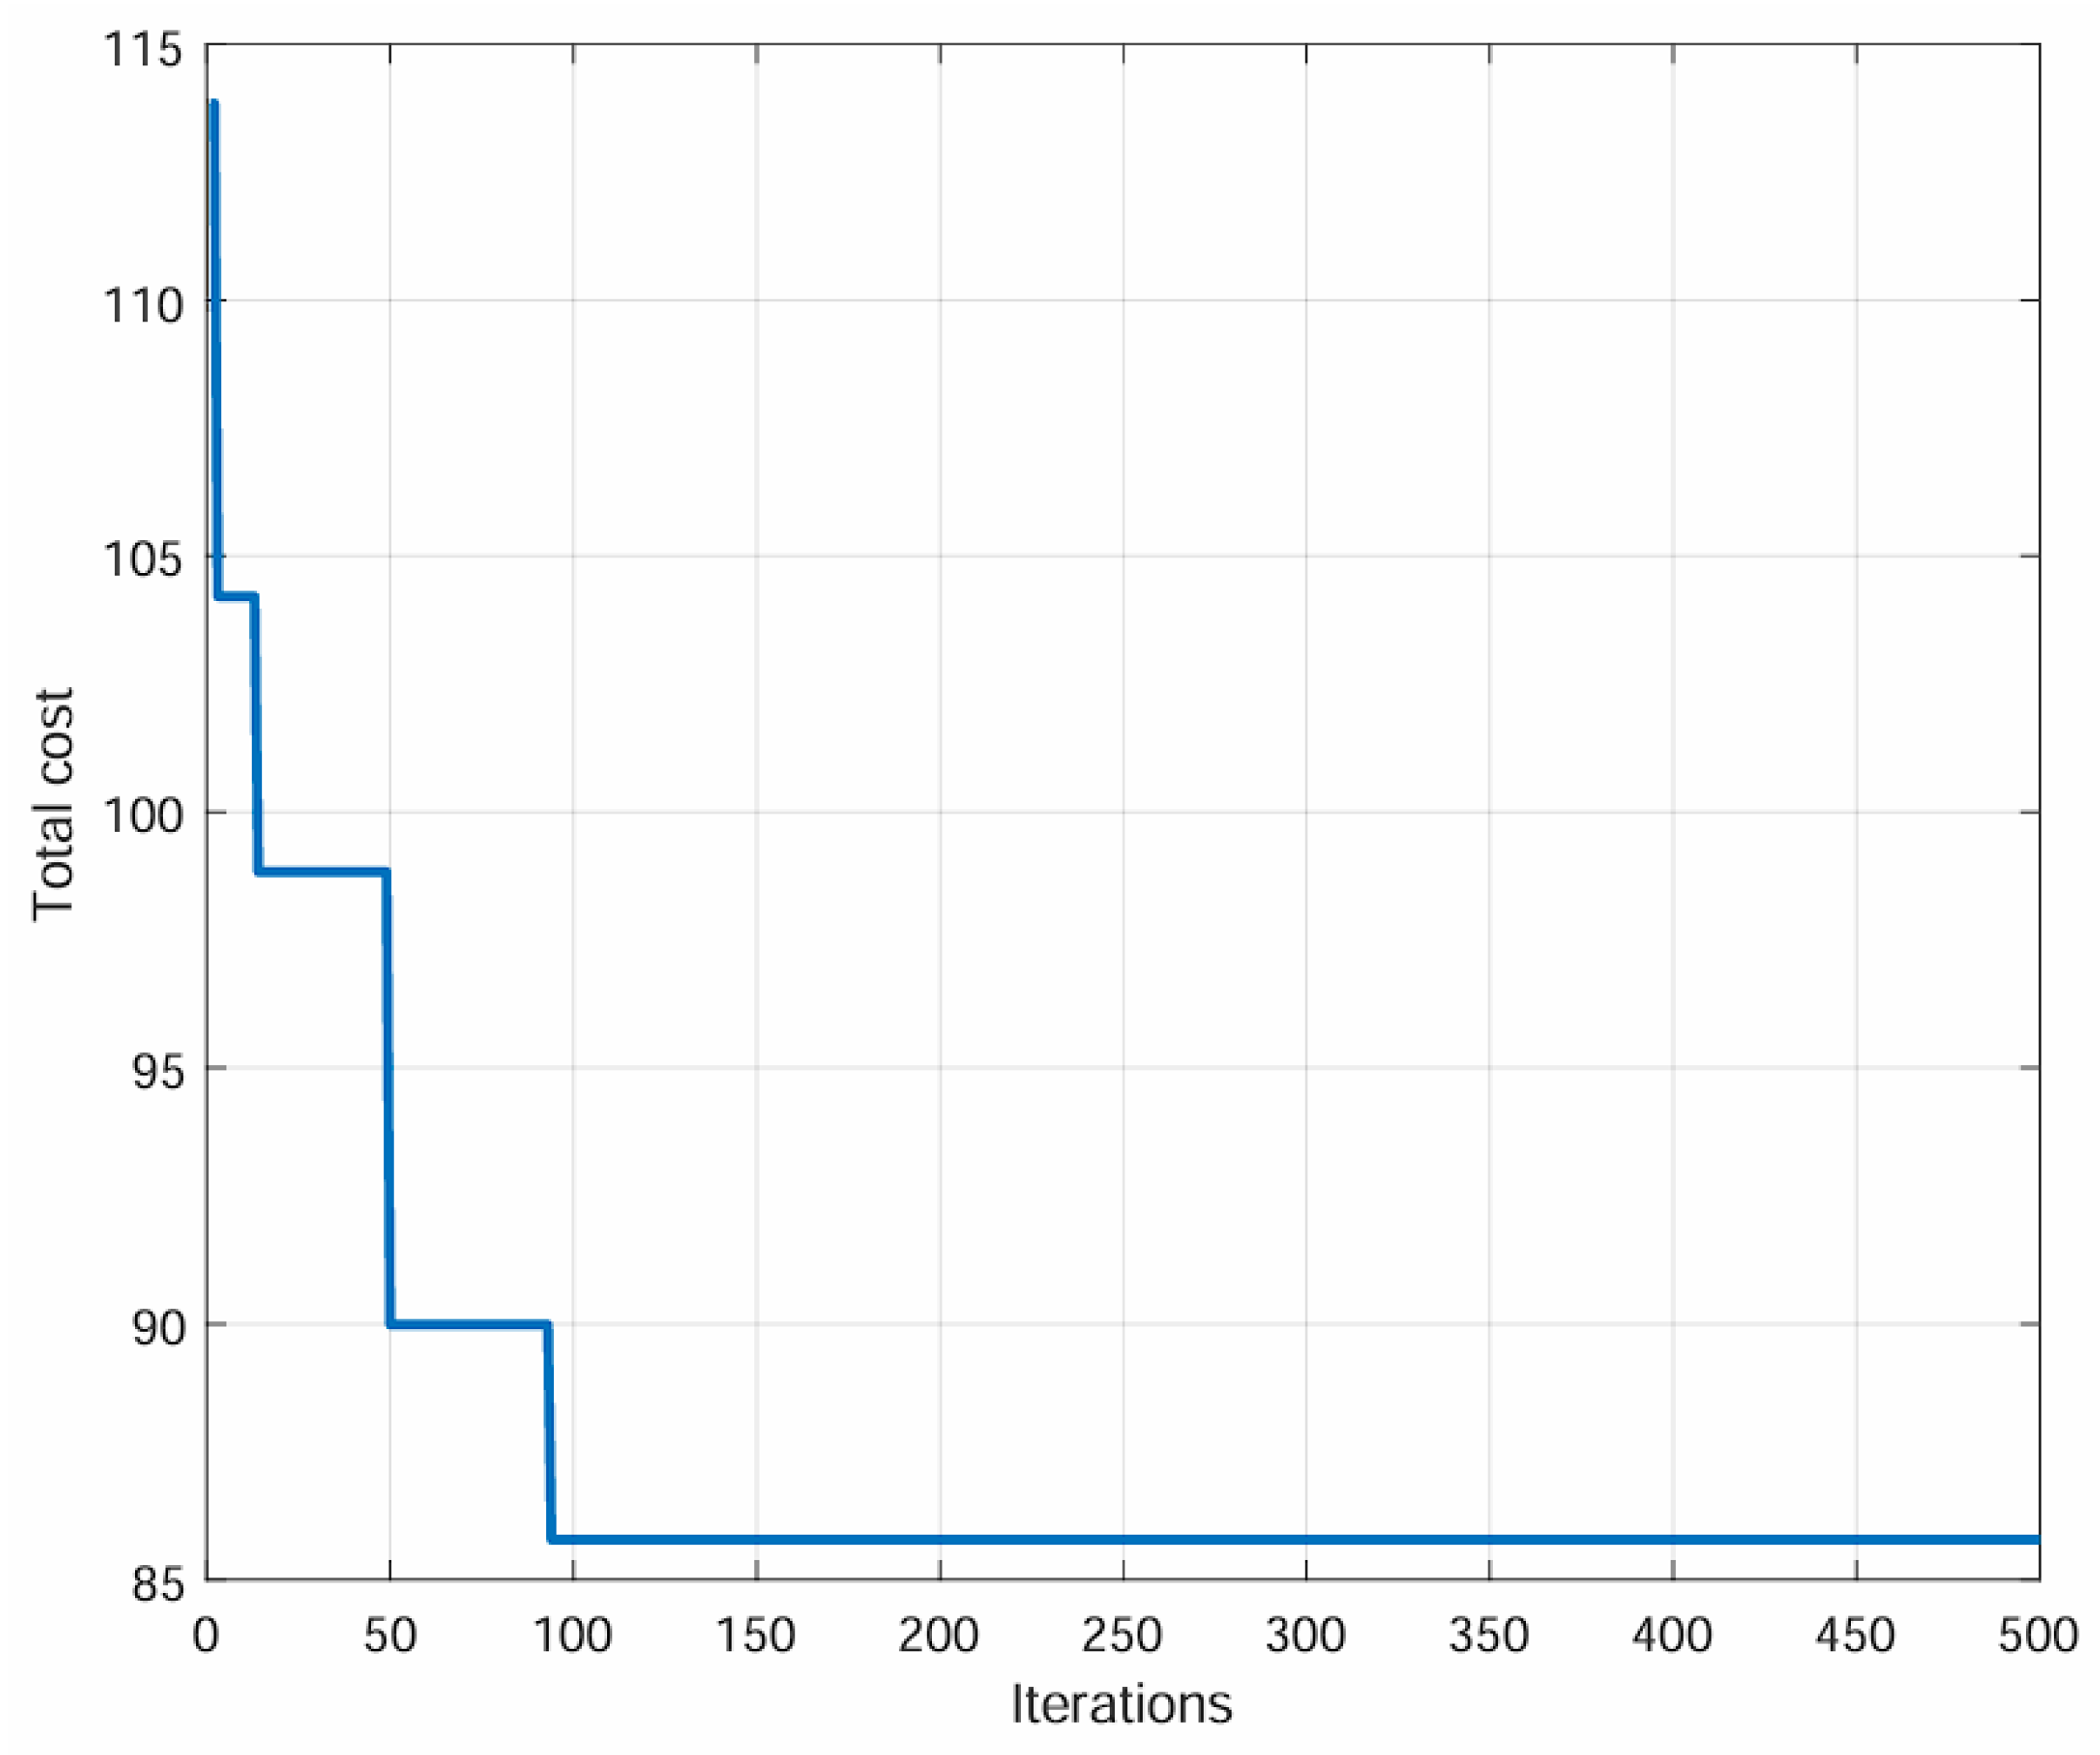
Figure 15 shows a schematic diagram detailing the results of the collaborative task allocation, and the corresponding data results are detailed in Table 3. The iterative variation of UAV cost is shown in Figure 16.
In Figure 15, the blue solid dots on the sea surface represent the charging stations, and the red hollow dots represent the wind turbine task points. The solid lines of various colors illustrate the flight paths of each UAV during the mission execution process. Table 3 records the task sequence of each UAV. The entire task was completed within a total time of 84.42 min.
As shown in Figure 16, DDGA attains feasible solutions, with the blue solid line depicting the evolution of the four-UAV total cost over iterations. The algorithm is momentarily caught near a local optimum at about 20 iterations and then rapidly recovers, reaching a steady cost level by 90 iterations.
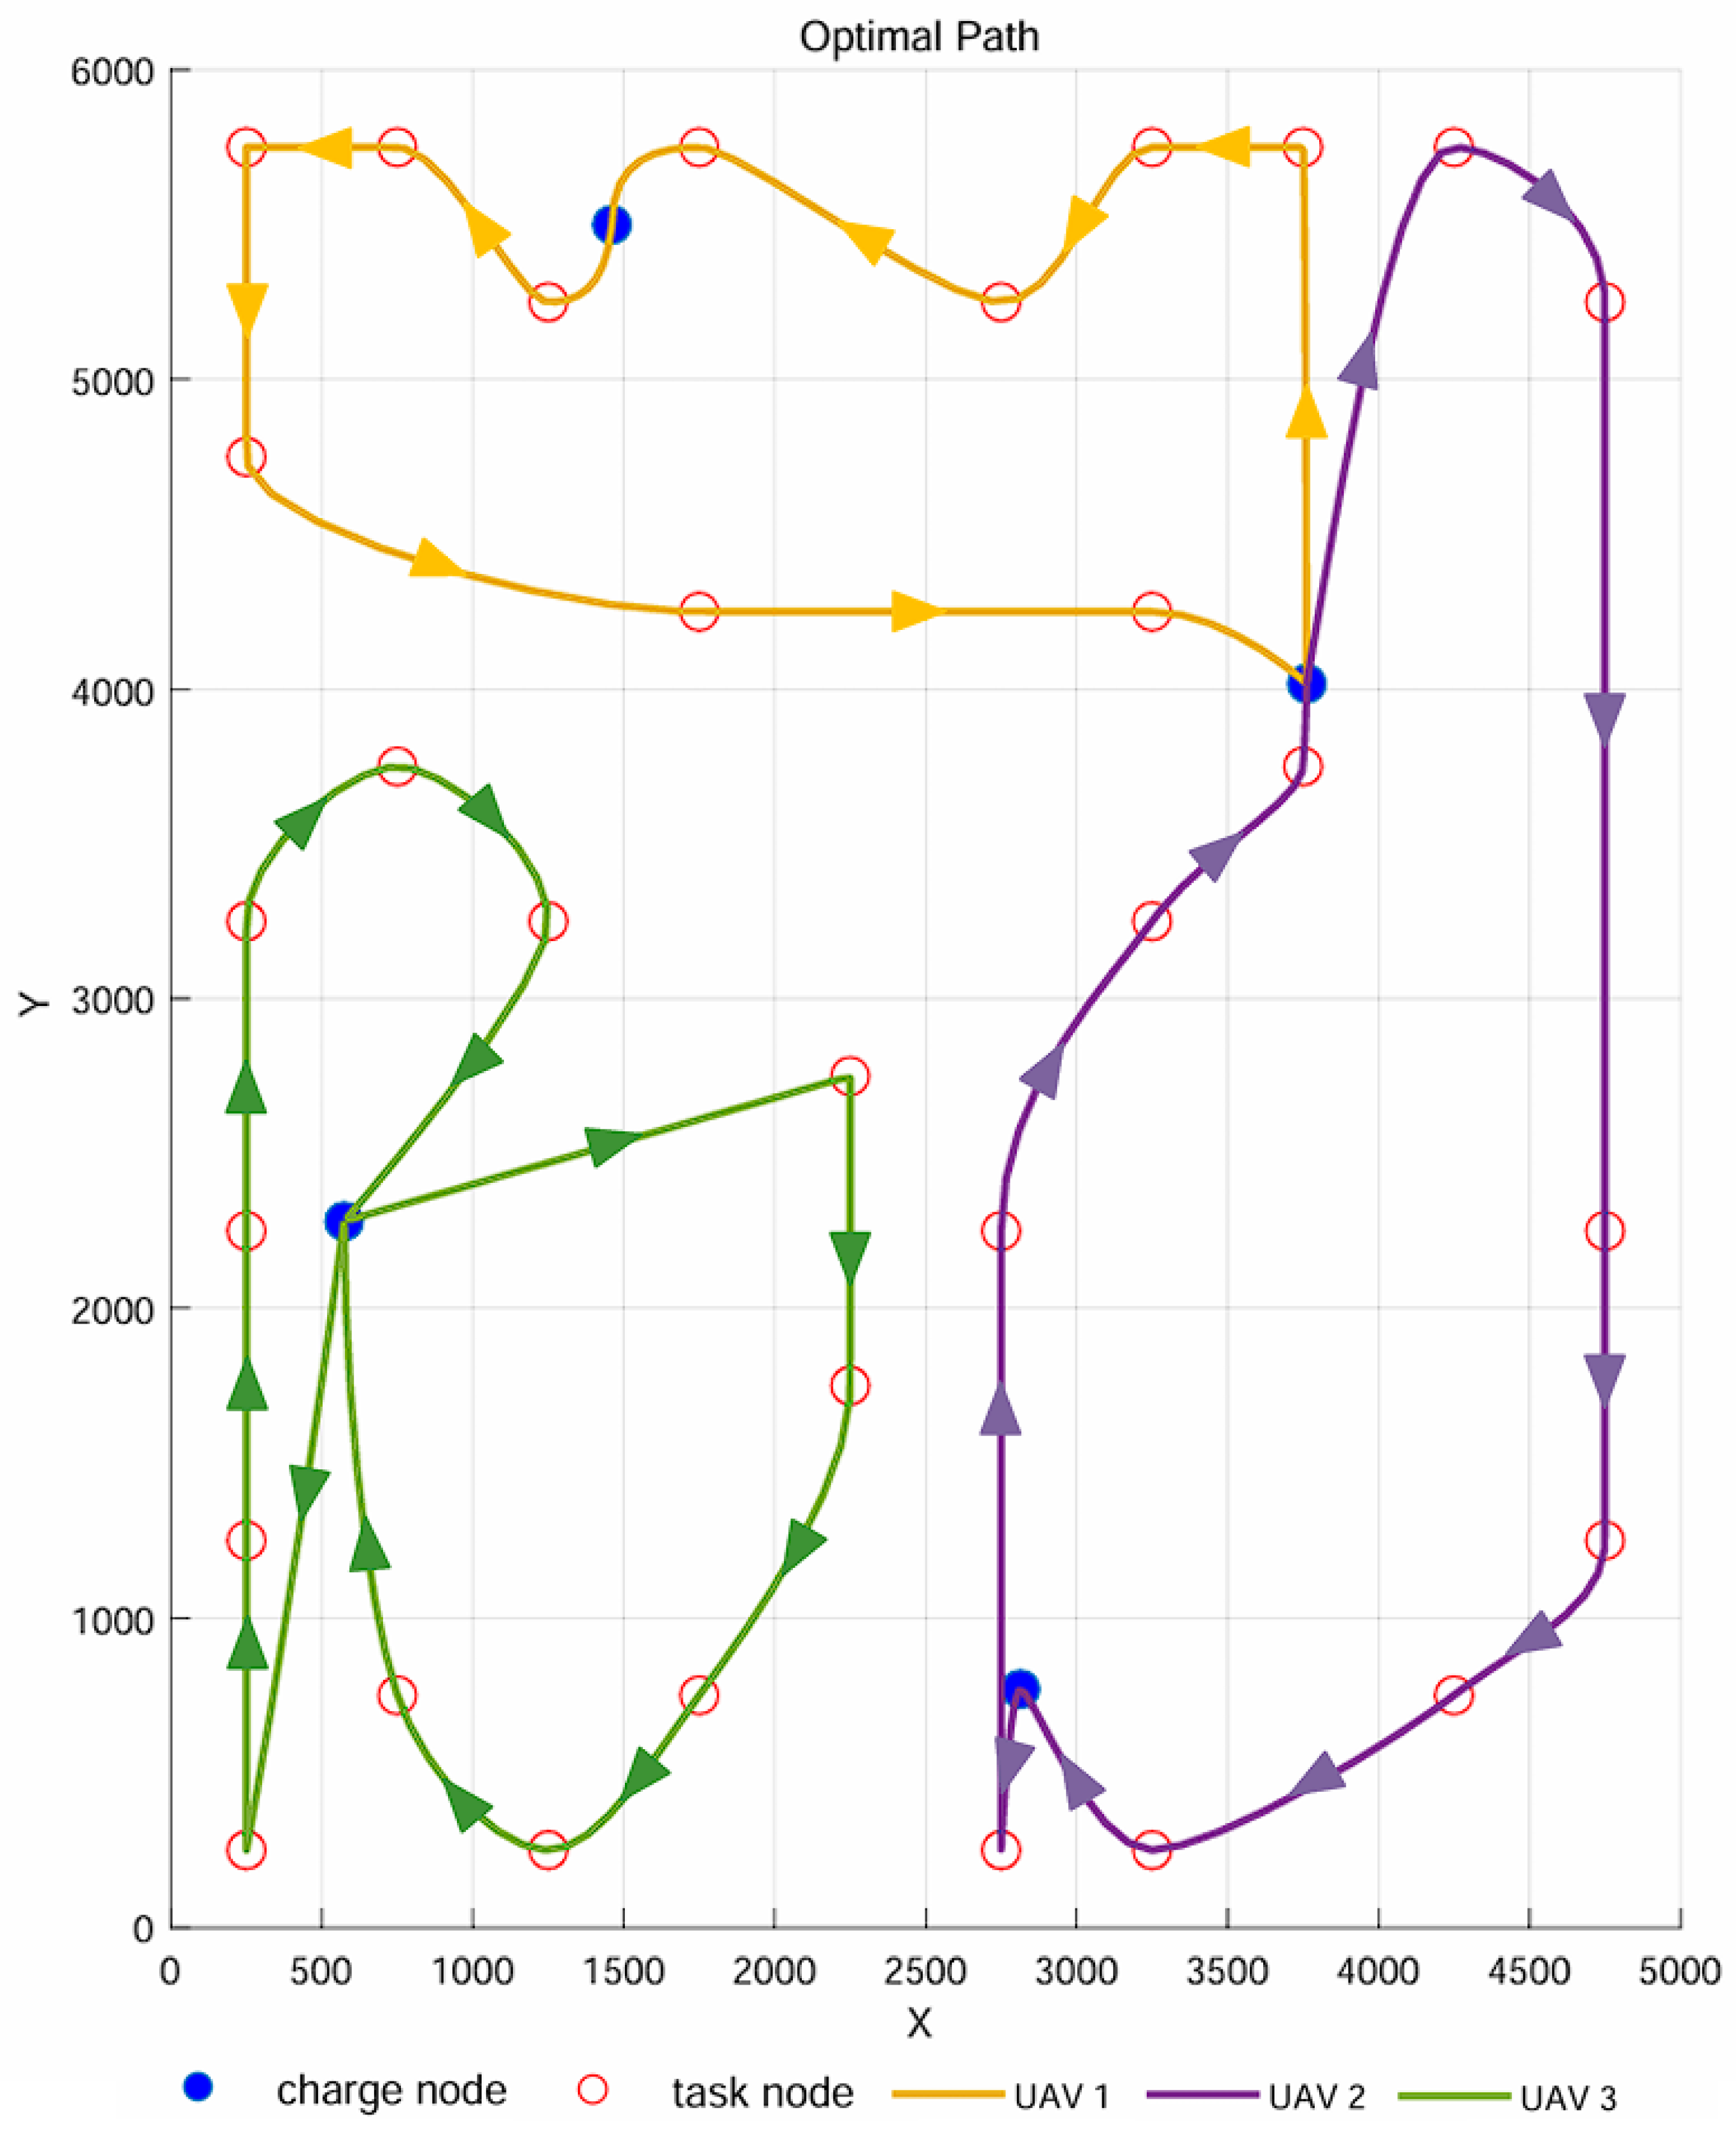
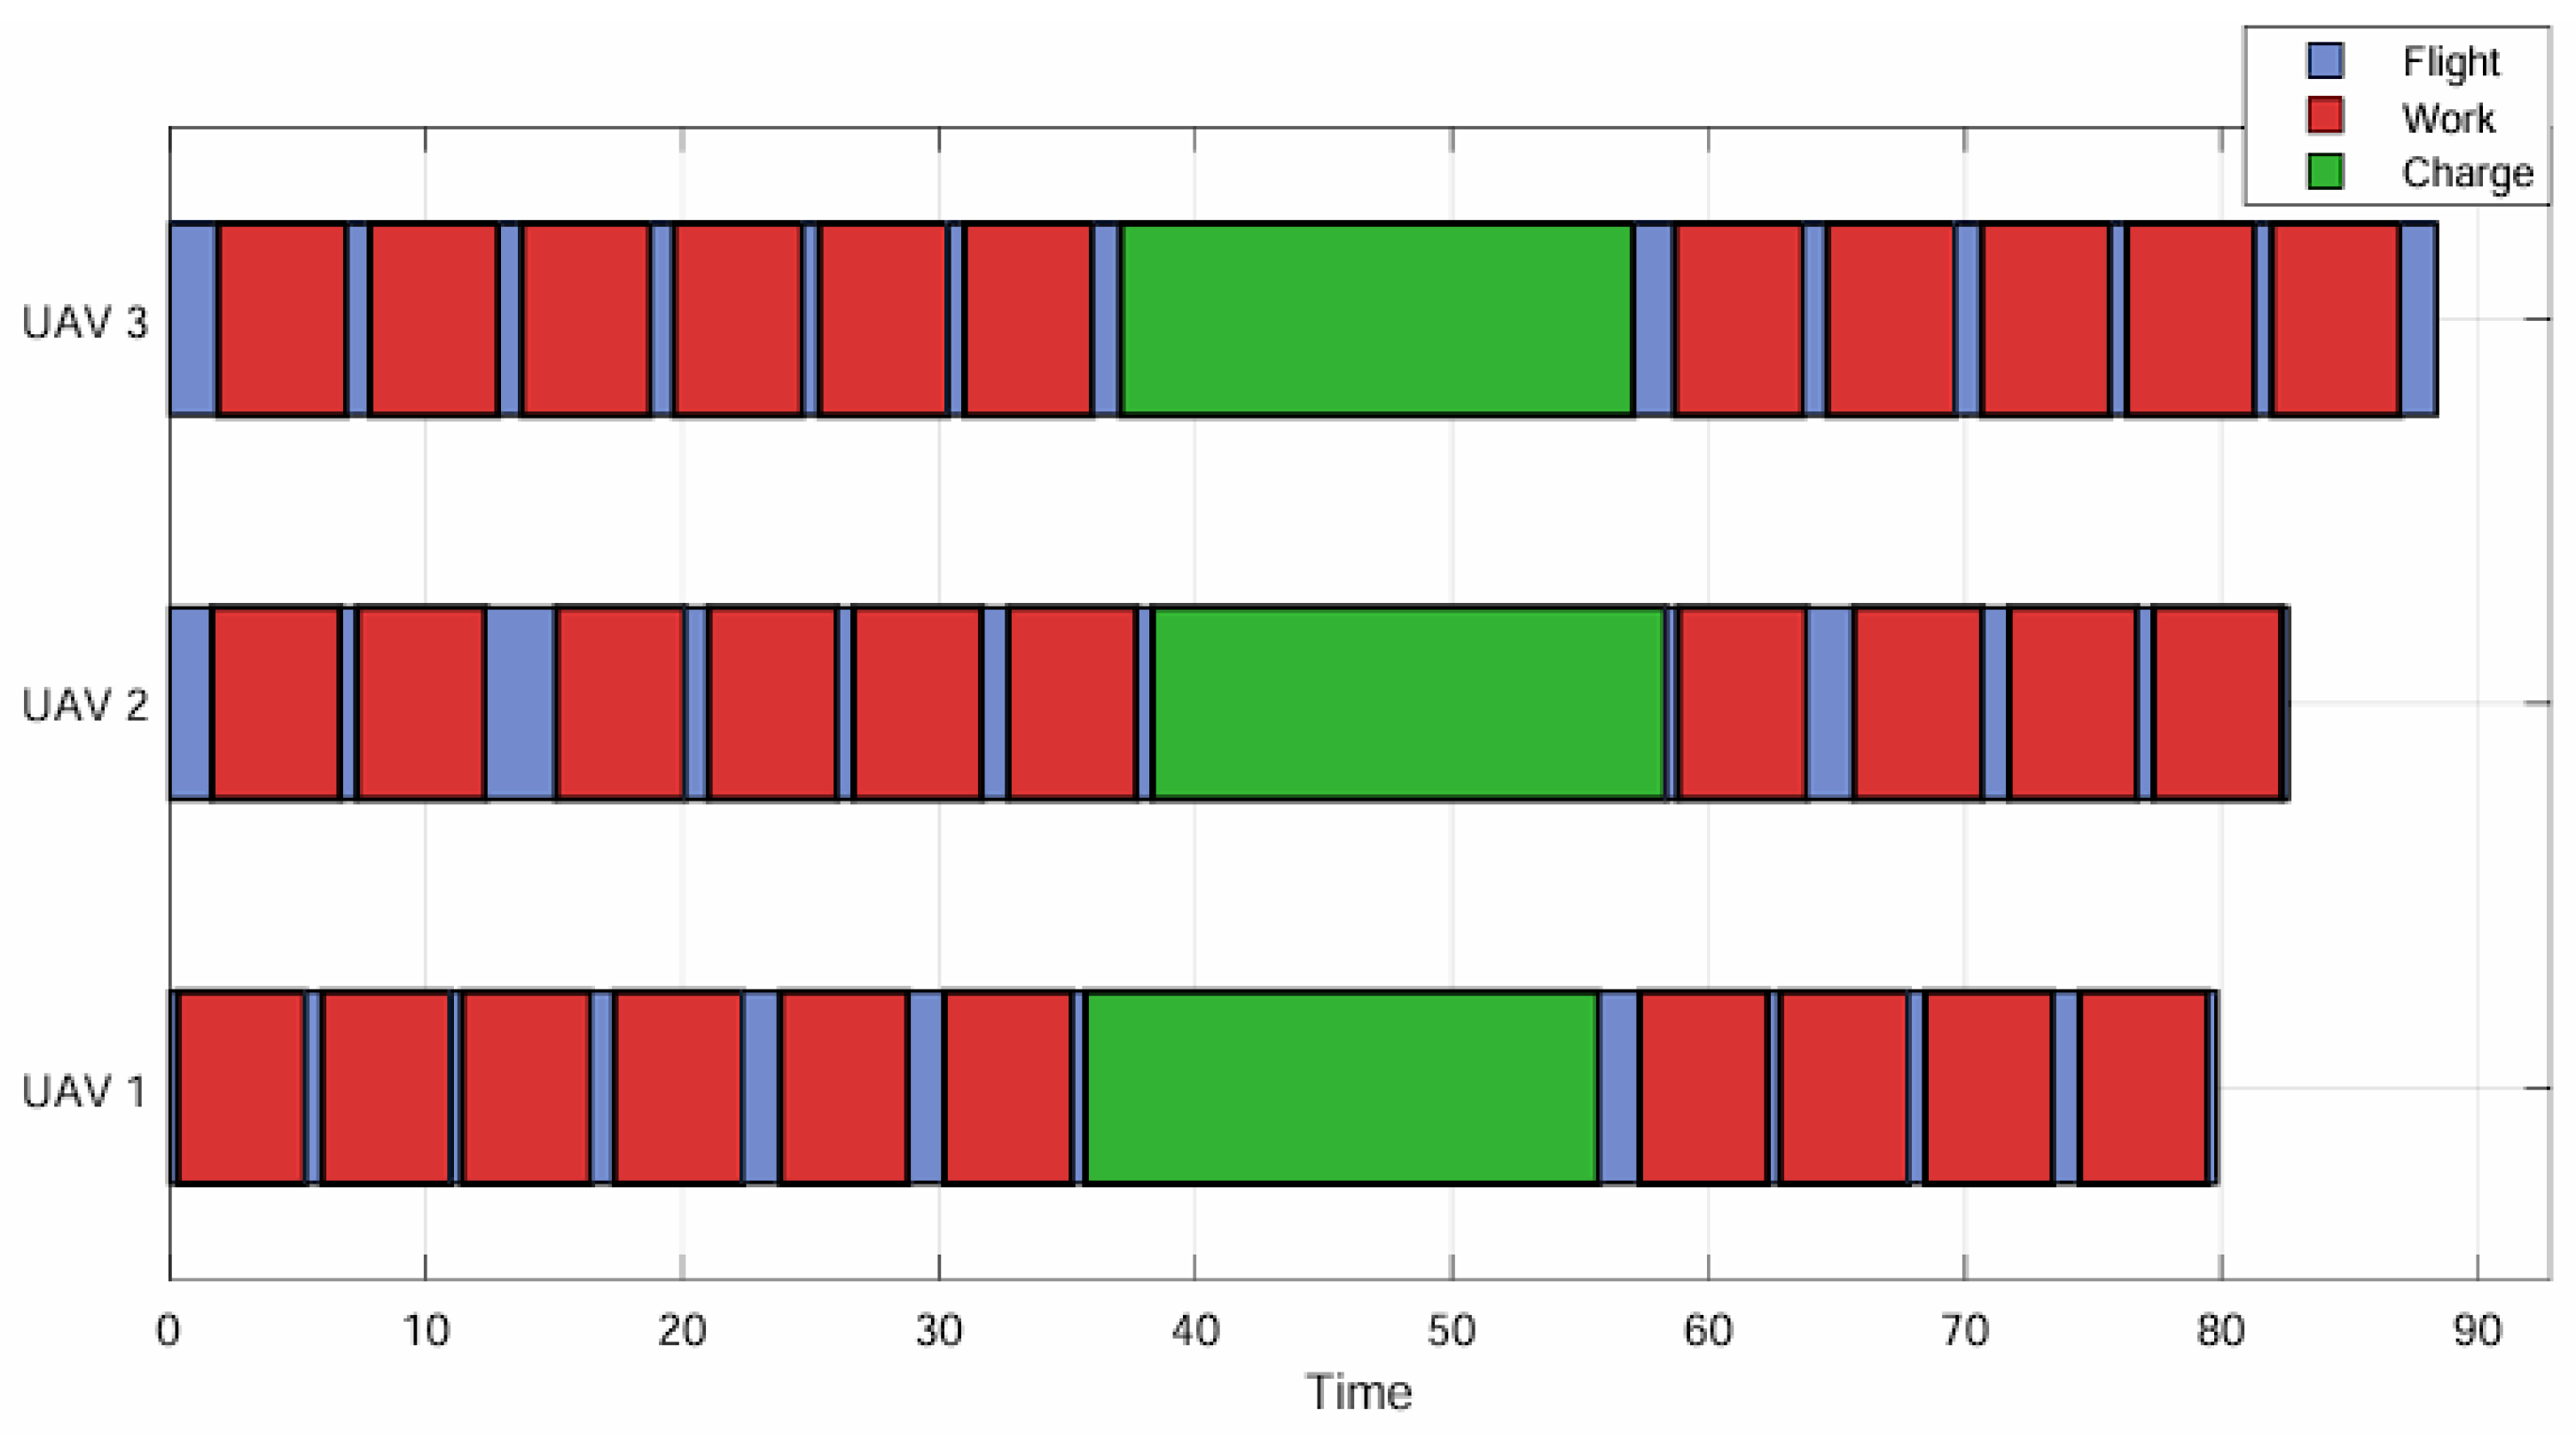
Case 4. Case 4 aims to evaluate the capability of the DDGA algorithm in solving the task allocation problem under scenarios with either a surplus or shortage of UAVs. The capacity of each charging station is set to two. In the simulation experiments, two scenarios are considered: one where the number of UAVs exceeds the number of charging stations, and another where it is fewer. Specifically, the number of UAVs is set to three and five, respectively. The cooperative task allocation results for three UAVs are shown in Figure 17. The Gantt chart of the flight times for the three UAVs is presented in Figure 18. In this graph, the flight durations of different drones are represented by three different colors. The red sections indicate working time, the green sections represent charging time, and the blue sections indicate flight time.
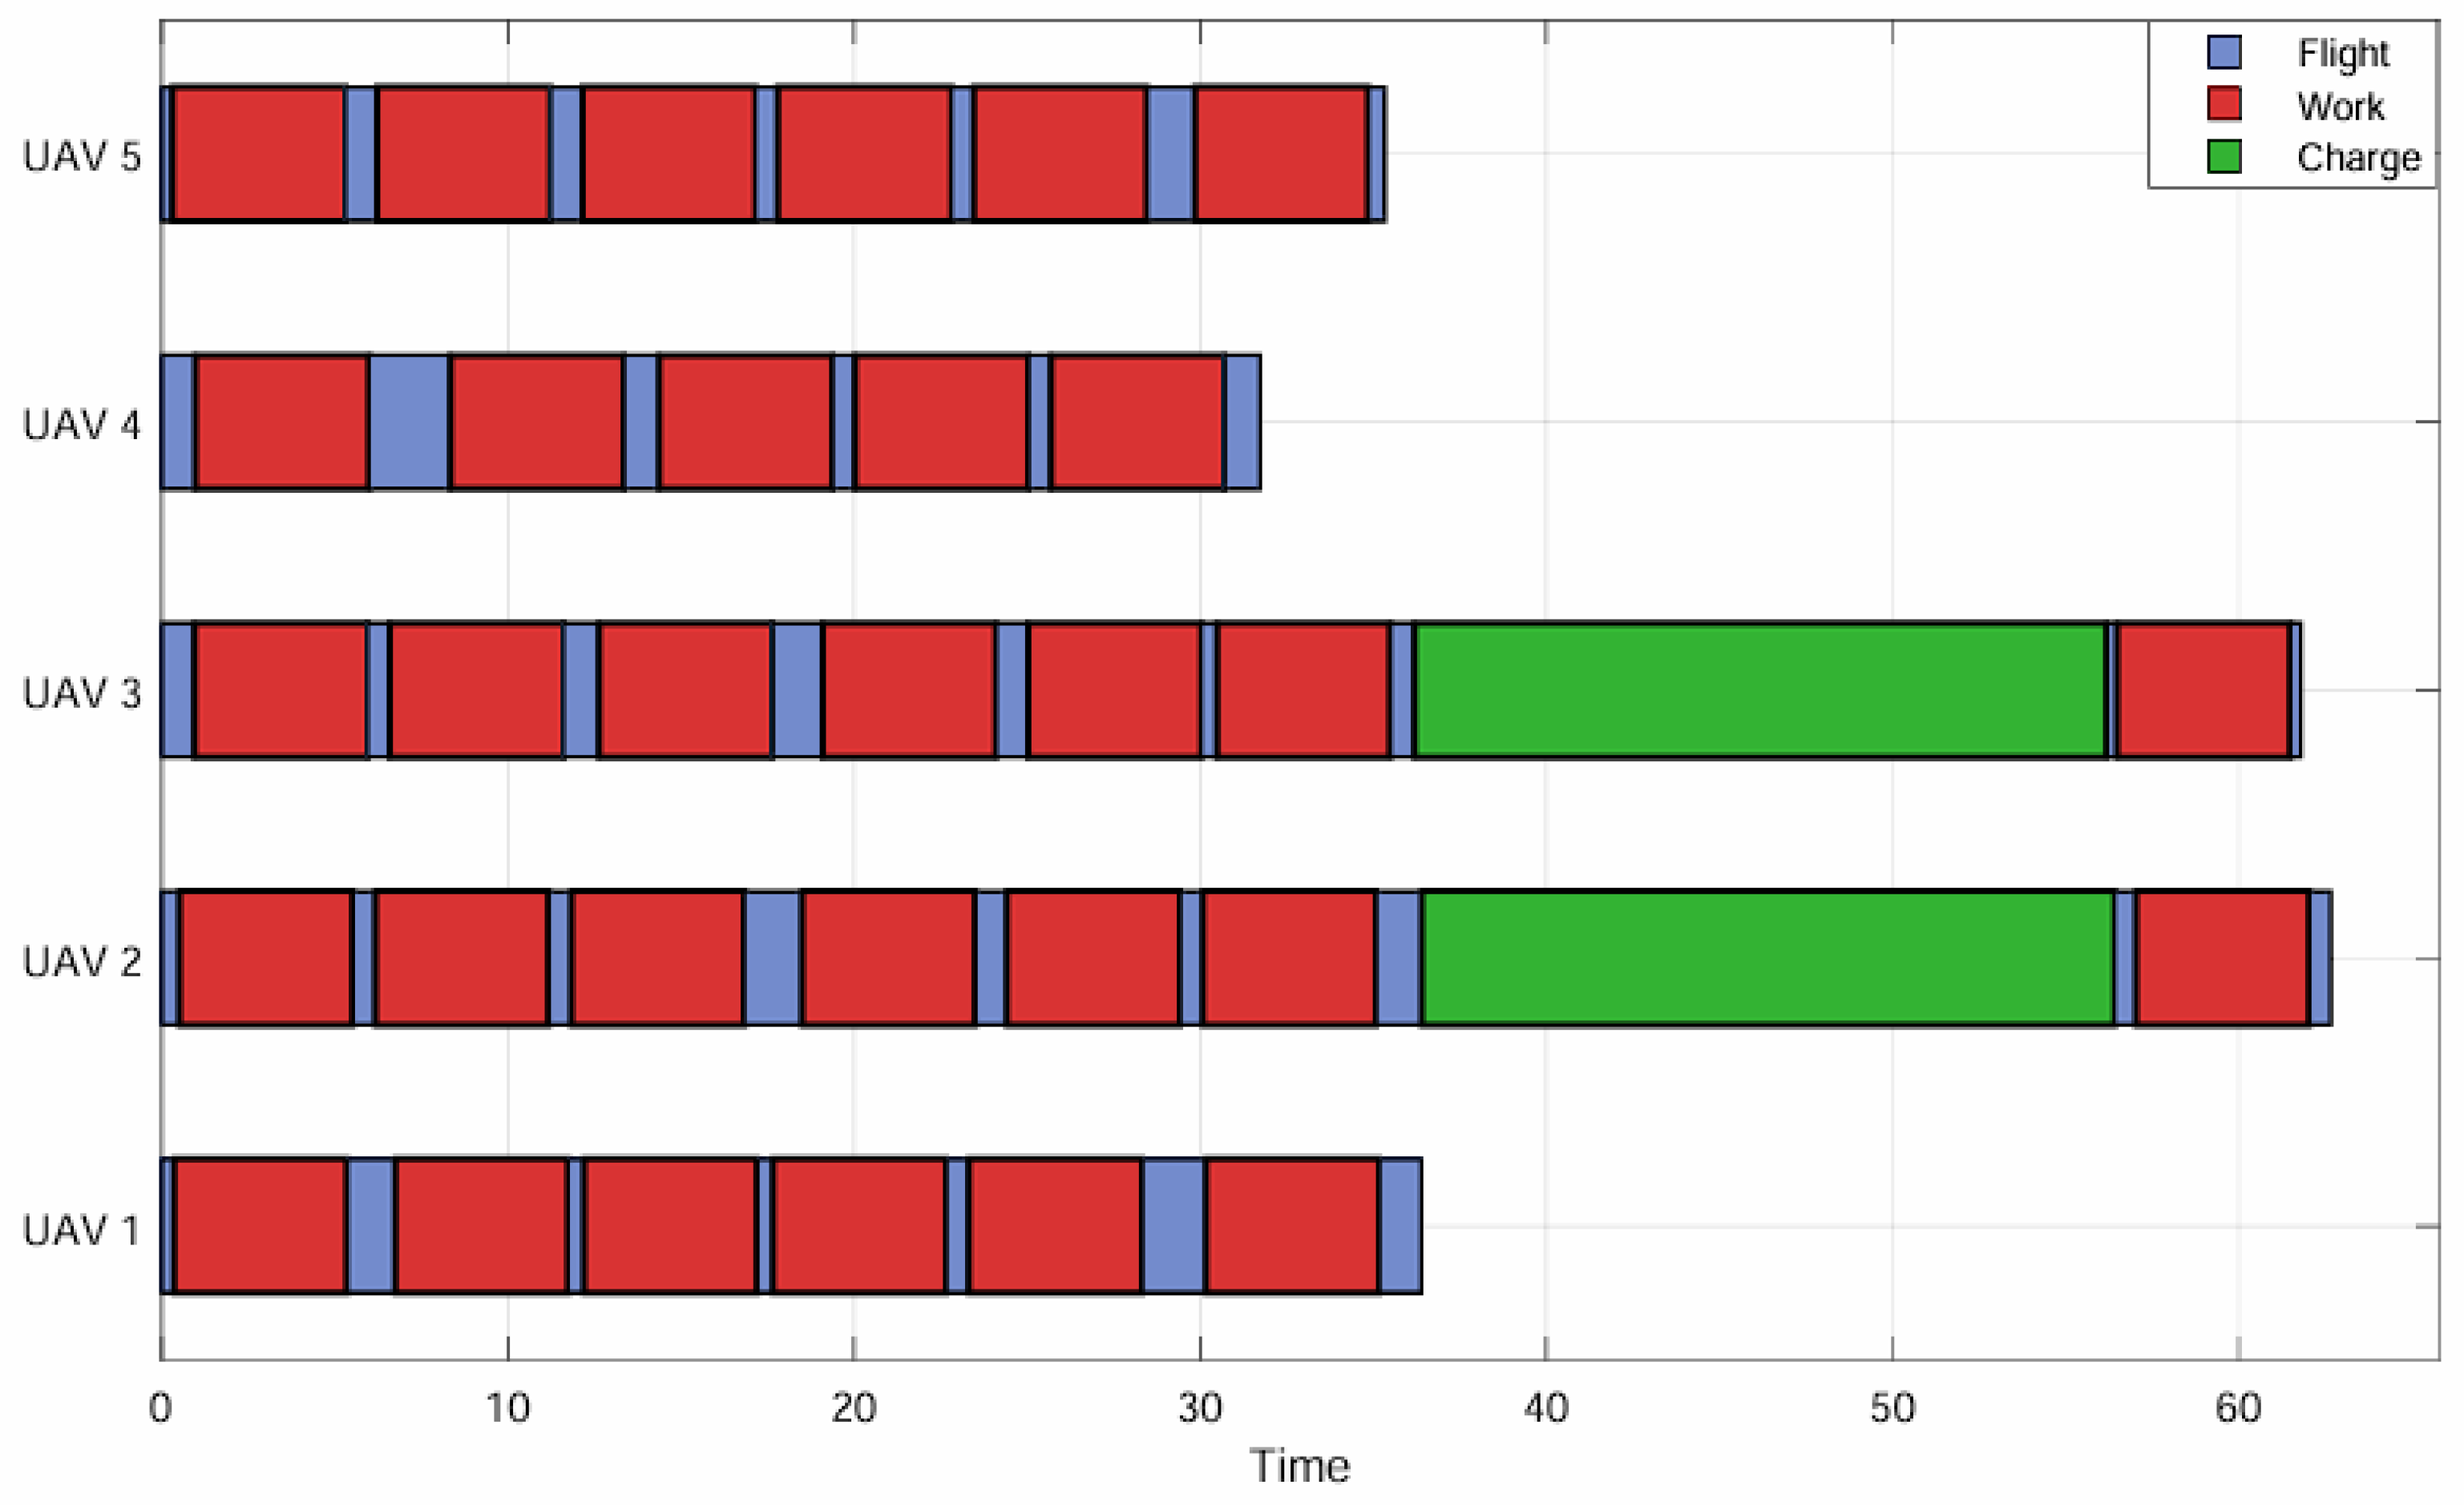
In this case, the operating times of UAVs numbered one to three are 84.23 min, 88.97 min, and 93.75 min, respectively, and the final total task completion time is 93.75 min. Compared with the four-UAV scheme, reducing the number of UAVs will increase the task burden of each individual UAV, increase the number of charging times, and increase the overall task completion time. The collaborative task allocation results of the five UAVs are shown in Figure 19. The flight time Gantt charts of five UAVs are shown in Figure 20. The red numbers represent the charging station numbers, and the black numbers represent the task point numbers. In this case, the running times of UAVs numbered one to five were 36.39 min, 67.85 min, 66.33 min, 31.74 min, and 38.46 min, respectively, and the final total task completion time was 67.85 min. Compared with the four-UAV scheme, increasing the number of UAVs will reduce the task burden of individual UAVs and the overall task completion time. However, as the number of UAVs increases, the cost of UAVs will also increase.

5. Evaluation and Validation

5.1. Sensitive Analysis

In order to verify the effectiveness and universality of the proposed DDGA in various UAV quantity scenarios, a sensitivity analysis was conducted based on the combination of Case 3 and Case 4, with the focus on the changed number of UAVs. In this experiment, although the location of the wind turbine task points and the locations and numbers of the charging stations remain unchanged, the number of UAVs will change (k = 1, k = 2, k = 3, k = 4, k = 5, k = 6, k = 7) to evaluate the solution performance of the DDGA.
Figure 21 describes the changes in the total flight time cost and the price cost of UAVs under seven scenarios. Figure 22 shows the variation curve of the total cost of UAVs with iterations. In Figure 21, the blue solid line represents the total inspection time cost of UAVs, and the red solid line represents the price cost of UAVs, which generally shows a linear relationship with the number of UAVs. Given the huge number of task points, the increase in the number of UAVs will lead to a more uniform task allocation, with each UAV undertaking fewer tasks. This can reduce the redundant travel distance, thereby lowering the total travel time cost. However, as the number of drones continues to increase, the related price cost of each drone will also rise, thereby reducing the cost-effectiveness of the inspection plan. It is not difficult to see from the figure that the cost performance is relatively high when the number of drones is three or four. However, when the number of drones is three or four, the blue line shows that the cost remains basically the same. However, the fitness level brought about by four drones is lower than that of three drones. Therefore, at four drones, the cost-effectiveness is relatively higher.
As shown in Figure 22, when the DDGA is used, all curves show convergence towards feasible solutions. With the increase in the number of UAVs, the convergence speed will slightly accelerate. The reason for this is that as the number of UAVs increases, but the number of task points remains fixed, each UAV is allocated fewer tasks and can find high-quality feasible solutions more quickly.

5.2. Comparison Analysis

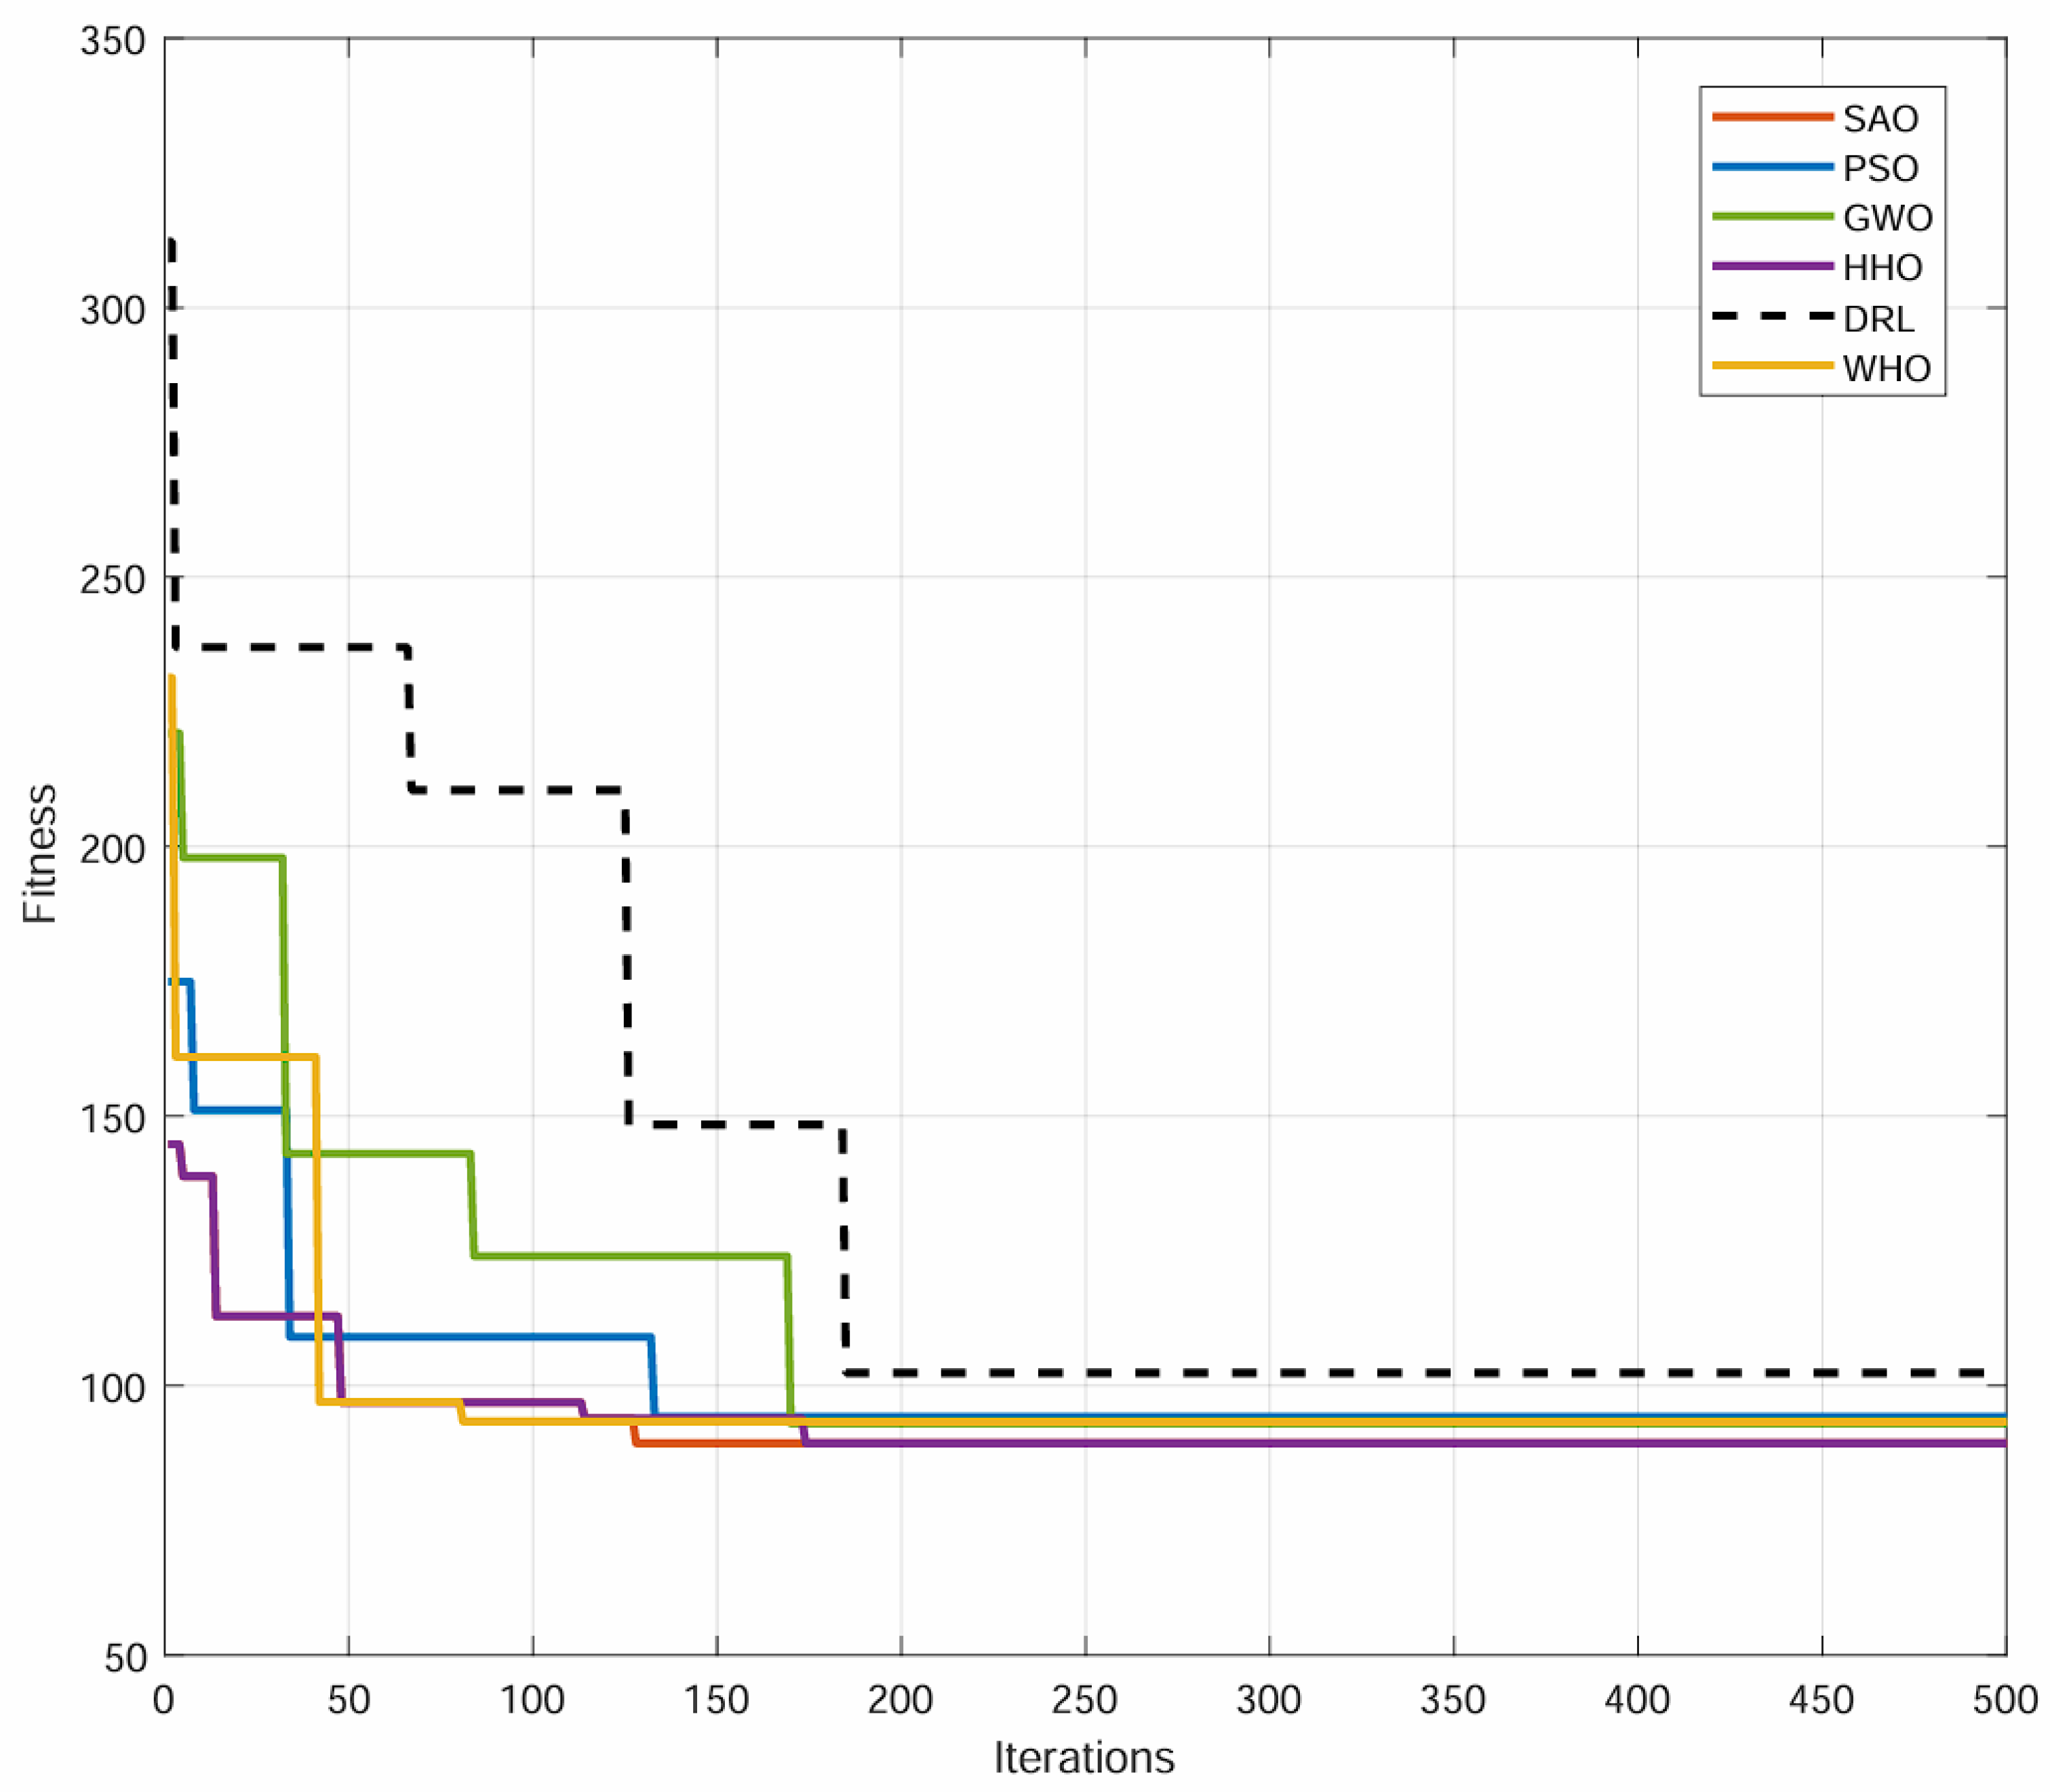
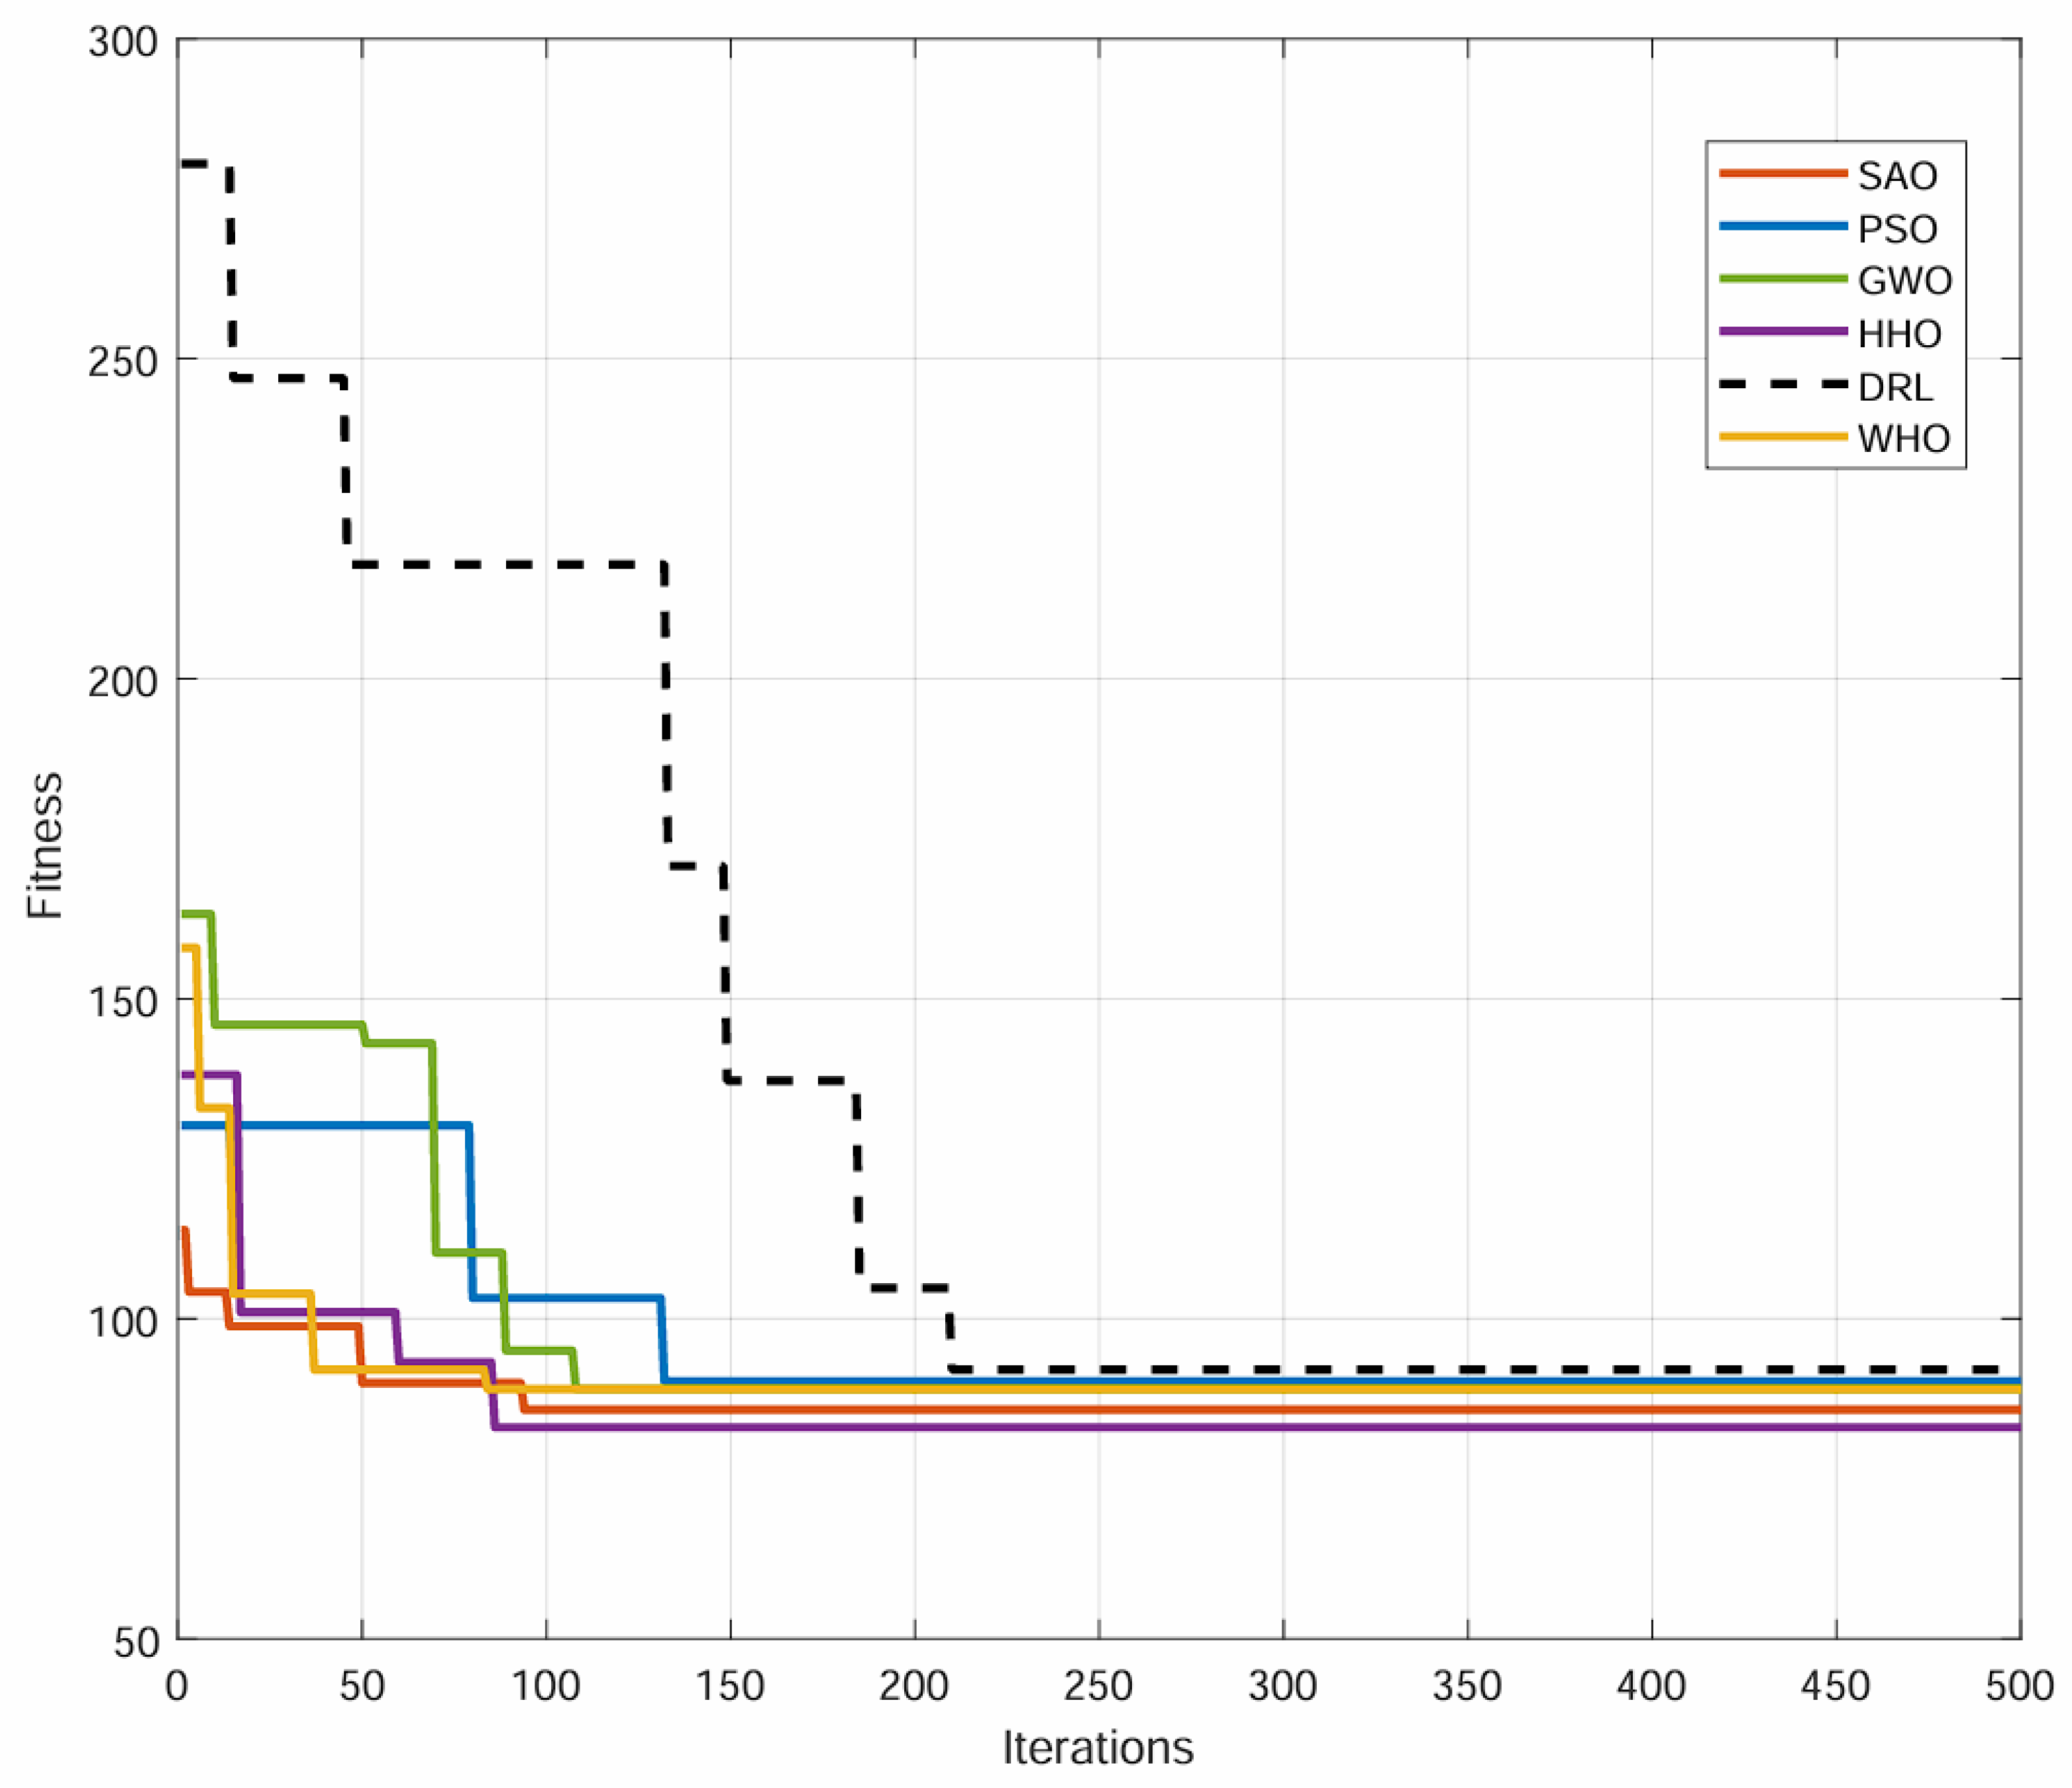
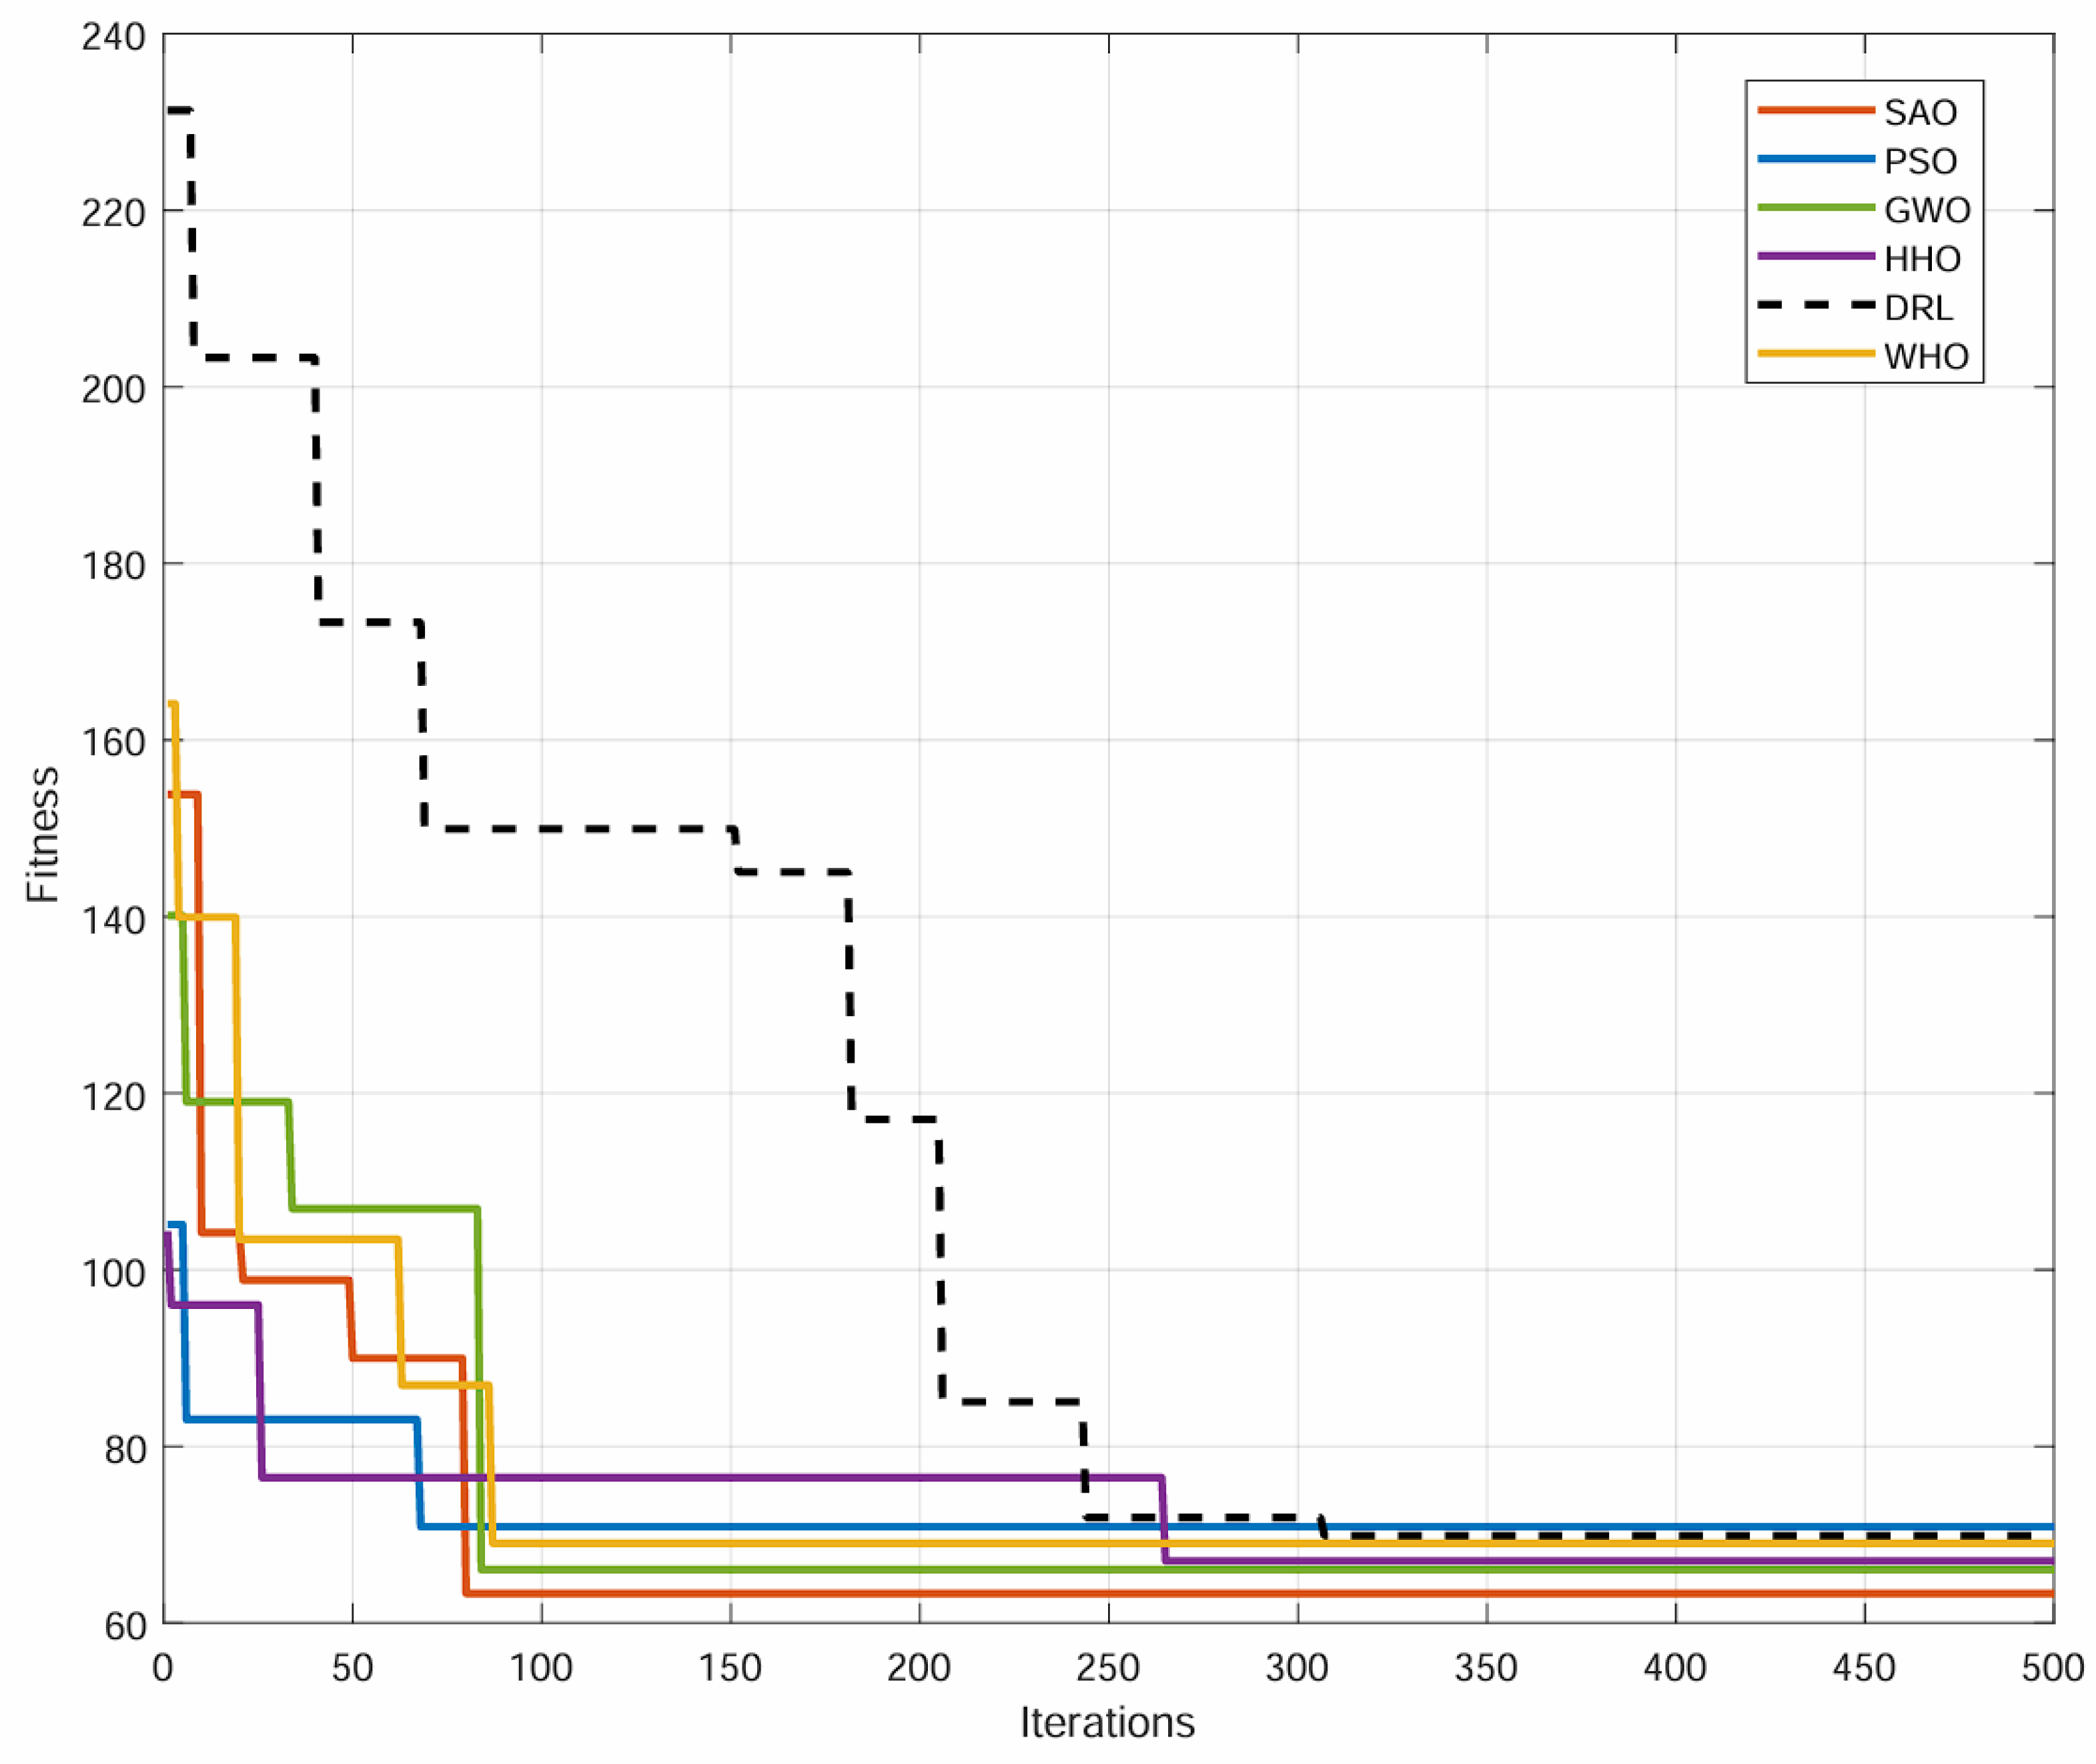
To prove the superiority of the proposed algorithm, this study considers three application scenarios: the number of UAVs is equal to the number of charging stations, the number of UAVs is greater than the number of charging stations, and the number of UAVs is less than the number of charging stations. The number of charging stations is four. The number of UAVs selected for this experiment is (k = 3, k = 4, k = 5). Under these configurations, the proposed DDGA was compared with four algorithms (HHO, WHO, GA-PSO, and GA-GWO) and deep reinforcement learning (DRL). Each algorithm is executed independently 20 times under two application scenarios. All runs use popsize = 50 , crossover probability P c = 0.8 , standard mutation probability P m 1 = 0.2 , and maximum mutation probability P m 2 = 0.4 . Table 4 summarizes the final task allocation statistics—average (AVE), minimum (MIN), and maximum (MAX)—for the four algorithms, computed over the two fitness objectives within each solution set.
Figure 23, Figure 24 and Figure 25 indicate that in these three cases, the HWO algorithm tends to converge prematurely to a local optimal value. Although the quality of its solutions is superior to that of other algorithms, it is inferior compared to the quality of the DDGA solutions. In these three cases, the convergence speed of the GWO algorithm and the PSO algorithm is relatively slow, and the initial solution quality is also poor. The solution effect of the HHO algorithm is better than that of DDGA when the number of unmanned aircraft is four. However, the initial result of the DRL algorithm is poor, but it gradually converges with the learning iterations, and the greater the number of unmanned aircraft, and the fewer tasks each unmanned aircraft is responsible for, the better the effect. In the end, the comprehensive quality of the optimal solutions obtained by them is not as good as the fusion algorithm GA-GWO and DDGA proposed in this paper.

5.3. Scalability Testing

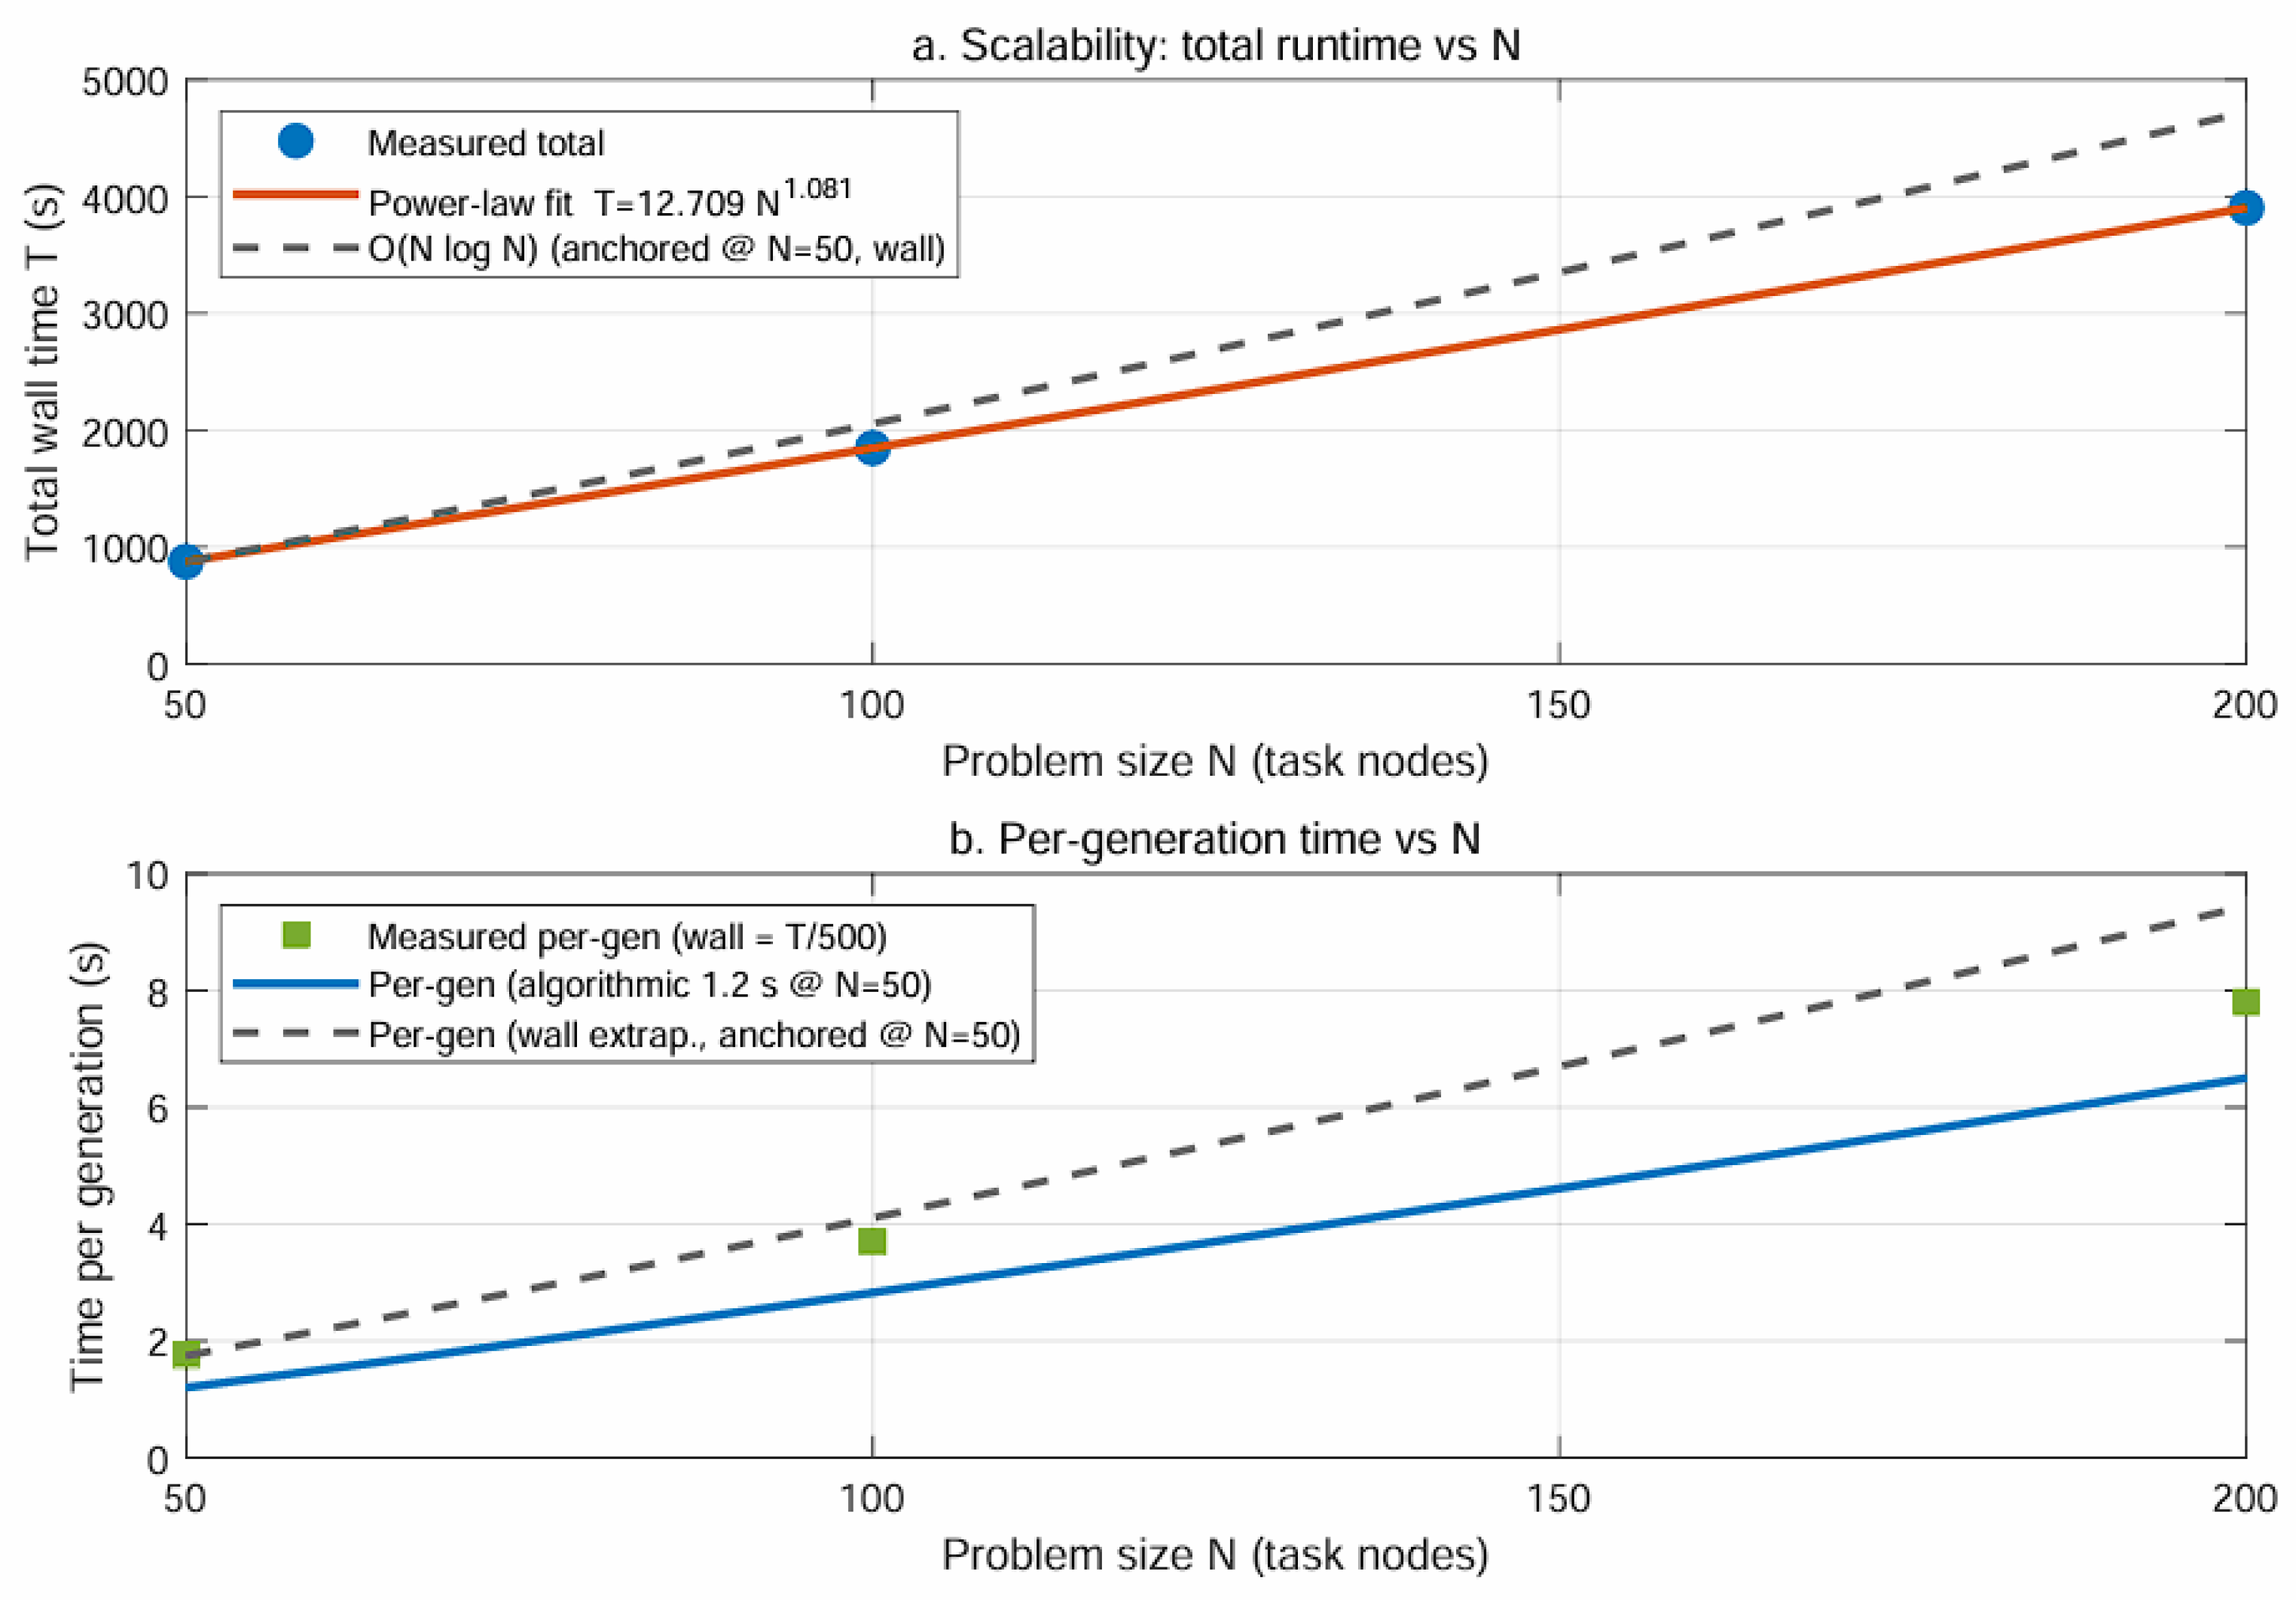
This section will investigate the scalability of this method, expanding the number of fan task points to 50, 100, and 200. Through the optimization model in Section 2.1 and the proposed IPSO algorithm, the number of optimized charging points obtained is 10, 20, and 40, respectively.
Two reporting viewpoints are adopted: (i) the algorithmic per-generation time t gen ( A ) , excluding incidental overhead (measured as 1.2 s at N = 50 ); (ii) the wall-clock per-generation time t gen ( B ) inferred from a budget of 500 generations, and the observed total time T = 872   s at N = 50 , hence t gen ( B ) = 1.744   s .
Following implementation characteristics (route update plus station capacity scanning with event sorting), we use the practical model
t eval c N ln N .
From the N = 50 baseline (200 evaluations per generation), we obtain
c A = 1.2 / 200 50 ln 50 = 3.07 × 10 5 s , c B = 1.744 / 200 50 ln 50 = 4.46 × 10 5 s .
Thus, for a new N, t gen ( N ) t gen ( 50 ) · N ln N 50 ln 50 .
Figure 26 compacts the results. Panel (a) shows the total runtime T versus N in log–log scale, including a power-law fit T c ^ N α ^ to the measured points ( T ( 50 ) = 872 s , T ( 100 ) = 1845 s , T ( 200 ) = 3902 s ), yielding α ^ = 1.081 and c ^ = 12.709 . A dashed O ( N ln N ) reference, anchored at N = 50 (wall-clock viewpoint), is overlaid for comparison. Panel (b) plots per-generation time versus N in log–log scale, showing measured wall clock t gen ( B ) = T / 500 alongside two references: the algorithmic 1.2 s @ N = 50 scaled by N ln N , and the wall clock 1.744 s @ N = 50 scaled likewise. Both panels indicate near-linear growth (slightly super-linear), consistent with O ( N ) O ( N ln N ) behavior.
Table 5 complements Figure 26 by listing per-generation time, total runtime under a fixed budget of 500 generations, and evaluation throughput (evaluations per second) for N { 50 , 100 , 200 } , reported under both viewpoints A (algorithmic) and B (wall clock).
Under the O ( N ln N ) model calibrated at N = 50 , moving to N = 100 increases per-generation time by ≈ 2.35 × and to N = 200 by ≈ 5.42 × . With a fixed budget of 500 generations, total wall clock time scales accordingly. To maintain the same total runtime as at N = 50 , one can proportionally reduce the generation budget by 1 / r ( N ) or lower the evaluations per generation.

6. Conclusions

This paper studies the complex and multi-constraint optimization problem of task allocation for offshore UAV swarms under energy constraints, proposes a collaborative task allocation method for unmanned systems with warehouses, and applies it to the information monitoring of offshore wind power stations. The main contributions of this study are as follows.
  • The IPSO algorithm is proposed based on the establishment of the location optimization model of charging stations, aiming to ensure the flight safety of UAVs and the low-cost location of charging stations, and to optimize the pre-inspection time, preparing for later task allocation research. Through the enhanced search strategy based on elite reverse learning, the global search ability of the PSO algorithm has been improved, and the performance of the algorithm has been enhanced. The simulation results show that the IPSO algorithm is superior to the original PSO algorithm.
  • This work presents an offshore UAV-swarm task allocation model with energy limitations and intricate constraints, optimized for inspection time cost. We devise DDGA, a GA improvement that integrates a dual-population architecture and an elite group, augments performance via piecewise coding and genetic operators, and refines adaptive elite preservation. Experiments in scenarios where charging chambers are more numerous than, fewer than, or equal to the UAVs validate the method and highlight its superiority through comparative tests.
This study focuses on the task allocation of UAV inspection in offshore wind power stations and introduces the application method of unmanned clusters in wind power station inspection under energy constraints. Our research predefined task areas do not involve dynamic factors such as marine animals in real marine environments. Furthermore, this study did not consider the possibility of damage to the UAV during its operation. In the future, we will conduct research to address the aforementioned deficiencies.

Author Contributions

D.Z.: Conceptualization of this study, methodology, and writing the most of the draft. W.L.: Methodology, software, and writing part of the draft. C.L.: Programming. X.H.: Funding acquisition, Data curation. K.L.: Partial writing—review, editing, Supervision. All authors have read and agreed to the published version of the manuscript.

Funding

This research was funded by the research project of Shanghai University of Electric Power (Project Number: 15ZR1418300).

Data Availability Statement

The data used in this study are all simulated data. The coordinates of the task points in the simulated wind farm can be provided if needed.

Acknowledgments

The authors hereby express their sincere gratitude to the relevant units that supported this research. Furthermore, the author would like to express his gratitude to all the team members who participated in the experiments and model tests. They made significant contributions during the data collection, simulation modeling, and algorithm optimization processes. Special thanks go to Zhang Dongliang for his meticulous guidance and valuable suggestions in terms of research ideas and paper writing.

Conflicts of Interest

The authors declare that they have no known competing financial interests or personal relationships that could have appeared to influence the work reported in this paper.

References

  1. Fang, L.; Li, M.; Wang, X.; Chen, Y.; Chen, T. Indo-Pacific finless porpoises presence in response to pile driving on the Jinwan Offshore Wind Farm, China. Front. Mar. Sci. 2023, 10, 1005374. [Google Scholar] [CrossRef]
  2. Reid, K.; Baker, G.B.; Woehler, E.J. An ecological risk assessment for the impacts of offshore wind farms on birds in Australia. Austral Ecol. 2023, 48, 1. [Google Scholar] [CrossRef]
  3. Liu, Y.; Hajj, M.; Bao, Y. Review of robot-based damage assessment for offshore wind turbines. Renew. Sustain. Energy Rev. 2022, 158, 112187. [Google Scholar] [CrossRef]
  4. Gohar, I.; Yew, W.K.; Halimi, A.; See, J. Review of state-of-the-art surface defect detection on wind turbine blades through aerial imagery: Challenges and recommendations. Eng. Appl. Artif. Intell. 2025, 144, 109970. [Google Scholar] [CrossRef]
  5. Tremps, L.; Yeter, B.; Kolios, A. Review and analysis of the failure risk mitigation via monitoring for monopile offshore wind structures. Energy Rep. 2024, 11, 5407–5420. [Google Scholar] [CrossRef]
  6. Cyp, H.G.; Jovanova, J. From Heights to the Deep Sea, a Review of Robots Interacting with Offshore Structures. Robot. Rep. 2024, 2, 85–100. [Google Scholar] [CrossRef]
  7. Zhang, K.; Pakrashi, V.; Murphy, J.; Hao, G. Inspection of Floating Offshore Wind Turbines Using Multi-Rotor Unmanned Aerial Vehicles: Literature Review and Trends. Sensors 2022, 24, 911. [Google Scholar] [CrossRef]
  8. Omara, A.; Nasser, A.; Alsayed, A.; Nabawy, M.R.A. Remote Wind Turbine Inspections: Exploring the Potential of Multimodal Drones. Drones 2025, 9, 4. [Google Scholar] [CrossRef]
  9. Rahman, M.; Sarkar, N.I.; Lutui, R. A Survey on Multi-UAV Path Planning: Classification, Algorithms, Open Research Problems, and Future Directions. Drones 2025, 9, 263. [Google Scholar] [CrossRef]
  10. Foster, A.J.I.; Gianni, M.; Aly, A.; Samani, H.; Sharma, S. Multi-Robot Coverage Path Planning for the Inspection of Offshore Wind Farms: A Review. Drones 2024, 8, 10. [Google Scholar] [CrossRef]
  11. Rendle, E.J.; Hunt, E.L.; Bicknell, A.W.J. A three-step approach for co-locating nature-based solutions within offshore wind farms. Front. Ecol. Evol. 2023, 11, 2296. [Google Scholar] [CrossRef]
  12. Methratta, E.T.; Silva, A.; Lipsky, A.; Ford, K.; Christel, D.; Pfeiffer, L. Science Priorities for Offshore Wind and Fisheries Research in the Northeast U.S. Continental Shelf Ecosystem: Perspectives from Scientists at the National Marine Fisheries Service. Mar. Coast. Fish. 2023, 3, e10242. [Google Scholar] [CrossRef]
  13. Han, S. Survey on UAV Deployment and Trajectory in Wireless Communication Networks: Applications and Challenges. Information 2022, 13, 389. [Google Scholar] [CrossRef]
  14. Messaoudi, K.; Oubbati, O.S.; Rachedi, A.; Lakas, A.; Bendouma, T.; Chaib, N. A survey of UAV-based data collection: Challenges, solutions and future perspectives. J. Netw. Comput. Appl. 2023, 216, 103670. [Google Scholar] [CrossRef]
  15. Mukerjee, L.; Yadav, M.; Choraria, A.; Tendolkar, A.; Hariharan, A.; Manohara Pai, M.M. Aerodock (a smart, autonomous charging and docking station for unmanned aerial vehicles). J. Phys. Conf. Ser. 2022, 2161, 012058. [Google Scholar] [CrossRef]
  16. Diller, J.; Han, Q. Energy-Aware Drone Path Finding with a Fixed-Trajectory Ground Vehicle. ACM J. Auton. Transp. Syst. 2025, 2, 1–33. [Google Scholar] [CrossRef]
  17. Huang, Y.; Chen, Z.; Chu, J.; Wang, H.; Sun, S. Long-term path planning with optimal deployment of a charging station for monitoring photovoltaic solar farms. Sci. Rep. 2024, 14, 17279. [Google Scholar] [CrossRef]
  18. Salameh, H.B.; Othman, A.; Alhafnawi, M. Optimized charging-station placement and UAV trajectory for enhanced uncertain target detection in intelligent UAV tracking systems. Int. J. Cogn. Comput. Eng. 2024, 5, 367–378. [Google Scholar] [CrossRef]
  19. Ma, Z.Y.; Chen, J. Adaptive path planning method for UAVs in complex environments. Int. J. Appl. Earth Obs. Geoinf. 2022, 115, 103133. [Google Scholar] [CrossRef]
  20. Xu, Z.Y.; Wang, Z.; Liu, R.; Huang, C.; Shi, Y.; Wang, M.; Chen, H. Efficient multi-UAV path planning in dynamic and complex environments using hybrid polar lights optimization. J. King Saud Univ. Comput. Inf. Sci. 2025, 37, 1319–1578. [Google Scholar] [CrossRef]
  21. Gabriel, F.C.; Pensado, E.A.; Veiga-López, F.; González-Jorge, H. Efficient offshore wind farm inspections using a support vessel and UAVs. Ocean Eng. 2025, 332, 121416. [Google Scholar] [CrossRef]
  22. Ghambari, S.; Golabi, M.; Jourdan, L.; Lepagnot, J.; Idoumghar, L. UAV path planning techniques: A survey. RAIRO Oper. Res. 2024, 58, 2951–2989. [Google Scholar] [CrossRef]
  23. Krishan, K.; Neeraj, K. Region coverage-aware path planning for unmanned aerial vehicles: A systematic review. Phys. Commun. 2023, 59, 102073. [Google Scholar] [CrossRef]
  24. Serhii, S.; Scislo, L.; Pawlik, M.; Melnychenko, O.; Radiuk, P.; Savenko, O.; Sachenko, A. DyTAM: Accelerating Wind Turbine Inspections with Dynamic UAV Trajectory Adaptation. Energies 2025, 18, 1823. [Google Scholar] [CrossRef]
  25. Khamis, A.; Hussein, A.; Elmogy, A.M. Multi-robot Task Allocation: A Review of the State-of-the-Art. Stud. Comput. Intell. 2015, 1, 31–52. [Google Scholar]
  26. Dijkstra, E. A Note on Two Problems in Connexion with Graphs. Numer. Math. 1959, 1, 269–271. [Google Scholar] [CrossRef]
  27. Hart, P.E.; Nilsson, N.J.; Raphael, B. A Formal Basis for the Heuristic Determination of Minimum Cost Paths. IEEE Trans. Syst. Sci. Cybern. 1968, 4, 100–107. [Google Scholar] [CrossRef]
  28. Archetti, C.; Bianchessi, N.; Speranza, M.G. Branch-and-cut algorithms for the split delivery vehicle routing problem. Eur. J. Oper. Res. 2014, 238, 685–698. [Google Scholar] [CrossRef]
  29. Al-Furhud, M.A.; Ahmed, Z. Experimental Study of a Hybrid Genetic Algorithm for the Multiple Travelling Salesman Problem. Math. Probl. Eng. 2020, 2020, 8864167. [Google Scholar] [CrossRef]
  30. Duan, X.J.; Liu, H.; Tang, H.; Cai, Q.; Zhang, F.; Han, X. A Novel Hybrid Auction Algorithm for Multi-UAVs Dynamic Task Assignment. IEEE Access 2020, 8, 86207–86222. [Google Scholar] [CrossRef]
  31. Huang, J.; Du, B.; Zhang, Y.; Quan, Q.; Wang, B.; Mu, L. A Pesticide Spraying Mission Allocation and Path Planning with Multicopters. IEEE Trans. Aerosp. Electron. Syst. 2024, 60, 2277–2291. [Google Scholar] [CrossRef]
  32. Peng, Z.B.; Sun, S.; Tong, L.; Fan, Q.; Wang, L.; Liu, D. Optimization of offshore wind farm inspection paths based on K-means-GA. PLoS ONE 2024, 19, e0303533. [Google Scholar] [CrossRef] [PubMed]
  33. Huang, X.F.; Wang, G. Optimization for total energy consumption of drone inspection based on distance-constrained capacitated vehicle routing problem: A study in wind farm. Expert Syst. Appl. 2024, 255, 124880. [Google Scholar] [CrossRef]
  34. Chung, H.-M.; Maharjan, S.; Zhang, Y.; Eliassen, F.; Strunz, K. Placement and Routing Optimization for Automated Inspection with UAVs: A Study in Offshore Wind Farm. IEEE Trans. Ind. Inform. 2020, 17, 3032–3043. [Google Scholar] [CrossRef]
  35. Zhao, S.M.; Hwang, S.-H. Complete coverage path planning scheme for autonomous navigation ROS-based robots. ICT Express 2024, 10, 83–89. [Google Scholar] [CrossRef]
  36. Zhao, L.; Bai, Y.; Paik, J.K. Optimal coverage path planning for USV-assisted coastal bathymetric survey: Models, solutions, and lake trials. Ocean Eng. 2024, 296, 116921. [Google Scholar] [CrossRef]
  37. Ismail, A.H.; Song, X.; Ouelhadj, D.; Al-Behadili, M.; Fraess-Ehrfeld, A. Unmanned surface vessel routing and unmanned aerial vehicle swarm scheduling for off-shore wind turbine blade inspection. Expert Syst. Appl. 2025, 284, 127534. [Google Scholar] [CrossRef]
  38. Zhao, C.; Roberts, A.; Cui, Y.; Johanning, L. Strategic Deployment of Service Vessels for Improved Offshore Wind Farm Maintenance and Availability. Mar. Energy Res. 2024, 1, 10003. [Google Scholar] [CrossRef]
  39. Fox, H.; Pillai, A.C.; Friedrich, D.; Collu, M.; Dawood, T.; Johanning, L. A Review of Predictive and Prescriptive Offshore Wind Farm Operation and Maintenance. Energies 2022, 15, 504. [Google Scholar] [CrossRef]
  40. Asim, T.; Islam, S.Z.; Hemmati, A.; Khalid, M.S.U. A Review of Recent Advancements in Offshore Wind Turbine Technology. Energies 2022, 15, 579. [Google Scholar] [CrossRef]
  41. Mohd, H.N.; Sharma, S.; Khan, A.; Gianni, M.; Rajendran, S.; Sutton, R. Collaborative Unmanned Vehicles for Inspection, Maintenance, and Repairs of Offshore Wind Turbines. Drones 2022, 6, 137. [Google Scholar] [CrossRef]
  42. Khalid, O.; Hao, G.; MacDonald, H.; Cooperman, A.; McAuliffe, F.D.; Desmond, C. Cost-benefit assessment framework for robotics-driven inspection of floating offshore wind farms. Wind Energy 2024, 27, 152–164. [Google Scholar] [CrossRef]
  43. Hong, S.; McMorland, J.; Zhang, H.; Collu, M.; Halse, K.H. Floating offshore wind farm installation, challenges and opportunities: A comprehensive survey. Ocean Eng. 2024, 304, 117793. [Google Scholar] [CrossRef]
  44. Xu, Y.; Zhang, G.; Li, J.; Zhang, X. Robust extreme learning machine control for offshore nacelle inspection maneuvering of sea-air cooperative vehicles via asynchronous virtual guidance. Ocean Eng. 2025, 331, 121347. [Google Scholar] [CrossRef]
  45. Li, W.H.; Zhao, T.; Dian, S. Multirobot Coverage Path Planning Based on Deep Q-Network in Unknown Environment. J. Robot. 2022, 2022, 6825902. [Google Scholar] [CrossRef]
  46. Wei, Y.D.; Feng, J.; Huang, Y.; Liu, K.; Ren, B. Path Planning of Mobile Robot Based on Improved Genetic Algorithm. J. Phys. Conf. Ser. 2022, 2365, 012053. [Google Scholar] [CrossRef]
  47. Eberhart, R.C.; Shi, Y. Tracking and optimizing dynamic systems with particle swarms. In Proceedings of the 2001 Congress on Evolutionary Computation, Seoul, Republic of Korea, 27–30 May 2001; pp. 94–100. [Google Scholar]
  48. Dudeja, C.; Kumar, P. An improved weighted sum–fuzzy Dijkstra’s algorithm for shortest path problem (iWSFDA). Soft Comput. 2022, 26, 3217–3226. [Google Scholar] [CrossRef]
  49. Yao, B.Z.; Yan, Q.; Zhang, M.; Yang, Y. Improved artificial bee colony algorithm for vehicle routing problem with time windows. PLoS ONE 2017, 12, 1–18. [Google Scholar] [CrossRef]
  50. Liu, Z.W.; Qiu, C.; Zhang, Z. Sequence-to-Sequence Multi-Agent Reinforcement Learning for Multi-UAV Task Planning in 3D Dynamic Environment. Appl. Sci. 2022, 12, 12181. [Google Scholar] [CrossRef]
  51. Zhu, T.B.; Xiao, Y.; Zhang, H. Maritime patrol tasks assignment optimization of multiple USVs under endurance constraint. Ocean Eng. 2023, 285, 115445. [Google Scholar] [CrossRef]
Figure 1. Process diagram of inspection task execution.
Jmse 13 01711 g001
Figure 2. Diagram of the coordinate system of the UAV.
Jmse 13 01711 g002
Figure 3. UAV yaw angle diagram.
Jmse 13 01711 g003
Figure 4. A and B segment coding structure diagram.
Jmse 13 01711 g004
Figure 5. Coding example (n = 8).
Jmse 13 01711 g005
Figure 6. Uniform crossover operation diagram.
Jmse 13 01711 g006
Figure 7. Partially matched crossover operation diagram (PMX).
Jmse 13 01711 g007
Figure 8. Random mutation operation diagram.
Jmse 13 01711 g008
Figure 9. Insertion mutation operation diagram.
Jmse 13 01711 g009
Figure 10. Flow chart of the DDGA.
Jmse 13 01711 g010
Figure 11. Simulated task area.
Jmse 13 01711 g011
Figure 12. Optimizing the location of charging stations in Case 1.
Jmse 13 01711 g012
Figure 13. Comparison between IPSO and traditional PSO algorithms.
Jmse 13 01711 g013
Figure 14. The relationship between the fitness and cost of the charging station.
Jmse 13 01711 g014
Figure 15. The collaborative task allocation results of the 4-UAV system.
Jmse 13 01711 g015
Figure 16. Curve of 4 UAVs’ total cost curve.
Jmse 13 01711 g016
Figure 17. The collaborative task allocation result of the 3-UAV system.
Jmse 13 01711 g017
Figure 18. The time-of-flight Gantt chart of the 3-UAV system.
Jmse 13 01711 g018
Figure 19. The collaborative task allocation result of the 5-UAV system.
Jmse 13 01711 g019
Figure 20. The time-of-flight Gantt chart of the 5-UAV system.
Jmse 13 01711 g020
Figure 21. The total cost curve and price cost curve of a UAV.
Jmse 13 01711 g021
Figure 22. The curve of the total cost of UAVs varying with iteration.
Jmse 13 01711 g022
Figure 23. Comparison of the total cost iteration curves of 3 UAVs.
Jmse 13 01711 g023
Figure 24. Comparison of the total cost iteration curves of 4 UAVs.
Jmse 13 01711 g024
Figure 25. Comparison of the total cost iteration curves of 5 UAVs.
Jmse 13 01711 g025
Figure 26. Scalability with measured points ( N = 50 , 100 , 200 ). (a) Total runtime T (blue circles) with power-law fit T = c ^ N α ^ (red line, α ^ = 1.081 ) and an N ln N reference anchored at N = 50 (grey dashed). (b) Per-generation time: measured wall-clock T / 500 (green squares), algorithmic reference 1.2 s scaled by N ln N (blue), and wall-clock reference 1.744 s scaled by N ln N (grey dashed).
Jmse 13 01711 g026
Table 1. Charging station coordinates.
NumberXYNumberXY
11460.81550033762.144017.54
2573.6152281.2142814.06769.866
Table 2. Simulation parameter.
ParametersValue
Algorithm parametersMaximum number of iterations: MaxIter500
Population size: Popsize200
Crossover probability: P c 0.8
Mutation probability: P m 1 0.4
Mutation probability: P m 2 0.4
UAV parametersUAV speed: v u 18 m/s
The maximum flight endurance time: E40 min
Table 3. Cooperative task allocation data result with four UAVs.
Task Sequence IdentifierOperating Time of the UAV
UAV1(32, 28, 24, 27, 31, 30, 26, 22, 19, 15)84.42 min
UAV2(34, 33, 25, 23, 21, 16, 14)69.13 min
UAV3(20, 18, 12, 9, 5, 6, 10, 7)71.48 min
UAV4(8, 11, 13, 17, 29, 35)71.92 min
Table 4. Performance comparison of 6 algorithms under different load configurations.
UAV number = 3AVEMAXMIN
DDGA85.7897.0382.94
GA-PSO94.23101.3889.23
GA-GWO92.9399.0487.71
HHO89.2997.5684.75
WHO93.3298.4688.16
DRL102.35113.1689.72
UAV number = 4AVEMAXMIN
DDGA84.4290.6481.58
GA-PSO90.2397.0387.46
GA-GWO89.0293.7983.23
HHO83.0492.1181.36
WHO89.0396.0382.61
DRL92.04103.4489.60
UAV number = 5AVEMAXMIN
DDGA63.3569.4159.87
GA-PSO70.9078.2465.73
GA-GWO66.0373.0163.48
HHO67.0374.5060.04
WHO69.0378.4361.30
DRL69.8683.9165.17
Table 5. Scalability numbers matching Figure 26: per-generation time, total runtime (500 generations), and evaluation throughput under an O ( N ln N ) scaling from the N = 50 baseline. Viewpoint A uses the measured 1.2 s /gen; viewpoint B uses the wall clock 1.744 s /gen derived from 872 s /500 generations.
N (A) t gen (s/gen)Total (500 gen) (s/min)Eval/s
501.200600.0/10.0166.7
1002.8251412.6/23.570.8
2006.5013250.5/54.230.8
N (B) t gen (s/gen)Total (500 gen) (s/min)Eval/s
501.744872.0 / 14.5114.7
1004.1062053.0 / 34.248.7
2009.4484724.0 / 78.721.2
Disclaimer/Publisher’s Note: The statements, opinions and data contained in all publications are solely those of the individual author(s) and contributor(s) and not of MDPI and/or the editor(s). MDPI and/or the editor(s) disclaim responsibility for any injury to people or property resulting from any ideas, methods, instructions or products referred to in the content.