1. Introduction
China has established itself as a global leader in hydropower development, with dams serving as critical infrastructure that significantly impacts national development and public welfare [
1]. In recent years, the safety of hydropower dams has faced escalating challenges, making inspection tasks increasingly demanding. Hydraulic structures are prone to environmental erosion, material aging, and long-term load effects, leading to defects such as cavitation, abrasion, and corrosion [
2,
3]. These issues result in cumulative structural damage and resistance degradation, potentially triggering catastrophic failures. Consequently, dam inspection serves as a vital means to identify and assess defects and hidden risks, as well as a key basis for evaluating structural safety and implementing reinforcement measures. Underwater robotic inspection has emerged as a promising solution but introduces new challenges. Hydropower stations present harsh underwater conditions, including extreme depths, widespread defect distribution, prolonged maintenance periods, complex turbulent flows, and poor visibility [
4]. Traditional diver-based methods are limited by inherent safety risks, restricted coverage, and low efficiency, rendering them inadequate for comprehensive inspections. Given these challenges, large-scale hydropower stations have increasingly prioritized safety monitoring and health diagnostics, driving the adaptation of underwater robotic technology from marine exploration to hydraulic engineering [
5].
The Hunan Institute of Water Resources and Hydropower Research introduced the Stealth 3 Remotely Operated Vehicle (ROV) produced by Canadian underwater robotics manufacturer Shark Marine, which has been deployed for underwater inspection work at Huangcai Reservoir in Ningxiang County, Guanshi Reservoir in Liuyang City, Baiyun Power Station in Chengbu County, and Tianxin Dam Sluice in Xinning County [
6]. The ROV main unit is equipped with detection sensors including an underwater high-definition camera, 2D multibeam imaging sonar, position and depth sensors, and comes with a control handle. China Southern Power Grid and China State Shipbuilding Corporation jointly developed an intelligent inspection robot [
7] that has achieved full coverage of acoustic–optical inspection at depths of 1000 m and in tunnels up to 2000 m long. This system supports ROV/Autonomous underwater vehicle (AUV) dual-mode switching and has been successfully applied at Hainan Pumped Storage Power Station and Jinping Hydropower Station. At the Datengxia Hydro Project, ROVs equipped with optical cameras, high-resolution 3D scanning sonar, 2D multibeam imaging sonar, laser measurement devices, and high-precision ultra-short baseline (USBL) positioning systems were used as platforms [
8] to conduct close-range observation and measurement of underwater structures including dams, stilling basins, and gates. Simultaneously, a high-resolution multibeam bathymetry system was employed to create 3D dam models by integrating with the dam’s design plans. Reference [
9] describes the application of ROVs for inspecting the diversion tunnel at Nanshui River Power Station in Guangdong Province. The approximately 4.5 m diameter, 218 m long tunnel revealed multiple defects including cracks, exposed reinforcement bars, and surface spalling during inspection. The Shandong Mainline Company of the South-to-North Water Diversion Project’s eastern route commissioned the Shandong Hydraulic Research Institute to inspect the Yellow River Crossing Tunnel [
10]. Using ROVs equipped with sonar and underwater cameras, they scanned and photographed tunnel walls, expansion joints, and fault zones to examine the tunnel’s actual operating condition. ROV inspections require continuous online support from highly skilled operators, which increases both labor and technical costs. Raffi et al. [
11] conducted inspections of a 3.2 km-long horseshoe-shaped concrete-lined tunnel using ROVs and performed 3D reconstruction of data obtained from multibeam sonar scans. The Yalong River Hydropower Development Company [
12] implemented ROV underwater inspection technology for the diversion tunnels at Jinping II Hydropower Station. For this inspection, the ROV was equipped with four horizontal vector thrusters and two vertical thrusters, along with multiple sensors, marking China’s first complete underwater inspection of a 2 km-long tunnel.
The effective deployment of underwater robots for accurate inspection of hydropower dam surfaces, particularly under the challenging hydraulic conditions commonly found in hydropower stations, requires highly intelligent and robust control systems. The performance of these control systems is crucial for navigation stability, precise defect localization, anti-interference capability, and sensor integration, fundamentally determining the success and reliability of inspection missions. This bottleneck issue is particularly prominent in current underwater robotic applications for complex underwater environments of hydropower dams.
This paper addresses the critical technological gap in the design of efficient and intelligent control systems for underwater dam inspection robots in hydropower stations. We focus on developing a specialized control system for underwater dam structure inspection robots, consisting of the following:
An underwater robotic control unit,
A surface human–machine operation unit,
A mission planning control unit,
A multi-robot coordination control unit, and
Surface control software.
The system achieves the following:
Various motion control modes including hovering, and maintaining fixed depth/height/orientation/speed/distance;
Disturbance-resistant motion control capability for underwater robots;
Precise distance control for dam surface inspection under multiple working conditions (horizontal, vertical, and inclined surfaces).
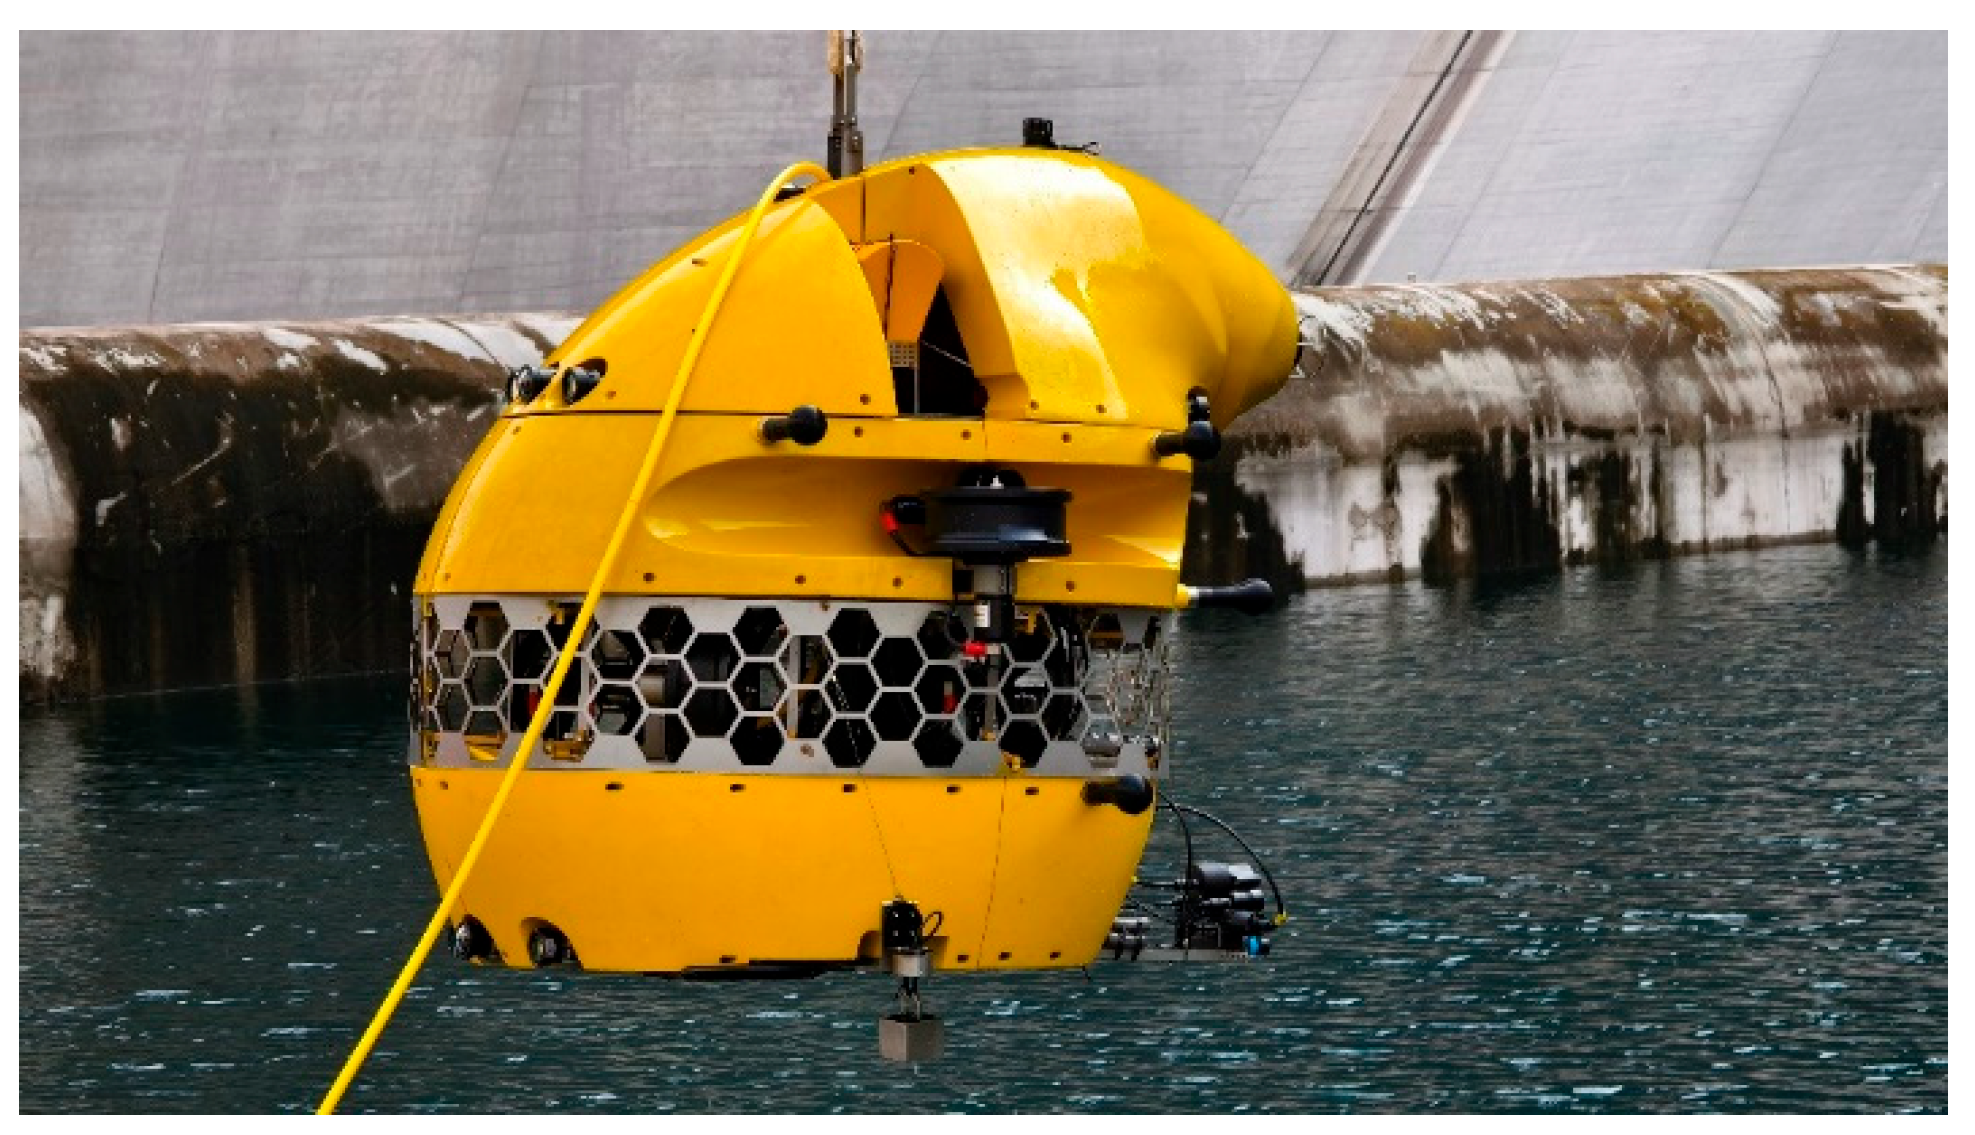
The proposed control system aims to overcome specific challenges in dam inspection, thereby contributing to safety assessment and maintenance practices for these critical national infrastructure assets. (
Figure 1)
The main contributions of this research are as follows:
- 1.
Most existing systems rely on fixed parameter control. The algorithm presented in this paper dynamically estimates complex water flow disturbances and compensates in real-time, significantly enhancing control accuracy under strong turbulence conditions.
- 2.
By utilizing independent networking and data preprocessing modules, it addresses the issues of data latency and noise from multiple sensors, outperforming traditional centralized processing. It supports collaborative operations and expands the detection coverage.
- 3.
Combining Adaptive Super-Twisting (ASTW) with a fixed-time observer, finite-time convergence is achieved under parameter uncertainty, avoiding the traditional high-gain chattering issue.
The remainder of this paper is structured as follows:
Section 2 (Hardware Design of Control System) details the integrated sensing-actuation platform.
Section 3 (Control System Software Design) presents the adaptive disturbance-rejection control algorithm.
Section 4 (Field Validation at Baihetan Hydropower Station) quantifies the system’s performance under turbulent flow conditions.
Section 5 (Conclusions) summarizes key innovations, operational limitations, and future extensions.
2. Hardware Design of Control System
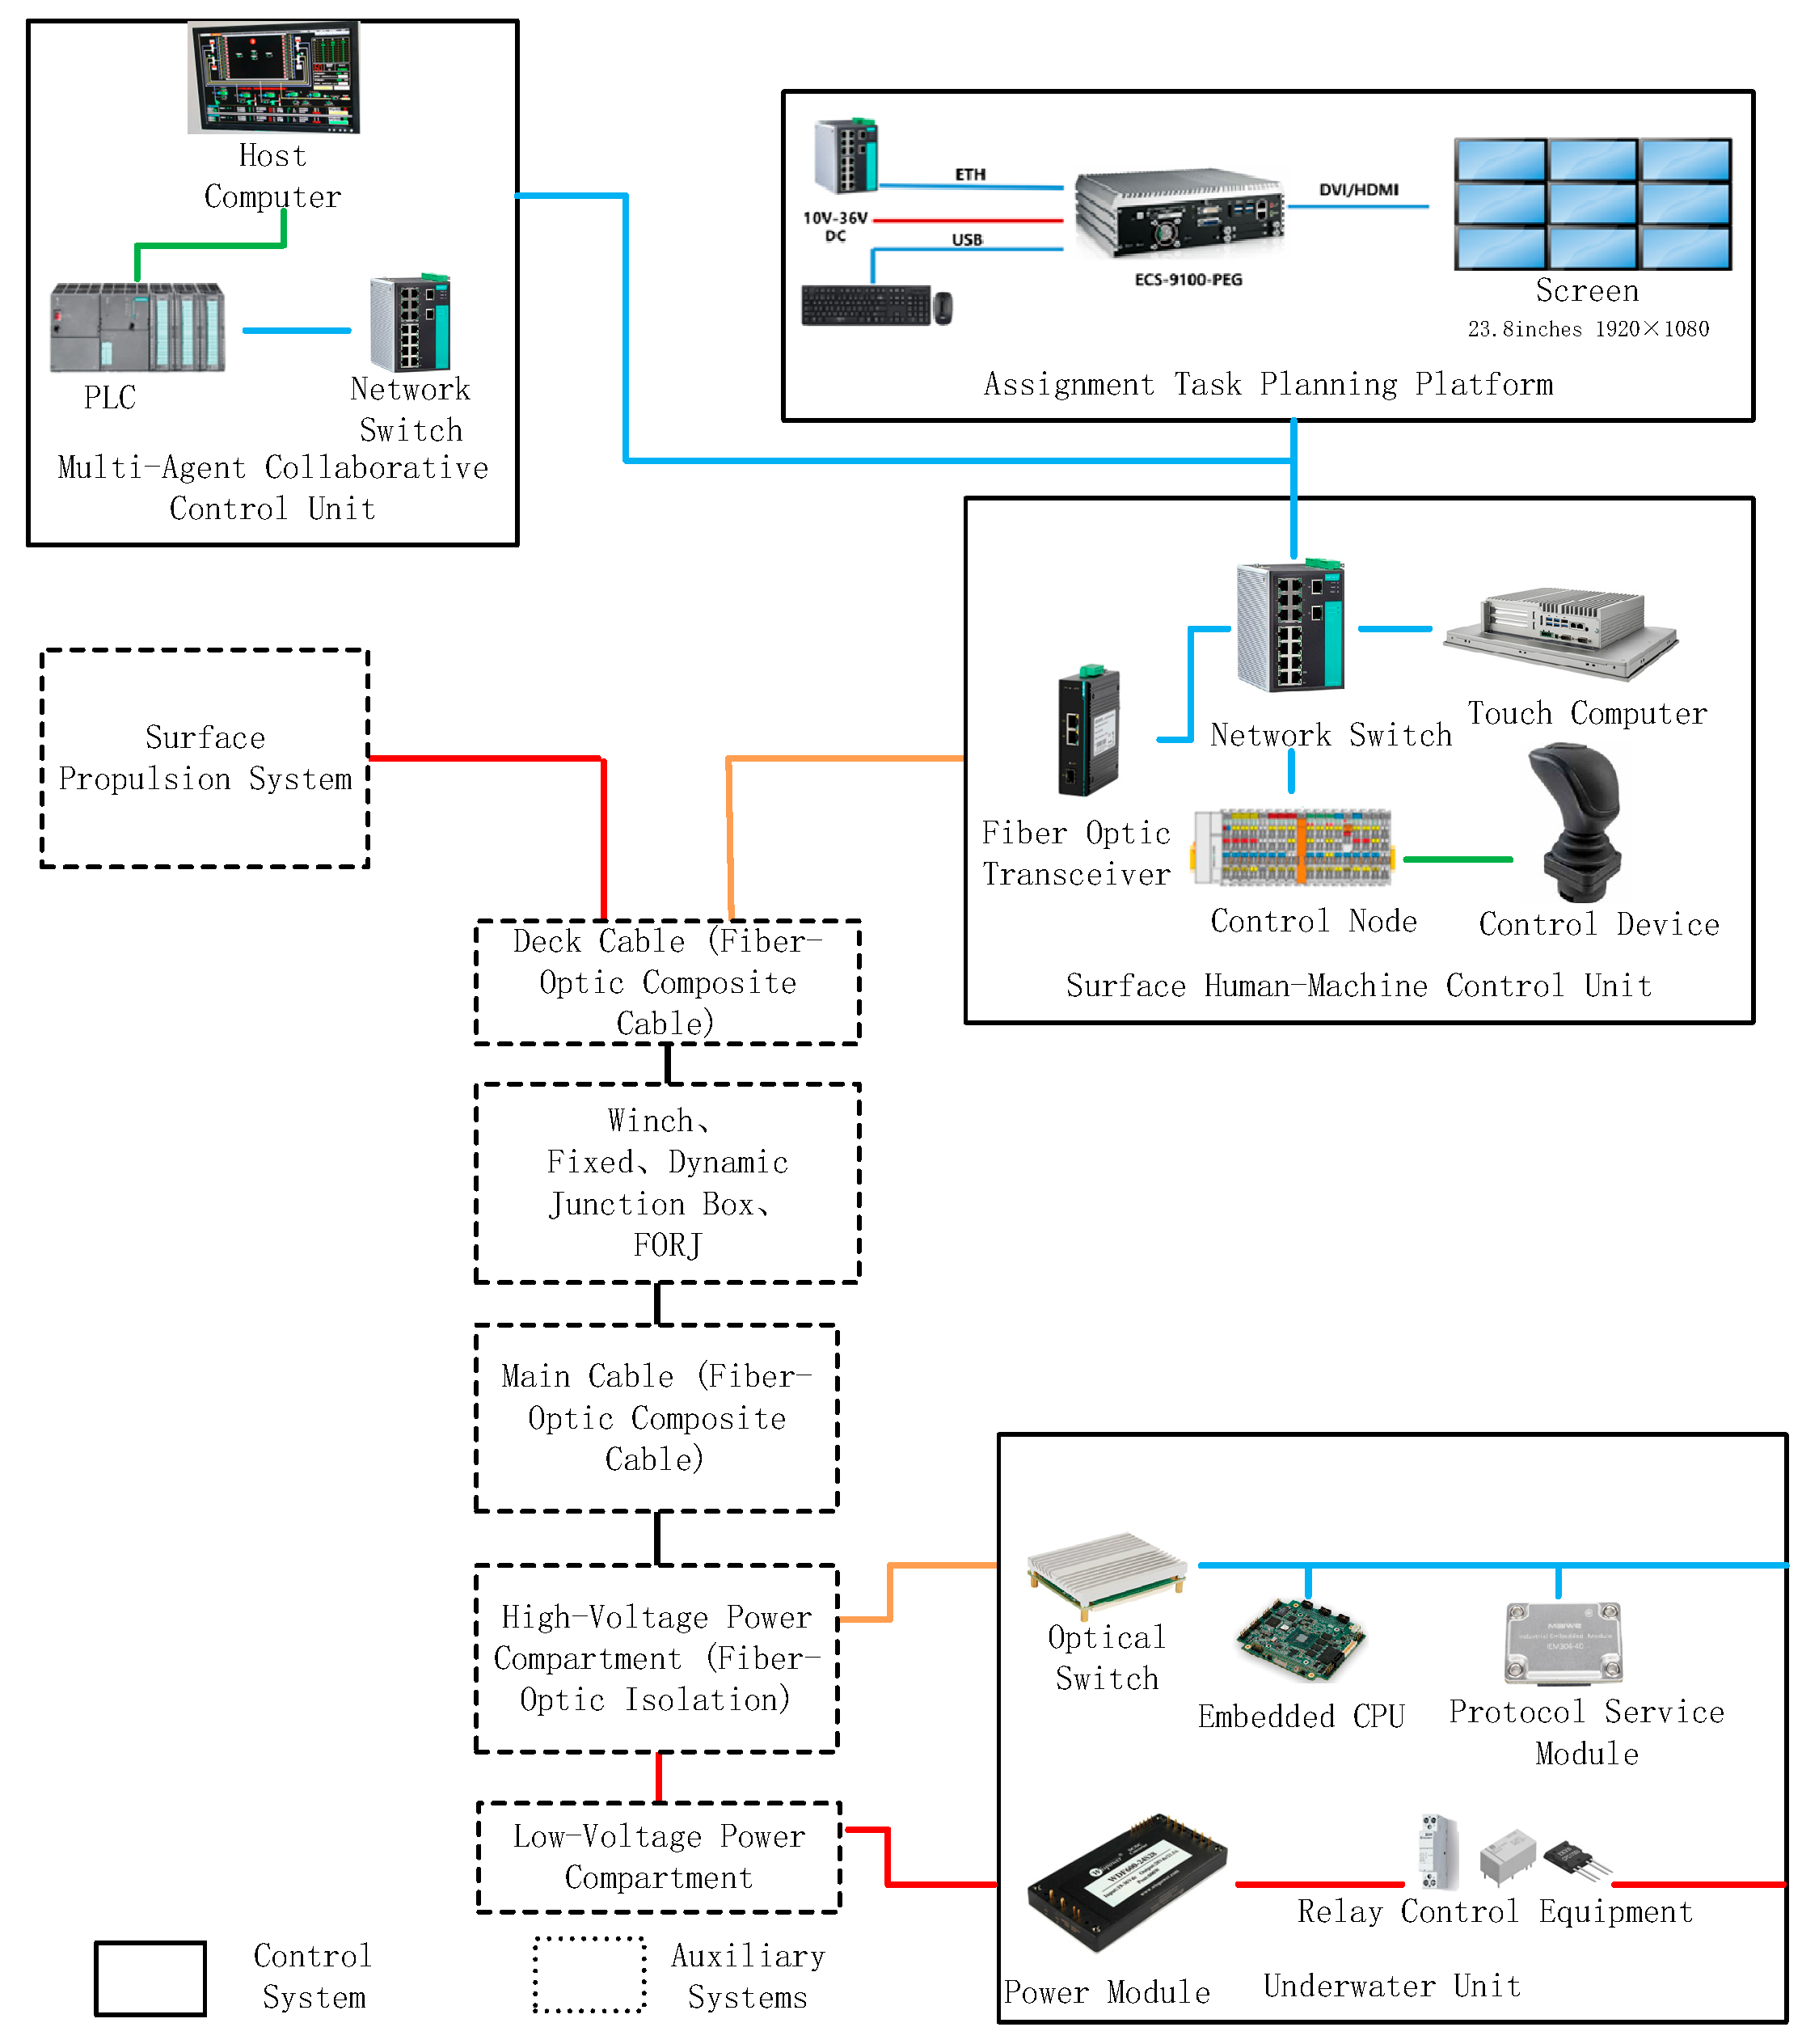
The control system can be divided into the following components: underwater unit, surface human–machine operation unit, mission planning platform and multi-robot coordination control unit. The last three components are integrated into the surface-based local control platform. Communication between surface and underwater systems is achieved through fiber-optic links and control system networks. Under the coordination of control system software, these components collectively accomplish underwater robot control tasks. The system architecture and interconnection methods are illustrated in the following diagram (
Figure 2).
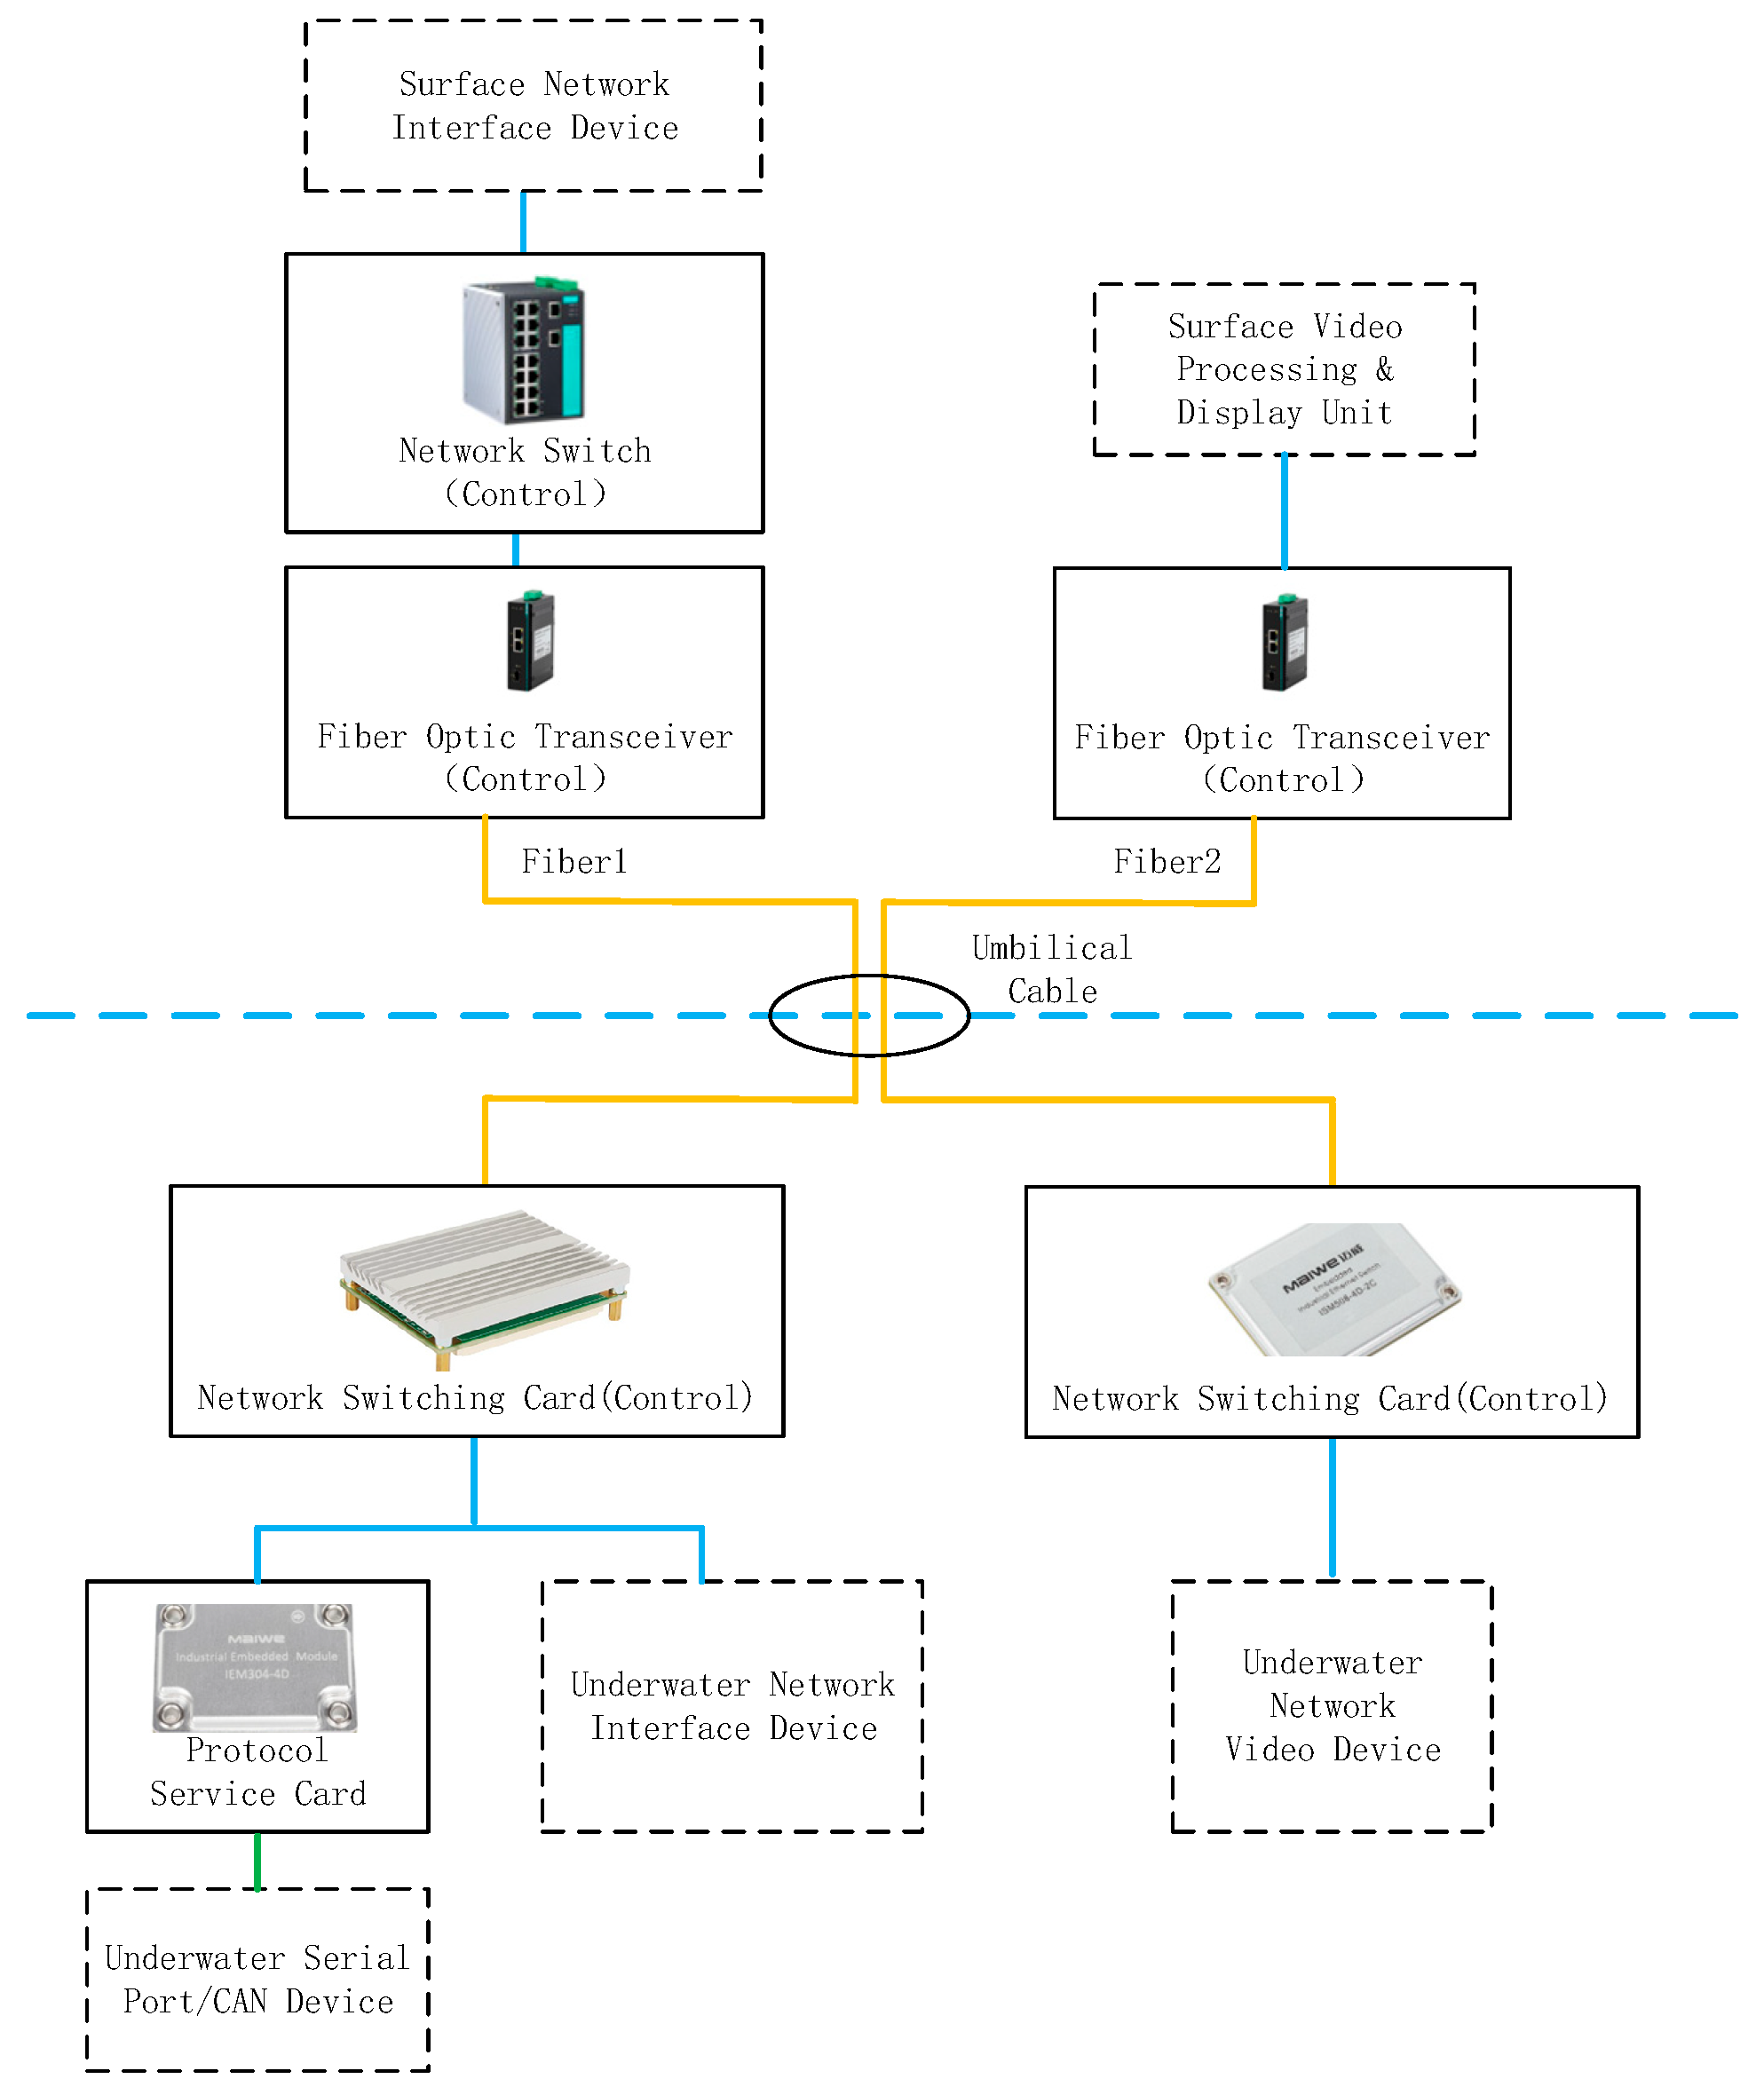
The surface human–machine operation unit, mission planning platform, and multi-robot coordination control unit are installed in the console of the surface control room. The surface human–machine operation unit primarily includes the following: operation panel, power supply, touch-control computer, node control module, and network switch. The mission planning platform mainly consists of a compact computer and multi-screen PC equipment. The multi-robot coordination control unit primarily comprises a host computer, PLC, and network switch. The underwater unit is installed in the main control cabin of the underwater robot vehicle, including the following: power supply, PC/104 module group, network switch board, protocol service board, relay control board, and integrated detection board. The control system requires high-volume data transmission (video data, control signals, etc.) between surface and underwater units, with a range of hundreds of meters. Fiber-optic communication technology is adopted to achieve long-distance, high-bandwidth composite data transmission. The system utilizes MW-ISM series industrial network switch modules to implement these functions. These core modules feature ultra-compact design, customizable PCB backplane development, multiple interface configurations (configurable as optical ports). This enables flexible surface–underwater networking with these modules as the core. To reduce latency and ensure real-time control data transmission, separate networks are established for control and video streams, transmitted via dedicated fiber-optic channels.
The surface–underwater networking schematic of the control system is shown in the following diagram (
Figure 3).
2.1. Underwater Control Unit of the Vehicle
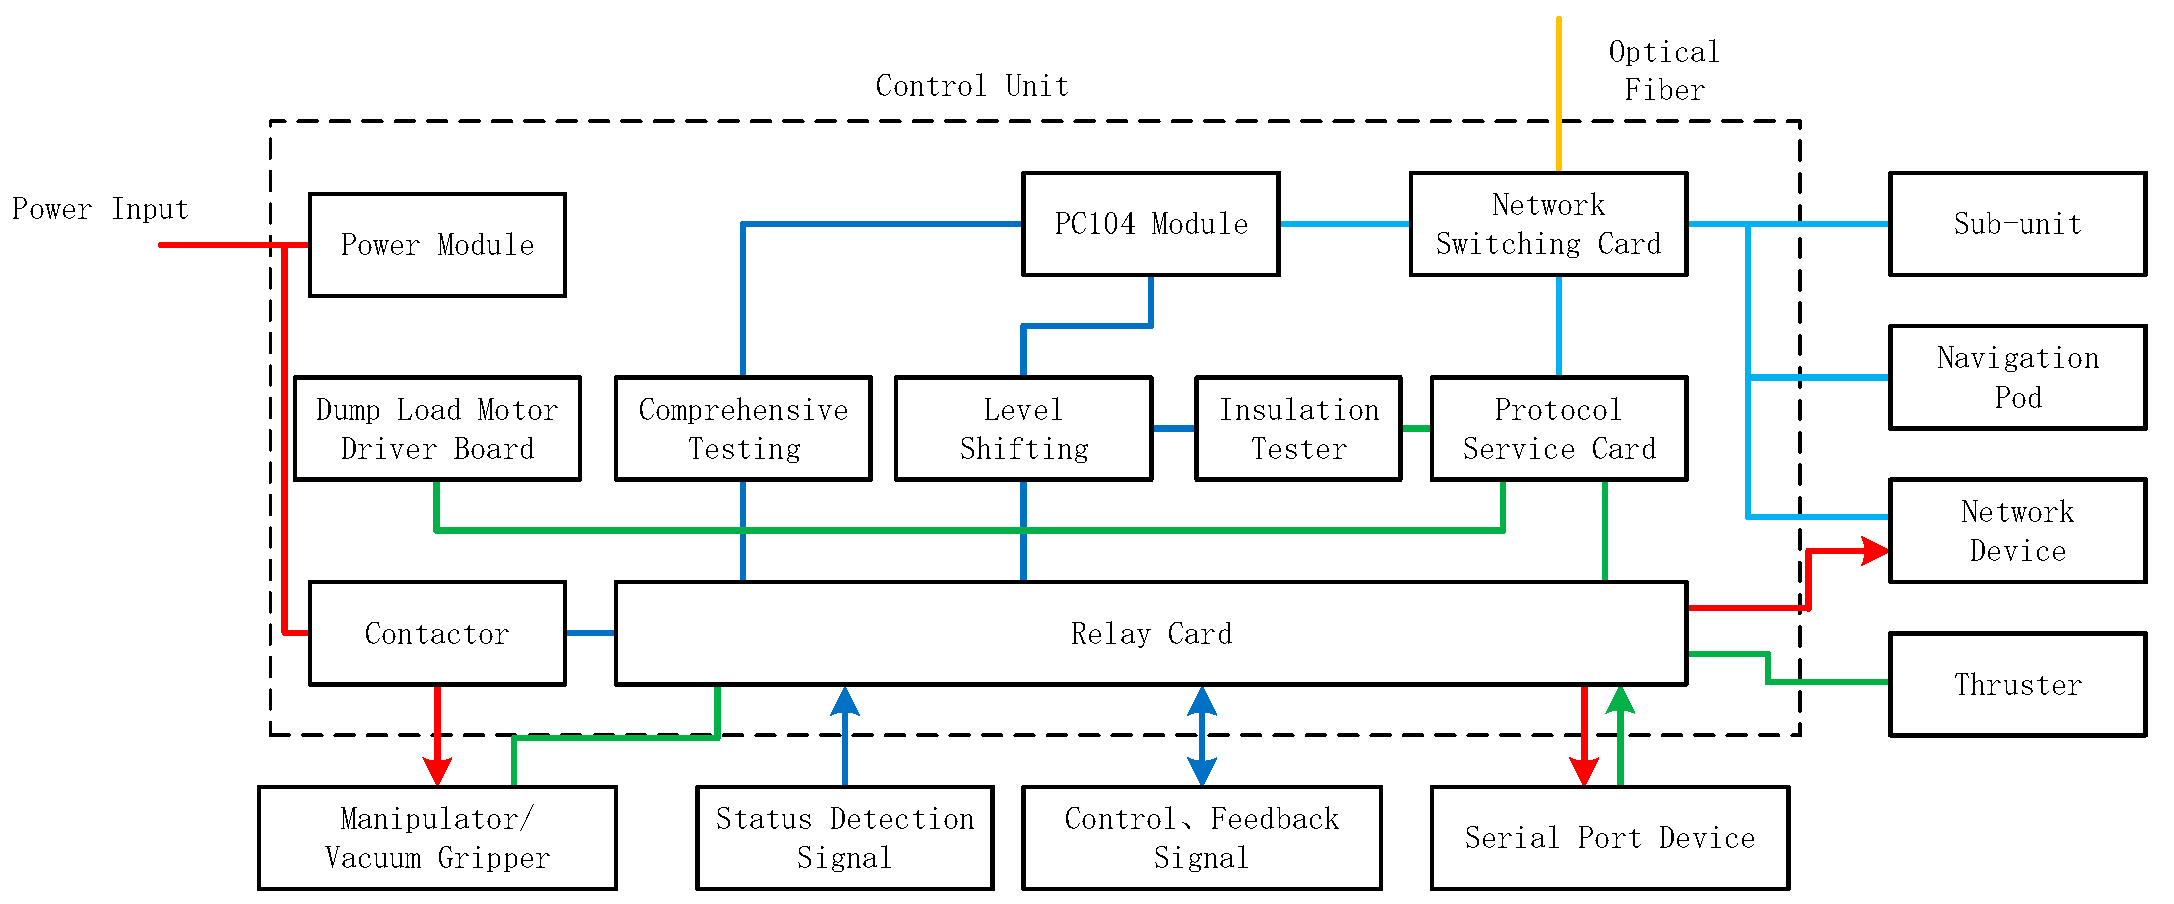
The control unit functions as an electronic core module, housed within the main pressure housing. It integrates a power supply, PC/104 embedded module array, and peripheral subsystems for communication, relay control, and comprehensive monitoring. The overall schematic of the unit is presented below (
Figure 4).
The embedded CPU within the PC/104 module array functions as the core of the control unit, executing surface control software. The embedded CPU accesses the control network via an Ethernet switch card to communicate with subsidiary units, navigation cabins, and other networked devices; utilizes optical channels of the Ethernet switch card for surface communication; and interfaces with serial devices and CAN bus thrusters through a protocol service card connected to the control network. Peripherals directly interfaced with the main pressure housing are powered under the control of relay cards and contactors. These relay cards simultaneously manage the connectivity of serial ports, CAN interfaces, and external level-signal interfaces. Power control signals for the relay cards/contactors and other control commands are issued by the embedded CPU via an I/O expansion module in the PC/104 array. Level conversion circuitry matches signal levels between the PC/104 I/O expansion module and output control/external feedback signals. The integrated monitoring module conditions operational status signals (internal/external to the electronic module) into formats detectable by the PC/104 interface modules.
2.2. Electronic Module Design
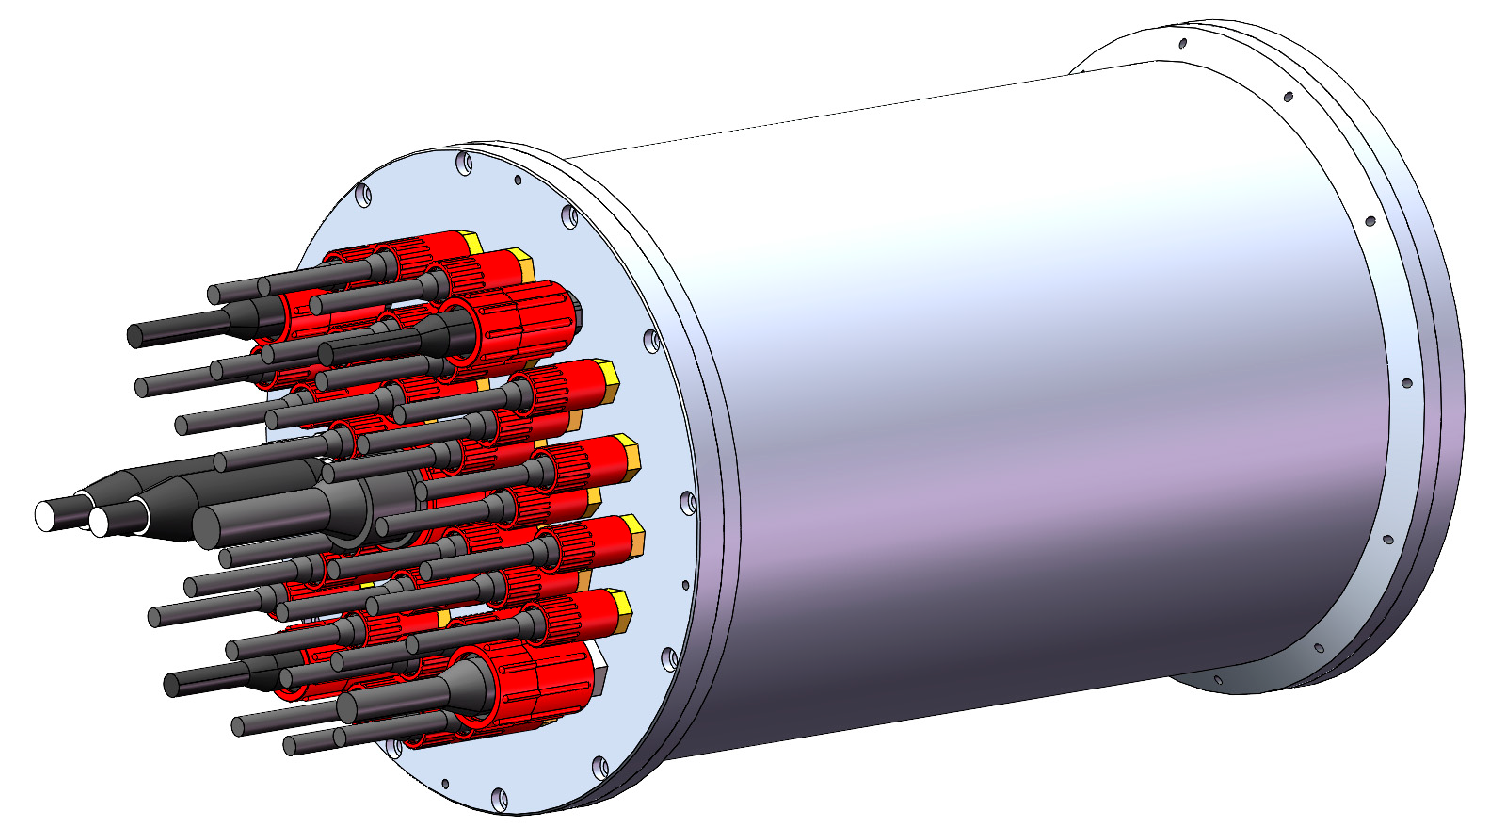
The electronic module is designed as a dry pressure-resistant sealed chamber rated for 300-m operating depth. It primarily consists of an end cover, pressure housing, subsea connectors, control core module, and sealing rings, as illustrated in
Figure 5. Thirty-six subsea connectors are circumferentially distributed along the periphery of the end cover flange.
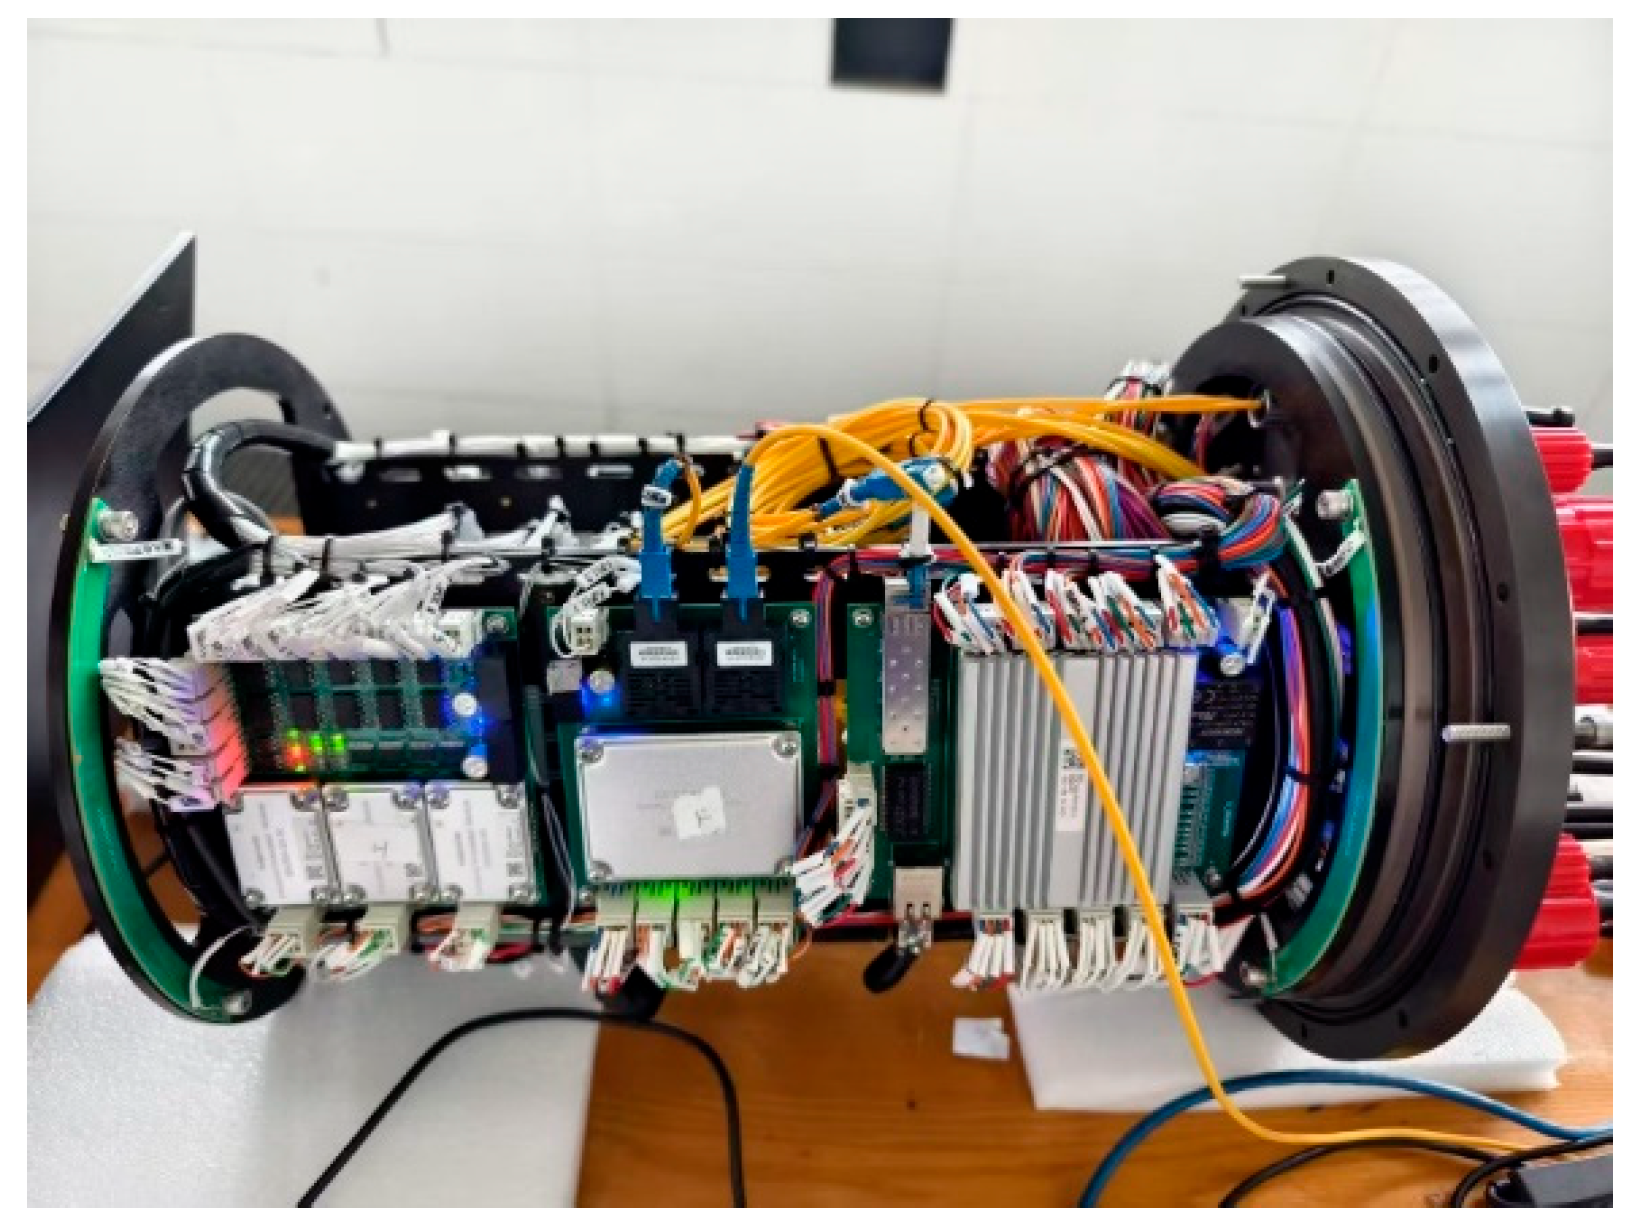
The chamber accommodates key components of the submersible vehicle’s underwater control unit, including control boards, an insulation monitoring instrument, terminal blocks, and DC contactors (
Figure 6). These components are mounted on an aluminum alloy support frame featuring circular flanges at both ends. Horizontal and vertical plates interconnect the flanges, providing mounting surfaces for component fixation.
2.3. Power Supply Design of Underwater Control Unit
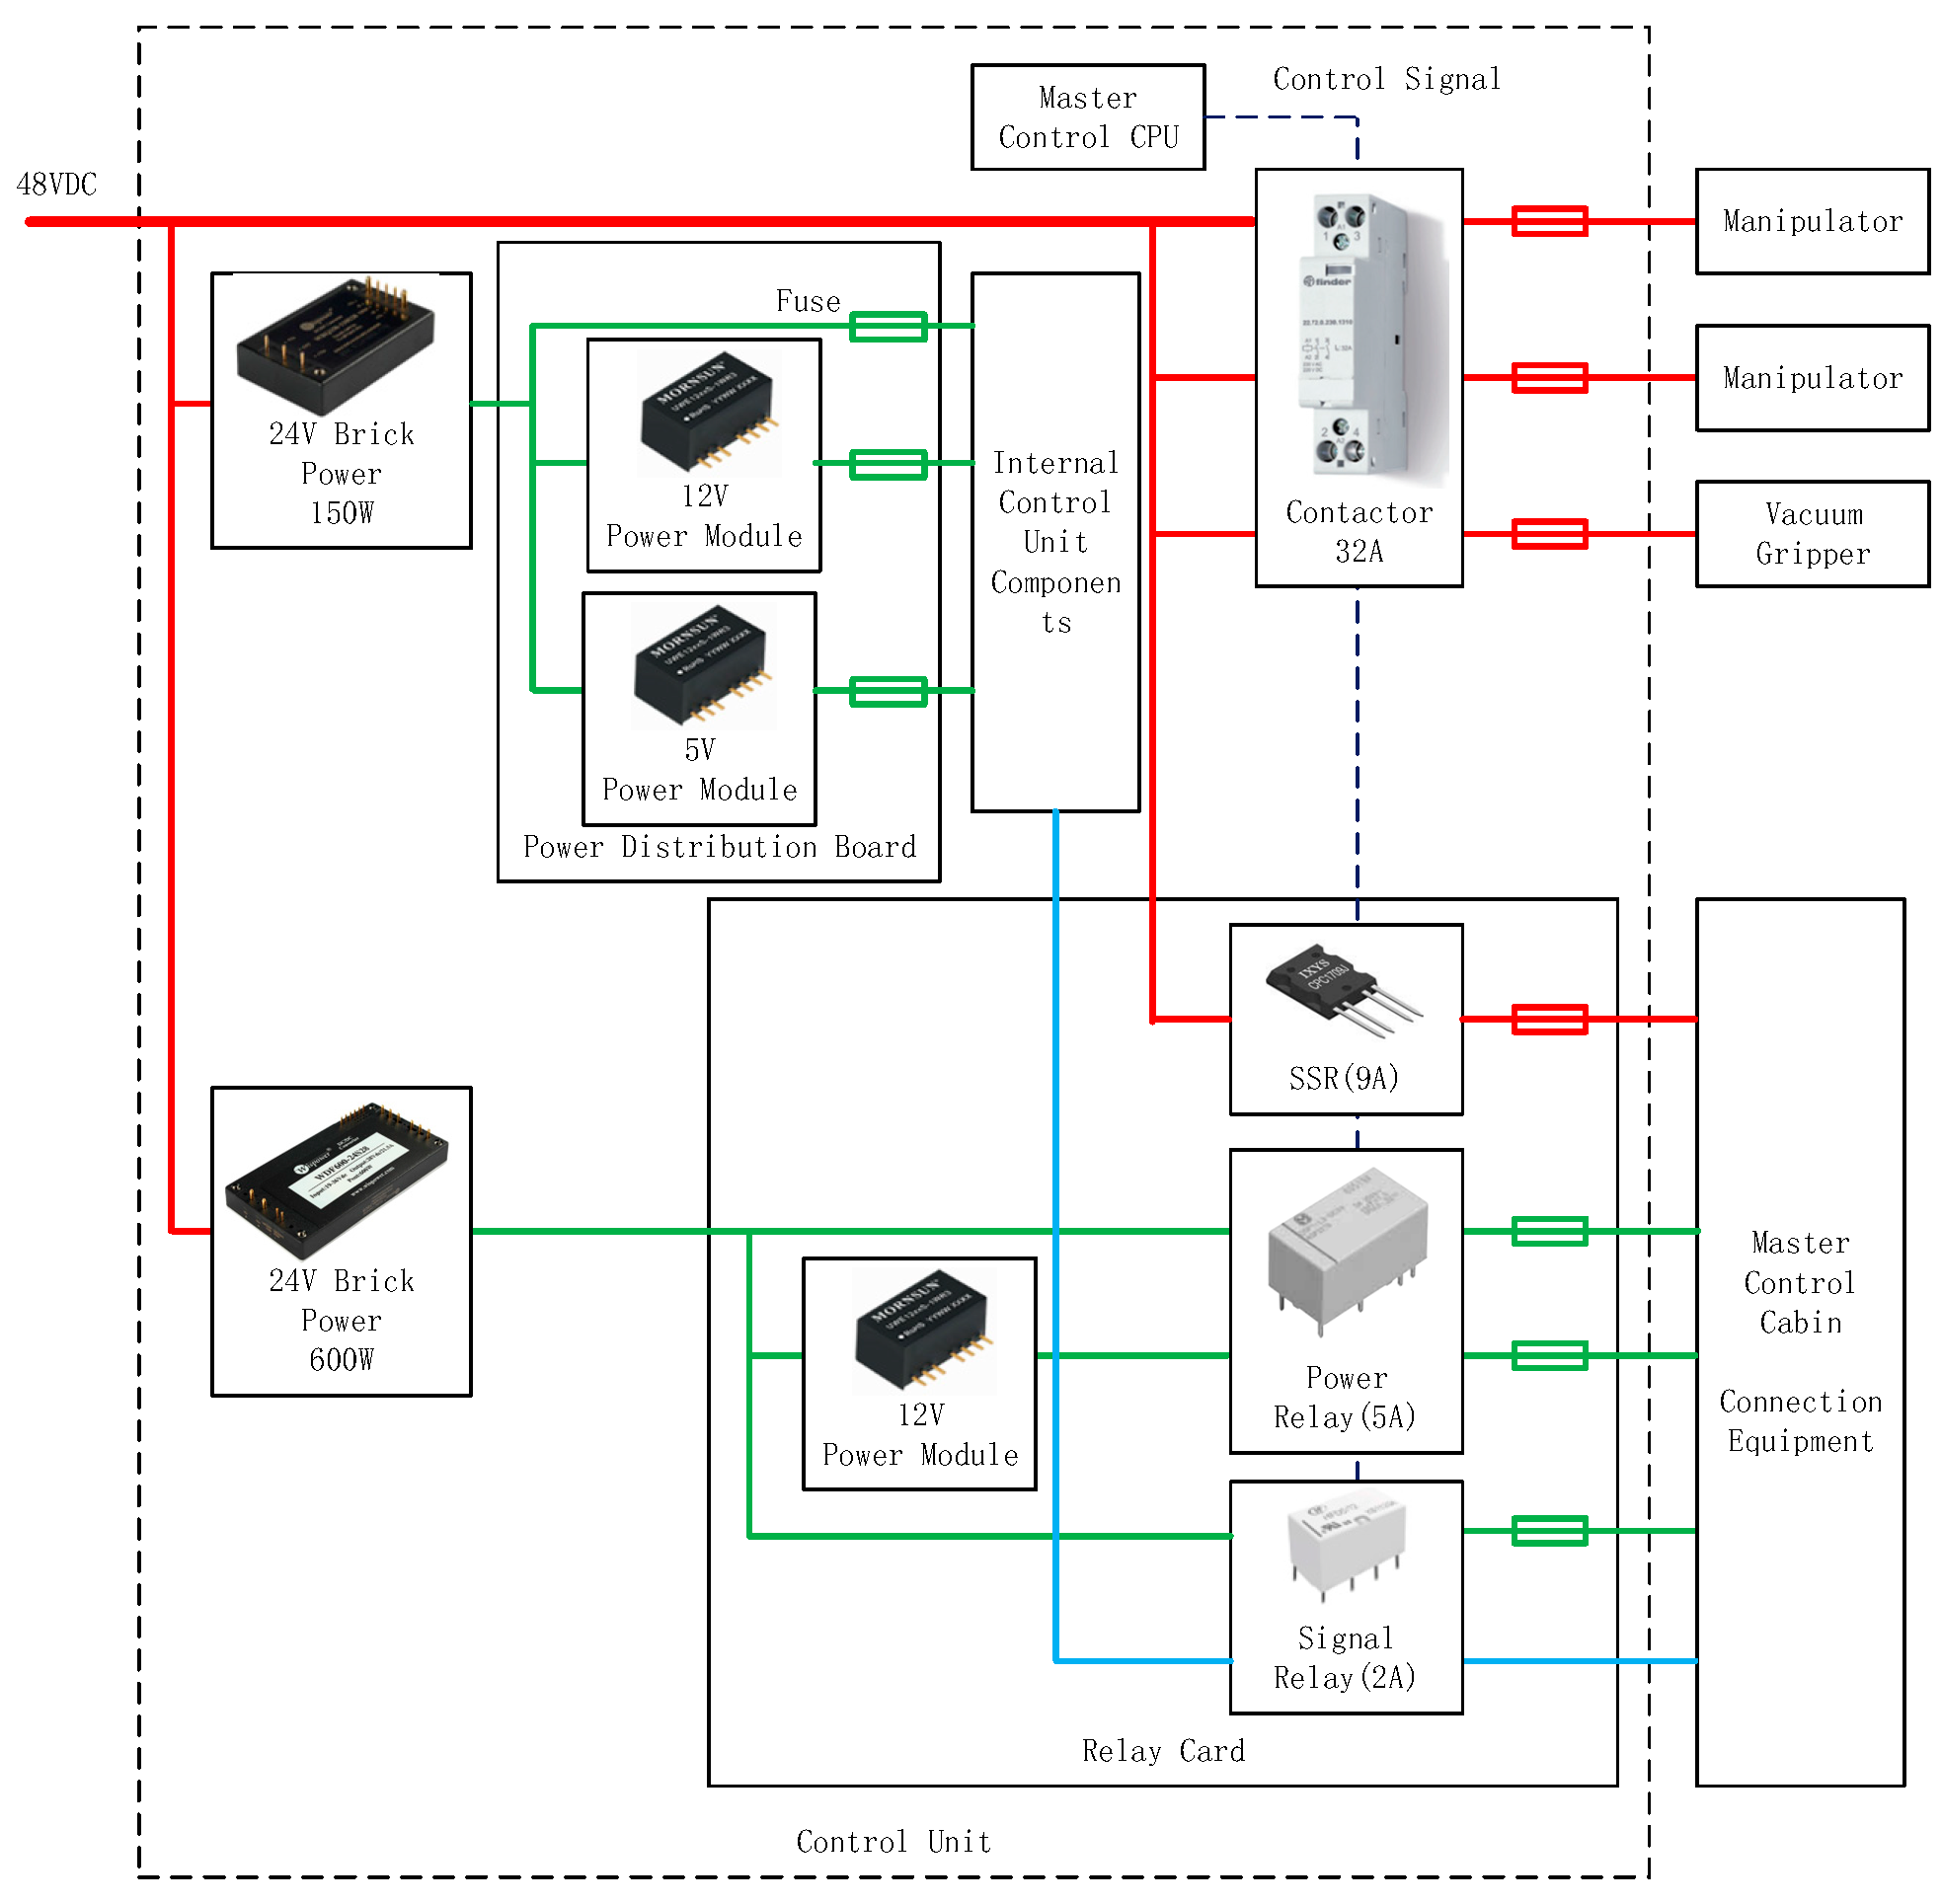
The control unit receives 48 V input from the power cabin. Within the control housing, this is stepped down to 24 V via a brick converter, then further converted to 12 V and 5 V by onboard power modules to supply internal components and peripherals directly interfacing with the main pressure housing. Dedicated power modules independently handle internal and external loads. Internal equipment remains powered by default, while external power delivery is governed by relay cards. High-power devices (≥5 A) utilize power relays; low-power devices (<2 A) along with level signals (e.g., serial/Pulse Width Modulation (PWM)) employ 2 A signal relays for power switching. High-load 48 V equipment (manipulators, adsorbers) operate directly via contactors without conversion. Lower-load 48 V devices are powered through solid-state relays on relay cards. The power architecture is shown in
Figure 7.
2.4. Communication Architecture of Underwater Control Unit
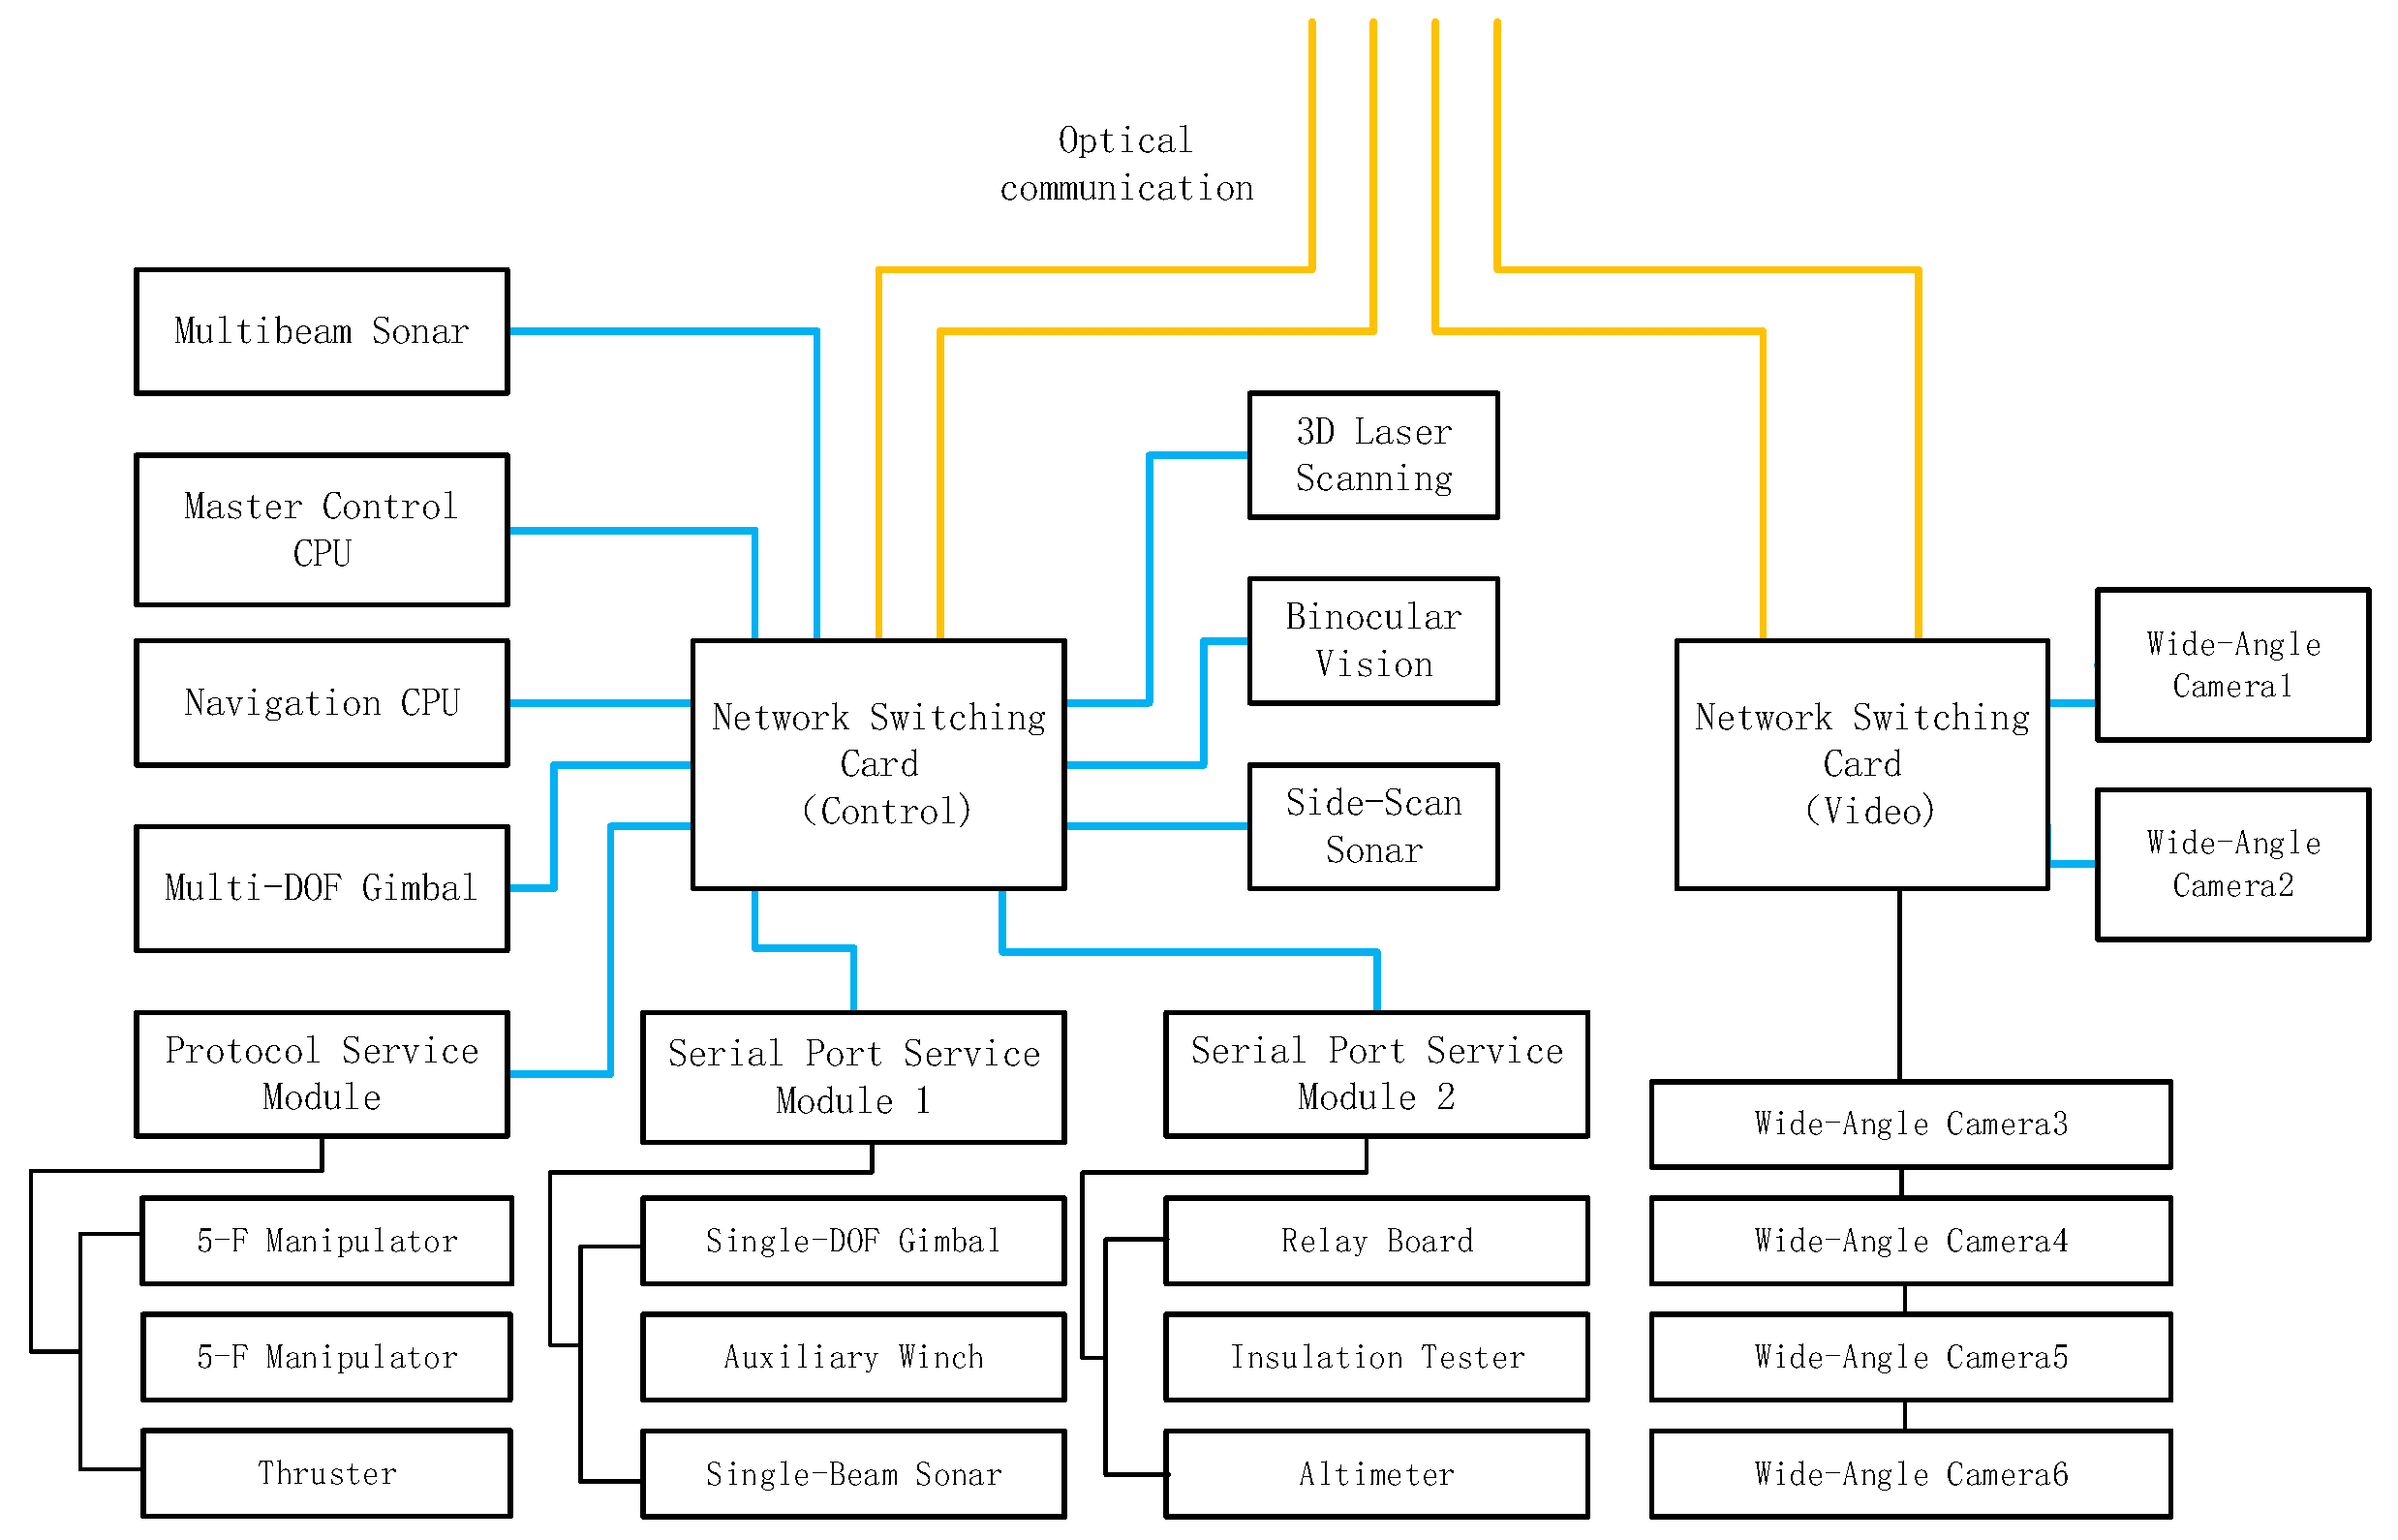
The control unit orchestrates the vehicle’s network infrastructure (
Figure 8). All networked devices interfacing with the main pressure housing—including auxiliary units, navigation cabins, and network interfaces—connect to the Ethernet switch card within the control unit to form the control network. Serial/CAN bus devices are converted to network interfaces via serial server cards and protocol conversion cards before network integration. The Ethernet switch card incorporates optical ports for fiber-optic surface communication. To minimize subsea data latency, the control and video networks operate independently using dual switch cards, requiring four optical channels (two transmit/receive pairs).
2.5. Integrated Monitoring System Design for Underwater Control Unit
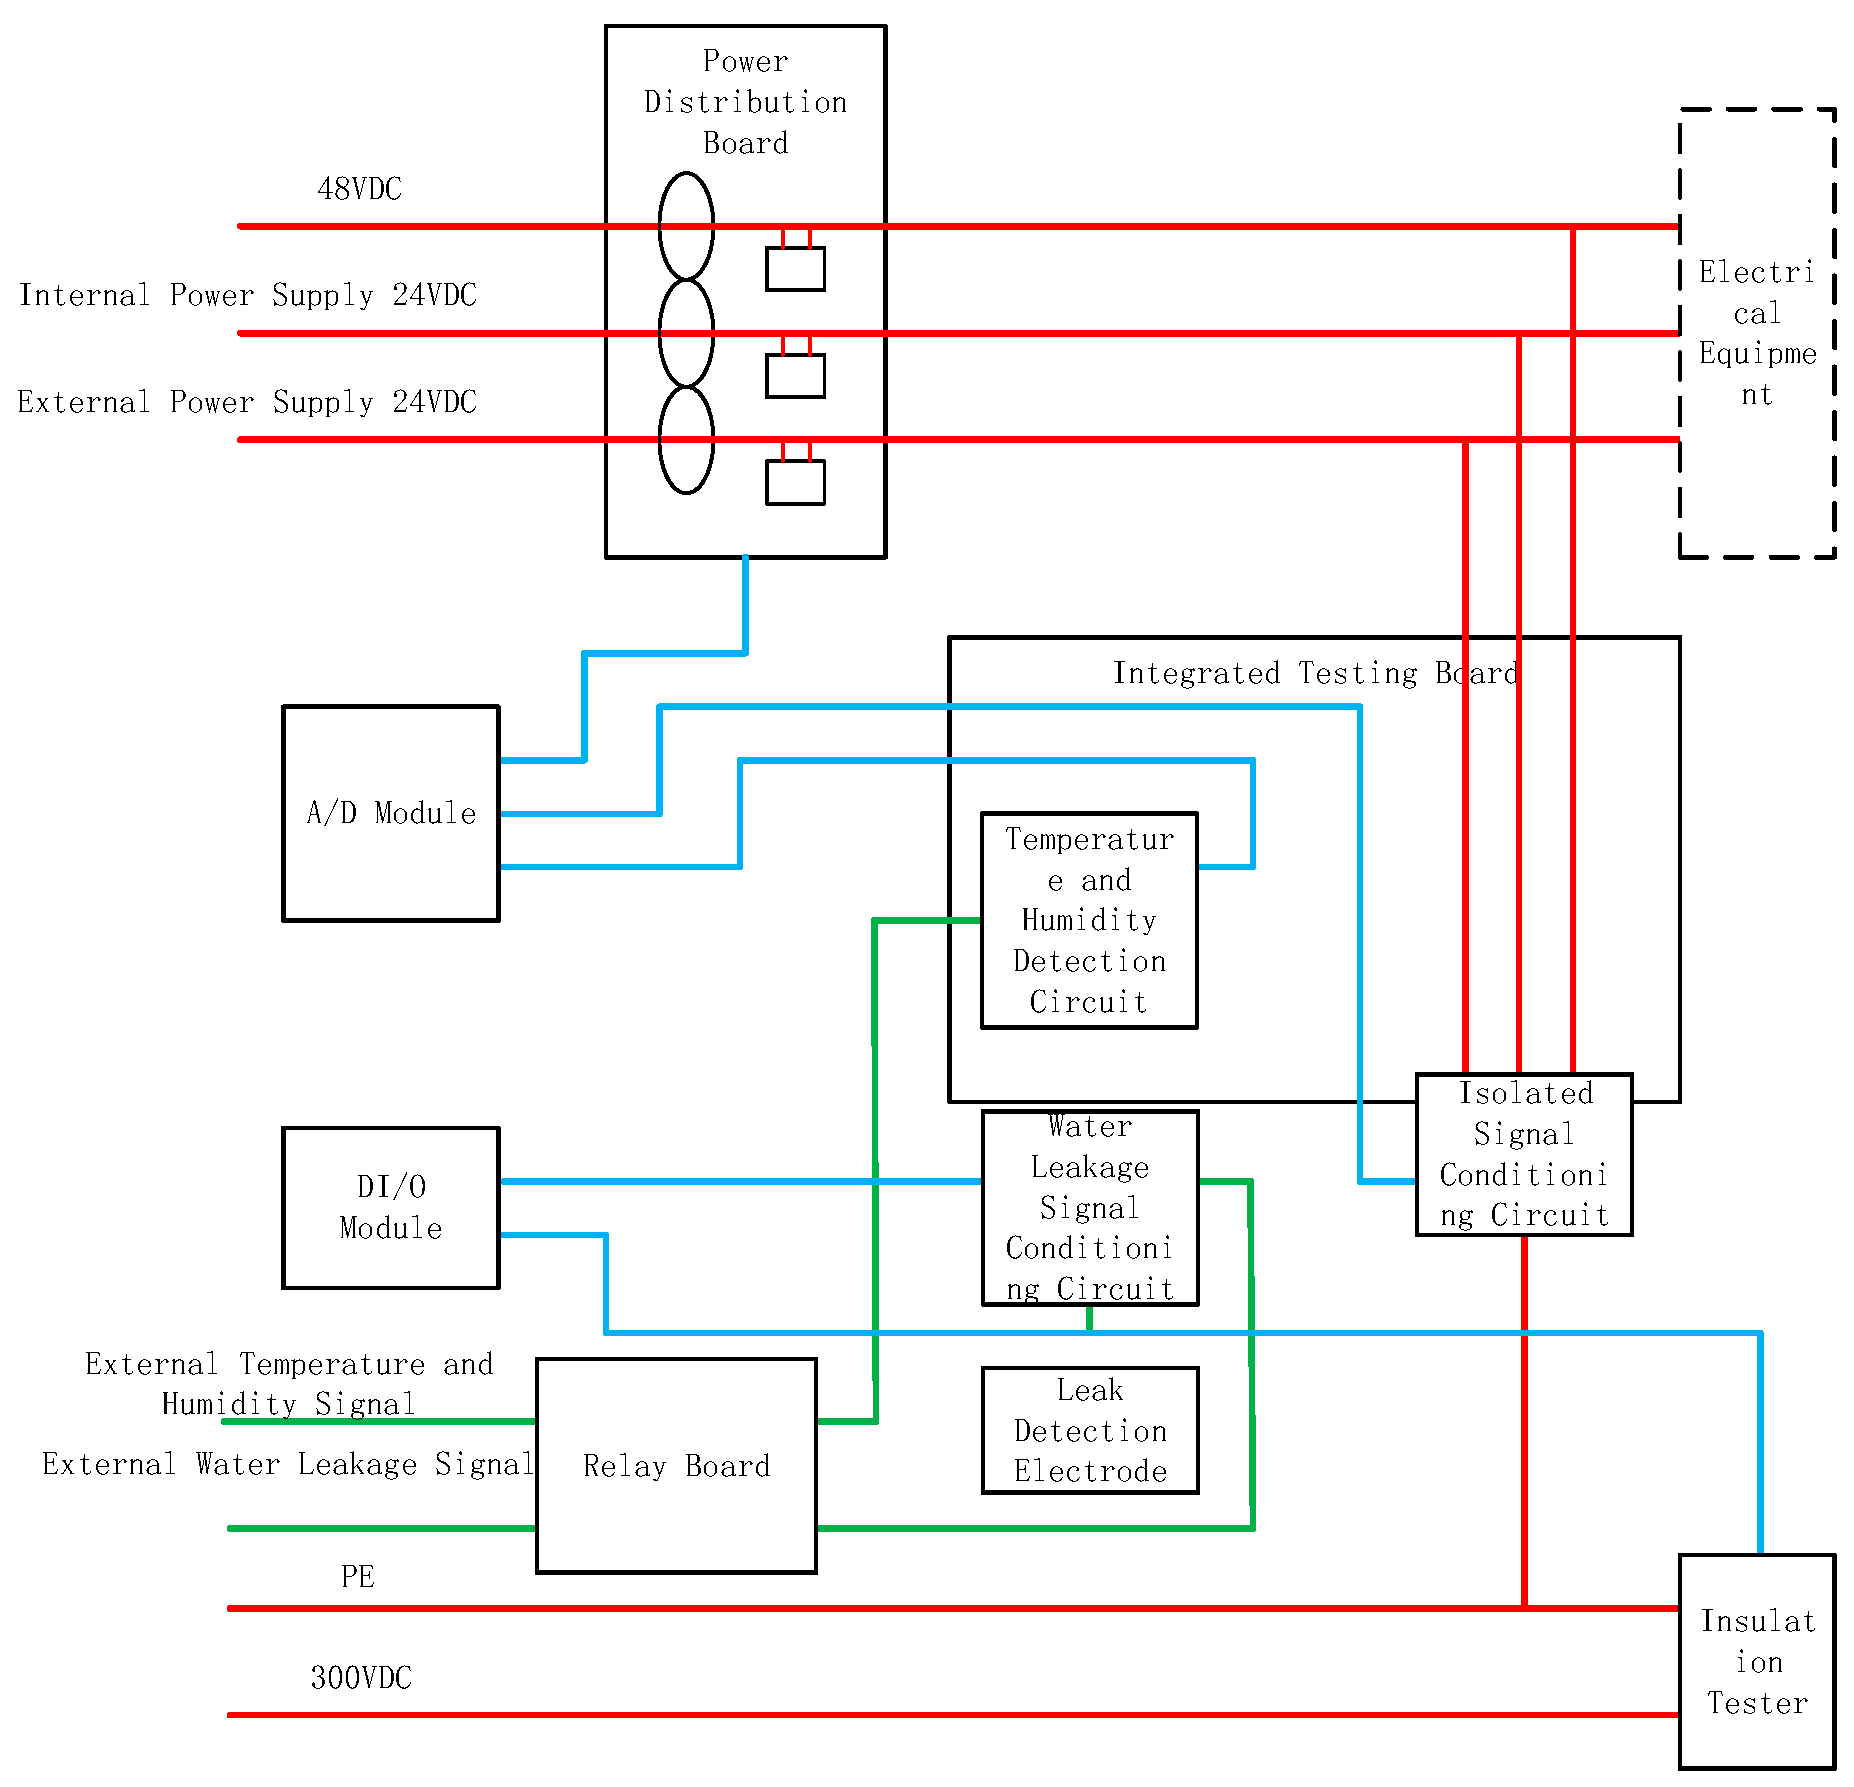
The integrated monitoring system encompasses voltage/current monitoring, temperature/humidity detection, leak sensing, and insulation diagnostics within the main pressure housing, as well as environmental monitoring of auxiliary chambers.
The monitoring architecture is shown in
Figure 9.
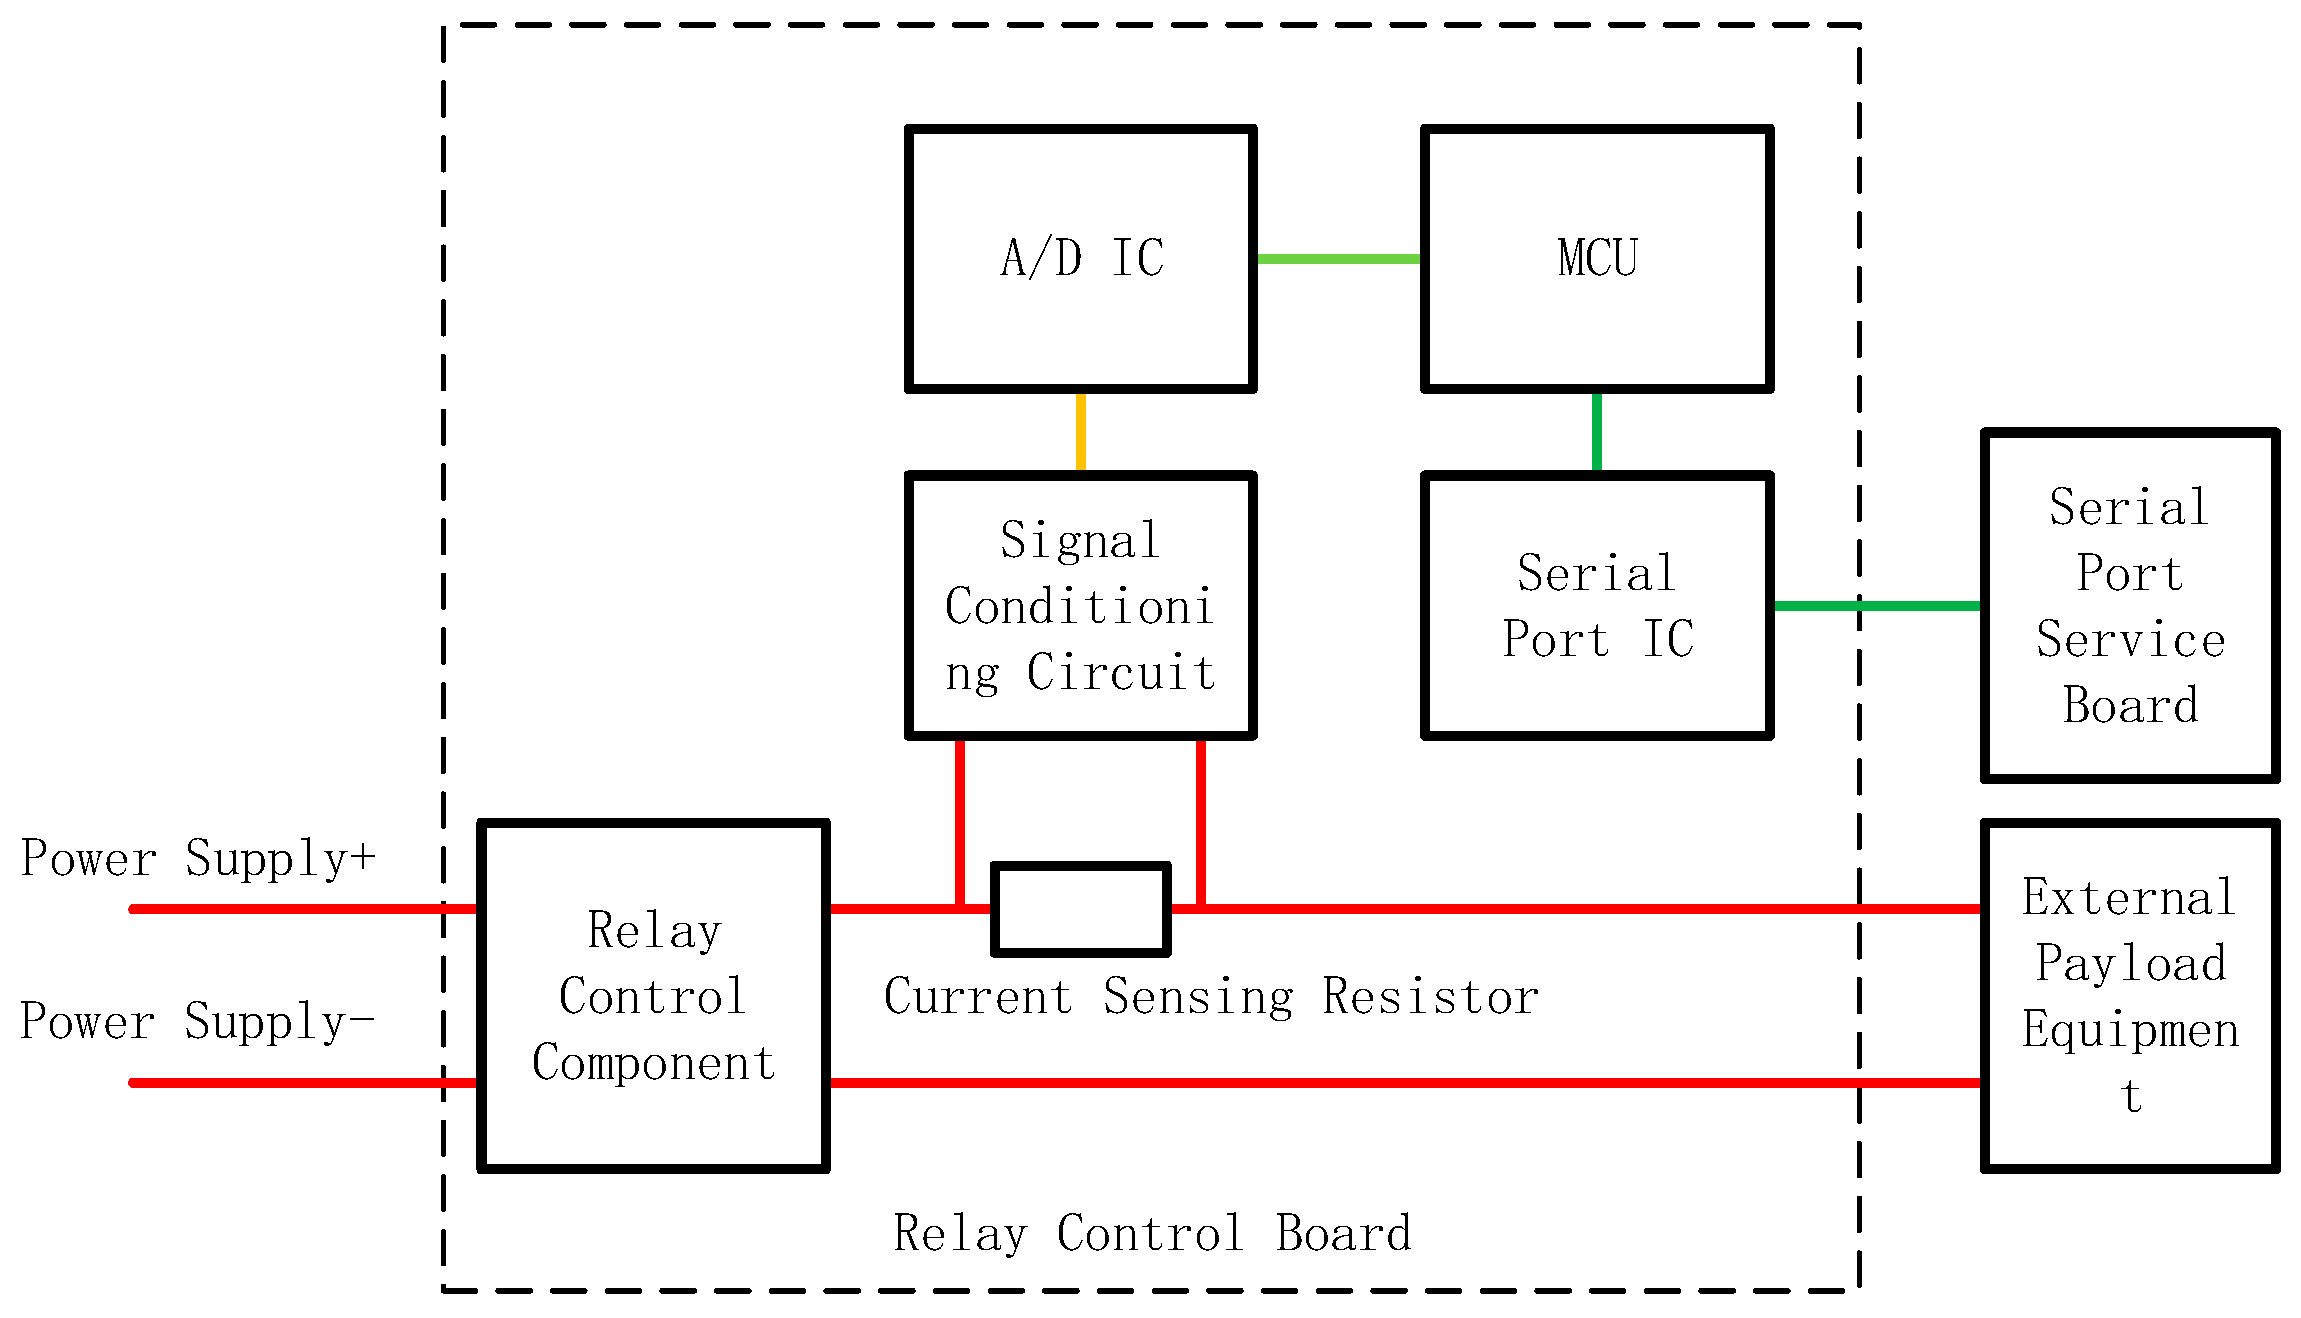
All power output channels on relay cards incorporate current sensing circuits (
Figure 10).
2.6. Surface Human–Machine Control Unit Design
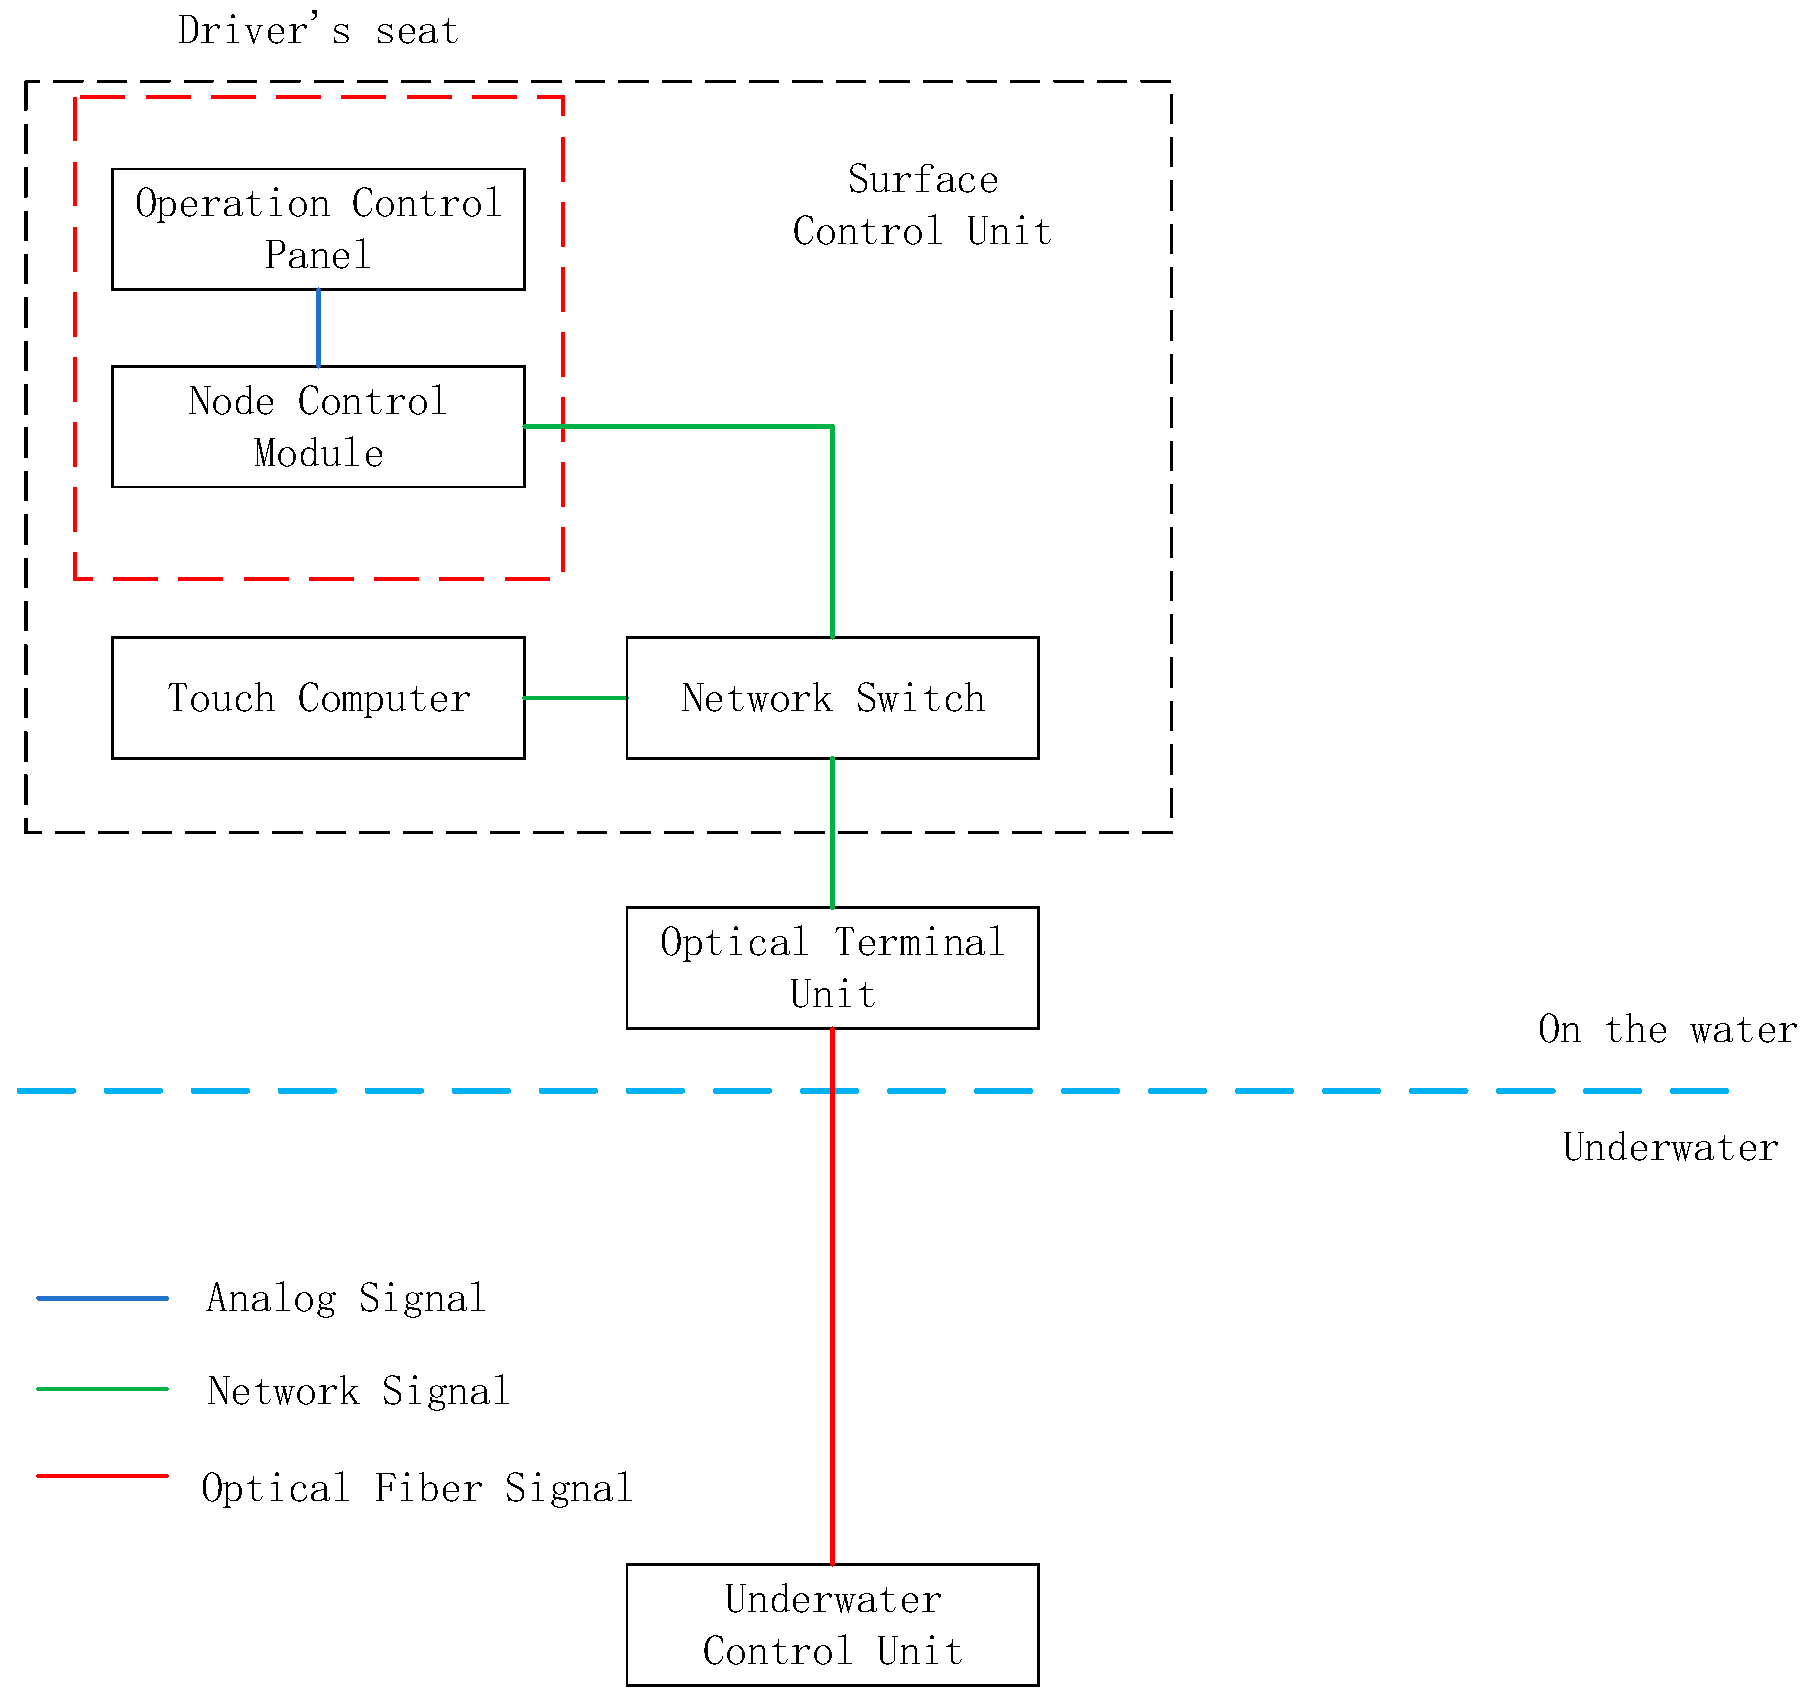
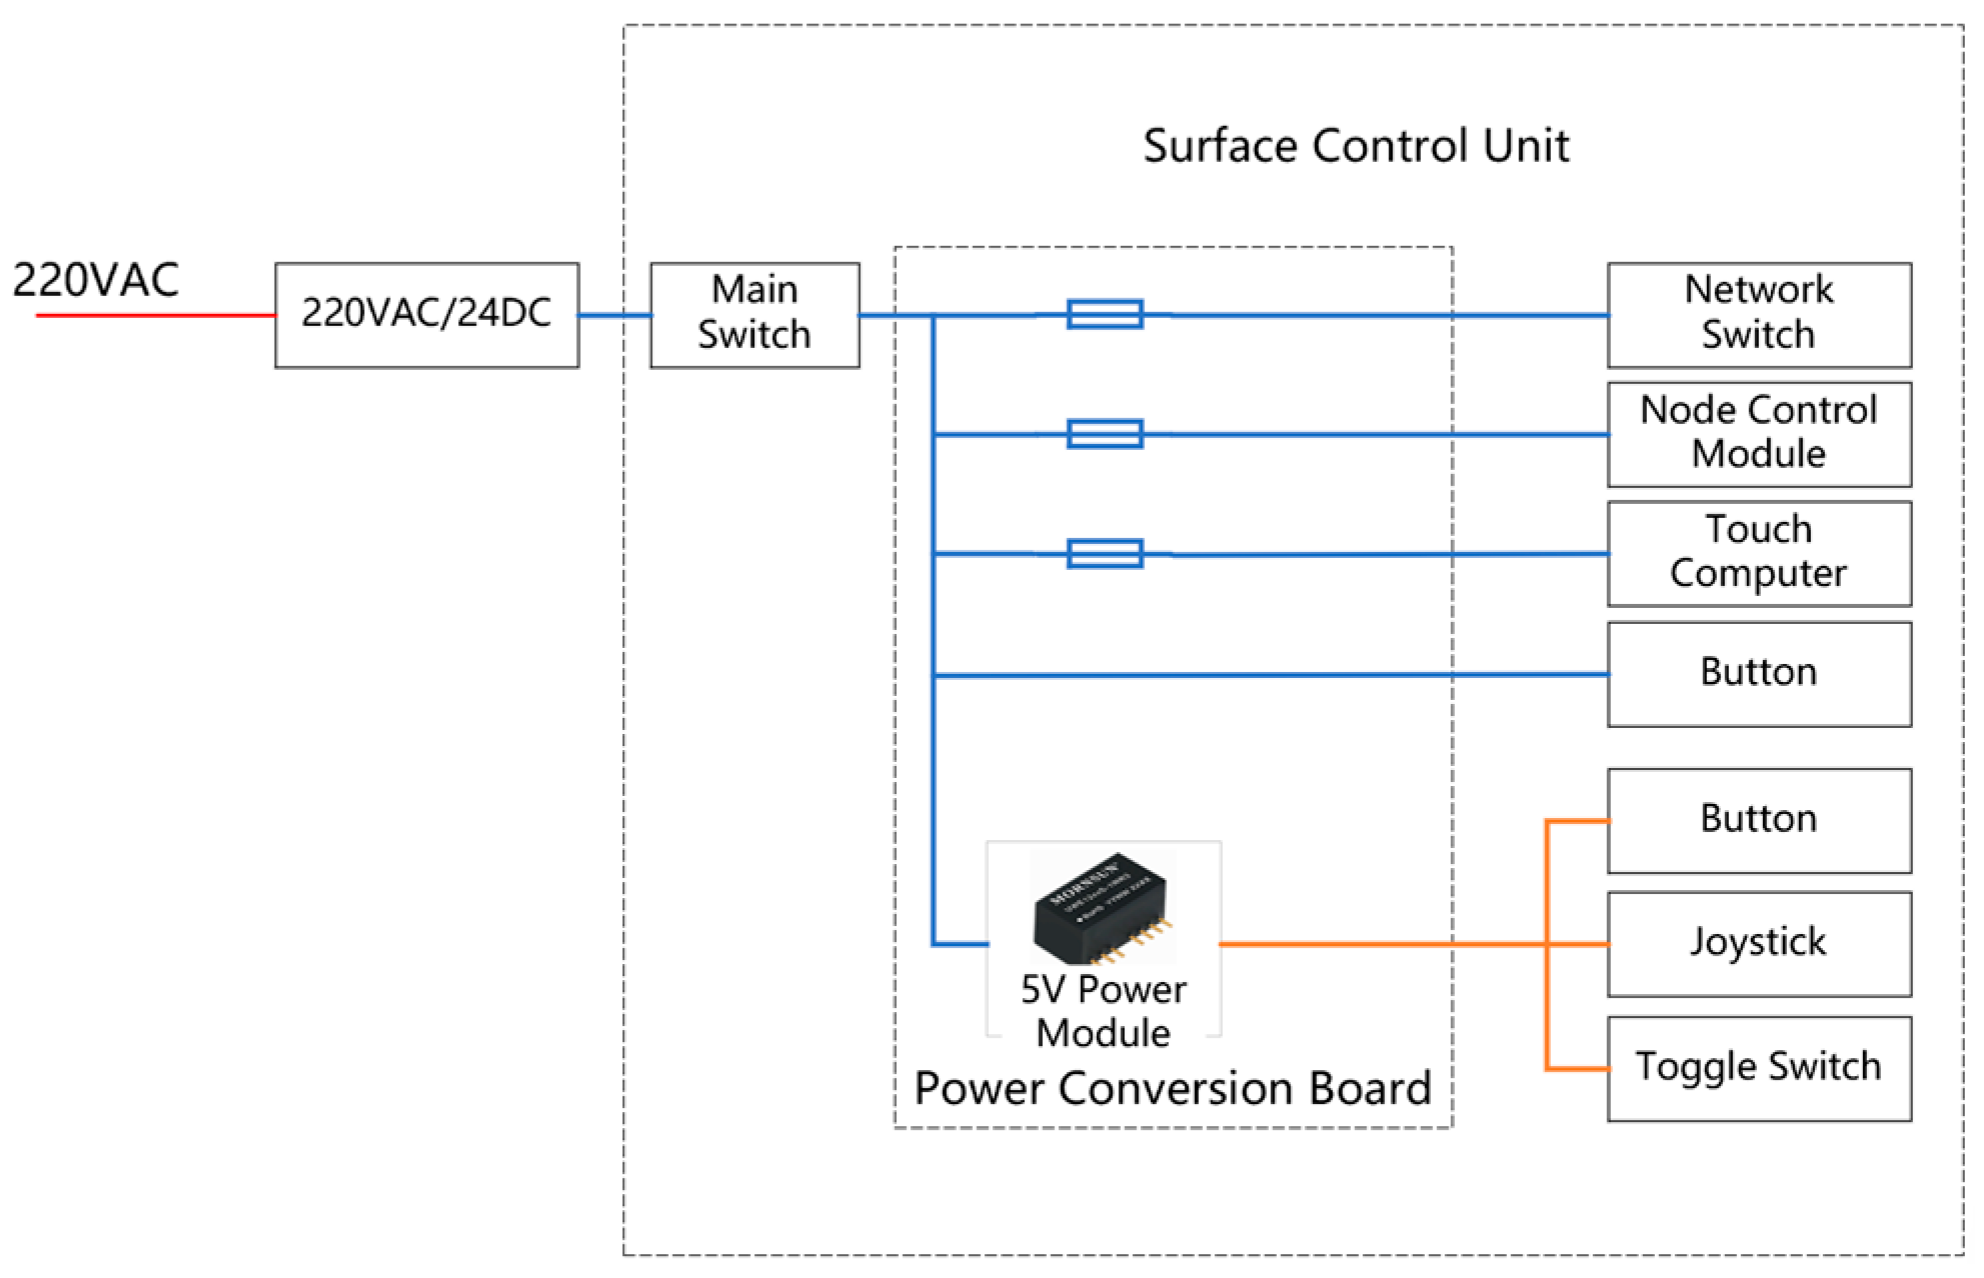
The surface human–machine control unit is installed within the console of the surface control room, positioned below the video display matrix. It comprises an operational control panel, power supplies, a touchscreen computer, a node control module, and a network switch, as illustrated in the control system block diagram (
Figure 11).
The operational control panel serves as the primary input device, equipped with joysticks, buttons, and knobs for commanding the submersible vehicle’s motions. Its integrated touchscreen computer provides soft-switch interfaces for toggling onboard equipment. Dedicated buttons/knobs on the panel enable precise control of adsorption tools. Backup keyboard and mouse ensure operational redundancy if the touchscreen fails. The node control module acquires status data from joysticks/buttons/knobs and transmits it to the touchscreen computer via the network switch. This switch interconnects the touchscreen computer, node module, surface optical transceiver, and other networked devices, facilitating the following:
Real-time vehicle state monitoring and control
Acquisition and execution of surface commands
Relay of control instructions to the optical transceiver
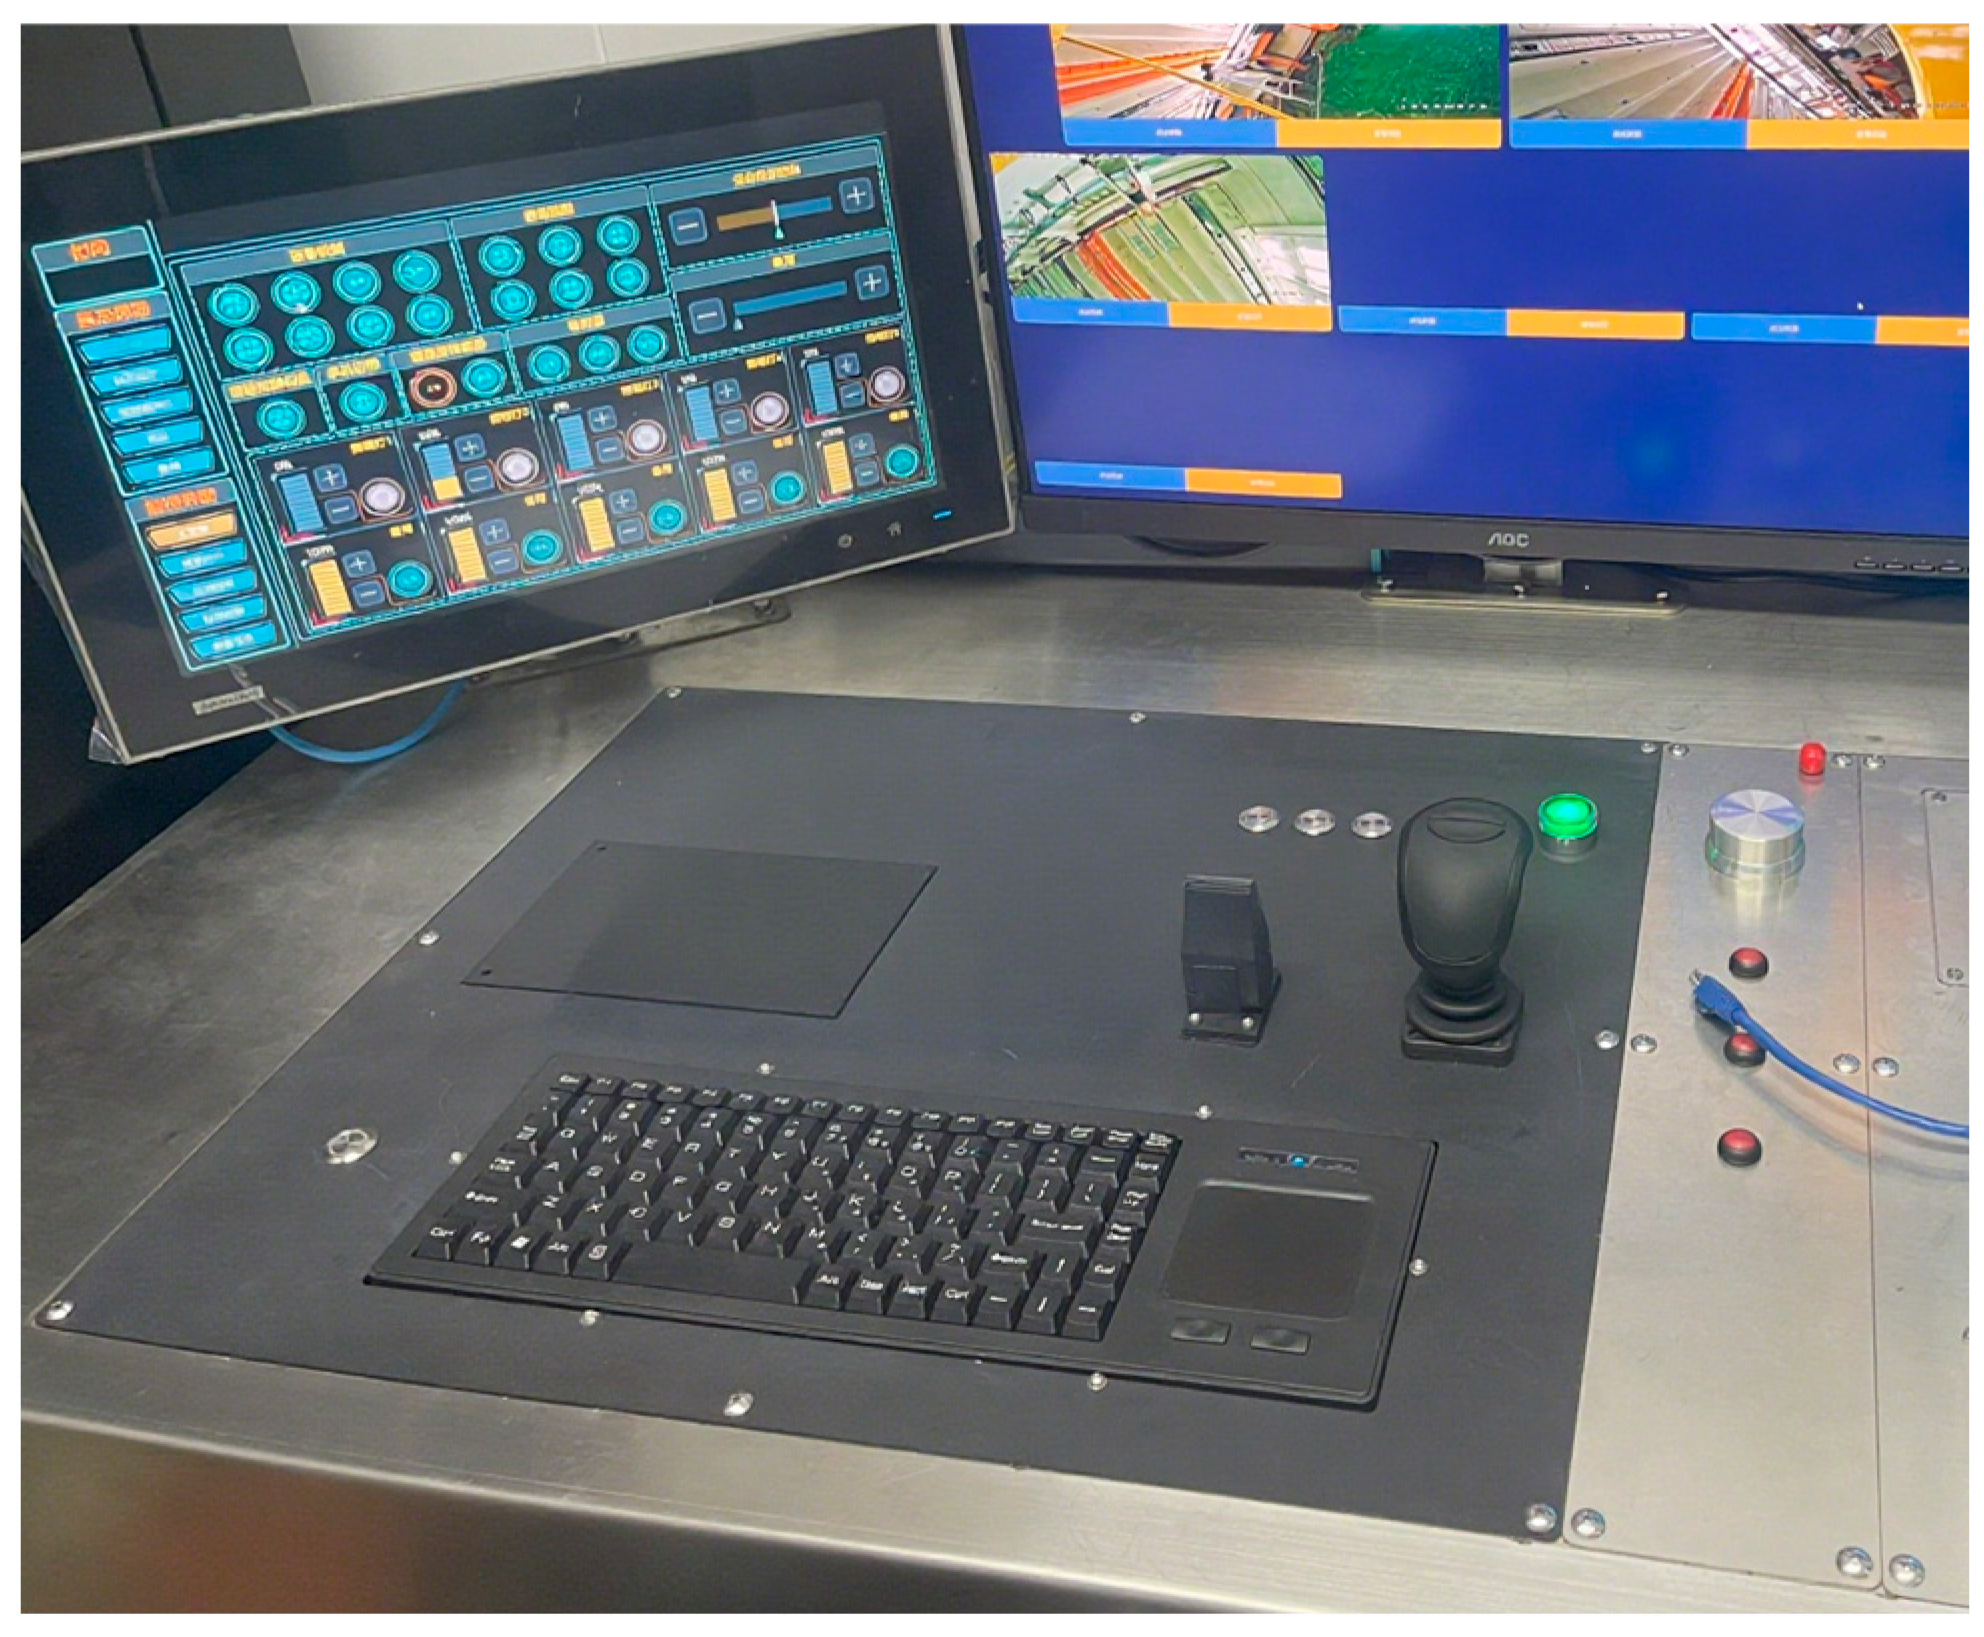
The touchscreen computer, running surface control software, functions as the unit’s core for data acquisition/storage, command issuance, and system status visualization (
Figure 12).
Powered by 220 V AC from the console, the unit employs a power converter for 24 V DC output and a voltage conversion board to deliver 24 V/5 V supplies. These power all primary devices while providing circuit protection (
Figure 13).
3. Control System Software Design
The surface control software functions as the core of the entire system, operating on the touchscreen computer of the surface human–machine platform. The human–machine interface is developed using C# and WPF, while the underlying control logic is implemented in C/C++, with data exchange between layers facilitated via UDP communication.
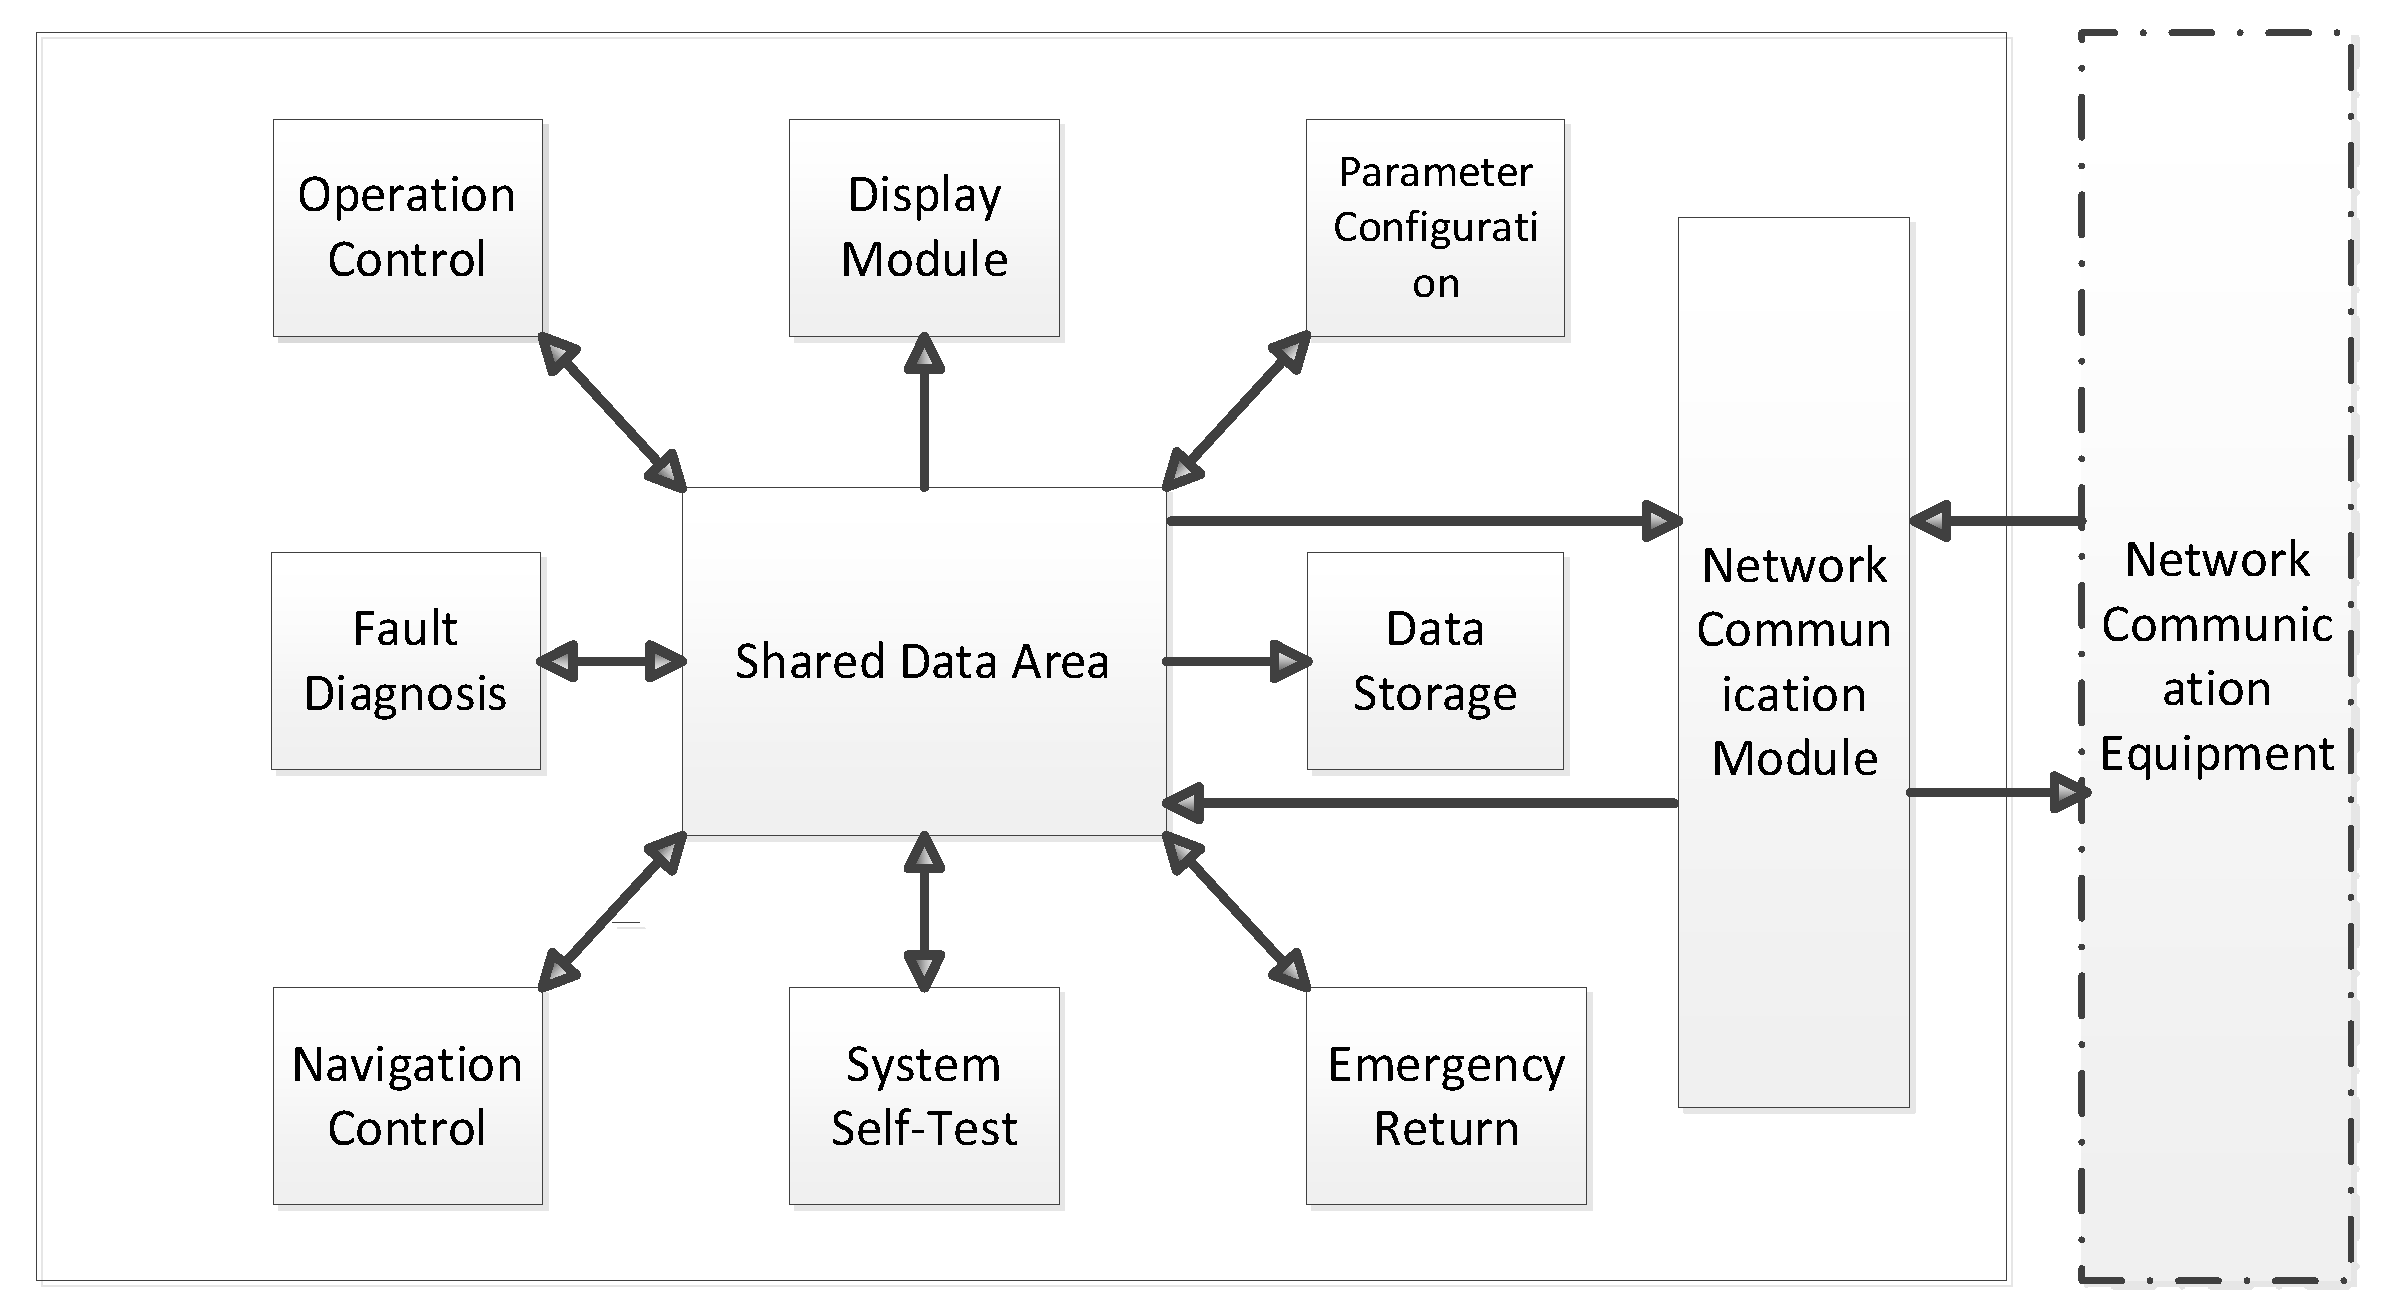
The control software adopts a modular design partitioned by functionality. Primary modules include the following: network communication, shared data repository, navigation control, operation control, positioning and navigation, fault diagnosis, visualization module, and human–machine interface, with functional architecture and data flow illustrated in
Figure 14.
The network communication module manages data exchange between the control computer and Ethernet devices, handling packet reception/parsing/calibration and output packet assembly, while simultaneously evaluating communication faults and link quality for all connected devices and circuits. The shared data repository organizes and manages global process variables by allocating a memory block segmented into Input Zone, Output Zone, Program Variable Zone, and Parameter Zone. This repository consolidates touchscreen operations, panel inputs, leak/insulation statuses, communication metrics, fault diagnostics, sensor data, and navigation/attitude information. The navigation control module orchestrates robotic motion control, including thrust allocation and autonomous functions (depth/altitude regulation, heading lock, station keeping, speed/distance tracking). The operation control module governs the following system logic operations: control mode selection, device actuation, functional switching, emergency procedures, and status indication. The parameter configuration module sets software runtime parameters including closed-loop control coefficients, data source selection thresholds, fault diagnosis criteria, and initialization values. The fault diagnosis module performs fault identification and system protection. It monitors leak detection, insulation integrity, temperature anomalies, and communication failures. Upon fault detection, it alerts operators via color-coded displays, indicator lights, and message prompts, while rendering fault locations on dedicated diagnostic interfaces to expedite troubleshooting. The data logging module periodically archives repository data to hard drives for post-mission performance profiling and failure analysis. The visualization module graphically displays robotic statuses (position, attitude, velocity, insulation, leaks, faults, communications, autonomy status) across categorized interfaces. The human–machine interface provides context-specific control panels (primary operations, functional control, parameter configuration) with rapid screen-switching capabilities, delivering streamlined operator interaction through ergonomic visual presentation.
3.1. Data Preprocessing Design
Raw data acquired from sensors and field acquisition devices contain noise even after extraction and calibration [
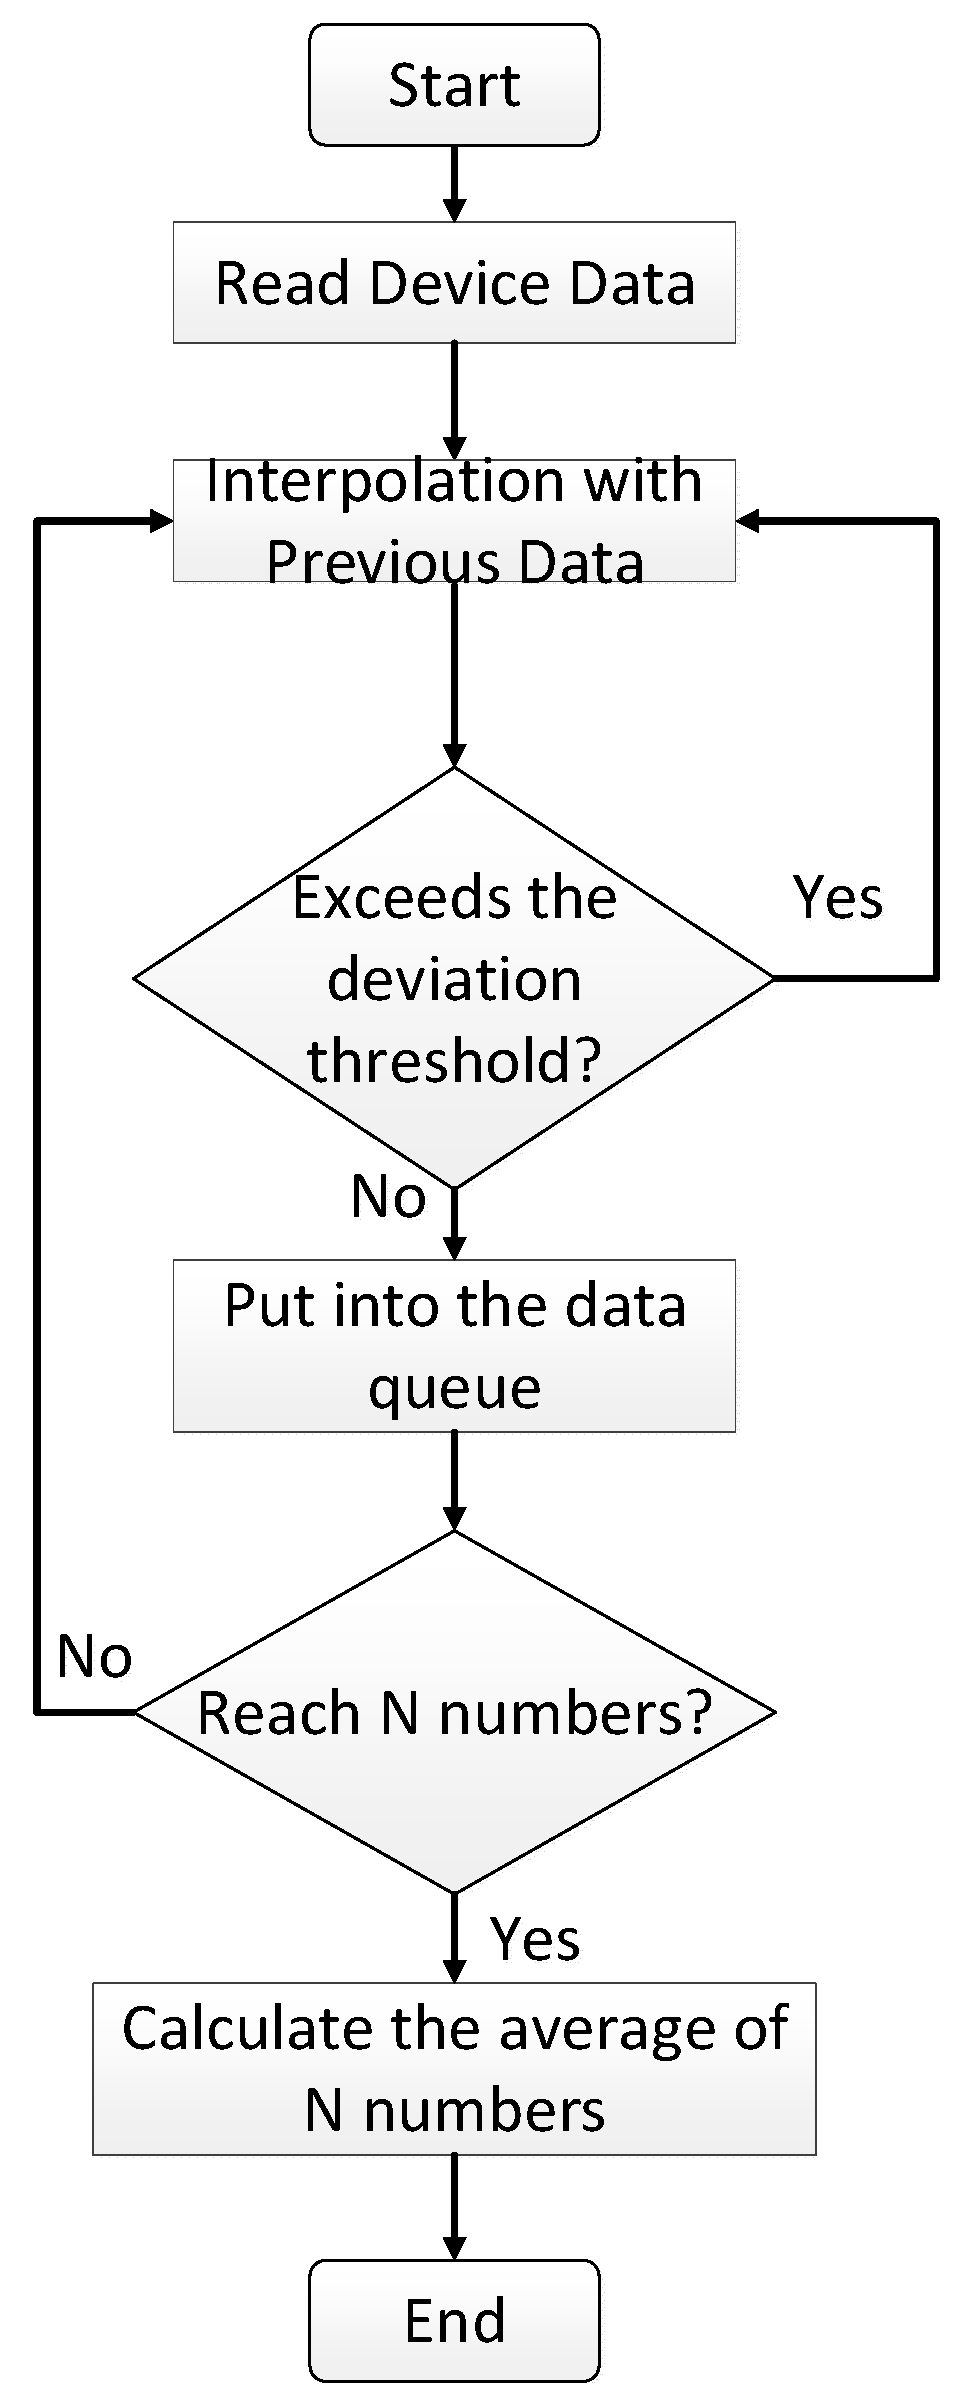
13]. Employing noise-contaminated data directly for control compromises robotic performance. Thus, for critical parameters, the control software eliminates aberrant outliers and applies filtering techniques (e.g., arithmetic mean filtering, median filtering, or quintic polynomial smoothing) [
14]. The data preprocessing workflow is illustrated in
Figure 15.
3.2. Motion Control Algorithm Design
3.2.1. Robotic Motion Model
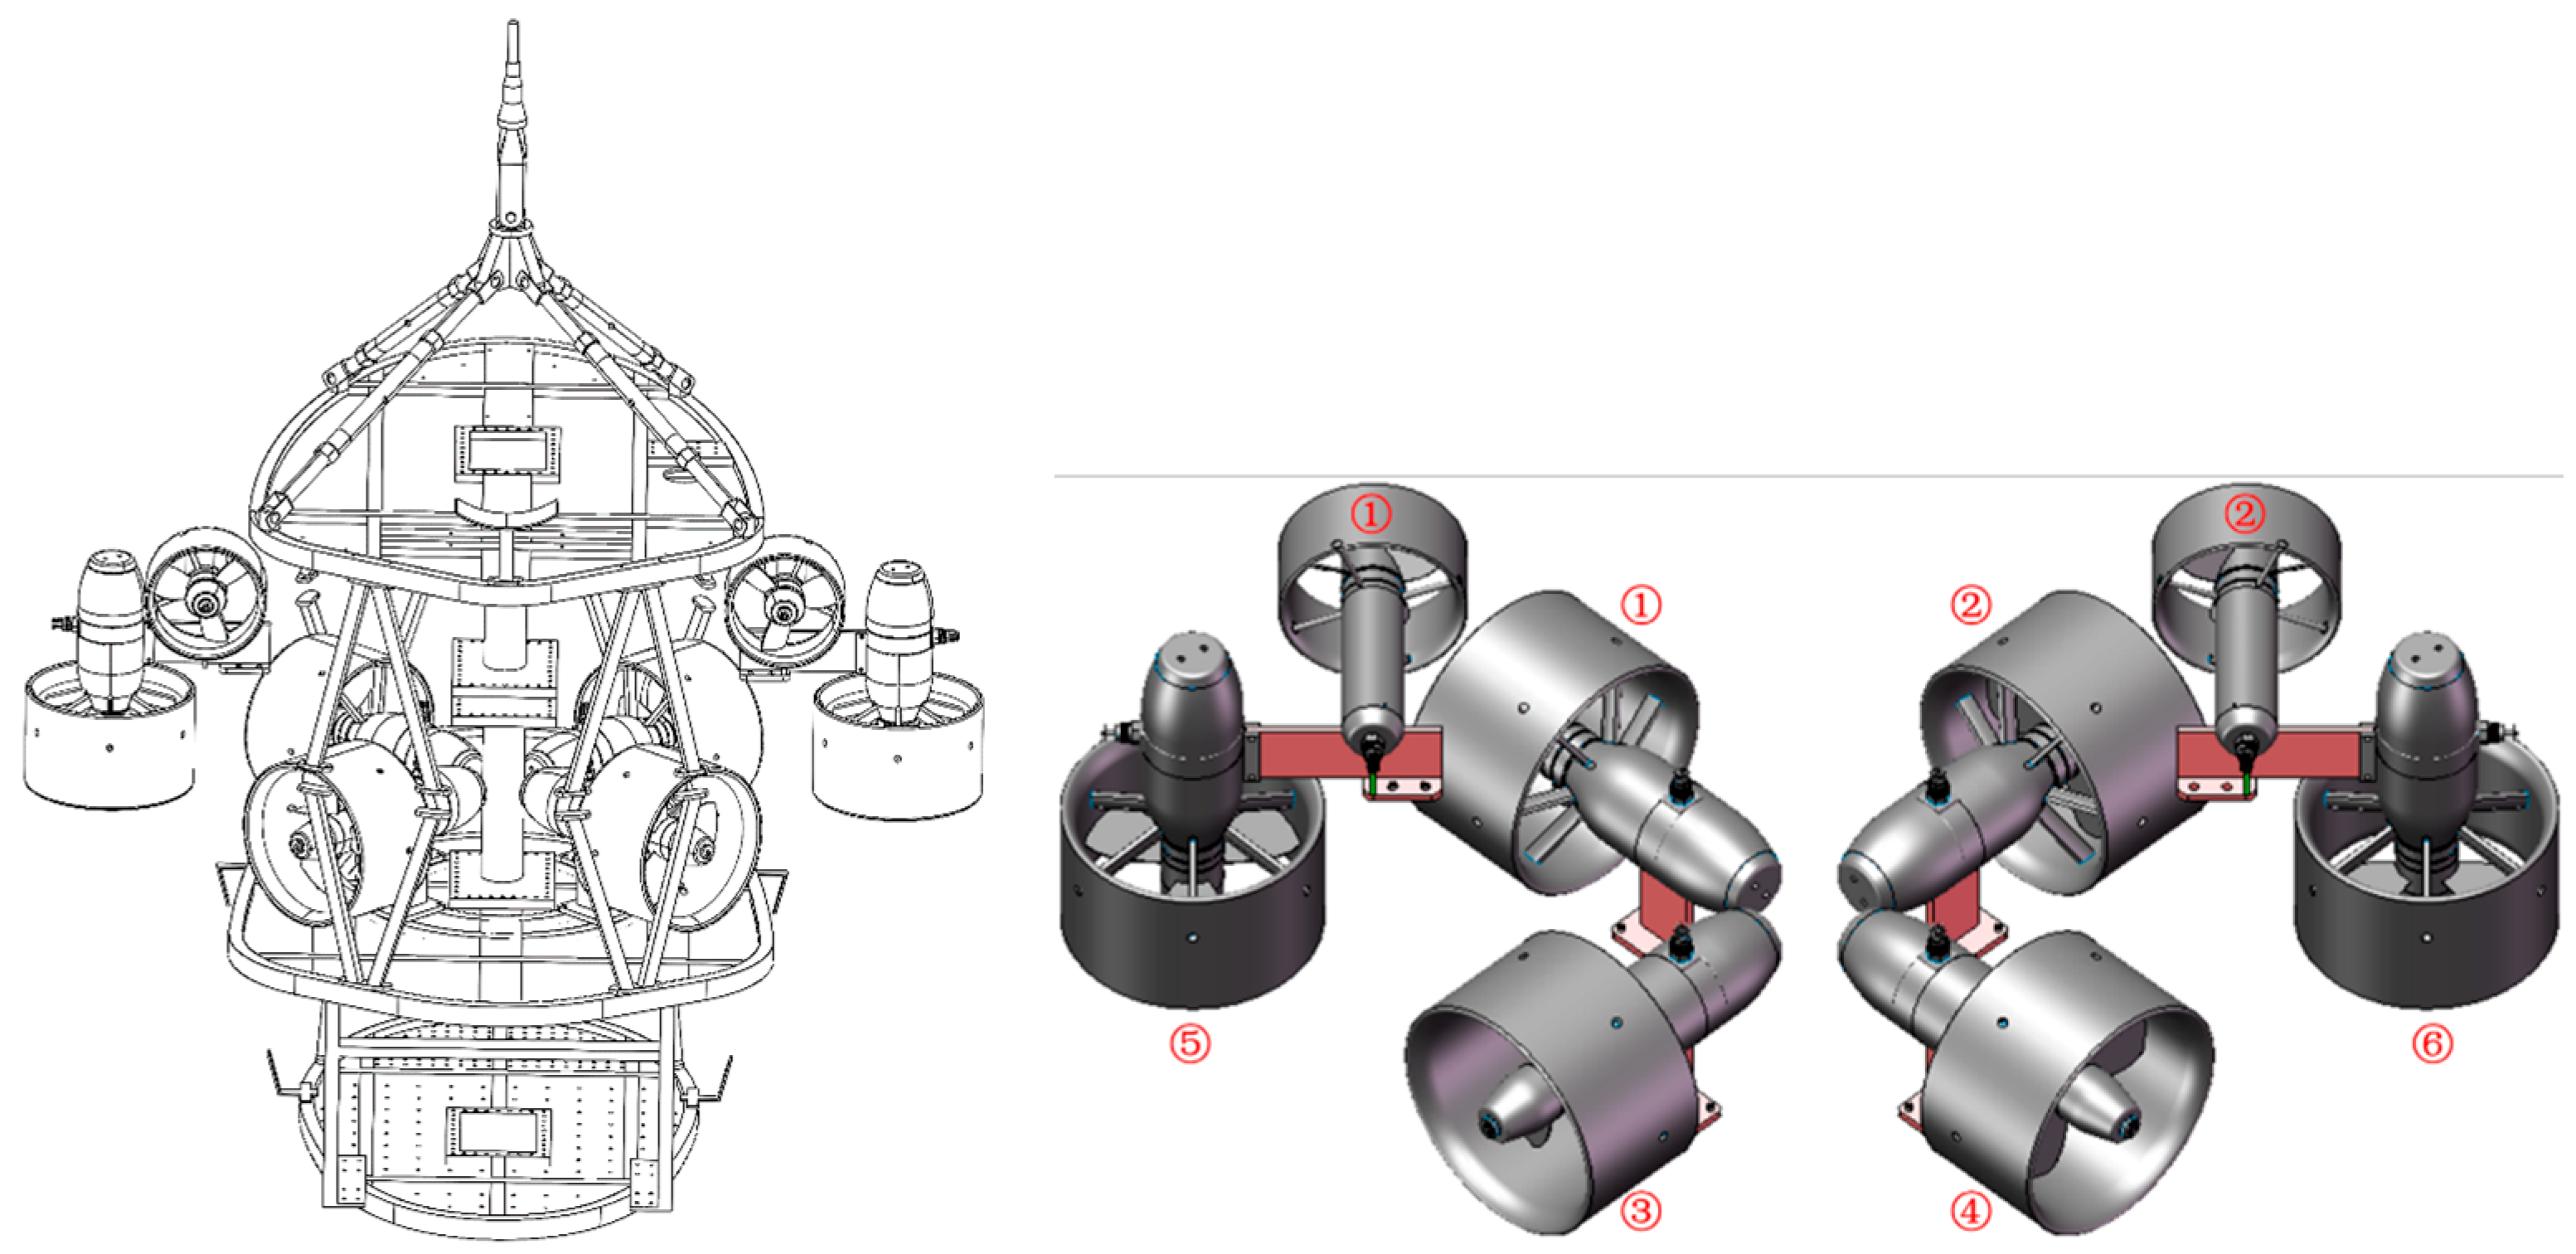
The submersible defect inspection vehicle requires orientation, altitude/depth regulation, station-keeping, velocity control, and dam-surface distance tracking. These correspond to four degree-of-freedom (DOF) motion controls: surge, sway, heave, and yaw. Eight thrusters provide actuation: four horizontal main thrusters, two horizontal micro-thrusters, and two vertical main thrusters, arranged as shown in
Figure 16.
Longitudinal propulsion is powered by four horizontal thrusters and two micro-thrusters; transverse motion is driven by four horizontal thrusters; vertical movement is actuated by two vertical thrusters; yaw motion generates torque through four horizontal thrusters and two micro-thrusters. The structural configuration of the submersible defect inspection robot ensures inherent stability in pitch and roll degrees of freedom [
15]. The four-degree-of-freedom kinematic equation is expressed as follows [
16]:
Accounting for unknown disturbances in dam reservoirs, the dynamic model is defined as follows:
The dimensions of variables in Equations (1) and (2) are defined as follows:
Equation (1)—Kinematics:
Pose vector: (x,y,z: position; ψ: yaw)
Rotation matrix: Converts body-fixed velocities to earth-fixed derivatives
Body-fixed velocity: (u: surge, v: sway, w: heave, r: yaw rate)
Equation (2)—Dynamics:
Inertia matrix
Coriolis–centripetal matrix
Damping matrix
Restoring vector
Control input vector
Environmental disturbance vector
3.2.2. Adaptive Super-Twisting Terminal Sliding Mode Controller
Sliding mode control exhibits strong robustness with lower sensitivity to parametric variations [
17], making it widely adopted in underwater vehicle control systems to enhance disturbance rejection and system robustness. However, traditional first-order sliding mode control suffers from chattering due to discontinuous control laws [
18]. In complex, time-varying flow fields of dam reservoirs, the submersible defect inspection robot inevitably faces parametric uncertainties and multi-source disturbances, severely degrading control performance.
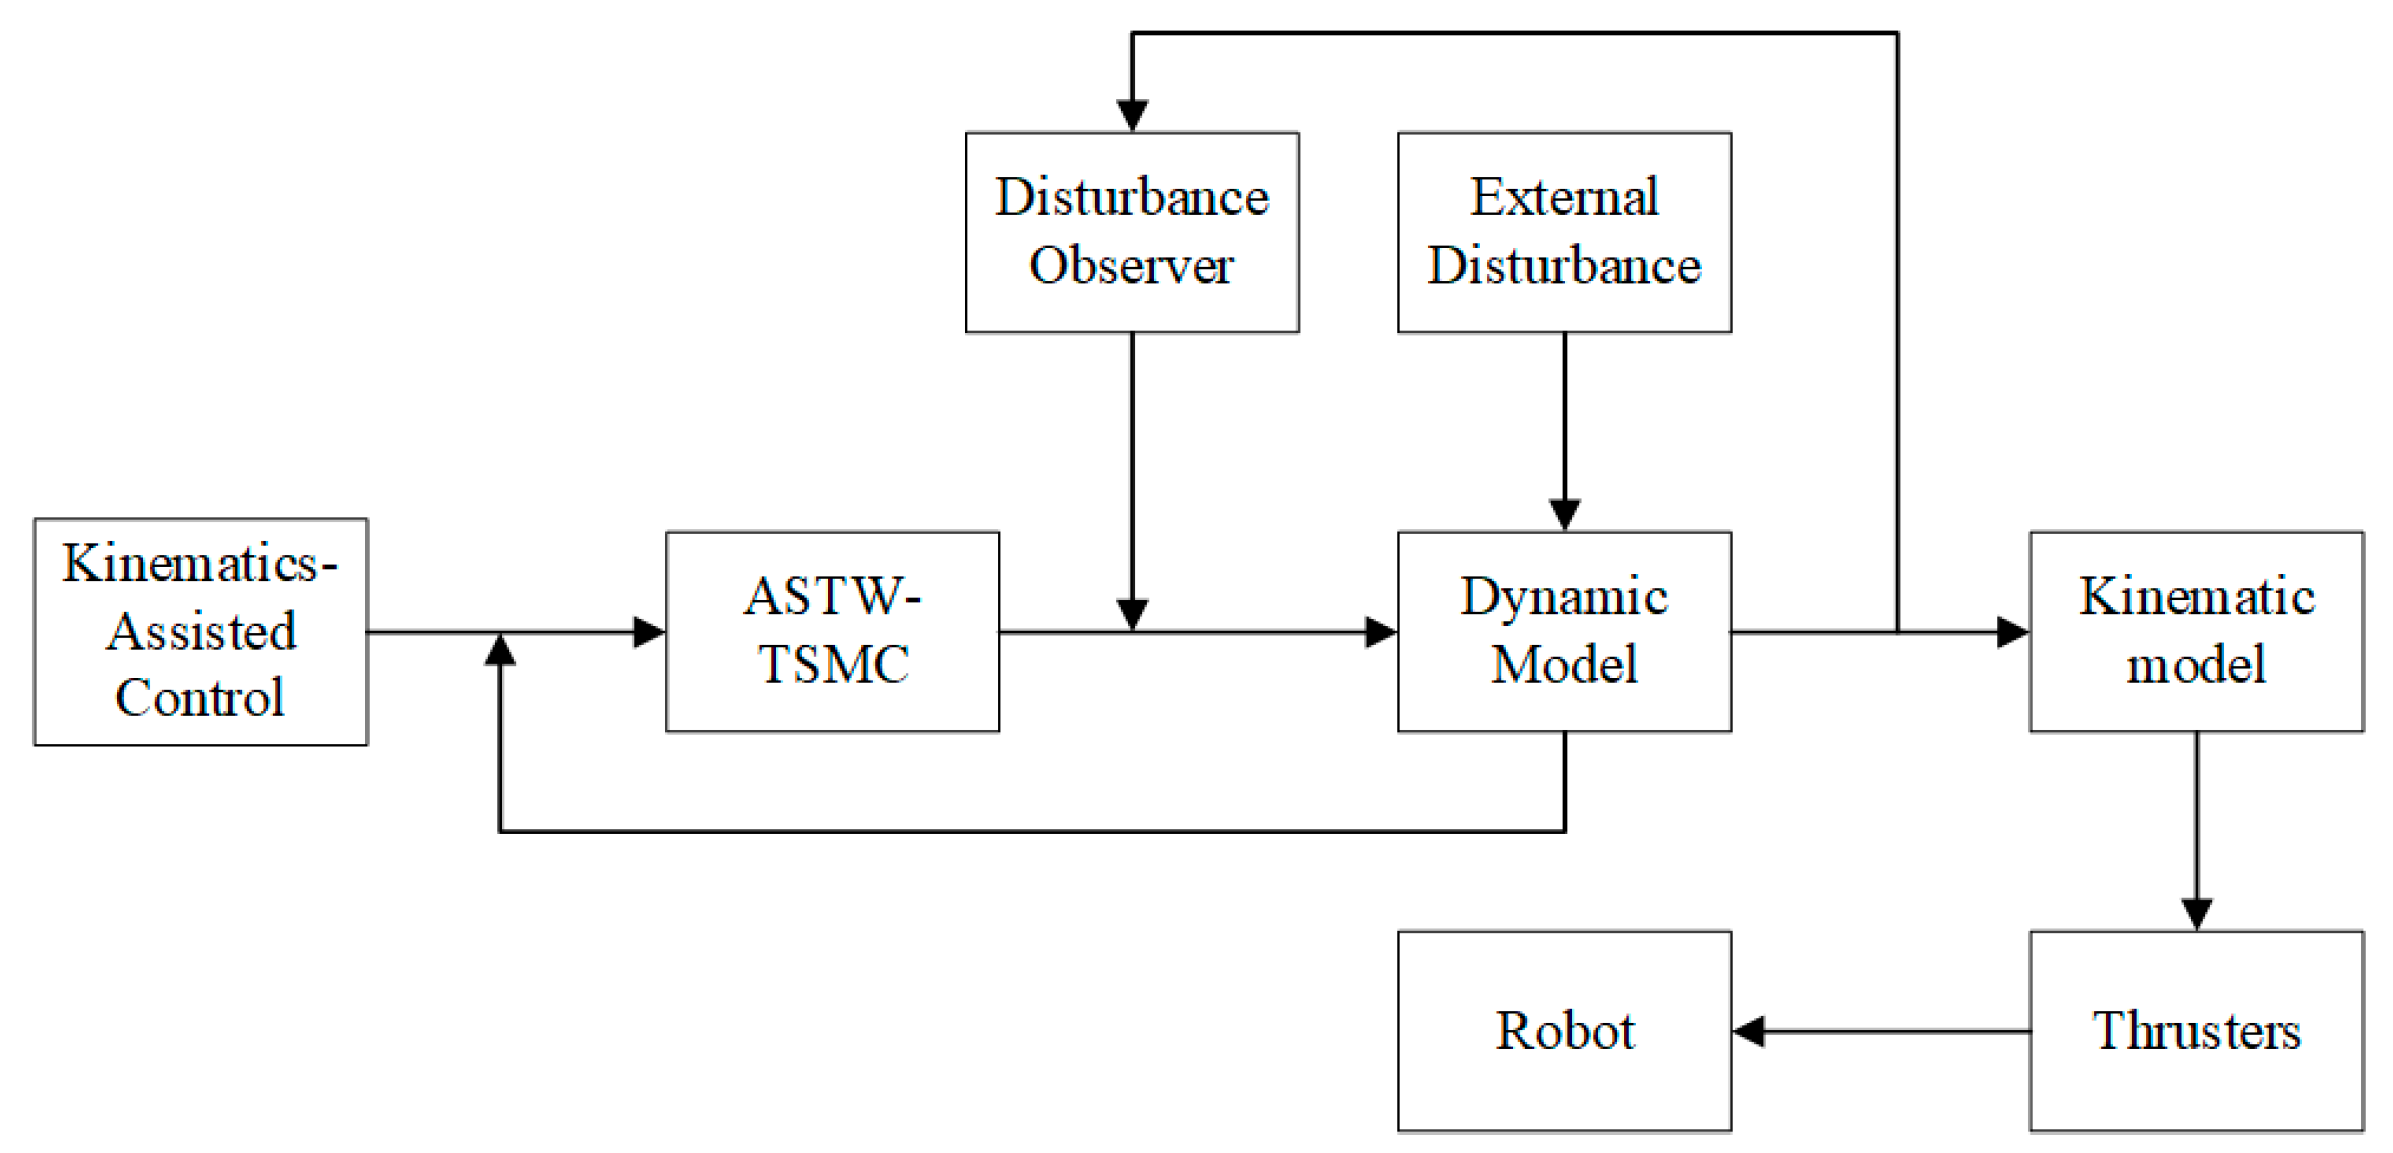
This study integrates nonsingular terminal sliding mode control and super-twisting sliding mode control to develop an Adaptive Super-Twisting Terminal Sliding Mode Controller (ASTW-TSMC) for trajectory tracking. The super-twisting algorithm significantly mitigates chattering in terminal sliding mode control. The design comprises two aspects:
- ①
Terminal Sliding Surface Design
In sliding mode variable structure control, if a region on the switching surface consists entirely of termination points, the reaching law drives the system toward the sliding manifold where errors asymptotically converge to zero. Traditional sliding mode controllers typically employ a linear error function as the sliding surface [
19]. When the system attains the sliding mode, tracking errors converge to zero asymptotically. However, linear sliding manifolds only guarantee asymptotic rather than finite-time convergence to zero. Terminal sliding mode strategy designs nonlinear functions to construct a nonlinear sliding surface, enabling finite-time error convergence to zero. Lyapunov stability criteria confirm that terminal sliding mode control systems achieve stability with the sliding manifold approaching zero in finite time.
Assuming the ROV’s desired trajectory is denoted as
, the position error is defined as
:
Terminal sliding mode control achieves finite-time convergence to zero, overcoming the asymptotic convergence limitation of conventional sliding mode controllers with linear surfaces. It exhibits superior dynamic performance and eliminates chattering by avoiding switching terms.
The terminal sliding manifold is formulated as:
where
, and
p,
q (
) are positive odd integers.
- ②
Adaptive Super-Twisting Reaching Law Design
The switching term in traditional sliding mode controllers contains discontinuous bounded sign functions, causing chattering that restricts system performance and precision [
20]. The super-twisting algorithm reduces chattering by generating cntinuous switching signals instead of switching functions [
21]. Typically, selection of control gains for the super-twisting algorithm relates to the upper bound of disturbances. To further enhance the performance of super-twisting sliding mode controllers, adaptive laws are designed for parameter estimation. Adaptive control addresses lumped disturbances from uncertain objects and external interference, adapting to additive and multiplicative perturbations with unknown bounds while avoiding gain overestimation to ensure rapid convergence and finite-time stability. The Adaptive Super-Twisting Terminal Sliding Mode not only overcomes the lack of finite-time convergence in traditional sliding mode control but also employs adaptive control to prevent overestimation of control parameters. The design principle dynamically increases control gains until the system’s sliding manifold approaches the equilibrium point.
The super-twisting reaching law is formulated as:
where
are control gains.
This paper designs adaptive laws to estimate control gains, addressing uncertain external disturbances in dam environments while preventing excessive gains and guaranteeing finite-time convergence. The ASTW structure is defined as:
where
are arbitrary positive constants ensuring adaptive parameters maintain positive gains, with
being a sufficiently small positive value.
3.2.3. Fixed-Time Sliding Mode Disturbance Observer
In sliding mode controllers, high switching gains suppress external disturbances to ensure controller robustness and stability. Maintaining control system stability typically requires selecting large upper-bound values and utilizing high-gain discontinuous terms for disturbance rejection. However, the sign functions inherent in this approach generate chattering. Furthermore, convergence time of conventional disturbance observers cannot be decoupled from initial conditions [
22], poor initial conditions may lead to uncontrolled convergence duration [
23]. The fixed-time sliding mode disturbance observer designed in this study possesses a predetermined upper-bound convergence time. Its parameter settings are independent of specific disturbance magnitudes, significantly enhancing applicability across operating conditions.
Consequently, this work designs a fixed-time sliding mode disturbance observer to approximate hydrodynamic disturbances in dam environments. Based on fixed-time control theory and disturbance observer techniques, auxiliary variables are introduced to define a sliding manifold (
Figure 17). This enables construction of a disturbance observer with fixed-time convergence capability for effective estimation of system composite disturbances, achieving high-precision motion control for the defect inspection robot.
Assuming the disturbance
and its derivative
are unknown and bounded (
), define the variable:
where
, and
denotes the estimated value of
.
Setting
yields:
The fixed-time disturbance observer is designed as:
where
, giving:
3.3. Control Software Interface Design
The surface control software interfaces are categorized into two types: status display interfaces and touch-operated control interfaces (
Figure 18). The status display interfaces primarily consist of main monitoring, status indication, and thruster display panels, which are interchangeably presented to provide operators with critical real-time vehicle status information. The touch-operated interfaces include pilot control panel, equipment control module, motion control console, autonomous operation interface, and parameter configuration interface, serving as essential tools for operator command execution.
Figure 18a Main Monitoring Interface displays the robot’s real-time position, attitude, and thruster status. This is the primary navigation and control dashboard. It displays the vehicle’s real-time orientation (pitch, yaw, roll), position from inertial and USBL navigation systems, speed, and depth. It also features a virtual control joystick for manual operation and toggles for activating automated functions like auto-depth and dynamic positioning.
Figure 18b Status Display Interface shows the communication status between the robot and sensors, along with alarm information. This screen functions as the system’s health diagnostics panel. It monitors all critical safety and operational parameters, including voltage levels for all power circuits, insulation resistance (a key safety metric), humidity and temperature inside the control cabin, and the status of leak sensors and key hardware components.
Figure 18c Thruster Monitoring Interface individually presents detailed parameters of each thruster (e.g., RPM, voltage). This interface provides a dedicated, visual overview of the vehicle’s propulsion system. It shows a schematic of the robot from top and front views, listing the real-time voltage and RPM data for each individual thruster, which is essential for diagnosing propulsion issues.
Figure 18d Master Control Interface manages sensor activation/deactivation. This is the primary operational console for managing the vehicle’s specialized tooling and payloads. It allows an operator to power and control specific equipment such as lights, a multi-axis camera gimbal, cleaning and grinding tools, and a crucial vacuum adsorption system for latching onto surfaces like dam walls.
4. Field Validation at Baihetan Hydropower Station
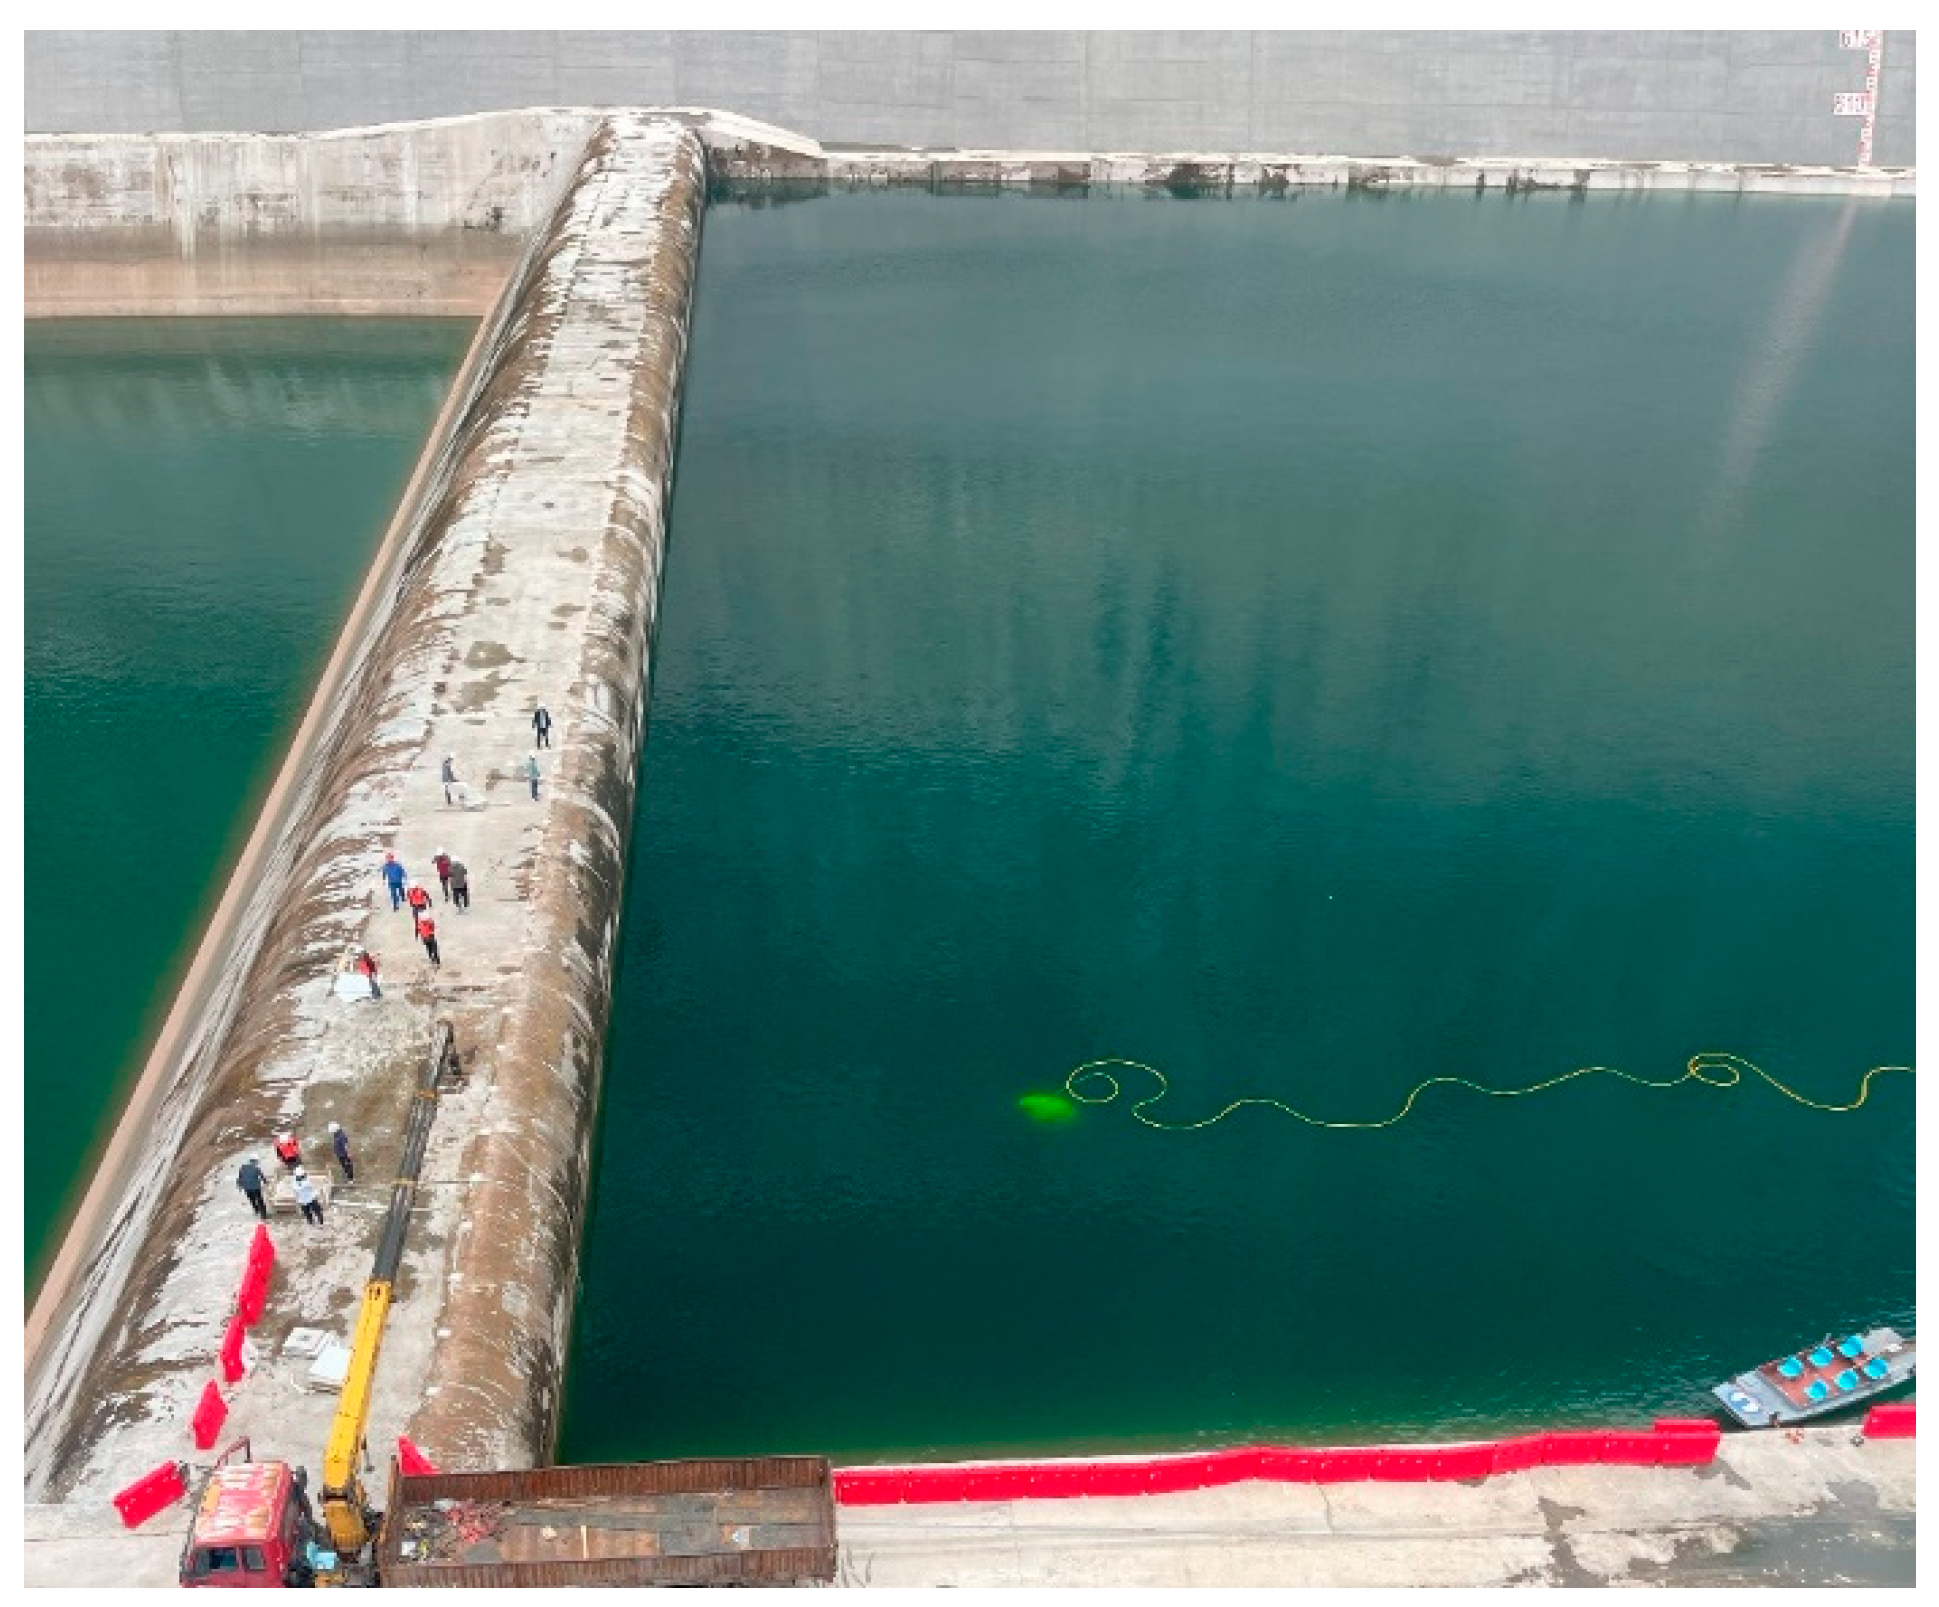
To validate the ultimate performance and reliability of the proposed underwater robotic control system, comprehensive field validation tests were conducted at Baihetan (
Figure 19) Hydropower Station—a world-class mega hydropower project characterized by extreme dam height, vast reservoir depth, and massive flood discharge capacity. The subaquatic environment exhibits intense turbulence, high-velocity currents, and complex near-wall hydrodynamic regimes, rendering it an ideal yet challenging natural testbed for verifying the performance of the underwater inspection robotic control system under the most severe operating conditions. The core objective of this field validation was to holistically assess the engineered practicality and robustness of the designed control system, specifically focusing on testing the robotic platform’s capability to execute critical tasks—including near-wall cruising, station-keeping, and multi-degree-of-freedom autonomous control—within environments featuring intense turbulence, high flow velocities, and low-visibility conditions. Quantitative evaluation focused on the actual effectiveness of the proposed motion control algorithm integrating environmental disturbance observation and compensation in overcoming hydrodynamic interference, maintaining precise attitude, and stabilizing control relative to dam-surface proximity (near-wall control).
Automatic depth-holding, altitude-holding, heading-lock, velocity regulation, dam-surface distance tracking, and station-keeping tests were performed on the underwater defect inspection robot. Depth data was acquired using the navigation system’s depth sensor; altitude data via an altimeter; heading angle by attitude sensors; position via an inertial navigation system (INS); velocity by speed sensors; and distance by ranging sensors. Standard deviations between recorded values and setpoints were calculated for each parameter, with results presented below.
The statistical terms referenced in the table below are defined as follows:
Total N (Sample Size), total number of observations in the dataset.
Mean (Arithmetic Mean), sum of all values divided by sample size.
Std. Dev. (Standard Deviation), measure of data dispersion around the mean.
Median, middle value in an ordered dataset.
Range, difference between maximum and minimum values.
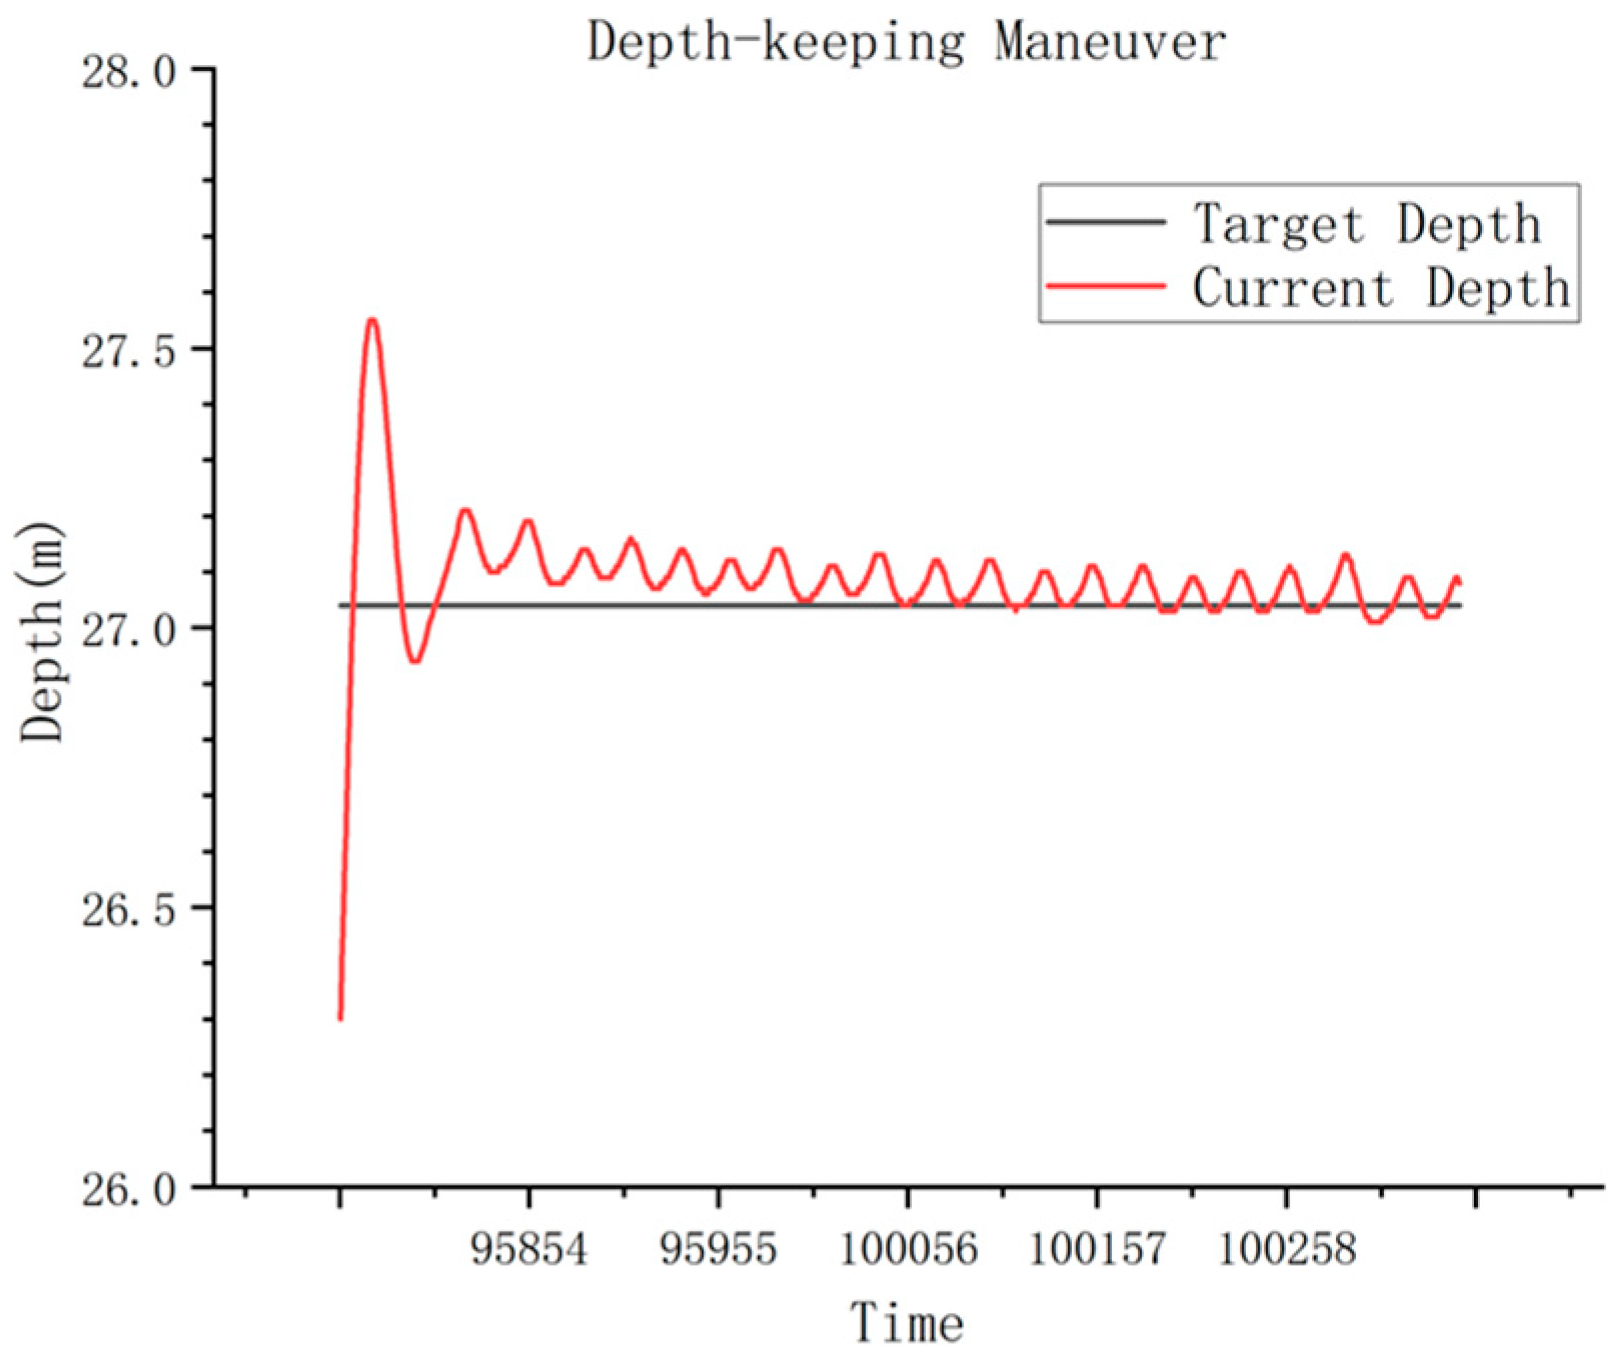
For automatic depth-holding navigation with a setpoint of 27.04 m, recording commenced 1 min after activation and persisted for 5 min during robotic depth-holding motion. Data analysis revealed a mean depth of 27.08 m under automatic depth-holding operation, with depth-holding precision standard deviation σ = 0.034 (
Figure 20,
Table 1).
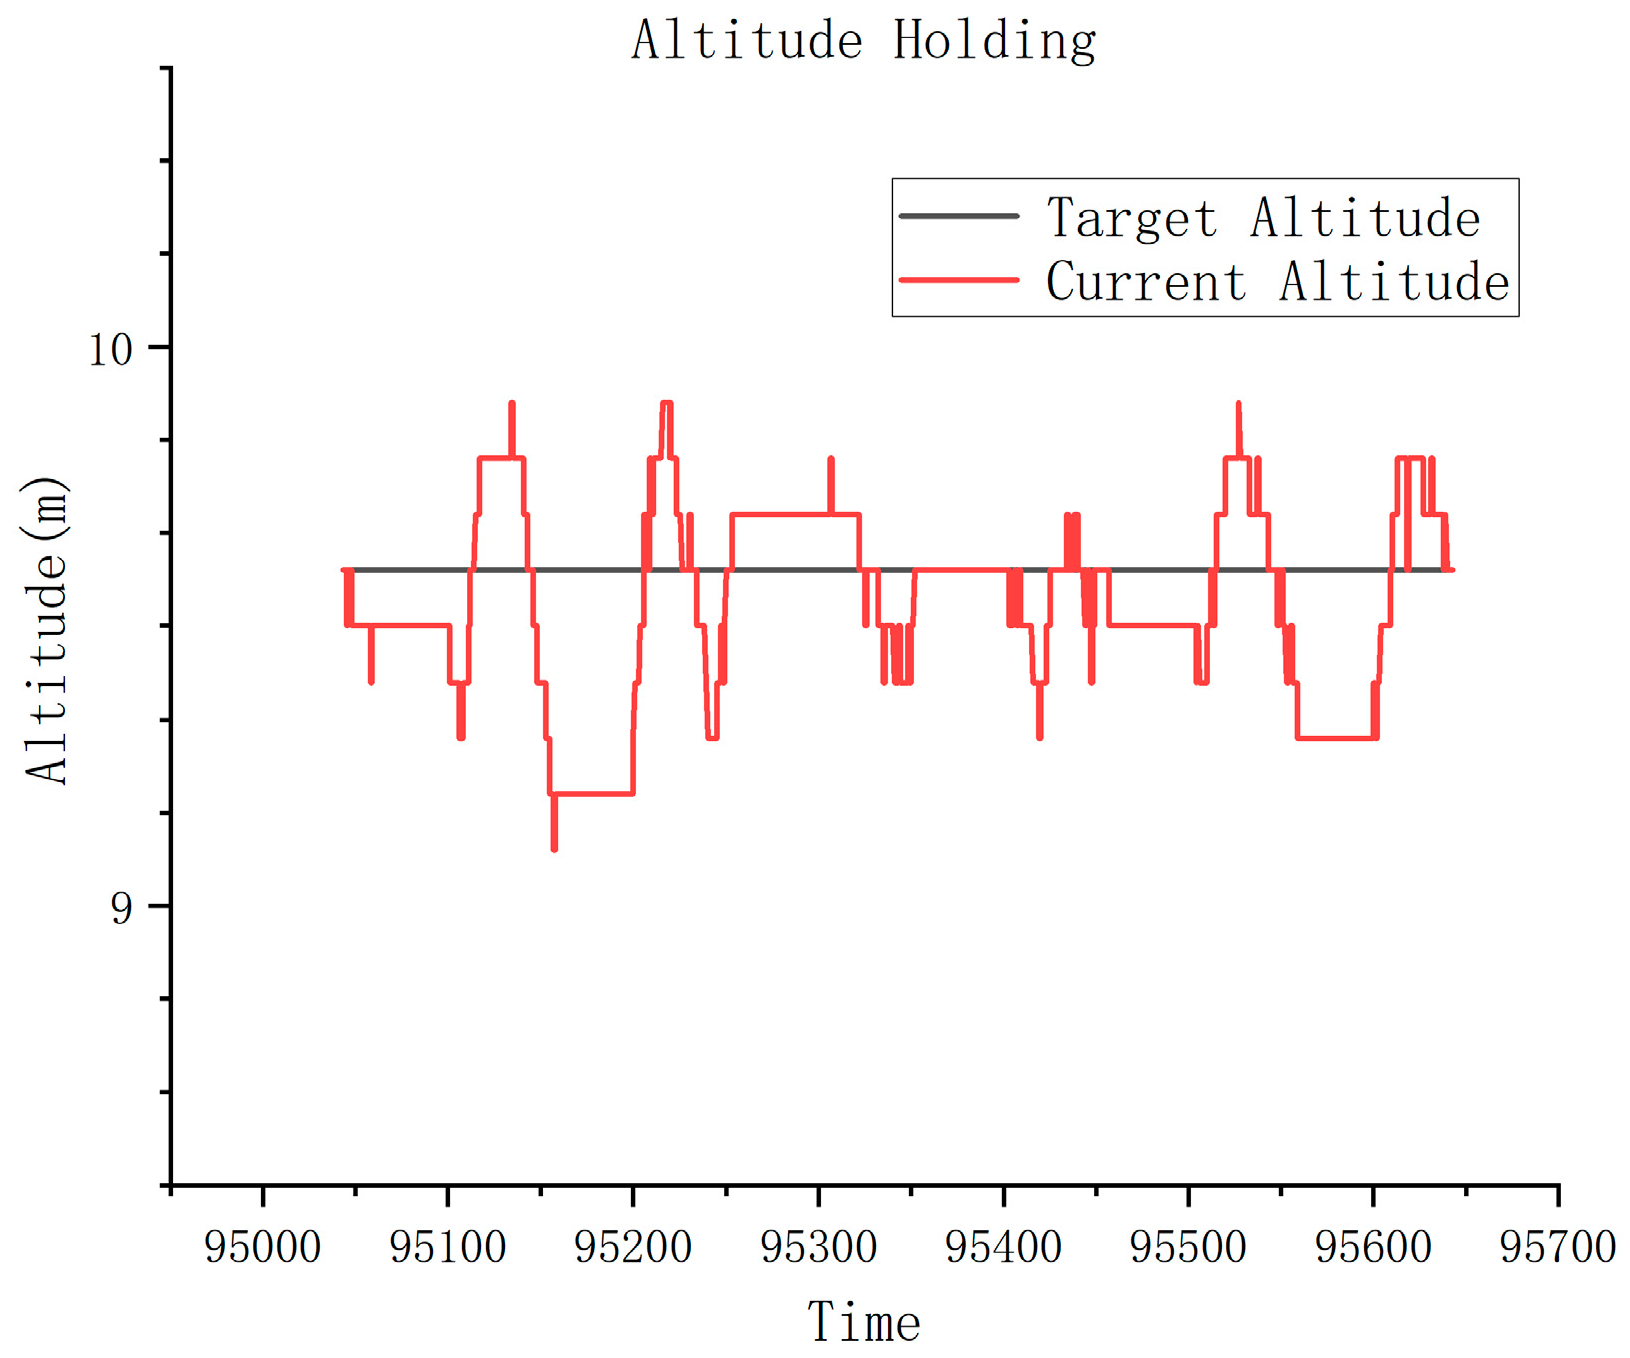
For automatic altitude-holding navigation with a setpoint of 9.6 m, recording commenced 1 min after activation and persisted for 5 min during robotic altitude-holding motion. Data analysis revealed a mean altitude of 9.59 m under automatic altitude-holding operation, with altitude-holding precision standard deviation σ = 0.148 (
Figure 21,
Table 2).
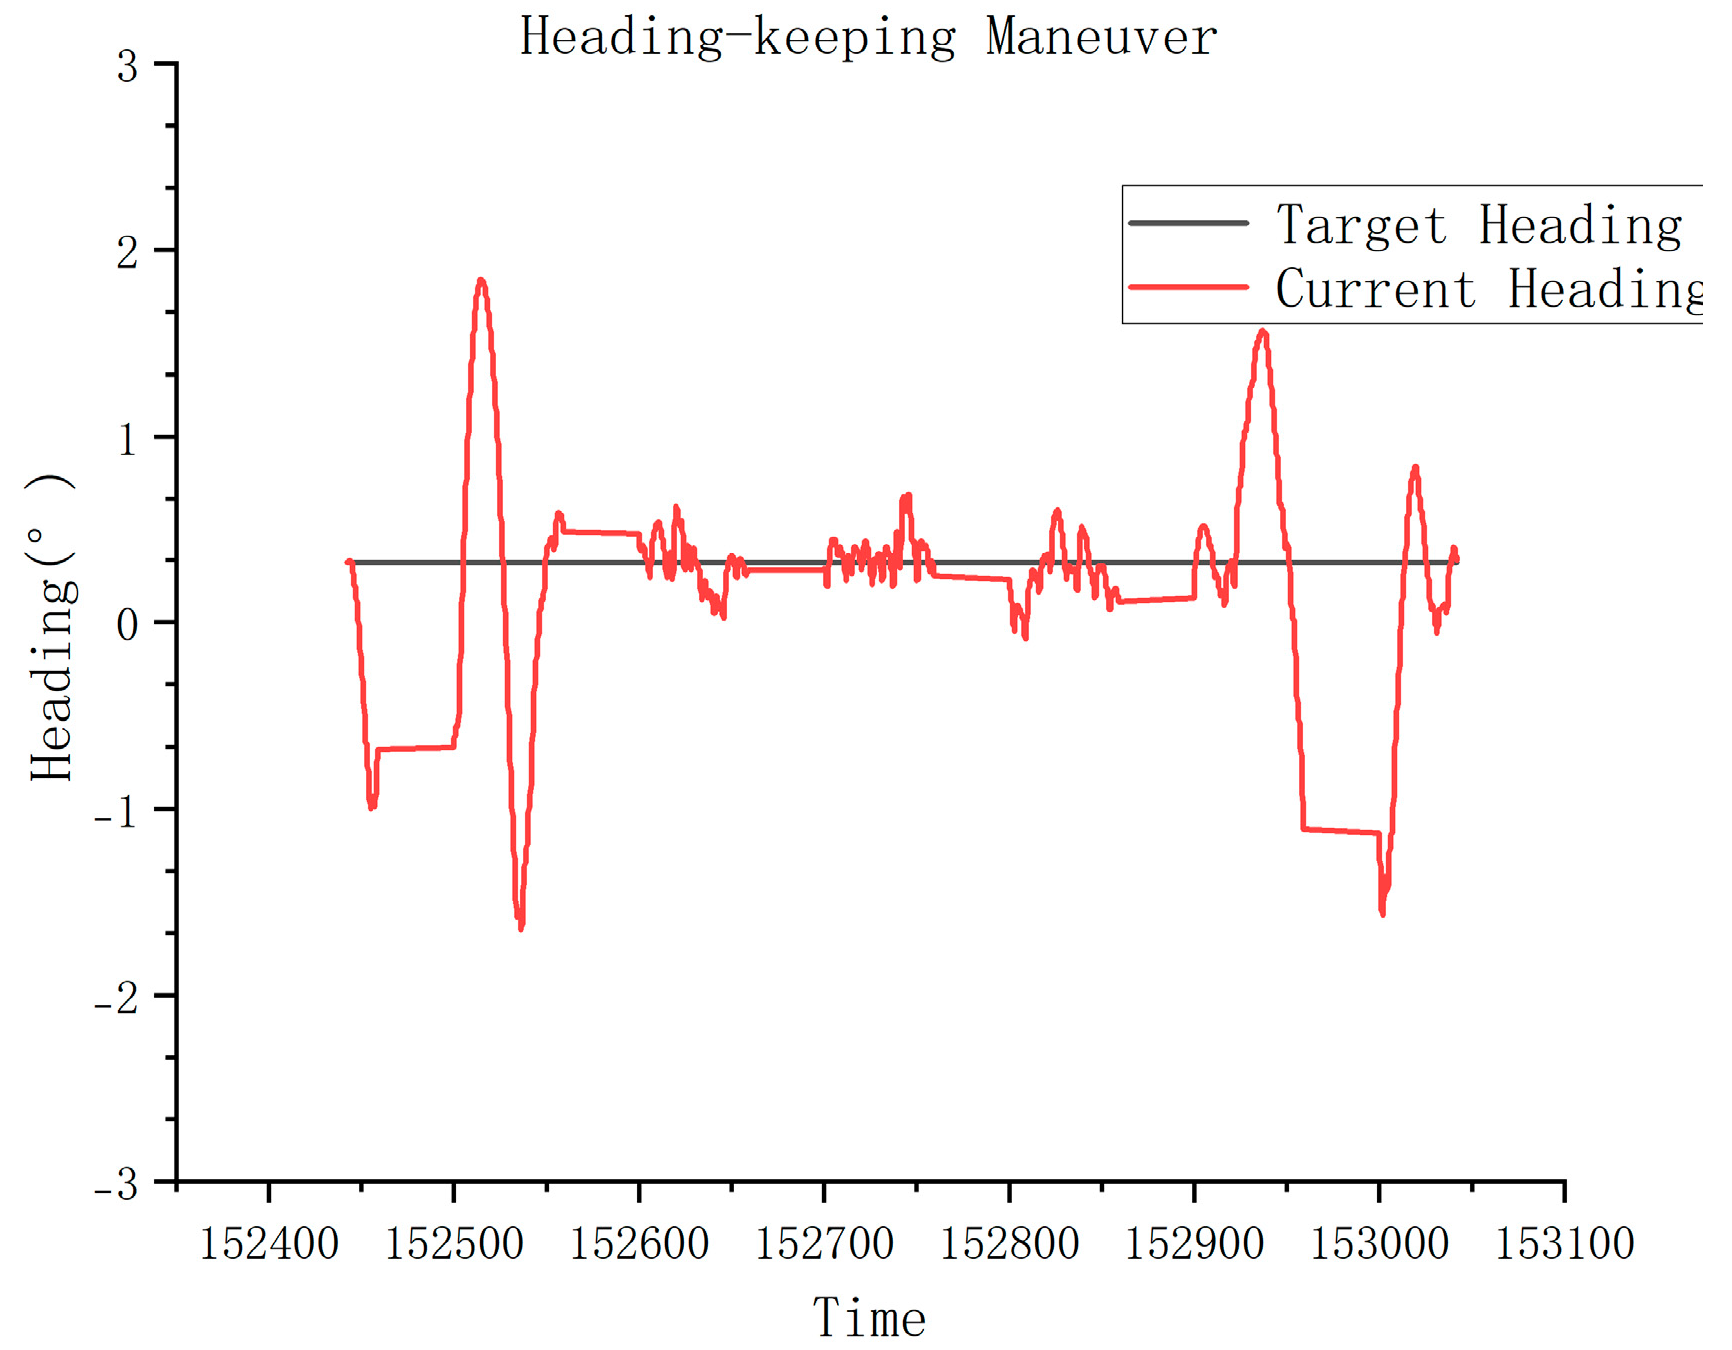
For automatic heading-lock navigation with a setpoint of 0.32°, recording commenced 1 min after activation and persisted for 5 min during robotic heading-lock motion. Data analysis revealed a mean heading angle of 0.31° under automatic heading-lock operation, with heading-lock precision standard deviation σ = 0.441 (
Figure 22,
Table 3).
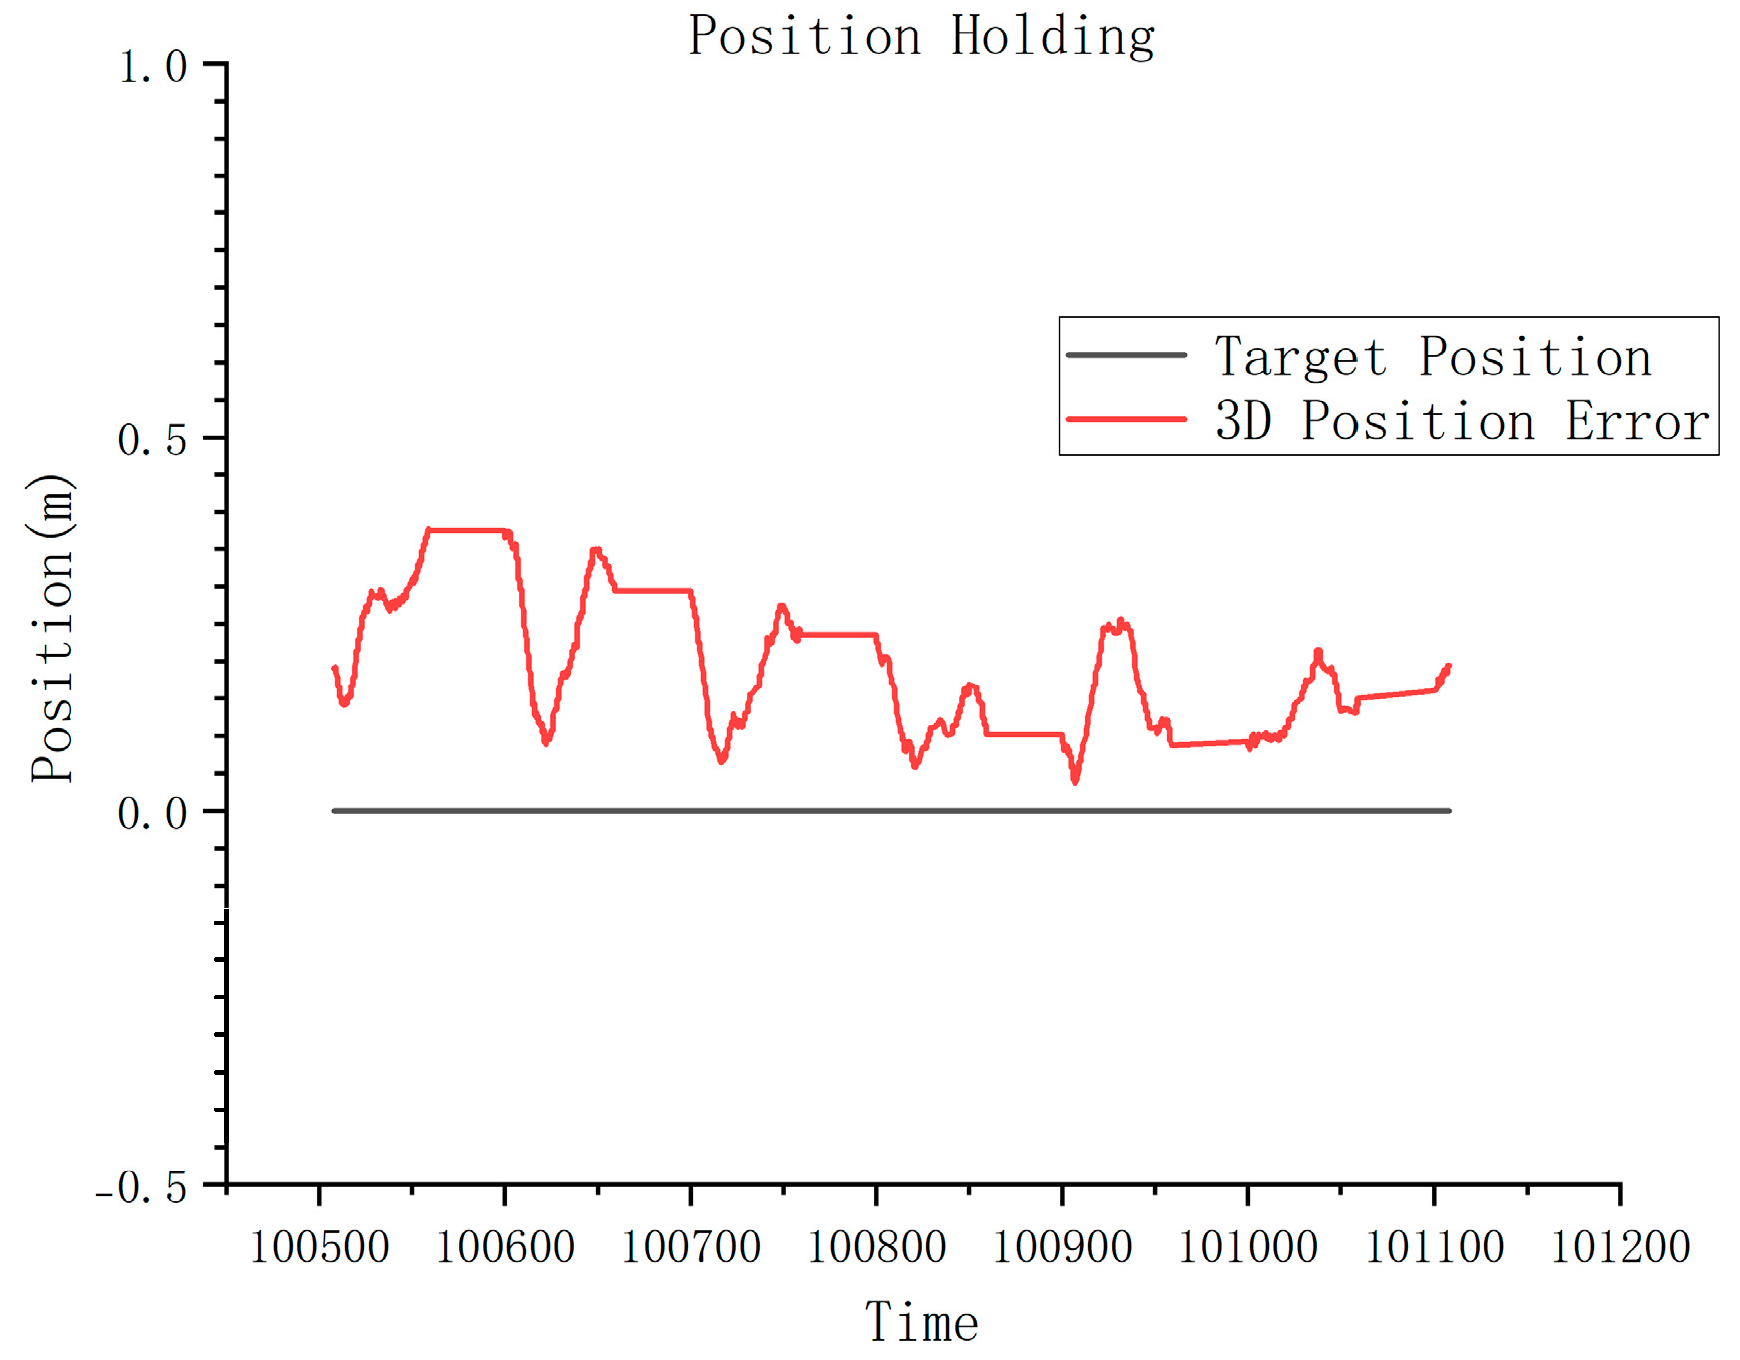
For station-keeping positioning tests with setpoint coordinates (0, 0, 27.26 m), recording commenced 1 min after activation and persisted for 5 min during robotic station-keeping motion. Data analysis revealed a mean 3D position deviation of 0.16 m under automatic station-keeping operation, with positioning precision standard deviation σ = 0.07 (
Figure 23,
Table 4). Test results confirm the robotic station-keeping performance meets specification requirements.
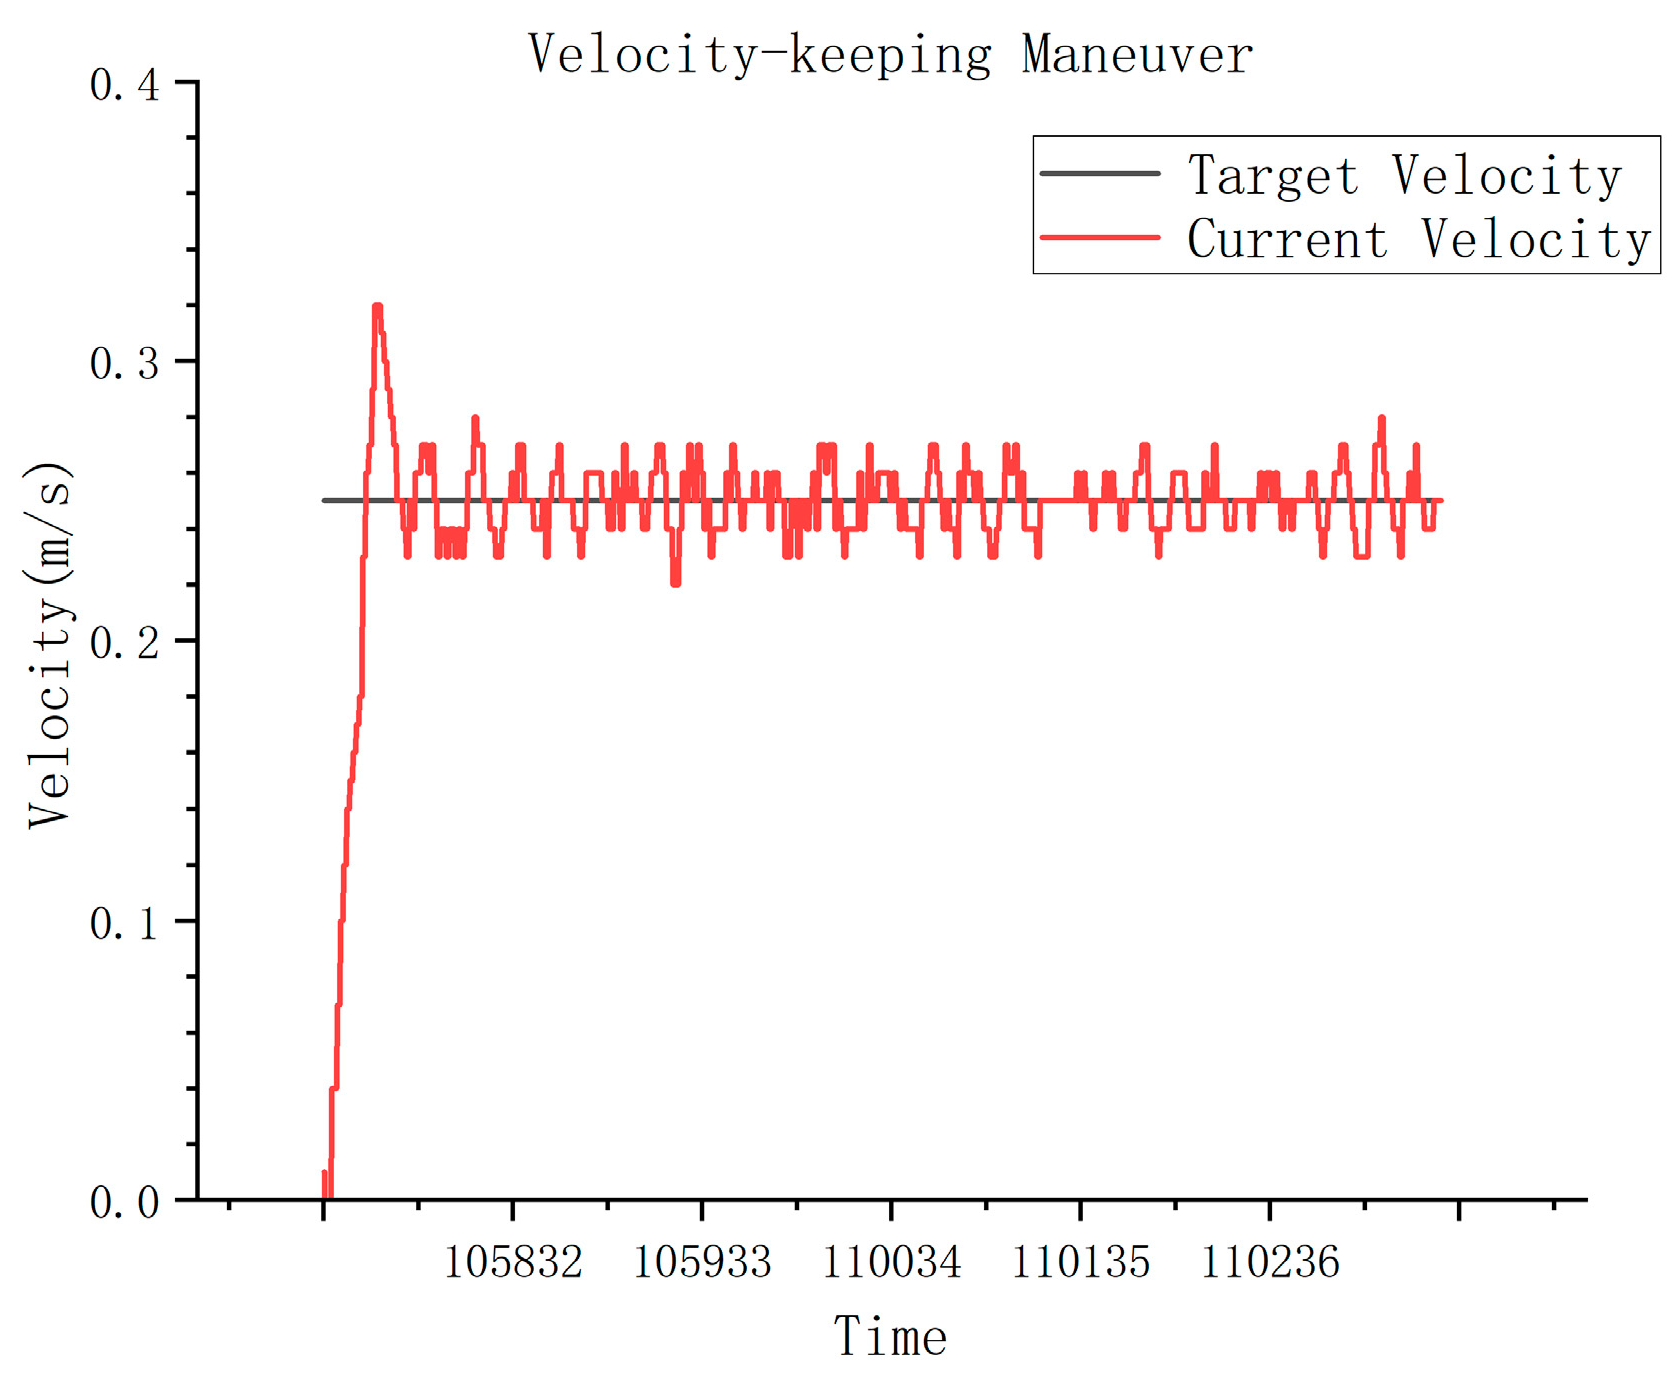
For automatic velocity regulation navigation with a setpoint of 0.25 m/s, recording commenced 1 min after activation and persisted for 5 min during robotic velocity regulation motion. Data analysis revealed a mean velocity of 0.25 m/s under automatic velocity regulation operation, with velocity regulation precision standard deviation σ = 0.011 (
Figure 24,
Table 5).
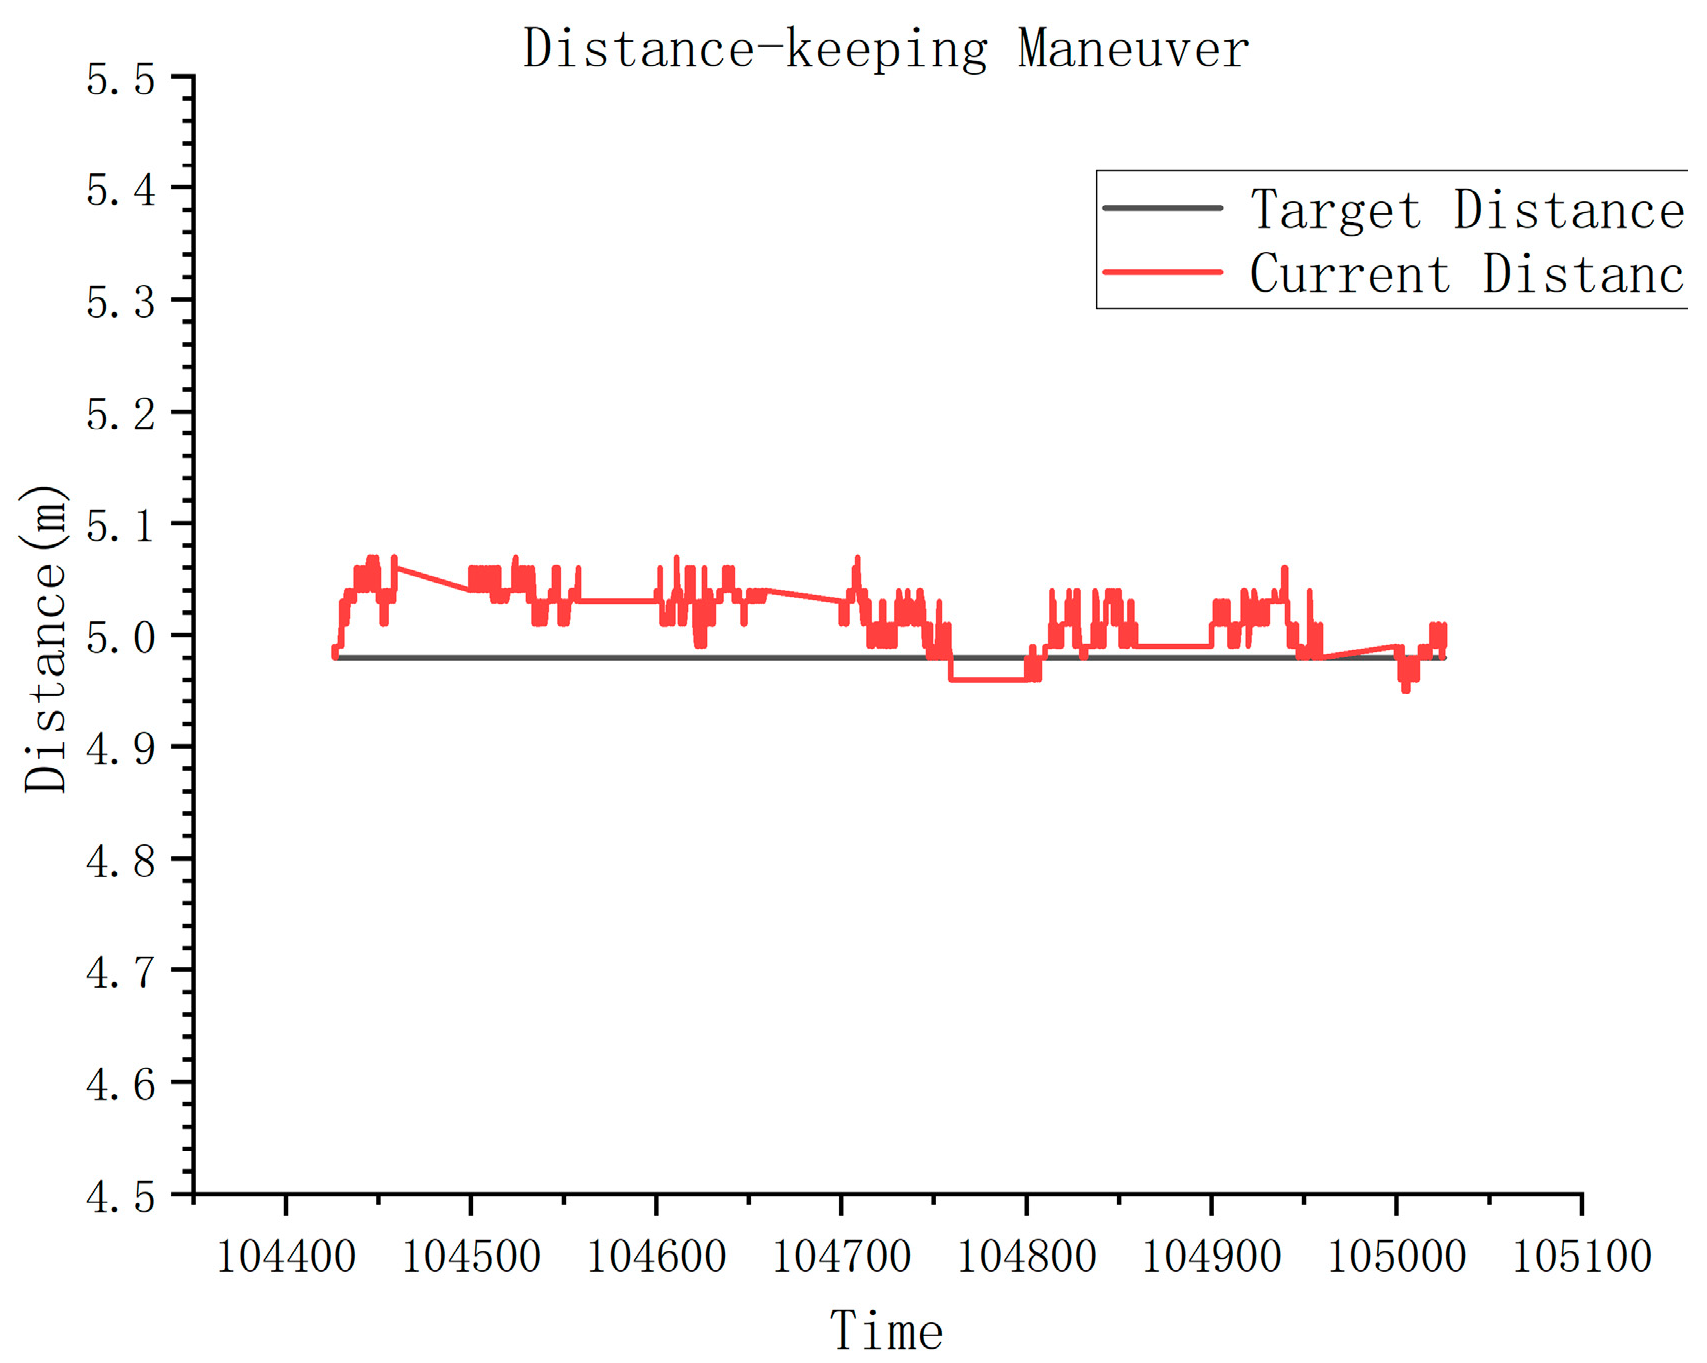
For dam-surface distance tracking navigation with a setpoint of 4.98 m, recording commenced 1 min after activation and persisted for 5 min during robotic distance-holding motion. Data analysis revealed a mean distance of 5.01 m under automatic distance-holding operation, with distance-holding precision standard deviation σ = 0.023 (
Figure 25,
Table 6).
Field validation at Baihetan Hydropower Station comprehensively verified six core motion control capabilities of this control system under extreme subaquatic conditions. Test data conclusively demonstrates exceptional overall precision, with all metrics meeting or exceeding design specifications. Particularly outstanding performance was observed in depth control (σ = 0.034 m), velocity regulation (σ = 0.011 m/s), dam-surface distance tracking (σ = 0.023 m), and station-keeping (σ = 0.07 m), highlighting the system’s strong robustness against complex hydrodynamic disturbances (
Table 7). Altitude-holding (σ < 0.15 m) and heading-lock (σ < 0.5°) precision fully satisfy engineering requirements for bottom clearance and course maintenance during large-scale dam inspections. These results directly validate the successful implementation of environmental disturbance observation and dynamic compensation mechanisms within the motion control algorithm, effectively suppressing Baihetan-specific intense turbulence to achieve stable, precise, and controllable robotic motion in challenging environments.
Quantitative precision testing at Baihetan provides compelling performance endorsement for the designed underwater robotic control system. Data confirms the system not only operates reliably in the uniquely harsh subaquatic conditions of hydropower stations but also delivers high-precision motion control at centimeter-to-decimeter levels. This establishes a solid technical foundation for efficient and accurate execution of dam-surface defect inspection and imaging missions.
5. Conclusions
This study addresses the urgent need for underwater structural safety inspection of hydropower dam structures amidst complex environmental challenges by designing and implementing a high-performance dedicated control system for underwater vehicles. The system prioritizes enhancing robotic capabilities for high-precision, stable near-wall inspection in deep-water, high-turbulence, and low-visibility environments. Field validation at Baihetan Hydropower Station yields the following key conclusions:
This study successfully developed a dedicated hierarchical control system for underwater inspection robots, comprising hardware, interaction, and core control layers. The integrated motion control algorithm incorporated environmental disturbance observation and dynamic compensation, ensuring stable near-wall operations under flow velocities.
The core innovation lies in developing a dedicated robotic control system tailored for the unique hydrodynamic complexities of hydropower dams, particularly its high-performance motion control algorithm with integrated disturbance observation and compensation. This effectively resolves critical bottlenecks constraining precise and stable underwater operations. Successfully deployed at Baihetan, the system’s efficacy is empirically validated, offering robust technical underpinning for safeguarding critical hydraulic infrastructure. Future work will focus on the following:
Further refine the control algorithms to improve adaptability to a wider range of flow velocities and underwater terrains, with a focus on real-time learning capabilities for handling dynamic hydraulic conditions.
- 2.
System Miniaturization and Autonomy Enhancement
Develop a compact and intelligent control system to enable fully unmanned inspections. Incorporate lightweight edge-AI modules equipped with computer vision and deep learning for real-time defect detection (e.g., cracks, corrosion), thereby minimizing dependence on post-processing at the surface level.
- 3.
Multi-Robot Collaboration and Swarm Intelligence
Standardized protocols for multi-robot collaboration systems must be developed, incorporating key functionalities such as dynamic task allocation and collision avoidance mechanisms, to facilitate efficient large-scale synchronous inspection operations. Furthermore, robust swarm control methodologies should be investigated for GPS-denied operational environments, utilizing underwater acoustic positioning systems and distributed simultaneous localization and mapping (SLAM) techniques to ensure reliable autonomous navigation and coordination.
- 4.
Multi-Scenario Validation
Future work will include comparative field trials against established benchmarks under matched conditions, with initial results expected from the Three Gorges Dam deployment in Q3 2025.
