Article

An Adaptive Dual-Channel Underwater Target Detection Method Based on a Vector Cross-Trispectrum Diagonal Slice

1
College of Meteorology and Oceanography, National University of Defense Technology, Changsha 410073, China
2
Unit 61540 of the Chinese People’s Liberation Army, Beijing 100029, China
*
Author to whom correspondence should be addressed.
These authors contributed equally to this work.
J. Mar. Sci. Eng. 2025, 13(9), 1628; https://doi.org/10.3390/jmse13091628
Submission received: 26 July 2025 / Revised: 14 August 2025 / Accepted: 25 August 2025 / Published: 26 August 2025
(This article belongs to the Section Ocean Engineering)

Abstract

This paper introduces a method for detecting weak line spectrum signals in dynamic, non-Gaussian marine noise using a single vector hydrophone. The trispectrum diagonal slice is employed to extract coupled line spectrum features, enabling the detection of line spectra with independent frequencies and phases while effectively suppressing Gaussian noise. By constructing a cross-trispectrum diagonal slice spectrum from the hydrophone’s sound pressure and composite particle velocity, the method leverages coherence gain to enhance the signal-to-noise ratio (SNR). Furthermore, a discriminator based on the cross-coherence function of pressure and velocity is proposed, which utilizes a dynamic threshold to adaptively and in real-time select either the vector cross-trispectrum diagonal slice (V-TriD) or the conventional energy detection (ED) as the optimal detection channel for incoming signal. The feasibility and effectiveness of this method were validated through simulations and sea trial data from the South China Sea. Experimental results demonstrate that the proposed algorithm can effectively detect the target signal, achieving an SNR improvement of 3 dB at the target frequency and an average reduction in broadband noise energy of 1–2 dB compared to traditional energy spectrum detection. The proposed algorithm exhibits computational efficiency, adaptability, and robustness, making it well suited for real-time underwater target detection in critical applications, including harbor security, waterway monitoring, and marine bioacoustic studies.

1. Introduction

Underwater target detection plays a pivotal role in numerous domains, including national defense, marine resource exploration, and environmental monitoring [1,2]. The line spectra radiated by targets, characterized by their higher energy and greater stability compared to the continuous spectrum, are frequently used as key features for detecting marine vessels [3]. However, the extraction of these faint line spectrum signals is significantly hampered by interference from ambient noise sources, such as biological activity, undersea seismic events, rainfall, and anthropogenic activities [1,4,5]. Consequently, developing methods to extract line spectra from complex and time-varying marine noise environments is of paramount importance for long-range target detection.
Traditional target detection methods have predominantly focused on the second-order statistical properties and scalar characteristics of the sound field, thereby neglecting the substantial information contained within higher-order statistics and phase relationships [6,7,8]. The focus on second-order statistics, such as the power spectrum, renders these methods blind to non-Gaussian signal characteristics and phase information, leading to inherent performance limitations and difficulties in achieving significant improvements. As a result, there is a pressing need for new signal detection methodologies that can operate robustly in non-Gaussian environments, fully leverage richer acoustic field information like phase, and adapt to the dynamic nature of the underwater environment. Numerous scholars have conducted in-depth studies in the field of adaptive line enhancement (ALE), which primarily operates by exploiting the difference in correlation properties between line spectrum signals and broadband noise components [9,10,11]. However, ALE algorithms exhibit limited efficacy when dealing with colored Gaussian noise. Concurrently, the Kalman filter (KF) has been recognized for its advantages in detecting periodic signals and has been applied to line spectrum detection [12,13], enhancing SNR through a prediction-and-filtering process. While some studies have shown significant performance gains at extremely low SNRs, the detection performance of KF-based methods degrades for moving targets (e.g., transiting cargo ships) because the signal coherence diminishes due to spatiotemporal variations in the channel [14]. More recently, chaos theory has seen some application in underwater detection, but these methods are often characterized by complex and time-consuming detection procedures [15].
In recent years, despite continuous advancements in acoustic sensor technology [16], the limitations of acoustic scalar sensors, constrained by aperture and information dimensionality, have led to a detection bottleneck. Acoustic vector sensors, capable of synchronously and co-locatingly measuring both sound pressure and particle velocity, have brought about a paradigm shift in underwater target detection [17]. Nehorai and Paldi established the fundamental model for acoustic vector sensors [18], providing the theoretical framework for subsequent signal processing algorithm design. Vector acoustics has since demonstrated broad potential in fields such as geoacoustic parameter inversion [19,20] and target detection [21,22,23]. Li et al. proposed a vector coherent frequency-domain batch (VCFB-ALE) method, which significantly reduces computational load compared to traditional time-domain algorithms and improves SNR by 3–6 dB [23]. However, its performance deteriorates severely in non-stationary, non-Gaussian noise. In parallel, within the field of statistical signal processing, Nikias and Raghuveer systematically introduced the concept of higher-order spectra (HOS), particularly the bispectrum, into digital signal processing [24]. A key property of HOS is its ability to suppress Gaussian noise while preserving crucial phase information, making it widely applicable for line spectrum extraction [25,26,27,28]. Third-order statistics can effectively extract harmonically related signals with second-order phase coupling [26,29], while fourth-order statistics can extract features from both second- and third-order coupled line spectra, including those with independent frequencies and phases [30]. Bao et al. proposed a line spectrum detection method based on a fourth-order cumulant slice spectrum, which inherits the Gaussian noise suppression property of HOS and does not require the signal to satisfy phase-coupling conditions. However, its effectiveness is highly dependent on the quality of the cumulant estimation, leading to severe performance degradation at low SNRs [31]. HOS has also been extensively developed for direction-of-arrival (DOA) estimation [32,33], where its core advantage remains the suppression of Gaussian noise to improve SNR.
To address the challenge of detecting weak target signals in dynamic, non-Gaussian marine environments, this paper proposes an adaptive dual-channel target detection method based on a vector hydrophone. First, we introduce a novel metric, the vector cross-trispectrum diagonal slice (V-TriD), which is constructed by jointly processing the sound pressure and composite particle velocity signals. This approach demonstrates superior performance compared to conventional energy detection methods by fully leveraging the advantages of vector signal joint processing while effectively suppressing Gaussian noise interference. Furthermore, we propose an adaptive dual-channel detection framework (V-TriD-Dual). A dynamic threshold discriminator, based on signal coherence, is designed to automatically and in real-time route the input signal to the optimal detection channel: either the V-TriD channel or a conventional energy detection (ED) channel. This framework synergistically combines the superior noise suppression of V-TriD under high-coherence conditions with the robustness of energy detection under low-coherence conditions. Simulations and experimental results confirm that this method shows strong environmental noise suppression capabilities.

2. Theoretical Background

This section establishes the fundamental physical and mathematical principles that underpin the proposed detection method. It begins by modeling the vector hydrophone signal and quantifying the relationship between its components, then introduces the higher-order statistical tools used for noise suppression, and finally details the procedure for identifying line spectra in the processed output.

2.1. Target Detection via Pressure–Velocity Correlation

The physical relationship between sound pressure and particle velocity for a target signal forms the basis of the proposed method’s adaptive capability. This relationship can be quantified by the coherence function, which serves as a key indicator of a target’s presence.

2.1.1. Signal Model for a Single Vector Hydrophone

When a sound wave propagates over a long distance underwater, it can be approximated as a plane wave. In this far-field condition, the sound pressure and particle velocity are in phase. For a harmonic sound wave, the sound pressure p ( t ) of an acoustic signal x ( t ) , radiated from a source S and received by a vector hydrophone at point A in the far-field, is given as
p ( t ) = p 0 e j ( ω t k r )
where p 0 is the amplitude, ω is the angular frequency, k is the wavenumber ( k = ω / c , where c is the speed of sound), and r is the distance between the hydrophone and the source. The relationship between sound pressure and particle velocity u ( t ) is governed by Euler’s equation:
ρ u t = p
where ρ is the density of the medium and is the Hamiltonian operator.
This leads to
u = 1 ρ p d t
Substituting Equation (1) into (3) yields
u ( t ) = 1 ρ p 0 e j ( ω t k r ) d t = 1 ρ ( e x x + e y y + e z z ) p 0 e j [ ω t ( k cos θ cos φ ) x ( k sin θ cos φ ) y ( k sin φ ) z ] d t = 1 ρ ( j k cos θ cos φ e x j k sin θ cos φ e y j k sin φ e z ) p 0 e j ( ω t k r ) d t = 1 ρ ( j ω c cos θ cos φ e x j ω c sin θ cos φ e y j ω c sin φ e z ) p 0 j ω e j ( ω t k r ) = 1 ρ c ( cos θ cos φ e x + sin θ cos φ e y + sin φ e z ) p ( t )
where φ is the horizontal azimuth angle and θ is the grazing angle of the incident sound signal, and e x , e y , e z are mutually orthogonal unit coordinate vectors. From Equation (4), the relationship between the components of the particle velocity vector and the sound pressure is
u x ( t ) = 1 ρ c p ( t ) cos θ cos φ e x u y ( t ) = 1 ρ c p ( t ) sin θ cos φ e y u z ( t ) = 1 ρ c p ( t ) sin φ e z
where Z = ρ c is defined as the specific acoustic impedance. In the far field, where the radiated sound wave is a plane wave, Z is a real number. Figure 1 illustrates the geometry of particle velocity reception for the vector hydrophone’s channels.

2.1.2. Coherence of Sound Pressure and Particle Velocity

The spatial–energy characteristics of a sound field can be described by its auto- and cross-spectral properties. Spectral analysis methods allow for the extraction of spectral components from various sound sources within the marine ambient noise, thereby expanding the possibilities for studying complex sound fields. For time-domain signals p ( t ) , u x ( t ) , u y ( t ) , and u z ( t ) , their Fourier transforms can be expressed as
P k ( f , N ) = 1 N p k ( t ) e j 2 π f t d t
V k , i ( f , N ) = 1 N u k , i ( t ) e j 2 π f t d t ,   i = x , y , z
where N is the sample length, and k is the number of Fourier transforms per sample segment. Based on this, the single-sided cross-spectral density function is defined as
S P V i ( f ) = lim N 2 N P k ( f , N ) V k , i ( f , N )
where i = x , y , z , and denotes the ensemble average. The coherence function can then be expressed using the single-sided cross-spectral density function:
γ P V i 2 = | S P V i ( f ) | 2 S P 2 ( f ) S V i 2 ( f ) ,   0 γ P V i 2 1
The sound intensity, defined as the time-averaged product of instantaneous sound pressure p ( t ) and particle velocity u ( t ) ( I ( t ) = < p ( t ) u ( t ) > ), quantifies the directional energy flux per unit area in an acoustic field. In the frequency domain, this translates to I ( ω ) = 1 2 Re { P ( ω ) V ( ω ) } , where P ( ω ) and V ( ω ) are the Fourier transforms of p ( t ) and u ( t ) , respectively. In acoustic vector signal processing, the aforementioned relationship is expressed as I i ( ω ) = 1 2 Re { P ( ω ) V i ( ω ) } . Physically, Equation (9) represents the squared magnitude of the normalized acoustic intensity spectrum I i ( ω ) , achieved through the coherence factor γ P V i 2 . This normalization isolates the propagating wave component while suppressing uncorrelated noise. Compared to the correlation function, the coherence function is more convenient and contains more information about the sound field, making it more commonly used in vector acoustic field analysis. When γ P V i 2 = 0 , the two signals have no linear relationship. When γ P V i 2 = 1 , the signals are perfectly correlated. Typically, a value of γ P V i 2 0.4 is considered to indicate a weak association between signals, possibly influenced by noise or non-linear factors. A value of γ P V i 2 0.6 suggests a strong linear coupling, which can be utilized for tasks such as signal source detection, localization, and system identification.

2.2. Vector Cross-Trispectrum Diagonal Slice Detection

Higher-order statistics (HOS) provide a powerful mathematical framework for suppressing Gaussian noise. A key property of Gaussian processes is that all joint cumulants of order higher than two are identically zero. Consequently, all spectra of order higher than two, known as polyspectra, vanish for a Gaussian process, making HOS an ideal tool for detecting non-Gaussian signals embedded in Gaussian noise.

2.2.1. Definition of the Vector Cross-Trispectrum Diagonal Slice

For a zero-mean stationary random signal x ( n ) , its fourth-order cumulant is
C 4 , x ( τ 1 , τ 2 , τ 3 ) = E x ( n ) x ( n + τ 1 ) x ( n + τ 2 ) x ( n + τ 3 ) R x ( τ 1 ) R x ( τ 2 τ 3 ) R x ( τ 2 ) R x ( τ 3 τ 1 ) R x ( τ 3 ) R x ( τ 1 τ 2 )
Analogous to the fourth-order cumulant, the cross fourth-order cumulant for four zero-mean stationary random signals x ( n ) , y ( n ) , z ( n ) , and s ( n ) is defined as
C 4 , x y z s ( τ 1 , τ 2 , τ 3 ) = E [ x ( n ) y ( n + τ 1 ) z ( n + τ 2 ) s ( n + τ 3 ) ] R x y ( τ 1 ) R x ( τ 2 τ 3 ) R x z ( τ 2 ) R x ( τ 3 τ 1 ) R x s ( τ 3 ) R x ( τ 1 τ 2 ) = E [ x ( n ) y ( n + τ 1 ) z ( n + τ 2 ) s ( n + τ 3 ) ] E [ x ( n ) y ( n + τ 1 ) ] E [ x ( n ) x ( n + τ 2 τ 3 ) ] E [ x ( n ) z ( n + τ 2 ) ] E [ x ( n ) x ( n + τ 3 τ 1 ) ] E [ x ( n ) s ( n + τ 3 ) ] E [ x ( n ) x ( n + τ 1 τ 2 ) ]
When τ 1 = τ 2 = τ 3 = τ , we obtain the diagonal slice of the cross fourth-order cumulant:
C 4 , x y z s ( τ ) = E [ x ( n ) y ( n + τ ) z ( n + τ ) s ( n + τ ) ] E [ x ( n ) y ( n + τ ) ] E [ x 2 ( n ) ] E [ x ( n ) z ( n + τ ) ] E [ x 2 ( n ) ] E [ x ( n ) s ( n + τ ) ] E [ x 2 ( n ) ]
Taking the Fourier transform of the above expression yields the cross-trispectrum diagonal slice of x ( n ) , y ( n ) , z ( n ) , and s ( n ) , also known as the 2 ( 1 / 2 ) -D spectrum:
S 4 , x y z s ( ω ) = F C 4 x y z s ( τ ) = F E x ( n ) y ( n + τ ) z ( n + τ ) s ( n + τ ) = + + x ( t ) y ( t + τ ) z ( t + τ ) s ( t + τ ) d t e j ω τ d τ = + x ( t ) e j ( ω ) t d t + y ( t + τ ) z ( t + τ ) s ( t + τ ) e j ω ( t + τ ) d ( t + τ ) = X ( ω ) Y ( ω ) Z ( ω ) S ( ω )
In the proposed formulation, S 4 , x y z s ( ω ) represents the cross-trispectrum diagonal slice spectrum, ω denotes frequency, while X ( ω ) , Y ( ω ) , Z ( ω ) , and S ( ω ) correspond to the spectra of four zero-mean stationary random variables. For vector hydrophone applications, the composite particle velocity V is obtained through synthesis of velocity channels. The cross-trispectrum diagonal slice spectrum is constructed using the following combination: S 4 , p v p p ( ω ) = = P ( ω ) V ( ω ) P ( ω ) P ( ω ) . This formulation allows for the joint processing of signals from different sensor channels, such as the pressure and particle velocity channels of a vector hydrophone, to exploit their mutual coherence.

2.2.2. The Vector Cross-Trispectrum Diagonal Slice of Gaussian Signals

We now demonstrate that the higher-order cumulants of a Gaussian signal are zero, starting from the definition of cumulants. For a zero-mean stationary random variable x ( t ) , its n-th order cumulant k n is the coefficient of the ( i t ) n / ( n ! ) term in the Taylor expansion of its cumulant-generating function K X ( t ) :
k n = 1 i n d n d t n K X ( t ) | t = 0
The characteristic function of a Gaussian random variable X ~ N ( μ , σ 2 ) is
Φ X ( t ) = E [ e i t X ] = e i μ t 1 2 σ 2 t 2
Its cumulant-generating function is
K X ( t ) = ln Φ X ( t ) = i μ t 1 2 σ 2 t 2
According to the definition of cumulants, we have
K X ( t ) = n = 1 k n ( i t ) n n !
From Equation (16), we get
K X ( t ) = i μ σ 2 t K X ( t ) = σ 2 K X n 0 ( n 3 )
For a Gaussian distribution:
K X ( t ) = i μ t 1 2 σ 2 t 2 + 0 t 3 + 0 t 4 +
Comparing Equations (18) and (19), it is evident that for a zero-mean ( μ = 0 ) Gaussian process, k 1 = μ , k 2 = σ 2 , and k n 0 for n 3 . It is important to note that while the higher-order cumulants of a Gaussian distribution are zero, its higher-order moments are not necessarily zero. Therefore, higher-order cumulants are commonly used as a criterion to determine if a signal is Gaussian.

2.3. Line Spectrum Detection

The final stage of the process involves identifying the target’s line spectra from the processed spectrum (either the V-TriD or ED spectrum). This requires preprocessing to isolate sharp spectral peaks and a principled method for declaring a detection.

2.3.1. Preprocessing for Line Spectrum Detection

Target-radiated noise typically consists of both line spectra and a continuous spectrum. The continuous spectrum often has peaks in the low-to-mid frequency range, which can adversely affect the extraction of line spectra. To improve the accuracy of line spectrum extraction and reduce the probabilities of false alarm and missed detection, it is necessary to perform a detrending operation on the signal to be analyzed. We employ an adaptive Gaussian smoothing algorithm to estimate the trend of the signal. This algorithm is adaptive to local abrupt changes in the signal, requires no prior information, and is iterative. The process can be expressed as
x k + 1 ( i ) = 1 N j = L L x k ( i + j ) w k ( i + j )
Here, x k ( i ) is the signal after the k -th iteration of smoothing, with x 0 ( i ) being the original signal. w k ( i ) is the weight coefficient for the k -th iteration, which determines the smoothing effect. L is the smoothing step size. If w k ( i ) = 1 for all k and x , the algorithm performs a simple uniform smoothing over a window of 2 L + 1 . N is used to regulate the amplitude of the smoothed signal and can be expressed as
N = J = L L w k ( i + j )
When w k ( i ) can be automatically adjusted based on the signal’s characteristics in different time segments, it is called adaptive smoothing. In line spectrum detection, to preserve sharp transitions, the derivative d k ( i ) at each signal point is typically used as a smoothing parameter. Consequently, the weighting coefficient becomes a function of this derivative, which can be expressed as follows:
w k ( i ) = f ( d k ( i ) )
Points with large derivative values are abrupt changes and should be preserved, so their weight coefficients should be small. Conversely, points with small derivative values are slow-changing points, and their weight coefficients should be large. Thus, the weight coefficient is a decreasing function of the derivative. In the adaptive Gaussian smoothing algorithm, a Gaussian function is chosen for f ( x ) , and the weight coefficient expression is
w k ( i ) = f ( d k ( i ) ) = e | d k ( i ) | 2 2 c 2
d k ( i ) = x k ( i ) x k ( i 1 )
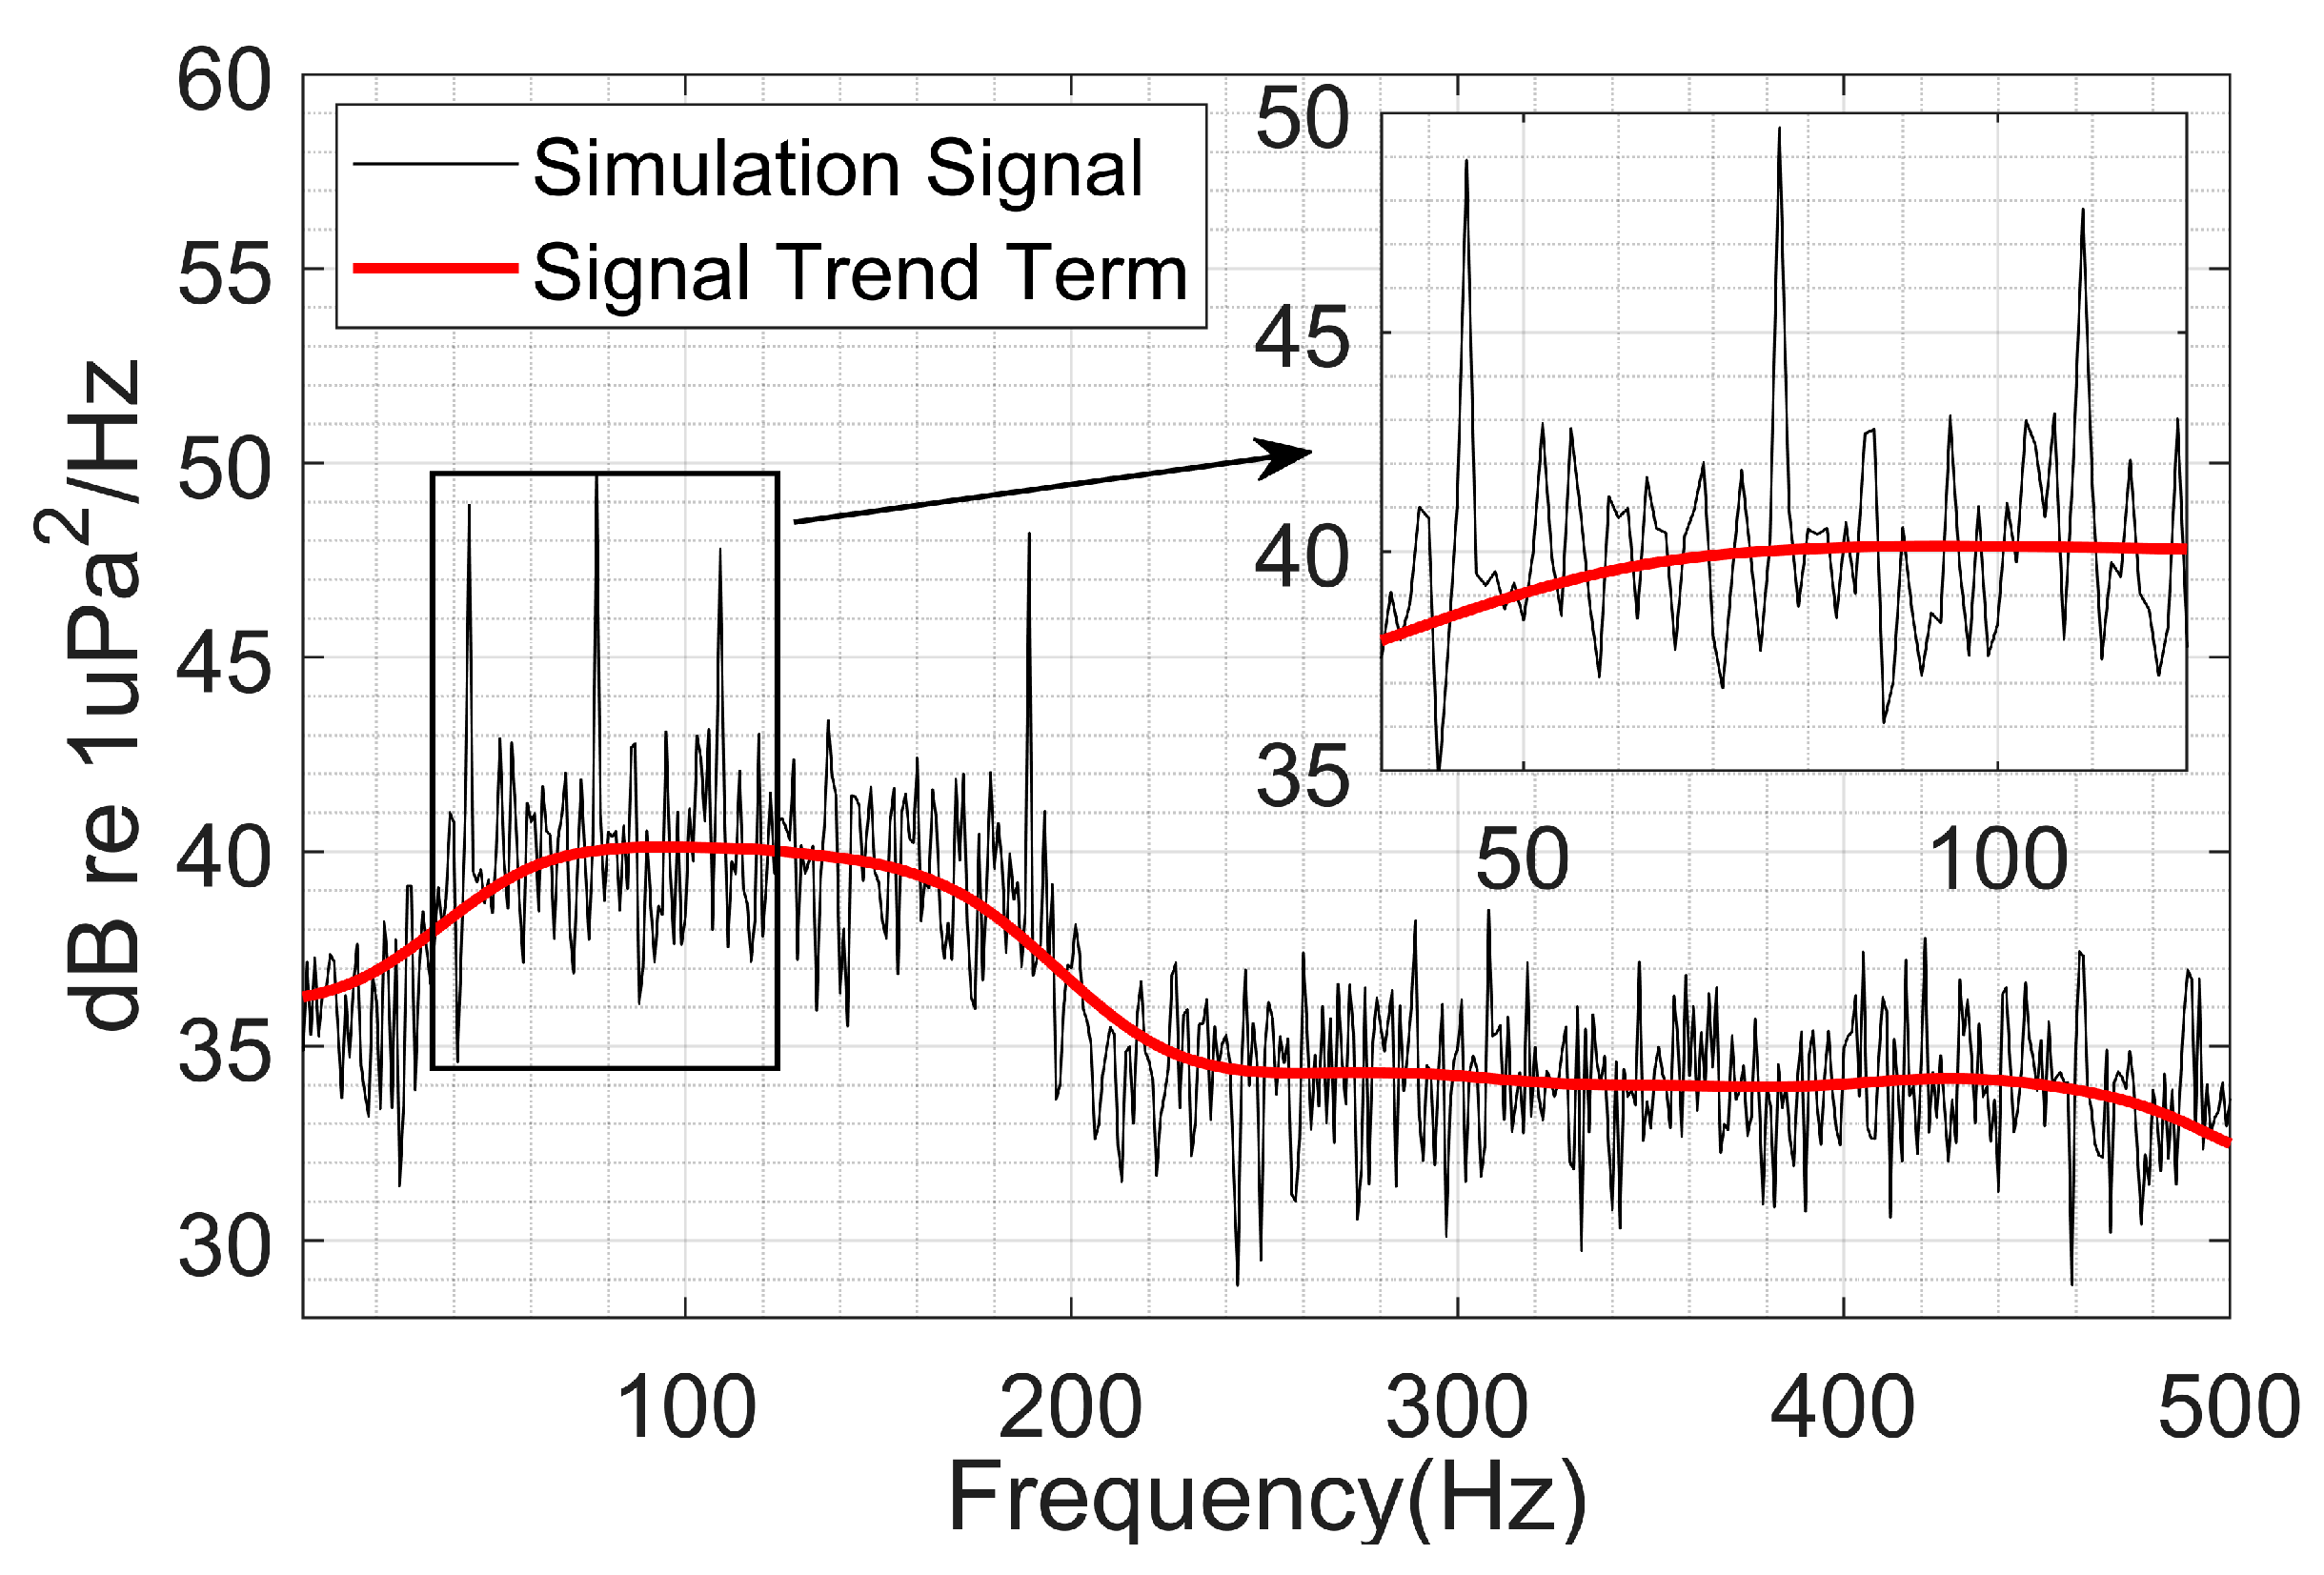
Figure 2 illustrates the results of applying adaptive Gaussian smoothing to a simulated signal, which consists of a line spectrum superimposed on a continuous spectrum. The relevant algorithm parameters were set as follows: c = 100 , k = 3 , and l = 20 . The smoothing results demonstrate that the adaptive Gaussian smoothing algorithm fits the overall trend of the signal well, while also effectively preserving the details of the sharp spectral lines. This prepares the data for subsequent detection tasks.

2.3.2. Principles of Line Spectrum Detection

Analysis of the characteristics of line spectra in target-radiated noise reveals three key features. First, a line spectrum must have left and right boundaries, and the width between these boundaries must not exceed a certain threshold. Second, the slope of the left boundary must be positive, and the slope of the right boundary must be negative, with the absolute value of the slopes exceeding a certain threshold. Third, the amplitude of the line spectrum must be above a certain threshold.
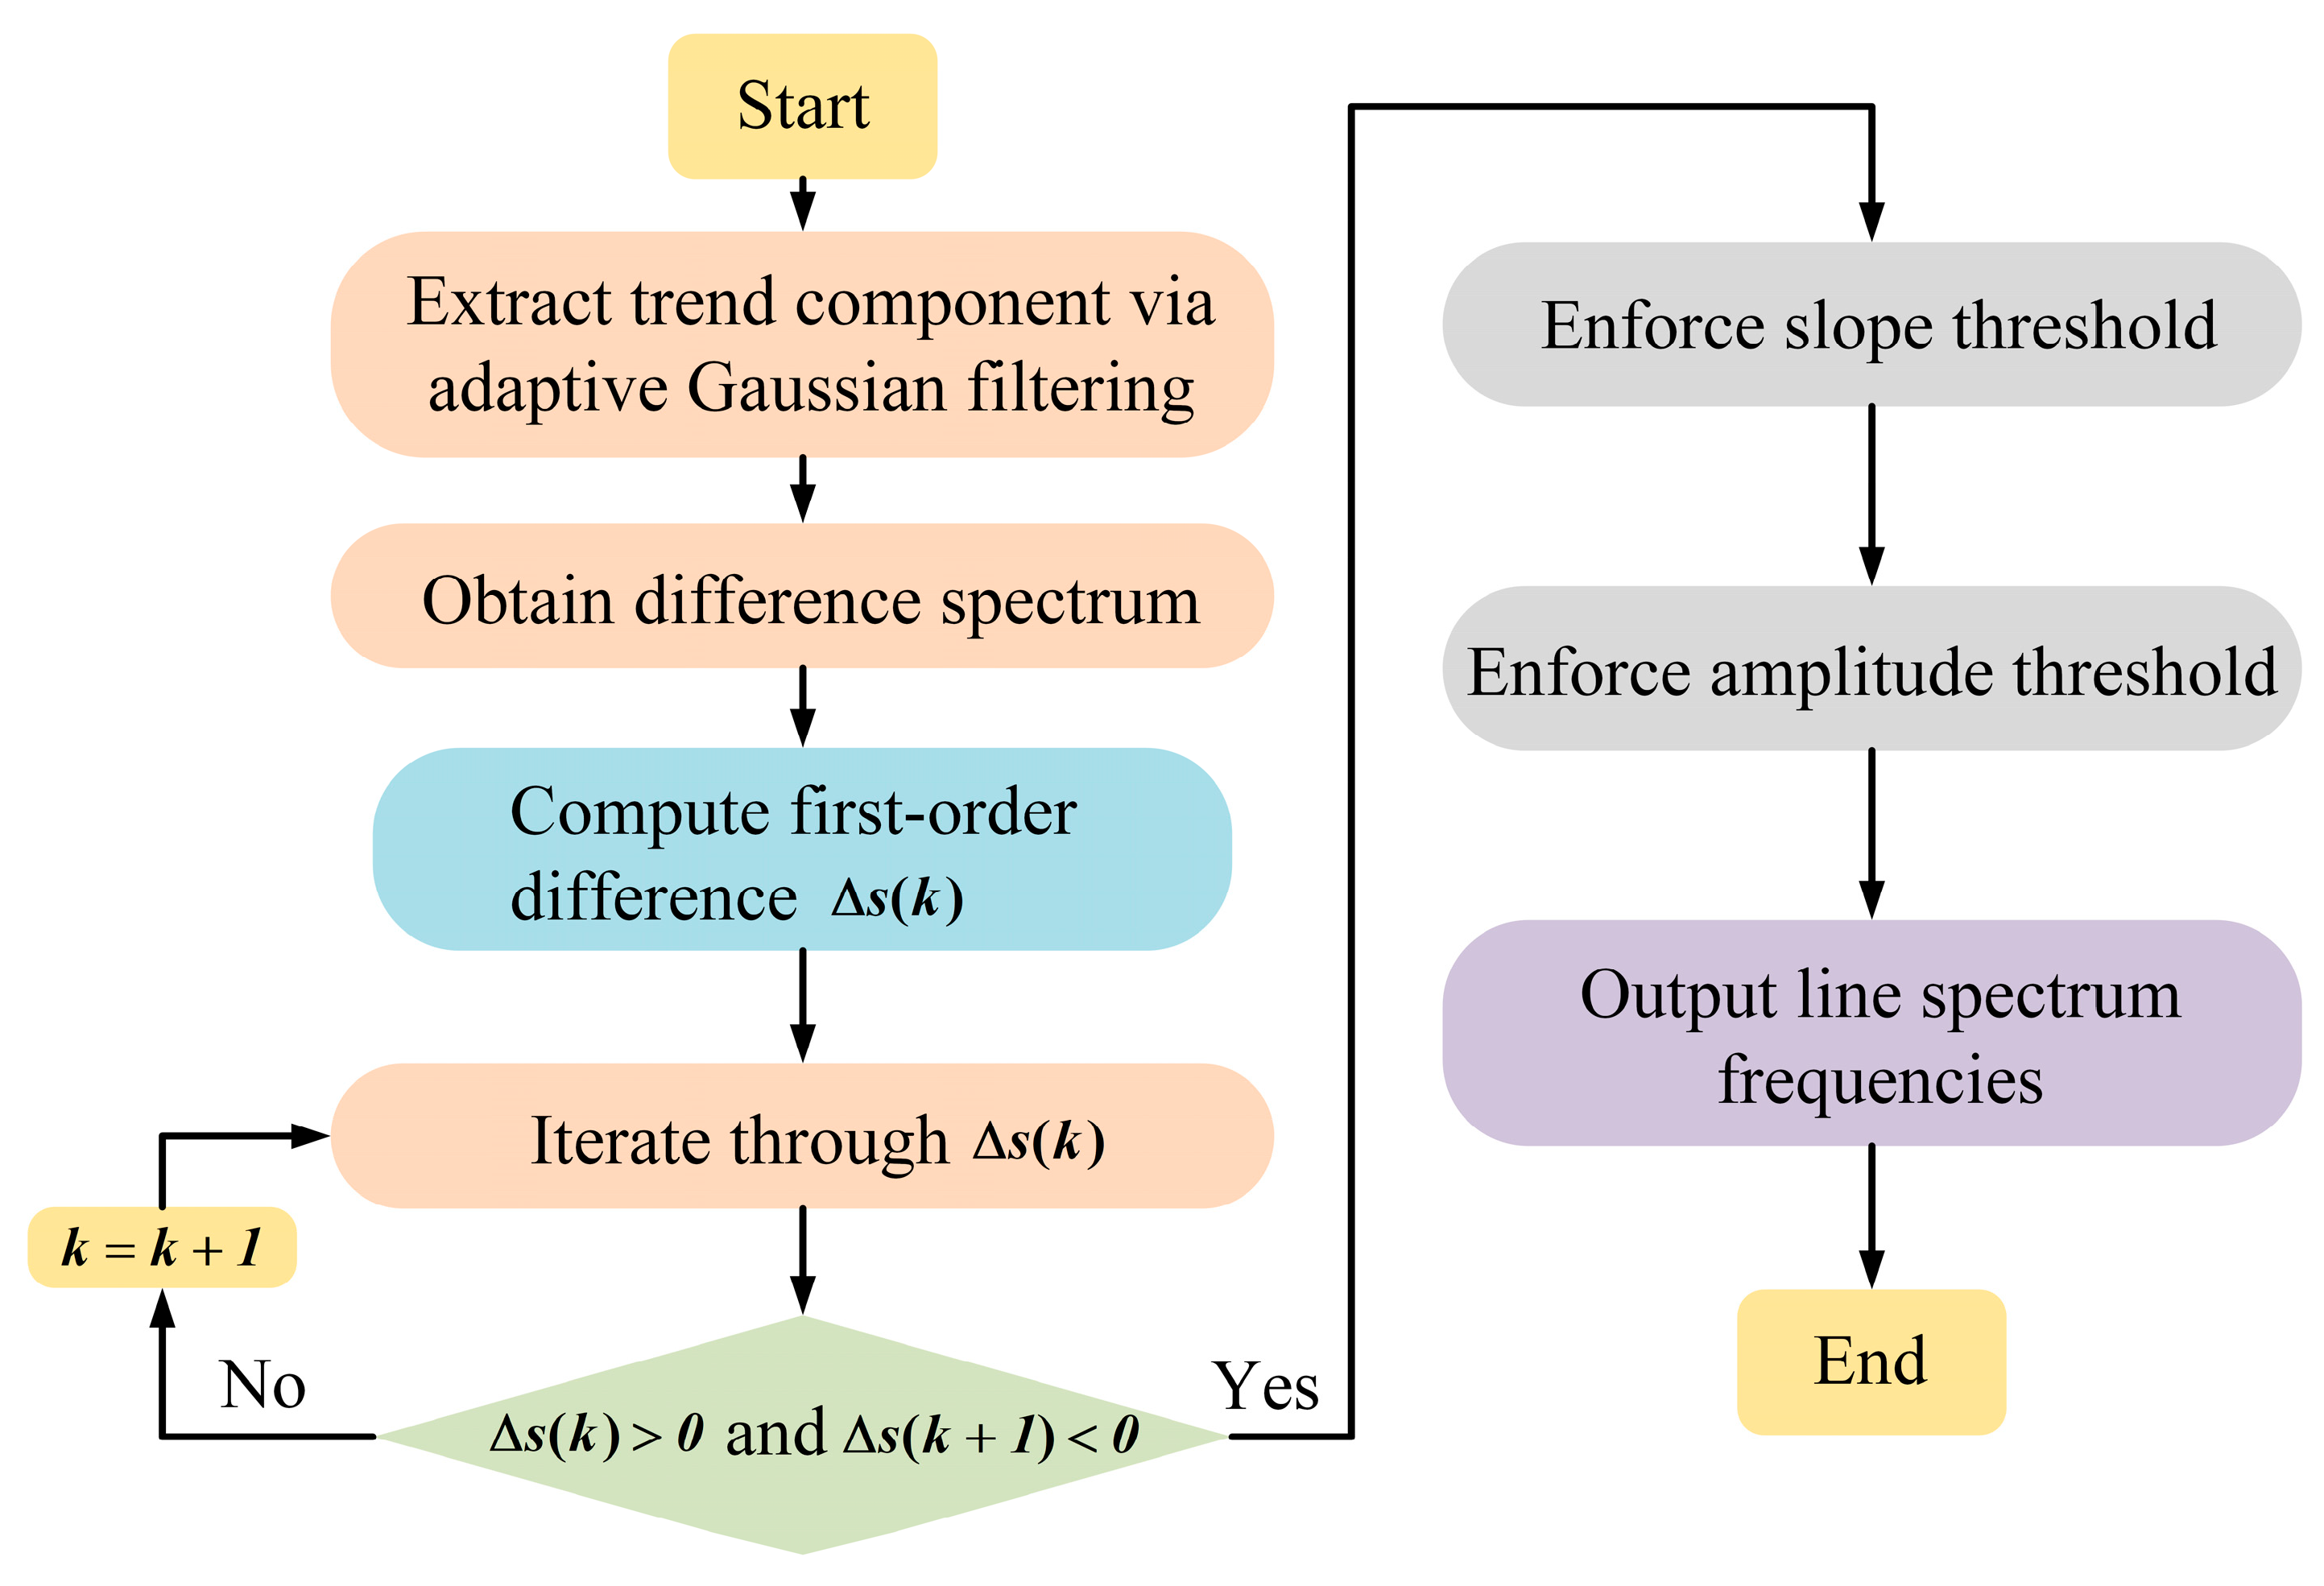
Based on these principles, an automatic line spectrum detection algorithm can be designed. The specific detection process is shown in Figure 3.
The line spectrum detection principles outlined above can be systematically implemented in practical data processing through the following operational steps: First, a first-order difference operation is performed on the detrended power spectrum or higher-order spectrum diagonal slice to obtain Δ s ( k ) . Points satisfying Δ s ( k ) > 0 and Δ s ( k + 1 ) < 0 are selected as candidate line spectrum points, and their positions n k are marked. Second, these candidate points are further screened using slope and amplitude thresholds to identify the final line spectrum frequencies. The difference spectrum of the detrended power spectrum is generally considered to be whitened noise, so its slope and amplitude values statistically follow a normal distribution, N ( μ , σ 2 ) . The slope and amplitude values of line spectra are significantly different from those of the continuous spectrum and can be considered outliers. Therefore, the 3 σ principle can be used to set the slope threshold S T and amplitude threshold A T . Considering that the data fluctuation varies across different frequency bands of underwater target signals, an adaptive local thresholding approach is used to set S T and A T . This involves calculating the mean μ k and standard deviation σ k of the 2M-point neighborhood of a candidate point n k , and setting the local threshold as μ k + β σ k . β is a constant adjusted according to the actual signal fluctuations, typically set to β = 3, which corresponds to a 99.73% confidence level for outliers in a normal distribution. While varying SNR conditions of line spectra relative to background noise may affect threshold selection, the current threshold configuration ensures minimal false identification of non-target signals as line components.
n k = 0             s ( n k ) μ k + β σ k 1             s ( n k ) > μ k + β σ k
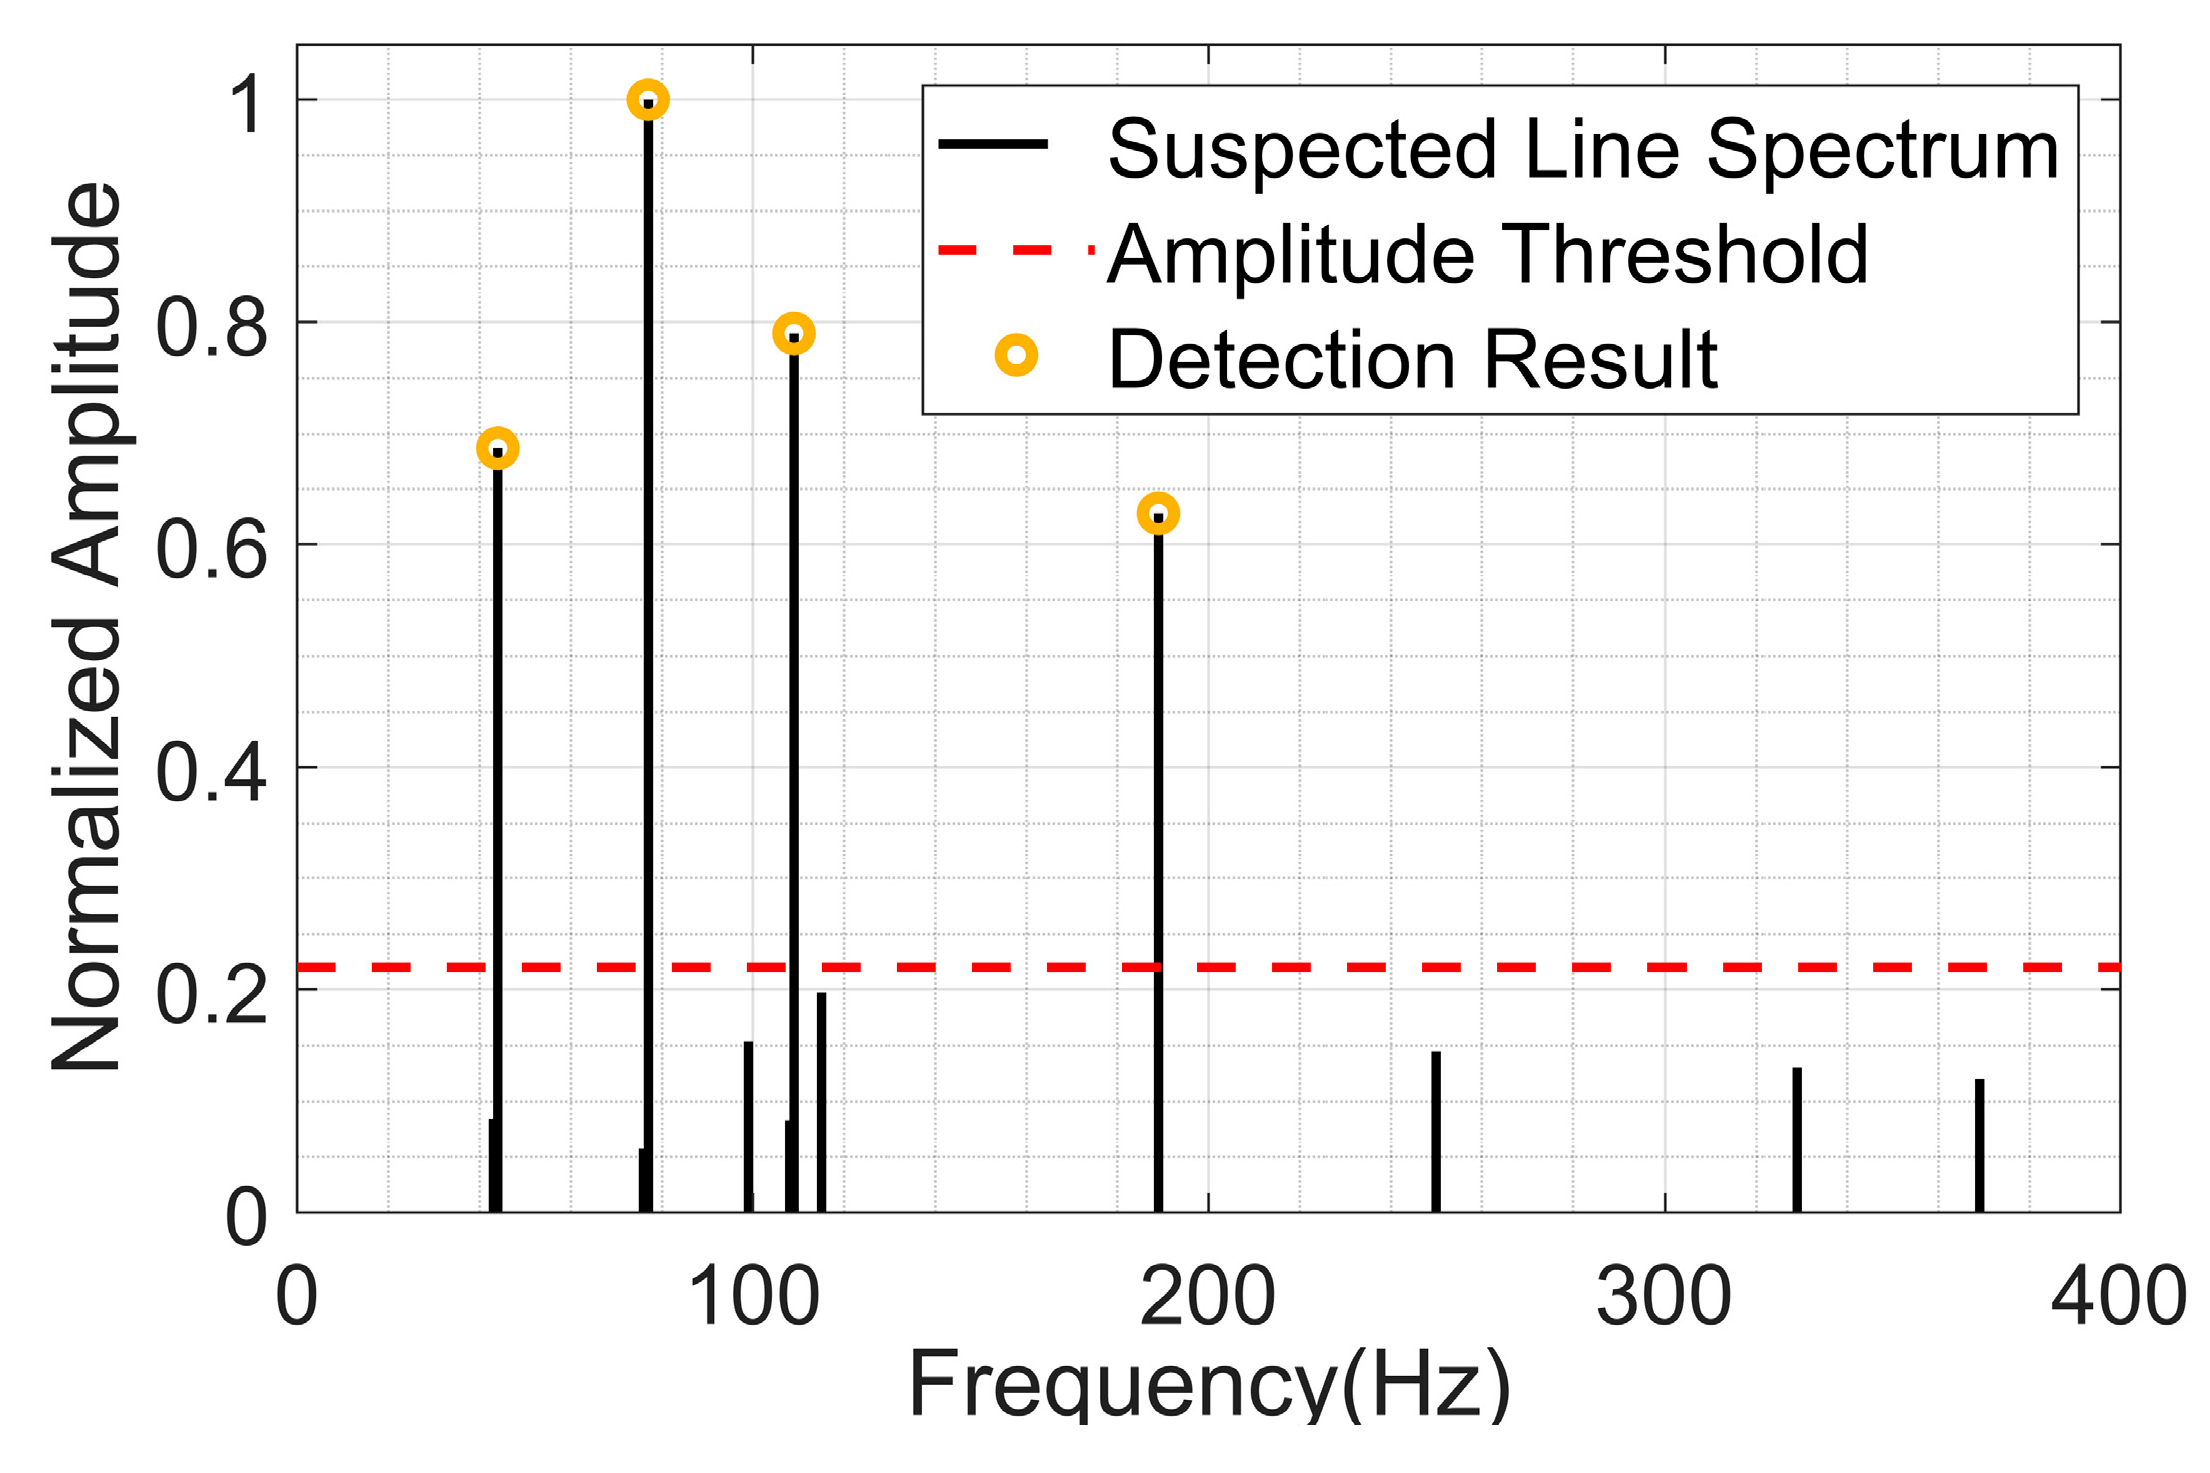
Equation (25) is the decision expression for determining whether a frequency point is a line spectrum signal. In this expression, n k = 1 represents a line spectrum signal, while n k = 0 represents a non-line spectrum signal. A schematic of the final detection results is shown in Figure 4.

3. Proposed Detection Method

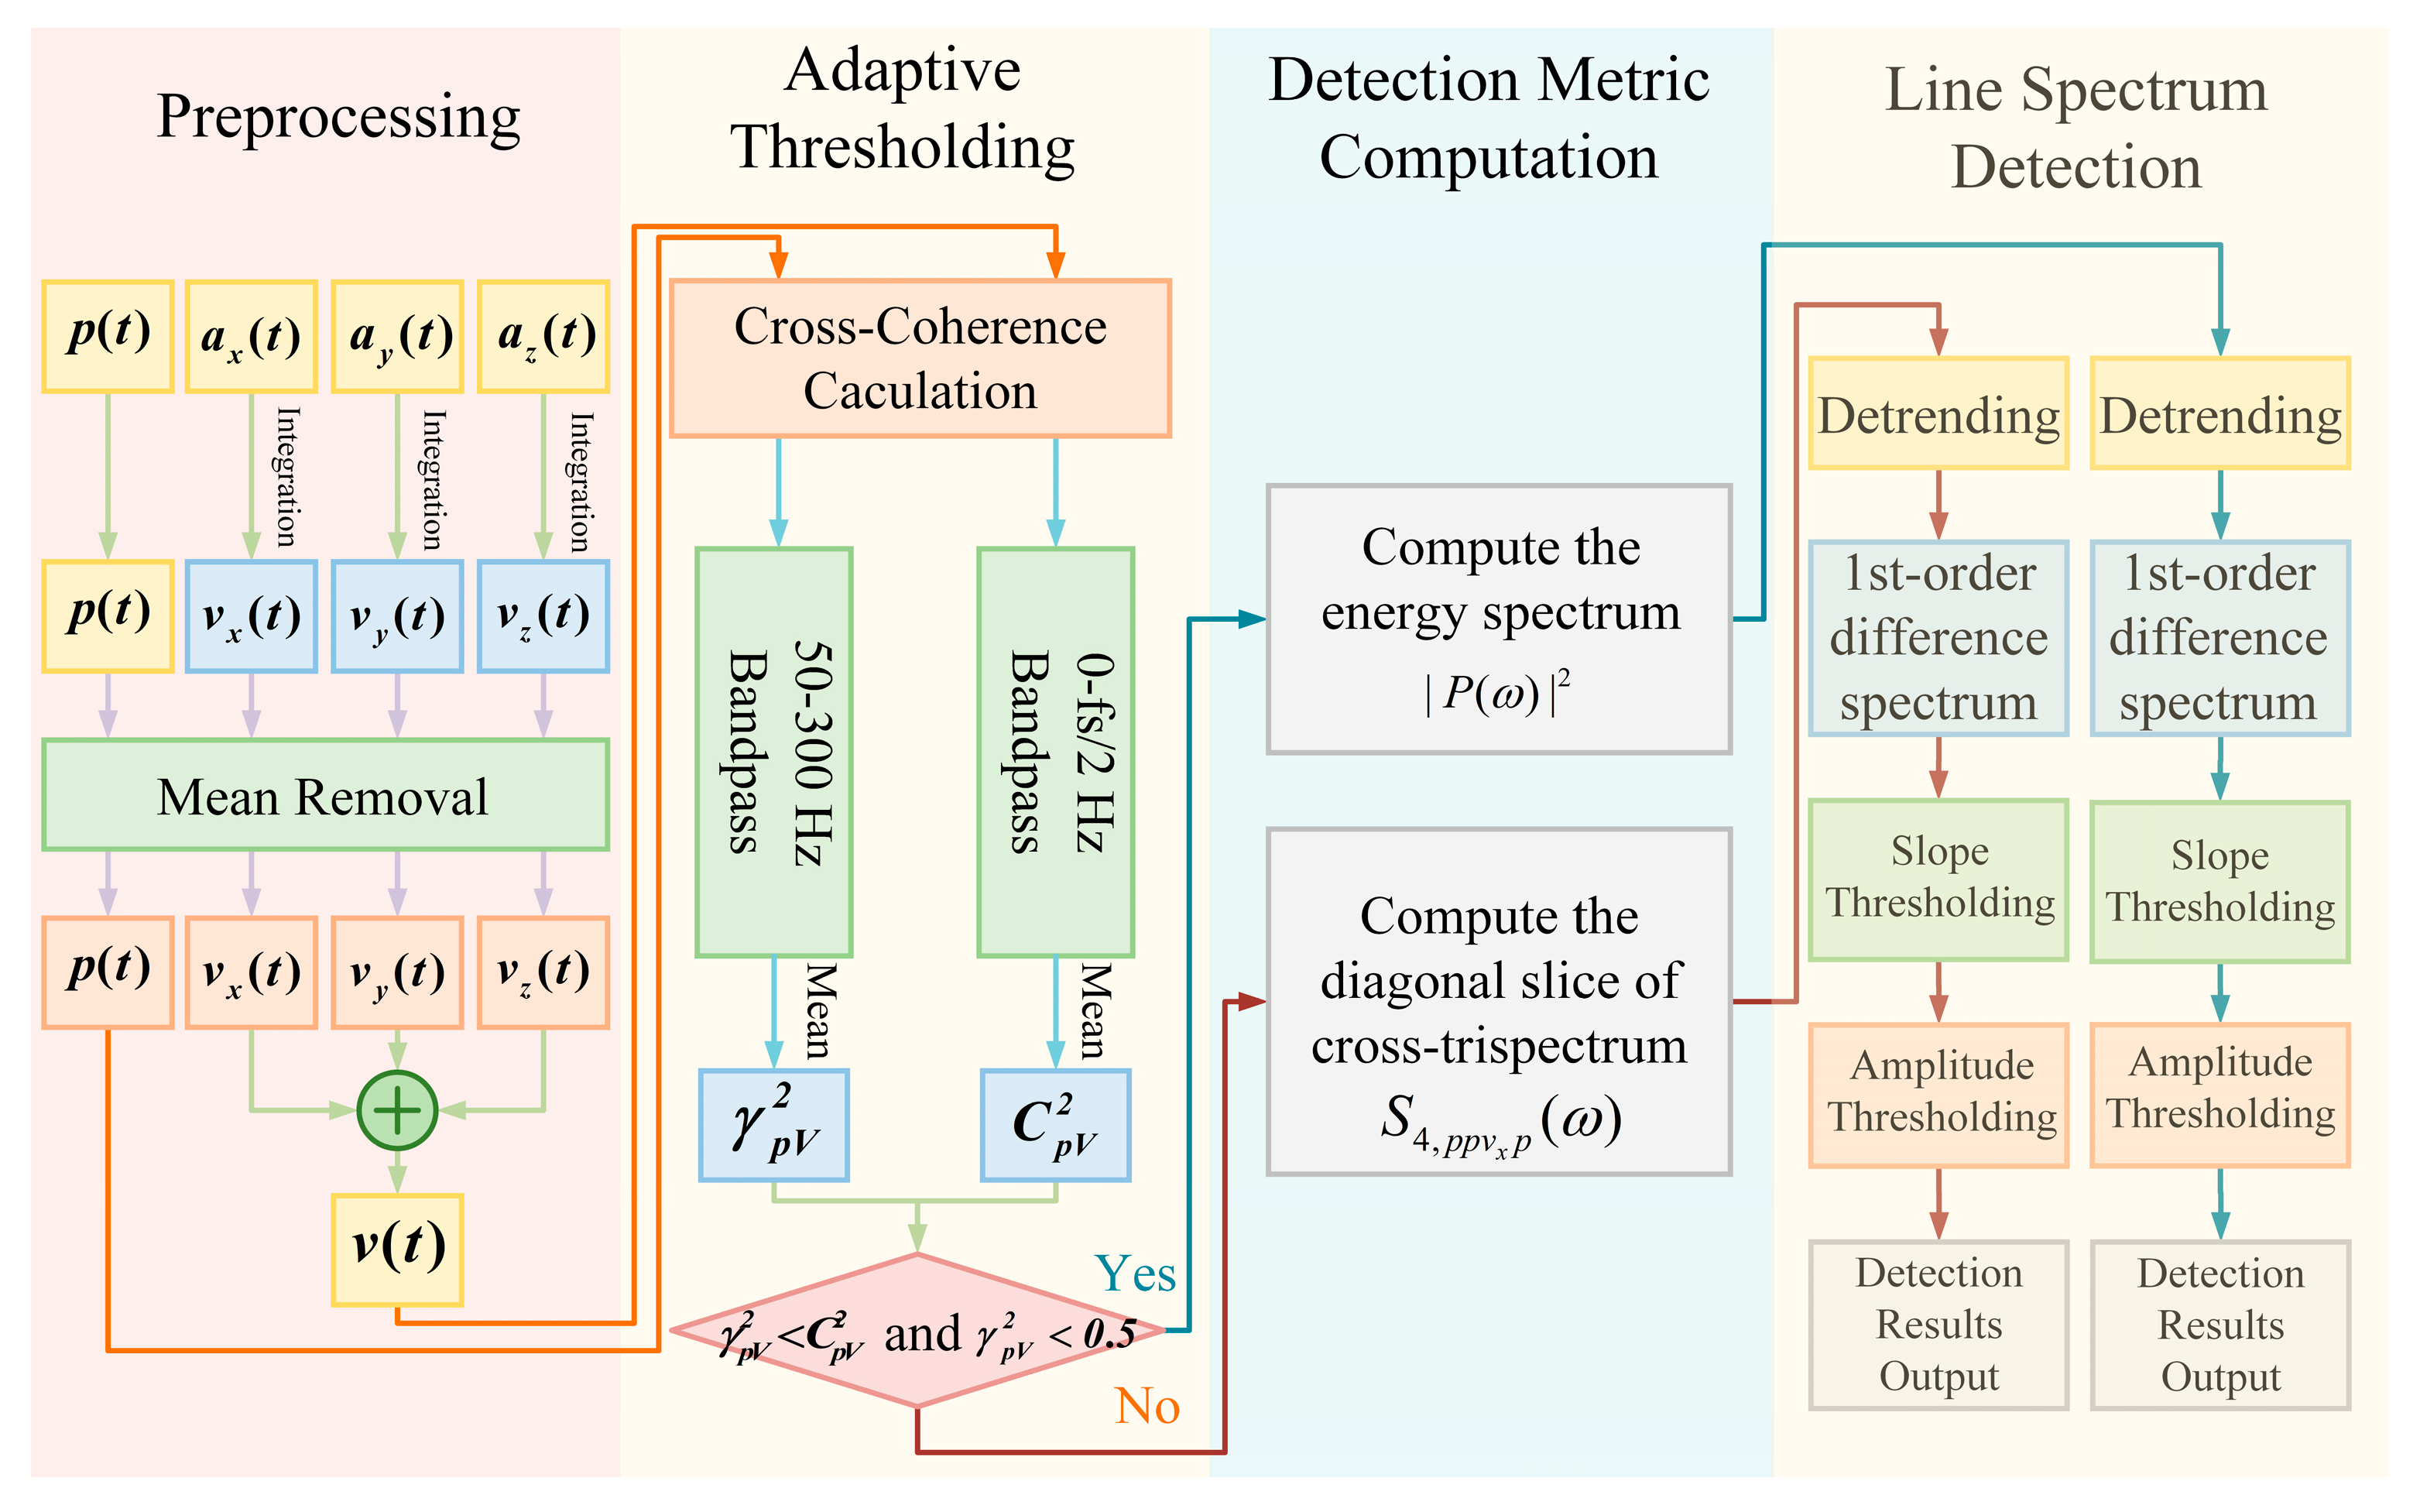
To more accurately detect the presence of underwater targets under low SNR conditions, we propose a dual-channel adaptive detection algorithm based on the vector cross-trispectrum diagonal slice. The overall workflow begins after the vector hydrophone receives the signal. First, the acceleration signals are integrated to obtain velocity components, which are then synthesized. Second, the cross-coherence between the sound pressure and the synthesized velocity is calculated. A dynamic, adaptive threshold based on this coherence determines which of two processing channels to use. Third, the detector routes the pressure and velocity signals to the selected channel to compute either their cross-trispectrum diagonal slice spectrum or their energy spectrum. Finally, the resulting spectrum is fed into a line spectrum detector to identify the target. The flowchart for the aforementioned target detection algorithm is presented in Figure 5. The more precise steps are listed below:
Part 1: Preprocessing
Stage 1: Integrate the accelerometer signals to convert them into particle velocity signals.
Stage 2: Perform mean removal on the vector channels and the pressure channel separately.
Stage 3: Combine the three particle velocity channels ( v x , v y , v z ) into a single composite velocity channel.
Part 2: Adaptive Threshold Calculation
The core of the algorithm’s adaptability lies in an intelligent decision-making module that assesses the coherence signature of the acoustic environment to select the optimal processing pathway.
Stage 1: Calculate the average value of the cross-coherence function between the sound pressure and the composite particle velocity within the [50, 300] Hz band, and denote this value as γ p V 2 . Concurrently, calculate the average value of the cross-coherence function across the entire effective frequency band, [0, fs/2] Hz, and denote it as C p V 2 . The selection of the [50, 300] Hz frequency band is based on three key factors: (i) the spectral characteristics of target signals, (ii) the frequency-domain distribution of target interference energy, and (iii) hardware-specific constraints. Specifically, the rationale for selecting the [50, 300] Hz band is threefold. First, the radiated noise from weak targets is mainly concentrated in the low-frequency range. Second, the noise energy from distant ships and other underwater targets is primarily below 300 Hz. Finally, it is necessary to avoid the vector hydrophone’s low-frequency resonant peak, which occurs at approximately 10–20 Hz. Therefore, when a weak target signal is present, the algorithm focuses on the fluctuations of the coherence function within this specific [50, 300] Hz band.
Stage 2: Apply a statistical decision rule based on the calculated coherence values. In environmental noise analysis, a coherence value greater than 0.6 is typically considered indicative of a strong correlation (same source), while a value below 0.4 suggests a weak correlation (incoherent signals). Based on this, the following decision strategy is adopted: if γ p V 2 C p V 2 and γ p V 2 < 0.5 , the received signal is considered to have few coherent components. This condition suggests the absence of a strong target or that the target signal is too weak to establish coherence. In this case, the robust energy detection (ED) method is more suitable. In all other cases, it is assumed that the frequency band of interest contains a target with significant coherent components. For this scenario, the V-TriD method is employed, as it can better suppress the incoherent Gaussian noise prevalent in the marine environment.
Part 3: Calculation of the Detection Metric
Based on the result of the adaptive threshold decision, the required signals are input into the corresponding channel to compute either the cross-trispectrum diagonal slice spectrum (V-TriD) or the energy spectrum (ED).
Part 4: Line Spectrum Detection
Stage 1: The calculated V-TriD spectrum or energy spectrum is fed into the line spectrum detector described in Section 2.3.
Stage 2: The final detection results are output.
To validate the algorithm in simulations, the received signals of hydrophones were constructed through convolution of the pre-computed system function (obtained from acoustic field simulation software) with source signals, thereby emulating realistic underwater acoustic conditions.
The KrakenC normal mode model was used to compute the underwater sound field, as it is well suited for medium-to-low frequency and medium-to-long-range acoustic propagation and has a clear physical interpretation. The sound speed profile and seabed parameters were input to solve for the frequency-domain sound pressure response, H p ( r , z ) . Then, based on Euler’s equation, the system functions H r ( r , z ) and H z ( r , z ) for the horizontal ( v r ) and vertical ( v z ) components of the particle velocity were further derived for use in vector acoustic field analysis. Under the normal mode model, the frequency-domain sound pressure response at a hydrophone located at a horizontal distance r and depth z from the source, as calculated by the KrakenC model, is expressed as follows:
H p ( r , z ) = i 8 π r ρ ( z s ) e i π 4 m = 1 ψ m ( z s ) ψ m ( z ) e i k r m r k r m
The frequency-domain relationship between sound pressure and particle velocity is given by the frequency-domain representation of Euler’s equation:
v ( r , z ) = 1 i ρ ω p ( r , z )
In the cylindrical coordinate system, the horizontal and vertical particle velocities are written respectively as
v r ( r , z ) = 1 i ρ ω p r
v r ( r , z ) = 1 i ρ ω p z
Combining Equations (26), (28), and (29), the system functions for the horizontal and vertical components of particle velocity can be expressed as
H r ( r , z ) = i ω ρ ( z ) 8 π r ρ ( z s ) e i π 4 m = 1 ψ m ( z s ) ψ m ( z ) k r m e i k r m r
H z ( r , z ) = i ω ρ ( z ) 8 π r ρ ( z s ) e i π 4 m = 1 ψ m ( z s ) ψ m ( z ) z e i k r m r k r m
In practice, H r ( r , z ) and H z ( r , z ) can be obtained by numerically differentiating H p ( r , z ) . For a given marine environment and a fixed receiver location, the system functions are solely functions of frequency, denoted as H p ( ω ) , H r ( ω ) , and H z ( ω ) . Assuming the horizontal azimuth of the particle velocity is θ , the received signal in each channel of the vector hydrophone can be expressed as
P ( ω ) = S ( ω ) H p ( ω ) V x ( ω ) = cos θ [ S ( ω ) H r ( ω ) ] V y ( ω ) = cos θ [ S ( ω ) H r ( ω ) ] V z ( ω ) = S ( ω ) H z ( ω )
At this stage, the complete algorithm and its underlying theoretical framework have been fully presented.

4. Simulation Experiments

To validate the effectiveness of the proposed algorithm and analyze its detection capabilities, simulation experiments were conducted for a deep-sea environment with a depth of 4300 m.
The simulation process and results are presented and analyzed in detail below.
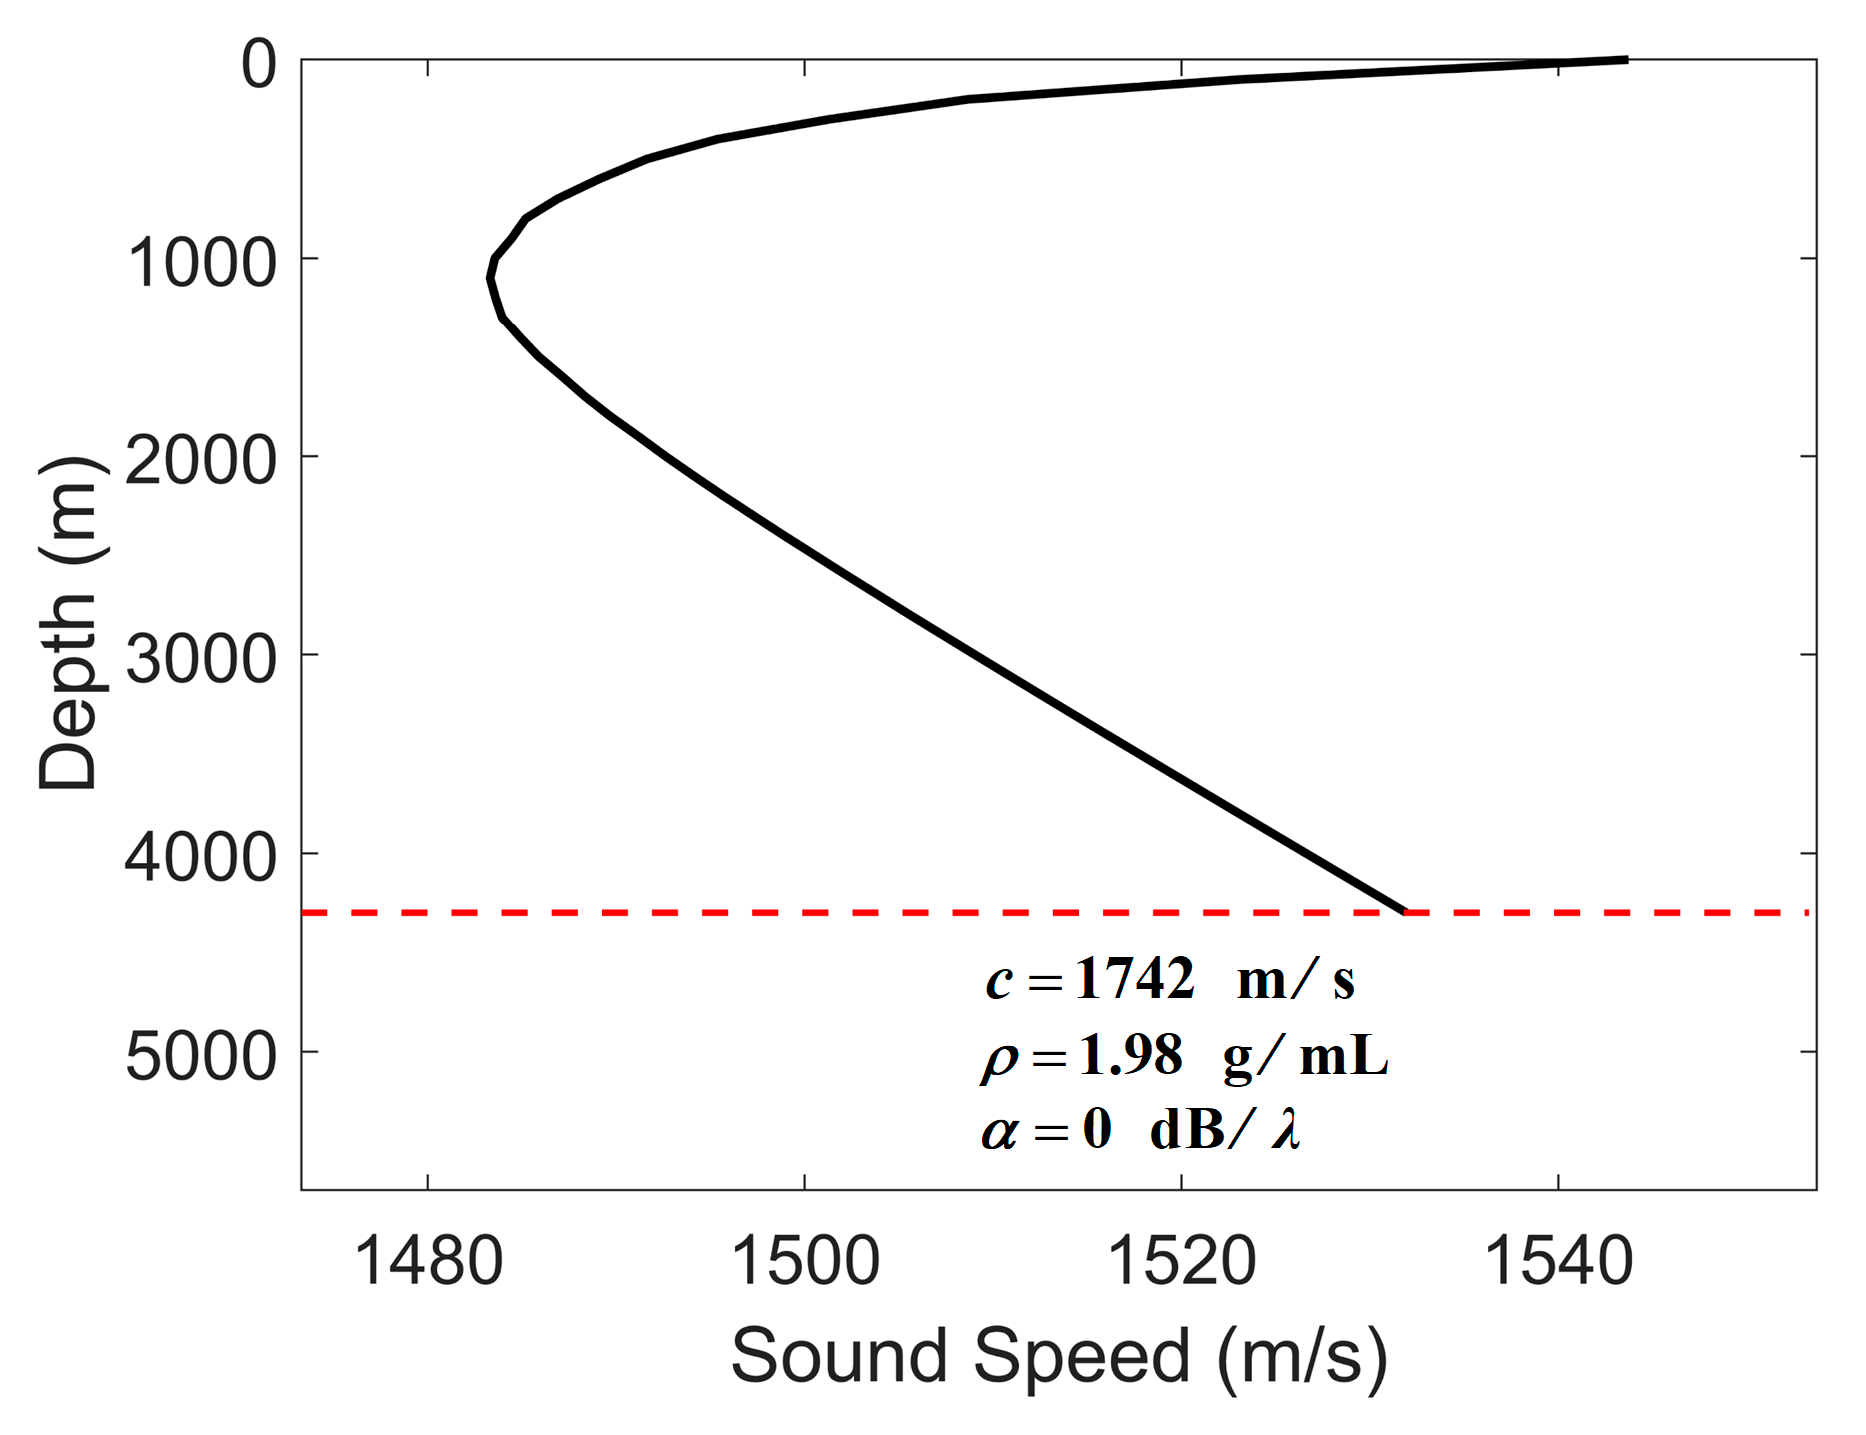
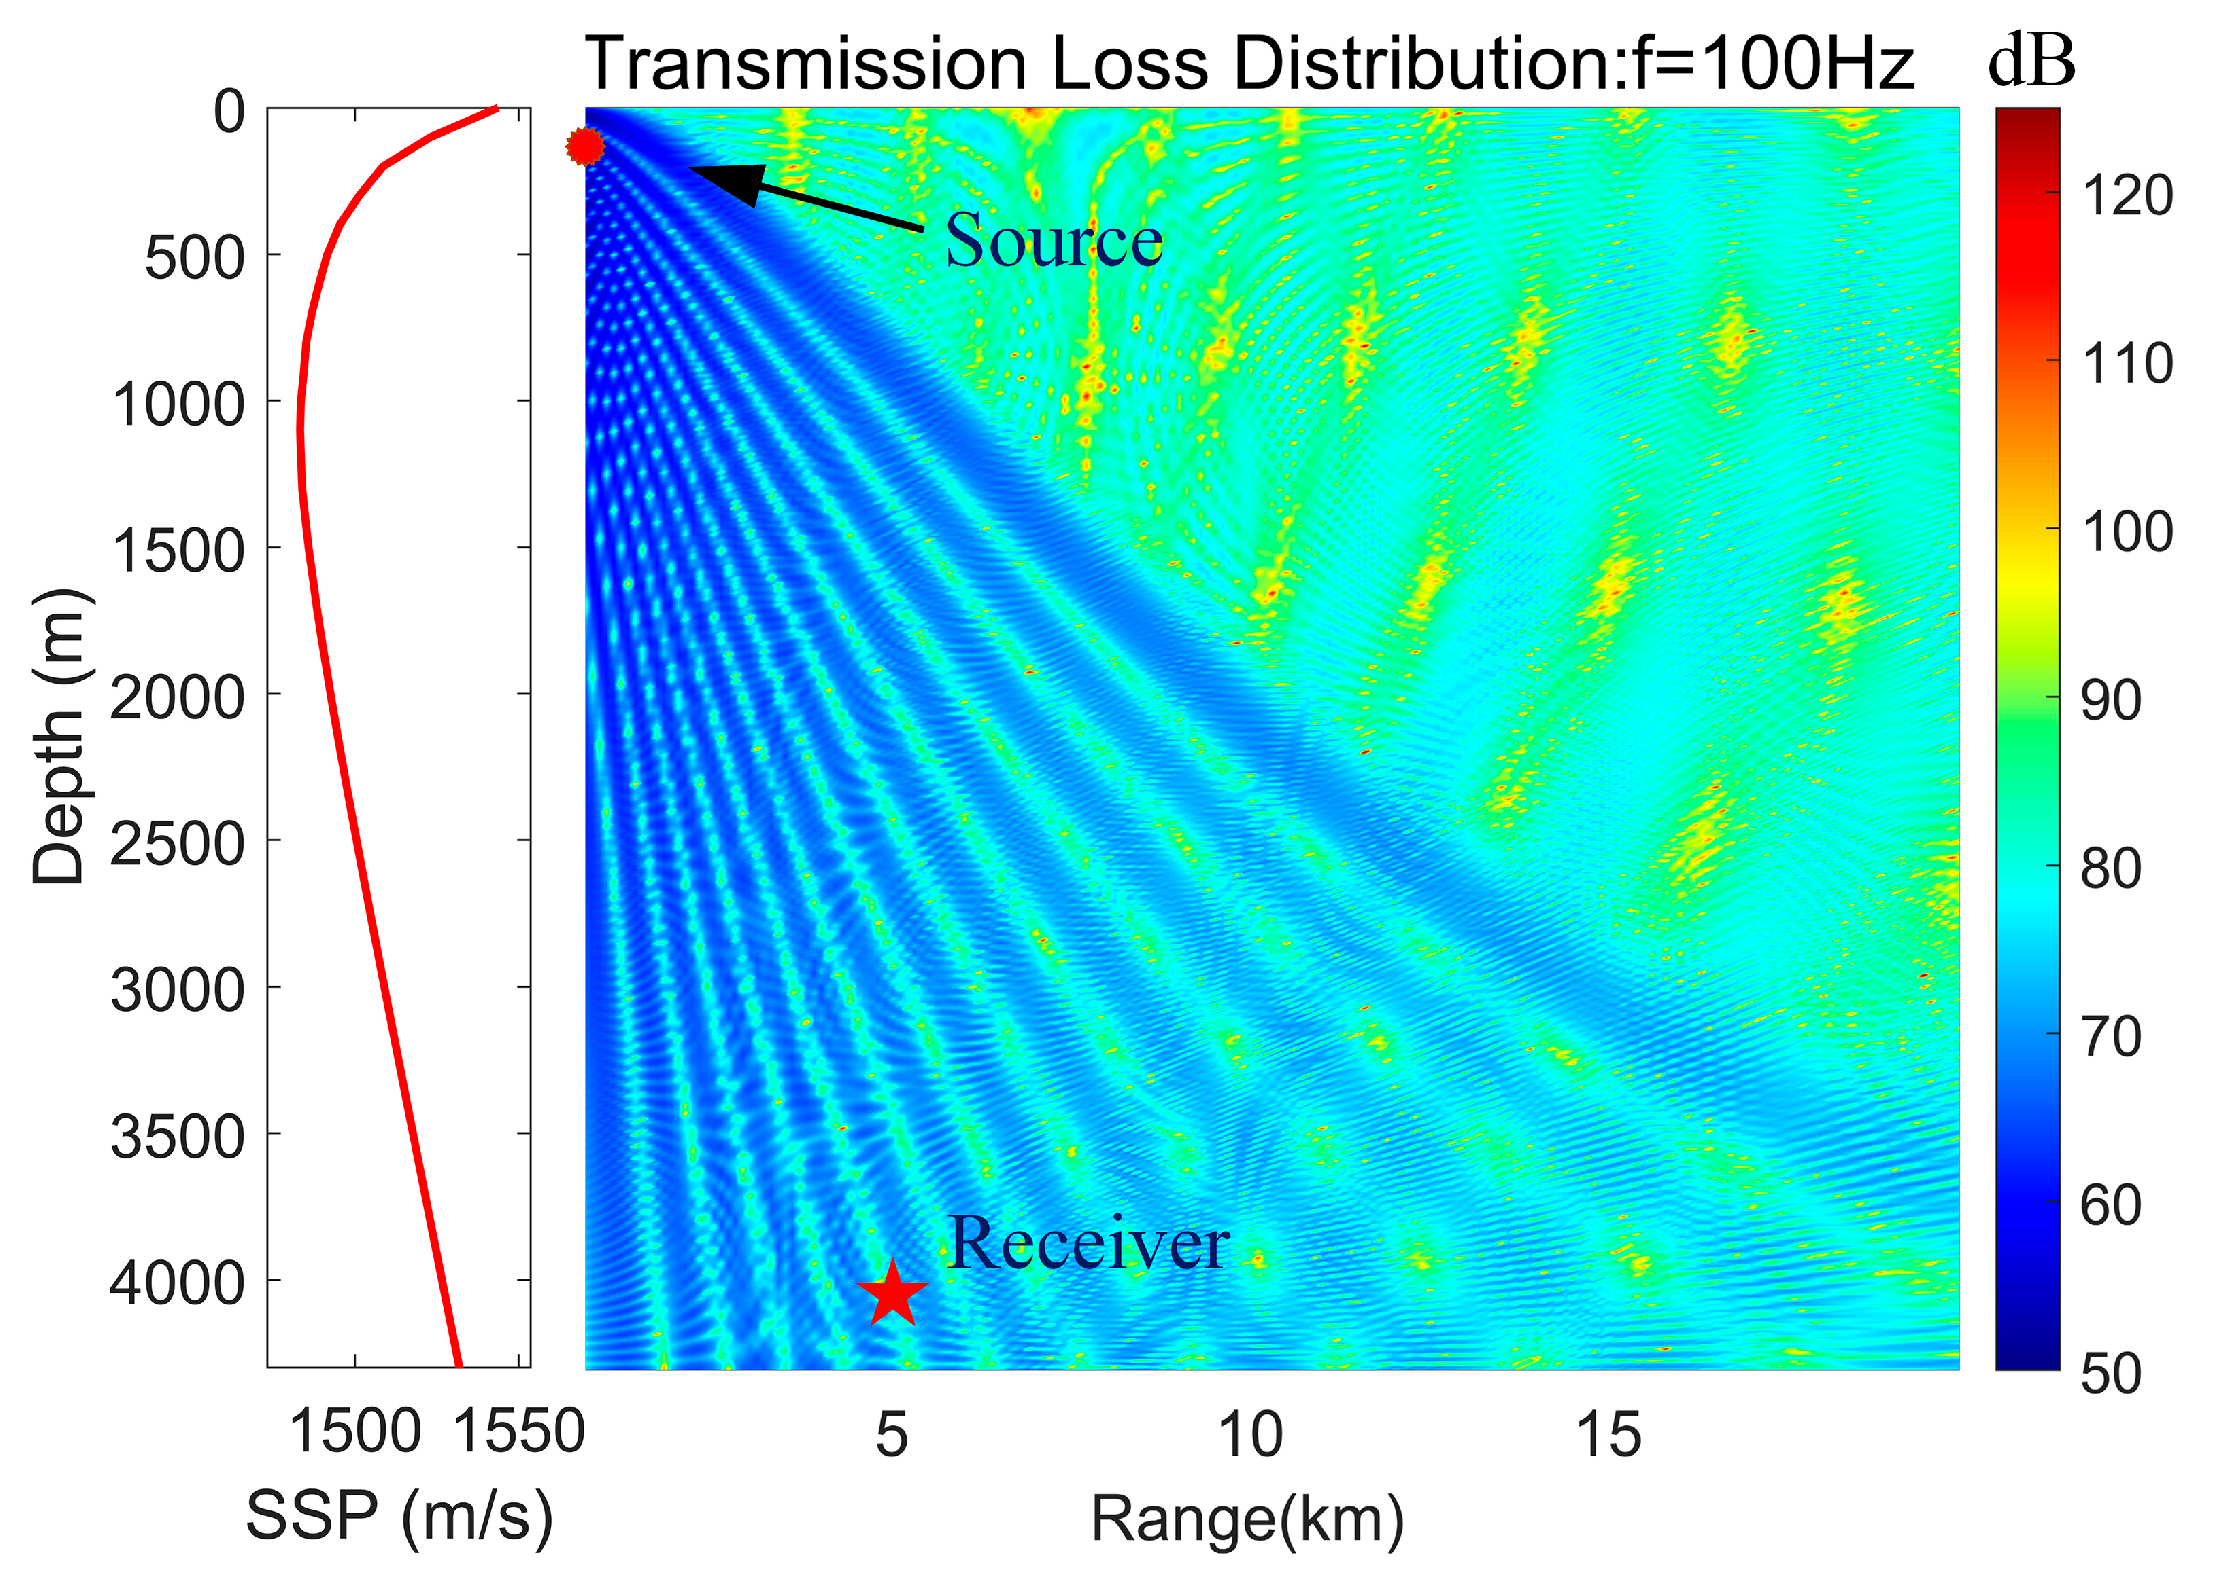
Figure 6 shows the environmental parameters set for the simulation under deep-sea conditions. The sound speed profile used was taken from actual measurements conducted by our research group during an experiment in the South China Sea in 2022. As can be seen in the figure, this represents an incomplete sound channel at the specified depth. In this marine environment, the transmission loss for a 100 Hz single-frequency signal, as well as the positions of the source and receiver, are shown in Figure 7. The receiver was located at a depth of 4000 m and a horizontal range of 5000 m from the source, placing it within the direct arrival zone. This ensured that the receiving hydrophone could capture a high-quality signal. The specific parameters for the simulation process are detailed in Table 1.
The simulated signal is composed of a line spectrum superimposed on a broadband continuous spectrum, which is designed to mimic the radiated noise from actual ships or submarine targets. The line spectrum consists of frequencies at 95 Hz and 132 Hz, while the broadband continuous spectrum is Gaussian white noise with a bandwidth of 1–512 Hz.
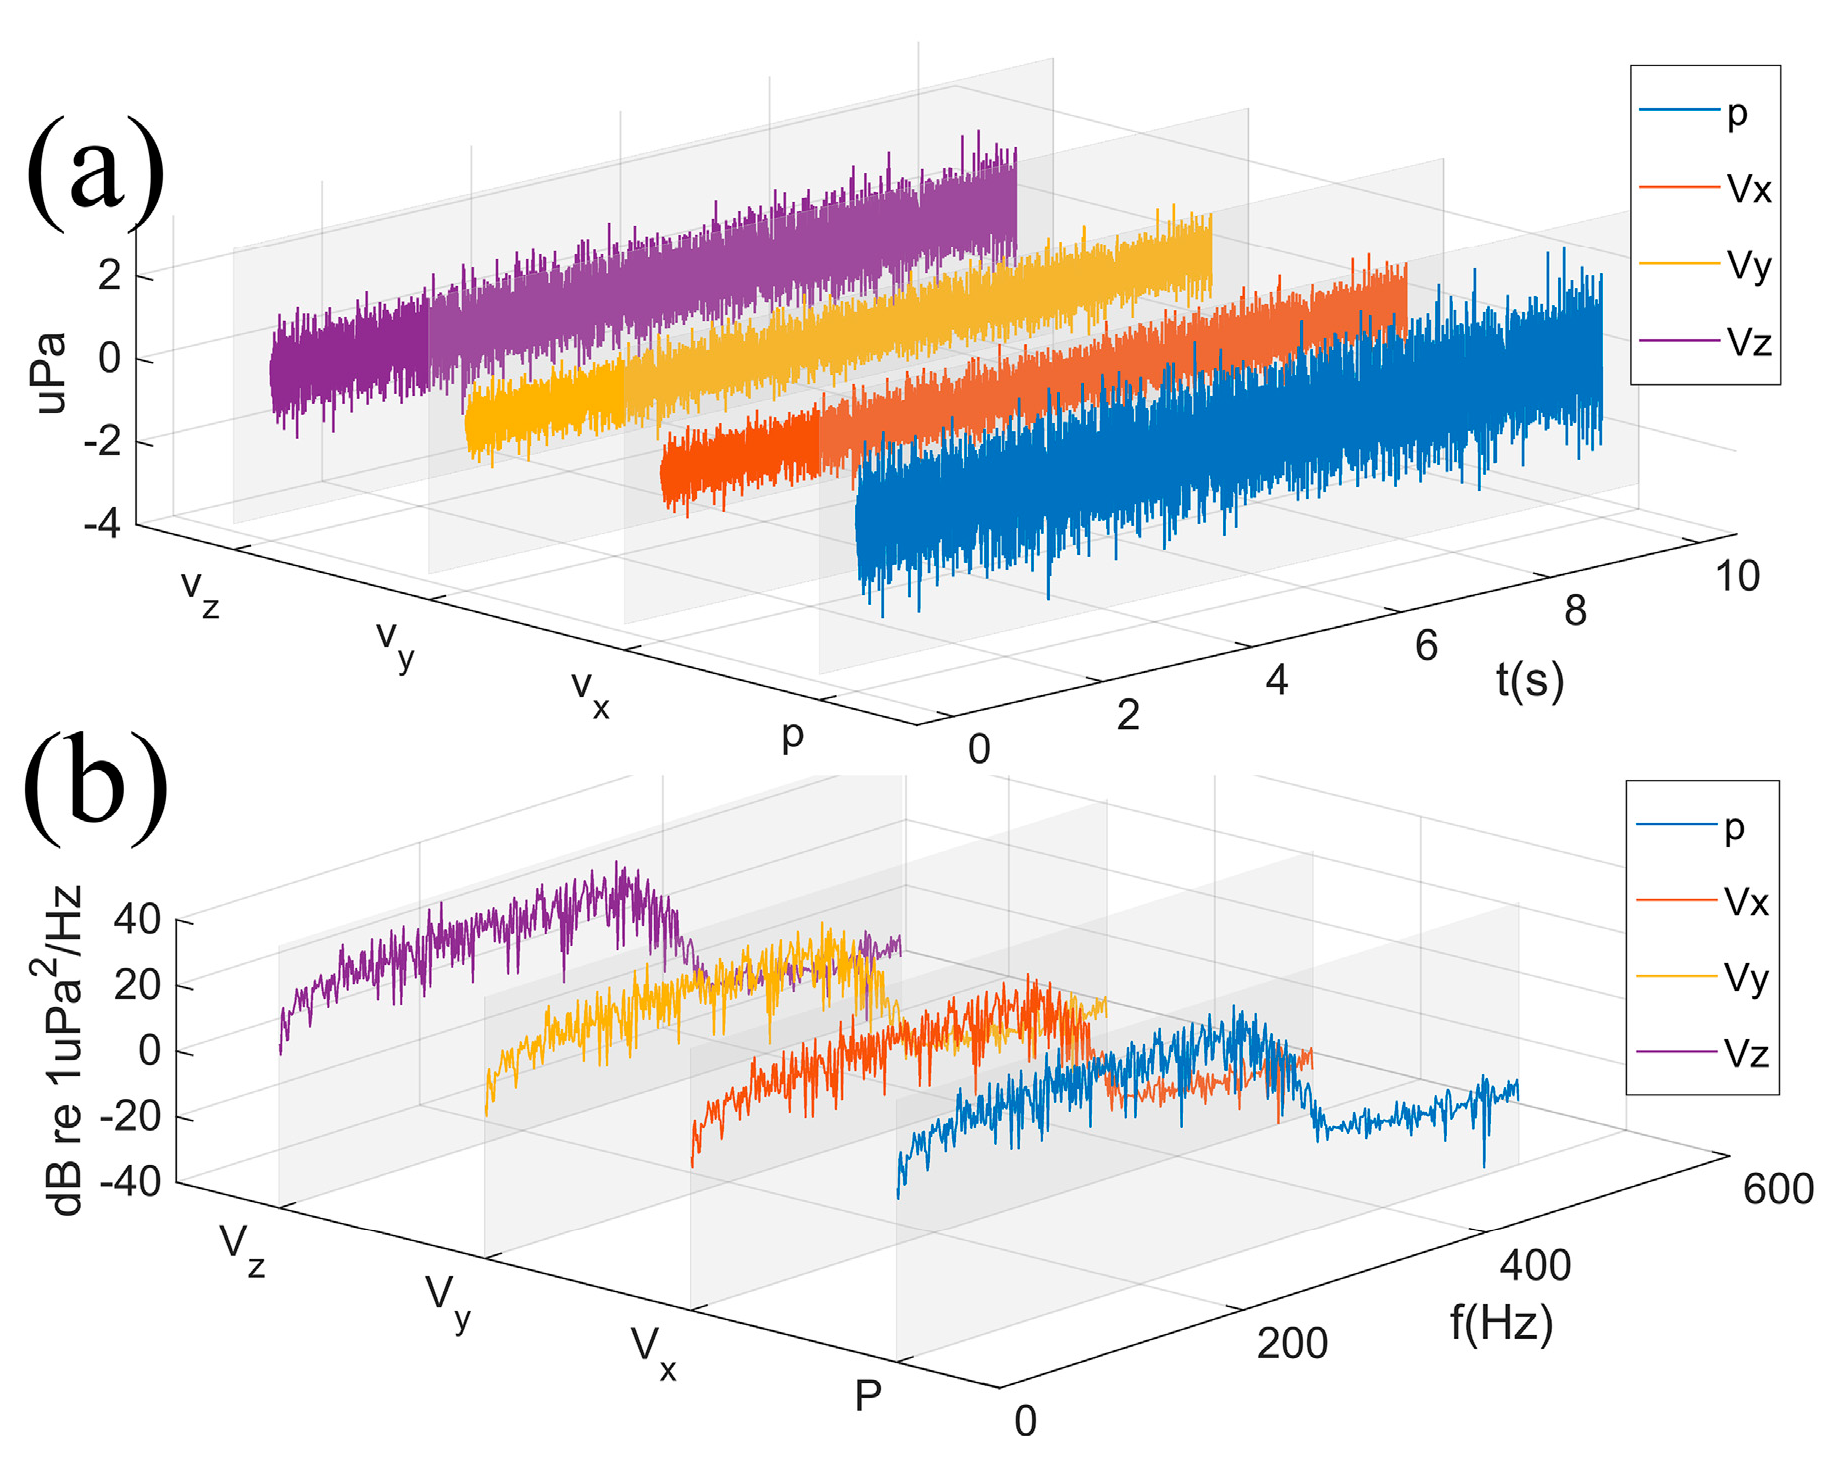
Figure 8 shows the time-domain waveform and frequency spectrum for each channel of the noiseless signal. As can be seen in Figure 8b, the signal’s energy is primarily concentrated in the low-to-mid frequency range and contains characteristic spectral lines, closely resembling the radiated noise of real-world targets.
First, a qualitative analysis was performed at a single SNR. Figure 9a–l present a comparative analysis of the spectrograms generated by the conventional low-frequency analysis and recording (LOFAR) method, the scalar trispectrum diagonal slice (S-TriD), and the proposed vector cross-trispectrum diagonal slice (V-TriD) across four different SNRs. A qualitative comparison of the spectrograms in Figure 9 reveals the progressive advantage of the proposed method. For instance, at a low SNR of −15 dB (Figure 9a,e,i), both S-TriD and V-TriD demonstrate effective suppression of Gaussian noise compared to the LOFAR spectrum, where the target line spectra are barely visible. A closer look at Figure 9e,i shows that the V-TriD method yields a clearer target signature than S-TriD, indicating its superior ability to leverage the noise differences between vector channels to suppress non-target components. As the SNR increases, this advantage becomes more pronounced. At 0 dB (Figure 9d,h,l), the spectra from V-TriD and S-TriD are virtually free of noise artifacts, while the LOFAR spectrum still contains visible noise.
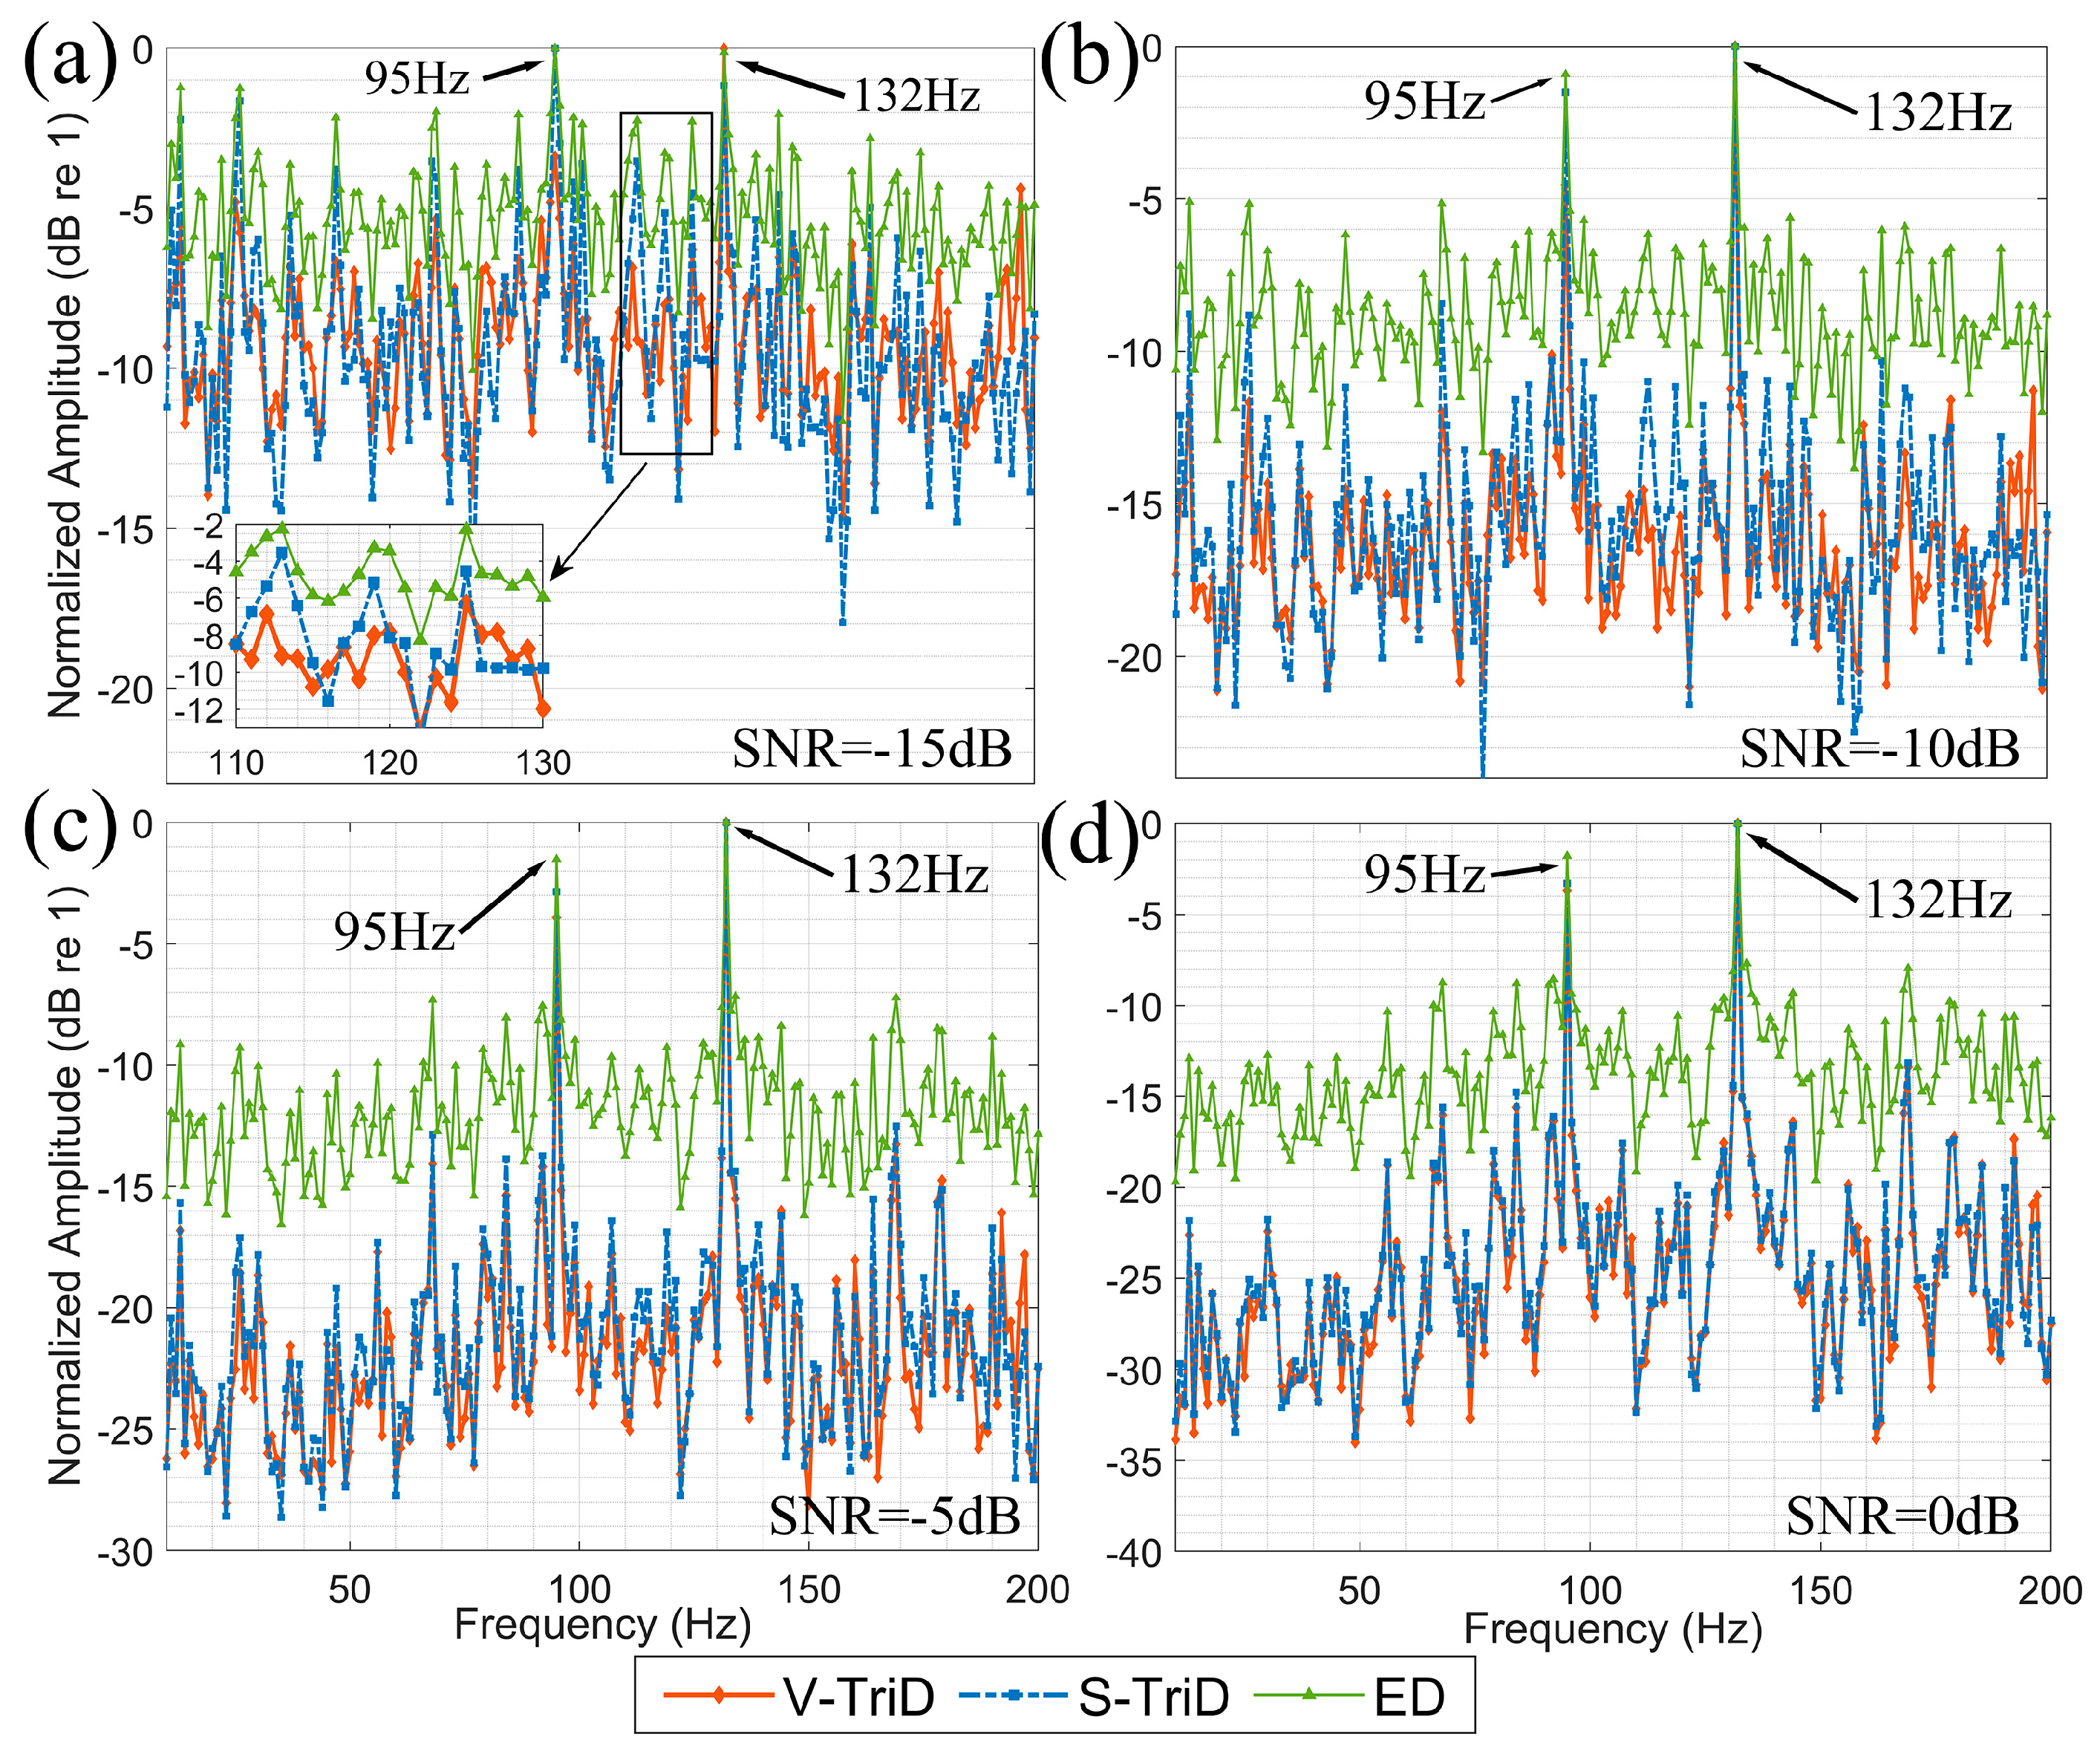
To quantify these visual observations, Figure 10 displays the time-averaged spectra for each method at the same SNRs. The results show that as SNR increases, the noise suppression effect of S-TriD and V-TriD becomes more significant. At an input SNR of 0 dB, both S-TriD and V-TriD achieve an approximate 10 dB gain over the conventional LOFAR spectrum. Critically, at a low SNR of −15 dB, where the target is nearly undetectable in the LOFAR spectrum (Figure 10a), S-TriD and V-TriD provide an SNR improvement of 3–5 dB. This gain is crucial for reducing the false alarm rate and enhancing the reliability of line spectrum detection. The superior performance of V-TriD in resolving noise details stems from its ability to jointly process pressure and velocity, exploiting the poor correlation of white noise across the different hydrophone channels.
To provide a robust statistical evaluation, 1000 Monte Carlo simulations were performed for each SNR point from −36 dB to 10 dB. To quantitatively evaluate the performance of the detection algorithms, the following three metrics are defined:
(a)
Probability of Detection ( P D ): The ratio of trials in which the target frequency components are correctly detected to the total number of Monte Carlo trials.
(b)
Effective Detection Rate of Target Line Spectra ( P L S D ): This metric assesses the purity of the detection results. For a single trial i , it is the ratio of the number of detected target line spectra to the total number of detected line spectra. The final P L S D is the average over all N trials: P L S D = i = 1 N x i .
(c)
Probability of False Alarm ( P F A ): The ratio of trials containing one or more erroneously detected non-target frequency components to the total number of Monte Carlo trials.
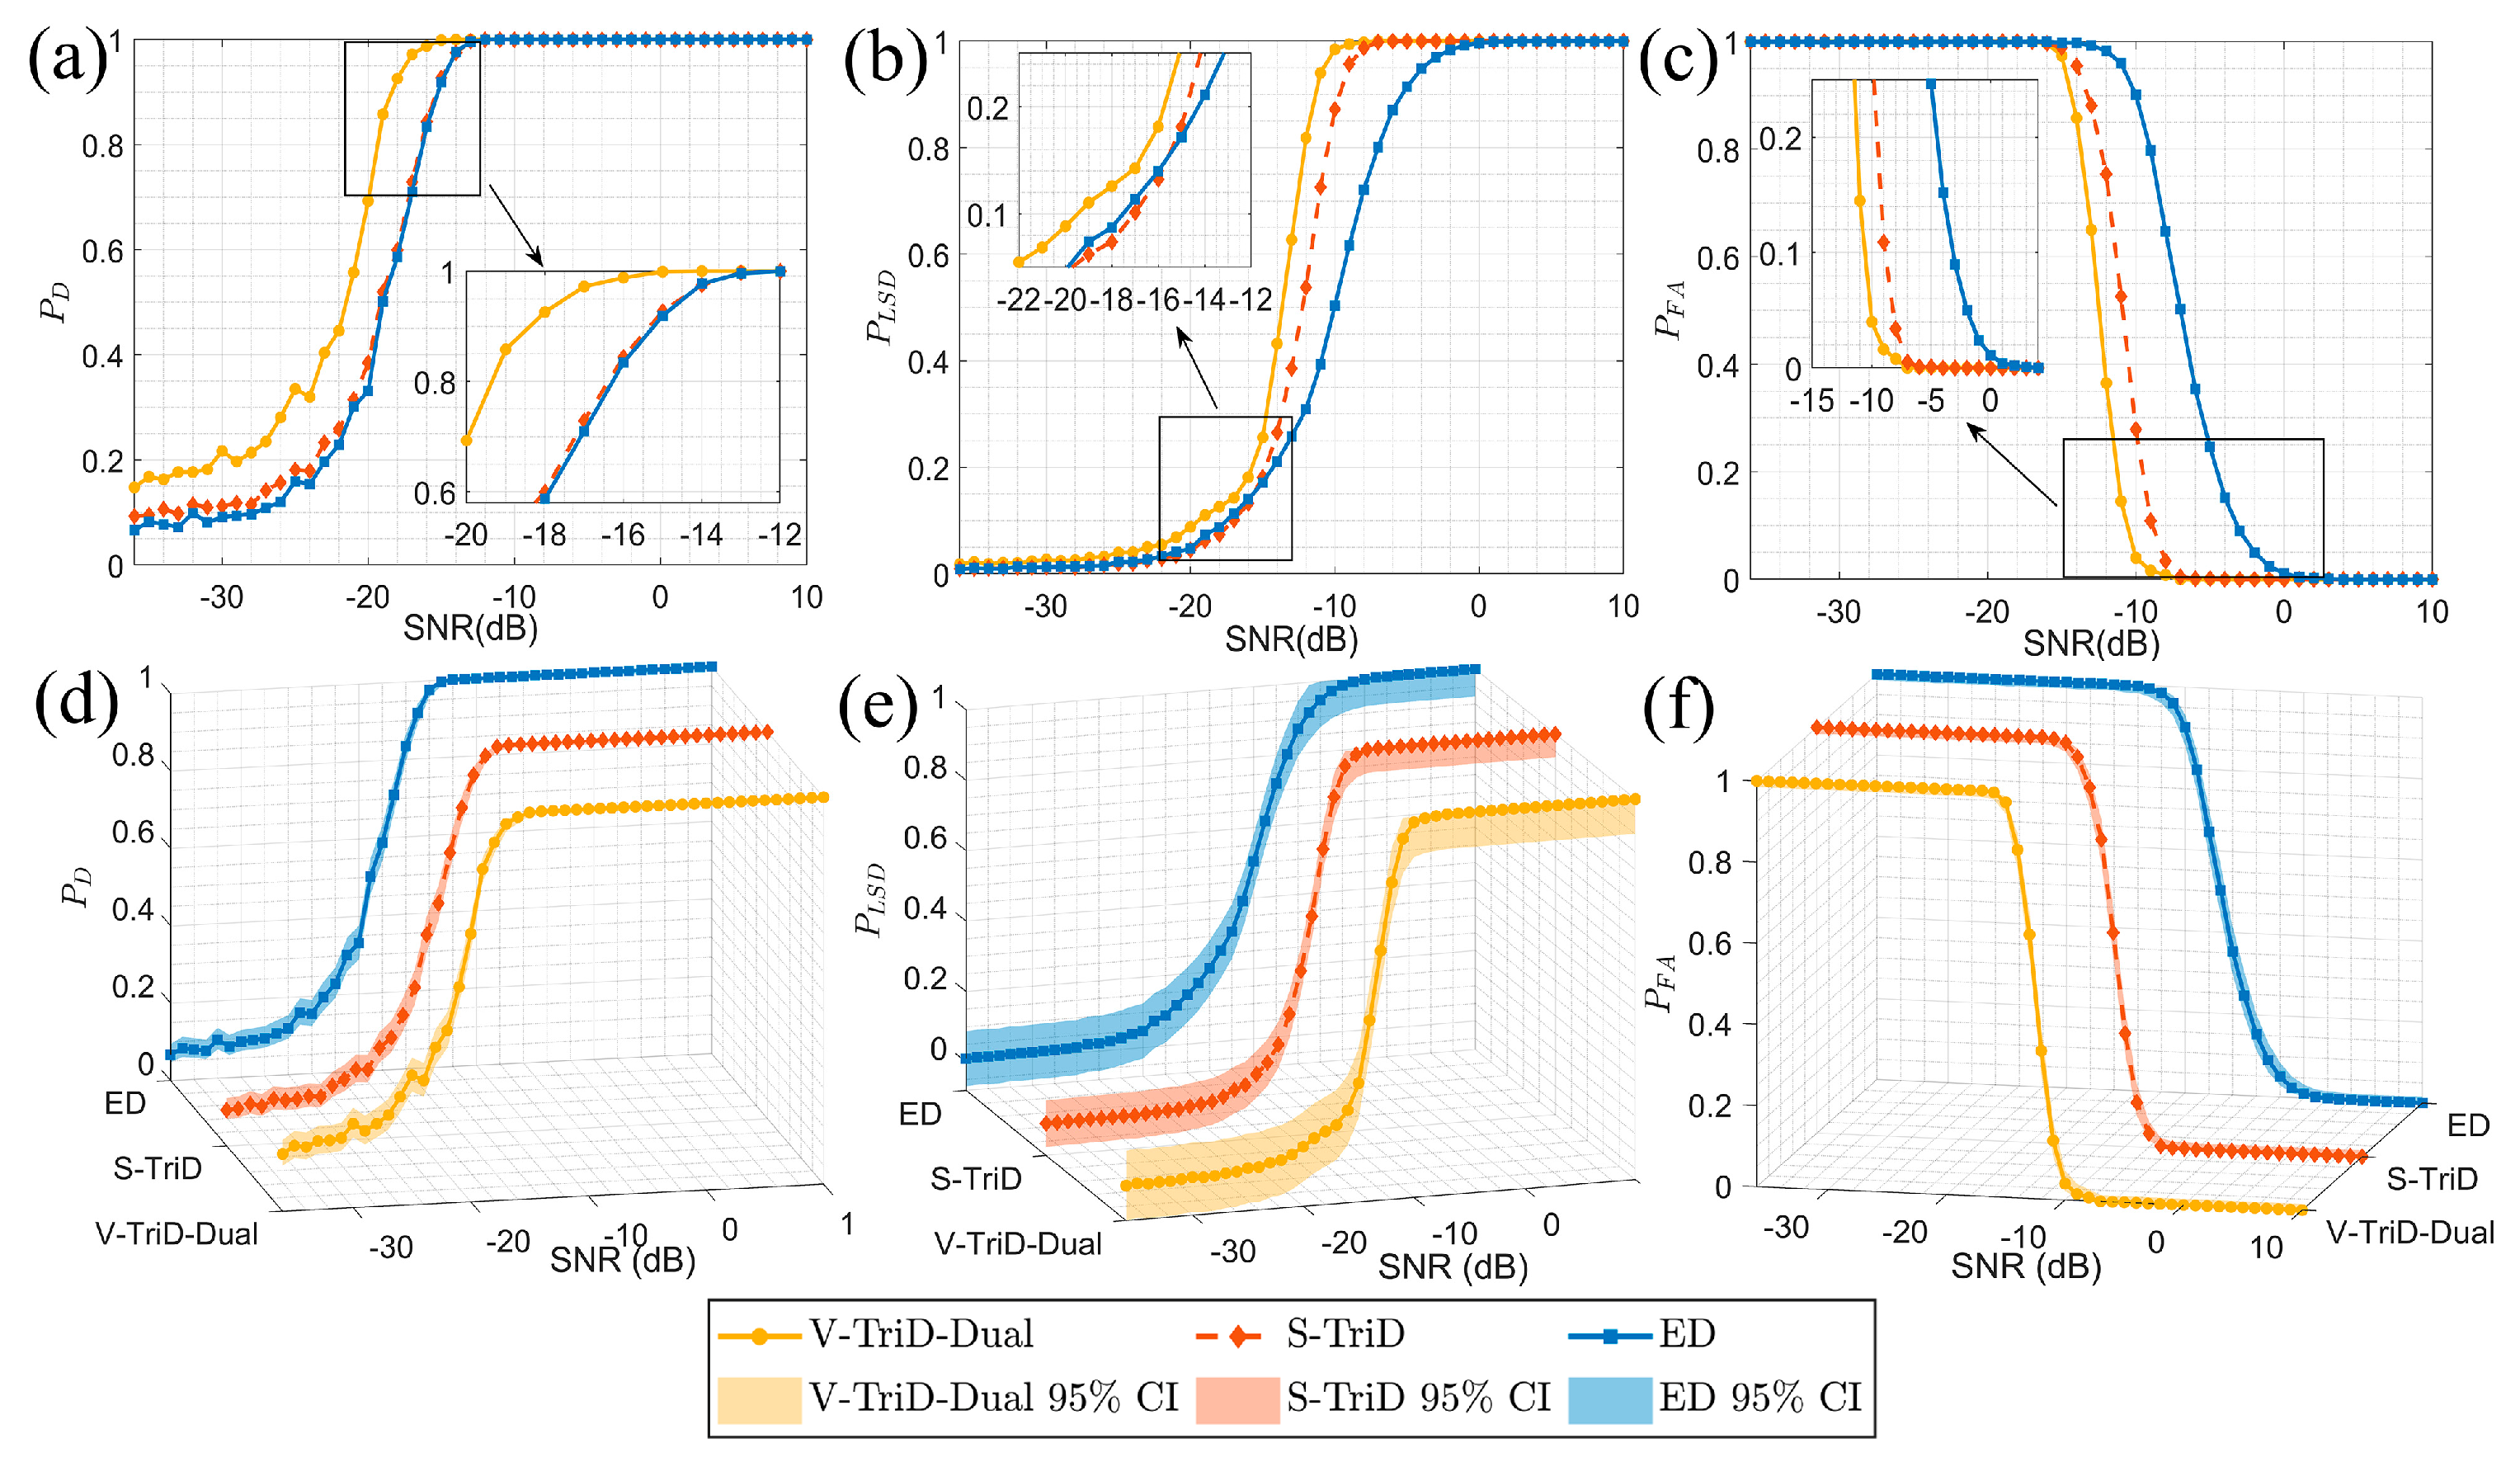
Figure 11 presents the statistical performance of the V-TriD-Dual, S-TriD, and ED methods. The probability of detection ( P D ) as a function of SNR is shown in Figure 11a. The V-TriD-Dual method consistently outperforms the other two, achieving a P D of 1.0 at an SNR approximately 4 dB lower than both the S-TriD and ED methods. The robustness of this performance is confirmed by the narrow 95% confidence intervals shown in Figure 11d. Figure 11b shows the P L S D metric, where the V-TriD-Dual and S-TriD methods show a faster increase in performance with SNR compared to ED. In terms of false alarm probability ( P F A ), Figure 11c illustrates the clear superiority of the proposed method. At a P F A of 0.1, the required SNR for V-TriD-Dual is −10.2 dB, compared to −9 dB for S-TriD and −3 dB for ED. The narrow 95% confidence intervals for all metrics (Figure 11d–f indicate stable and reliable performance for all algorithms).
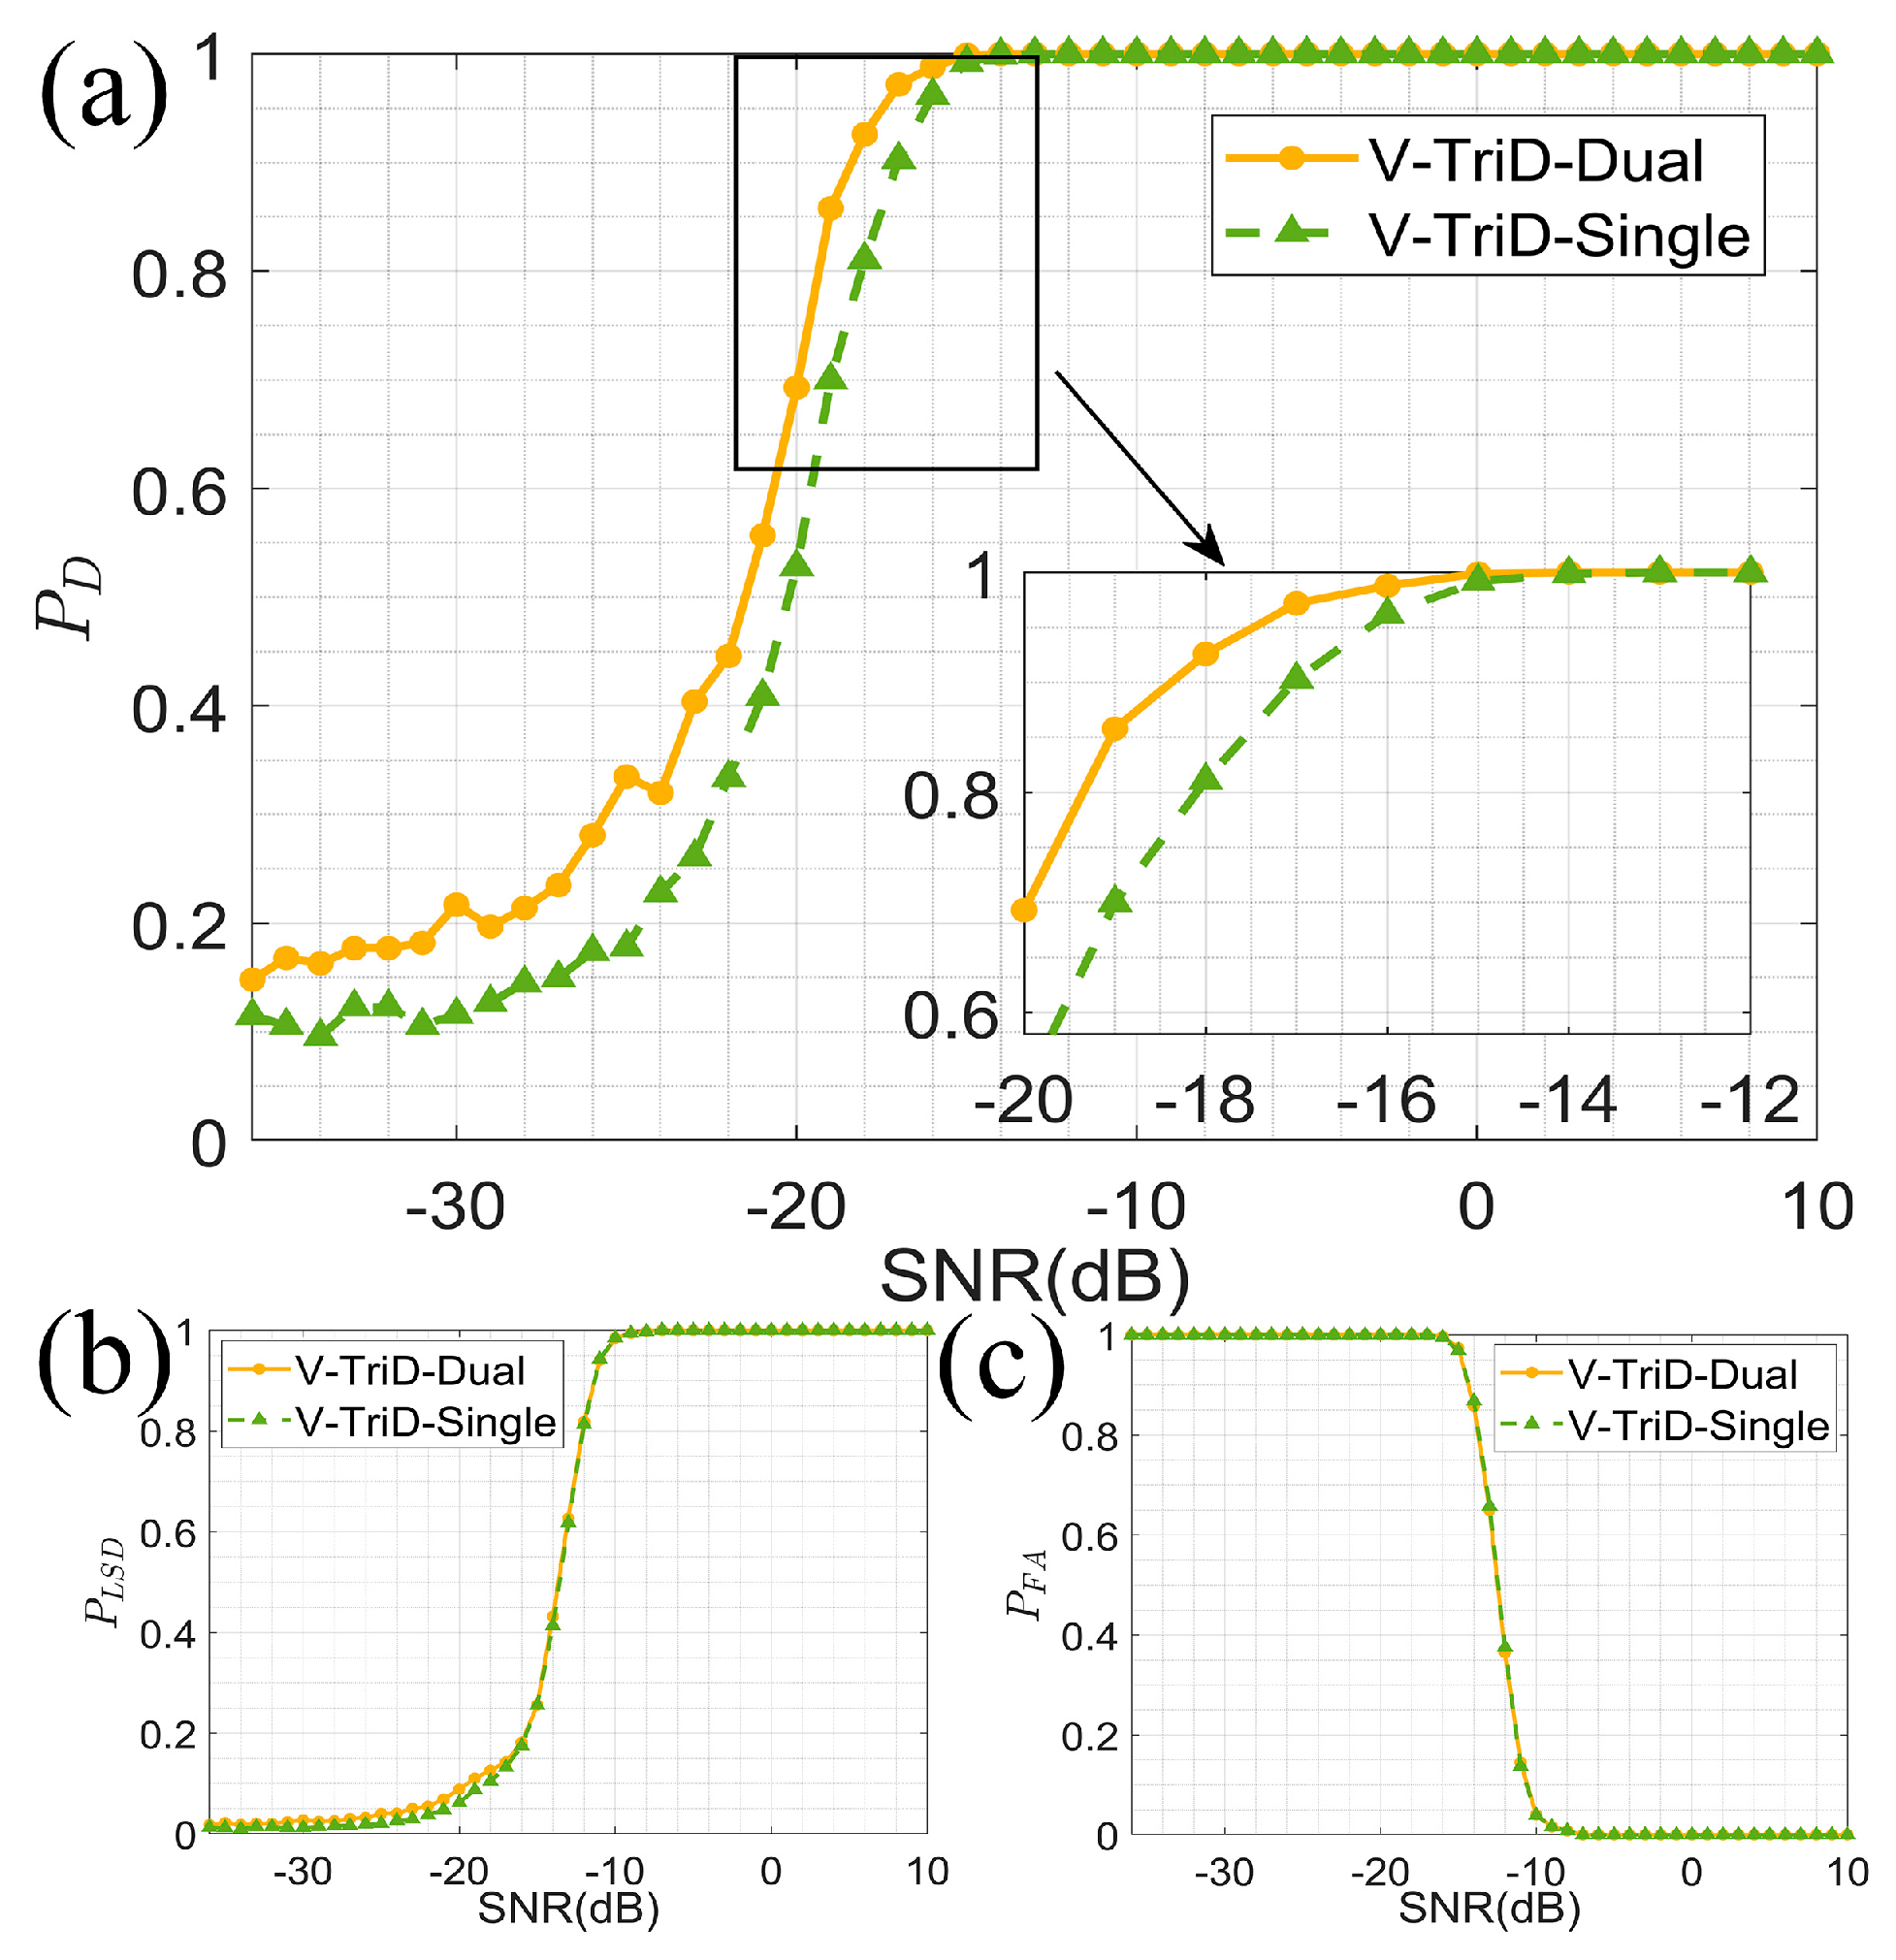
To quantify the performance gain afforded by the adaptive dual-channel architecture, a direct comparison was made between the proposed V-TriD-Dual detector and its single-channel counterpart (V-TriD-Single). The results are presented in Figure 12.
As illustrated in Figure 12a, the dual-channel approach provides a significant improvement in the probability of detection ( P D ) within the low-SNR regime (below −15 dB). While the P D curve for the V-TriD-Dual detector exhibits slightly more fluctuation than the single-channel version at SNRs below −22 dB, the variance is minor and well within acceptable limits. Critically, even with these fluctuations, its detection probability remains consistently higher, confirming the overall stability and superiority of the adaptive method.
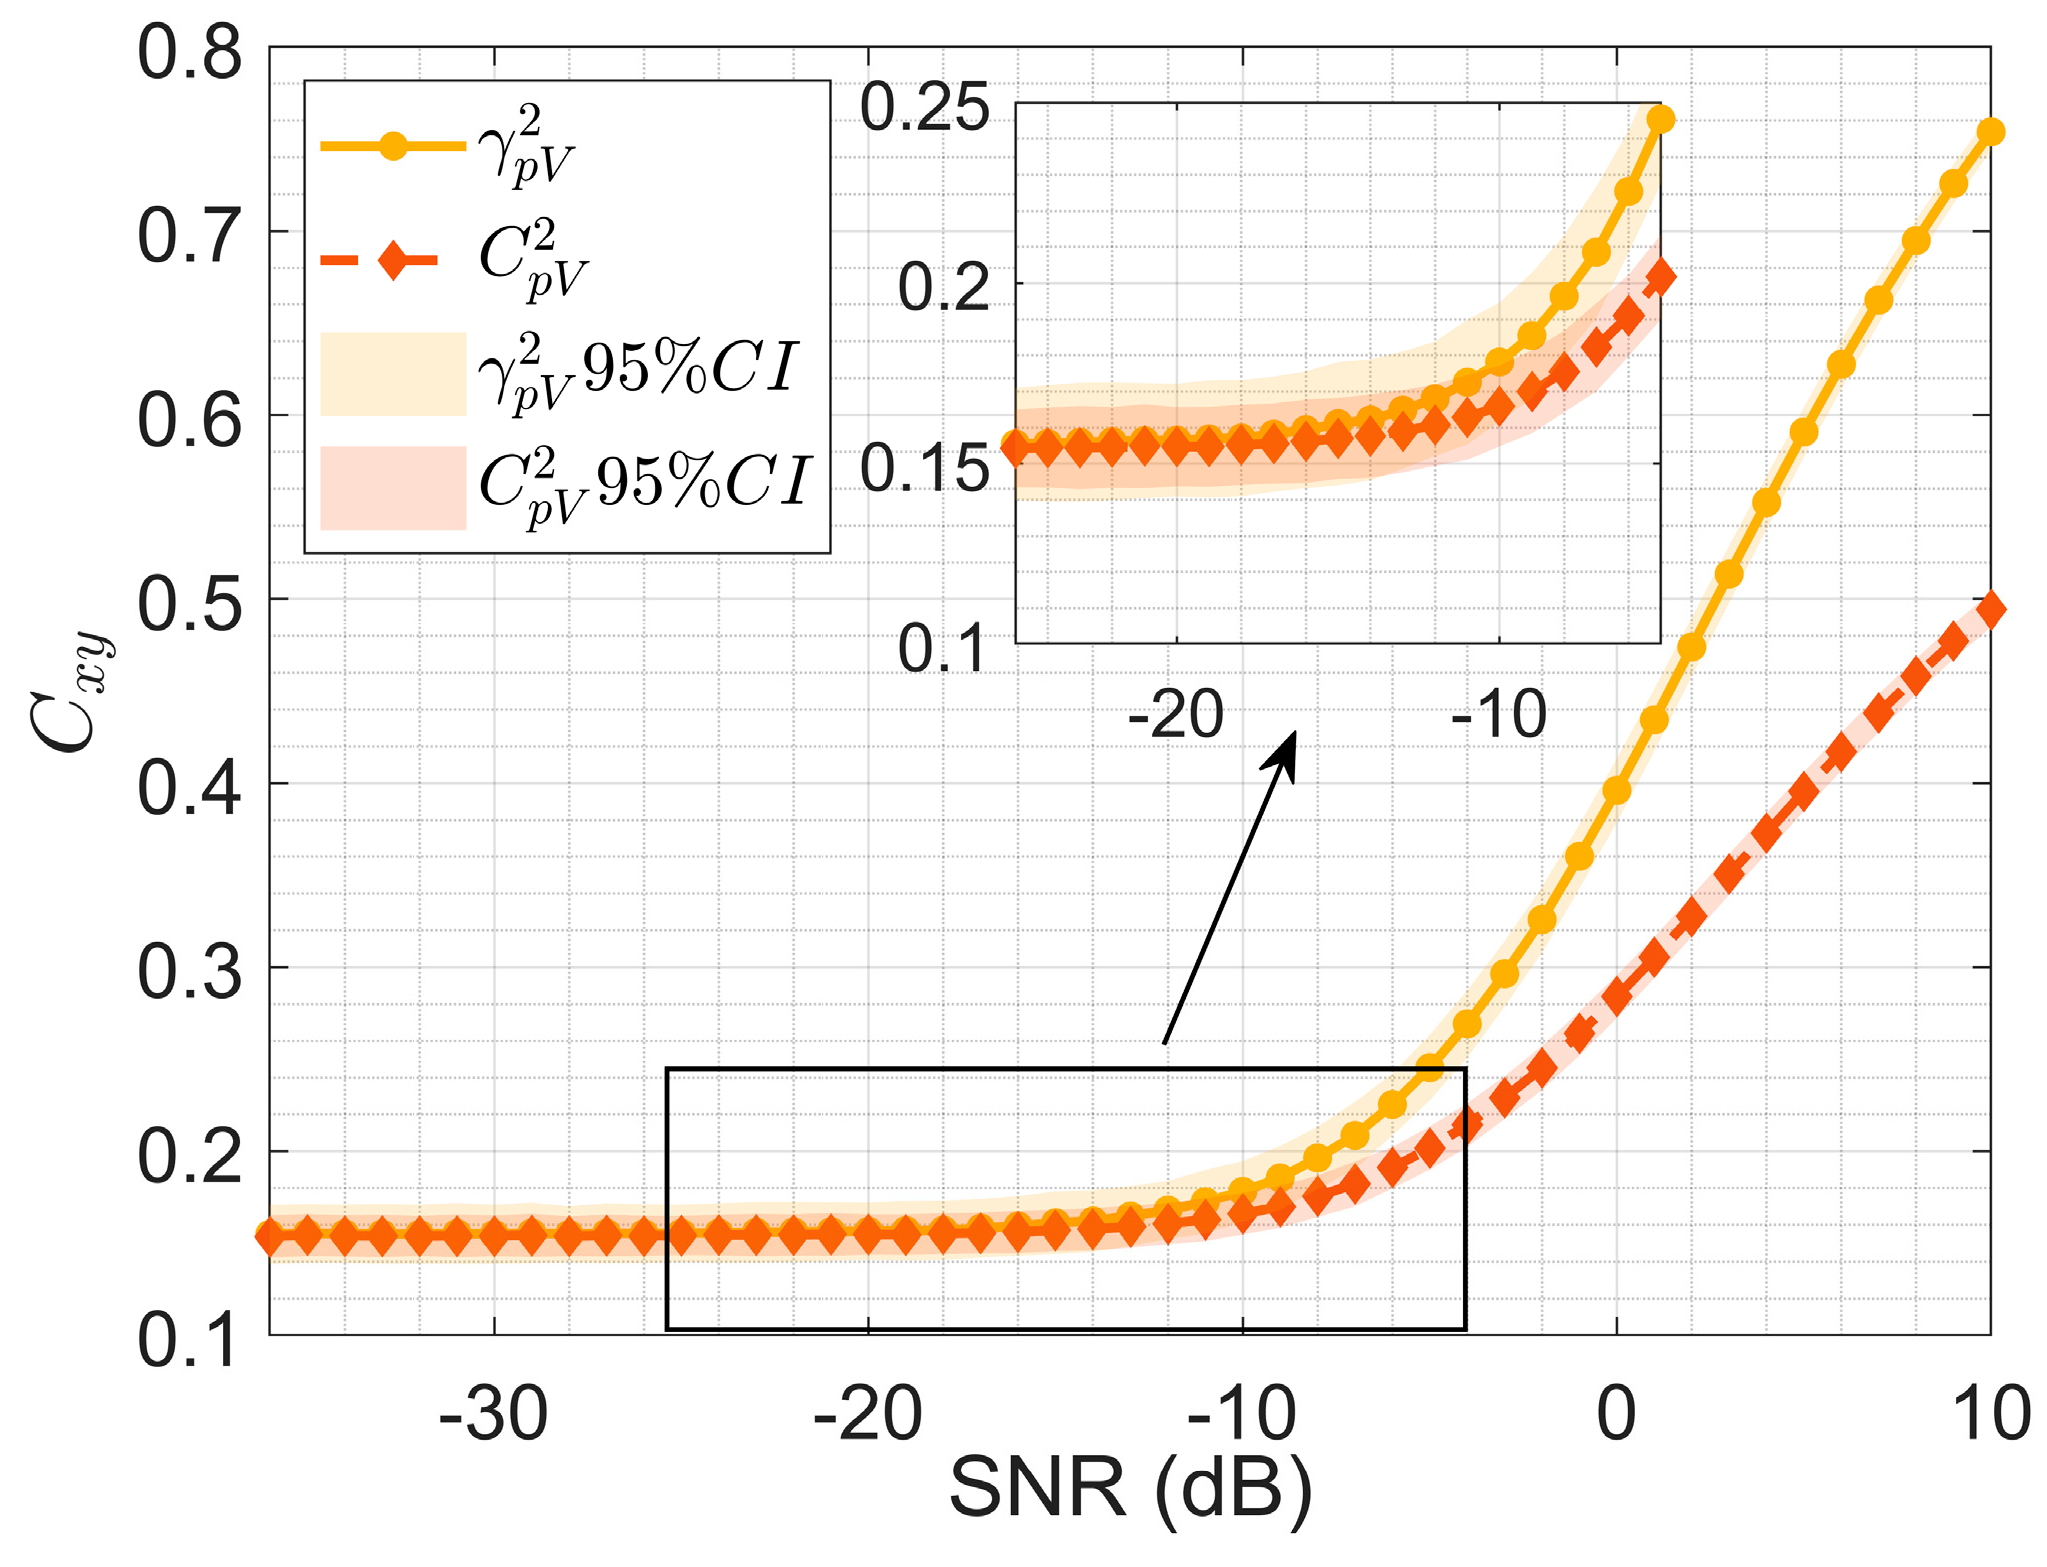
The mechanism behind this enhancement is detailed in Figure 13, which shows the behavior of the adaptive thresholding logic as a function of SNR. At SNRs above −8 dB, where the coherence between the pressure and particle velocity channels is strong, the test statistic γ p V 2 consistently exceeds the threshold C p V 2 . Consequently, the algorithm correctly selects the high-performance V-TriD channel for detection. Conversely, at SNRs below −8 dB, the coherence diminishes, causing the confidence intervals of γ p V 2 and C p V 2 to overlap. In this scenario, the detector increasingly selects the more robust energy detection (ED) channel. This adaptive switching is the key to the V-TriD-Dual’s improved performance, as it avoids the degradation that higher-order spectral methods face when signal coherence is low. It should be noted that incoherent environmental noise has minimal impact on threshold selection, as parameters γ p V 2 and C p V 2 are predominantly determined by the signal-to-noise ratio (SNR) between target signals and interfering noise. This SNR dependence constitutes the primary factor governing adaptive detection channel selection outcomes.
Furthermore, the comparison of the effective detection rate of target line spectra ( P L S D ) (Figure 12b) and the probability of false alarm ( P F A ) (Figure 12c) reveals that the dual-channel approach maintains or slightly improves upon the single-channel method in these aspects as well, with no significant difference observed in the false alarm rates.
In summary, the results validate the effectiveness of the adaptive framework. By intelligently selecting the optimal processing channel based on the real-time characteristics of the underwater acoustic signal, the dual-channel detector significantly enhances detection probability in challenging low-SNR environments compared to a conventional single-channel detector.
To provide a definitive quantitative assessment, Table 2 and Table 3 present a detailed comparison of the detection methods’ performance at discrete signal-to-noise ratios.
Table 2, which tabulates the probability of detection ( P D ) from −30 dB to −10 dB, confirms the consistent and significant superiority of the V-TriD-Dual method. This robust performance is a direct result of its adaptive framework, which intelligently leverages higher-order spectra or energy detection based on the signal’s coherence characteristics. The practical impact of this approach is starkly illustrated at an SNR of −20 dB: the V-TriD-Dual method achieves a P D of 0.693, substantially outperforming the ED (0.331), S-TriD (0.385), and V-TriD-Single (0.528) methods. Notably, the V-TriD-Dual detector is also the first to achieve perfect detection ( P D = 1.0) at an SNR of −14 dB, demonstrating its efficiency as conditions improve.
Complementing this, Table 3 details the probability of false alarm ( P F A ) over the −18 dB to 0 dB range, highlighting the exceptional reliability of the proposed vector-based method. The contrast is most striking at an SNR of −10 dB. At this point, the V-TriD-Dual method maintains an excellent low P F A of 0.040. In stark opposition, the conventional ED method is highly prone to errors with a P F A of 0.901, and the scalar S-TriD method also struggles with a false alarm rate of 0.279. This superior performance in rejecting noise is sustained even at higher SNRs; by −5 dB, the V-TriD-Dual method achieves a false alarm rate of zero, underscoring its stability.
Taken together, the simulation results in Table 2 and Table 3 demonstrate that the proposed adaptive dual-channel method enhances detection probability in low-SNR environments, while also showing superior performance in suppressing false alarms, especially at moderate signal-to-noise ratios.

5. Experimental Analysis

To validate the performance of the proposed algorithm beyond idealized simulations, it was tested on data acquired from a sea trial. This step is critical for assessing practical effectiveness, as real-world ocean acoustic noise fundamentally differs from simulated Gaussian noise, often presenting complex non-Gaussian and colored spectral characteristics. The algorithm’s successful detection of the target signal within this complex environment indicates its robustness and supports its potential for real-world applications.

5.1. Basic Experimental Settings

The data used for this analysis was collected during a sea trial conducted by our research group in the South China Sea in 2022. The experimental scenario is shown in Figure 14. The experimental site featured a relatively flat seabed with a gentle slope, at a water depth of approximately 4300 m. A 9-element fiber optic vertical line array (VLA) was used for signal reception. The data from the second element of the array was selected for this analysis. During the experiment, the source vessel turned off its main engine and operated on silent power. The acoustic source was deployed at a depth of 100 m and transmitted line spectrum signals at 107 Hz and 170 Hz. The receiver was at a depth of approximately 4200 m and a horizontal distance of about 5 km from the source. The sea state was level 2.

5.2. Processing Results

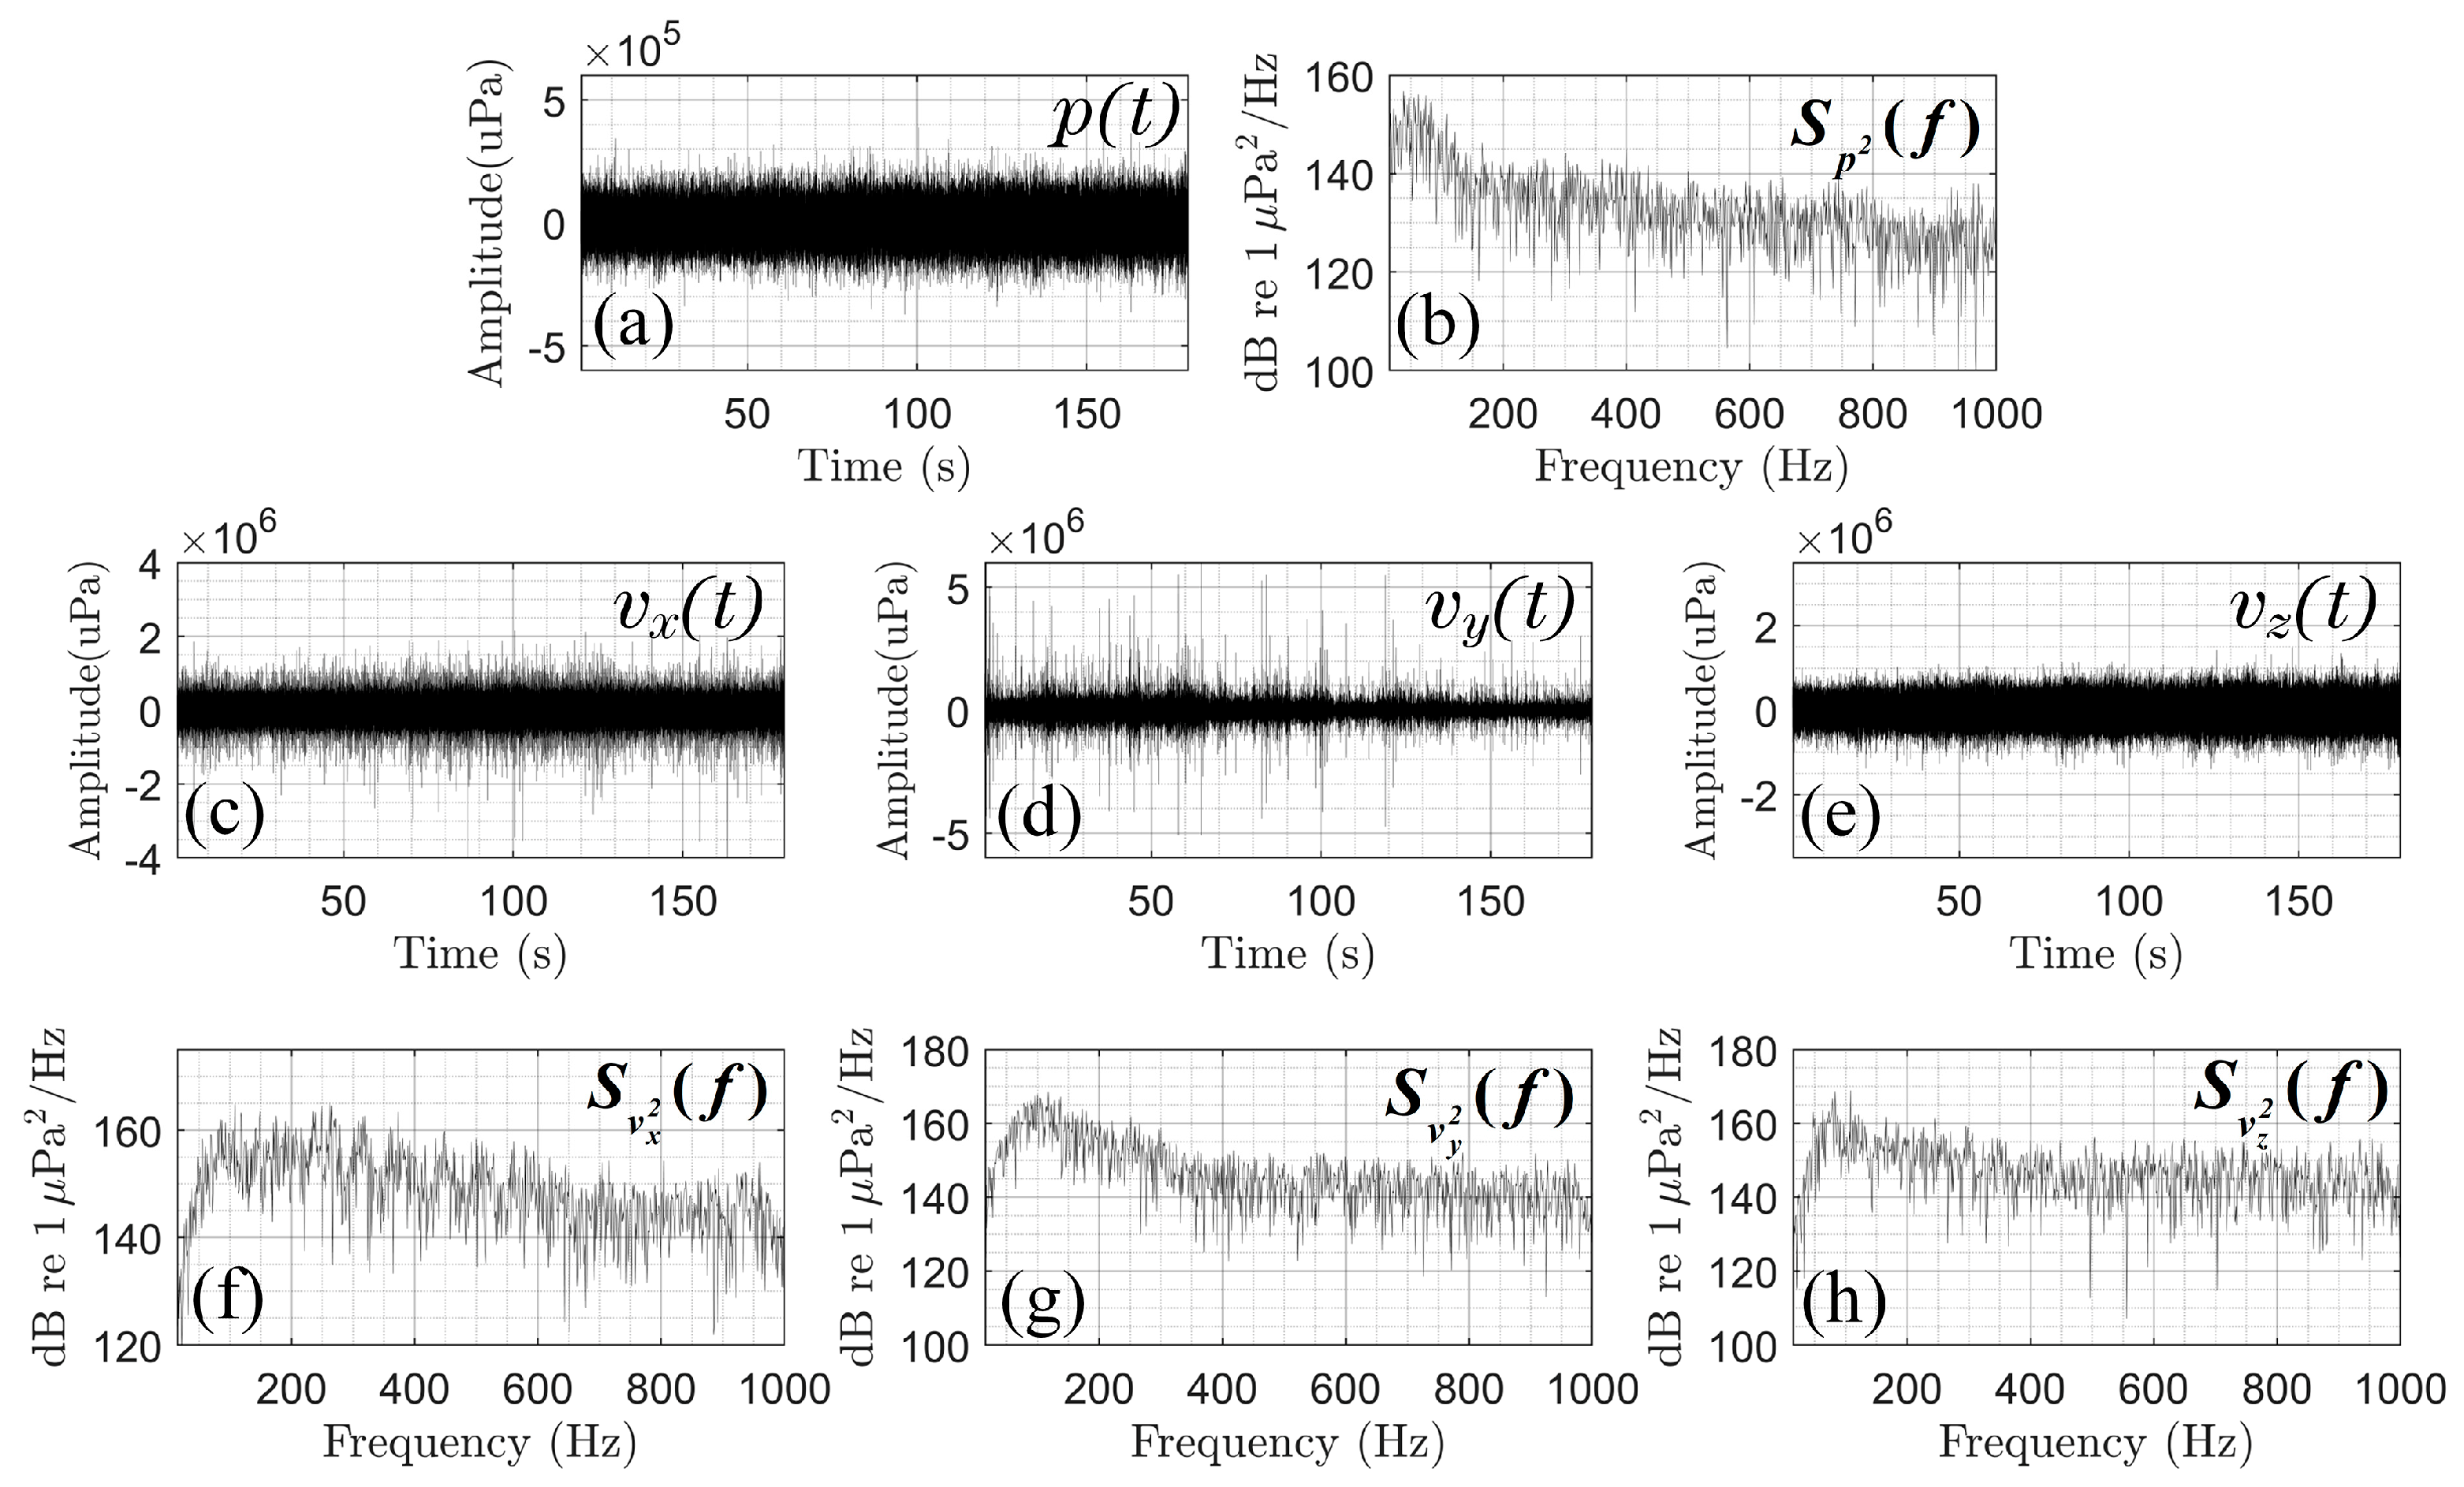
The sea trial data was acquired using a vector hydrophone, which synchronously recorded signals from four co-located channels: one acoustic pressure channel ( p ( t ) ) and three orthogonal particle velocity channels ( v x ( t ) , v y ( t ) , and v z ( t ) ). Figure 15 displays the time-domain waveforms and energy density spectra for each channel during the signal transmission period. For consistency in the analysis, the particle velocity measurements were converted into an equivalent pressure unit (μPa). A preliminary inspection of the figure confirms that the received signals across all channels were within normal parameters, showing no significant distortion or anomalies.
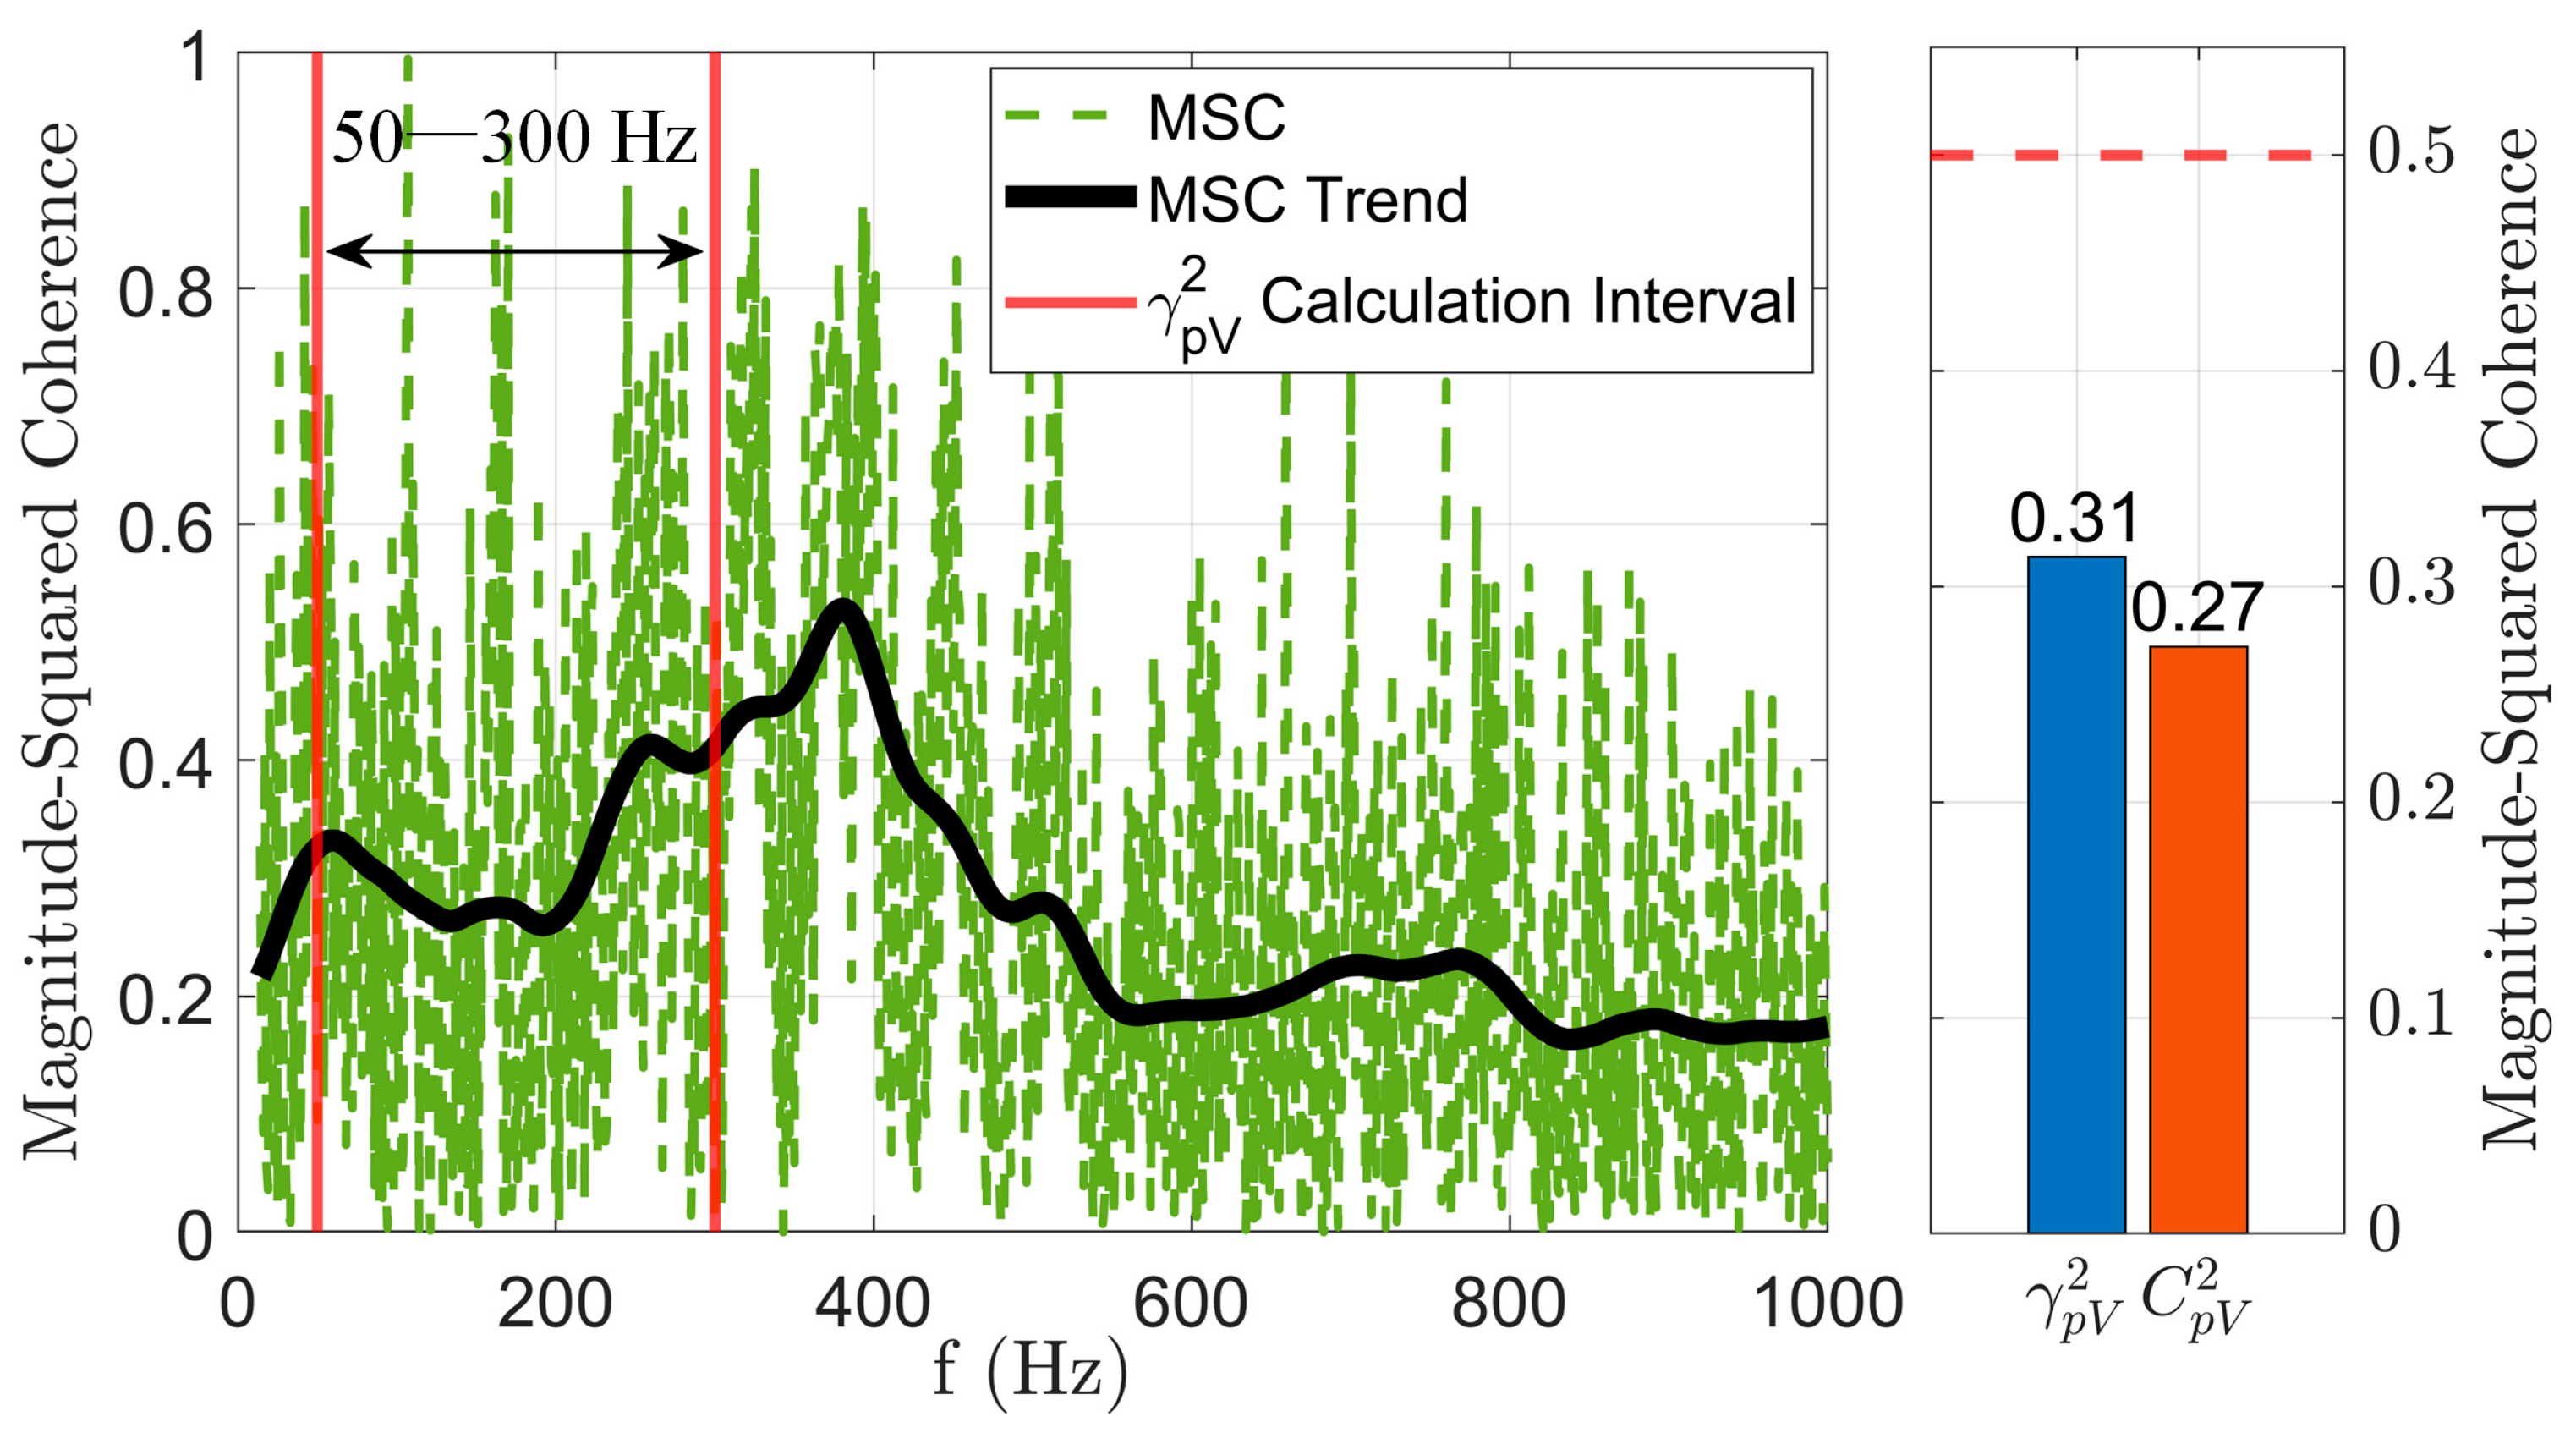
For a detailed analysis, a 100 s segment of the signal captured during the source transmission was processed. Figure 16 presents the magnitude-squared coherence (MSC) between the composite velocity and pressure signals, alongside the parameters γ p V 2 and C p V 2 that govern the adaptive detector’s decision logic.
The analysis confirms that the condition γ p V 2 > C p V 2 is met, indicating that the average coherence in the low-to-mid frequency band is greater than the average coherence across the entire frequency spectrum. This pattern is consistent with the presence of a non-Gaussian target signal whose energy is concentrated in this particular band. Therefore, triggered by this condition, the adaptive detector routes the input signal to the vector cross-trispectrum (V-TriD) processing channel, which is specifically designed to exploit such coherent signal properties for detection.
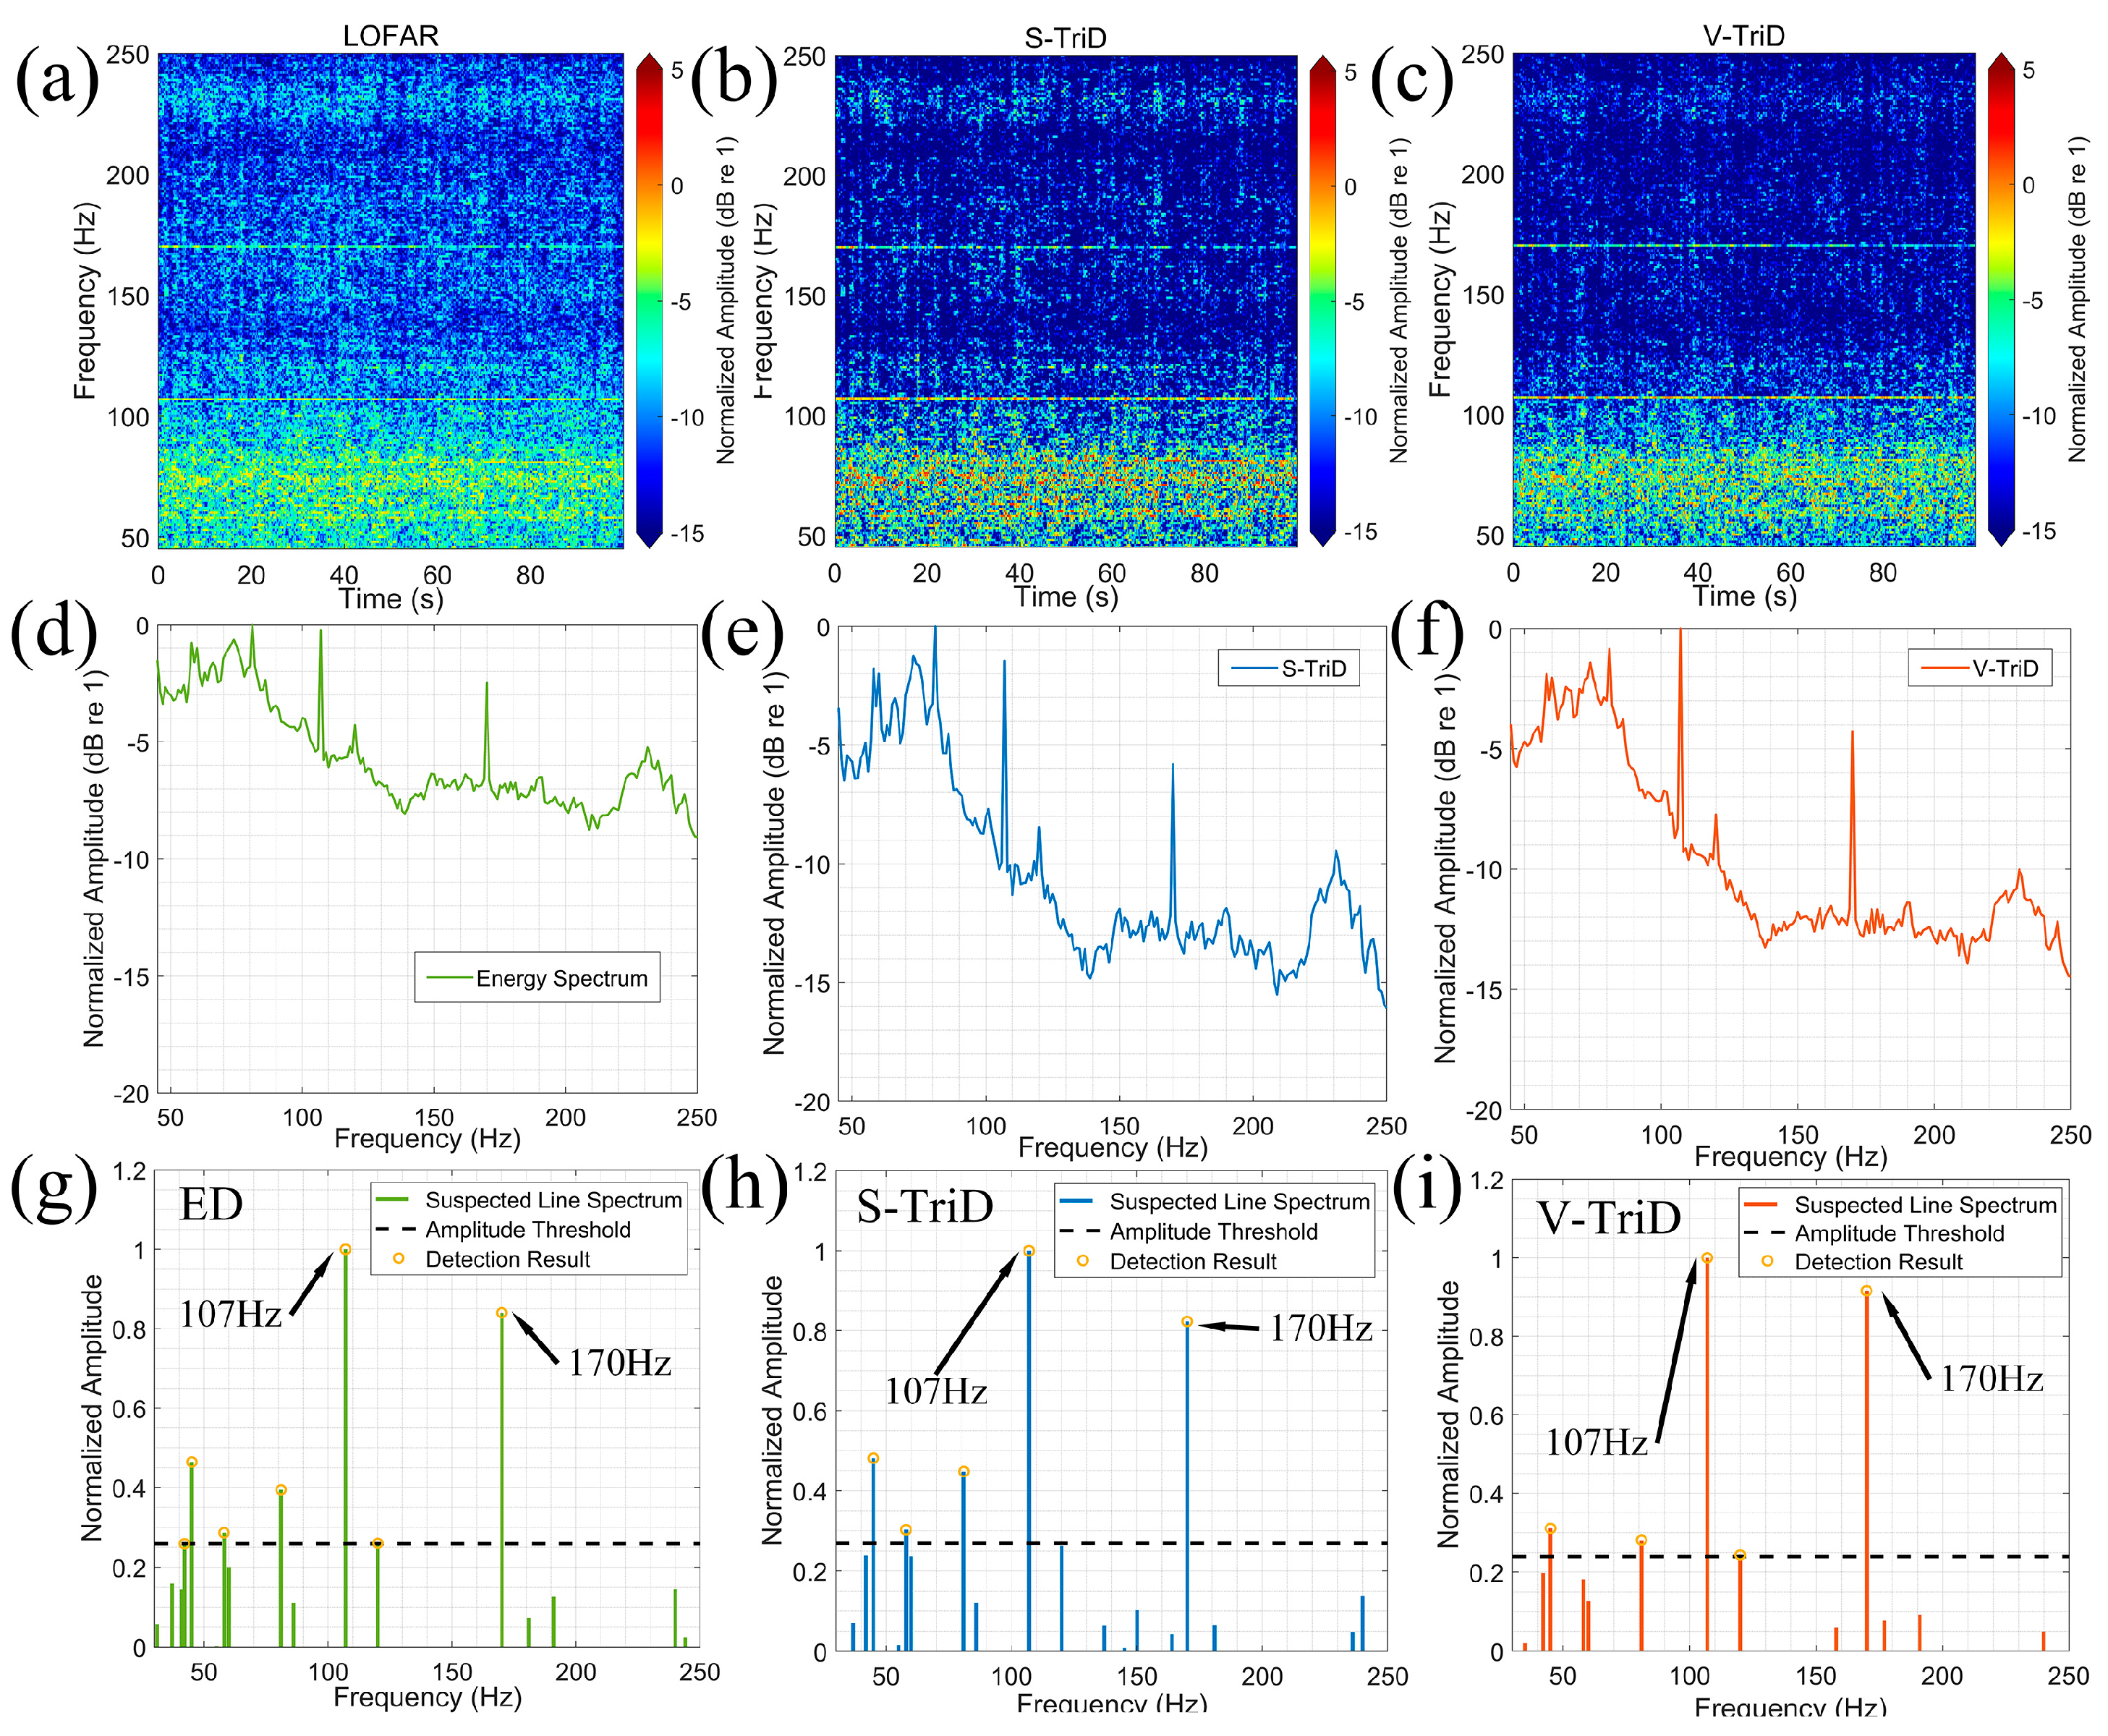
Figure 17 presents the final detection results for the sea trial data, comparing the performance of three methods: conventional energy detection (via a LOFAR spectrum), the scalar-based trispectrum (S-TriD), and the proposed vector-based trispectrum (V-TriD).
The first two rows of the figure illustrate the noise suppression capabilities of the higher-order spectral methods. Panels (a), (b), and (c) of Figure 17 display the resulting spectrograms, while panels (d), (e), and (f) show the corresponding time-averaged and normalized energy distributions. It is evident from these panels that both the S-TriD and V-TriD methods effectively suppress the background ambient noise compared to the conventional LOFAR spectrum. This suppression enhances the signal-to-noise ratio (SNR) of the target’s frequency components, making them more prominent.
The final row, panels (g), (h), and (i), displays the outputs of an automatic line spectrum detector when fed the averaged spectra from the row above. While all three methods successfully identify the target’s primary spectral lines, the V-TriD-based result is significantly cleaner. It yields fewer spurious lines and detects fewer non-target components, and the energy of the true target line is higher than in the other two methods.
This outcome validates the decision made by the V-TriD-Dual algorithm. As established in the previous section, the coherence analysis triggered the criterion to route this signal segment to the V-TriD processing channel. The results in Figure 17 confirm the benefit of this decision. Compared to conventional energy-based or scalar trispectrum methods, the vector-based approach not only suppresses the Gaussian ambient noise but also fully exploits the advantages of the vector hydrophone. By leveraging the coherence between the acoustic pressure and particle velocity fields, it can more effectively reject non-target interferences, leading to a cleaner detection profile, an enhanced SNR for the true target, and ultimately, a reduced probability of false alarms.

6. Discussion

6.1. Performance Analysis

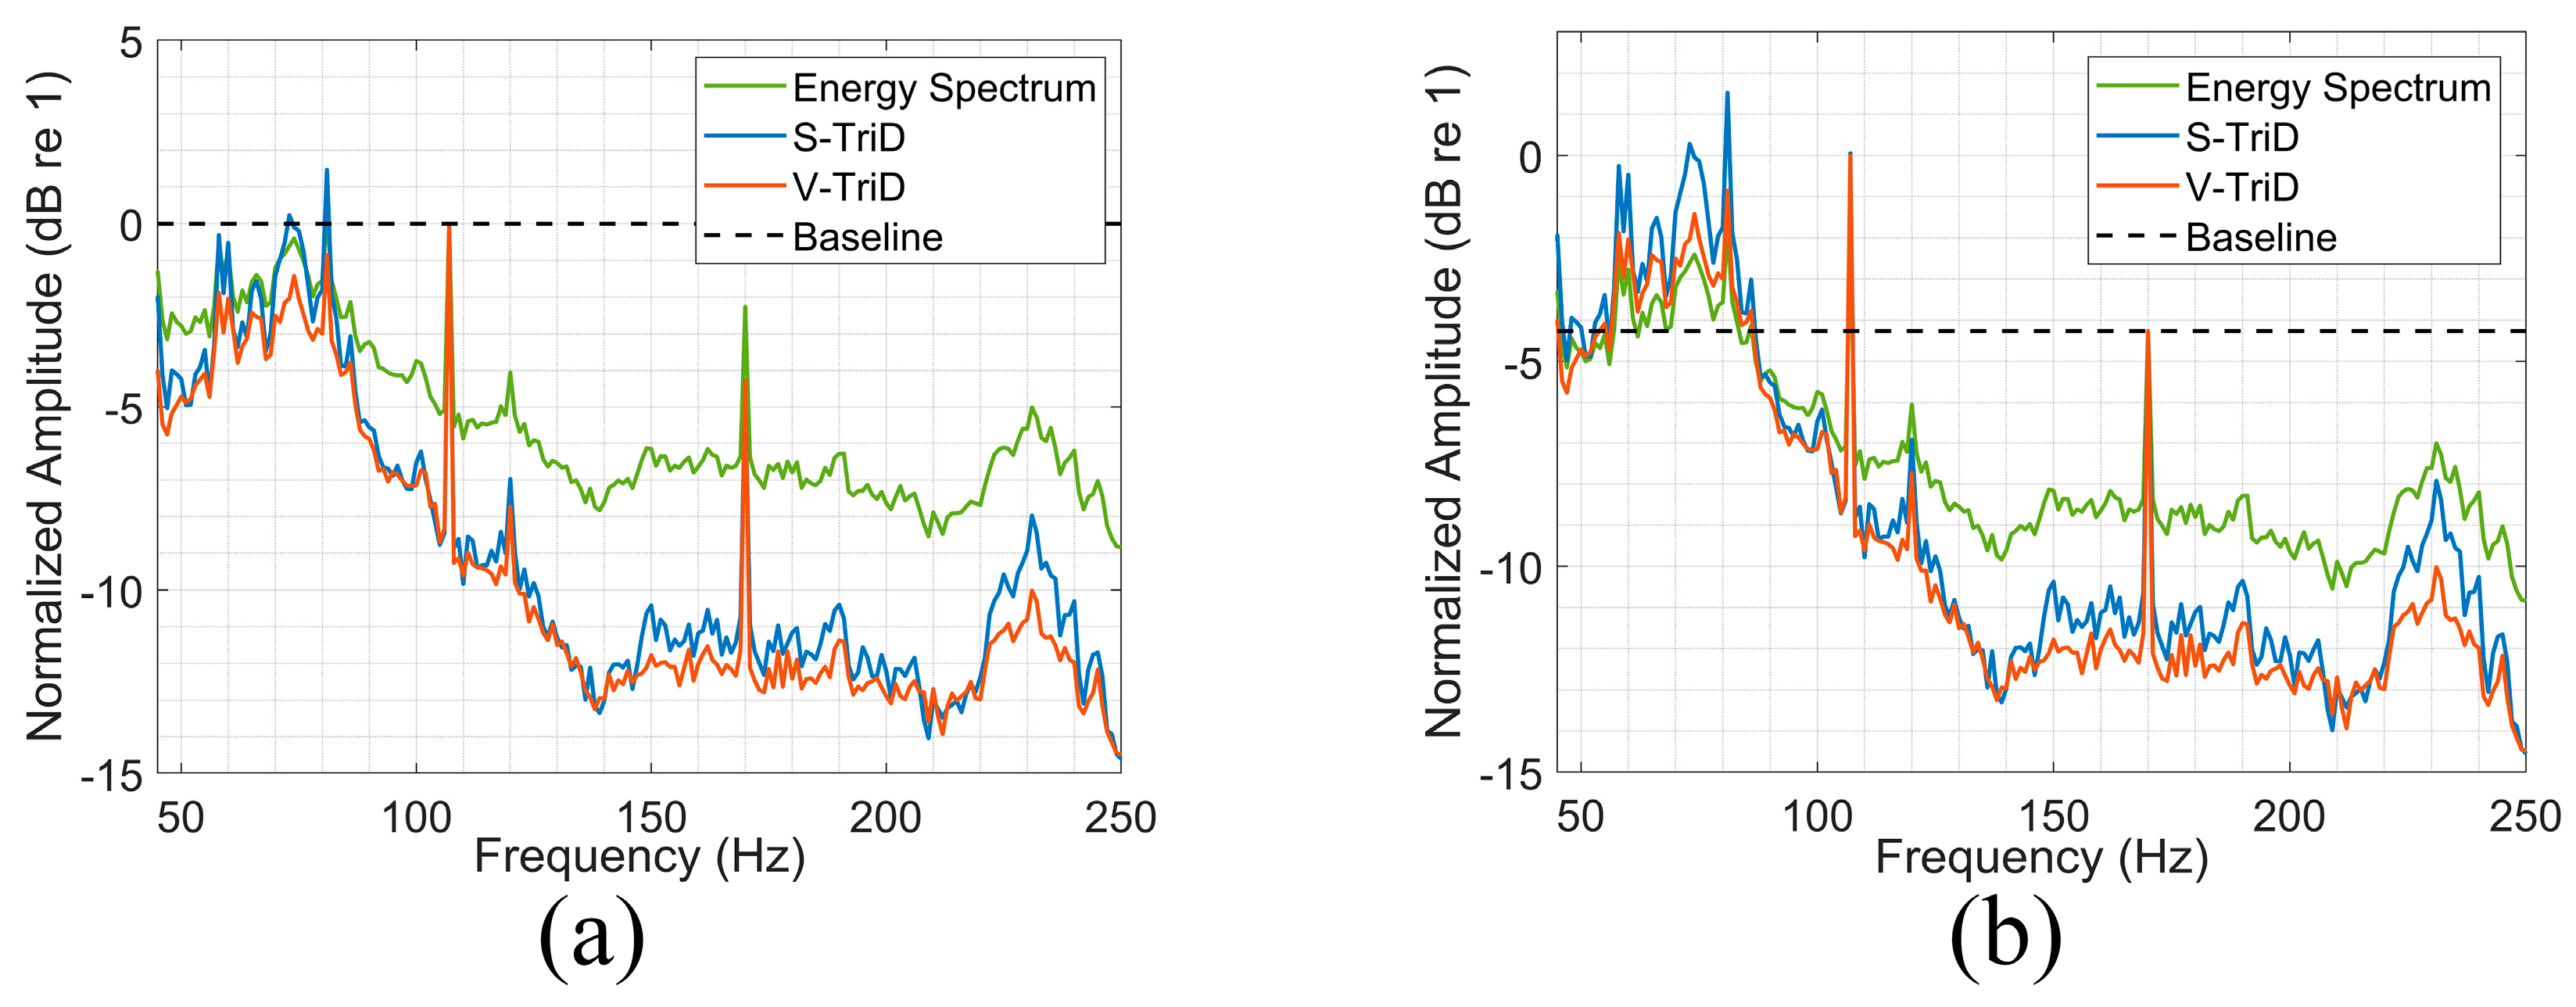
The comprehensive results from both simulations and the sea trial provide a solid foundation for interpreting the performance advantages and underlying principles of the proposed V-TriD-Dual method. A key aspect of this discussion is the quantitative analysis of the sea trial data, which serves to dissect the mechanisms responsible for the method’s effectiveness, particularly following the adaptive framework’s selection of the V-TriD channel. For this, the time-averaged spectra from the three detectors—energy detection (ED), scalar trispectrum (S-TriD), and vector trispectrum (V-TriD)—were normalized and overlaid for direct comparison.
The analysis quantifies the distinct SNR improvement provided by the V-TriD method. As shown in Figure 18a, where the spectra are aligned at the 107 Hz component, the V-TriD spectrum exhibits an SNR gain of approximately 3 dB over the conventional energy spectrum. A 3 dB improvement in SNR is particularly noteworthy, as such a gain directly translates to a higher probability of detection, especially in low-SNR conditions. Compared to the S-TriD spectrum, the V-TriD method provides a maximum SNR improvement of about 2 dB across other frequencies in this alignment. A similar advantage is observed when the spectra are aligned at 170 Hz (Figure 18b), where the V-TriD spectrum again shows an approximate 3 dB gain over the energy spectrum and a 1 dB gain over the S-TriD spectrum at the target line, with this advantage reaching up to 2.5 dB elsewhere in the band.
These observed SNR gains are attributable to two key mechanisms inherent to the V-TriD processing. First, as a higher-order statistical (HOS) method, it effectively suppresses the Gaussian ambient noise background, which is the primary reason for its advantage over the ED method. Second, and more critically for its advantage over the scalar S-TriD method, it leverages the vector hydrophone’s intrinsic spatial filtering. The natural dipole directivity of each particle velocity channel selectively attenuates off-axis interference, including discrete noise sources that may not be Gaussian. This spatial discrimination, a unique benefit of vector sensing, is the key mechanism responsible for the cleaner spectrum and the additional SNR improvement observed compared to S-TriD, ultimately leading to more reliable detection in a realistic ocean environment.
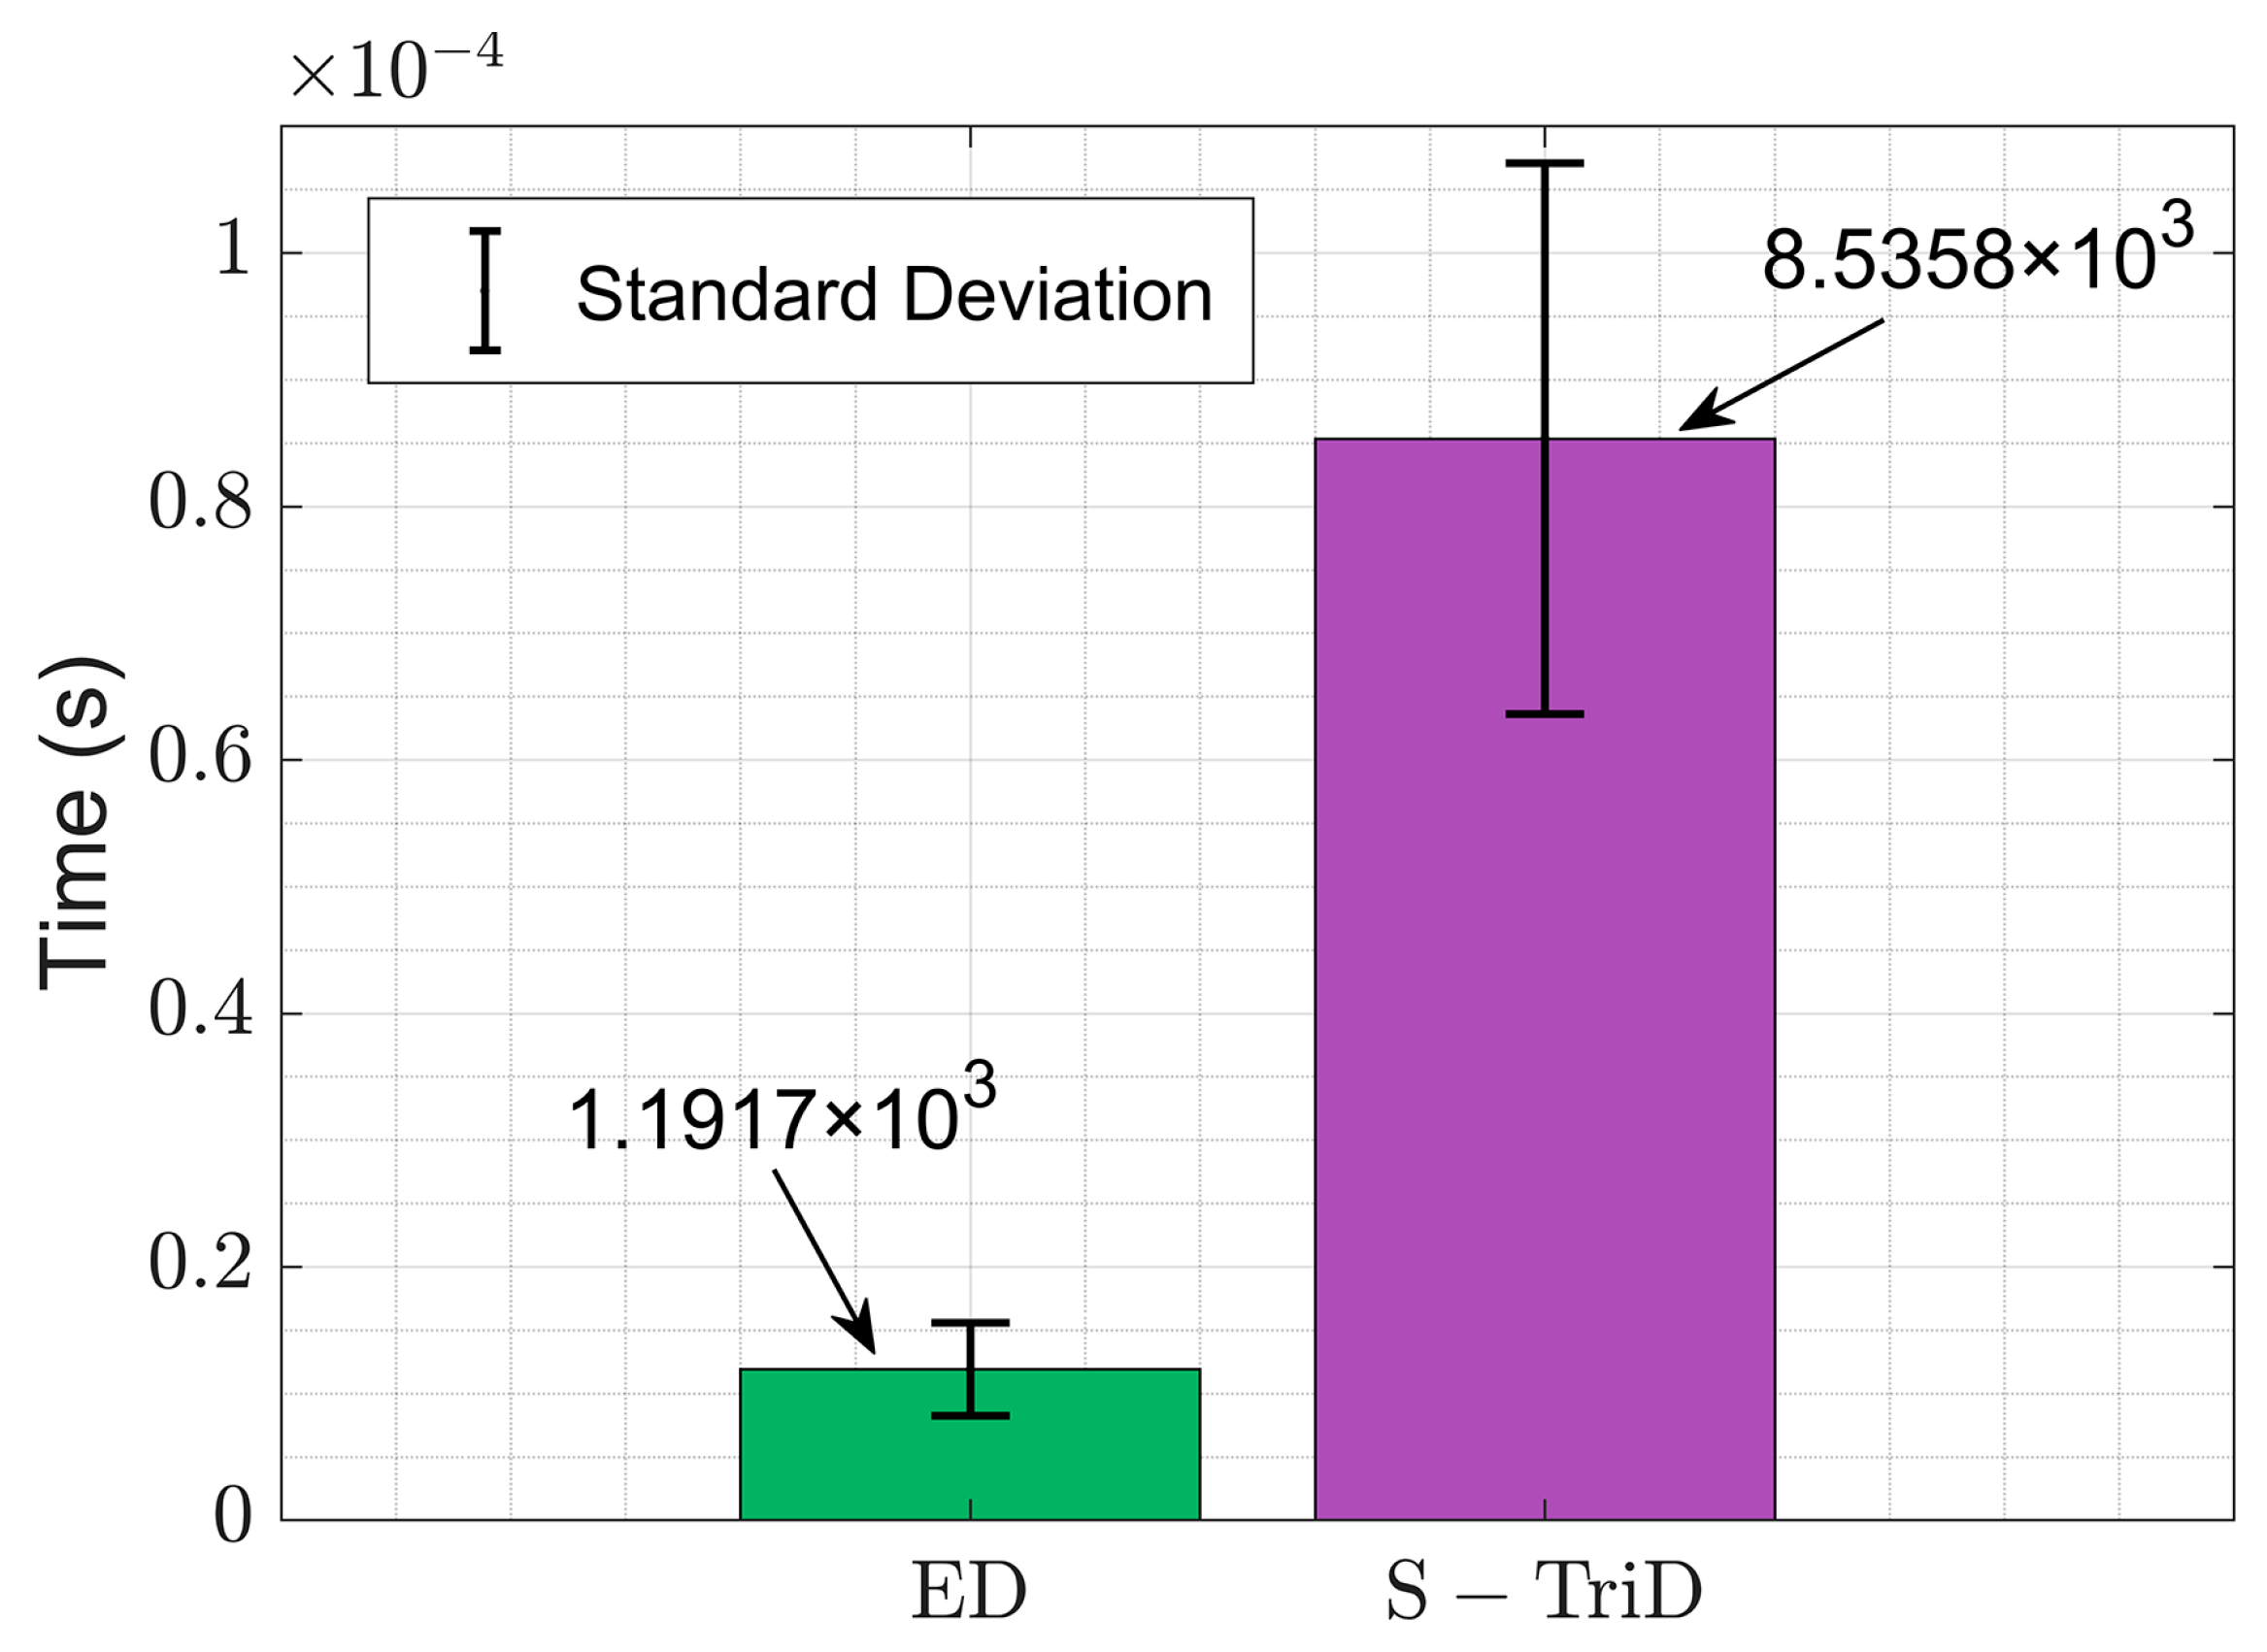
For a 10 s simulated signal, we conducted a statistical analysis of the computation time required by the S-TriD and ED algorithms across 1000 Monte Carlo simulations. The runtime benchmarks are summarized in Table 4. As illustrated in Figure 19, although the computation speed of the mutual trispectrum diagonal slice (S-TriD) surpassed that of the conventional energy detection (ED) method, both algorithms remained within the same order of magnitude in terms of computational time.

6.2. Limitations and Future Work

While the method proposed in this paper demonstrates advantages in detection performance over traditional techniques, it is important to acknowledge its current limitations. First, the false alarm rate may increase in the presence of highly coherent, non-Gaussian interference, as HOS processing does not suppress this type of noise. Second, the algorithm’s performance is contingent upon high-fidelity signals from all vector hydrophone channels; sensor resonance or channel distortion could produce erroneous results. Future work will focus on addressing these challenges and expanding the method’s capabilities.
A major focus of future research will be the integration of spatial filtering techniques and the V-TriD algorithm to enhance the suppression of non-Gaussian interference from acoustic sources in diverse directions. The proposed methodology currently focuses on single vector sensor processing, which faces inherent limitations in distinguishing multiple coherent interferers, such as simultaneous vessel signals due to insufficient spatial discrimination. To address this challenge, future developments will incorporate array-based spatial filtering techniques through the deployment of multiple vector sensors configured in precisely arranged vertical and horizontal arrays. By implementing advanced beamforming approaches, including minimum variance distortionless response and matched-field processing, such arrays enable the spatial separation of coherent sources based on their distinct arrival angles. This allows selective enhancement of signals from specific azimuths while adaptively suppressing interference through optimized null steering, thereby significantly improving detection performance in multi-source environments.
It is foreseeable that deploying this algorithm on vertical or horizontal arrays will significantly expand its applicability to harbor security, waterway monitoring, and marine bioacoustic research.

7. Conclusions

This paper developed and evaluated a dual-channel adaptive detection method based on a vector cross-trispectrum diagonal slice for weak underwater targets. The proposed framework combines vector sensor processing with higher-order statistics (HOS) through an adaptive selection mechanism designed to improve detection performance in complex underwater environments. The primary findings are summarized as follows:
(1)
A metric, termed the vector cross-trispectrum diagonal slice (V-TriD), was formulated and theoretically derived. This metric is constructed by jointly processing the acoustic pressure and composite particle velocity signals from a vector hydrophone. Its formulation utilizes the mutual coherence between these components to enhance the discrimination between signal and noise.
(2)
An adaptive dual-channel detection framework, V-TriD-Dual, was developed. It incorporates a channel selection discriminator that employs a dynamic threshold based on signal coherence. This allows the system to automatically select the more suitable processing path (V-TriD or energy detection) for the given conditions without manual intervention. The computational efficiency of the proposed method is comparable to that of a traditional single-channel technique, as only one processing path is active at any given moment. This characteristic makes the algorithm well suited for applications that require real-time detection capabilities.
(3)
The performance of the V-TriD-Dual method was evaluated through both simulation and sea trial analysis. Its effectiveness is rooted in an adaptive framework that leverages the V-TriD channel’s noise suppression capabilities in high-coherence scenarios while switching to the robust ED channel when coherence is low. This adaptability yields quantifiable performance gains across key metrics. Simulation results demonstrate that at an SNR of −18 dB, the detection probability (PD) increased by 57.8% over the ED method. Concurrently, the method provides superior false alarm suppression: its false alarm rate (PFA) was 0.040 at an SNR of −10 dB (a reduction of 0.861 and 0.239 relative to the ED and S-TriD methods, respectively) and reached zero by −5 dB, a level of reliability not matched by the competing detectors. The practical viability of this adaptive approach was subsequently confirmed through the analysis of the sea trial data.

Author Contributions

Conceptualization, W.Z. and Y.C.; Data curation, Q.B. and Y.L. (Yuyao Liu); Formal analysis, Y.L. (Yan Liang); Funding acquisition, Y.C.; Investigation, Y.C.; Methodology, W.Z.; Project administration, Z.M.; Resources, W.Z. and Y.L. (Yan Liang); Software, Q.B.; Supervision, Z.M.; Validation, W.Z. and Y.L. (Yuyao Liu); Visualization, W.Z., Y.L. (Yuyao Liu), and Y.L. (Yan Liang); Writing—original draft, W.Z.; Writing—review and editing, Q.B. and Z.M. All authors have read and agreed to the published version of the manuscript.

Funding

This research was funded by the Independent Scientific Research Foundation of the National University of Defense Technology, grant number 24-ZZCX-JDZ-46.

Data Availability Statement

The data presented in this study are available on request from the corresponding author.

Conflicts of Interest

The authors declare no conflicts of interest.

Abbreviations

The following abbreviations are used in this manuscript:
DOADirection of Arrival
SNRSignal-to-Noise Ratio
EDEnergy Spectrum Detection
S-TriDScalar Cross-Trispectrum Diagonal Slice Detection
V-TriDVector Cross-Trispectrum Diagonal Slice Detection
V-TriD-SingleVector Cross-Trispectrum Diagonal Slice Single-Channel Detection
V-TriD-DualVector Cross-Trispectrum Diagonal Slice Dual-Channel Detection
CIConfidence Interval

References

  1. Luo, J.; Han, Y.; Fan, L. Underwater Acoustic Target Tracking: A Review. Sensors 2018, 18, 112. [Google Scholar] [CrossRef]
  2. Sahoo, S.; Mohanta, R.K.; Pani, P.P.; Mohapatra, S.K.; Chakravarty, S. A Multi-Faceted Approach for Underwater Sonar Rock vs Mine Classification Using Machine Techniques. In Proceedings of the 2024 1st International Conference on Cognitive, Green and Ubiquitous Computing (IC-CGU), Bhubaneswar, India, 1–2 March 2024; pp. 1–5. [Google Scholar]
  3. Jin, A.; Zeng, X. A Novel Deep Learning Method for Underwater Target Recognition Based on Res-Dense Convolutional Neural Network with Attention Mechanism. JMSE 2023, 11, 69. [Google Scholar] [CrossRef]
  4. Ji, Y.; Xie, L.; Xu, G.; Zhu, Z.; Gu, Y.; Fei, J.; Li, Y.; Chen, Y.; Cai, K. Sonar image denoising based on Noise2Void self-supervised learning. Remote Sens. Lett. 2025, 16, 560–571. [Google Scholar] [CrossRef]
  5. Yu, T.; Xie, Y.; Luo, J.; Zhu, W.; Liu, J. Research on underwater disease target detection method of inland waterway based on deep learning. Sci. Rep. 2025, 15, 14072. [Google Scholar] [CrossRef] [PubMed]
  6. Dong, H.; Ma, S.; Suo, J.; Zhu, Z. Matched Stochastic Resonance Enhanced Underwater Passive Sonar Detection under Non-Gaussian Impulsive Background Noise. Sensors 2024, 24, 2943. [Google Scholar] [CrossRef] [PubMed]
  7. Mendel, J.M. Tutorial on higher-order statistics (spectra) in signal processing and system theory: Theoretical results and some applications. Proc. IEEE 1991, 79, 278–305. [Google Scholar] [CrossRef]
  8. Petropulu, A.P. Higher-Order Spectral Analysis; CRC Press: Boca Raton, FL, USA, 1999. [Google Scholar]
  9. Li, Z.; Cheng, Y.; Qiu, J. Adaptive Line Enhancer for Passive Sonars Based on Frequency-Domain Sparsity, Shannon Entropy Criterion and Mixed-Weighted Error. Arab. J. Sci. Eng. 2025, 50, 5899–5920. [Google Scholar] [CrossRef]
  10. Tufts, D.W.; Griffiths, L.J.; Widrow, B.; Glover, J.; McCool, J.; Treichler, J. Adaptive line enhancement and spectrum analysis. Proc. IEEE 1977, 65, 169–173. [Google Scholar] [CrossRef]
  11. Widrow, B.; Glover, J.R.; McCool, J.M.; Kaunitz, J.; Williams, C.S.; Hearn, R.H.; Zeidler, J.R.; Eugene, D., Jr.; Goodlin, R.C. Adaptive noise cancelling: Principles and applications. Proc. IEEE 1975, 63, 1692–1716. [Google Scholar] [CrossRef]
  12. Kazemi, R.; Farsi, A.; Ghaed, M.H.; Karimi-Ghartemani, M. Detection and extraction of periodic noises in audio and biomedical signals using Kalman filter. Signal Process. 2008, 88, 2114–2121. [Google Scholar] [CrossRef]
  13. Zhang, J.; Li, Y.; Ali, W.; Liu, L. Line Spectrum Enhancement of Underwater Acoustic Signals Using Kalman Filter. J. Mar. Sci. Appl. 2020, 19, 148–154. [Google Scholar] [CrossRef]
  14. Zhao, Z.; Li, Q.; Xia, Z.; Shang, D. A Single-Hydrophone Coherent-Processing Method for Line-Spectrum Enhancement. Remote Sens. 2023, 15, 659. [Google Scholar] [CrossRef]
  15. Li, G.; Liu, F.; Yang, H. A new detection model of ship-radiated noise signal. Ocean. Eng. 2024, 297, 117081. [Google Scholar] [CrossRef]
  16. Li, H.; Liu, Y.; Ye, Z.; Zhang, Q.; Yang, S.; Xu, M. Underwater target detection using hybrid carbon nanotube self-adhesive sensors. Device 2024, 2, 100223. [Google Scholar] [CrossRef]
  17. Santos, P.; Felisberto, P.; Jesus, S.M. Vector Sensor Arrays in Underwater Acoustic Applications. In Emerging Trends in Technological Innovation; Camarinha-Matos, L.M., Pereira, P., Ribeiro, L., Eds.; IFIP Advances in Information and Communication Technology; Springer: Berlin/Heidelberg, Germany, 2010; Volume 314, pp. 316–323. ISBN 978-3-642-11627-8. [Google Scholar]
  18. Nehorai, A.; Paldi, E. Acoustic vector-sensor array processing. IEEE Trans. Signal Process. 1994, 42, 2481–2491. [Google Scholar] [CrossRef]
  19. Dahl, P.H.; Dall’Osto, D.R. Range-Dependent Inversion for Seabed Parameters Using Vector Acoustic Measurements of Underwater Ship Noise. IEEE J. Oceanic Eng. 2022, 47, 680–689. [Google Scholar] [CrossRef]
  20. Dahl, P.H.; Dall’Osto, D.R. Vector Acoustic Analysis of Time-Separated Modal Arrivals From Explosive Sound Sources During the 2017 Seabed Characterization Experiment. IEEE J. Oceanic Eng. 2020, 45, 131–143. [Google Scholar] [CrossRef]
  21. Dahl, P.H.; Bonnel, J. Vector acoustic and polarization properties of underwater ship noise. J. Acoust. Soc. Am. 2022, 151, 3818–3827. [Google Scholar] [CrossRef] [PubMed]
  22. D’Spain, G.L.; Luby, J.C.; Wilson, G.R.; Gramann, R.A. Vector sensors and vector sensor line arrays: Comments on optimal array gain and detection. J. Acoust. Soc. Am. 2006, 120, 171–185. [Google Scholar] [CrossRef]
  23. Li, H.; Wang, T.; Guo, X.; Su, L.; Mo, Y. Application research on vector coherent frequency-domain batch adaptive line enhancement in deep water. IET Radar Sonar Navi. 2024, 18, 1859–1873. [Google Scholar] [CrossRef]
  24. Nikias, C.L.; Raghuveer, M.R. Bispectrum estimation: A digital signal processing framework. Proc. IEEE 1987, 75, 869–891. [Google Scholar] [CrossRef]
  25. Fan, Y.; Shang, J.; Sun, J.; Li, P.; Xu, J. Feature extraction of ship-radiated noise using higher-order spectrum. Chin. J. Acoust. 2000, 24, 159–165. [Google Scholar] [CrossRef]
  26. Jiang, H.; Xia, Y.; Wang, X. Rolling bearing fault detection using an adaptive lifting multiwavelet packet with a 1 1 2 dimension spectrum. Meas. Sci. Technol. 2013, 24, 125002. [Google Scholar] [CrossRef]
  27. Shen, X.; Bao, M.; Chen, Z.; Zhao, J.; Gao, Y. Fourth-Order Cumulant-Based Acoustic Imaging via Small-Aperture Acoustic Vector-Sensor Array. IEEE Trans. Instrum. Meas. 2024, 73, 1–12. [Google Scholar] [CrossRef]
  28. Hinich, M.J.; Marandino, D.; Sullivan, E.J. Bispectrum of Ship-Radiated Noise. J. Acoust. Soc. Am. 1988, 85, 127. [Google Scholar] [CrossRef]
  29. Bian, J.; Chang, Q.H.; Jing, J.Y. Fault Feature Detection of Rolling Bearing Based on LMD and Third-Order Cumulant Diagonal Slice Spectrum. AMM 2016, 851, 333–339. [Google Scholar] [CrossRef]
  30. Fan, Y.; Tao, B.; Xiong, K. A study of information included in FOC of harmonic signal. J. Astronaut. 2002, 23, 46–50. [Google Scholar]
  31. Bao, Z.; Gong, S.; Wu, Z.; Li, J. Line spectrum extraction of harmonic signals by using fourth-order cumulant slice spectrum. J. Nav. Univ. Eng. 2010, 53, 31–34. [Google Scholar]
  32. Chen, H.; Zhang, J.; Jiang, B.; Cui, X.; Zhou, R.; Zhang, Y. Multi-source underwater DOA estimation using PSO-BP neural network based on high-order cumulant optimization. China Commun. 2023, 20, 212–229. [Google Scholar] [CrossRef]
  33. Xing, C.; Dong, S.; Wan, Z. Direction-of-Arrival Estimation Based on Sparse Representation of Fourth-Order Cumulants. IEEE Access 2023, 11, 128736–128744. [Google Scholar] [CrossRef]
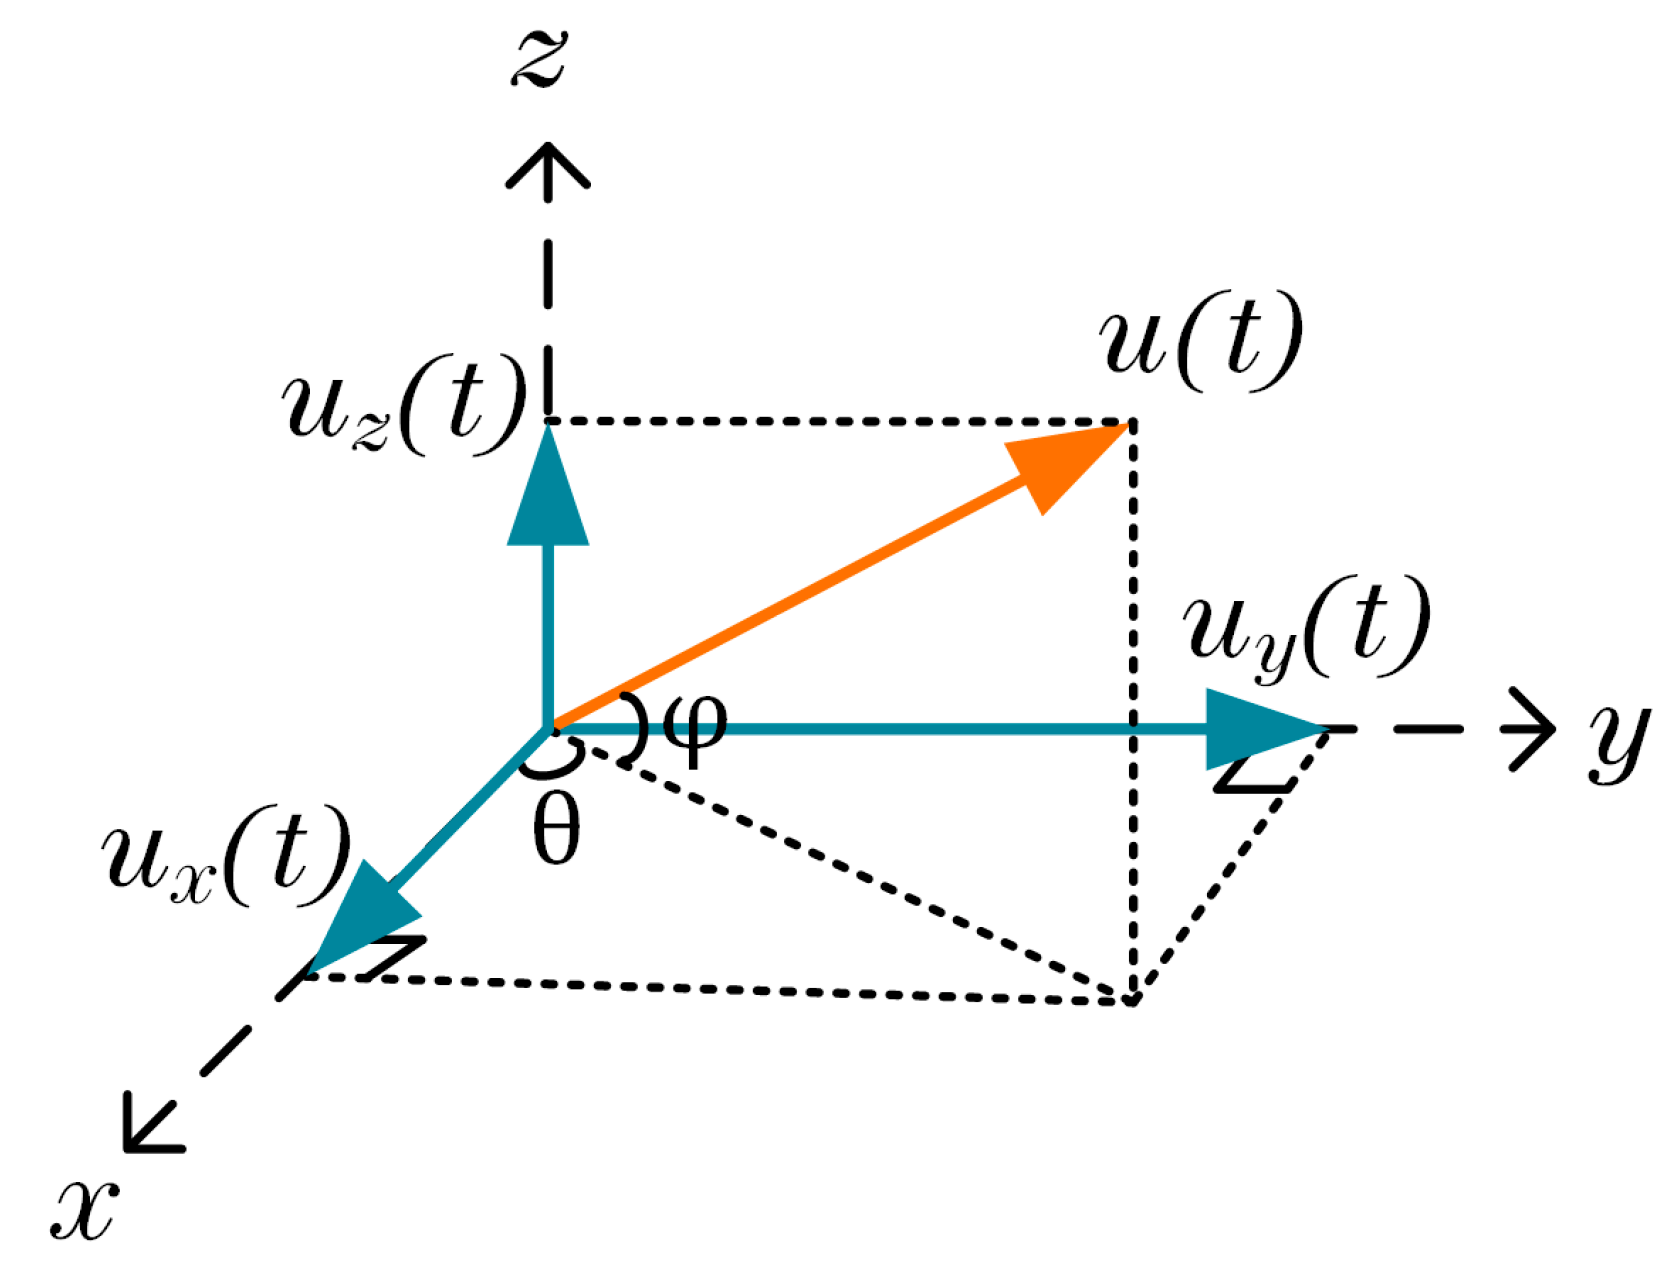
Figure 1. Schematic diagram of the particle velocity vector model.
Jmse 13 01628 g001
Figure 2. Results of the adaptive Gaussian smoothing algorithm.
Jmse 13 01628 g002
Figure 3. Flowchart of automatic line spectrum detection.
Jmse 13 01628 g003
Figure 4. Schematic of adaptive local thresholding.
Jmse 13 01628 g004
Figure 5. Flowchart of the target detection algorithm.
Jmse 13 01628 g005
Figure 6. Simulated deep-sea sound speed profile and seabed parameters.
Jmse 13 01628 g006
Figure 7. Transmission loss at a source frequency of f = 100 Hz.
Jmse 13 01628 g007
Figure 8. Noise-free simulated vector acoustic signal. (a) Time-domain plots and (b) frequency spectra for the four channels: pressure ( p ), and particle velocity components ( v x , v y , v z ).
Jmse 13 01628 g008
Figure 9. LOFAR, S-triD, and V-triD spectra of energy-normalized received signals at different signal-to-noise ratios (SNRs). (ad) LOFAR spectra at SNRs of −15 dB, −10 dB, −5 dB, and 0 dB, respectively; (eh) S-triD spectra at SNRs of −15 dB, −10 dB, −5 dB, and 0 dB, respectively; (il) V-triD spectra at SNRs of −15 dB, −10 dB, −5 dB, and 0 dB, respectively.
Jmse 13 01628 g009
Figure 10. Frequency-domain average energy distribution of normalized LOFAR, S-triD, and V-triD spectra at different signal-to-noise ratios (SNRs). (a) Superimposed spectra at SNR = −15 dB; (b) Superimposed spectra at SNR = −10 dB; (c) Superimposed spectra at SNR = −5 dB; (d) Superimposed spectra at SNR = 0 dB.
Jmse 13 01628 g010
Figure 11. Results from 1000 Monte Carlo simulations for different detection methods: (a,d) detection probability; (b,e) effective detection rate of target line spectra; (c,f) false alarm probability. The results in (df) are shown with their 95% confidence intervals.
Jmse 13 01628 g011
Figure 12. Comparison of dual-channel and single-channel detection methods based on the diagonal slice of vector cross-higher-order spectra: (a) detection probability; (b) effective detection rate of target line spectra; (c) false alarm probability.
Jmse 13 01628 g012
Figure 13. Variation in the decision threshold parameter for the adaptive dual-channel detector as a function of SNR during Monte Carlo simulations.
Jmse 13 01628 g013
Figure 14. Spatial configuration of the sound source and the receiving array during the sea trial.
Jmse 13 01628 g014
Figure 15. Time-domain plots and frequency spectra of the sound pressure and particle velocity signals from the four channels of the vector hydrophone. (a,c,d,e) show the time-domain waveforms of the received signals from individual channels of the vector hydrophone, respectively; (b,f,g,h) display the corresponding frequency spectra of the received signals from each channel, respectively.
Jmse 13 01628 g015
Figure 16. The energy squared coherence function of the received signal and the relevant parameter values for the decision condition of the adaptive detector.
Jmse 13 01628 g016
Figure 17. Target frequency detection results using different methods, shown in three rows. Top row (ac): LOFAR, S-TriD, and V-TriD spectra. Middle row (df): Frequency-domain average energy distributions of the corresponding normalized spectra. Bottom row (gi): Autonomous line spectrum detection results based on energy, S-TriD, and V-TriD.
Jmse 13 01628 g017
Figure 18. Comparison of SNR gain for different detection algorithms: (a) with energy alignment at 107 Hz; (b) after energy alignment at 170 Hz.
Jmse 13 01628 g018
Figure 19. Computational cost comparison: ED vs. S-TriD.
Jmse 13 01628 g019
Table 1. Simulation parameter settings.
ParameterValue
Water depth4300 m
Source depth100 m
Source frequency (tonal)95 Hz, 132 Hz
Source frequency (broadband)1–512 Hz
Signal duration10 s
Sampling rate1024 Hz
Number of elements1
Receiver depth4000 m
Horizontal range5000 m
Table 2. Detection probabilities ( P D ) for different detection methods at given signal-to-noise ratios (SNRs).
SNR (dB)EDS-TriDV-TriD-SingleV-TriD-Dual
−300.0910.1120.1160.217
−250.1590.1810.1780.335
−200.3310.3850.5280.693
−180.5870.6000.8110.926
−160.8340.8440.9620.988
−140.9750.9770.9991
−101111
Table 3. False alarm probabilities ( P F A ) for different detection methods at given signal-to-noise ratios (SNRs).
SNR (dB)EDS-TriDV-TriD-SingleV-TriD-Dual
−181111
−1610. 9970.9950.997
−140.9980.9550.8680.858
−120.9830.7540.3760.365
−100.9010.2790.0390.040
−50.2460.00100
00.011000
Table 4. Runtime benchmarks.
ParameterValue
Programming LanguageMATLAB 2024a
CPUIntel(R) Core(TM) i5-10210U
Core Utilization Count1
Memory32 GB
Operating SystemWindows10
Mean Computation Time (ED)1.1917 × 10⁻⁵ s
Mean Computation Time (S-TriD)8.5358 × 10⁻⁵ s
Variance of Computation Time (ED)1.3327 × 10⁻¹¹ s2
Variance of Computation Time (S-TriD)4.7248 × 10⁻¹⁰ s2
Standard Deviation of Computation Time (ED)3.6506 × 10⁻⁶ s
Standard Deviation of Computation Time (S-TriD)2.1737 × 10⁻⁵ s
Disclaimer/Publisher’s Note: The statements, opinions and data contained in all publications are solely those of the individual author(s) and contributor(s) and not of MDPI and/or the editor(s). MDPI and/or the editor(s) disclaim responsibility for any injury to people or property resulting from any ideas, methods, instructions or products referred to in the content.