Article

GPSFlow/Hydrate: A New Numerical Simulator for Modeling Subsurface Multicomponent and Multiphase Flow Behavior of Hydrate-Bearing Geologic Systems

1
College of Life Science and Technology, Jinan University, Guangzhou 510632, China
2
Institute of Groundwater and Earth Science, Jinan University, Guangzhou 510632, China
3
Energy Geosciences Division, Lawrence Berkeley National Laboratory, 1 Cyclotron Road, Berkeley, CA 94720, USA
*
Author to whom correspondence should be addressed.
J. Mar. Sci. Eng. 2025, 13(9), 1622; https://doi.org/10.3390/jmse13091622
Submission received: 18 July 2025 / Revised: 21 August 2025 / Accepted: 22 August 2025 / Published: 25 August 2025
(This article belongs to the Section Geological Oceanography)

Abstract

Numerical simulation has played a crucial role in modeling the behavior of natural gas hydrate (NGH). However, the existing numerical simulators worldwide have exhibited limitations in functionality, convergence, and computational efficiency. In this study, we present a novel numerical simulator, GPSFlow/Hydrate, for modeling the behavior of hydrate-bearing geologic systems and for addressing the limitations in the existing simulators. It is capable of simulating multiphase and multicomponent flow in hydrate-bearing subsurface reservoirs under ambient conditions. The simulator incorporates multiple mass components, various phases, as well as heat transfer, and sand is treated as an independent non-Newtonian flow and modeled as a Bingham fluid. The CH4 or binary/ternary gas hydrate dissociation or formation, phase changes, and corresponding thermal effects are fully accounted for, as well as various hydrate formation and dissociation mechanisms, such as depressurization, thermal stimulation, and sand flow behavior. In terms of computation, the simulator utilizes a domain decomposition technology to achieve hybrid parallel computing through the use of distributed memory and shared memory. The verification of the GPSFlow/Hydrate simulator are evaluated through two 1D simulation cases, a sand flow simulation case, and five 3D gas production cases. A comparison of the 1D cases with various numerical simulators demonstrated the reliability of GPSFlow/Hydrate, while its application in modeling the sand flow further highlighted its capability to address the challenges of gas hydrate exploitation and its potential for broader practical use. Several successful 3D gas hydrate reservoir simulation cases, based on parameters from the Shenhu region of the South China Sea, revealed the correlation of initial hydrate saturation and reservoir condition with hydrate decomposition and gas production performance. Furthermore, multithread parallel computing achieved a 2–4-fold increase in efficiency over single-thread approaches, ensuring accurate solutions for complex physical processes and large-scale grids. Overall, the development of GPSFlow/Hydrate constitutes a significant scientific contribution to understanding gas hydrate formation and decomposition mechanisms, as well as to advancing multicomponent flow migration modeling and gas hydrate resource development.

1. Introduction

Natural gas hydrate (NGH) is considered to be a highly prospective source of energy from fossil fuels for the future. It is estimated that the NGH reserves in shallow marine and permafrost areas are at least twice the total carbon content of all proven fossil fuel resources. NGH is distributed globally, with 99% of it being located offshore, making it a viable option for meeting the growing global energy demand [1]. NGH is an ice-like compound formed by water and hydrocarbon gas molecules under strict high-pressure and low-temperature conditions [1,2,3]. To date, the United States, Canada, Japan, and Russia have successfully conducted trial production of gas hydrate using conventional recovery techniques, such as thermal stimulation, depressurization, and inhibitor injection [4]. China has conducted two offshore natural gas hydrate production trials in the Shenhu area of the South China Sea. The first trial, in 2017, used vertical-well depressurization and produced about 3 × 10⁵ m3 of gas in 60 days, while the second, in 2020, employed horizontal wells and advanced sand-control technologies, yielding about 8.61 × 10⁵ m3 in 30 days with significantly higher daily output [5].
However, the conventional NGH extraction methods may lead to sand production issues. For instance, sand production accompanying gas and water extraction was reported during the hydrate production trials conducted at the Mallik site in Canada [6] and on the North Slope of Alaska, USA [7]. In Japan, excessive amounts of sand migration into drilled wells caused pump blockage and reduced pumping efficiency during trials in 2007 and 2013 [8]. China also reported sand production from weakly cemented hydrate-bearing sediments in the Shenhu sea area [9]. Sand production has both beneficial and detrimental effects on gas hydrate exploitation. It can increase near-wellbore permeability, which may enhance gas production efficiency [6]. At the same time, the presence of sand grains can compromise formation stability and block the production well, potentially leading to premature termination of gas recovery [10].
The guest molecule exchange method, initially proposed by Ebinuma [11] and validated by Ogaki et al. [12], offers a promising strategy to maintain structural stability and to mitigate sand production, as mentioned above. The principle of this method is to produce gas from NGHs by substituting the original guest molecules in the hydrate lattice with other molecules, typically CO2 or other suitable gases. The exchange process occurs spontaneously because the guest molecule of CO2 is more thermodynamically stable than methane under reservoir conditions [13]. In this way, CH4 exploitation and CO2 sequestration can be achieved simultaneously. Recently, several laboratory experiments have been conducted to test the viability of this approach. Park et al. [14] proposed an improved approach that involves injecting a binary gas mixture of CO2 and N2, which increases CH4 recovery efficiency compared to the use of single CO2. Ahn et al. [15] demonstrated a feasible mechanism that utilizes air and CO2. Additionally, the Iġnik Sikumi field experiment was conducted to assess the viability of CO2–CH4 exchange in the Alaska North Slope permafrost area in the United States [7]. While previous experiments have indicated that the process of guest molecule exchange may be less efficient compared to other recovery technologies, it remains a viable option due to its economic and ecological considerations in the future.
Numerical simulators have played a vital role in modeling the behavior of natural gas hydrates, as it offers a cost-effective alternative to field tests and laboratory experiments, and also eliminates the limitations posed by time and space. Currently, there are only a few relatively mature numerical simulators available. MH-21 HYDRATES, developed by the Advanced Industrial Science and Technology (AIST) in Japan, was used to predict the gas productivity of methane hydrate (CH4-hydrate) reservoirs in the Eastern Nankai trough [16]. The Pacific Northwest National Laboratory (PNNL) in the United States developed the STOMP program to simulate subsurface transport over multiple phases, and its sub-series program, STOMP-HYDT-KE, includes guest molecule exchange while fulfilling basic hydrate simulation requirements [17,18]. The Qingdao Institute of Marine Geology presented a thermal-hydrodynamic-mechanical–chemical coupled model QIMGHyd-THMC to simulate the fluid flow and the geomechanical behavior of hydrate-bearing sediments [19]. The Lawrence Berkeley National Laboratory (LBNL) has developed several versions of simulators, including EOSHYDR, HydrateResSim, TOUGH-Fx/Hydrate, and TOUGH + Hydrate. In 2008, an international team compared the existing hydrate simulators and found their results largely consistent [20]. Since then, most advances have focused on improving these simulators rather than developing new ones. Between 2017 and 2018, the second International Gas Hydrate Code Comparison Study (IGHCCS2) involved 55 researchers from 25 groups in five countries, showing that all participating simulators had made progress. Appendix A.1 lists a summary of the Institutes, Teams, and Simulators participating in IGHCCS2 [21].
The existing numerical simulators still have some unavoidable limitations in characterizing hydrate-bearing geologic systems. For example, CMG-STARS (2002), which implements the simulation of hydrates, may be inadequate, as the software was originally designed for black oil [22]. MH-21 HYDRATES and STOMP-HYDT-KE have some regional limitations and deficiencies in parallel computing. The QIMGHyd-THMC simulator does not account for gas dissolution and lacks a component model, instead only incorporating a kinetic model for hydrate decomposition [23]. HydrateBiot and TOUGH + Hydrate with FLAC 3D/Millstone evaluated reservoir stability and studied sand production by coupling with geomechanical models [21,24,25]. These studies account for a comprehensive range of influencing factors and describe sand behavior via mechanical coupling, but none explicitly address the sand flow process. Loret [26] categorized the eroded grains into two phases: suspended grains entrained in the fluid phase and transported with the flow, and settled grains in a static or precipitated state. He further proposed that these two phases are dynamically interchangeable as hydrate dissociation and fluid flow evolve. However, it remained at the theoretical level and was not implemented in practical numerical simulations. Song et al. [27] also suggested that, during hydrate exploitation, the liquid and solid phases can be treated as a unified continuum, assuming that only gas–liquid flow occurs in both porous media and production pipelines. Although this assumption simplified model development, it risked obscuring the distinct flow behaviors inherent to each phase in multiphase systems. Consequently, there has been limited research explicitly addressing the transport behavior of sand as an independent phase and component.
This study introduces GPSFlow/Hydrate, a novel simulator designed to model multicomponent, multiphase subsurface flows in hydrate-bearing formations. We highlight its mathematical and numerical frameworks, thermodynamic models used to determine gas hydrate formation and dissociation conditions, as well as the sand migration model. To validate the accuracy of the GPSFlow/Hydrate simulator, two one-dimensional (1D) benchmark problem cases are conducted and compared to numerical simulation results from the established simulators. Furthermore, the GPSFlow/Hydrate simulator is applied to a simple sand flow model, and three-dimensional (3D) cases with varying geological parameters and initial conditions based on laboratory experiments and inversion modeling results. Finally, we assess parameter sensitivities, computational efficiency, and convergence, providing insights into both the simulator’s capabilities and the fundamental processes governing NGH production.

2. GPSFlow/Hydrate Simulator

2.1. GPSFlow Software

The Natural Gas Hydrate Simulator, GPSFlow/Hydrate, is a derivative of the GPSFlow simulator, a hybrid parallel computing general purpose subsurface flow simulator. The software was developed using the object-oriented programming language C++ within Visual Studio 2019. The GPSFlow simulator currently incorporates eight equation-of-state modules, namely NCG, SoilGas, CO2, AirH2O, NoGas, BlackOil, Composition, and Hydrate, to model multidimensional, isothermal or non-isothermal, multicomponent, and multiphase fluid and fluid mixtures in porous and fractured media. The simulator is equipped with the capability to generate grids on a massive scale, and has demonstrated its efficacy through successful simulations. Accounting for solving linear equations, GPSFlow has an interface for calling the most well-known linear solvers, including AMGCL, FASP, HYPRE, PETSC, TRILINOS, ViennaCL, AMGX, and rocALUTION, among others. The hybrid parallel computing capability of the simulator is achieved through domain decomposition technology, combining Message Passing Interface (MPI, distributed memory) and Open Multi-Processing (OpenMP, for shared memory) parallelism, along with support for multiple GPU computing [28]. The GPSFlow/Hydrate simulator inherits all the advanced concepts and technologies from GPSFlow [29].

2.2. Mathematical Model

2.2.1. Governing Equations

Figure 1 shows the cross-sectional diagram [27] and continuum hypothesis of the hydrate-bearing sediments in porous media. GPSFlow/Hydrate is capable of simulating up to eight mass components ( i ) and heat ( θ ), including water, four gases (CH4, CO2, N2, and an additional gas as required), hydrates in kinetic conditions, water-soluble inhibitors, and sand. These mass components are partitioned into six possible phases ( β ), including gas, aqueous, liquid carbon dioxide, hydrate, ice, and non-Newtonian fluid, and only hydrate and ice phase are immobile.
The change of mass and energy within each grid is equal to the difference between the inflow and outflow of mass and energy. Mass conservation for each component is described as follows:
t β ϕ S β ρ β X   β i =   β ρ β X β   i V β + β X β   i q β
where ϕ is the porosity, S β is the saturation of phase β , ρ β is the density of phase β measured in kg/m3, X β   i is the mass fraction of component i in phase β , q β is the sink/source term of phase β in kg/(m3·s), and V β is the Darcy’s velocity of phase β in m/s, which is described by Equation (2):
V β   =   k k r β μ β P β     ρ β g Z
where μ β is the viscosity of phase β in Pa·s, P β is the pressure of phase β in Pa, k is the intrinsic permeability of rock grains in m2, k r β is the relative permeability of phase β . g is the gravitational acceleration vector in m/s2, and Z is depth, m.
The conservation of energy considers not only the heat from all phases and rock grains, but the conduction, advection, and heat Qh resulting from hydrate dissociation or formation. The equation is defined as follows:
t β ϕ S β ρ β U β   +   1     ϕ ρ R C R T + Q h =   · λ T + β h β ρ β V β + q θ
where U β and H β denote the internal energy and specific enthalpy of phase β in J/kg, and the relationship between the two is U β   =   H β     P / ρ β , ρ R is the density of rock in kg/m3, C R is the heat capacity of rock in J/(kg·K), T is the temperature in K, λ is the thermal conductivity in W/(m·K), and q θ is the sink and source of heat in J/(m3·s).

2.2.2. Sand Flow

An extensive number of field and laboratory experiments have demonstrated the occurrence of sand production through the migration of fine particles from hydrate-bearing sediments. Previous numerical simulation studies utilizing TOUGH + Hydrate coupled with FLAC3D, PFC3D, Biot [10], and Millstone [30], among others, have revealed the mechanisms of migration of sand production. However, the sand transport process which occurs during NGH exploitation has not been addressed.
The Bingham model is a widely adopted approach for describing the transient flow behavior of viscoplastic fluids, making it a popular choice in studies of viscous debris flow [31]. Similarly, experimental simulations by Wang et al. [32] demonstrated that tetrahydrofuran hydrate slurries with solid volume concentrations above critical thresholds exhibit Bingham fluid behavior. Nuland and Tande [33] also utilized the Bingham fluid model to simulate hydrate slurry flow, providing further support for this approach. Based on these insights, we assume that the sand flow in natural gas hydrate exploitation can be modeled as a Bingham fluid. The property of Bingham fluid can be described as Newtonian fluid by Equation (4):
τ   =   η d v d y   +   τ 0
where τ is the shear stress in Pa, η is the plastic viscosity in Pa·s, d v d y is the shear rate in s−1, and τ 0 is the yield stress in Pa. The flow of sand in hydrate-bearing geologic systems is contingent upon the relationship between pressure gradient P and threshold pressure gradient G as given by Equation (5):
P e   =   sgn P P     G     P > G 0             P G
where P e is the effective pressure gradient in Pa/m and G   =   α τ 0 / k k r in Pa/m, where α is empirical parameters. Therefore, the behavior of sand is consistent with Darcy’s law, as described by Equation (6), and its mass and energy conservation conform to the above governing equations as one of the components.
V = k k r μ b P e
where v is the Darcy velocity in m/s and μ b is the Bingham plastic viscosity coefficient in Pa·s.

2.2.3. Phase Equilibrium for Multiple Gas

The occurrence of gas hydrate formation and dissociation is governed by phase equilibrium conditions. The phase equilibrium diagram shown as Figure 2 encompasses the water–gas phase curve in the gas–aqueous–ice system and the phase curve of natural gas/gas mixtures in the gas–aqueous–hydrate/gas–liquid–aqueous–hydrate system. The phase transition of water is assumed to follow the melting/fusion equilibrium line of the water–ice system. The relationship between the equilibrium hydration pressure Pe and the corresponding equilibrium hydration temperature Te of the CH4-hydrate is obtained by three methods: (1) the regression equation from Kamath [34], (2) a general regression expression derived by Moridis [35], and (3) a user-defined phase equilibrium curve data interpolation obtained from laboratory and field experiments.
The thermodynamic models that exist for predicting the behavior of gas mixtures in hydrate form include the van der Waals–Platteeuw model, the Parrish–Prausnitz model, the Ng–Robinson model, the John–Holder model, and the Chen–Guo model [36], among others. Numerous laboratory experiments have validated the Chen–Guo model as a robust and highly accurate thermodynamic tool. Researchers have widely used it to evaluate the formation of pure and mixed gas hydrates and to predict hydrate conditions in porous media [37]. Thus, we implemented this model not only to determine the pressure or temperature conditions governing the formation of single or multicomponent gas hydrates but to calculate the mole fraction of each gas component within the hydrate at equilibrium. Figure 2 presents the pressure–temperature curve for carbon dioxide hydrate (CO2-hydrate) under phase equilibrium conditions. For temperatures below a certain threshold, T Q 2 C O 2 , the curve is relatively similar to those prediction tools, such as the CSMHyd simulator, the Chen–Guo model, and the Kamath model, among others. When the temperature is larger than T Q 2 C O 2 , the curve is established based on a regression equation derived from numerical modeling and laboratory experiments [38].

2.2.4. Thermophysical Properties of Gases

We determined the thermodynamic properties of CH4, N2, and vapor using real-gas properties, including density, fugacity, viscosity, specific enthalpy, internal energy, and compressibility of pure gases and gas mixtures. For this purpose, GPSFlow/Hydrate implemented three cubic equations of state (EOS): PR (Peng–Robinson), RK (Redlich–Kwong), and SRK (Soave–Redlich–Kwong). Although the computed real-gas properties of CO2 are less accurate compared with the NIST values [39], we ensure sufficient accuracy by batch downloading density, enthalpy, internal energy, viscosity, and thermal conductivity of CO2 from the NIST database and interpolating them at the specified pressure and temperature. We also obtained the saturation pressure line of CO2 from the NIST database, which was then used to determine its gas–liquid phase boundary. The properties of liquid water and ice rely on fast regression equations derived from NIST [40], covering enthalpy, sublimation pressure, and fusion/melting pressure. In addition, GPSFlow/Hydrate provides up to 9 models for capillary pressure and 18 models for relative permeability, including the Parker, Brooks–Corey, and van Genuchten models.

2.3. Numerical Design Approach

2.3.1. Equation of States and Primary Variables

The hydrate equation of state defines the thermodynamic state and the distribution of mass and energy components among the six possible phases. GPSFlow/Hydrate represents 13 thermodynamic states across the entire phase equilibrium diagram (Figure 2 above shows the pressure−temperature equilibrium relationship of the CH4–CO2 hydrate system and potential thermodynamic states), and it incorporates both equilibrium and kinetic hydrate reactions. Appendix A.2 lists the phase combinations along with their corresponding primary variables (PV). The total number of primary variables depends on the number of components, while the saturation constraint requires that the sum of all phases equals one. When simulating additional gases, users can directly add mass fractions or mole fractions after the fifth primary variable.
The primary variables between CH4-hydrate simulation and multicomponent gas hydrate simulations differ in the following ways: (1) the CH4-hydrate simulation adopts the gas–aqueous–ice–hydrate phase as the quadruple point, whereas multicomponent gas hydrate simulation models the quadruple point line, and (2) the CO2 phase state is determined from the saturation pressure–temperature relation of the chosen EOS. Currently, CO2 is treated as one of the gases for the sake of simplicity. The GPSFlow/Hydrate simulator can automatically select the appropriate phase combination and primary variables based on the module setup specified in the input file.

2.3.2. Space and Time Discretization

The conservation Equations (1) and (3) are discretized in space using the integral finite difference method, and the time discretization is carried out with a backward, first-order finite difference method. The accumulative terms on the left side of the conservation equations can be represented by M, and flow and other terms on the right side can be written by F and q. Thus, the conservation equations can be expressed as a set of first-order ordinary differential equations as follows:
M n   i V n t   = m A n m F n m   i + V n q n   i
where
M n   i = β ϕ S β ρ β X β i               f o r   m a s s β ϕ S β ρ β U β + 1     ϕ ρ R C R T + Q h    f o r   e n e r g y
F n m i = β X β   i k n m k r β ρ β μ β n m P β , n     P β , m D n m     ρ β , n m g           f o r   m a s s β h β k n m k r β ρ β μ β n m P β , n     P β , m D n m     ρ β , n m g           f o r   e n e r g y
In the above equations, i denotes either a mass component or an energy component in Equation (7), Vn is the volume of element n, Anm, knm, and Dnm are the common interface area, permeability, and distance between connected elements n and m, and the q term for energy includes the sink, source, and conduction heat.

2.3.3. Numerical Solutions

We developed three numerical solutions to solve the non-linear algebraic equations: (1) the fully implicit method (FIM), which simultaneously solves for pressure, saturation, and mass fraction to ensure stability and allow larger time steps; (2) the implicit pressure–explicit saturation (IMPES) method, which calculates pressure implicitly and determines saturation and mass fraction based on the pressure solution; (3) the adaptive implicit method (AIM), which switches between the FIM and the IMPES depending on the region to accelerate simulation and to reduce storage requirements. In the current version, both IMPES and AIM perform efficiently only for models with a limited number of components.
The residual form of Equation (7) of the widely used FIM method can be represented as follows:
R n i , k + 1   =   M n   i , k + 1     M n   i , k V n t     m A n m F n m   i , k + 1   V n q n   i , k + 1   =   0
where k and k+1 denote the previous time level and current time level, respectively. These equations are solved using the Newton/Raphson iteration implemented by Equation (11):
j R n i , k + 1 x j p x j , p + 1     x j , p = R n i , k + 1 x j , p
With the two convergence criteria (mass error and maximum change of primary variables) given by Equation (12):
R n , p + 1 i , k + 1 M n , p + 1   i , k + 1 ε 1   or   R n , p + 1 i , k + 1 ε 1 ε 2      P V   i < P V c r i t   i
where ε 1 and ε 2 are the relative and absolute convergence criterion, PV i is the i-th primary variable in an EOS, and P V c r i t   i is the convergence criterion of the i-th maximum primary variable change. As long as one of the two convergence criteria is reached, the solutions are obtained.

2.3.4. Solution of Linear Equations

For solving linear equations, GPSFlow incorporates an interface that integrates well-known third-party linear solver libraries, including AMGCL, FASP, HYPRE, PETSC, Trilinos, ViennaCL, AMGX, and rocALUTION. Among these, AMGCL is particularly distinguished for its effectiveness in solving large sparse linear systems derived from the discretization of partial differential equations on unstructured grids. AMGCL offers customizable data structures and operations, and it supports parallel computing across both shared and distributed memory systems. Engineered for high-performance parallel computing, AMGCL efficiently handles extensive algebraic equations within each computational time step. Currently, the AMGCL library is extensively utilized within the GPSFlow/Hydrate numerical simulator, demonstrating robust stability and high efficiency in both testing and practical applications [29].

2.3.5. Parallel Computing

Parallel computing techniques are an advanced solution to accurately and efficiently solve the large and complex calculations and to reduce the time required for model operations. The simulation process encompasses three primary time-consuming tasks, including assembling Jacobian matrices, solving linear equations, and performing EOS computations. The hybrid parallel computing capability of the simulator is realized through domain decomposition technology, which integrates MPI and OpenMP parallelism, and supports multiple GPU computing platforms [28]. Currently, the GPSFlow/Hydrate simulator utilizes multithread parallel processing via an OpenMP shared memory scheme. It leverages third-party linear solver libraries, such as AMGCL, for multithread OpenMP parallel computations, which is particularly advantageous for cyclic processes. To optimize efficiency, the assembly of Jacobian matrices and EOS computations are structured into larger cycles based on the number of model grids [29].

2.3.6. Workflow Path

The modeling workflow of the GPSFlow/Hydrate simulator is illustrated in Figure 3, and comprises the following three main steps:
  • Initialization: At the start of the simulation, default settings are applied, and input files containing various module configurations—such as rock properties, hydrate information, initial conditions, equation-solving parameters, and computing parameters—are read to initialize the flow system. The simulator is capable of generating computational grids and employs domain decomposition techniques to allocate grid elements and their connections to different computing units (CPUs/computing cores).
  • Time-Stepping Iteration: This step constitutes the core computational process of the simulator. It involves assembling and solving the Jacobian matrix, calculating secondary variables within the equation of state, and solving linear equations. These operations are iteratively performed to advance the simulation through discrete time steps.
  • Result Generation: Upon completion, at user defined times of the simulation, or reaching the maximum simulated time step, the simulator generates output files. These include log files, restart files, hydrate information, and user-defined files, which provide comprehensive data on the simulation outcomes.

3. Verifications: Comparison of Different Numerical Simulators

White et al. [21] evaluated the performance of various simulators within the IGHCCS2 by applying multiple benchmark problems (BPs). In this study, we selected two specific benchmark problems, BP3 and BP4, to assess and compare the simulation results produced by the GPSFlow/Hydrate numerical simulator.

3.1. Case 1: BP3—Depressurization and Thermal Stimulation

Benchmark problem 3 addresses the challenge of gas hydrate recovery using thermal stimulation and depressurization methods, excluding geomechanical considerations. The study focuses on a 1D radial grid model, as illustrated in Figure 4. The model’s outermost layer extends to a radius of 1000 m and has a thickness of 1 m. The domain is radially discretized into two distinct regions. Within the radius range of 0 to 20 m, a uniform grid spacing of 0.02 m is employed. Beyond 20 m, extending to 1000 m, the area is divided into 1000 grid cells with logarithmically distributed spacing.
The initial and boundary conditions of the model are illustrated in Figure 4. The model is initially configured to a state where liquid and hydrate solid phases coexist. At the center of the model resides a wellbore unit. In the depressurization method, fluid is extracted at a rate of 0.1 kg/s, while in the thermal stimulation method, heat is injected at a power of 150 J/s. The BP3 problem was simulated using ten numerical simulators from IGHCCS2 for two days, and the corresponding results are presented here for comparison. The reservoir properties and details are presented in Table 1.
Figure 5 and Figure 6 present the numerical simulation outcomes for both depressurization and heat injection-based natural gas hydrate dissociation in a 1D radial grid configuration. White et al. [21] identified the STOMP-HYDT-KE simulator as yielding the most reliable results. The figures indicate that the GPSFlow/Hydrate outcomes closely parallel those of STOMP-HYDT-KE, exhibiting consistent pressure and temperature distributions as well as hydrate saturation patterns comparable to the other simulators. This strong agreement highlights the reliability and accuracy of the GPSFlow/Hydrate simulator in modeling natural gas hydrate extraction processes.

3.2. Case 2: BP4—Depressurization of a Pure Liquid Phase

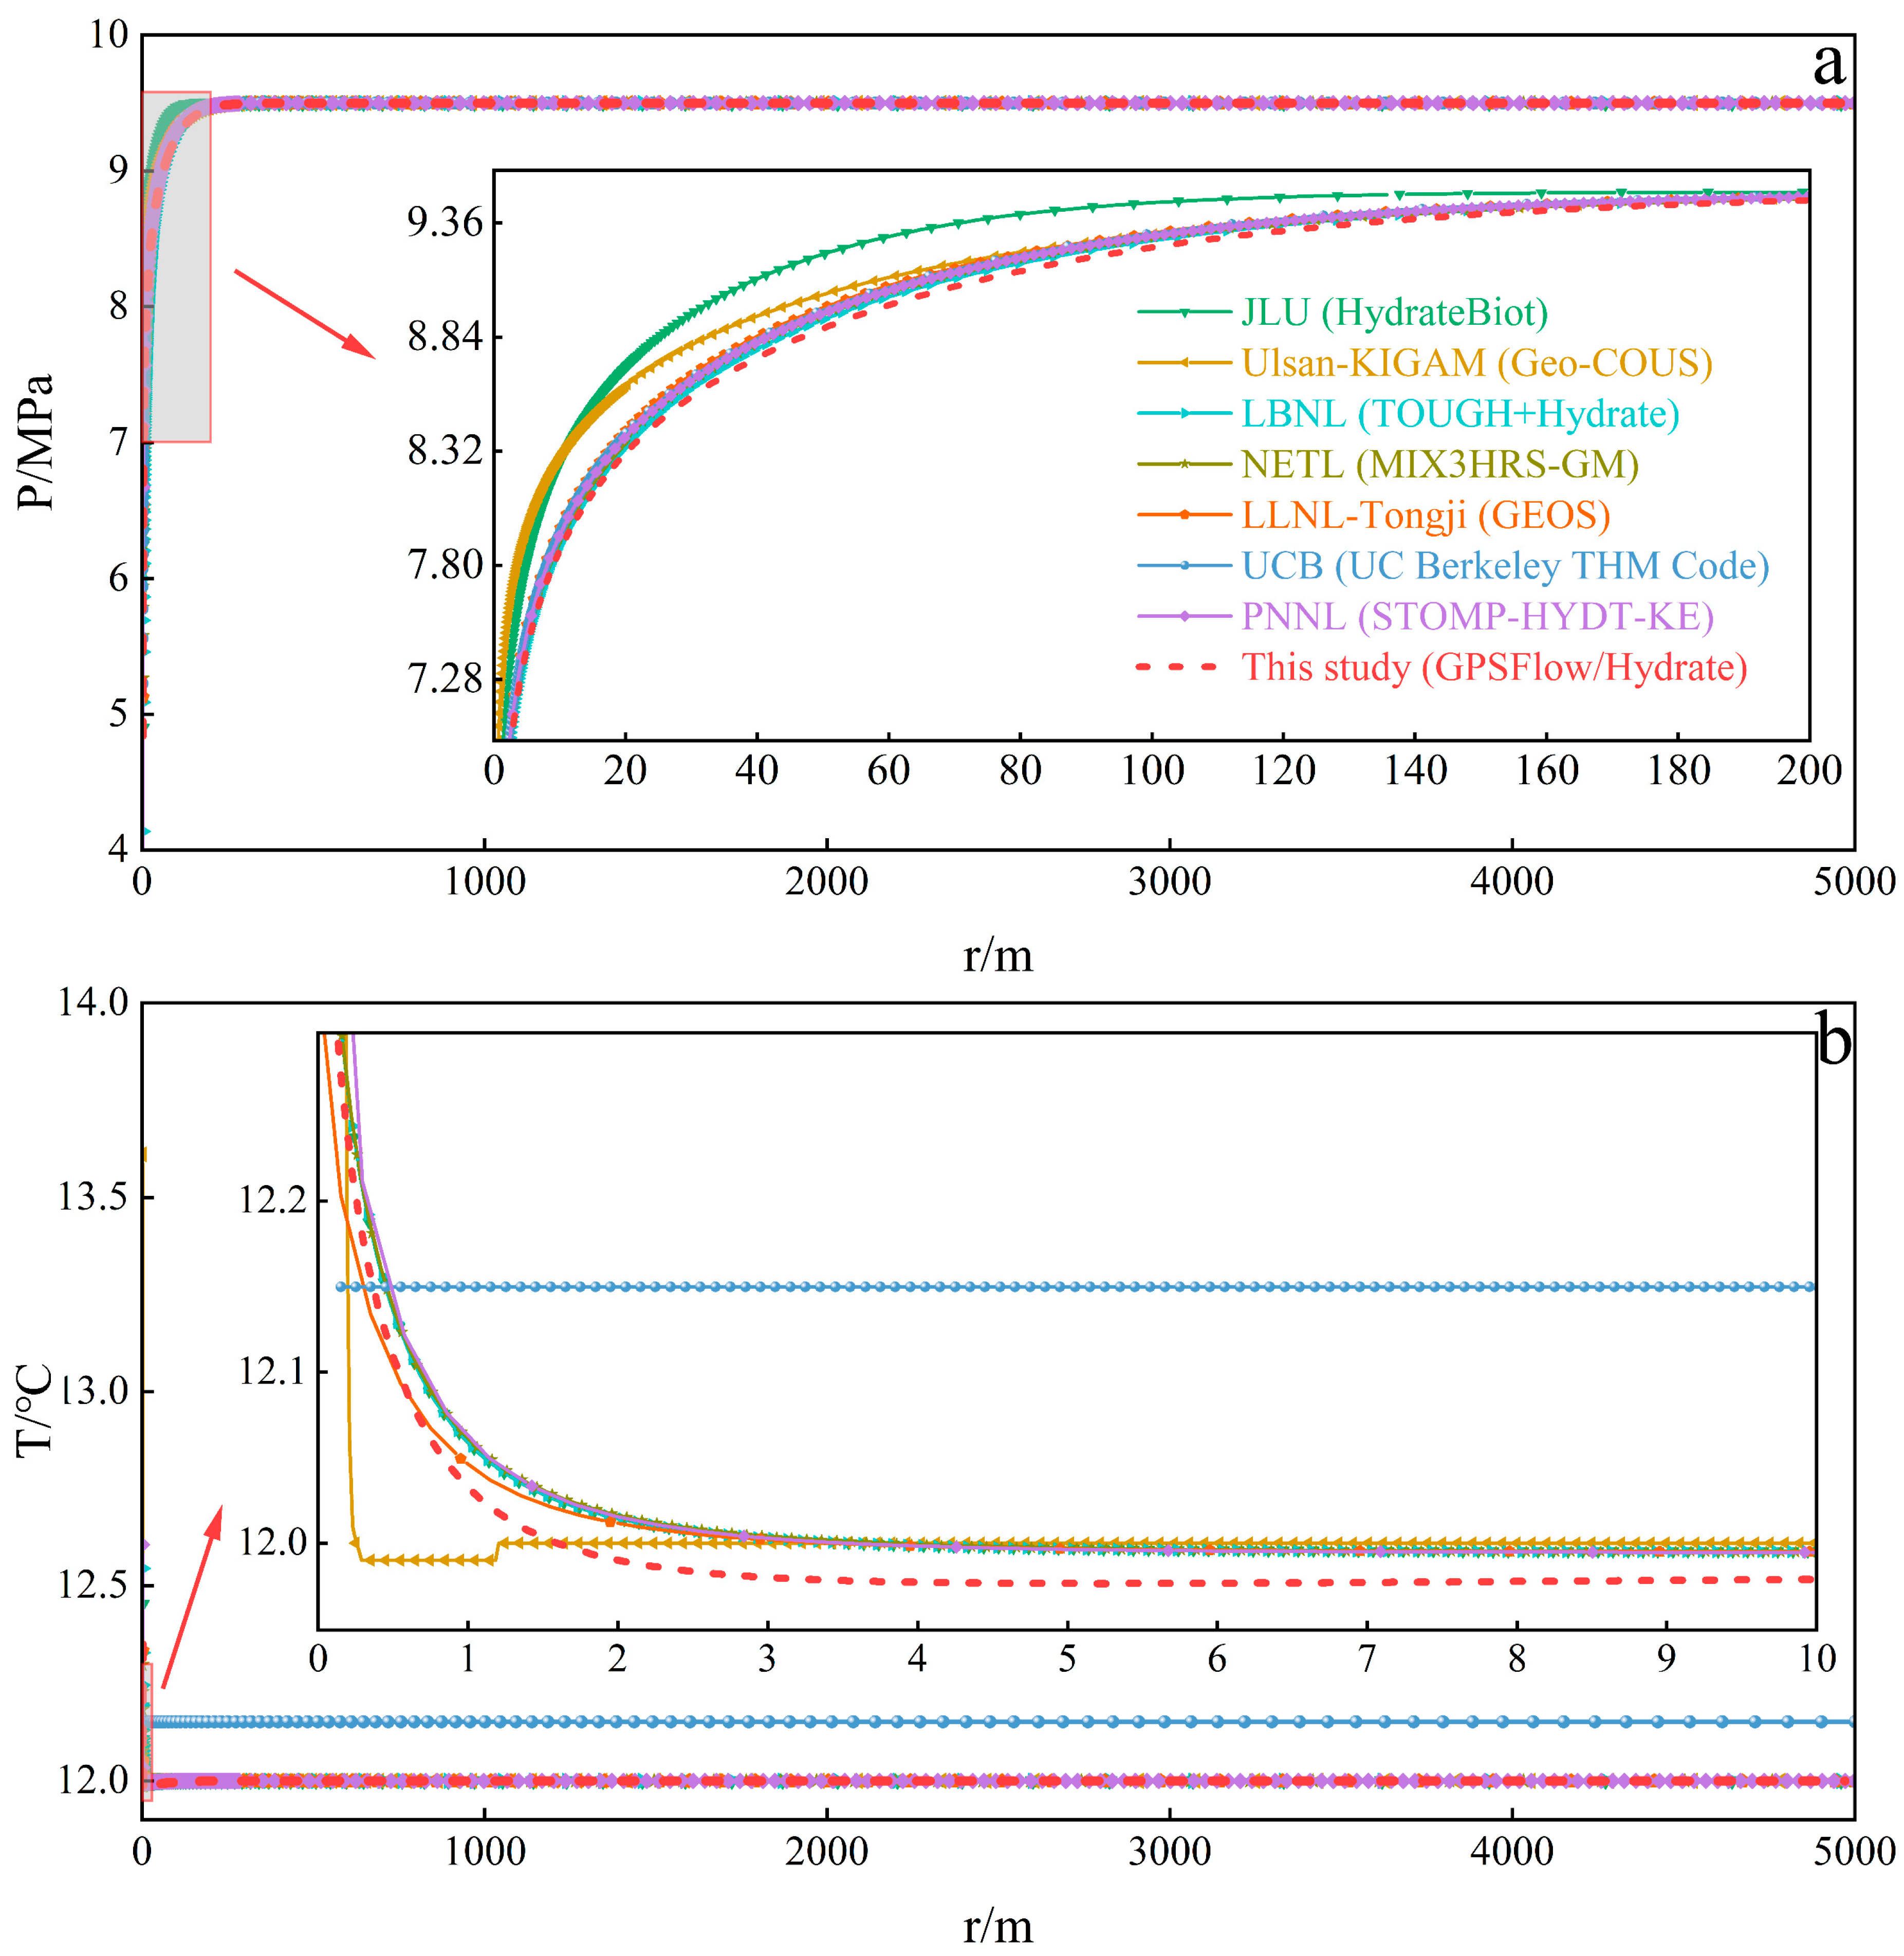
Benchmark problem 4 involves a depressurization simulation of a pure liquid phase in a one-dimensional radial grid, excluding the presence of hydrates. The model configuration for BP4 is illustrated in Figure 7, featuring an outermost radius of 5000 m and a thickness of 1 m. At the center of the model resides a wellbore element with a radius of 0.15 m. The radial domain is discretized into 999 grid elements with a uniform spacing of 0.02 m from the well to a radius of 20 m, and 500 grid elements with logarithmically distributed spacing from 20 m to 5000 m.
The initial and boundary conditions of the model are depicted in Figure 7. The model is initially configured to a state where the liquid phase coexists with the sand phase, with a sand saturation of 0.1 to facilitate calculations. The wellbore unit operates by pumping fluid at a rate of 1.0 kg/s. Due to limitations in the current model, the simulation process encounters convergence difficulties; therefore, the simulation was conducted for a duration of only one hour for comparative purposes. The test data for the seven numerical simulators coupled with geomechanical model are sourced from White et al. [21]. The reservoir parameters are outlined in Table 2.
Figure 8 presents the numerical simulation results for BP4. White et al. [21] determined that the TOUGH + Hydrate coupled Millstone simulator from LBNL yielded the most accurate results based on comprehensive code comparisons and result analyses. In Figure 8a, the GPSFlow/Hydrate numerical simulator demonstrates closer agreement with the TOUGH + Hydrate coupled Millstone results compared to most other simulators. Although the temperature distribution results shown in Figure 8b differ from those of the TOUGH + Hydrate coupled Millstone, the overall trend remains consistent. This performance surpasses that of the Geo-COUS simulator developed by Ulsan-KIGAM and the simulator from the UCB. These findings indicate that the GPSFlow/Hydrate numerical simulator exhibits a certain level of feasibility in simulating the sand flow.

4. Applications

4.1. Case 3: One-Dimensional Numerical Simulation in Modeling the Behavior of Sand Flow

A simple 1D depressurization model was implemented to assess the capability of GPSFlow/Hydrate in simulating sand flow behavior. The model treats the sand phase as a Bingham fluid, with a threshold pressure gradient of 0.1 MPa, while the saturation of the sand phase in the porous media was set to 0.1. In the current version of the simulator, properties such as density, viscosity, and thermal conductivity are assumed to be constant. A 30.0-m-long domain was discretized into 11 elements, and the first grid was assigned a very large volume to maintain a constant thermodynamic condition. The simulation was run for 100 days using OpenMP parallel computing, with 123 time steps (elapsed time: 0.205 s).
The simulation results are presented in Figure 9. Initially, the pressure gradient exceeds the minimum threshold, resulting in the flow of sand. Subsequently, the rate of sand production gradually decreases as the pressure gradient declines, and the sand production rate ultimately decreases to 0.0 kg/d after 2 days. In contrast to the trend of the sand production rate, the cumulative production mass of sand steadily increases until it reaches 1.933 × 10³ kg. The final production masses of gas and aqueous are 4.061 × 10⁴ kg and 1.145 × 10⁵ kg, respectively. The presence of the sand flow causes a reduction in the cumulative production masses of gas and water compared to the results obtained without the sand flow, indicating the inhibitory effect of the sand flow on gas and water production. This corresponds to a relative mass error of just 9.48 × 10⁻⁷%, indicating excellent computational accuracy.

4.2. Three-Dimensional Numerical Simulation in Modeling the Behavior of Gas Hydrate

In order to evaluate the behavior of the gas hydrate, we utilized the GPSFlow/Hydrate simulator to conduct a 3D modeling study. The chosen hydrate reservoir was located at a depth of approximately 1385 m below sea level in the South China Sea. The study area, as illustrated in Figure 10, was divided into three strata comprised overburden, gas hydrate-bearing sediments (GHS), and underburden, and discretized into 24,768 grid blocks with dimensions of 24 × 24 × 43. The minimum grid interval was set to 0.1 m in all directions, with the maximum being 5 m in the X–Y plane and 2 m less in depth. The top layer of overburden and the base of underburden, comprising a total of 1152 inactive grids, were treated as constant pressure and temperature boundaries. Two 19.1-m-long horizontal and one 7.1-m-long vertical wells were used to provide depressurization conditions for hydrate dissociation and channels for gas and water production in the numerical models. The porosity of the multi-branch wells was set to 1.0, with an isotropic permeability of 1.0 × 10⁻¹⁰ m2, while the fluids within the wells were treated to satisfy Darcy’s Law. The intrinsic permeability of the water-saturated overburden and underburden was assumed to be three orders of magnitude less than that of the hydrate deposits. The grids located 50 m away from the vertical well were designed as isolated boundaries to minimize boundary effects. The relevant parameters modified from previous studies [5,43], as well as the initial conditions and wellbore conditions of five 3D cases, are listed in Table 3 and Table 4, respectively.
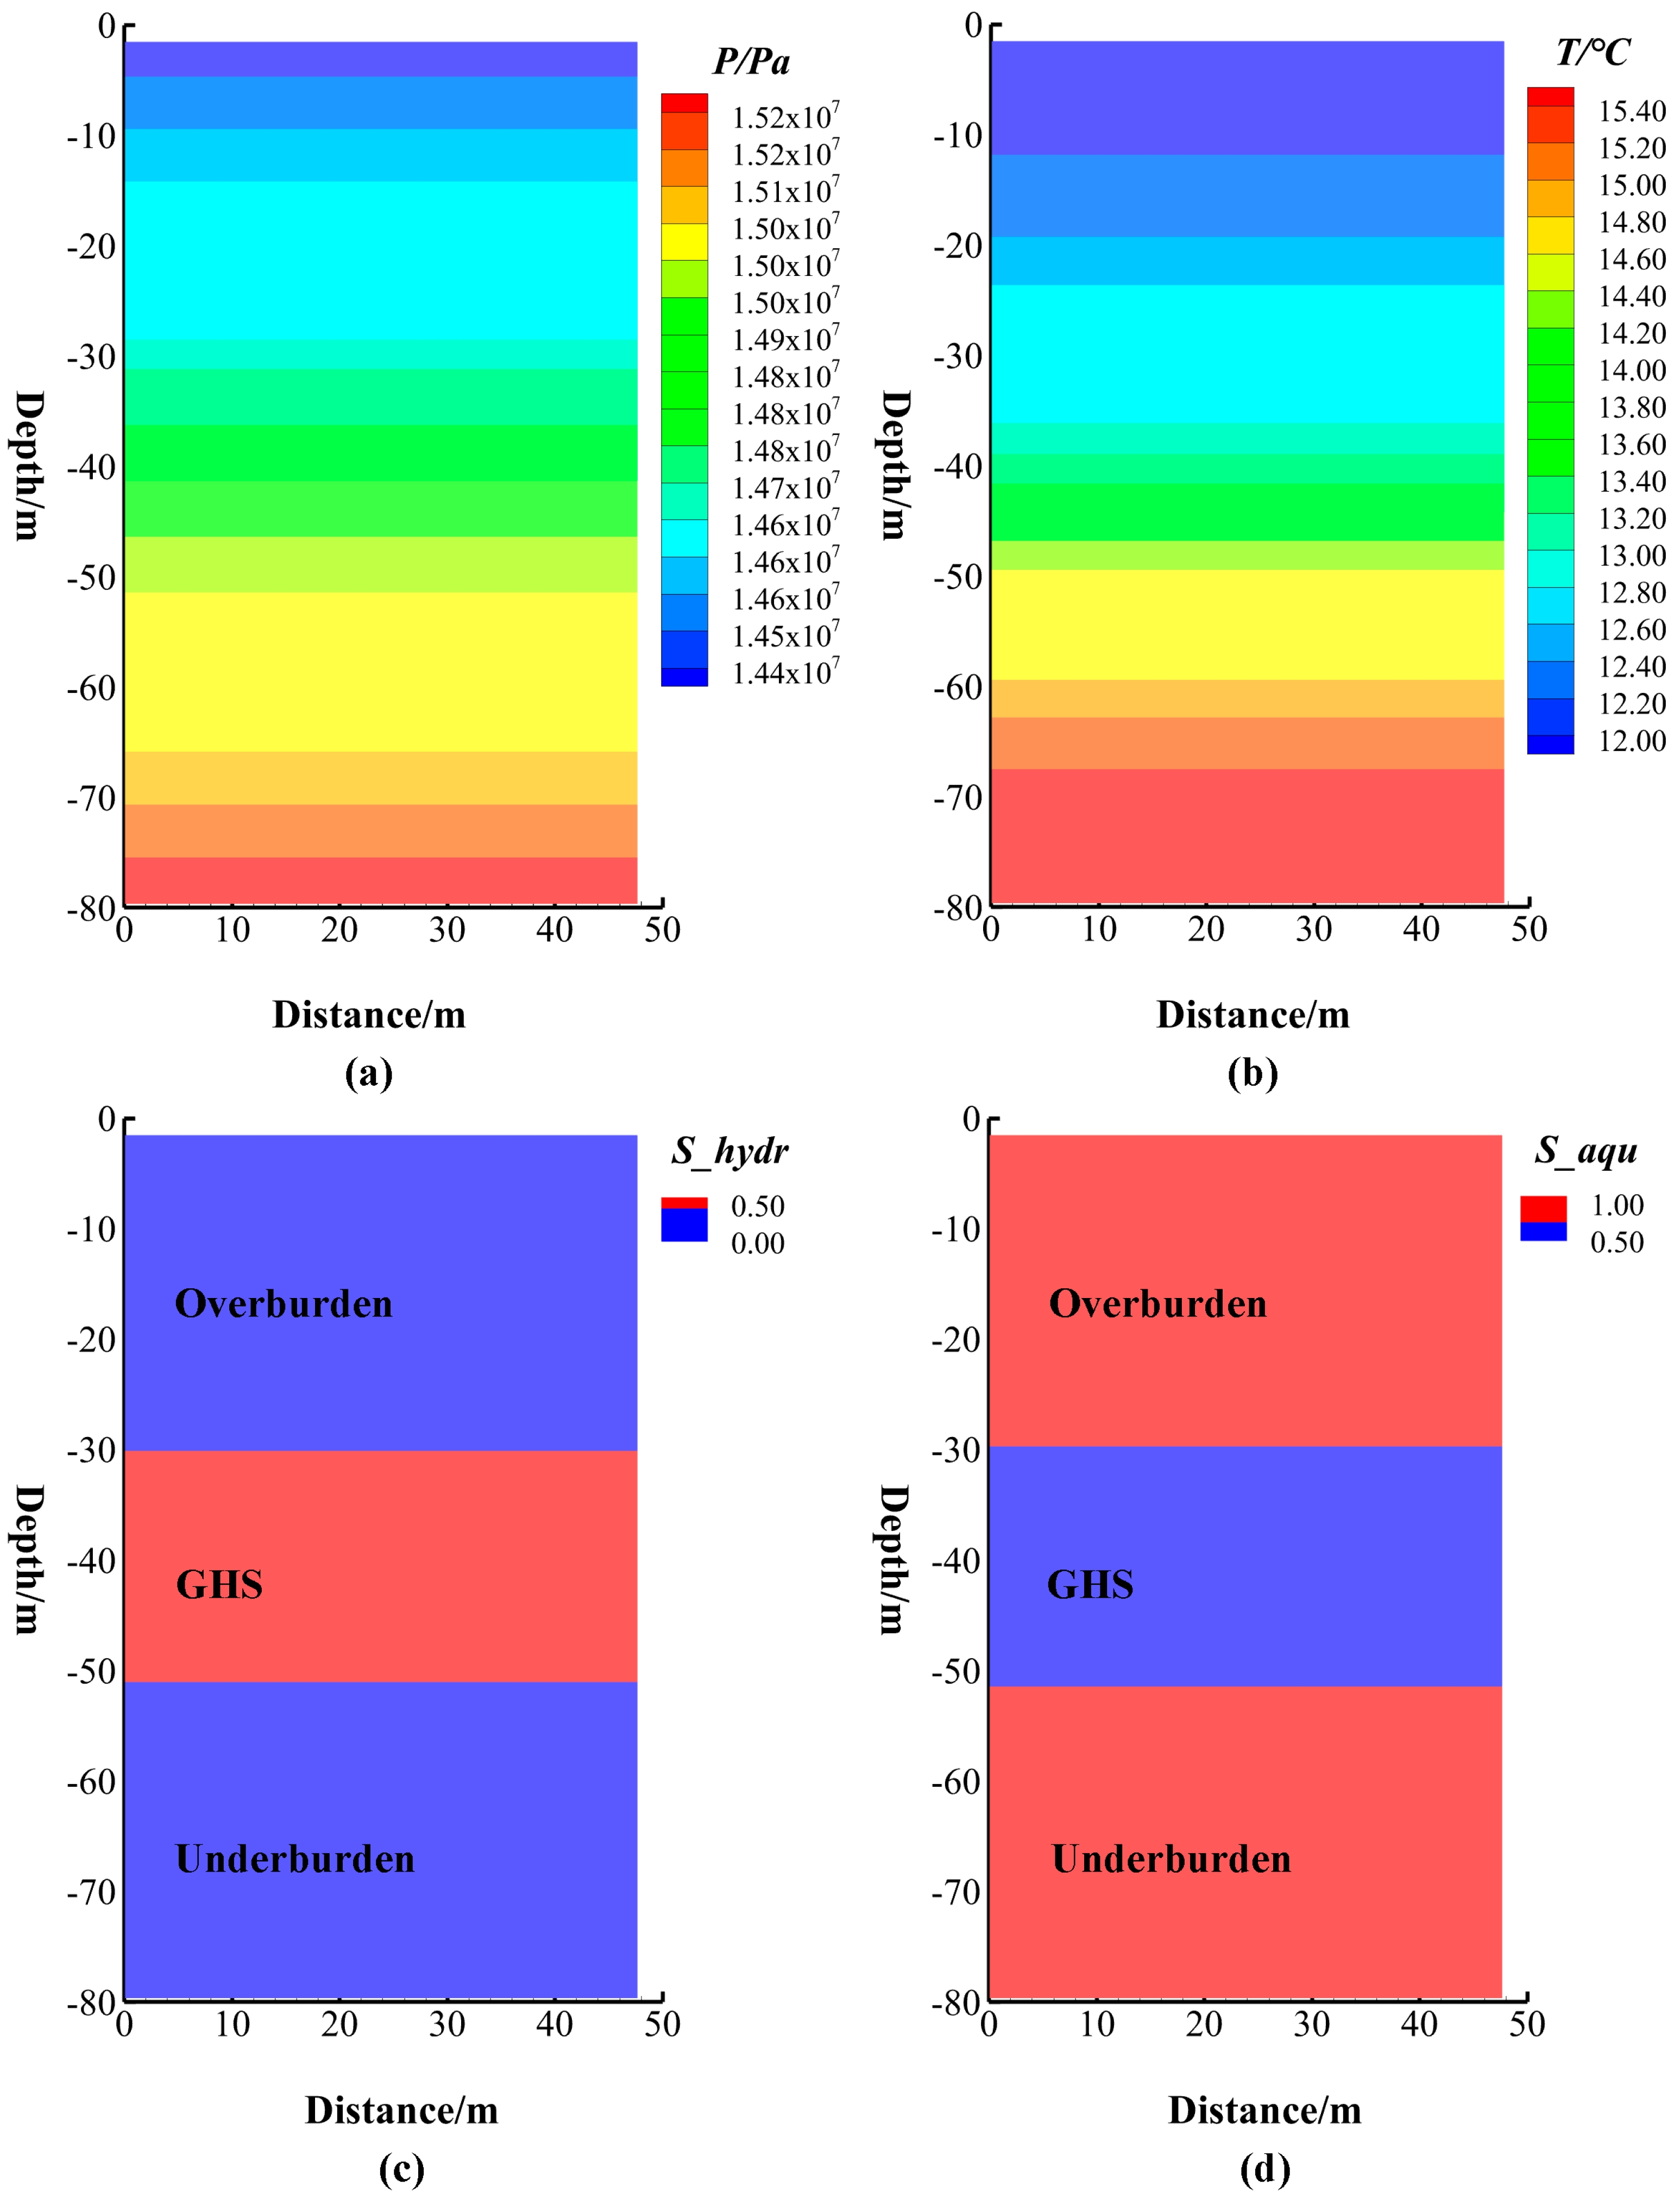
The initial conditions of the reservoir, as depicted in Figure 11, evolved based on the hydraulic pressure gradient and the geothermal gradient beneath the seafloor. The simulation system achieved a steady state after 1000 days of simulation. The results indicate that the gas hydrate can exist in the GHS layer stably, in comparison to the calculated pressure and temperature at phase equilibrium conditions. The utilization of numerical model initialization provides a closer approximation to the actual formation conditions.

4.2.1. Spatial Evolution and Gas Production Characteristics of Reservoir Parameters

Figure 12 presents the spatial distribution and evolution of pressure, temperature, and saturation of the three phases over a period of 10 days, 100 days, and 1000 days based on Case 4. The results demonstrate that the properties near the wellbore have significant changes as a result of depressurization in the well. The reduction in pressure, induced by the difference between the reservoir pressure and the 3.0 MPa mining pressure, leads to significant dissociation of the hydrate near the production well (Figure 12a). The decrease in pressure is then gradually transmitted in all directions over time. The decrease in temperature (Figure 12b) is due to the endothermic reaction of hydrate decomposition. Figure 12c shows the decline of hydrate saturation, with saturation dropping to zero after 1000 days near the wellbore, implying that the hydrate in the region located about 20 m from the well has been completely decomposed. As the hydrate dissociates, the saturation of the gas and aqueous phases increases and occupies the pore space. The effects of higher temperature fluid from the underburden result in faster fluid flow and heat transfer in the lower layer of the GHS compared to the upper layer of the GHS, as indicated in Figure 12b–e.
Zhang et al. [5] conducted a similar numerical simulation. In Case 3 of their research, the hydrate dissociation is mainly concentrated around the multi-branch well after 10 days. By day 100, a roughly rectangular dissociation zone has formed, while the top and bottom layers still exhibit limited decomposition, creating a temporary flow barrier. This barrier is fully removed by day 1000. The result is consistent with Figure 12c.
In Figure 13a, the volumetric rate of the produced gas increases rapidly at the beginning of the extraction process (peaking near 12,500 ST m3/d initially) and then decreases slightly. Additionally, the cumulative mass of the gas produced increases steadily (monotonically increasing to ~2.5 × 105 kg by 1000 days) as hydrate dissociation occurs, while the mass of the undissociated hydrate decreases. Figure 13b illustrates the production of both gas and water during the extraction process. The pressure difference drives both gas and water into the production well. The fluctuations in the gas production rate are closely tied to the rate of hydrate dissociation, while the rate of recovered water gradually decreases. After 1000 days of simulation, the total mass of the gas and water produced is 8.57 × 10⁵ kg and 9.32 × 10⁵ kg, respectively, demonstrating that substantial dissociation and production can be accurately estimated.

4.2.2. Sensitivity Analysis of Parameters

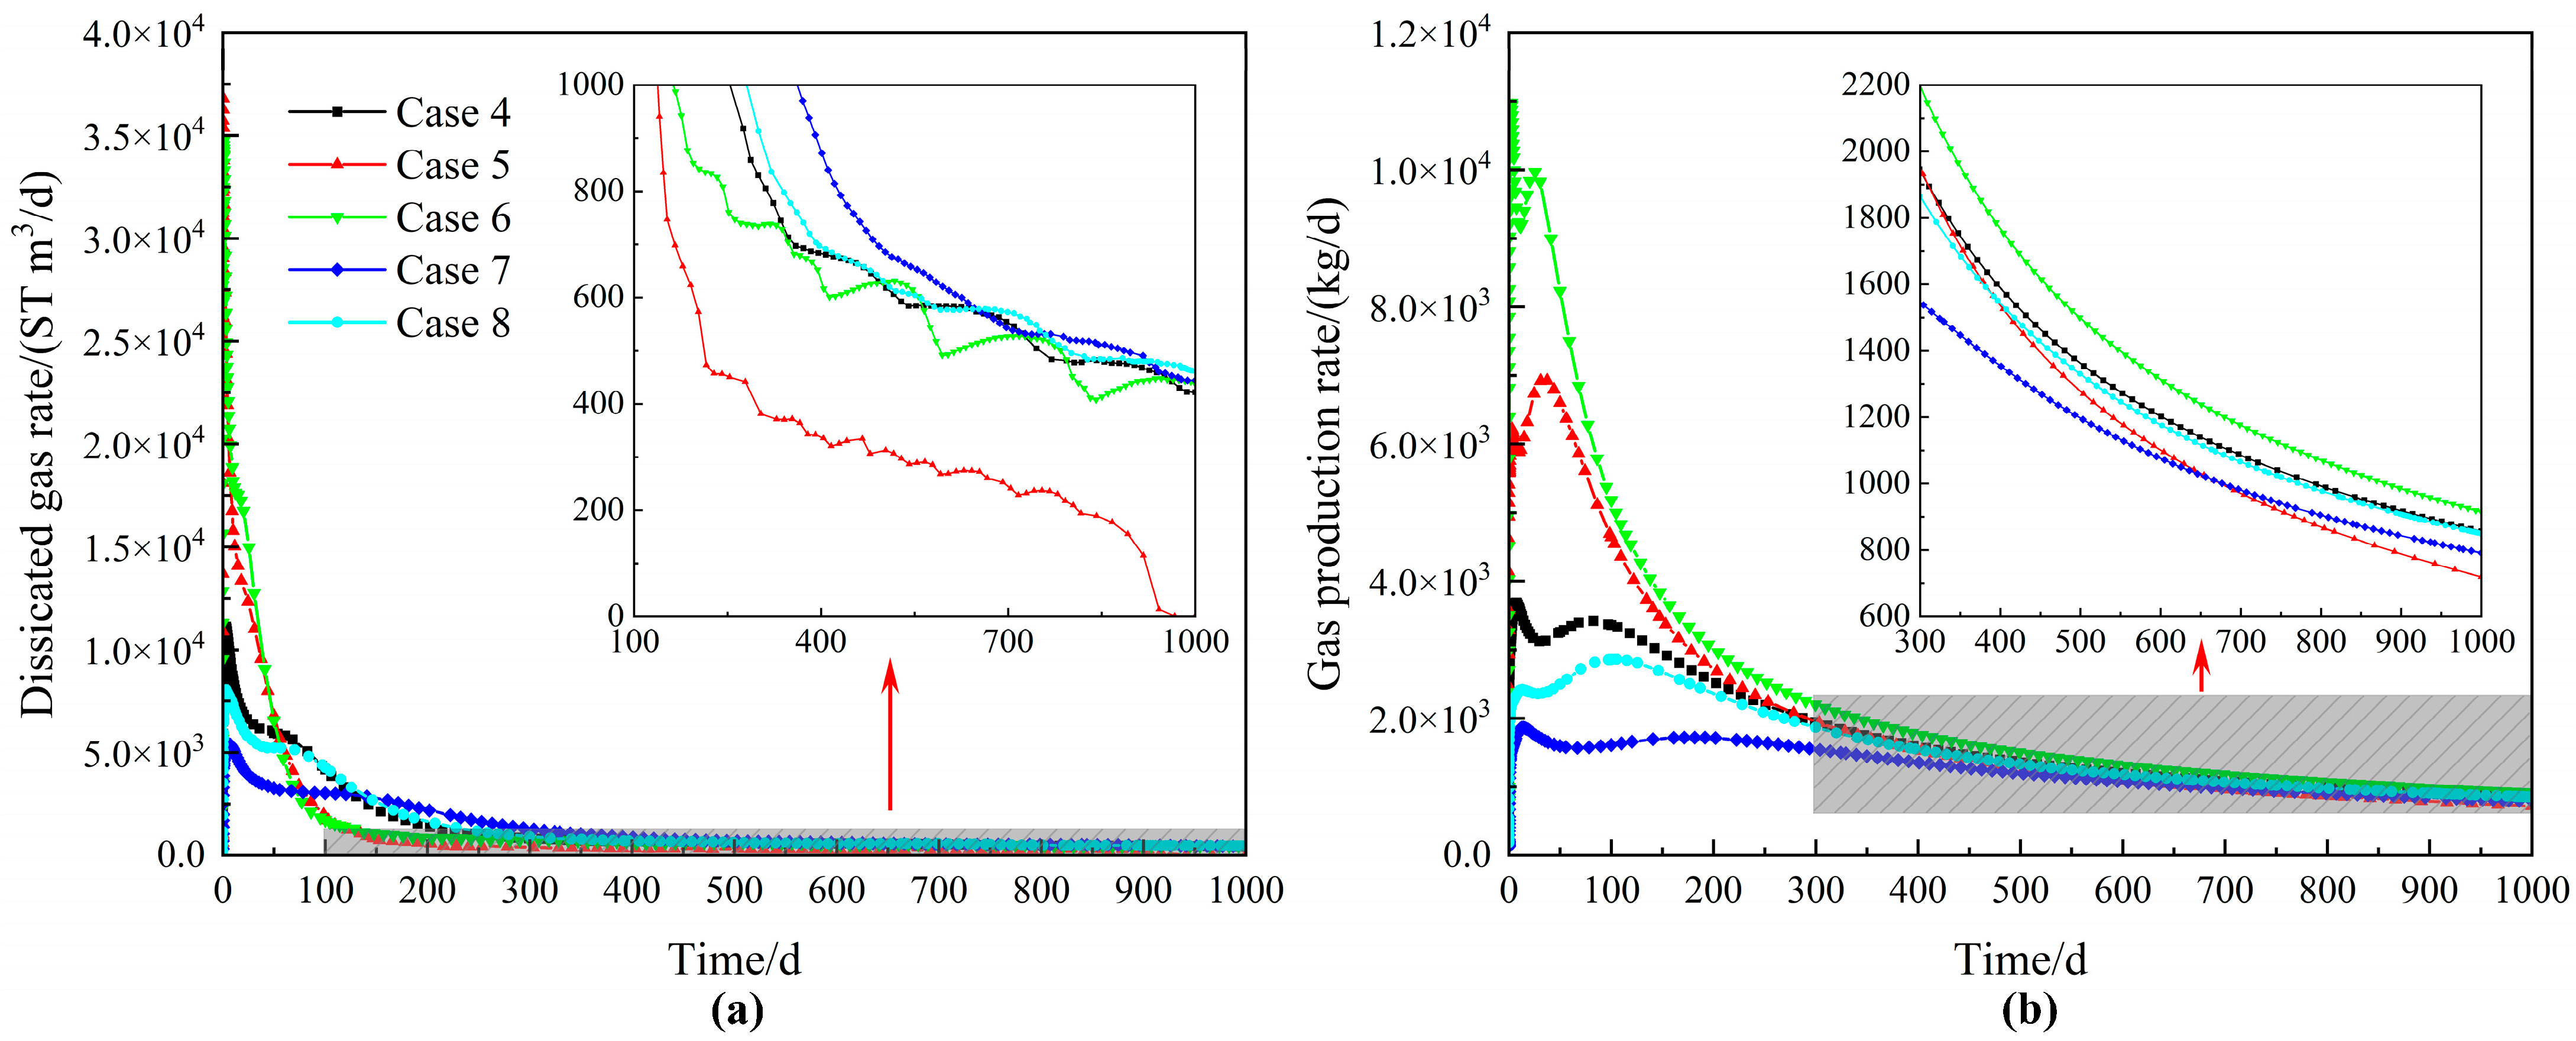
The results of Case 4 and Case 5 illustrate the influence of varying initial hydrate saturations on gas hydrate behavior. At the outset of the simulations, Case 4 exhibits a higher hydrate saturation compared to Case 5, indicating a greater concentration of hydrate and a correspondingly lower volume of aqueous fluid. After 1000 days of simulation, the hydrate saturation in Case 5 diminishes to zero, while the aqueous saturation increases to 0.9 or higher. As depicted in Figure 14, the rate of gas release and production in Case 5 surpasses that of Case 4, as evidenced by the cumulative gas mass, and remaining hydrate levels shown in Figure 15. This accelerated gas production in Case 5 is attributed to the increased aqueous fluid flow, which enhances the convection and heat transfer processes. Despite containing less hydrate, the initial conditions of Case 5 are more conducive to hydrate dissociation, facilitating more efficient gas production.
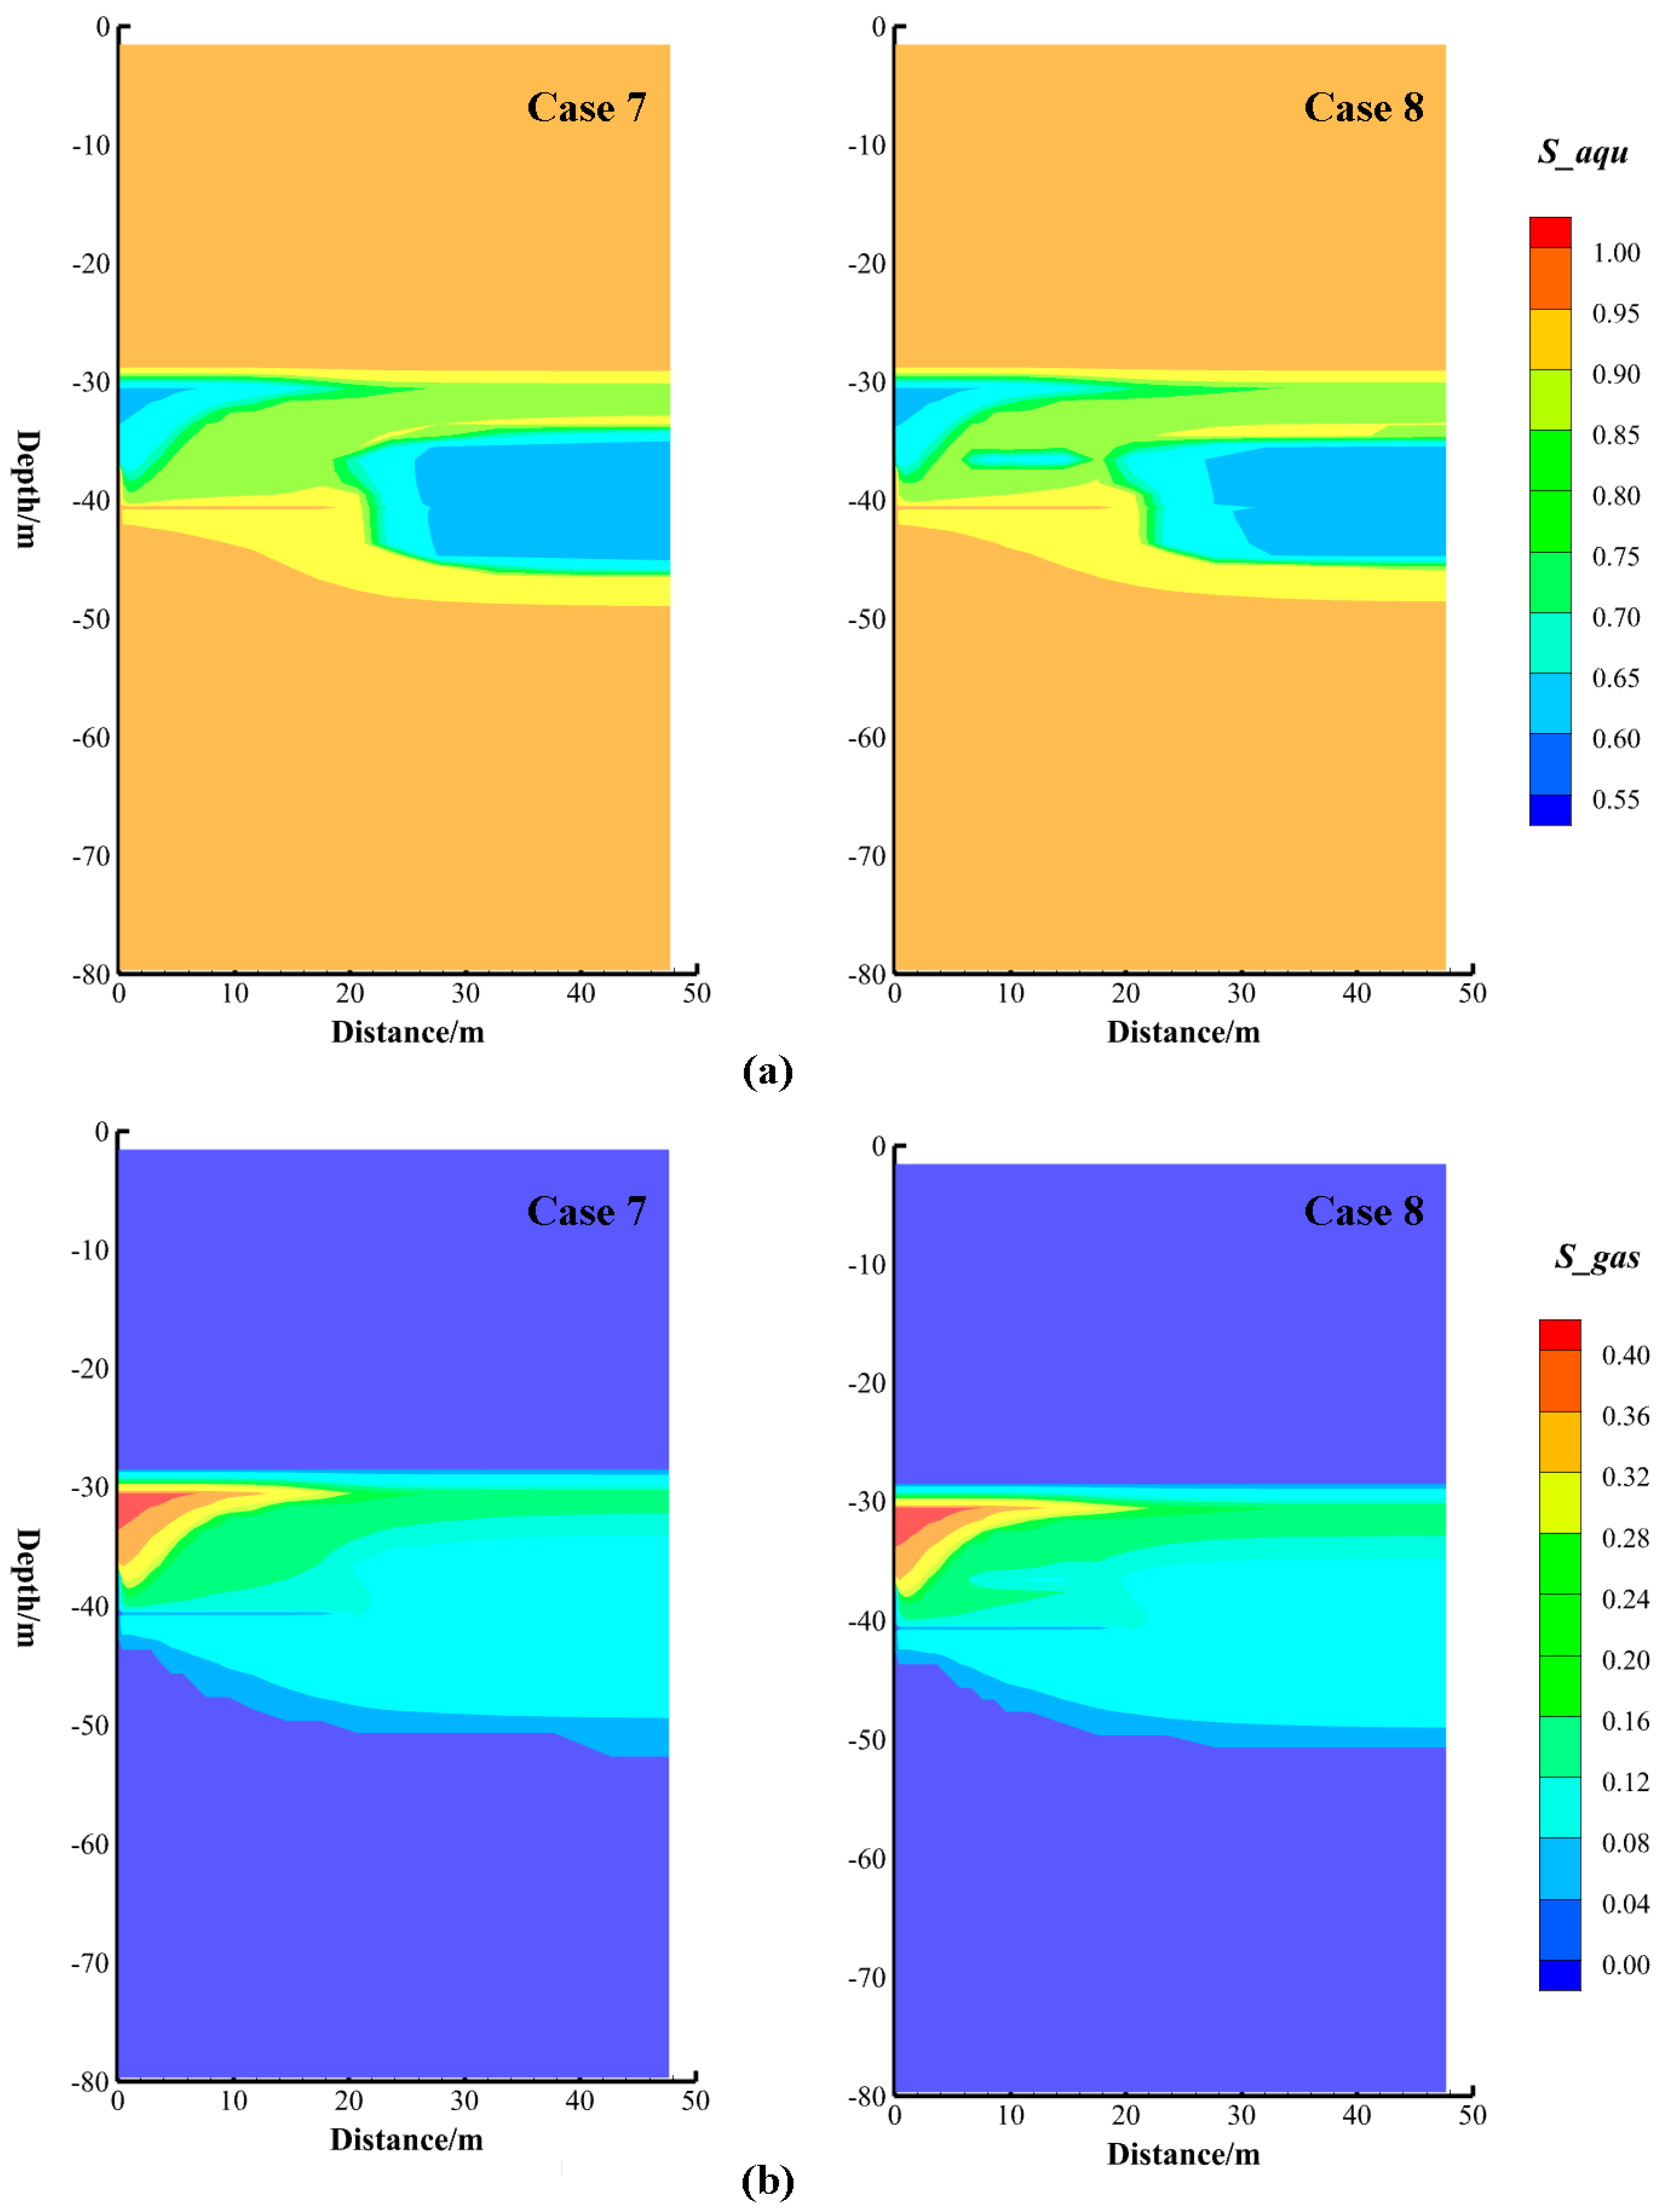
Cases 6–8 examine the effects of varying intrinsic permeability on gas hydrate dissociation and production. As shown in Figure 14 and Figure 15, significant differences are observed in the gas production rate, the cumulative gas release, and the amount of undissociated hydrate between Case 4 and Case 6. Specifically, Case 6, which possesses three times the permeability of Case 4, results in more rapid hydrate dissociation and increased gas production. Conversely, Case 7, with half the permeability of Case 4, demonstrates a consistent but inverse trend, exhibiting slower gas production and reduced hydrate dissociation rates. Figure 16 reveals that Cases 7 and 8 display similar distributions of gas and aqueous saturation. This similarity is likely due to the low permeability in these cases, which impedes vertical conductivity. Consequently, uneven temperature distributions arise, leading to disparate fronts of hydrate dissociation.

4.2.3. Parallel Computing Performance

To evaluate the performance of GPSFlow/Hydrate, we conducted simulations using both single-core and multicore processors, as depicted in Figure 17. Overall, multithreaded computing significantly outperforms single-threaded computing across all cases. For instance, regarding the Jacobian matrix operation time, the 8-thread parallel computation in Case 4 achieves an efficiency of 828.0% relative to single-threaded computing. Similarly, in the solution time for linear equations and the total simulation time, the multithreaded parallel computing in Case 6 attains efficiencies of 326.6% and 400.3%, respectively. These results demonstrate the substantial performance gains achievable through parallel processing, highlighting the scalability and efficiency of the GPSFlow/Hydrate simulator when utilizing multiple cores.

5. Conclusions

In this research, we present a novel numerical simulator, namely GPSFlow/Hydrate, which is designed to model the complex subsurface multicomponent and multiphase flow behavior of hydrate-bearing geologic systems. The simulator accommodates up to eight mass components, six possible phases, and heat transfer. The sand flow is treated as a component and individual phase, and is modeled as a Bingham fluid. The simulator fully accounts for methane or binary/ternary gas hydrate dissociation or formation, phase changes, and corresponding thermal effects under equilibrium and kinetics conditions. Additionally, the simulator employs a hybrid parallel computing approach using distributed memory (MPI) and shared memory (OpenMP), as well as multiple GPU computing to improve computational efficiency.
The present study validates the accuracy and assesses the performance of the GPSFlow/Hydrate simulator by two BP 1D cases. Comparative analyses demonstrate that GPSFlow/Hydrate successfully reproduces pressure, temperature, and hydrate saturation distributions in close agreement with benchmark solutions. The simulator closely approximates the results of the benchmark’s top-performing code. These results confirm the fundamental accuracy and reliability of GPSFlow/Hydrate in the calculation of secondary variables in each equation of state, as well as in the linear equation-solving and iteration process. The simulation results of the sand flow indicates that the sand flow may affect gas and water production during NGH exploitation, and the case achieves exceptional mass balance accuracy with a relative conservation error of 9.84 × 10⁻⁷%. Furthermore, we conducted five 3D cases using the GPSFlow/Hydrate simulator, and the results are similar to those reported in the literature, highlighting its capability for simulating large-scale and complex scenarios of natural gas hydrate extraction. The performance of GPSFlow/Hydrate using OpenMP parallel computing exhibits remarkable efficiency and great convergence during simulation.
The simulator is deficient in that it does not consider the mechanical processes, and the simulation of multicomponent gas hydrates also lacks comparison with the experimental or trial production data. Future studies will focus on optimizing algorithms for guest molecule exchange simulation and coupling mechanics models to model the mechanical stability of porous media.

Author Contributions

Conceptualization, B.X.; methodology, B.X.; software, B.X. and K.Z.; validation, B.X.; formal analysis, B.X.; investigation, B.X.; resources, B.X.; data curation, B.X.; writing—original draft preparation, B.X.; writing—review and editing, B.X. and K.Z.; visualization, B.X.; supervision, K.Z.; project administration, K.Z.; funding acquisition, K.Z. All authors have read and agreed to the published version of the manuscript.

Funding

This research was funded by the National Science and Technology Major Project, China (No. 33550000-20-ZC0611-0042).

Data Availability Statement

The data in this study can be obtained at the request of the corresponding author because the data involve confidentiality.

Acknowledgments

Bingbo Xu acknowledges the care and support from his family (Wenxin Xu, Hongdi Fu, Yan Xu), and particularly his wife Hanjie Ge.

Conflicts of Interest

The authors declare no conflicts of interest.

Abbreviations

The following abbreviations are used in this manuscript:
NGHNatural gas hydrate
CH4-hydrateMethane hydrate
CO2-hydrateCarbon dioxide hydrate
IGHCCS2The Second International Gas Hydrate Code Comparison Study
1DOne-dimensional
3DThree-dimensional
MPIMessage Passing Interface
OpenMPOpen Multi-Processing
EOSEquations of state
PVPrimary variables
FIMFully implicit method
IMPESImplicit pressure–explicit saturation method
AIMAdaptive implicit method
BPBenchmark problem
GHSGas hydrate-bearing sediments

Appendix A

Appendix A.1

The Second International Gas Hydrate Code Comparison Study (IGHCCS2) was organized between 2017 and 2018 under the leadership of the Pacific Northwest National Laboratory (PNNL), Lawrence Berkeley National Laboratory (LBNL), and the National Energy Technology Laboratory (NETL). The primary objective of IGHCCS2 was to rigorously benchmark and to validate numerical simulators designed for gas hydrate reservoir modeling by testing their performance against standardized problems. The study attracted broad international participation, with 55 representatives from 25 research groups across 5 countries. Ten widely used simulators were employed to solve benchmark problems, such as the “BP3 problem”, which involves multiphase, multicomponent hydrate dissociation and fluid flow in porous media. Results from IGHCCS2 highlighted both the overall consistency among simulators and their respective limitations, thereby providing valuable insights for improving model accuracy, convergence, and predictive reliability in hydrate reservoir simulations. Table A1 lists the Institutes, Teams, and Simulators participating in IGHCCS2 [21].
Table A1. Summary of Institutes, Teams, and Simulators Participating in IGHCCS2 (Modified from White et al. [21]).
Institutes and TeamsSimulators
Cambridge-JOGMEC (MH21 Research Consortium)
University of California, Berkeley (UCB)
Berkeley-Cambridge THM model—COMSOL FEM Code
GEOMAR Helmholtz Center for Ocean Research Kiel (GEOMAR) SuGaR-THMC
Jilin University (JLU)HydrateBiot
Korea Advanced Institute of Science and TechnologyK-Hydrate + FLAC2D/FLAC3D
Korea Institute of Geoscience and Mineral Resources University of Ulsan (Ulsan-COUS)Geo-COUS
Kyoto UniversityCOMVI-MH
Lawrence Berkeley National Laboratory (LBNL)TOUGH + HYDRATE + Millstone
Lawrence Livermore National Laboratory-Tongji University (LLNL-Tongji)GEOS
National Energy Technology Laboratory (NETL)MIX3HRS-GM
Pacific Northwest National Laboratory (PNNL)STOMP-HYDT-KE + GeoMech
Sandia National Laboratories (SNL)PFLOTRAN
National Oceanography Center Southampton, University of SouthamptonCODE_BRIGHT + Hydrate-CASM
University of Texas at Austin (UT)UT_HYD

Appendix A.2

In this study, the considered components of marine natural gas hydrates include methane, carbon dioxide, water, inhibitors, sand, and heat, while the phases comprise gas, liquid, sand, ice, and hydrate solids. To accurately characterize the thermodynamic states associated with natural gas hydrates, the system was initially divided into 18 thermodynamic states considering the multicomponent hydrate system as a whole. However, significant challenges related to phase transitions and convergence were encountered during the simulator implementation. To simplify the simulations, carbon dioxide was temporarily assumed to exist entirely in the gaseous phase, with further testing and improvements planned in subsequent work. In the current version of the simulator, sand is treated as an independent and optional component and phase. Accordingly, the initial version of the developed simulator categorizes all possible thermodynamic phase combinations of the multicomponent hydrate system into 13 states, as summarized in Table A2.
Table A2. List of primary variables (PV) in the GPSFlow/Hydrate simulator.
StatePhase
Combination
PV 1PV 2
(opt)
PV 3PV 4
(Kinetics *)
PV 5
(opt)
PV 6
(opt)
PV 7
1GasP_gasS_sandY_gas1S_hydrate *Y_gas2XinhibitorT
2AqueousPS_sandX_gas1S_hydrate *X_gas2XinhibitorT
3Aqueous, GasP_gasS_sandS_aqueousS_hydrate *Y_gas2XinhibitorT
4Ice, GasP_gasS_sandS_iceS_hydrate *Y_gas2XinhibitorT
5Aqueous, HydratePS_sandS_aqueousX_gas1 *X_gas2XinhibitorT
6Ice, HydratePS_sandS_iceS_gas *Y_gas2XinhibitorT
7Aqueous, Gas, HydrateS_gas P_gas *S_sandS_aqueousS_gas *Y_gas2XinhibitorT
8Aqueous, Ice, GasP_gasS_sandS_aqueousS_hydrate *Y_gas2XinhibitorS_gas
9Aqueous, Ice, HydratePS_sandS_aqueousS_gas *X_gas2XinhibitorS_ice
10Ice, Gas, HydrateS_gas P_gas *S_sandS_ice
S_gas *
S_ice *Y_gas2XinhibitorT
11Aqueous, Ice, Gas, HydrateS_gas P_gas *S_sandS_aqueousS_gas *Y_gas2XinhibitorS_ice
12Gas, HydrateP_gasS_sandS_gasS_ice *Y_gas2XinhibitorT
13Aqueous, IcePS_sandS_aqueousS_gas *X_gas2XinhibitorX_gas1
where P, S, X, Y, and T denote pressure, saturation, mass fraction of component dissolved in aqueous phase, mass fraction of component in gas phase, and temperature, respectively. The symbol of “opt” is for users choice whether the numerical model has sand, inhibitor, or additional gas. The primary variables with “*” are used for kinetics hydration reaction.

References

  1. Merey, Ş. Prediction of Methane, Water and Ice Properties for Numerical Gas Hydrate Simulations. Celal Bayar Üniversitesi Fen Bilim. Derg. 2018, 14, 177–186. [Google Scholar] [CrossRef]
  2. Shahnazar, S.; Hasan, N. Gas hydrate formation condition: Review on experimental and modeling approaches. Fluid Phase Equilibria 2014, 379, 72–85. [Google Scholar] [CrossRef]
  3. Sun, Y.H.; Ma, X.L.; Guo, W.; Jia, R.; Li, B. Numerical simulation of the short- and long-term production behavior of the first offshore gas hydrate production test in the South China Sea. J. Pet. Sci. Eng. 2019, 181, 106196. [Google Scholar] [CrossRef]
  4. Chong, Z.R.; Yang, S.H.B.; Babu, P.; Linga, P.; Li, X.-S. Review of natural gas hydrates as an energy resource: Prospects and challenges. Appl. Energy 2016, 162, 1633–1652. [Google Scholar] [CrossRef]
  5. Zhang, P.; Zhang, Y.; Zhang, W.; Tian, S. Numerical simulation of gas production from natural gas hydrate deposits with multi-branch wells: Influence of reservoir properties. Energy 2022, 238, 121738. [Google Scholar] [CrossRef]
  6. Kurihara, M.; Sato, A.; Funatsu, K.; Ouchi, H.; Yamamoto, K.; Numasawa, M.; Ebinuma, T.; Narita, H.; Masuda, Y.; Dallimore, S.R.; et al. Analysis of Production Data for 2007/2008 Mallik Gas Hydrate Production Tests in Canada. In Proceedings of the International Oil and Gas Conference and Exhibition in China, Beijing, China, 8–10 June 2010. [Google Scholar]
  7. Boswell, R.; Schoderbek, D.; Collett, T.S.; Ohtsuki, S.; White, M.; Anderson, B.J. The Iġnik Sikumi Field Experiment, Alaska North Slope: Design, Operations, and Implications for CO2-CH4 Exchange in Gas Hydrate Reservoirs. Energy Fuels 2017, 31, 140–153. [Google Scholar] [CrossRef]
  8. Uchida, S.; Klar, A.; Yamamoto, K. Sand production model in gas hydrate-bearing sediments. Int. J. Rock Mech. Min. Sci. 2016, 86, 303–316. [Google Scholar] [CrossRef]
  9. Li, J.F.; Ye, J.L.; Qin, X.W.; Qiu, H.J.; Wu, N.Y.; Lu, H.L.; Xie, W.W.; Lu, J.A.; Peng, F.; Xu, Z.Q.; et al. The first offshore natural gas hydrate production test in South China Sea. China Geol. 2018, 1, 5–16. [Google Scholar] [CrossRef]
  10. Zhu, H.; Xu, T.; Yuan, Y.; Feng, G.; Xia, Y.; Xin, X. Numerical analysis of sand production during natural gas extraction from unconsolidated hydrate-bearing sediments. J. Nat. Gas Sci. Eng. 2020, 76, 103229. [Google Scholar] [CrossRef]
  11. Ebinuma, T. Method for Dumping and Disposing of Carbon Dioxide Gas and Apparatus Therefor. U.S. Patent US5261490A, 16 November 1993. [Google Scholar]
  12. Ogaki, K.; Takano, K.; Sangawa, H.; Matsubara, T.; Nakano, S. Methane exploitation by carbon dioxide from gas hydrates. Phase equilibria for CO2-CH4 mixed hydrate system. J. Chem. Eng. Jpn. 1996, 29, 478–483. [Google Scholar] [CrossRef]
  13. Zhang, X.H.; Lu, X.B.; Li, P. A comprehensive review in natural gas hydrate recovery methods. Sci. Sin.-Phys. Mech. Astron. 2019, 49, 38–59. [Google Scholar] [CrossRef]
  14. Park, Y.; Kim, D.-Y.; Lee, J.-W.; Huh, D.-G.; Park, K.-P.; Lee, J.; Lee, H. Sequestering carbon dioxide into complex structures of naturally occurring gas hydrates. Proc. Natl. Acad. Sci. USA 2006, 103, 12690–12694. [Google Scholar] [CrossRef]
  15. Ahn, Y.-H.; Kang, H.; Koh, D.-Y.; Lee, H. Production of Natural Gas Hydrate by Using Air and Carbon Dioxide. World Academy of Science, Engineering and Technology. Int. J. Chem. Mol. Nucl. Mater. Metall. Eng. 2015, 9, 808–812. [Google Scholar]
  16. Kurihara, M.; Sato, A.; Ouchi, H.; Narita, H.; Masuda, Y.; Saeki, T.; Fujii, T. Prediction of Gas Productivity From Eastern Nankai Trough Methane-Hydrate Reservoirs. SPE Reserv. Eval. Eng. 2009, 12, 477–499. [Google Scholar] [CrossRef]
  17. White, M.; Oostrom, M. STOMP Subsurface Transport Over Multiple Phases, Version 4.0, Users Guide; Technical Information Service, U.S. Department of Commerce: Springfield, VA, USA, 2006. [Google Scholar] [CrossRef]
  18. White, M.D. STOMP-HYDT-KE A Numerical Simulator for the Production of Natural Gas Hydrate using Guest Molecule Exchange with CO2 and N2; PNNL: Richland, WA, USA, 2012. [Google Scholar]
  19. Wan, Y.; Wu, N.; Chen, Q.; Li, W.; Hu, G.; Huang, L.; Ouyang, W. Coupled thermal-hydrodynamic-mechanical–chemical numerical simulation for gas production from hydrate-bearing sediments based on hybrid finite volume and finite element method. Comput. Geotech. 2022, 145, 104692. [Google Scholar] [CrossRef]
  20. Wilder, J.W.; Moridis, G.J.; Wilson, S.J.; Kurihara, M.; Masuda, Y.; Anderson, B.J.; Collett, T.; Hunter, R.B.; Narita, H.; Pooladi-Darvish, M.; et al. An International Effort To Compare Gas Hydrate Reservoir Simulators. In Proceedings of the 6th International Conference on Gas Hydrates (ICGH 2008), Vancouver, BC, Canada, 6–10 July 2008. [Google Scholar]
  21. White, M.D.; Kneafsey, T.J.; Seol, Y.; Waite, W.F.; Uchida, S.; Lin, J.S.; Myshakin, E.M.; Gai, X.; Gupta, S.; Reagan, M.T.; et al. An international code comparison study on coupled thermal, hydrologic and geomechanical processes of natural gas hydrate-bearing sediments. Mar. Pet. Geol. 2020, 120, 104566. [Google Scholar] [CrossRef]
  22. Howe, S.J. Production Modeling and Economic Evaluation of a Potential Gas Hydrate Pilot Production Program on the North Slope of Alaska. 2004. Available online: http://hdl.handle.net/11122/6032 (accessed on 27 April 2024).
  23. Wan, Y. QIMGHyd-THMC User’s Manual: A Thermal-Hydraulic-Chemical-Mechanical Coupled Simulator for the Simulation of Behavior in Natural Gas Hydrate Bearing Sediments; Qingdao, China, 2022. [Google Scholar]
  24. Yan, C.L.; Ren, X.; Cheng, Y.F.; Song, B.J.; Li, Y.; Tian, W.Q. Geomechanical issues in the exploitation of natural gas hydrate. Gondwana Res. 2020, 81, 403–422. [Google Scholar] [CrossRef]
  25. Zhao, X.; Wang, Z.; Zhao, Y.; Zuo, J.; Li, P.; Liang, W.; Wang, B.; Chen, X.; Lei, H.; Jin, G. Coupled thermal–hydrodynamic–mechanical numerical simulation of natural gas hydrate horizontal well depressurization production: Method and application in the South China Sea. Nat. Gas Ind. B 2022, 9, 548–560. [Google Scholar] [CrossRef]
  26. Loret, B. Sand Production During Hydrate Dissociation and Erosion of Earth Dams: Constitutive and Field Equations. In Fluid Injection in Deformable Geological Formations: Energy Related Issues; Loret, B., Ed.; Springer International Publishing: Berlin/Heidelberg, Germany, 2019; pp. 369–463. [Google Scholar] [CrossRef]
  27. Song, Y.; Zhao, J.; Yang, M. Fundamentals of Natural Gas Hydrates Exploitation; Science Press: Beijing, China, 2021. [Google Scholar]
  28. Zhang, K. User’s Guide for GPSFlow-A Hybrid Parallel Computing General Purpose Subsurface Flow Simulator; Berkeley, CA, USA, 2022. [Google Scholar]
  29. Xu, B. User’s Manual for GPSFlow/Hydrate-A Numerical Simulator for Modeling Subsurface Multicomponent and Multiphase Flow Behavior of Hydrate-Bearing Geologic Systems; Guangzhou, China, 2023. [Google Scholar]
  30. Moridis, G.J.; Queiruga, A.F.; Reagan, M.T. Simulation of Gas Production from Multilayered Hydrate-Bearing Media with Fully Coupled Flow, Thermal, Chemical and Geomechanical Processes Using TOUGH + Millstone. Part 1: Numerical Modeling of Hydrates. Transp. Porous Media 2019, 128, 405–430. [Google Scholar] [CrossRef]
  31. Li, Y.; Wang, L.; Zhao, Y.; Wang, H.; Li, S.; Jia, J. Numerical investigation of the flow characteristics of Bingham fluid on a slope with corrected smooth particle hydrodynamics. Front. Environ. Sci. 2022, 10, 1060703. [Google Scholar] [CrossRef]
  32. Wang, W.; Fan, S.; Liang, D.; Li, Y. A model for estimating flow assurance of hydrate slurry in pipelines. J. Nat. Gas Chem. 2010, 19, 380–384. [Google Scholar] [CrossRef]
  33. Nuland, S.; Tande, M. Hydrate Slurry Flow Modeling. In Proceedings of the 12th International Conference on Multiphase Production Technology, Barcelona, Spain, 25–27 May 2005. [Google Scholar]
  34. Kamath, V.A. Study of Heat Transfer Characteristics During Dissociation of Gas Hydrates in Porous Media Univ. of Pittsburgh, Pittsburgh, PA. United States. 1984. Available online: https://www.osti.gov/biblio/5753228 (accessed on 4 March 2023).
  35. Moridis, G.J. Numerical Studies of Gas Production From Methane Hydrates. SPE J. 2003, 8, 359–370. [Google Scholar] [CrossRef]
  36. Shi, B. Gas Hydrate Treatment Technology; Petroleum Industry Press: Beijing, China, 2021. [Google Scholar]
  37. Chen, G.-J.; Guo, T.-M. A new approach to gas hydrate modelling. Chem. Eng. J. 1998, 71, 145–151. [Google Scholar] [CrossRef]
  38. Sloan, J.; Carolyn, K. Clathrate Hydrates of Natural Gases, 3rd ed.; CRC Press: Boca Raton, FL, USA, 2007. [Google Scholar]
  39. NIST. Thermophysical Properties of Fluid Systems. 2022. Available online: https://webbook.nist.gov/chemistry/fluid/ (accessed on 3 April 2022).
  40. Moridis, G.J. User’s Manual for the HYDRATE Option of TOUGH+ v1.5: A Code for the Simulation of System Behavior in Hydrate-Bearing Geologic Media; Earth Sciences Division, Lawrence Berkeley National Laboratory: Berkeley, CA, USA, 2014. [Google Scholar]
  41. Stone, H.L. Estimation of Three-Phase Relative Permeability And Residual Oil Data. J. Can. Pet. Technol. 1973, 12, 53–61. [Google Scholar] [CrossRef]
  42. van Genuchten, M.T. A Closed-form Equation for Predicting the Hydraulic Conductivity of Unsaturated Soils. Soil Sci. Soc. Am. J. 1980, 44, 892–898. [Google Scholar] [CrossRef]
  43. Shen, Z.; Wang, D.; Zheng, T. Numerical simulations of the synthetic processes and consequences of secondary hydrates during depressurization of a horizontal well in the hydrates production. Energy 2023, 263, 125675. [Google Scholar] [CrossRef]
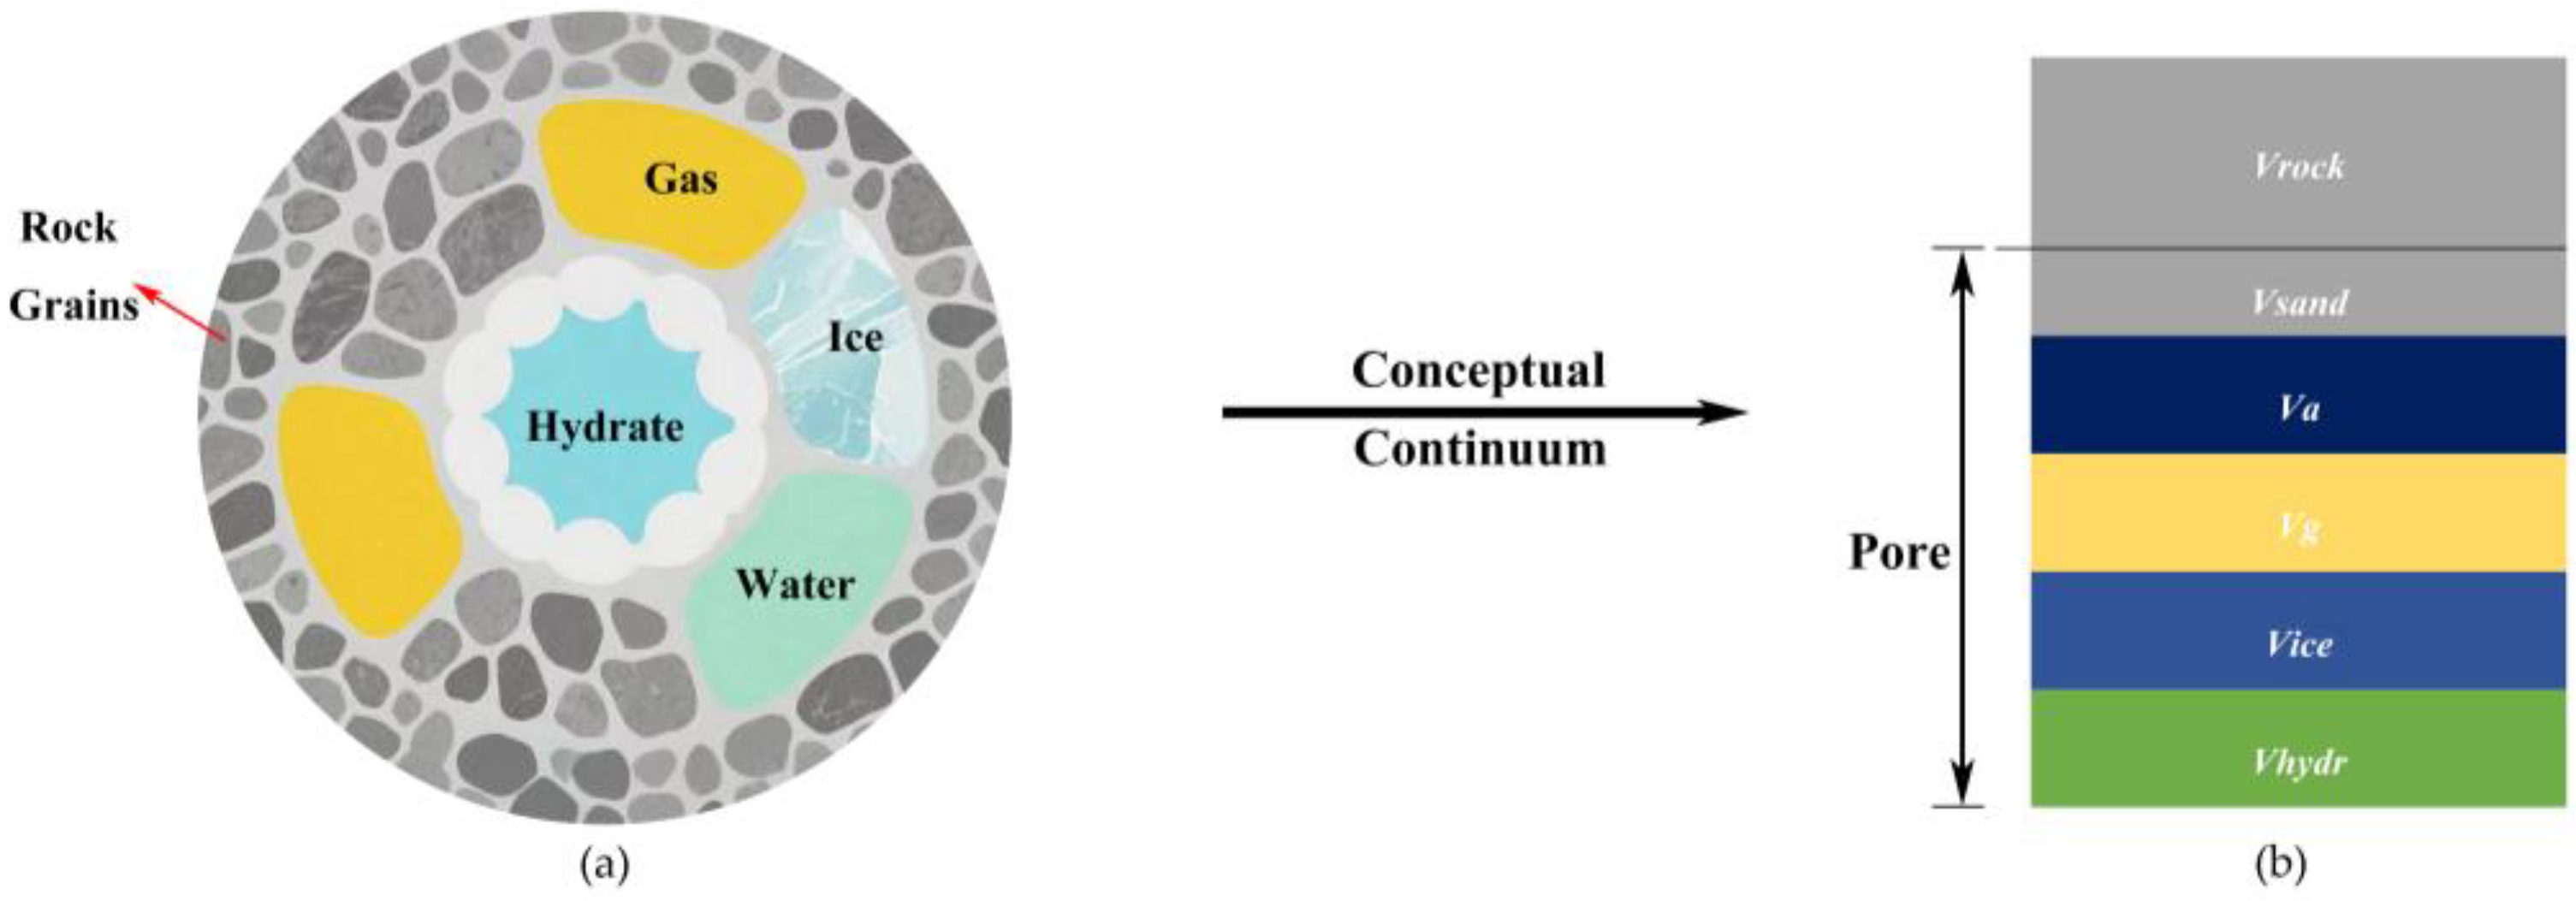
Figure 1. Diagram of a porous media of hydrate-bearing sediments: (a) cross-sectional view [27]; (b) conceptual continuum.
Jmse 13 01622 g001
Figure 2. The pressure−temperature equilibrium relationship in the phase diagram of the CH4–CO2 hydrate system.
Jmse 13 01622 g002
Figure 3. Flow diagram of the GPSFlow/Hydrate simulator modeling processes.
Jmse 13 01622 g003
Figure 4. Benchmark problem 3 of gas hydrate dissociation in a 1D radial domain.
Jmse 13 01622 g004
Figure 5. Comparison of numerical simulation results for depressurization: (a) pressure, (b) temperature, and (c) hydrate saturation after 2 days.
Jmse 13 01622 g005
Figure 6. Comparison of numerical simulation results for thermal stimulation: (a) pressure, (b) temperature, and (c) hydrate saturation after 2 days.
Jmse 13 01622 g006
Figure 7. Benchmark problem 4—depressurization of a pure liquid phase in a 1D radial domain.
Jmse 13 01622 g007
Figure 8. Comparison of numerical simulation results: (a) pressure and (b) temperature after 1 h.
Jmse 13 01622 g008
Figure 9. The sand production rate and mass within 2 days.
Jmse 13 01622 g009
Figure 10. The schematic diagram of the natural gas hydrate reservoir and mesh discretization.
Jmse 13 01622 g010
Figure 11. Initial pressure (a), temperature (b), hydrate saturation (c) and aqueous saturation (d) distribution of the simulation system.
Jmse 13 01622 g011
Figure 12. Spatial distribution of (a) pressure, (b) temperature, (c) hydrate saturation, (d) aqueous saturation, and (e) gas saturation after 10 days, 100 days, and 1000 days in Case 4.
Jmse 13 01622 g012aJmse 13 01622 g012b
Figure 13. Volumetric rates of dissociated gas, cumulative released CH4, and undissociated hydrate in the reservoir (a), and gas and water production rates in the well (b) as the hydrate dissociates within 1000 days in Case 4.
Jmse 13 01622 g013
Figure 14. The rate of dissociated gas (a) and gas production (b) within 1000 days of five cases.
Jmse 13 01622 g014
Figure 15. Cumulative released CH4 (a) and undissociated hydrate in the reservoir (b) within 1000 days of five cases.
Jmse 13 01622 g015
Figure 16. Spatial distribution of (a) aqueous saturation and (b) gas saturation after 1000 days in Case 7 and Case 8.
Jmse 13 01622 g016
Figure 17. Comparison of performance in Jacobian matrix setup, linear system solving, and elapsed time of five cases.
Jmse 13 01622 g017
Table 1. Reservoir parameters for BP3.
ParametersValueParametersValue
Grain density2600.0 kg/m3Grain specific heat1000.0 J/(kg·°C)
Porosity0.3Wet thermal conductivity2.18 W/(m·K)
Pore compressibility10−9 Pa−1Dry thermal conductivity2.0 W/(m·K)
Intrinsic permeability (depressurization) k x , y , z   =   3.0   ×   1 0 13   m2Intrinsic permeability
(thermal)
k x , y , z   =   1 . 0   ×   1 0 12   m2
Relative permeabilityStone model [41]: S r a = 0.12 ,   S r g = 0.02 ,   n =   n g = 3.0
Capillary pressurevan Genuchten model [42]:
λ   =   0.45 ,   S r a   =   0.12 ,   1 / P 0   =   0.00008   P a 1 ,   P m a x   =   1 0 6   Pa ,   S a m a x   =   1.0
Numerical simulators for comparisonGEOMAR (SuGaR-THMC)
SNL (PFLOTRAN)
JLU (HydrateBiot)
Ulsan-KIGAM (Geo-COUS)
LBNL (TOUGH + Hydrate)
UT (UT_HYD)
NETL (MIX3HRS-GM)
LLNL-Tongji (GEOS)
UCB (UC Berkeley THM Code)
PNNL (STOMP-HYDT-KE)
GPSFlow/Hydrate
Table 2. Reservoir parameters for BP4.
ParametersValueParametersValue
Grain density2600.0 kg/m3Grain specific heat1000.0 J/(kg·°C)
Porosity0.3Wet thermal conductivity3.1 W/(m·K)
Intrinsic permeability k x , y , z   =   3.0   ×   1 0 13   m2Dry thermal conductivity1.0 W/(m·K)
Fluid type2-Bingham fluidThreshold pressure gradient1.0 MPa
Relative permeability Stone   model :   S r a = 0.12 ,   S r g = 0.02 ,   n = n g = 3.0
Capillary pressurevan Genuchten model
λ   =   0.45 ,   S r a   =   0.11 ,   1 / P 0   =   0.00008   P a 1 ,   P m a x   =   5.0   ×   10 6   Pa ,   S a m a x   =   1.0
Numerical simulators for comparisonJLU (HydrateBiot)
Ulsan-KIGAM (Geo-COUS)
LBNL (TOUGH + Hydrate)
NETL (MIX3HRS-GM)
LLNL-Tongji (GEOS)
UCB (UC Berkeley THM Code)
PNNL (STOMP-HYDT-KE)
GPSFlow/Hydrate
Table 3. Basic property parameters of the hydrate deposit for numerical model simulation.
ParametersValueParametersValue
ThicknessOverburden:30.0 m Overburden:0.42
GHS:21.1 mPorosityGHS:0.40
Underburden:30.0 m Underburden:0.38
Intrinsic permeability 1 k x , y , z   =   1.0 × 10⁻¹⁶ m2
(Isotropic, overburden and underburden)
Rock grain density2600.0 kg/m3
Geothermal gradient46.95 °C/kmDry/Wet thermal conductivity1.0/3.1 W/(m·℃)
Gas compositionCH4Hydration number6.0
Pressure at the base of GHS15.14 MPaTemperature at the base of GHS14.23 °C
Relative permeability model k r A = max 0 ,   m i n S A S i r A 1 S i r A n ,   1
k r G = max 0 ,   m i n S G S i r G 1 S i r G n G ,   1
Capillary pressure model P c a p   =   P 0 S * 1 / λ   1 1 λ ,
subject to the restriction:
P m a x     P c a p   0 ,   S * = S A S i r A S s A S i r A
1 Intrinsic permeability of GHS and initial saturation of gas hydrate are listed in Table 4.
Table 4. Intrinsic permeability of GHS, initial conditions and wellbore conditions of five 3D cases.
CaseIntrinsic Permeability (m2)Initial ConditionsWellbore Conditions
Case 4 k x , y , z   =   1.0 × 10⁻¹³Phases: Aqueous and Hydrate
P   =   14.93   MPa ,   T   =   13.29   ° C ,   S h   =   0.5
Phase: Aqueous
P   =   3.0   MPa ,   T   =   10.0   ° C ,   S h   =   0.0
Case 5 k x , y , z = 1.0   ×   10 13 Phases: Aqueous and Hydrate
P   =   14.93   MPa ,   T   =   13.29   ° C ,   S h   =   0.3
Phase: Aqueous
P   =   3.0   MPa ,   T   =   10.0   ° C ,   S h   =   0.0
Case 6 k x , y , z   =   3.0 × 10⁻¹³Phases: Aqueous and Hydrate
P   =   14.93   MPa ,   T   =   13.29   ° C ,   S h   =   0.5
Phase: Aqueous
P   =   3.0   MPa ,   T   =   10.0   ° C ,   S h   =   0.0
Case 7 k x , y , z   =   5.0 × 10⁻¹⁴Phases: Aqueous and Hydrate
P   =   14.93   MPa ,   T   =   13.29   ° C ,   S h   =   0.5
Phase: Aqueous
P   =   3.0   MPa ,   T   =   10.0   ° C ,   S h   =   0.0
Case 8 k x , y   =   1.0   ×   10 13 ,   k z   =   5.0 × 10⁻¹⁴Phases: Aqueous and Hydrate
P   =   14.93   MPa ,   T   =   13.29   ° C ,   S h   =   0.5
Phase: Aqueous
P   =   3.0   MPa ,   T   =   10.0   ° C ,   S h   =   0.0
Disclaimer/Publisher’s Note: The statements, opinions and data contained in all publications are solely those of the individual author(s) and contributor(s) and not of MDPI and/or the editor(s). MDPI and/or the editor(s) disclaim responsibility for any injury to people or property resulting from any ideas, methods, instructions or products referred to in the content.