Article

The Influence of Seafloor Gradient on Turbidity Current Flow Dynamics and Depositional Response: A Case Study from the Lower Gas-Bearing Interval of Huangliu Formation II, Yinggehai Basin

1
School of Earth Sciences and Engineering, Xi’an Shiyou University, Xi’an 710065, China
2
Shaanxi Key Laboratory of Petroleum Accumulation Geology, Xi’an 710065, China
3
CNOOC Limited Hainan Branch, Haikou 570300, China
4
Sinopec Geophysical Corporation Research and Development Center, Nanjing 210000, China
*
Author to whom correspondence should be addressed.
J. Mar. Sci. Eng. 2025, 13(9), 1616; https://doi.org/10.3390/jmse13091616
Submission received: 24 June 2025 / Revised: 31 July 2025 / Accepted: 21 August 2025 / Published: 24 August 2025
(This article belongs to the Section Geological Oceanography)

Abstract

The Huangliu Formation, Section I, Gas Group II, at the eastern X gas field of the Yinggehai Basin, hosts thick, irregularly deposited sandstone bodies. The genesis of these sedimentary sand bodies has remained unclear. Utilizing drilling logs, core samples, and 3D seismic data from this field, this study integrates seismic geomorphology analysis, paleo-hydrodynamic reconstruction, and sedimentary numerical simulation to investigate the spatiotemporal evolution of the depositional system under micro-paleotopographic conditions during Gas Zone II sedimentation. Key conclusions include the development of seven morphologically diverse isolated sand bodies in the Lower II Gas Zone, covering areas of 1.4–13.4 km2 with thicknesses ranging from 8.0 to 42.0 m. These sand bodies consist predominantly of massive fine-grained sandstone, characterized by box-shaped gamma-ray (GR) log responses and U- or V-shaped seismic reflection configurations. Reconstruction of paleo-turbidity current hydrodynamics for the Lower II depositional period was achieved through analysis of topographic slope gradients and the dimensional constraints (width/depth) of confined channels. Critically, slope gradients within the intraslope basin prompted a transition from supercritical to subcritical flow states within turbidity currents. This hydraulic transformation drove alternating erosion and deposition along the seafloor topography, ultimately generating the observed irregular, isolated turbidite sand bodies.

1. Introduction

In shallow marine settings, seafloor topography dominates turbidite depositional processes. Even subtle microtopographic relief can significantly influence lobe architecture, lithofacies distribution, and sediment partitioning through mechanisms such as flow confinement and pathway steering [1,2,3,4,5,6]. Straub et al. demonstrated via flume experiments that elevated deposition rates on outer bends of sinuous channels deviate from classical fluvial depositional models, highlighting the necessity to investigate topography/turbidity current interactions [7]. As a representative area for shallow marine turbidite development, the Yinggehai Basin exhibits multi-scale slope-break geomorphology shaped by tectonic/sedimentary evolution. Here, paleotopography exerts direct control through gradient variations: sand bodies are thin and erosional at topographic highs, whereas they become thick and depositionally enriched in topographic lows; topographic depressions guide channel propagation directions [8]. Crucially, seafloor gradients govern erosion/deposition processes by modulating turbidity current flow regime transitions and shear stresses, ultimately controlling 3D sand body architecture and lithological characteristics [2,9,10,11,12,13,14,15,16].
Although topography controls sedimentary mechanisms, sedimentary bodies interpreted as turbidites are present within the study area and target layers. Variations in their thickness and lateral continuity have been identified, but several limitations still exist in the current study: (1) while seismic profiles reveal the presence of complex paleotopography, the issue of how topography controls the distribution of these sedimentary bodies remains controversial; (2) seismic, well log, and core studies are limited in capturing the transient flow state changes induced by water jumps during erosion or deposition within the sedimentary bodies, along with the underlying mechanisms. Furthermore, numerical modeling lacks constraints from actual topographic parameters, leading to insufficient explanations for the genesis of irregular sand bodies within the channels. This study integrates seismic, well log, and core data with quantitative topographic parameters (slope, dip angle, and channel width-to-depth ratio), and inverts key dynamic parameters to reveal the sedimentary body transformation mechanisms under the staircase topography of the Yinggehai Basin, offering important new methods for shallow marine reservoir prediction.

2. Regional Geological Setting

The Yinggehai Basin (Figure 1a) is a large-scale Cenozoic strike-slip extensional basin located in the northwestern South China Sea, extending NNW-SSE along basement faults at the junction of the northern South China Sea passive continental margin and the Indochina Block. Its tectonic evolution progressed through four distinct phases: initial rifting during the Early Paleogene, fault-dominated subsidence in the Late Paleogene, Mid-Neogene post-rift thermal subsidence, and accelerated post-rift subsidence from the Late Neogene to the Quaternary [17,18]. Covering 110,000 km2, the basin comprises first-order tectonic units including the Yingdong Slope Belt, Central Depression Belt, Yingxi Slope Belt, and Hanoi Depression Belt, with multiple faults developed around the central depression (Figure 1a) [19,20]. The Yinggehai Basin, as a favorable sedimentary environment, hosts gravity flow deposits [19,21,22,23,24]. The sources from Hainan Island, the eastern Vietnamese Red River, and the Lanjiang River systems converge in the northern central depression zone of the Yinggehai Basin [25] (Figure 1a).
The target interval is located within Member 1 of the Huangliu Formation (Miocene). Figure 1b displays the seismic profile during the depositional period of Member 1 of the Huangliu Formation. Interface T31 represents the basal boundary of the Huangliu Formation, while interface T30 marks the top boundary of Member 1. The section between these two interfaces corresponds to the initial flooding surface (MFS). During the deposition of Member 1 (Upper Miocene), tectonic activity was relatively weak, and the paleo-topographic relief (uplift/depression configuration) had diminished. Influenced by late-stage rifting tectonics, this period was characterized by accelerated subsidence, classified as a shallow marine shelf depression phase [26,27]. Currently buried at depths of 2600–3500 m, with paleo-water depths ranging from 40 to 110 m. This setting facilitated the development of large-scale, multi-phase turbidite systems, exhibiting fine grain size, rapid lateral migration, and thick accumulation [27,28,29,30,31]. The study area resided in a relatively deep-water sector of the continental shelf under low tectonic stress. Existing regional geological studies of the Yinggehai Basin indicate that during Huangliu Formation deposition [32], the sedimentation rate in the southern Yinggehai area exceeded the subsidence rate in the northern sector. This differential resulted in migration of depocenters, manifesting structurally as a north/high, south/low (NHSL) topographic configuration.

3. Data Acquisition and Analytical Methods

3.1. Paleotopographic Characteristics

Using the 3D seismic data from the 3400 km2 eastern region and 500 km2 high-density 3D seismic data, with a seismic frequency range of 10–80 Hz and a dominant frequency of 35 Hz (Figure 1c), the target layer velocity is approximately 3500 m/s. The vertical seismic resolution is 25 m, with a detectable thickness of 10 m.
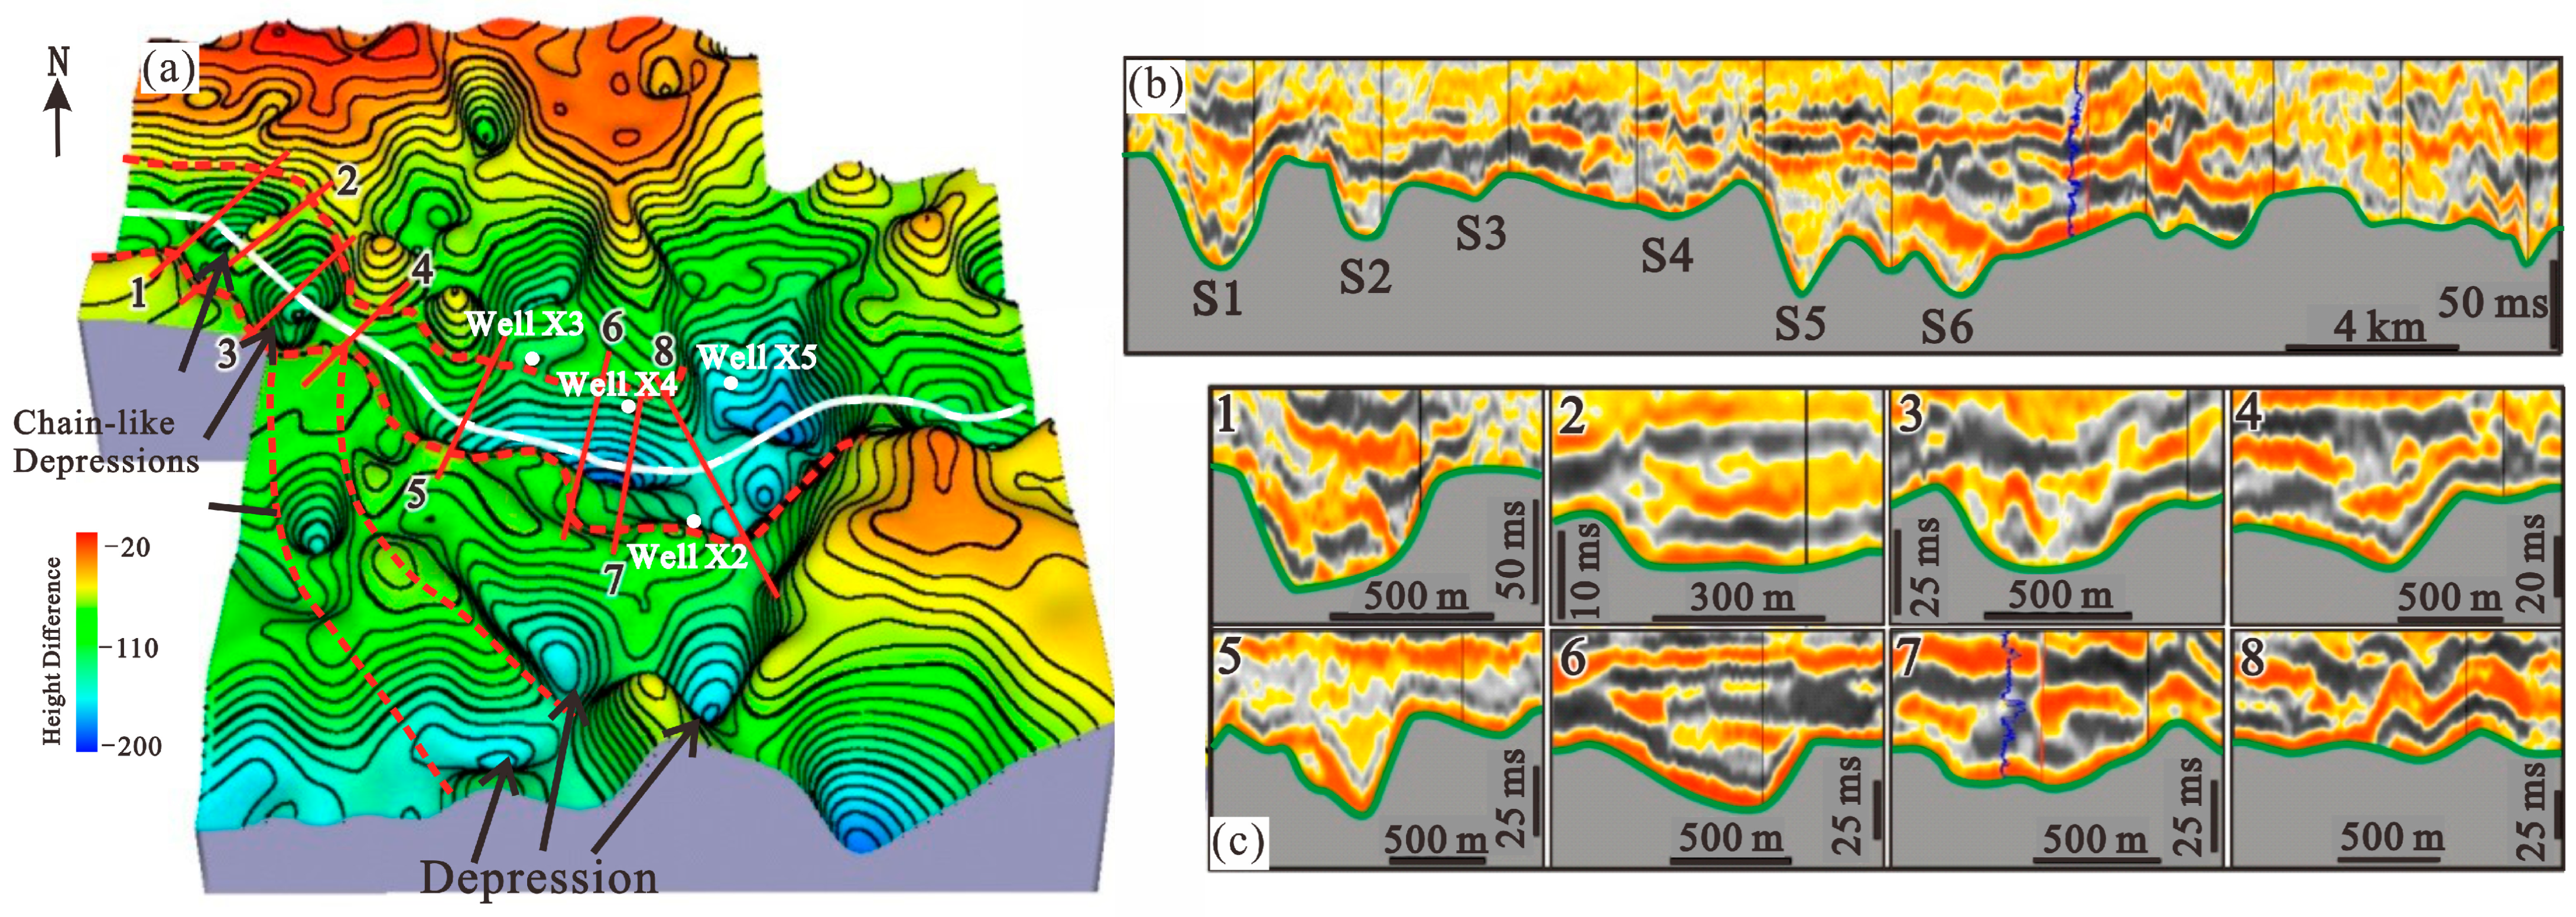
Based on the three-dimensional seismic data of the Yinggehai Basin, combined with previous research and the geological characteristics of the region, a method integrating seismic sequence stratigraphy and geomorphology was applied to study the topography and landforms of the area. Paleogeomorphological restoration techniques were employed to interpret the seismic macro-sedimentary unit isochronous interfaces [31]. The general approach for the paleogeomorphological restoration is as follows: VSP data and well log composite records were used to obtain the corresponding time/depth relationship. The T0 isochronous interface was converted into depth interfaces, and the strata thickness was calculated to derive the original thickness of sandstone and mudstone layers. Subsequently, sonic time-shift corrections were applied to decompact the strata, resulting in the original thickness of the layers. Since no significant stratigraphic erosion has occurred in the study area, the corrected strata thickness can approximately reflect the seafloor morphology during the deposition period. This approach was then used to generate the paleotopographic map (Figure 2). The reconstructed H1II paleotopography reveals a chain-like depression cluster across Dongfang X Gas Field—interpreted as a paleo-channel—with thicker strata in the northern high-relief sector and thinner strata in the southern low-relief zone. Irregular and linear depressions within this paleo-channel suggest a dominant sediment supply from the western Lam River provenance. Basin topography controlled NW-SE sediment dispersal patterns, evidenced by seismic cross-sections perpendicular to the channel axis (Figure 2c) showing irregular depressions (S1~S6) eroded and infilled by sand-laden turbidity currents, with thick sand accumulations in depression centers.

3.2. Depositional System Characterization

3.2.1. Typical Core Facies Characteristics

In the study area, the identification of sand bodies modified by gravity flows largely relies on core observation, and core facies analysis can be used to interpret sedimentary structural features. The Lower II Member of the Huangliu Formation is primarily influenced by gravity flow processes, with the predominant development of blocky bedding and a general fine-grained sandstone texture.
The first type of lithofacies is characterized by massive bedding with homogeneous sandstone lithology, lacking significant grain size variations or sedimentary structures. It is sharply bounded by the underlying mudstone interval (Figure 3a). These features are interpreted as the result of rapid deposition from high-density turbidity currents, corresponding to the S3 division in the Lowe model [33], indicative of a high-energy channelized erosional environment with limited sediment sorting. The second lithofacies consists predominantly of fine-grained sandstone with mud clasts and trace fossils but lacks other prominent sedimentary structures. Although the grain size is generally uniform, thin mud laminae are present (Figure 3b,c). Mud clasts show no preferred orientation parallel to bedding nor a fining-upward trend. Trace fossils occur sporadically, mainly at the top of beds or alternating with massive units, typically forming thin layers. This facies corresponds to the Bouma D–E divisions [34], suggesting a decline in flow energy. The third lithofacies is defined by discontinuous, scour-based cross-bedded (massive) structures, characterized by the coexistence of box-like bedding and scour cross-lamination with interbedded mud laminae (Figure 3d). These features record alternating deposition by pulsating low-density turbidity currents (Bouma B–C divisions) and background sedimentation [34]. The massive sandstone facies (well X1) dominates the proximal setting, while the distal setting (well X2) is marked by more ripple and cross-laminated units, indicating a longitudinal facies transition. The channel system was primarily formed by gravity-driven flows, locally modified by tidal influences, and is consistent with classical turbidite facies models [33,35] (Figure 3d).

3.2.2. Log and Seismic Facies Characteristics

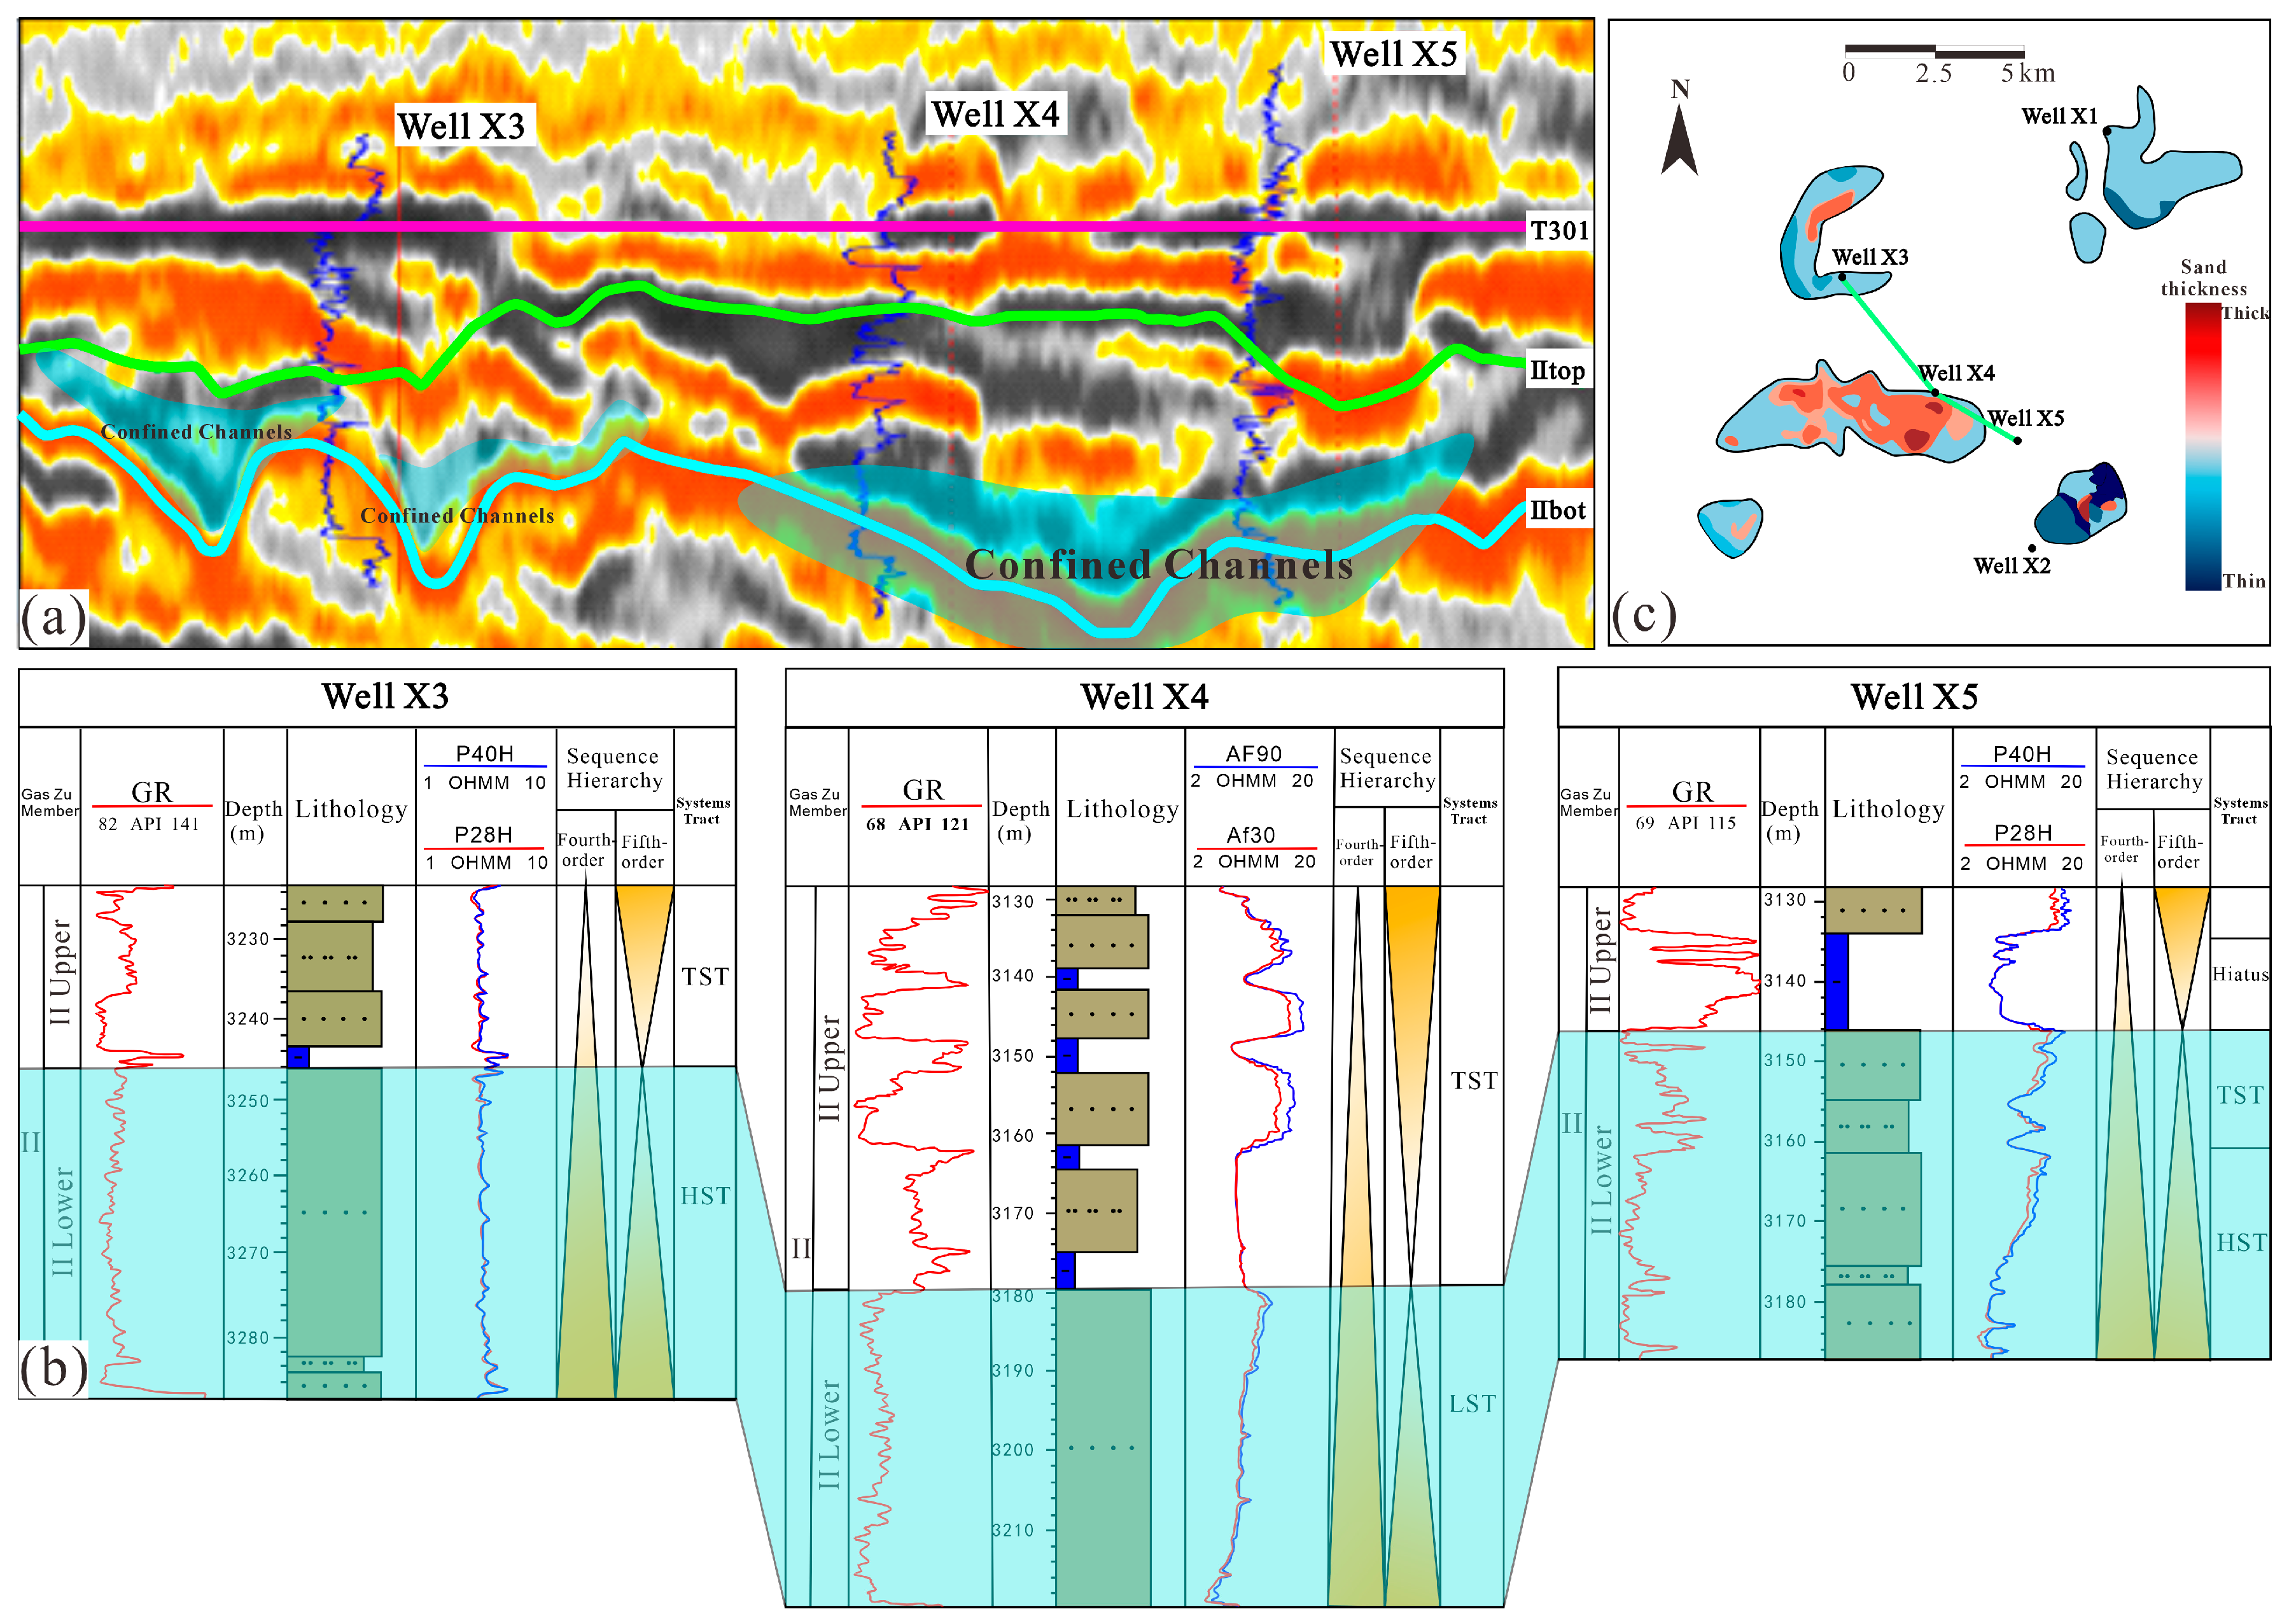
The well profile trend is northwest–southeast (Figure 1a), with minimal topographic control, most of which is in the confined deposition infilling stage. Well X1 is located at the main part of the confined channel, and the profile exhibits “U” and “V” shapes (Figure 4a). The sand body has a large area in the plan view, approximately 9.2 km2, and it extends in a tongue-like shape (Figure 4c). A confined channel develops between wells X3, X4, and X5, with seismic facies showing medium-amplitude oblique fills, and the massive sandstone in the plan view forms an elliptical shape (Figure 4c), the seismic facies characteristics and massive sandstone distribution are consistent with features typically observed in infilling stages (Figure 4c). The well data show that in the Lower II Member, all three wells—X3, X4, and X5—encountered massive sandstone greater than 40 m thick, with the corresponding natural gamma curves generally exhibiting a serrated box-like pattern. The log facies combination includes superimposed box-like and funnel-shaped patterns (Figure 4b), with abrupt contacts at both the top and bottom, and thick stacked sandstone layers or isolated box-shaped or bell-shaped sand bodies. The gamma ray log patterns, with box-like or bell-shaped curves and sandstone thicknesses exceeding 40 m, are typical of rapid, high-volume depositional events, with the largest sand body area located at well X4, where the sand body thickness reaches 42 m. Seismic profiles show elongated depressions in the subsurface, oriented NW-SE, in which confined channels developed with limited lateral migration. Lateral migration of the channel is constrained, thus making the confined channel relatively straight with small curvature. In this confined channel, turbidity current deposition predominantly occurs in vertical aggradation, with thicker deposits in the channel. The profile typically exhibits “U”- or “V”-shaped features, and the well logs display box-shaped patterns (Figure 4b).
Based on the seismic profile, the target stratigraphic interval is selected, and the GR logs from the wells are extracted [36,37]. By setting a specific range of GR values, sandstone and mudstone within the target interval are differentiated. Sandstone typically corresponds to lower GR values, while mudstone is characterized by higher GR values. The vertical distance between the upper and lower boundaries of the identified sandstone is then measured to statistically calculate the sandstone thickness within the target interval. A sandstone thickness distribution map (Figure 4c) is subsequently created.

3.2.3. Numerical Modeling of Turbidity Current Depositional Processes Under Complex Topographic Conditions

Based on the analysis of the target interval, this study conducts numerical simulations of turbidity current depositional processes by investigating geometric parameters within submarine channels. It aims to determine the sedimentary processes and dynamic mechanisms governing sand body formation in such paleogeomorphologic settings, and to elucidate the genetic mechanisms of sand body deposition and erosion under complex channel conditions.
This study targets a chain-like negative topographic feature within the paleotopography of the H1II Sub-member (Figure 2). Applying paleo-turbidity current dynamics, we investigate depression genesis in distributive channel systems through quantitative characterization. Key geometric parameters of individual depressions include the following: ① length, height, gradient; ② lengths and gradients of upstream-facing and downstream-facing slopes; ③ cross-sectional asymmetry; ④ length-to-height ratios. For bankfull hydraulic geometry of submarine distributive channels, critical parameters comprise the following: ① bankfull widths at thalweg (W1) and levee crest (W2) cross-sections; ② bankfull depths at thalweg (h1) and levee crest (h3) cross-sections [38]. Six retrogradationally migrating asymmetric depressions (S1~S6) identified along the channel axis (Figure 2) provide geometric constraints for inferring turbidity current hydrodynamics.
Using the restored paleotopographic map (Figure 2), we calculated channel gradients along axial seismic profiles and measured channel widths/depths along cross-sectional transects to obtain preliminary geometric parameters. Key turbidity current hydrodynamic parameters—including Richardson number, bed friction coefficient, minimum/maximum flow velocities (U_min, U_max), and minimum/maximum sediment fluxes (Q_min, Q_max)—were derived through computational equations.
Initially, Ri is iteratively solved through Equations (1) and (2). Subsequently, turbidity current velocity (U) is computed from Equations (3)–(5) using Ri. Then, bankfull discharge (Q) is determined based on U. Finally, Fr is derived via Equation (7).
0 = S C f b 1 1 + e w ( 1 + 0.5 R i ) C fb 1 R i
e w = 0.075 1 + 718 R i 2.4
C f i = e w ( 1 + 0.5 R i )
r = C f i C f b
U 2 = ( 1 1 + r ) R C g h s C f b
Q = U W h
F r = U R C g h
Applying Chanson’s (2014) [39] momentum conservation framework for submerged density flows, the fundamental equations governing post-jump turbidity current characteristics—Froude number (Fr), thickness (h2), and velocity (U)—are expressed as
F r 2 = 2 1.5 F r 1 ( 1 + 8 F r 1 2 1 ) 1.5
h 2 = h 1 2 ( 1 + 8 F r 1 2 1 )
U 2 = h 1 h 2 U 1
In which ew is the dimensionless entrainment coefficient of ambient seawater into turbidity current; Cfb is the bed friction coefficient between turbidity current and channel substrate (0.002–0.005 [40]); R is the Richardson number; C is the sediment concentration. g is the gravitational acceleration (9.8 m/s2); h is the Bankfull channel depth (m).
Application of Equations (1)–(10) yields computed hydrodynamic parameters for the turbidity current system, with the results tabulated in Table 1.
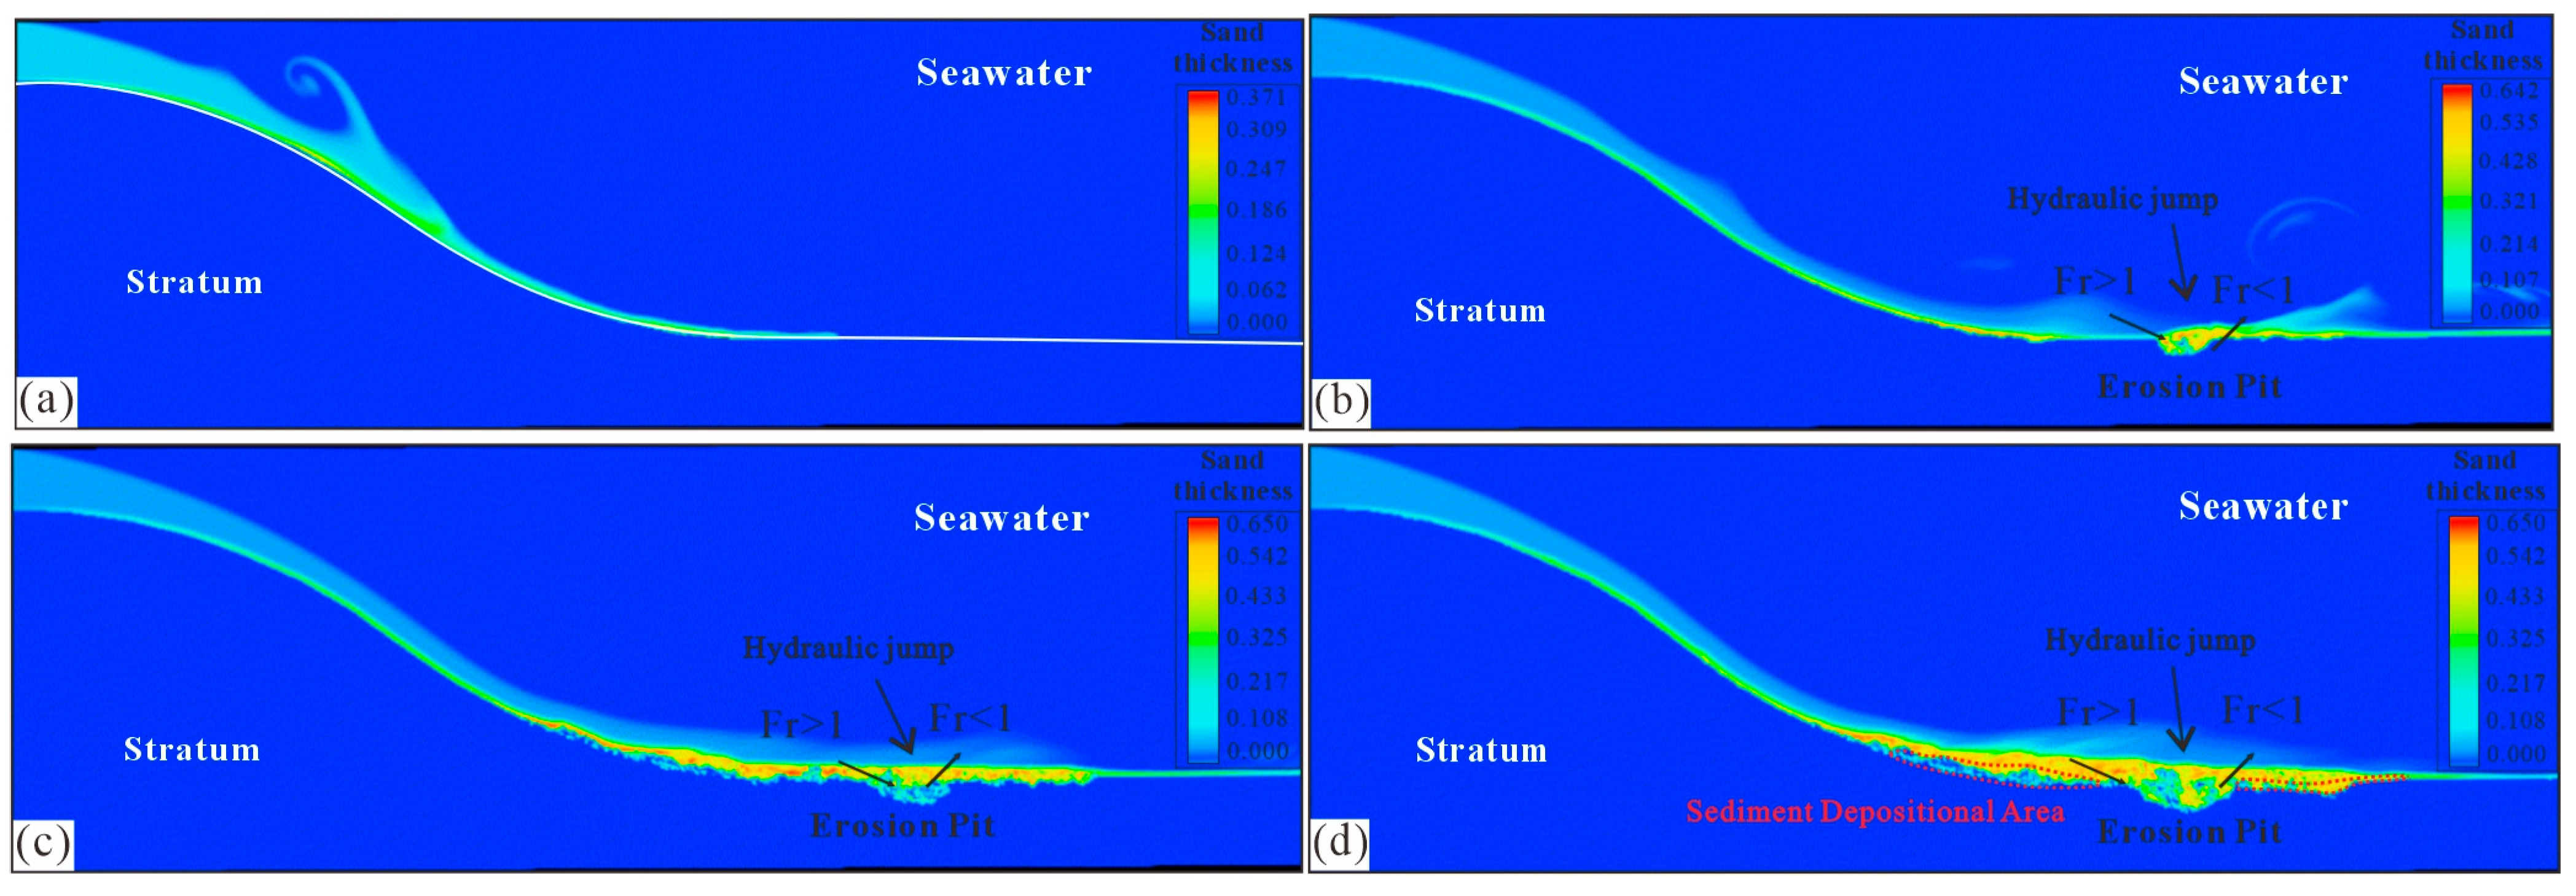
The triggering of supercritical flows—governed by topographic slope (dominant control), current discharge, and flow thickness [41,42,43]—served as the basis for numerical simulations of sand body formation during turbidite transport. Initial geological modeling integrated (a) paleotopographic/channel architectural parameters from Huangliu Fm. H1II-Lower, and (b) hydrodynamic similitude principles for low-gradient basins. Using estimated ancient turbidity current dynamics parameters, a computational fluid dynamics (CFD) model is established with Fluent to conduct numerical simulations. The simulations focus on the effects of variations in initial seabed sediment grain size and flow velocity, under a specific slope. Key simulation parameters, such as sediment grain size, concentration, initial velocity, and initial sediment layer thickness, are set. Based on the simulation results, the dynamic processes of erosion pits and sand bodies are observed over time, under a given slope. The analysis aims to investigate the impact of these processes on sediment accumulation and redistribution (Figure 5).

4. Results

Based on core observations, sedimentary structures, and preliminary biostratigraphic evidence, our analysis of core samples from the Lower Member II reveals three distinct lithofacies: massive-bedded sandstone facies, intraclast and trace fossil-bearing massive-bedded sandstone facies, and discontinuous concave cross (blocky)-bedding fine to medium sandstone facies. The blocky stratification often contains discontinuous mudstone laminae or trough cross-stratification, which reflects tidal and turbidity current influences occurring at different times. The blocky stratification coexists with trough cross-stratification developed with mudstone laminae. These features record two alternating dominant processes: under the influence of high-density, episodic turbidity current activity, blocky sandstone is formed, with some small discontinuous laminae or troughs potentially reflecting fluctuations in fluid dynamics or deposition processes. During the intermissions between turbidity currents, the area experiences tidal bottom current effects, which scour and modify the top surfaces of the sandstones, forming trough cross-stratification. The repeated cycles of these two processes result in variations in both internal and spatial features of the facies, reflecting the superposition of dominant mechanisms in the time sequence and their heterogeneous spatial distribution (Figure 3d). The sand bodies in the study area are significantly influenced by gravity flow processes, as evidenced by the widespread development of blocky bedding, fine-grained sandstone texture, and rapid sedimentation characteristics. This indicates that during the deposition of the Lower II Member of the Huangliu Formation, gravity flow was the primary mechanism for sediment accumulation.
The sand body thickness is greatest between wells X4 and X5, while it is thinner near well X3. Based on the observations discussed earlier, it is concluded that the primary sedimentary system during the second stage of the Huangliu Formation is characterized by confined channels. Within these confined channels, deposition primarily occurs through vertical aggradation, with the channel sediment layers being relatively thick and exhibiting a “U”- or “V”-shaped cross-section. The logging response of these deposits typically shows a box-like pattern (Figure 4).
The numerical simulation results show that when the fluid moves from a high to a low slope on the seabed, a transition occurs from supercritical flow to subcritical flow. During this process, a flow separation phenomenon, known as a hydraulic jump, takes place, accompanied by changes in velocity and flow structure, as shown in Figure 5. The initial interface consists of stratified layers with a certain slope (Figure 5a). When the fluid flows from a high to a low slope, the turbidity current has a high velocity, and the Froude number (Fr) is greater than 1, indicating supercritical flow. As the supercritical flow enters and reaches the base of the slope, a hydraulic jump occurs, eroding the underlying layers. The flow velocity and energy decrease, and the Froude number (Fr) drops below 1, transforming the flow into subcritical flow. During this process, the low-density turbidity current is carried upward, while the high-density turbidity current deposits downward. Thick sandy deposits develop in the region just before the hydraulic jump, marking the transition from supercritical to subcritical flow (Figure 5b). As time progresses, the prolonged erosion, transport, and redeposition process continuously alters the front-end deposits. The transport path lengthens, and at the next slope base, the supercritical flow again transitions into subcritical flow, forming an undulating terrain (Figure 5c). The turbidity current fills and deposits in this terrain, forming confined lobate deposits (Figure 5d).

5. Discussion

5.1. Turbidity Current Deposition and Sand Body Formation Conditions

The observed variation in sandstone thickness between wells X4, X5, and X3 corresponds well with the regional topographic features, indicating that during continuous turbidity current deposition, the ancient depressions were gradually infilled with sediment transported by these currents. Once the sediment overtopped the lowest points of the depressions, deposition continued in newly eroded areas. In steeper channel zones, turbidity currents began depositing sediment as they entered broader, lower-gradient regions. At the distal end of the confined channel—where lobe development is most prominent—changes in turbidity current dynamics led to localized erosion in some areas, while reduced flow velocity in others resulted in the formation of irregularly shaped sand bodies.

5.2. Spatiotemporal Evolution of Sand Bodies

The spatiotemporal evolution of sand body genesis has often been studied at large scales, leading to insufficient investigation into the finer details of sedimentary evolution and genetic mechanisms. The distribution of ancient depressions formed under early gravity flow influence is complex and varies in scale. Based on the analysis of the target interval, it is evident that the gravity-flow-driven infilling stage persisted for an extended period. The sand bodies affected by gravity flows exhibit sedimentary patterns influenced by hydrodynamic forces, which account for variations in sandstone thickness. Therefore, to further understand the depositional processes and dynamic mechanisms responsible for sand body formation under such geomorphological conditions, numerical simulations based on the internal geometrical parameters of the channel system were conducted to quantitatively analyze turbidity current deposition. This approach facilitates the discussion of the sedimentary and erosional mechanisms of sand bodies under complex channel conditions.

5.3. Control of Turbidity Current Behavior and Sand Body Distribution

The spatial distribution of massive sandstone bodies, in combination with the observed seismic facies (medium-amplitude oblique fills) and the tongue- or elliptical-shaped geometry in the plan view, suggests that deposition occurred during the infilling stage of a confined channel system. During this stage, the channel was largely filled with sediments, reducing topographic relief and resulting in vertical aggradation rather than lateral migration. Furthermore, the log facies from wells X3, X4, and X5 display consistent box-like and bell-shaped gamma ray curves, abrupt contacts, and sandstone thicknesses exceeding 40 m. These features are characteristic of rapid deposition by high-density turbidity currents under strong hydrodynamic conditions. The limited lateral migration and straight channel morphology further support the interpretation of a confined flow regime, where deposition is concentrated along the channel axis with minimal lateral dispersion. The confined channel turbidity currents were likely influenced by early-formed, elongated negative topographic features that acted as physical boundaries. These features restricted the lateral movement of turbidity currents and promoted vertical aggradation. Such confinement prevented the flows from freely dispersing across the basin floor, thereby enhancing the thickness and continuity of the channel-axis sand bodies.
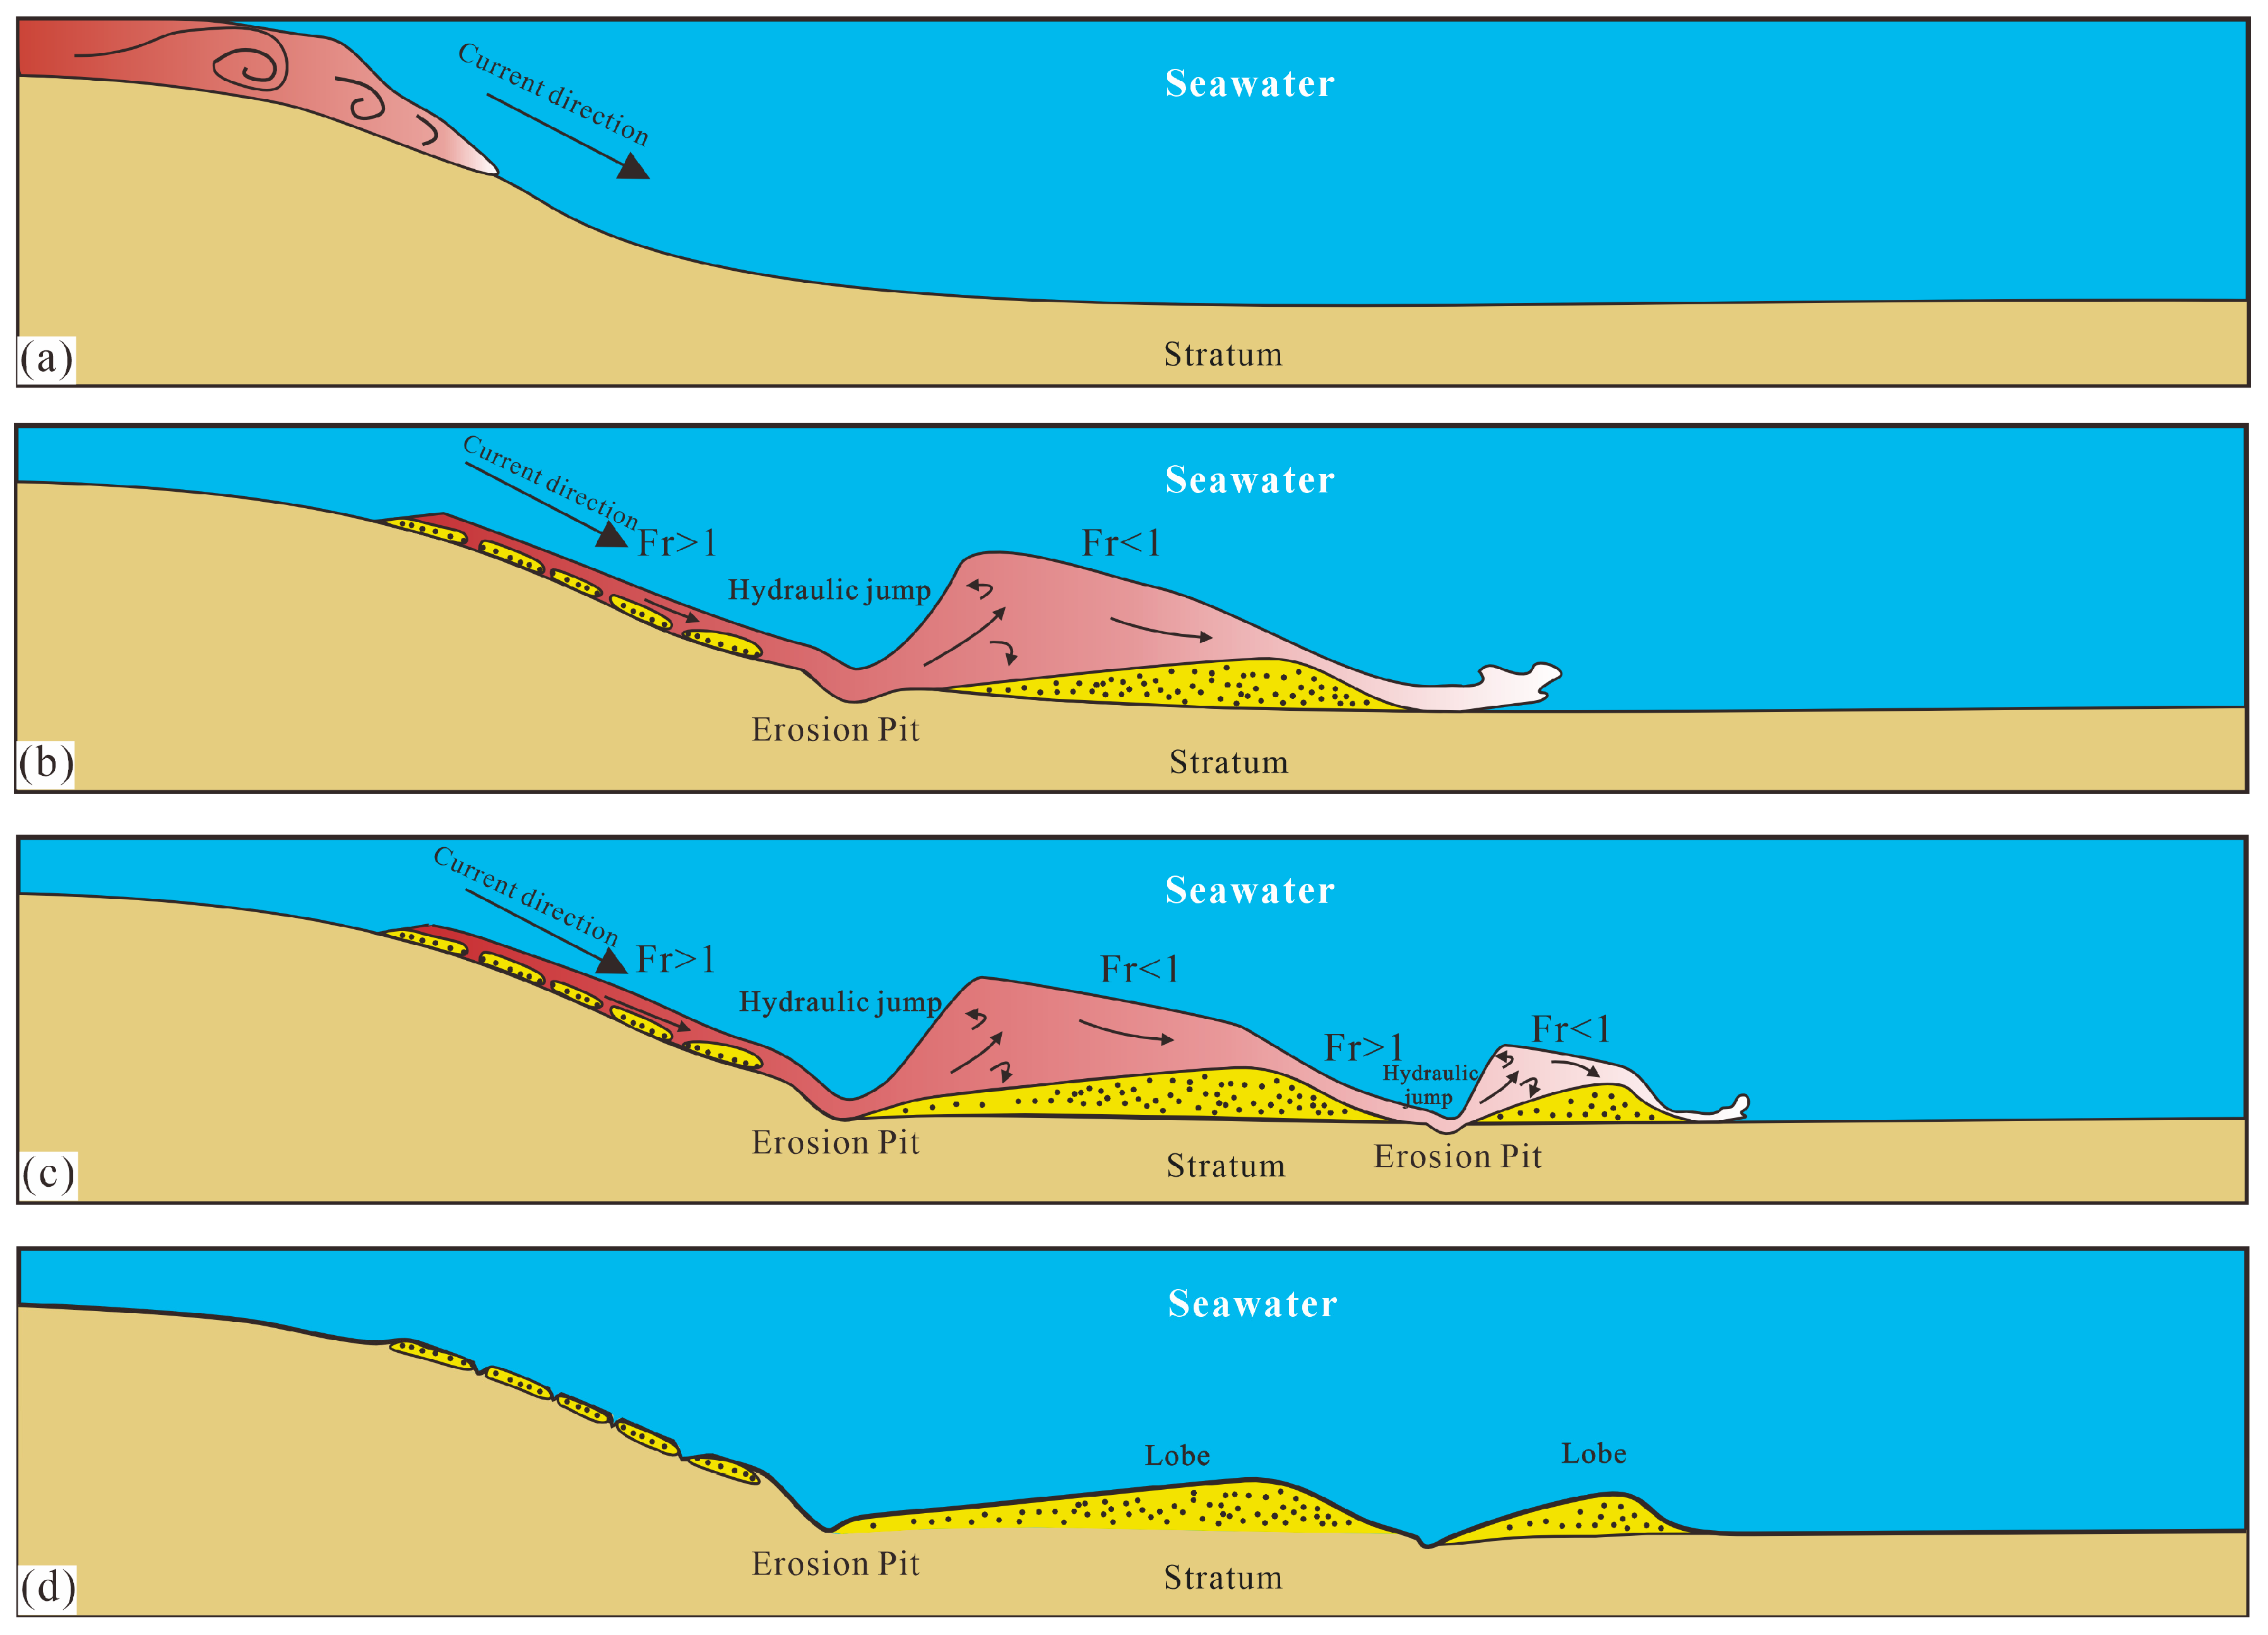
Non-classical slope breaks governed topographic gradients [44,45], exerting critical control over sand body boundary truncation and abrupt thickness variations. This resulted in discontinuous isolated sheet sands on steep slopes due to intense scouring; low-sinuosity ribbon sands on gentle slopes; and supercritical to subcritical transitions with hydraulic jumps at steep/gentle transitions, depositing irregular lobes/isolated sheets exhibiting stepped geometries and vertical aggradation (Figure 6). As key submarine fan components, these sand bodies display thickness differentiation—thick massive sands from high-energy turbidity currents versus thin sand/mud interbeds from low-energy flows—while their geometries encode paleo-hydrodynamics and sediment supply. Analyzing slope controls on turbidity current behavior and erosion/deposition processes in shallow marine settings is thus essential for deciphering sand body distribution patterns and source-to-sink systems [36].
The Yinggehai Basin, as a typical shelf basin, experiences a transition from supercritical to subcritical flow regimes under the influence of slope, leading to both erosional and depositional processes. Similar shallow marine shelf basins are also found in the Moray Firth Basins of the North Sea. In the Moray Firth Basins [46], the variation in slope is closely associated with tectonic belts, which bear similarities to the slope types in the Yinggehai Basin, particularly in terms of their influence on turbidity current deposition. Both basins share similar controlling factors in their sedimentary systems, and slope variation significantly impacts sediment distribution and thickness, especially the distribution of sandstone, which shows a pronounced relationship with slope.

5.4. Influence of Slope on Sand Body Deposition

Slope morphology can systematically control the distribution of sandy and muddy sediments by influencing the pathway, energy, and deposition loci of turbidity currents. Prather et al. classified continental slopes into three types [47]: gentle slopes, stepped slopes, and confined slopes. On gentle slopes, turbidity currents can travel long distances with sustained energy, resulting in high depositional efficiency. Sandy sediments tend to accumulate at the slope toe and basin floor. This slope type is particularly favorable for predicting large, laterally extensive sand bodies in reservoir modeling, as the relatively uniform depositional processes lead to more predictable facies distributions. Stepped slopes are characterized by staircase-like morphologies where topographic steps trap sandy turbidity flows, forming localized, sand-rich “hanging fan aprons”. In such settings, reservoir modeling must account for these small-scale sedimentary heterogeneities, which are of particular relevance to reservoir characterization in areas such as the Tawila West Field in the Gulf of Suez Basin [48]. Confined slopes represent topographically enclosed slope basins, where the highest sand content is typically found in the mid-slope regions and decreases downslope toward the basin floor. These environments have the lowest depositional efficiency, and their complex morphology necessitates careful integration of seismic and well log data. Such settings may influence rock physical properties and complicate reservoir prediction models [49]. The fundamental differences in sedimentation across these three slope types are slope-controlled: gentle slopes with low gradients allow for long-distance sediment transport; stepped slopes with abrupt breaks promote flow transformation; and confined slopes with steep, enclosing boundaries restrict flow dispersion.
Slope gradient acts as a critical triggering factor. As topography becomes steeper, the increase in slope gradient elevates the potential energy of sediments carried by turbidity currents, thereby enhancing their energy. At the transition from high to low gradients, a flow regime transition occurs. Turbulence suspends sand-sized particles, which undergo differential settling by grain size when flow velocity decreases. The conversion of sediment potential energy to kinetic energy intensifies the hydraulic jump, resulting in reduced depositional thickness. Collectively, these processes exert macroscopic control over the distribution range, orientation, and depositional system type of sand bodies [50,51]. Furthermore, higher sediment concentration within turbidity currents promotes the occurrence of hydraulic jumps. Coarser-grained sediments lead to higher depositional rates, favoring the preservation of submarine sand body bedforms. Higher flow discharge enhances erosive capacity, facilitating the formation of both hydraulic jumps and step-like bedforms [52].
The control of slope gradient thresholds on turbidity current behavior is modulated by sediment supply and fluid properties. On gentle topography with slopes <0.1°, gradient controls the lateral facies transition within depositional lobes, generating transition zones up to kilometer-scale widths and forming aggradational lobe fringe facies with vertical stacking reaching tens of meters. When slope thresholds fall within 0.02–0.06°, the self-suspension effect of turbidity currents is triggered, facilitating sediment bypass over distances exceeding 100 km without erosion; this results in non-deposition along the channel axis and deposition of thin sand layers only along its margins [4,53]. When turbidity currents traverse slopes exceeding 0.6°, sediment concentration and grain size govern whether the flow attains a supercritical state, potentially generating hydraulic jumps that form step-like bedforms [38,54,55]. However, slopes steeper than 0.92° cause sustained flow acceleration, delaying the flow regime transition to distal basin areas and reducing the likelihood of step-like bedform development. Steeper slopes increase the downslope component of gravitational force, promoting continuous acceleration that suppresses the energy required for internal hydraulic jumps while increasing the potential for transition to subcritical flow [52,56].

6. Conclusions

This study focuses on the Lower II Member of the Huangliu Formation in the Yinggehai Basin as the target interval, analyzing the control of seabed slope on sand body formation and its dynamic mechanisms. The main conclusions are as follows:
(1) Based on the lithofacies associations and vertical/lateral evolutionary characteristics, the occurrence characteristics of clasts/boulders within the sandstone bodies of the target interval in the study area are interpreted as high-density turbidity current deposits. Three lithofacies were identified during this period: blocky bedding sandstone facies, mud-clast and trace fossil-bearing blocky bedding sandstone facies, and discontinuous concave cross (blocky)-bedding fine to medium sandstone facies. The sedimentary bodies exhibit typical “U”- or “V”-shaped geometries on the seismic profiles, consistent with the confined channel fill morphology. These shapes align with the numerical simulation results (Figure 5), which replicate the erosional or depositional characteristics of the sedimentary bodies. Combined with the well log facies, the interpretation of a confined channel is supported.
(2) Multi-scale characterization integrating core/log/seismic data reveals that core and log data serve as control points for identifying lithological variations and vertical distribution within sand bodies. Isopach maps delineate sand body boundaries and planar distribution. The integration of these three datasets provides critical constraints for precise interwell reservoir sand body identification.
(3) The First Member of the Huangliu Formation developed in a shelf setting where slope gradient was the key factor controlling turbidity currents and deposition. When turbidity currents traversed slopes, their high velocity and thin sediment load promoted the formation of supercritical turbidity currents. Dynamic transitions between supercritical and subcritical flow states generated irregularly shaped sand bodies. As flows advanced from steep slopes to gentle terrain, slope gradient changes triggered internal flow transformations, with frequent supercritical/subcritical transitions accompanied by hydraulic jumps. Subsequent turbidity currents underwent repeated erosion/deposition cycles within irregular negative relief on the seafloor, ultimately forming isolated thick sand bodies.

Author Contributions

Conceptualization, Y.X. and L.L.; methodology, G.Z.; software, Y.X.; validation, Y.X., L.L. and G.Z.; formal analysis, Y.X. and X.Z.; investigation, G.Z.; resources, W.Z. and Z.Z.; data curation, J.W.; writing—original draft preparation, Y.X. and L.L.; writing—review and editing, Y.X., L.L. and G.Z.; visualization, Y.X. and G.Z.; supervision, L.L., W.Z., Z.Z. and X.Z.; project administration, L.L.; funding acquisition, L.L. All authors have read and agreed to the published version of the manuscript.

Funding

This research was supported by the National Major Science and Technology Project for New Oil and Gas Exploration and Development of China [Grant Number 2025ZD1402703], specifically through Sub-project 6: “Key Technologies for Development Geology and Reservoir Engineering in Ultra-Deepwater Ultra-Shallow Gas Fields”, which falls under Project 3: “Key Technologies for Efficient Exploration and Development in Deepwater Ultra-Shallow to Shallow Formations” of the larger program “Hydrocarbon Accumulation Mechanisms and Key Exploration & Development Technologies in the South China Sea” and the Xi’an Shiyou University Graduate Student Innovation and Practical Ability Training Program (YCX2513099).

Data Availability Statement

The data in this study can be obtained at the request of the corresponding author because the data involve confidentiality.

Conflicts of Interest

Author Wei Zhou was employed by the company CNOOC Limited Hainan Branch, and author Zhongpo Zhang is employed by the company Science and Technology Research and Development Center of Sinopec Geophysical Company. The remaining authors declare that the research was conducted in the absence of any commercial or financial relationships that could be construed as a potential conflict of interest.

References

  1. Wang, H.; Chen, S.; Jiang, S. Can large gravity flow sediments accumulate and develop in the shallow sea background? Earth Sci. 2022, 47, 3867–3868. [Google Scholar]
  2. Nasr-Azadani, M.M.; Meiburg, E.; Kneller, B. Mixing dynamics of turbidity currents interacting with complex seafloor topography. Environ. Fluid Mech. 2018, 18, 201–223. [Google Scholar] [CrossRef]
  3. Middleton, G.V. Sediment Deposition from Turbidity Currents. J. Annu. Rev. Earth Planet Sci. 1993, 21, 89–114. [Google Scholar] [CrossRef]
  4. Spychala, Y.T.; Hodgson, D.M.; Stevenson, C.J.; Flint, S.S. Aggradational lobe fringes: The influence of subtle intrabasinal seabed topography on sediment gravity flow processes and lobe stacking patterns. Sedimentology 2017, 64, 582–608. [Google Scholar] [CrossRef]
  5. Wynn, R.B.; Talling, P.J.; Masson, D.G.; Bas, T.P.L.; Stevenson, C.J. The Influence of Subtle Gradient Changes on Deep-Water Gravity Flows: A Case Study from the Moroccan Turbidite System. In Application of the Principles of Seismic Geomorphology to Continental-Slope and Base-of-Slope Systems: Case Studies from SeaFloor and Near-Seafloor Analogues; Prather, B.E., Deptuck, M.E., Mohrig, D.C., van Hoorn, B., Wynn, R.B., Eds.; SEPM Society for Sedimentary Geology: Tulsa, OK, USA, 2012; Volume 99, pp. 371–383. [Google Scholar]
  6. Nasr-Azadani, M.M.; Meiburg, E. Turbidity currents interacting with three-dimensional seafloor topography. Fluid Mech. 2014, 745, 409–443. [Google Scholar] [CrossRef]
  7. Straub, K.M.; Mohrig, D.; Mcelroy, B.; Buttles, J.; Pirmez, C. Interactions between turbidity currents and topography in aggrading sinuous submarine channels: A laboratory study. Geol. Soc. Am. Bull. 2008, 120, 368–385. [Google Scholar] [CrossRef]
  8. Deng, T.D. Sedimentary Simulation Experiment of Huangliu Formation in Dongfang Gas Field Group, Yinggehai Basin. Master’s Thesis, Yangtze University, Jingzhou, China, 2018. [Google Scholar]
  9. Jiang, P.; Li, M.J.; Zhou, W.; Li, M. Confined-unconfined lobe architecture and evolution of Huangliu Formation Unit 1 in Yinggehai Basin. J. Prog. Geophys. 2019, 34, 2451–2458. [Google Scholar]
  10. Meiburg, E.; Kneller, B. Turbidity Currents and Their Deposits. J. Annu. Rev. Fluid Mech. 2009, 42, 135–156. [Google Scholar] [CrossRef]
  11. Tian, D.; Jiang, T. The current situation and Prospect of sedimentary dynamics in deep water channels. Acta Sedimentol. Sin. 2024, 42, 1107–1127. [Google Scholar]
  12. Dang, Y.Y. Seismic sedimentological study of a section of submarine fan in the Huangliu Formation, Eastern Yinggehai Basin. Bull. Geol. Sci. Technol. 2023, 42, 118–128. [Google Scholar]
  13. Zhong, Z.H.; Zhang, Y.C.; He, X.H.; Xu, T.; Ren, J.Y.; Liu, X.Y.; Ling, T.; Han, G.M. Sequence stacking patterns and internal architecture of submarine fans in Huangliu Formation, Dongfang area, Yinggehai Basin. Mar. Geol. Quat. Geol. 2015, 35, 91–99. [Google Scholar]
  14. Kostic, S. Modeling of submarine cyclic steps: Controls on their formation, migration, and architecture. Geosphere 2011, 7, 294–304. [Google Scholar] [CrossRef]
  15. Zhong, G.; Cartigny, M.J.B.; Kuang, Z.; Wang, L. Cyclic steps along the South Taiwan Shoal and West Penghu submarine canyons on the northeastern continental slope of the South China Sea. Geol. Soc. Am. Bull. 2015, 127, 804–824. [Google Scholar] [CrossRef]
  16. Cao, Y.C.; Yang, T.; Wang, Y.Z.; Li, W.Q. Formation, evolution and sedimentary characteristics of supercritical sediment gravity-flow. Acta Pet. Sin. 2017, 38, 607–621. [Google Scholar]
  17. Huang, Y.T.; Yao, G.Q.; Zhou, F.D. Provenance Analysis of Shallow Marine Gravity Flow Sandbodies and Its Petroleum Geological Significance in Yinggehai Basin. Earth Sci. 2016, 41, 1526–1538. [Google Scholar]
  18. Wang, Y.Z.; Wang, J.M.; Wu, A.J.; Cao, Y.C.; Wang, S.P.; Li, H.Y.; Xiao, L.L.; Shen, J. Sedimentary Facies and Favorable Exploration Target Prediction under Sequence Constraint of the Second Member of Huangliu Formation in the Eastern Margin of Yinggehai Basin. J. China Univ. Pet. 2025, 49, 22–36. [Google Scholar]
  19. Li, H.; Yang, Z.Q.; Zhou, W.; He, Y.B.; Wang, Y.; Peng, X.; Li, Y.R.; Lv, X.B. Formation mechanism and reservoir distribution of shallow sea multi-level submarine fans of the Miocene Huangliu Formation in Dongfang 1-1 Gas Field, Yinggehai Basin. Oil Gas Geol. 2023, 44, 429–440. [Google Scholar]
  20. Li, L.; Zhang, P.; Zou, Y.; Ping, T.Q.; Zhuang, Y.; Wang, X.H. Seismic sedimentary facies of shallow marine in Dongfang X Area, Yinggehai Basin. Mar. Geol. Front. 2019, 35, 31–39. [Google Scholar]
  21. Zhu, S.P.; Zhang, C.; Zhou, W.; Meng, D.; Tang, X.Y. Evaluation and Prediction of Reservoir Quality for Shallow Marine Gravity-Flow Low-Permeability Fine-Grained Sandstone: A Case Study of the First Member of Huangliu Formation in Dongfang A Area, Yinggehai Basin. Mar. Geol. Front. 2025, 41, 1–13. [Google Scholar]
  22. Yue, S.F.; Zhang, H.; Qin, L.J.; Yang, Z.Q.; Qi, Z.; Wang, Y.B. Sandy Debris Flow Sedimentary Model of the First Member of Huangliu Formation in Dongfang Area, Yinggehai Basin. Pet. Geol. Dev. Daqing 2020, 39, 9–18. [Google Scholar]
  23. Wang, Z.; Xian, B.; Liu, J.; Fan, C.; Liu, J. Large-Scale Turbidite Systems of a Semi-Enclosed Shelf Sea: The Upper Miocene of Eastern Yinggehai Basin, South China Sea. Sediment. Geol. 2021, 425, 106006. [Google Scholar] [CrossRef]
  24. Li, X.; Wang, H.; Yao, G.; Peng, Y.; Ouyang, J.; Zhao, X.; Lan, Z.; Huang, C. Sedimentary features and filling process of the Miocene gravity-driven deposits in Ledong area, Yinggehai Basin, South China Sea. J. Pet. Sci. Eng. 2022, 209, 109886. [Google Scholar] [CrossRef]
  25. Chen, S. Research on the Sedimentary Facies Types and Development Laws of the Yinger Section of the Dongfang Gas Field in the Yinggehai Basin. Ph.D. Dissertation, Northwest University, Xi’an, China, 2020. [Google Scholar]
  26. Liu, W.; Yang, X.B.; Zhang, X.P.; Duan, L.; Shao, Y.; Hao, D.F. Gravity flow sedimentary characteristics and controlling factors of the Yellow Stream Formation in the eastern Yinggehai Basin. J. Lithol. Reserv. 2019, 31, 75–82. [Google Scholar]
  27. Wang, H.; Chen, S.; Gan, H.J.; Liao, J.H.; Sun, M. Research advances and accumulation mechanisms of large-scale turbidite fans in shallow marine settings: A case study of gravity flows in the Huangliu Formation, Yinggehai Basin. Earth Sci. Front. 2015, 22, 21–34. [Google Scholar]
  28. Zhang, H.L.; Pei, J.X.; Zhang, Y.C.; Jiang, C.Y.; Zhu, J.C.; Ai, N.P.; Hu, Q.W.; Yu, J.F. Characteristics of overpressured reservoirs in the middle-deep Huangliu Formation, Dongfang area, Yinggehai Basin. Pet. Explor. Dev. 2013, 40, 284–293. [Google Scholar] [CrossRef]
  29. Huang, Y.T.; Wen, L.; Yao, G.Q.; Jiang, P. Sedimentary characteristics of thick fine-grained shallow-marine gravity flow deposits from Huangliu Formation in Dongfang area, Yinggehai Basin, China. J. Acta Pet. Sin. 2018, 39, 290–303. [Google Scholar]
  30. He, W.J.; Xie, J.Y.; Liu, X.Y.; Li, S.S. Foraminiferal Biostratigraphy and Sedimentary Environment of Well DF1-1-11 in Yinggehai Basin. J. Stratigr. 2011, 35, 81–87. [Google Scholar]
  31. Li, X.; Fu, L.; Wei, P.; Li, J.F.; Xu, G.; Cao, Q.Q.; Zhong, Y.; Wang, Z.P. Restoration of sedimentary paleogeography and its control on sedimentary system: A case study of the Triassic Baikouquan Formation in Shixi area of Junggar Basin. Lithol. Reserv. 2025, 37, 38–48. [Google Scholar]
  32. Jiang, G.Z.; Xie, H.; Zhao, Z.X.; Shi, H.C.; Pan, H. Cenozoic tectonic-sedimentary evolution and dynamic mechanism analysis of Yinggehai Basin. Haiyang Xuebao 2023, 12, 45. [Google Scholar]
  33. Lowe, D.R. Sediment gravity flows, II. Depositional models with special reference to the deposits of high-density turbidity currents. J. Sediment. Petrol. 1982, 52, 279–297. [Google Scholar]
  34. Bouma, A.H. Sedimentology of Some Flysch Deposits: A Graphic Approach to Facies Interpretation; Elsevier: Amsterdam, The Netherlands, 1962; 168p. [Google Scholar]
  35. Mutti, E. Turbidite Sandstones; Agip Special Publication; AGIP: Milan, Italy, 1992; 275p. [Google Scholar]
  36. Farouk, S.; El-Din, A.A.; Shennawy, T.E.; Al-Kahtany, K.; Hu, Y. Integration of seismic and well log data for structural evaluation of the west delta deep marine, egypt: Implications for petrophysical analysis of the messinian abu madi reservoir. Mar. Geophys. Res. 2025, 46, 16. [Google Scholar] [CrossRef]
  37. Wei, J.; Li, L.; Xu, Y.; Xue, G.; Zhang, Z.; Zhang, G. Characterization and Numerical Modeling of Shallow Marine Turbidite Depositional Systems: A Case Study from the Second Member of the Yinggehai Formation, X Gas Field, Yinggehai Basin. J. Mar. Sci. Eng. 2025, 13, 1107. [Google Scholar] [CrossRef]
  38. Li, L.; Gong, C.L. Gradual Transition from Net Erosional to Net Depositional Cyclic Steps Along the Submarine Distributary Channel Thalweg in the Rio Muni Basin: A Joint 3-D Seismic and Numerical Approach. J. Geophys. Res. Earth Surf. 2018, 123, 2087–2106. [Google Scholar] [CrossRef]
  39. Chanson, H. Hydraulics of Open Channel Flow; Elsevier: Amsterdam, The Netherlands, 2004. [Google Scholar]
  40. Konsoer, K.; Zinger, J.; Parker, G. Bankfull hydraulic geometry of submarine channels created by turbidity currents: Relations between bankfull channel characteristics and formative flow discharge. J. Geophys. Res. Earth Surf. 2013, 118, 216–228. [Google Scholar] [CrossRef]
  41. Postma, G.; Cartigny, M.J.B. Supercritical and subcritical turbidity currents and their deposits—A synthesis. J. Geol. 2014, 42, 987–990. [Google Scholar] [CrossRef]
  42. Poiré, A.G.; Lajeunesse, P.; Normandeau, A.; Francus, P.; Nzekwe, O.P. Morphological expression of bedforms formed by supercritical sediment density flows on four fjord-lake deltas of the southeastern Canadian Shield (Eastern Canada). Sedimentology 2016, 63, 2106–2129. [Google Scholar]
  43. Uh Zapata, M.; Pham Van Bang, D.; Nguyen, K.D. Unstructured Finite-Volume Model of Sediment Scouring due to Wave Impact on Vertical Seawalls. J. Mar. Sci. Eng. 2021, 9, 1440. [Google Scholar] [CrossRef]
  44. Xie, Y.H.; Wang, Z.F.; Xie, X.N.; Ren, J.Y.; Jiang, T. Patterns of Slope-Break Zone and Their Depositional Models in the Yinggehai Basin. J. Earth Sci. 2004, 5, 569–574. [Google Scholar]
  45. Zhang, N.; Jiang, T.; Zhang, D.J. The topographic and geomorphic characteristics of the seabed in the Qiongdongnan Basin and their control over deep-water sedimentation. J. Mar. Geol. Quat. Geol. 2012, 32, 27–33. [Google Scholar] [CrossRef]
  46. Roberts, A.M.; Badley, M.E.; Price, J.D.; Huck, I.W. The structural history of a transtensional basin: Inner Moray Firth, NE Scotland. J. Geol. Soc. 1990, 147, 87–103. [Google Scholar] [CrossRef]
  47. Prather, B.E.; O’Bynre, C.; Pirmez, C.; Sylvester, Z. Sediment partitioning, continental slopes and base-of-slope systems. Basin Res. 2017, 29, 394–416. [Google Scholar] [CrossRef]
  48. Sarhan, M.A.; Hseinat, M.A.A.; AlZidaneen, M. Geophysical characterization of Miocene Kareem reservoirs in the Tawila West oil field, offshore southern Gulf of Suez Basin, Egypt. Egypt. J. Pet. 2025, 34, 1. [Google Scholar] [CrossRef]
  49. Farouk, S.; Saada, S.A.; Fagelnour, M.S.; Arafat, M. Petrophysical and Gas Chromatographic Analysis Integration for Hydrocarbon Identifications in Cretaceous Reservoirs, Azhar Field, Beni Suef Basin, Egypt. J. Pet. 2024, 33, 7. [Google Scholar] [CrossRef]
  50. Jiang, D.G.; Luo, S.S.; Chen, L.; Dai, R.; Pu, Y.X.; Zhou, Q.A.; Yan, H.G.; Pang, J.L. The distribution law and sedimentary model of fine-grained sedimentary rock facies in the 73 subsection of the Yanchang Formation in the Longdong area: Based on the simulation experiment of water trough deposition. J. Palaeogeogr. 2025, 27, 625–640. [Google Scholar]
  51. Lu, Y. Experimental Study on the Flow and Deposition of Turbidity Currents on Multiple Slopes. Ph.D. Thesis, Anhui University of Technology, Ma’anshan, China, 2019. [Google Scholar]
  52. Cheng, L.Y.; Li, L.; Gao, Y.F.; Zhang, W.; Gong, G.C.; Yang, Z.P.; Wang, P. Characteristics and Genesis of the seabed periodic step bottom shape in Lingshui Depression, Qiongdongnan Basin. Mar. Geol. Quat. Geol. 2022, 42, 37–44. [Google Scholar]
  53. Stevenson, C.J.; Talling, P.J.; Wynn, R.B.; Masson, D.G.; Hunt, J.E.; Frenz, M.; Akhmetzhanhov, A.; Cronin, B. The flows that left no trace: Very large-volume turbidity currents that bypassed sediment through submarine channels without eroding the sea floor. Mar. Pet. Geol. 2013, 41, 186–205. [Google Scholar] [CrossRef]
  54. Komar, P.D. Hydraulic jumps in turbidity currents. Geol. Soc. Am. Bull. 1971, 82, 1477–1487. [Google Scholar] [CrossRef]
  55. Hand, B.M.; Middleton, G.V.; Skipper, K. Antidune cross-stratification in a turbidite sequence, Cloridorme Formation, Gaspé, Québec. Sedimentology 1972, 18, 135–138. [Google Scholar] [CrossRef]
  56. Tan, M.X.; Zhu, X.M.; Liu, W.; Shi, R.S. Morphodynamics of cyclic step bedforms and characteristics of associated sediments. Geol. Rev. 2017, 63, 1512–1522. [Google Scholar]
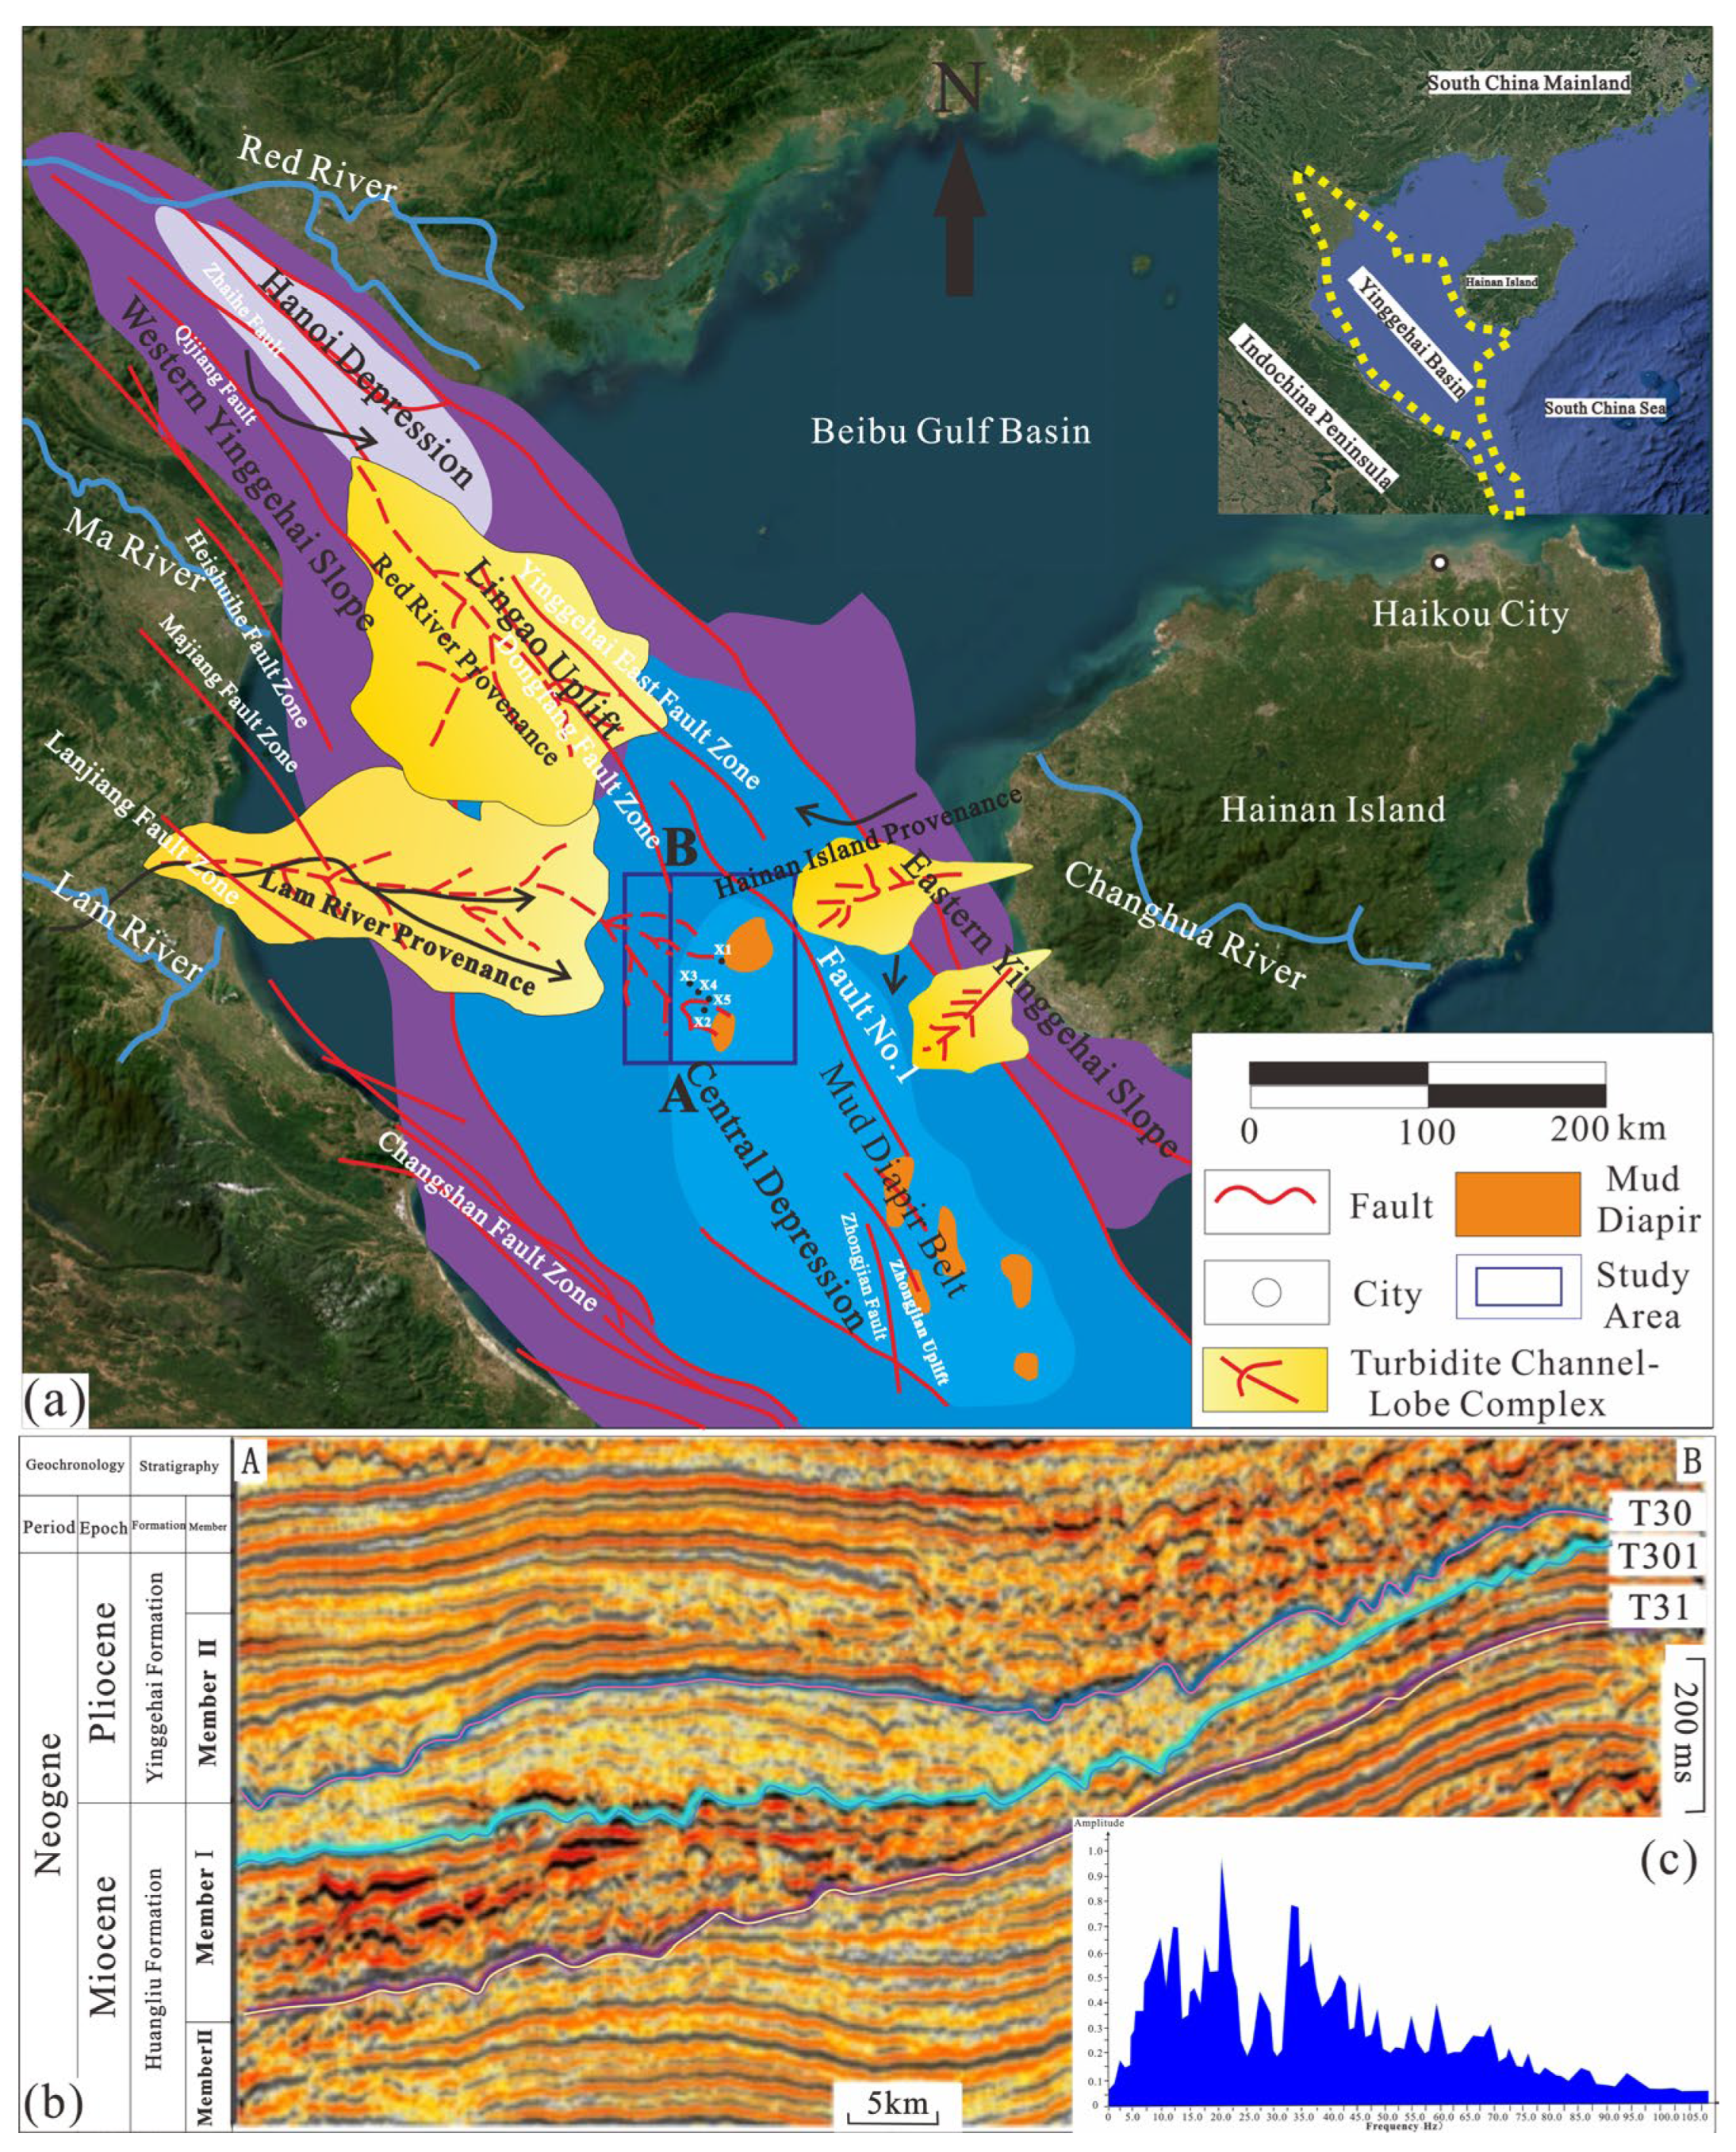
Figure 1. Regional location map of Yinggehai Basin: (a) regional location of the study area; (b) seismic profile along the A–B line (shown in (a)); (c) frequency spectrum of the study area. Note: The labels X1, X2, X3, X4, and X5 represent the well names.
Jmse 13 01616 g001
Figure 2. Paleotopographic map of the H1II interval in Huangliu Formation, Dongfang X Gas Field: (a) paleotopographic profile of H1II in Dongfang X Gas Field; (b) seismic section along the channel axis; (c) seismic section across channel crest and trough. Note: In (a), the red dashed line indicates the orientation of the paleochannel, while in (b,c), the green lines represent the base interface of the depression.
Jmse 13 01616 g002
Figure 3. Typical lithofacies of gravity-flow sandstones in the Lower Gas Interval II, Huangliu Formation Unit I: (a) massive bedding sandstone, well X1, 3044.85 m; (b,c) mud chip- and trace fossil-bearing massive bedding sandstone, well X2, 3136.2 m and 3134.37 m; (d) discontinuous concave cross (blocky)-bedding fine to medium sandstone facies, well X2, 3130.32 m.
Jmse 13 01616 g003
Figure 4. Lower depositional system of the H1II Sub-member in the Huangliu Formation, study area: (a) representative seismic profile; (b) well tie profile; (c) sand thickness map. Note: The green line in (c) corresponds to the well-tie profile displayed in (a).
Jmse 13 01616 g004
Figure 5. Simulation results of turbidity current depositional processes: (ad) temporal evolution of flow dynamics in a single simulation run, illustrating the depositional progression from initial to final stages.
Jmse 13 01616 g005
Figure 6. Conceptual model of flow regime transition in turbidity currents. (a) Initial seafloor surface prior to turbidity current occurrence; (b) Process of hydraulic jump formation; (c) Phase involving a hydraulic jump followed by prolonged erosion, transport, and deposition; (d) Final depositional surface.
Jmse 13 01616 g006
Table 1. Architectural parameters of paleo-channels and hydrodynamic parameters of paleo-turbidity currents.
WHSRiCfiU1Q1RiCfiU2Q2
17081060.060.270.0154.01726,8620.300.0142.21400,798
3334940.030.410.0103.07965,1000.470.0081.65519,925
530890.170.160.0254.72221,2190.170.0242.65124,197
1297530.050.340.0122.54174,8250.380.0111.3895,326
12051180.100.210.0194.75675,2100.230.0182.64376,116
1196650.050.290.0143.02234,6760.320.0131.66128,961
880770.090.230.0183.72250,7530.250.0172.06139,344
763470.070.270.0152.6796,0810.300.0141.4752,973
Notes: W: Channel width (m); H: Channel depth (m); S: Thalweg gradient along channel axis (rad); Cfi: Friction coefficient at turbidity current/seawater interface; U1: Maximum velocity of paleo-turbidity current (m/s); U2: Minimum velocity of paleo-turbidity current (m/s); Q1: Maximum sediment flux of paleo-turbidity current (m3/s) Q2: Minimum sediment flux of paleo-turbidity current (m3/s).
Disclaimer/Publisher’s Note: The statements, opinions and data contained in all publications are solely those of the individual author(s) and contributor(s) and not of MDPI and/or the editor(s). MDPI and/or the editor(s) disclaim responsibility for any injury to people or property resulting from any ideas, methods, instructions or products referred to in the content.