1. Introduction
With the continuous expansion of marine engineering in the 21st century, island reefs have become preferred sites for offshore infrastructure development. Many of these locations are situated near tectonic plate boundaries, where seismic activity is frequent. To effectively mitigate the damage and economic losses caused by earthquakes, it is essential to fully consider the potential seismic impacts on island-based infrastructure.
Underground engineering constitutes a critical component of island construction. Due to the confinement provided by the surrounding soil or rock, underground structures generally exhibit superior seismic performance. Previous studies have demonstrated that compared to surface structures, underground structures tend to exhibit more stable seismic responses and a lower likelihood of failure. As a result, the seismic resilience of underground structures received limited attention until the 1995 Kobe earthquake in Japan (magnitude 7.2), which caused severe damage to the Daikai subway station [
1,
2]. Since then, with increasing incidents of underground structural failure during earthquakes, research on their seismic response behavior has become more intensive and systematic [
3,
4,
5,
6].
Coral sand is widely distributed in the South China Sea, the coastal regions of the Middle East, and islands around the South Pacific [
7,
8]. It is one of the most commonly used materials in marine engineering. Coral sand particles typically exhibit irregular shapes, high porosity, and a tendency to fracture easily, along with a relatively large internal friction angle [
9,
10,
11,
12,
13]. In terms of engineering properties, coral sand differs significantly from terrestrial quartz sand in both static and dynamic behaviors [
8,
13,
14,
15,
16,
17]. The bearing capacity of coral sand sites is notably higher than that of ordinary quartz sand sites, exhibiting a larger deformation modulus. This is primarily due to the more irregular shape of coral sand particles, which interlock more effectively, whereas the regular shape of quartz sand particles allows for easier sliding between them, resulting in greater deformation. Furthermore, coral sand sites demonstrate enhanced liquefaction resistance. These characteristics lead to significant differences in seismic performance between coral sand and quartz sand sites, which, in turn, strongly influence the seismic behavior of underground structures located within coral sand sites. Therefore, investigating the seismic response of underground structures in coral sand sites is a critical aspect of seismic research for island-based underground engineering.
Methods for evaluating the seismic performance of underground structures primarily include prototype observation, numerical simulation, and experimental analysis. Among these, experimental approaches provide essential measured data, which support the development of numerical models and further theoretical investigations. Conducting experiments to capture the dynamic response characteristics of underground structures under seismic loading is of great significance for model validation and understanding response mechanisms. The shaking table test is a widely used method for investigating the seismic behavior of underground structures [
18,
19,
20].
However, experimental studies focusing on underground structures at coral sand sites remain limited, and relevant data are relatively scarce. There is an urgent need for more experimental support to advance seismic research on island-based underground structures. Due to limitations in testing facilities, most previous studies about shaking table experiments have been restricted to unidirectional seismic inputs. For example, Ding et al. [
21] conducted tests using unidirectional sine waves with a peak acceleration of 0.2 g to investigate the dynamic response of underground structures at coral sand sites with varying groundwater levels. Their results showed that rising groundwater levels could reduce the acceleration amplification of the coral sand site and decrease the settlement of underground structures. Zhang et al. [
22] performed unidirectional seismic input tests with peak accelerations of 0.1 g, 0.2 g, and 0.3 g using a 300 g-t centrifuge to explore differences in seismic responses between saturated coral sand sites with (structure field, SF) and without (free field, FF) underground structures. They found that the presence of an underground structure could induce a deeper liquefied zone beneath it.
Although these previous studies provided important insights into the dynamic response of underground structures in coral sand under unidirectional seismic loading, they overlooked critical issues, such as response amplification and complex soil–structure interactions induced by multidirectional seismic coupling, which may cause discrepancies when compared to actual multidimensional seismic conditions. Recently, some scholars have begun to analyze the seismic responses of sites and underground structures under multidirectional seismic inputs. Iida et al. [
2] suggested that the failure of underground subway stations is mainly caused by horizontal seismic motion. An et al. [
1] found that vertical ground motion significantly influences the early-stage inelastic deformation of structures. Wang et al. [
23], through three-dimensional numerical simulations, observed that when horizontal–vertical seismic coupling is considered, the vertical inertial force leads to additional compressive damage in central columns. Hu et al. [
24] reported that vertical seismic motion increases both the liquefaction potential of the surrounding soil and the structural dynamic response.
Although the aforementioned studies have preliminarily revealed that seismic loading from different directions significantly influences the dynamic response characteristics and failure modes of sites and underground structures, experimental investigations on the multidirectional coupled seismic response mechanisms of underground structures at coral sand sites remain limited. Therefore, systematic shaking table tests are essential to further explore the response behavior of underground structures in coral sand under multidimensional seismic excitation.
This study designs a shallow-buried underground structure featuring a dual-layer (inner and outer) configuration. Through shaking table tests under unidirectional, bidirectional, and tridirectional seismic inputs, the seismic responses of the underground structure and the coral sand site are compared, which include boundary effects under different loading conditions, the acceleration of the foundation and structure, Fourier spectra, and structural strain. The results fill the current research gap regarding multidimensional coupled seismic responses at coral sand sites and in underground structures, and provide a comparative analysis between multidirectional and unidirectional seismic responses. The main objectives of this study are to fill the research gap regarding the multidimensional coupled seismic response of coral sand sites and underground structures and to provide a comparative analysis of multidirectional and unidirectional seismic responses, offering experimental data and theoretical foundations for evaluating the seismic performance of underground structures under multidimensional seismic loading in island environments.
2. Materials and Methods
2.1. Test Equipment
The shaking table tests were conducted at the Earthquake Simulation Laboratory of Southeast University (Nanjing, China). The shaking table supports six degrees of freedom (three translational and three rotational) for seismic input. The platform measures 9 m in length and 6 m in width, with a maximum design load of 120 tons. The maximum horizontal displacement reaches 500 mm, with a peak acceleration of 1.5 g under a full load. Vertically, the table allows a maximum displacement of 300 mm and a peak acceleration of 1.3 g. The operating frequency ranges from 0.1 to 50 Hz.
Due to spatial limitations in the laboratory setup, shaking table tests on underground structures typically place the soil and the structure within a model soil container to simulate a semi-infinite ground environment [
25,
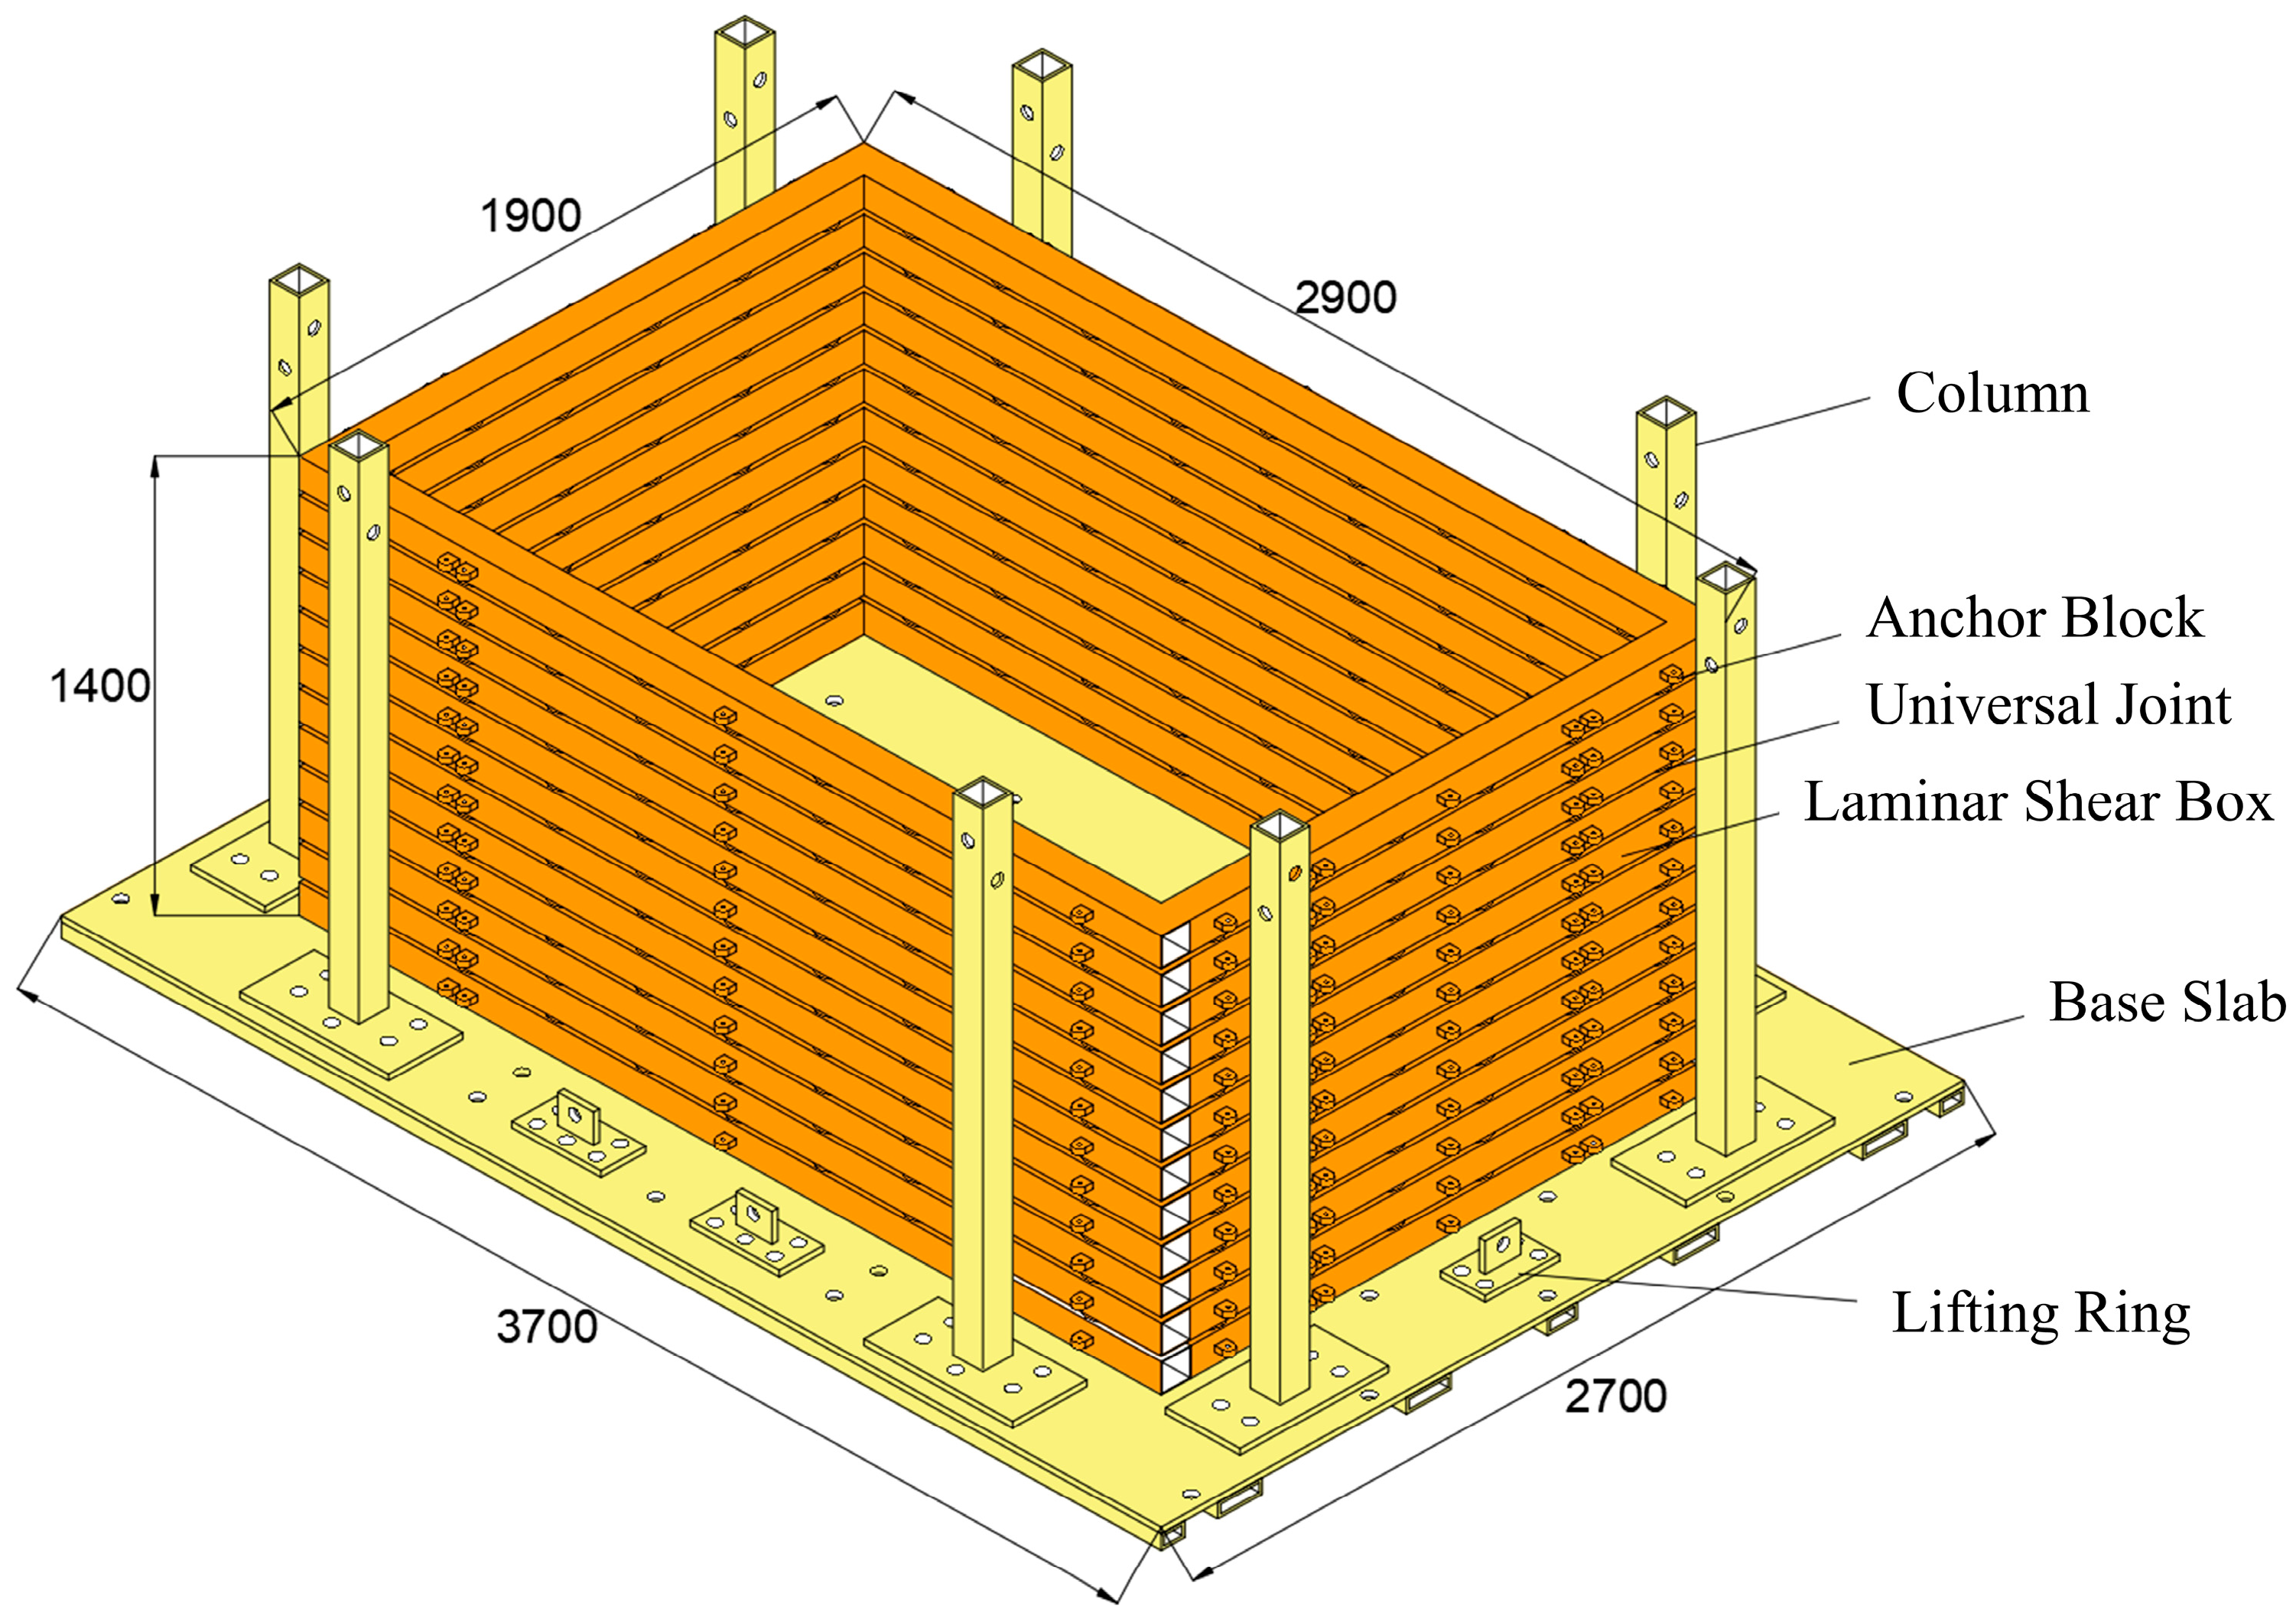
26]. In this study, a laminated shear model box was specially designed, which permits free vibration in all three directions. The internal dimensions of the box are 2.7 m × 1.7 m × 1.4 m, and the total weight is approximately 3 tons. The model box is composed of 12 layers of square steel frames, with each frame measuring 100 mm × 100 mm × 3 mm. Thirty universal ball bearings are installed between each layer, allowing horizontal shear deformation of the box independently from the surrounding soil. The layers are connected using bolts to prevent flexural deformation of the box during seismic excitation. Additionally, eight vertical steel columns are installed on the outer sides of the box to restrict excessive lateral displacement. To enhance the vertical stiffness of the bottom plate and avoid deformation during hoisting, square steel tubes are welded beneath the base. Bolt holes are also reserved on the bottom plate to anchor the model box securely to the shaking table. The structural design of the laminated shear model box is shown in
Figure 1.
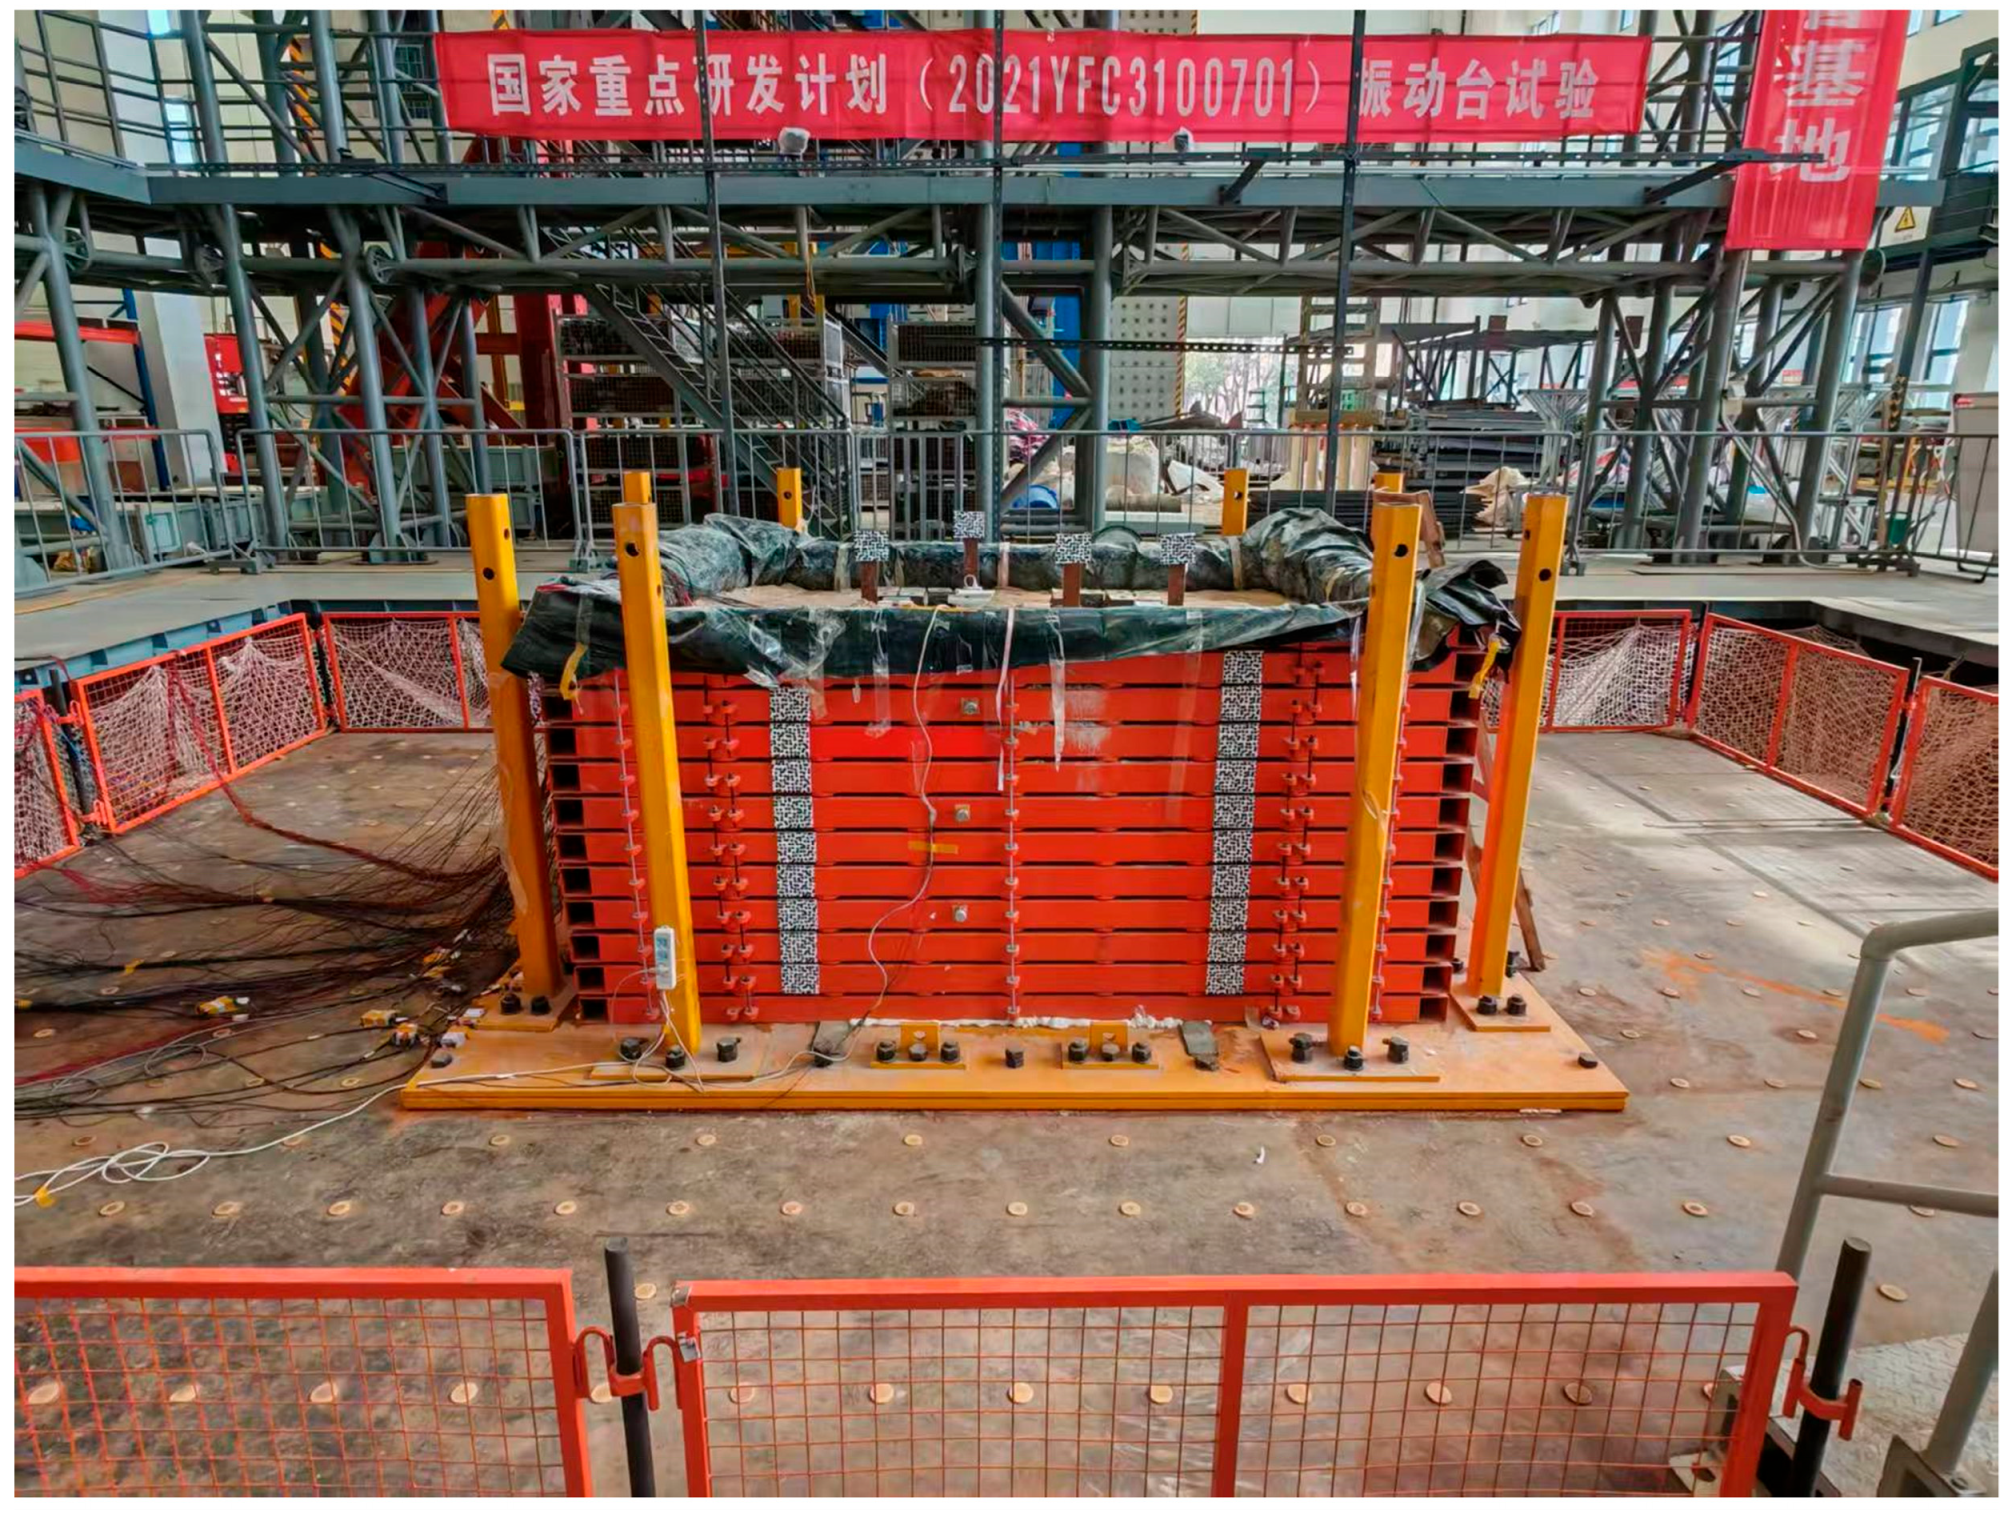
The laminar shear model box is bolted to the shaking table platform, as shown in
Figure 2.
To mitigate the reflection effects from the model box boundaries, a 20 mm thick layer of polyethylene foam was affixed to the inner walls of the model box. In addition, to prevent seepage of soil and water during the experiment, two layers of geomembrane, each with a thickness of 1 mm, were attached to the inner walls.
2.2. Underground Structure Model and Coral Sand
The prototype of the underground structure investigated in this study is an underground storage facility, primarily constructed from C40 concrete and HRB400 reinforcement steel. The structure consists of inner and outer layers, with coral sand filling the space between them. The top of the structure is flush with the ground surface.
During the development of the scale model, considering the dimensions of the shaking table and the model box, a geometric similarity ratio of 1:25 was adopted. Taking the upper limit of the loading capacity shaking table into account, the acceleration similarity ratio was set at 2. Referring to the experimental design proposed by Wu et al. [
27], micro-aggregate concrete and galvanized steel wire were employed as the model materials in this study, with the elastic modulus controlled at one-quarter of the prototype value. According to the Buckingham π-theorem, length (L), elastic modulus (E), and acceleration (a) were selected as the primary control parameters. The remaining parameters were derived based on the fundamental similarity ratios and dimensional analysis. The similarity ratios of all the experimental control parameters are summarized in
Table 1.
In this experiment, the axial compressive strength of the micro-aggregate concrete was 18.9 MPa, and the elastic modulus was 9 GPa, meeting the similarity requirements. The galvanized steel wire used in the model had an elastic modulus of 210 GPa.
Mass compensation in the shaking table tests was achieved by adding artificial mass blocks. Owing to the restrictions imposed by the size of the model, the final compensation ratio reached 65.20%.
The coral sand used in this experiment has a maximum dry density of 1.768 g/cm
3 and a minimum dry density of 1.230 g/cm
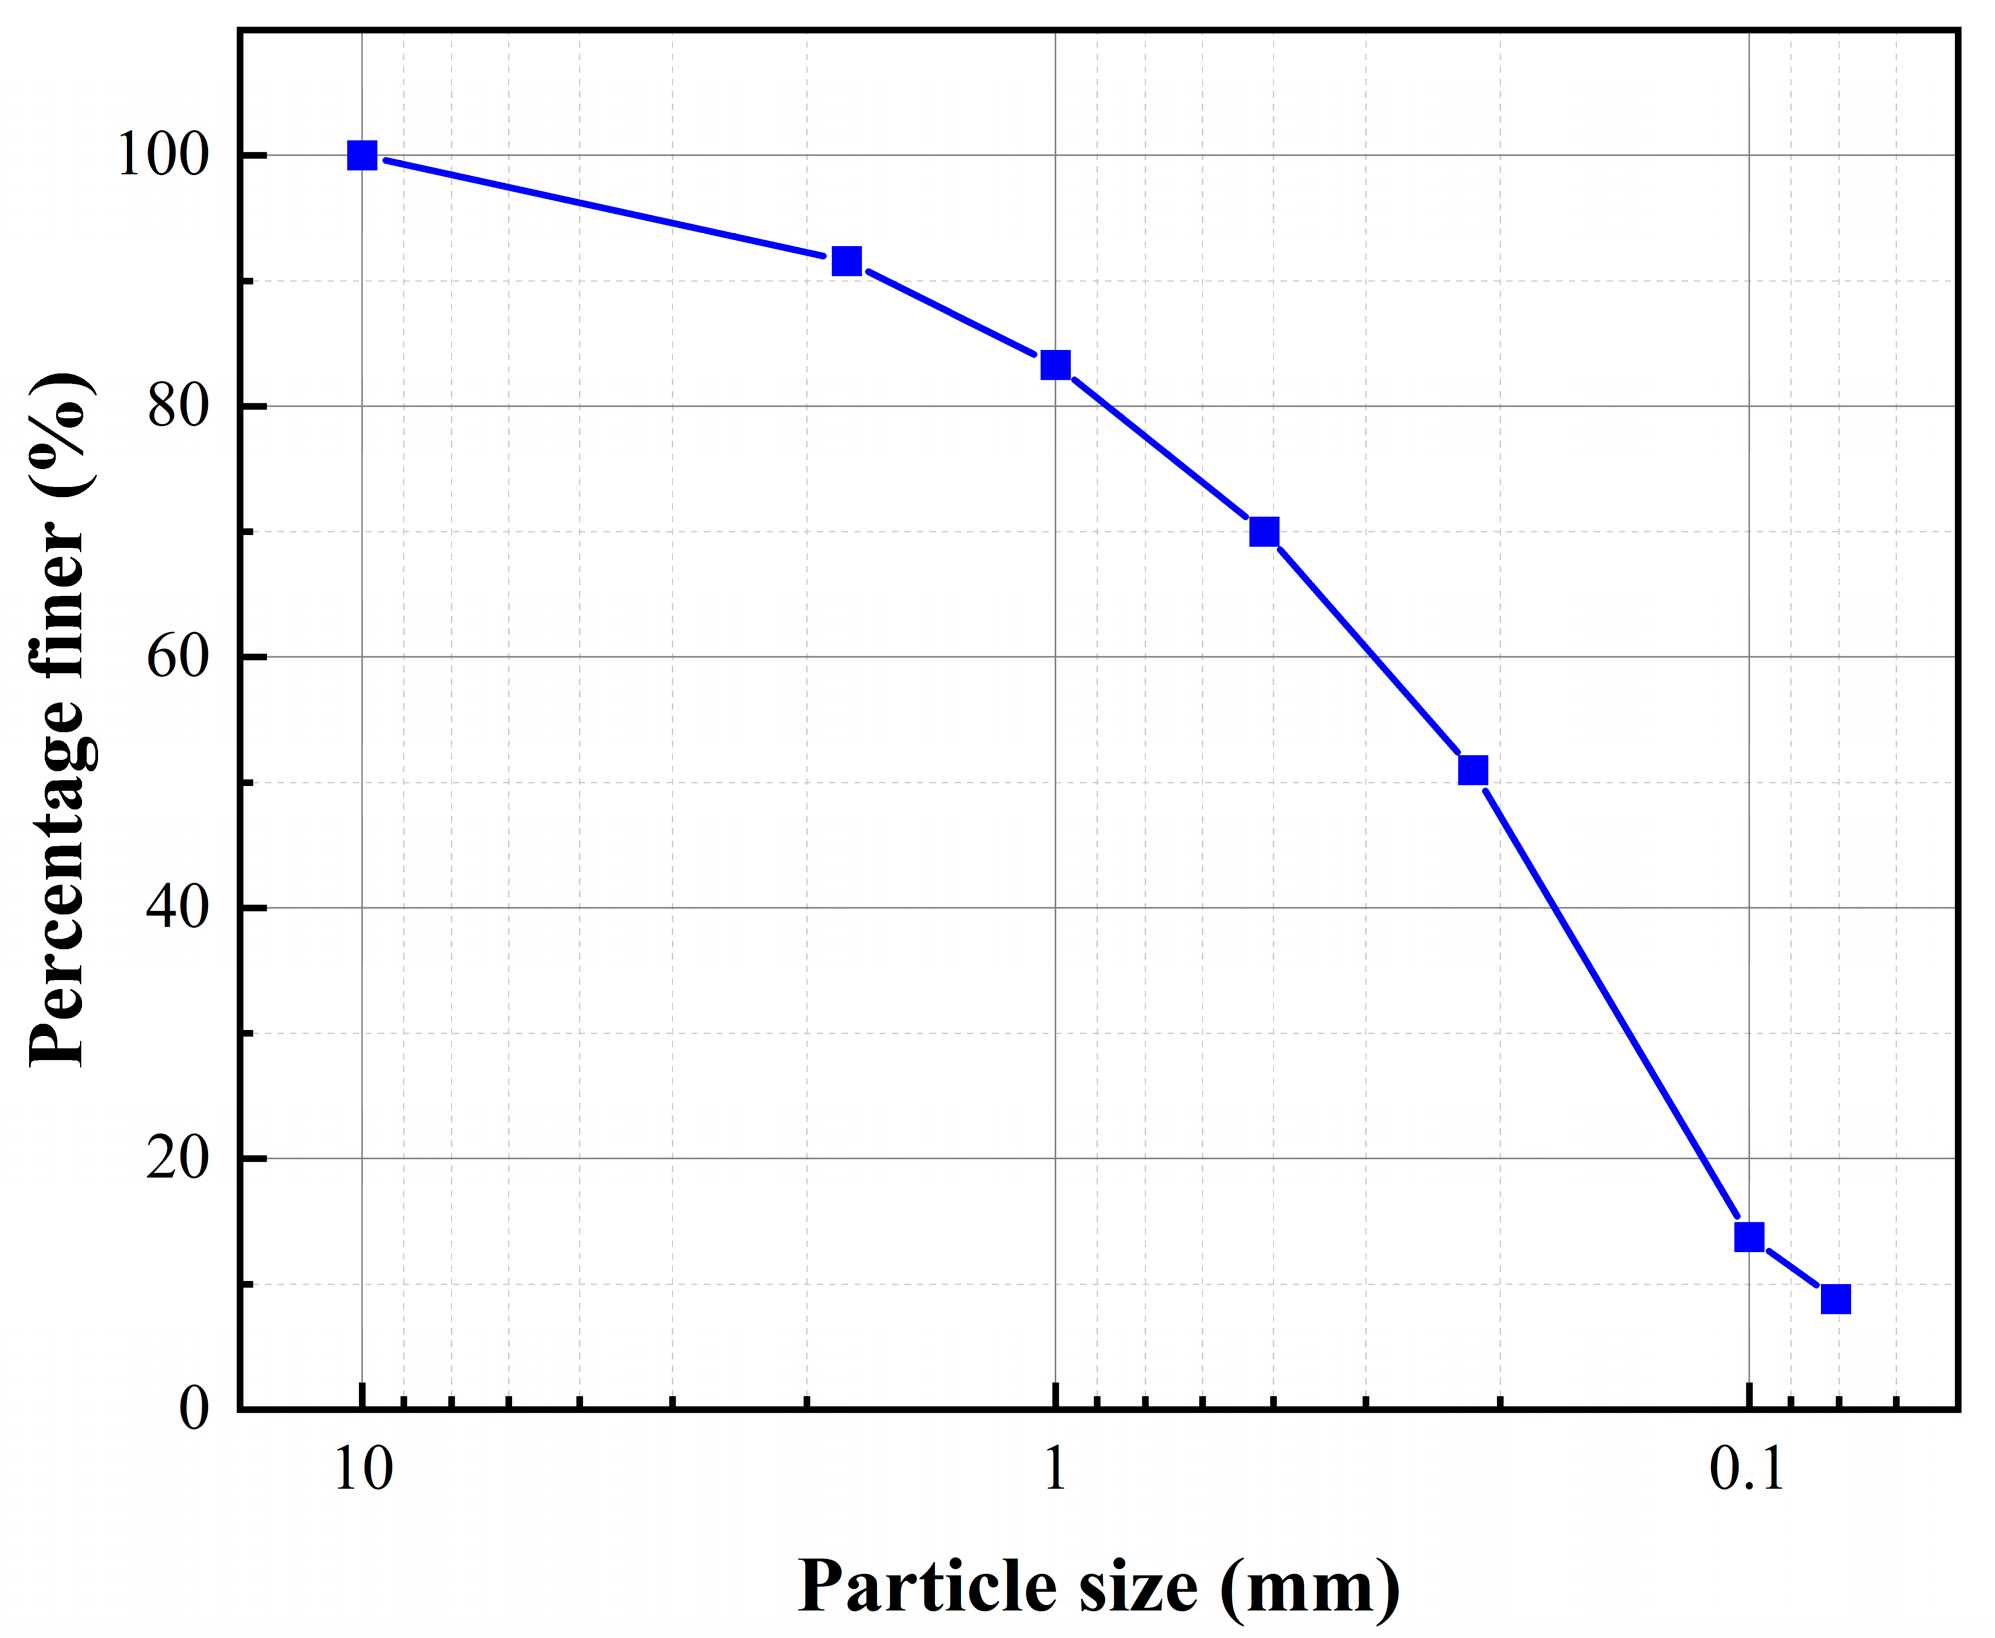
3. The particle size distribution of it is shown in
Figure 4. The relative density of the coral sand site during the experiment was 60%, and the coral sand was pre-dried to a moisture content of approximately 5%.
2.3. Sensor Arrangement
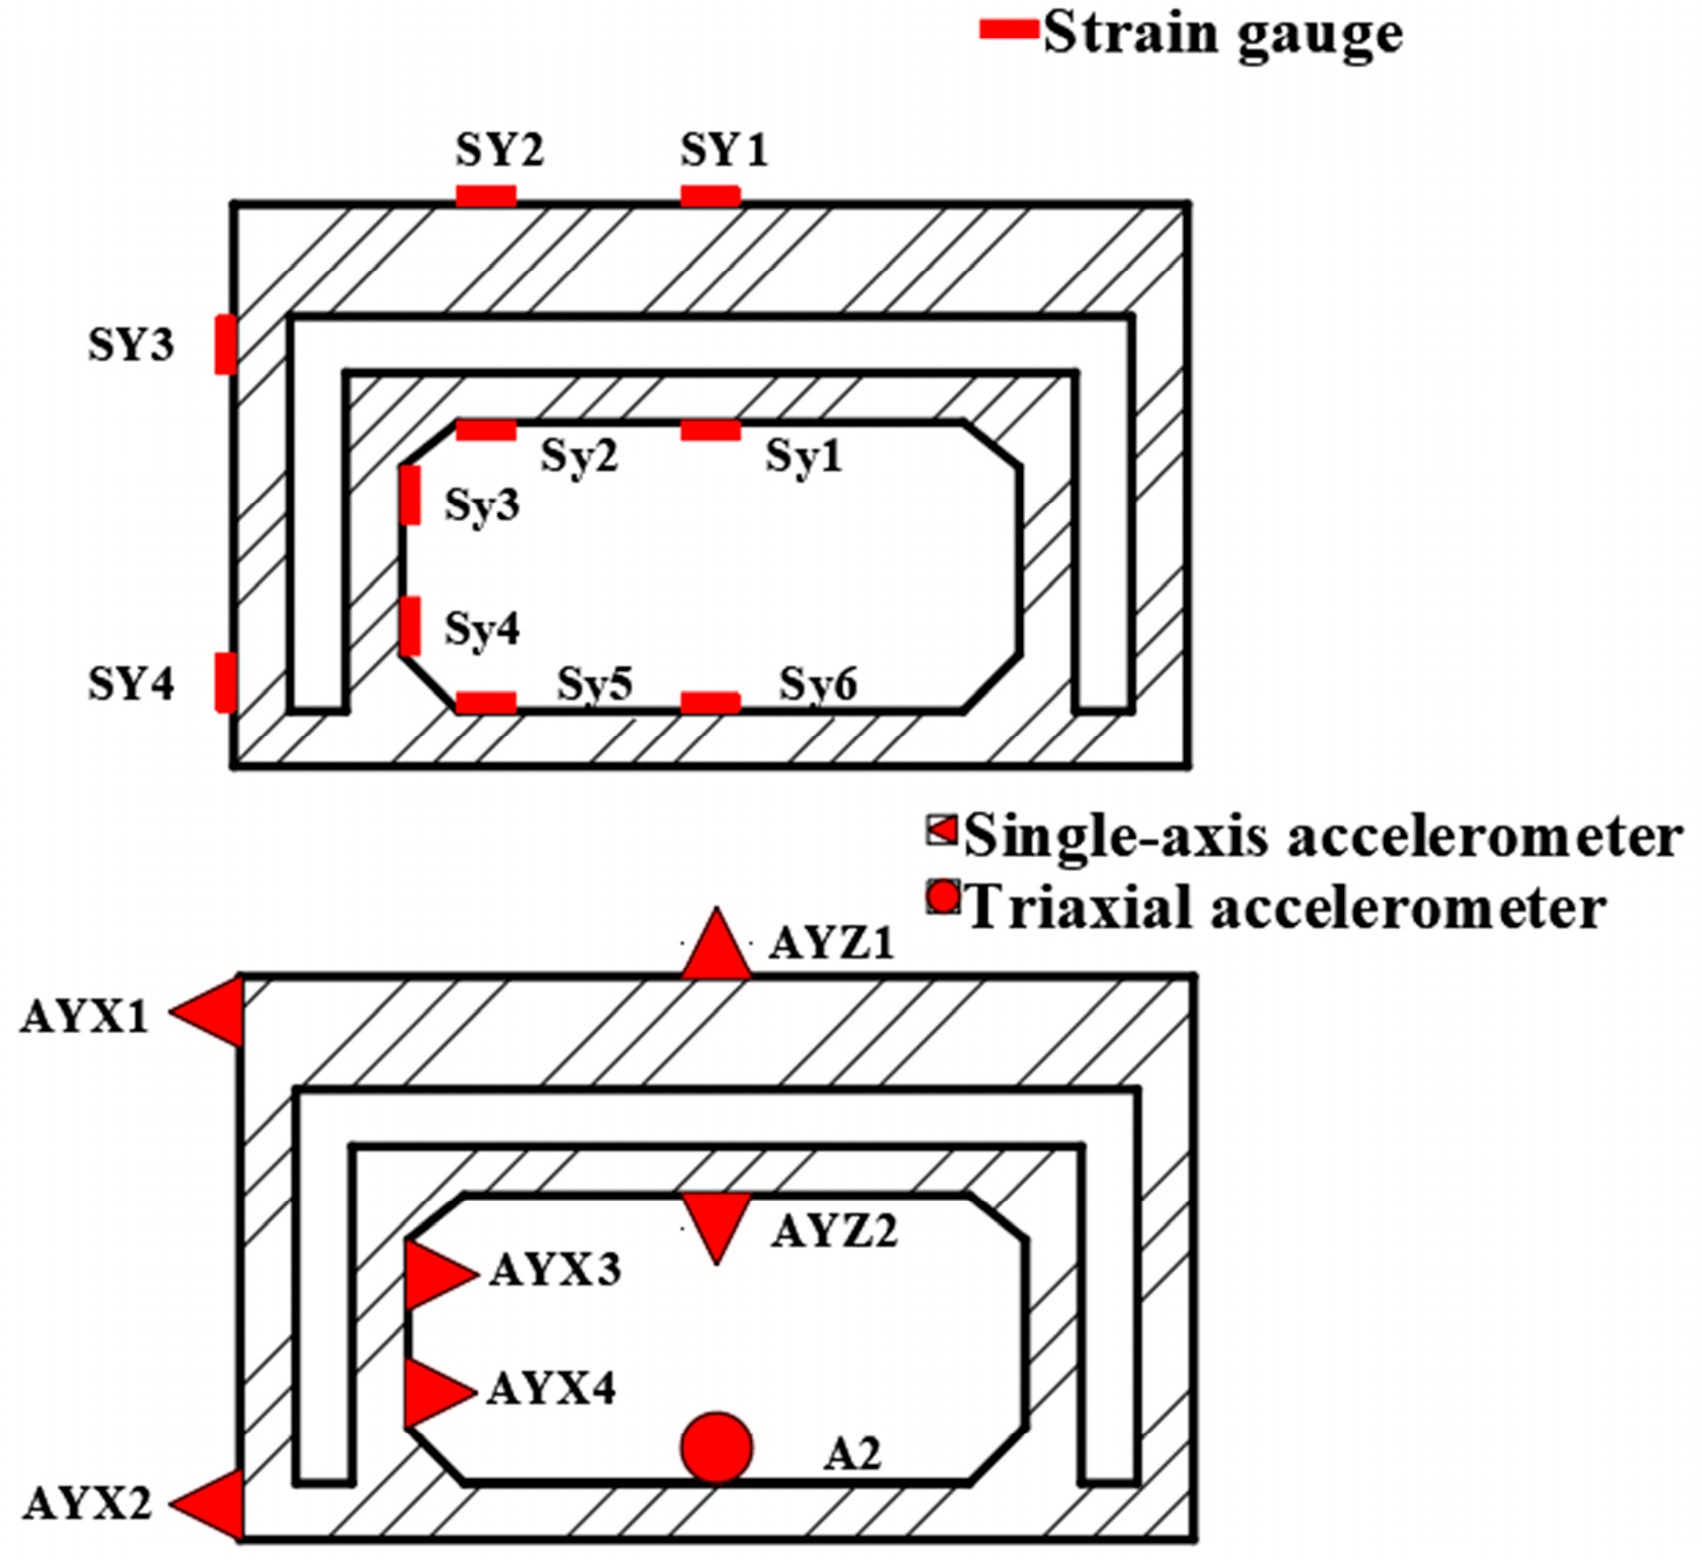
The sensors utilized in this experiment included unidirectional accelerometers (AX, AY, and AZ), triaxial accelerometers (A), and strain gauges (S). The arrangements of the sensors in the coral sand and the structure are shown in
Figure 5 and
Figure 6.
2.4. Loading Conditions
According to the characteristics of the response spectra for typical reef islands, as proposed by Bao et al. [
28], this experiment employed a representative strong-motion seismic record from the ETMC seafloor-monitoring network in the Sagami Bay area of Japan. A typical ground motion record, KNG2010908130749.EW, was selected as the input wave [
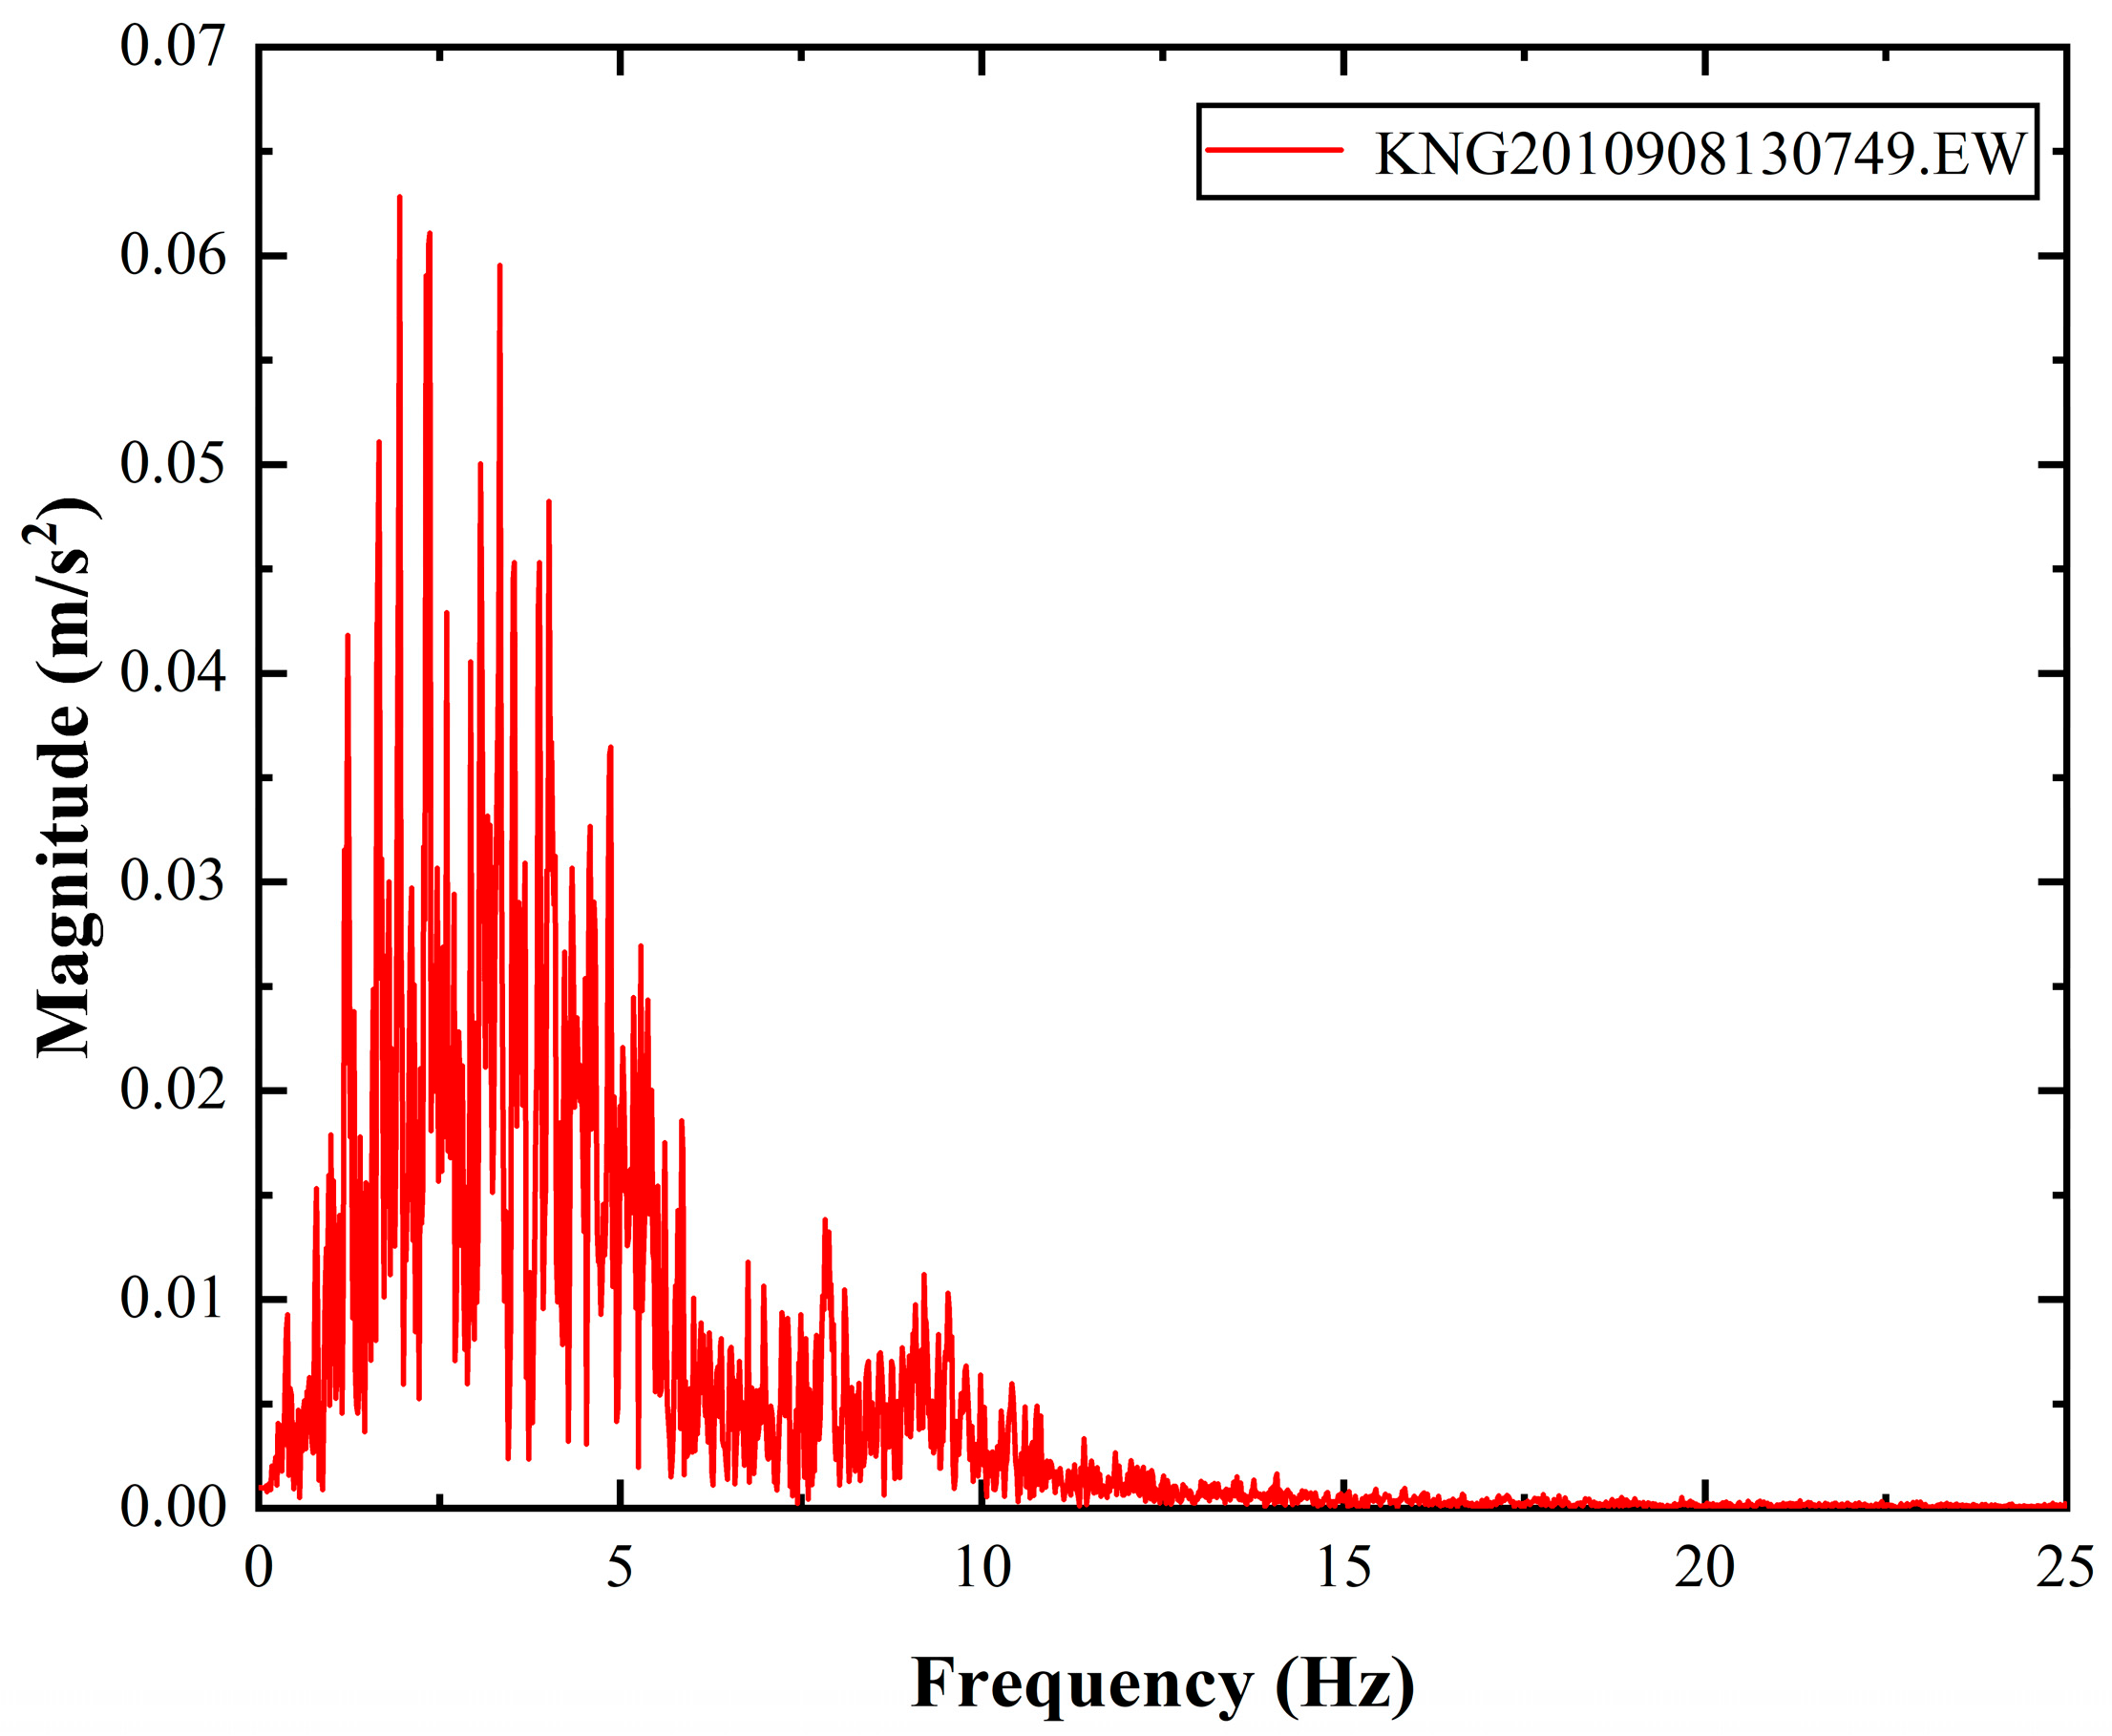
29]. The effective duration of the original seismic wave was extracted by clipping it within the Arias intensity range from 5% to 95%. High-frequency components, which are not significant for the engineering analysis, were filtered using a bandwidth of 0.1–25 Hz. Baseline correction was also applied.
The time history curve of the seismic wave is shown in
Figure 7, and its Fourier-amplitude spectrum is shown in
Figure 8.
To investigate the differences in unidirectional, bidirectional, and triaxial seismic loading conditions on the seismic responses of the coral sand site and the underground structure in shaking table tests, the loading conditions were designed as summarized in
Table 2. For multidirectional loading, the X-direction was the primary direction, with amplitude modulation applied to the other directions at a ratio of X:Y:Z = 1:0.85:0.65 according to the Chinese seismic code.
3. Results and Discussion
3.1. Boundary Effects
In this experiment, a laminar shear box was employed, with polyethylene foam sheets placed between the soil and the model box as buffer material. When seismic waves reach the boundaries of the model box, reflection and scattering occur, affecting the seismic responses of both the soil layers and the underground structure. To verify the effectiveness of the model box design under different loading conditions, acceleration data from surface sensors AX1–AX5 and AY1–AY5 were analyzed. Sensors 1 to 3 were arranged along the longitudinal direction of the model box to monitor boundary effects along its long side, while sensors 4 and 5 were positioned along the X-direction to monitor boundary effects along the short side.
In this study, the acceleration relative error (R) and the boundary effect index (μ) were used as evaluation indicators. The boundary effect index was calculated according to Equation (1).
The reference point signal is denoted as
, the comparison point signal is denoted as
,
n represents the number of data samples, and
refers to the effective peak acceleration at the corresponding layer. In this study, AX1 was selected as the reference point for AX1–AX3, AY1 for AY1–AY3, AX4 for AX4–AX5, and AY4 for AY4–AY5. The detailed boundary effect analysis results are presented in
Table 3.
Monitoring data show that the site experiences vibrations, even in directions other than the excitation direction. In
Table 3, green labels indicate that the sensor-monitoring direction is consistent with the excitation direction, while orange labels indicate that the monitoring direction differs from the excitation direction. It can be observed that under all the loading conditions, boundary effects in the excitation direction are relatively small. This indicates that the model box design in this experiment can effectively simulate the boundary conditions and soil shear behavior of the coral sand site in the excitation direction in various loading scenarios, without any noticeable boundary reflection or scattering effects.
In contrast, boundary effects in the non-excitation directions are significantly larger than those in the excitation direction. This is because when vibrations in the excitation direction are transmitted to non-excitation directions, seismic energy is more likely to attenuate due to reflections at various interfaces. The reflected and refracted seismic waves interacting with the model box walls and structural surfaces are more sensitive in these non-excitation directions.
3.2. Fourier Spectra
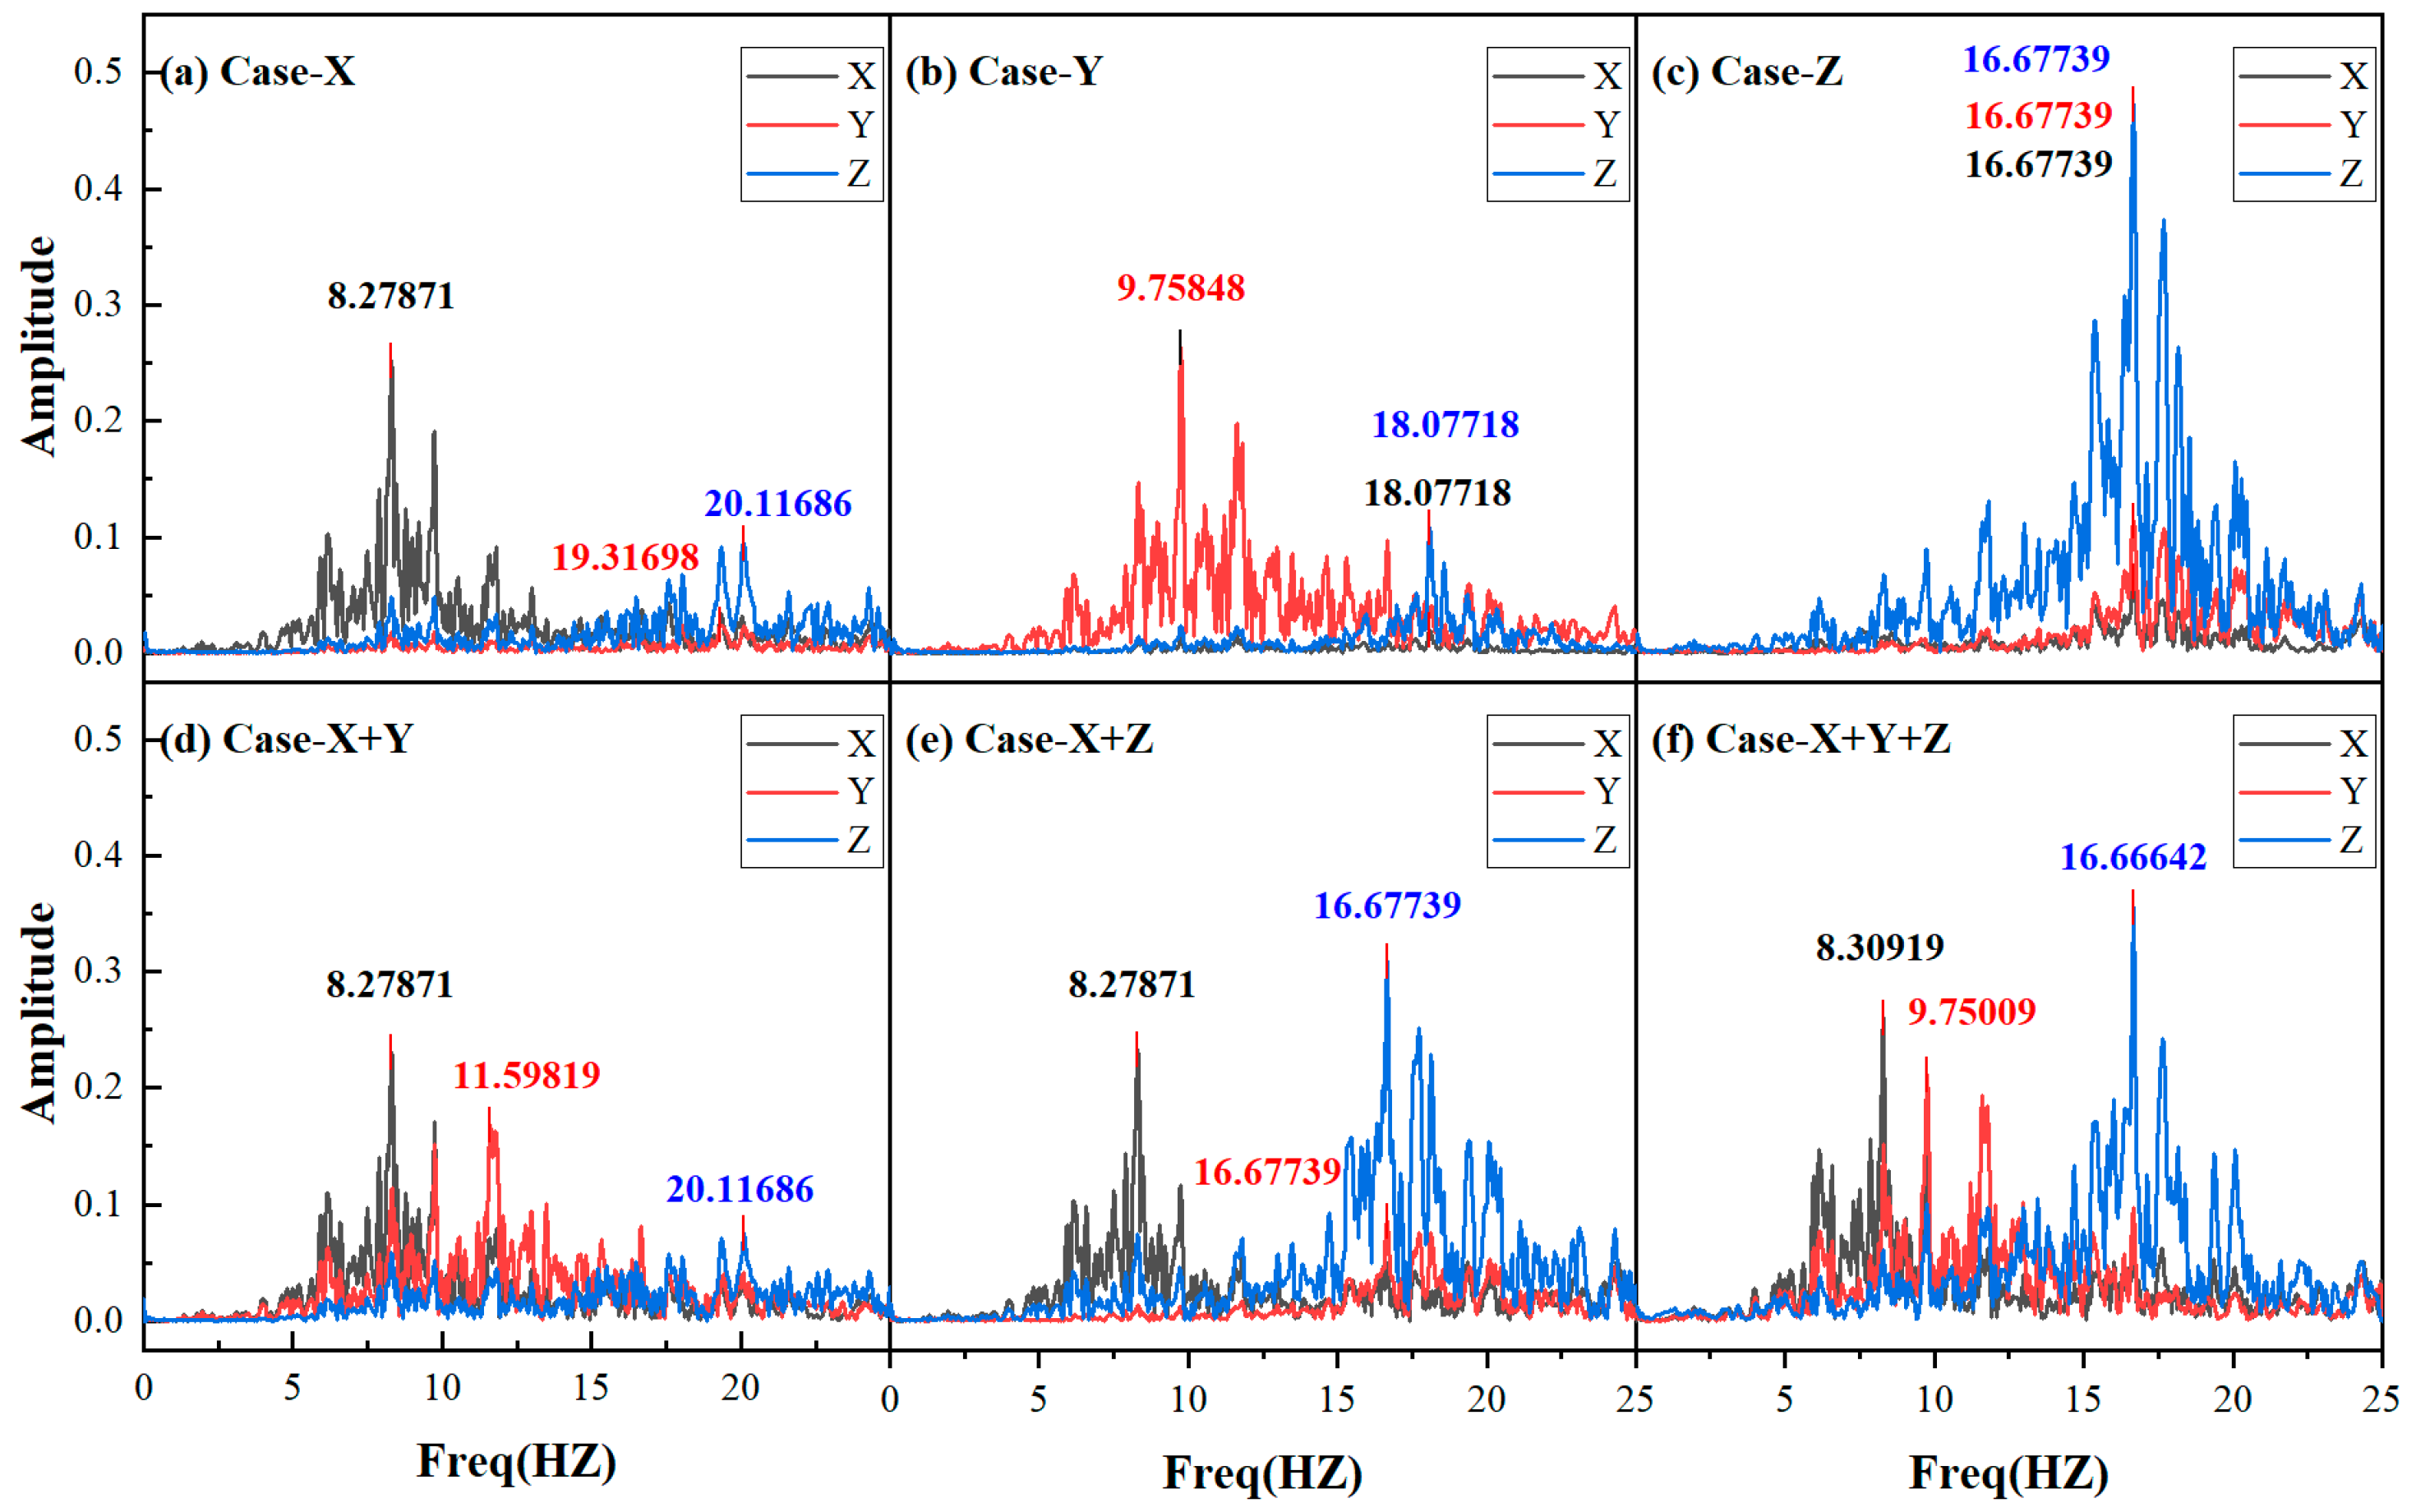
Figure 9 shows the amplitude spectra of accelerations in the X-, Y-, and Z-directions on the surface of the coral sand site, obtained through Fast Fourier Transform (FFT). The experiment includes unidirectional (X-, Y-, and Z-), bidirectional (X- and Y-; X- and Z-), and triaxial (X- and Y- and Z-) excitation conditions, aimed at studying the dynamic response characteristics of both the structure and the soil under different excitation methods. The six experimental conditions correspond to the six plots from (a) to (f) in
Figure 9.
3.2.1. Unidirectional Input Condition
In plots (a), (b), and (c) for the unidirectional input condition, the input seismic waves remain unchanged, with only the direction of the input altered. However, the Fourier-spectrum characteristics of the acceleration in the three directions differ. From the peak frequencies in the spectra, it is evident that the characteristic frequencies corresponding to the peaks in the three directions are different. When the excitation frequency matches the natural frequency of the soil–structure system, a significant resonance phenomenon occurs, amplifying the response of the soil–structure system. Therefore, the characteristic frequencies corresponding to the peaks in the Fourier spectrum can, to some extent, reflect the natural frequencies of the soil–structure system [
30].
Under the unidirectional X-input condition (SA1), the characteristic frequency corresponding to the peak spectrum in the X-direction is approximately 8.28 Hz. Under the unidirectional Y-input condition (SA2), the characteristic frequency corresponding to the peak spectrum in the Y-direction is approximately 9.76 Hz. Under the unidirectional Z-input condition (SA3), the characteristic frequency corresponding to the peak spectrum in the Z-direction is approximately 16.68 Hz. To facilitate the analysis of spectral responses in different input directions, we define the characteristic frequencies of 8.28 Hz, 9.76 Hz, and 16.68 Hz in the excitation directions as the reference frequencies for the unidirectional input conditions.
The difference in the reference frequencies in the X- and Y-directions may be attributed to the different dimensions of the coral sand site in the X- and Y-directions and the differing stiffnesses of the shallow-buried structure in the X- and Y-directions. However, the overall difference is not significant. In contrast, the reference frequency in the Z-direction is significantly higher than that in the horizontal directions, which is due to the different propagation characteristics of longitudinal seismic waves compared to horizontal seismic waves at the coral sand site.
Under unidirectional input of horizontal ground motions in the X- or Y-direction, the characteristic frequencies in the two non-excitation directions are relatively close, both falling within the range of approximately 18–20.5 Hz. These frequencies are significantly higher than those observed in the excitation direction. This indicates that under unidirectional horizontal excitation, the vibrations in the non-excitation directions are primarily concentrated in the high-frequency range, which may be due to the fact that high-frequency seismic waves are more prone to reflection and refraction.
In the case of unidirectional Z-direction excitation, the characteristic frequencies of the seismic response in the horizontal directions are almost identical to that in the Z-direction. This may be attributed to the fact that vibrations in the non-excitation directions are more susceptible to high-frequency seismic energy, and since vertical ground motions are themselves dominated by high-frequency components, the characteristic frequencies in the non-excitation directions tend to align with those in the vertical direction.
In summary, ground-surface motions in the non-excitation directions are more likely to be influenced by the high-frequency components of vibrations in the excitation direction.
3.2.2. Bidirectional Input Conditions
In Case SA4 (X- and Y-input), both X and Y are excitation directions. The characteristic frequency in the X-direction remains nearly unchanged compared to the unidirectional X-direction reference case, while the Y-direction characteristic frequency increases relative to its baseline. In the non-excitation Z-direction, the characteristic frequency is also higher than the reference value, but it is essentially consistent with the Z-direction response observed in Case SA1. This may be due to the fact that in SA4, the peak ground acceleration (PGA) of the input motion in the X-direction is greater than that in the Y-direction. As a result, the Y-direction response is influenced by vibrations in the X-direction, leading to an increase in high-frequency components.
In Case SA5 (X- and Z-input), the X- and Z-directions are the primary excitation directions. The characteristic frequencies in both directions are nearly identical to their respective reference values. Although the input PGA in the Z-direction is smaller than that in the X-direction, the spectral analysis at the ground surface shows that the spectral peak in the Z-direction is higher than that in the X-direction, indicating a more significant amplification effect in the Z-direction. In the non-excitation Y-direction, the characteristic frequency is much higher than its baseline value and aligns closely with that in the Z-direction. This is because the amplification effect in the Z-direction is significantly stronger than that in the X-direction, resulting in a stronger surface vibration in the Z-direction. Consequently, the Y-direction response is mainly influenced by the Z-direction vibration, and its characteristic frequency nearly coincides with that in the Z-direction.
These results suggest that under bidirectional seismic excitation, if both excitation directions are horizontal, the direction with the weaker input motion is likely to be influenced by the other horizontal direction. Compared with the unidirectional input case, the Fourier spectrum tends to shift toward higher frequencies. However, if the two excitation directions are one horizontal and one vertical, the spectral characteristics in both directions are essentially consistent with those under unidirectional input, and the characteristic frequency in the non-excitation direction matches that of the vertical direction.
3.2.3. Triaxial Input Conditions
In Case SA6 (X- and Y- and Z-input), the characteristic frequencies in all three directions are consistent with their respective reference frequencies. This indicates that under triaxial excitation, the characteristic frequencies of the ground-surface Fourier spectrum for the coral sand site–underground structure system remain the same as those observed under unidirectional excitation. Therefore, it is feasible to infer the three-dimensional seismic spectral response characteristics based on the spectral response obtained from unidirectional loading tests.
3.3. Peak Ground-Surface Acceleration
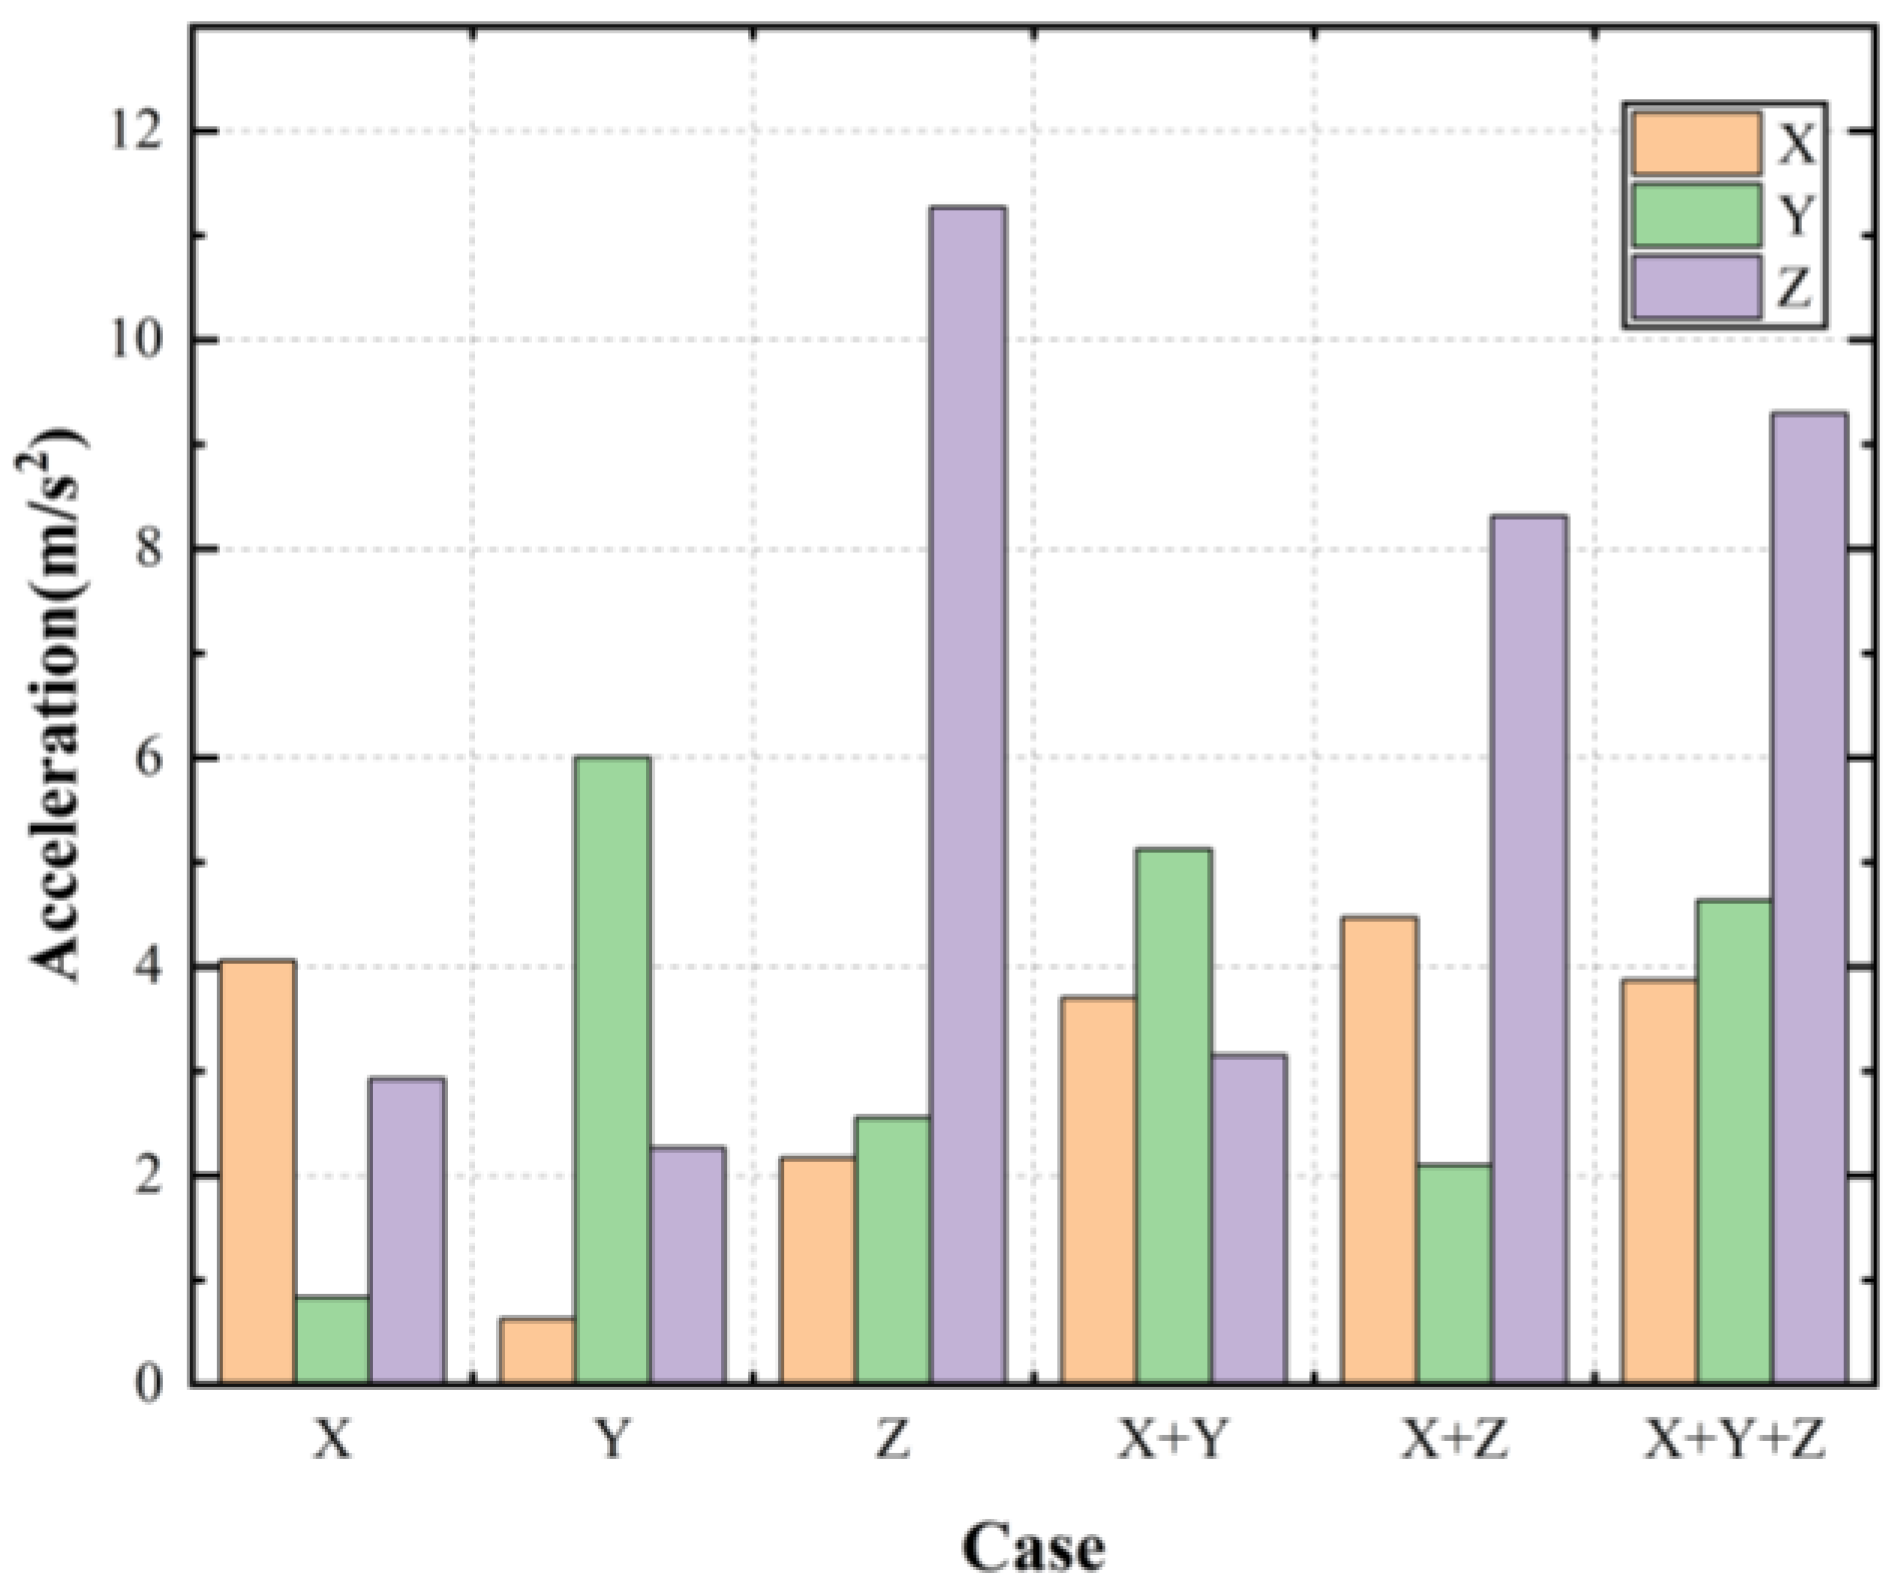
In this experiment, six loading cases were designed: three unidirectional seismic loading cases (X, Y, and Z), two bidirectional loading cases (X and Y; X and Z), and one triaxial loading case (X and Y and Z). The peak ground accelerations under different loading conditions are shown in
Figure 10.
Under unidirectional seismic excitation, noticeable acceleration responses were still observed in the non-excitation directions. However, the peak accelerations in those directions were significantly lower than that in the excitation direction. This phenomenon can be attributed to two main factors:
First, it results from the wave propagation characteristics. During the experiment, seismic waves encountered interfaces such as the boundary between the underground structure and the coral sand deposit, the model box walls, and internal discontinuities due to soil heterogeneity and anisotropy. These conditions led to the reflection and refraction of seismic waves, generating secondary vibration components in directions other than the input direction. Consequently, a part of the seismic energy from the unidirectional input was transferred to the non-excitation directions.
Second, the natural vibration modes of the structure exhibit multicomponent characteristics. A single vibration mode typically contains components not only in the X-direction but also in the Y- or Z-direction. When the excitation frequency is close to the natural frequency of such a mode, unidirectional input can trigger responses in all the modal components. Additionally, unidirectional loading causes deformation in the soil along directions other than the excitation axis. The nonlinear behavior, heterogeneity, irregular particle shapes, and porosity of coral sand contribute to complex deformation patterns. The observed vibrations in both the excitation and non-excitation directions are thus the result of the coupled interaction between the soil and the underground structure.
Since the seismic energy decays as it propagates from the excitation direction to the non-excitation directions, the peak accelerations in the latter are significantly lower than those in the input direction. In both unidirectional and bidirectional horizontal seismic loadings (X, Y, and X and Y), the ratio of the peak vertical acceleration in the non-excited direction to the peak acceleration in the excited direction exceeds 0.4 and is markedly greater than the peak acceleration in the horizontal non-excited direction. Consequently, even under purely horizontal loading conditions, the presence of vertical seismic motion cannot be neglected.
Although seismic motion is also induced in directions not directly excited by the shake table, the measured peak ground acceleration in the X-direction remains essentially unchanged across the three loading conditions—unidirectional excitation in X, bidirectional excitation in X and Y, and triaxial excitation—despite the superposition of additional directional inputs. This finding indicates that under multidirectional seismic excitation, the site response is governed by a complex coupling mechanism rather than by simple linear superposition. Specifically, the oscillations in the three directions may partially cancel each other out or fail to significantly influence the response in the X-direction, resulting in little change in the acceleration in the X-direction. Future research could refine the input patterns of seismic waves and conduct a detailed analysis of the loading intensities and phase relationships in each direction in order to gain a more comprehensive understanding of the impact of triaxial loading on accelerations in different directions.
3.4. Acceleration Amplification Factors at Coral Sand Sites
The acceleration amplification factor of the coral sand site is defined as the ratio of the peak acceleration recorded at different measurement points within the site to the peak acceleration at the bottom of the model container. In this experiment, accelerometers were installed at three different depths: the ground surface, 0.4 m, and 0.9 m below the surface. Notably, the bottom of the underground structure is located at a depth of 0.4 m. The acceleration amplification factors are shown in
Figure 11.
The acceleration amplification factors vary with depth at the coral sand site. Under the same loading condition, the amplification factor in the horizontal direction exhibits a distinct “<”-shaped distribution. That is, from the deep soil layer to the region around the base of the underground structure, the peak acceleration first decreases and then increases again near the ground surface. This pattern is primarily attributed to soil heterogeneity and the soil–structure interaction, which induce wave reflection and refraction. Near the bottom of the underground structure, wave reflections can result in energy loss, leading to a reduction in acceleration at that location. As the waves continue to propagate toward the surface, interference and energy concentration lead to increased acceleration at the ground surface.
In contrast, the amplification factor in the vertical (Z) direction demonstrates a “>”-shaped distribution. From the deeper layers to the bottom of the underground structure, vertical acceleration significantly increases. However, from the bottom of the structure to the surface, the amplification factor changes only slightly—either increasing or decreasing marginally. This behavior is closely related to seismic wave propagation characteristics (P-waves and S-waves), soil anisotropy, and subsurface heterogeneity. Vertical wave propagation tends to cause strong reflection and compression effects, resulting in concentrated energy that is less prone to dissipation. Therefore, the amplification effect of vertical seismic waves from the model box bottom to the base of the underground structure is particularly pronounced. However, due to the energy dissipation induced by the structure, there is little further amplification of vertical acceleration near the structure itself.
For surface peak acceleration amplification factors under unidirectional seismic input, the amplification factors in the excitation directions for SA1 (X), SA2 (Y), and SA3 (Z) are 1.039, 1.73, and 3.492, respectively. Under bidirectional input, the amplification factors in the X- and Y-directions for SA4 (X+Y) are 0.941 and 1.929, while those in the X- and Z-directions for SA5 (X+Z) are 1.25 and 3.605. Under triaxial input (SA6: X+Y+Z), the amplification factors in the X-, Y-, and Z-directions are 1.029, 1.447, and 3.597, respectively.
These results indicate that under unidirectional, bidirectional, and triaxial loading conditions, the amplification factor in the Y-direction is markedly greater than that in the X-direction, attributable both to the differing site dimensions along the X- and Y-axes and to the unequal stiffness of the subsurface structure in those directions. The amplification factor in the vertical (Z-) direction under different loading conditions remains consistently at around 3.5, which is significantly higher than those in the horizontal directions. Therefore, seismic performance assessments of underground structures should account for the effects of triaxial seismic loading, with particular attention to vertical seismic components, in order to more accurately capture the structural response under real earthquake conditions [
31].
3.5. Soil–Structure Interaction
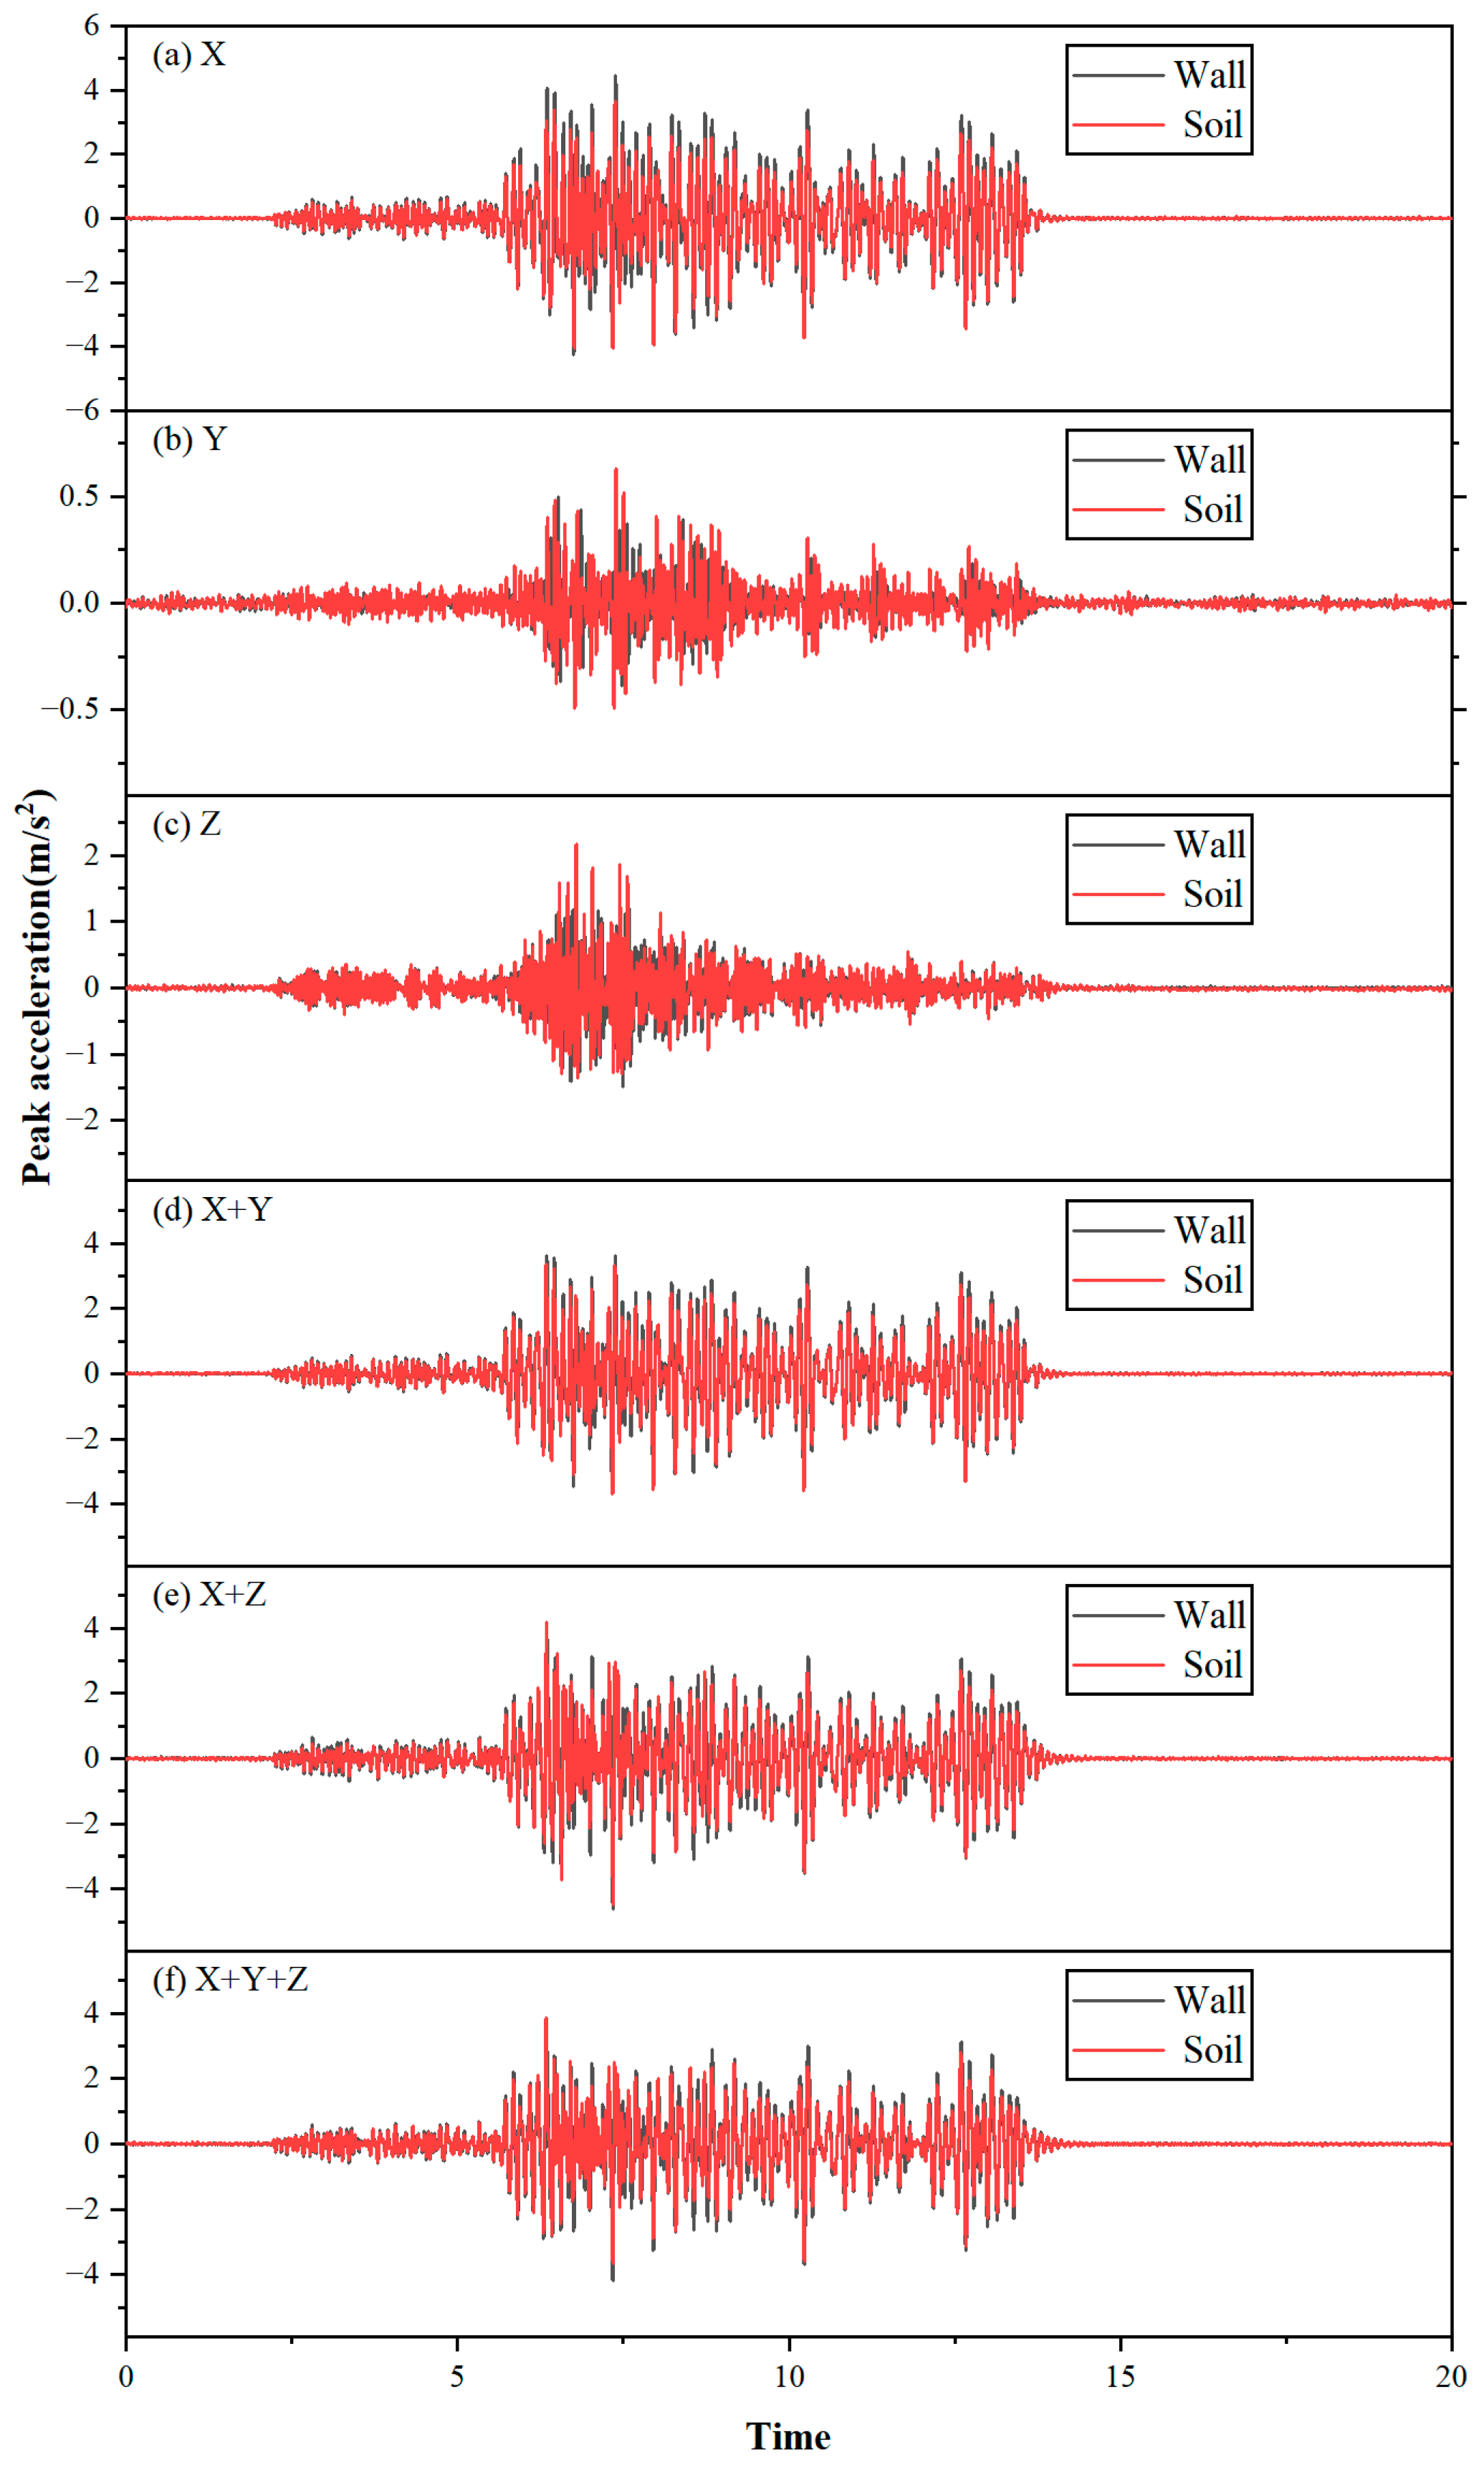
The acceleration time histories of the side wall (direction X) of the structure and the adjacent coral sand layers are shown in
Figure 12, along with their corresponding Fourier spectra shown in
Figure 13.
The acceleration time history curves of the side wall of the structure closely match those of the surrounding coral sand, and their Fourier spectra also show a high degree of overlap. This indicates that under the loading conditions of this experiment, there was no evident separation or slippage between the structure and the adjacent soil. The seismic response of the structure remained well-coordinated with that of the surrounding coral sand.
In the Fourier spectra, the spectral distributions under bidirectional and triaxial input conditions are generally consistent with those under unidirectional input in the X-direction. Together with the surface Fourier-spectrum characteristics discussed in
Section 3.2, this suggests that unidirectional shaking table tests can reasonably represent the directional spectral characteristics of both the coral sand layer and the underground structure under more complex bidirectional or triaxial seismic loading. These findings support the applicability of frequency spectrum analysis from unidirectional tests to multidirectional seismic scenarios.
3.6. Structural Strain
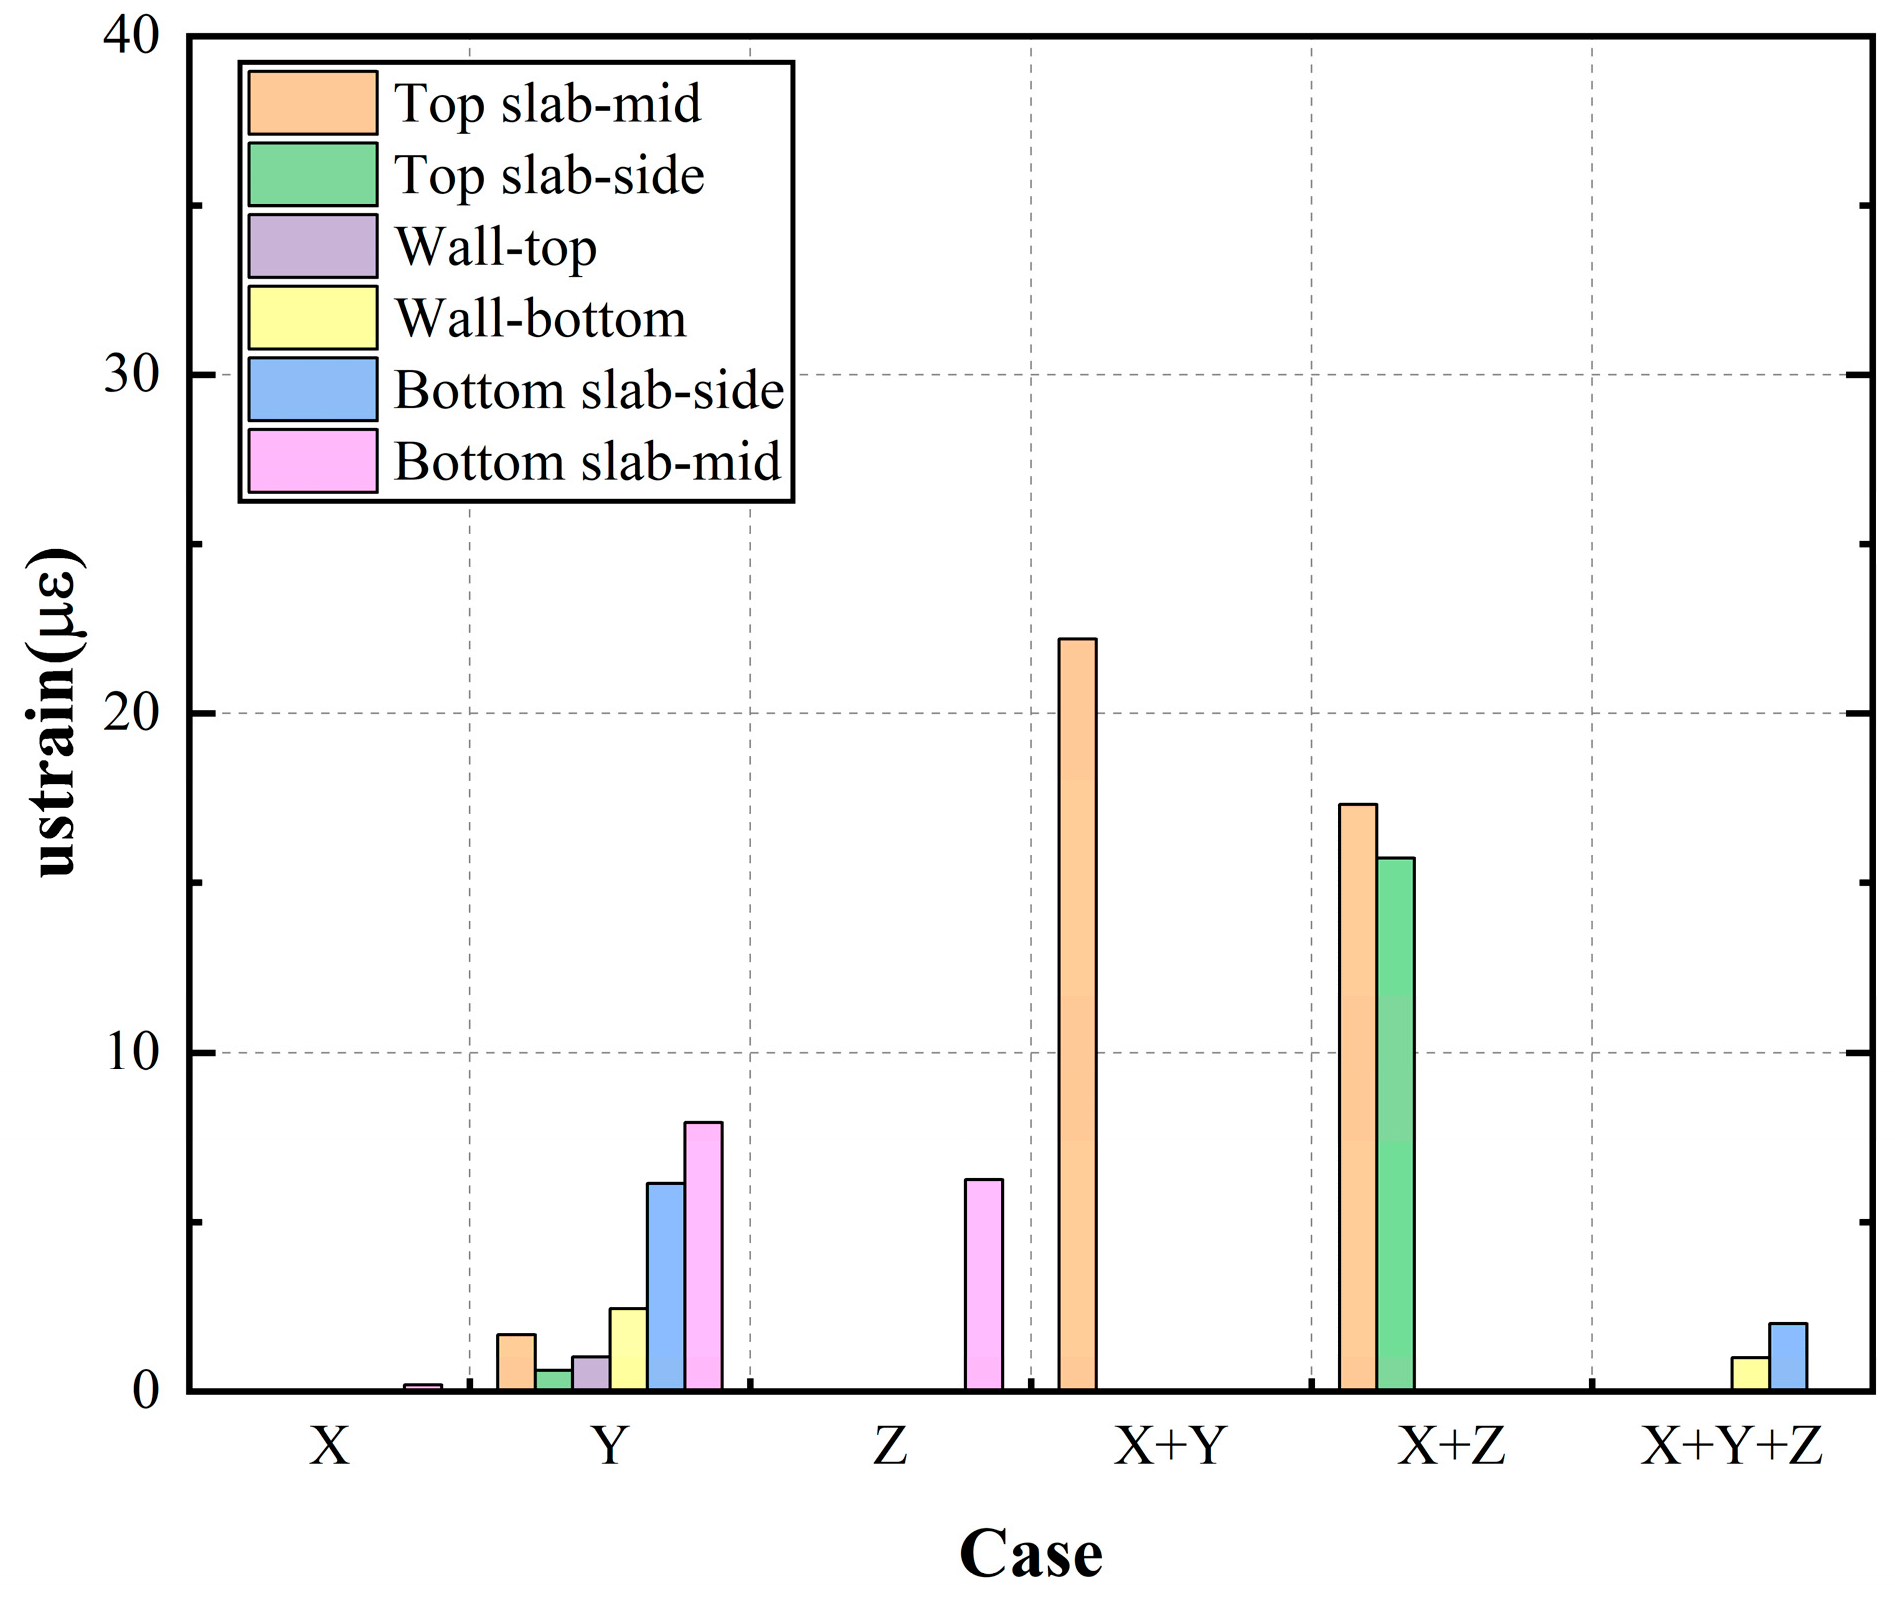
In this experiment, strain was primarily monitored at six locations of the structure: the center and edge of the outer roof slab, the top and bottom of the side walls, and the center and edge of the base slab. As illustrated in
Figure 14 (tensile strain) and
Figure 15 (compressive strain), changes in the loading direction have significant influences on the tensile and compressive strain responses at various structural positions. By comparing the tensile and compressive strain data in different loading scenarios, the differential effects of multidirectional seismic loading on various structural components are revealed.
Under unidirectional input in the X-, Y-, and Z-directions, strain responses vary across the structural elements. When subjected to seismic loading in the X- or Z-direction, the structure exhibits similar deformation characteristics, with the maximum strain occurring as tensile strain at the top of the side wall. In contrast, under unidirectional loading in the Y-direction, the maximum strain is observed as tensile strain at the center of the roof slab. These findings indicate that the internal force distribution within the underground structure depends significantly on the direction of the seismic excitation.
As analyzed in
Section 3.2, the unidirectional input in the Z-direction also induces considerable acceleration in the X-direction at the ground surface. This explains the similarity in lateral deformation patterns under Z-direction and X-direction loadings, with the maximum strain in both cases occurring at the top of the side wall. Under Y-direction input, however, due to differences in the structural configuration and stiffness between the X- and Y-directions, the deformation mode diverges notably from those observed under X- and Z-direction loadings.
Under bidirectional and triaxial seismic loadings, the maximum strain in the underground structure increases significantly. When subjected to X- and Y-directional inputs, tensile strain at the edge of the roof slab increases markedly, and compressive strain at the center of the roof slab also shows a noticeable rise. Under X- and Z-directional inputs, tensile strain at the top of the side wall increases significantly. During triaxial loading, the overall strain in the structure is further amplified, with the maximum observed tensile strain occurring at the center of the base slab, followed by the bottom of the side wall.
Overall, compressive strains in the structural components are consistently lower than tensile strains, indicating that seismic damage to underground structures is more likely to occur in tension. Under triaxial excitation, the strain levels are substantially higher than those under unidirectional and bidirectional conditions, with the most vulnerable areas being the center of the base slab and the bottom of the side wall. These findings suggest that targeted reinforcement in these regions could effectively enhance the seismic performance of underground structures.
4. Conclusions
In this study, a series of shaking table tests was conducted on an underground structure embedded in coral sand in various seismic loading directions. The experimental data were analyzed to evaluate the effectiveness of boundary conditions in the laminar shear model box and to investigate the influences of the loading direction on the ground acceleration response, the amplification characteristics of the site, and the acceleration and strain responses of the underground structure, as well as the interaction between the structure and the surrounding soil. The following conclusions can be drawn:
The laminar shear model box designed in this study effectively simulates the boundary conditions and shear behavior of coral sand in different loading directions. In the direction of the seismic excitation, the model shows minimal boundary and reflection effects. In contrast, more pronounced boundary effects are observed in the non-excitation directions;
The coral sand–underground structure system exhibits seismic responses not only in the excitation direction but also in the non-excitation directions, although the peak acceleration in the latter is smaller;
The ground acceleration amplification factors of the foundation in the X-, Y-, and Z-directions in different loading directions are 0.9–1.3, 1.4–2, and 3.4–3.7, respectively. The amplification effect in the vertical direction (Z-axis) shows little variation under unidirectional, bidirectional, and triaxial loading conditions and is significantly larger than the amplification effects in the horizontal directions (X and Y);
Taking the characteristic frequency corresponding to the peak of the surface Fourier amplitude under unidirectional loading as the reference frequency, it is found that the X- and Y-directions share similar reference frequencies in the low-frequency range (8–10 Hz), while the Z-direction exhibits a much higher reference frequency (around 16 Hz). Moreover, unidirectional seismic input generates high-frequency components (16–20 Hz) in the non-excitation directions;
Under bidirectional seismic input, when both excitation directions are horizontal, the response in the direction with the lower input intensity is affected by the other direction, causing the Fourier spectrum to shift toward higher frequencies compared with unidirectional input. However, when the excitation directions include one horizontal and one vertical component, the spectral distribution in both directions closely resembles that under unidirectional input. Under triaxial loading conditions, the characteristic frequencies in all three directions are nearly identical to their respective unidirectional reference frequencies.
The objective of this study is to investigate the seismic responses of coral sand sites and underground structures under different loading conditions. Current research on the seismic performance of underground structures at coral sand sites primarily employs shaking table tests or centrifuge experiments, with unidirectional seismic excitation being the commonly used input. However, the potential differences in the seismic responses between unidirectional excitation and realistic three-dimensional seismic conditions remain unclear. The conclusions derived from this study indicate that the vibrational characteristic frequencies of the coral sand foundation and underground structure are essentially consistent under both unidirectional and triaxial seismic loading conditions, and the amplification effect of the foundation varies similarly with depth, although the specific amplification factors differ. Moreover, the observed deformations of the underground structure under triaxial seismic loading are significantly greater than those under unidirectional loading, suggesting that the structural damage predicted from unidirectional seismic excitation in previous studies may underestimate the damage that would occur under actual three-dimensional seismic conditions.
Therefore, an important contribution of this study is to identify the differences in seismic responses among unidirectional, bidirectional, and triaxial loading conditions for coral sand sites and underground structures, providing qualitative correction references for seismic response evaluations.
The limitations of this study include the restricted experimental conditions and the insufficient sample size, which prevent a quantitative analysis of the differences in seismic responses under the various loading conditions. As a result, it is not possible to propose quantitative correction parameters for peak surface accelerations and structural damage. Furthermore, factors such as the seismic loading intensity, the density of the coral sand site, and the depth of the underground structure all influence the seismic response, but sensitivity analysis on these factors has not been conducted in this study.
Future research could consider expanding the sample size through numerical simulations and constructing machine-learning models to conduct a quantitative analysis of the differences in seismic responses under different loading conditions. This would allow for the development of correction factors or formulae, thereby reducing experimental requirements and costs. Additionally, based on both experimental and numerical results, a deeper analysis of the stress and deformation mechanisms of coral sand sites and underground structures under various influencing factors would enable a more systematic assessment of their seismic performance. Such an approach would provide a theoretical foundation for the safe construction of underground structures at coral sand sites.
