Article

Upper-Bound Stability Analysis of Cracked Embankment Slopes with Inclined Interlayers Subject to Pore Water Pressure

1
School of Architectural Engineering, Tongling University, Tongling 244061, China
2
Engineering Research Center for Geological Environment and Underground Space of Jiangxi Province, East China University of Technology, Nanchang 330013, China
3
School of Civil and Architectural Engineering, East China University of Technology, Nanchang 330013, China
4
Power China Jiangxi Electric Power Engineering Co., Ltd., Nanchang 330001, China
*
Author to whom correspondence should be addressed.
J. Mar. Sci. Eng. 2025, 13(8), 1594; https://doi.org/10.3390/jmse13081594
Submission received: 9 June 2025 / Revised: 25 July 2025 / Accepted: 13 August 2025 / Published: 21 August 2025
(This article belongs to the Section Coastal Engineering)

Abstract

This study analyzes the stability of embankment slopes with inclined interlayers and vertical tensile cracks at the crest under saturated conditions. This study first establishes a composite failure mechanism based on a finite element limit analysis; then, it derives an upper-bound solution formula for stability considering pore water pressure; and finally, it verifies the rationality of the method through case comparisons. This study finds that an increase in crack depth (Hc) causes the crack initiation position to approach the crest edge, while increases in the slope angle (β), pore water pressure coefficient (ru), and interlayer embedment depth (d) lead to the opposite trend. Both the stability number (γH/c1) and safety factor (Fs) decrease with the increase in the slope angle, pore water pressure coefficient, and crack depth, and they increase with the enhancement of relative soil strength and the increase in interlayer embedment depth. When cracks exist at the crest, the influence of pore water pressure on the sliding surface is diminished, while decreasing the cohesion ratio of interlayer to embankment slope soil (c2/c1) expands the range of the critical sliding surface.

1. Introduction

Coastal embankments serve as vital barriers against escalating threats from sea-level rise, storm surges, and intensified wave action under climate change [1,2]. Their stability is pivotal to preventing catastrophic failures, from coastal landslides threatening communities to highway slope collapses disrupting transportation networks [3]. Engineering evidence highlights that slope instability is significantly exacerbated by the presence of tension cracks at the crest. Deep-seated landslides are more probable on steep slopes where tension cracks develop at the crest [4]. These cracks develop when tensile stresses induced by processes such as dry–wet cycles [5,6], weathering [7], differential settlement [8], and anthropogenic activities exceed the tensile strength of the soil mass. The formation of cracks drastically diminishes slope stability by altering potential failure mechanisms and seepage paths [9]. By creating preferential flow channels, soil cracks enhance permeability and diminish shear strength. Additionally, the hydrostatic pressure generated in water-filled cracks imposes an extra driving force on the slope [10,11].
Furthermore, for embankments founded on layered soft soils, especially those containing inclined weak interlayers with low strength and high deformability, rainfall infiltration can increase the degree of saturation of the weak interlayers, thereby reducing their shear strength, which may cause instability in slopes that were originally stable [12,13,14,15]. The interplay of crest cracking, pore water pressure effects, and inclined weak interlayers creates a critical hydro-mechanical coupling issue, which significantly threatens the integrity of embankments. Therefore, developing a reasonable analytical method to accurately evaluate the stability of such complex embankment slopes under these combined effects is crucial for ensuring the safety and long-term performance of coastal protection infrastructure.
Accurate stability assessment of such complex slopes requires understanding their critical failure mechanisms. Previous studies have noted that slopes with weak interlayers often exhibit composite sliding surfaces, combining weak structural planes and log-spiral segments [9,12]. Analytical methods for slope stability have evolved from translational failure modes [16] and rotational–translational mechanisms [17] to limit equilibrium approaches (e.g., Bishop’s method, Morgenstern–Price method) and finite element analysis. Among stability calculation methods for fractured slopes based on existing limit equilibrium theory, the overall circular sliding method or slice-based methods, such as Bishop’s method and the Morgenstern–Price method (M-P method), are typically selected for circular sliding surfaces. In contrast, the unbalanced thrust method can be widely applied for the verification of non-circular sliding surfaces. It is noteworthy that these traditional calculation methods possess theoretical limitations, primarily manifested in inadequate or entirely absent consideration of tension cracks at the slope crest, or failure to effectively characterize the mechanical influence of crack propagation. For instance, Fredlund [18] established an analytical framework for non-circular sliding surfaces using a combined Janbu–Morgenstern algorithm based on generalized limit equilibrium theory. Although Huang [19] and Chang [20] have developed non-deterministic sliding surface search methods, these require large-scale numerical iterations to locate the critical sliding surface, resulting in significantly reduced computational efficiency [21].
Early extensions of the limit equilibrium method to slope stability problems that consider cracks required establishing limit equations for slopes with cracks under inter-slice force conditions. Utili [22] first determined the most adverse crack position in rotational failure mechanisms through the systematic minimization of the safety factor. Subsequent advances [23] extended this fundamental principle to composite failure modes. Baker [24] first combined the variational extremum theory with the limit equilibrium theory to evaluate the influence of tension cracks in cohesive soil slopes. Leshchinsky [25] further extended this approach to the calculation of safety factors for slopes containing cracks. The finite element method, capable of considering the progressive nature of slope failure and not requiring prior determination of potential sliding surfaces or crack distributions, has been progressively applied to slope stability analysis [26]. However, the slope stability analysis results obtained using the limit equilibrium method in the above two approaches are not precise upper- or lower-bound solutions [27]. Furthermore, the finite element method considers static and kinematic fields disrupted by cracks, and there is no unified criterion for identifying the critical state, which affects the accuracy of the calculation results. Additionally, for practical engineering applications, the finite element method often necessitates complex modeling, causing inconvenience in engineering practice [28]. The limit analysis method is based on the theory of soil plasticity and was first introduced into slope stability analysis by Drucker et al. [29]. Its advantage lies in the fact that the stress distribution during calculation does not need to satisfy equilibrium conditions, and step-by-step analysis of the elastoplastic state at various stages is unnecessary. Instead, it needs to establish only a kinematically admissible velocity field to directly solve the failure load under the limit state. Since it can provide the exact upper and lower bound solutions for slope stability analysis, it has been adopted by many scholars. Based on the simple translational failure mechanism and circular arc rotational failure mechanism, Chen [30] proposed a logarithmic spiral rotational failure mechanism and obtained the upper bound solution for the critical height of homogeneous slopes by establishing an energy balance equation. Subsequently, this method was extended to the stability analysis of complex slopes [31,32,33,34].
Existing research has predominantly focused on either slopes with weak interlayers or those with crest cracks, leaving the combined effects of inclined interlayers, crest cracks, and pore water pressure underexplored. Traditional methods also struggle to capture the asymmetric sliding behavior arising from this combination. To fill this gap, this study establishes a coupled analysis model integrating crest cracks, inclined weak interlayers, and pore water pressure. A composite failure mechanism (incorporating tension, shear, and translation) is constructed, and an upper-bound limit analysis, combined with shear strength reduction, is used to derive analytical expressions for stability. Mathematical optimization is employed to investigate how pore water pressure influences the stability number, crack position, and critical sliding surface. Finally, a method for indirectly determining the safety factor using stability charts is proposed, aiming to improve the safety assessment of complex embankments under realistic conditions.

2. Composite Failure Mechanism

Regarding the failure mechanism of slopes containing a single weak interlayer, a combined failure mechanism involving rotational and translational sliding is proposed by Huang et al. [12]. Between the rotating sliding mass and the translating sliding mass, a discontinuity exists in the velocity distribution across the interface. From the perspective of the rotating sliding mass, the velocity on the interface exhibits a trapezoidal distribution, whereas from the perspective of the translating sliding mass, the velocity shows a rectangular distribution (i.e., uniform velocity within this region). However, this mechanism does not account for the effects of cracks at the slope crest and pore water pressure.
To establish a failure mechanism for embankments with inclined interlayers under the combined influence of slope crest cracking and pore water pressure, the finite element limit analysis (FELA) numerical simulation software Optum G2 (v2.2019.02.12) was employed to construct the embankment model shown in Figure 1, where the groundwater level is positioned at the embankment slope crest. The physical–mechanical parameters and geometric dimensions of the slope and inclined interlayer in the model are listed in Table 1.
In the proposed model, both the weak interlayer and the overlying/underlying soil layers are simulated using the Mohr–Coulomb material model. The soil layers have a Young’s modulus E = 5000 kPa and a Poisson’s ratio ν = 0.3, while the weak interlayer is assigned E = 3000 kPa and ν = 0.3. The weak interlayer is modeled as a “shear joint” (represented by red dashed lines in Figure 2). The slope crest crack is also simulated as a Mohr–Coulomb material with shear joint behavior, where its elastic modulus E = 1000 kPa, and other parameters, including Poisson’s ratio, cohesion, internal friction angle, and unit weight, are all set to zero. Since the slope crest cracks in this study are of known depth but unknown location, vertical cracks with a depth of 0.6 m (Hc/H = 0.1) are predefined at every other grid node along the slope crest, as shown by the black segments in Figure 2. Standard boundary conditions are applied: the left and right sides of the slope model are constrained against horizontal displacement, while the bottom boundary is fixed in both the horizontal and vertical directions.
Figure 3a shows the mesh deformation of an embankment slope. The distribution of gray shading indicates the concentrated stress regions within the slope, reflecting that the plastic zones mainly occur near the toe of the slope in the middle part of the slope body as well as near the lower end of the crack at the slope crest, where potential sliding surfaces may develop. Figure 3b shows the distribution of groundwater flow within the embankment slope body, with arrows indicating the direction and intensity of water movement. The direction of the arrows represents the path of water infiltration, while their length reflects the magnitude of the flow. In Figure 3b, it can be seen that the water flow is mainly concentrated near the weak interlayer (indicated by the red dashed line) and permeates along the sliding surface, suggesting that water infiltration plays a significant role in slope failure. Additionally, the arrows indicate that water seeps from the top slope cracks into the interior of the embankment soil, which may increase the sliding driving force of the upper soil layer and accelerate the formation of top slope cracks. Consequently, pore water pressure generated by water infiltration significantly accelerates embankment failure. Figure 3c shows the shear dissipation contour diagram of the critical sliding surface of the saturated embankment with an inclined interlayer. It can be seen that the critical sliding surface initiates from the bottom end of the slope crest crack, presenting an arc shape until it reaches the weak interlayer plane. Then, it develops along the interlayer plane and finally exits the slope base along the path with the maximum shear dissipation, which is where the weak interlayer meets the overlying soil.
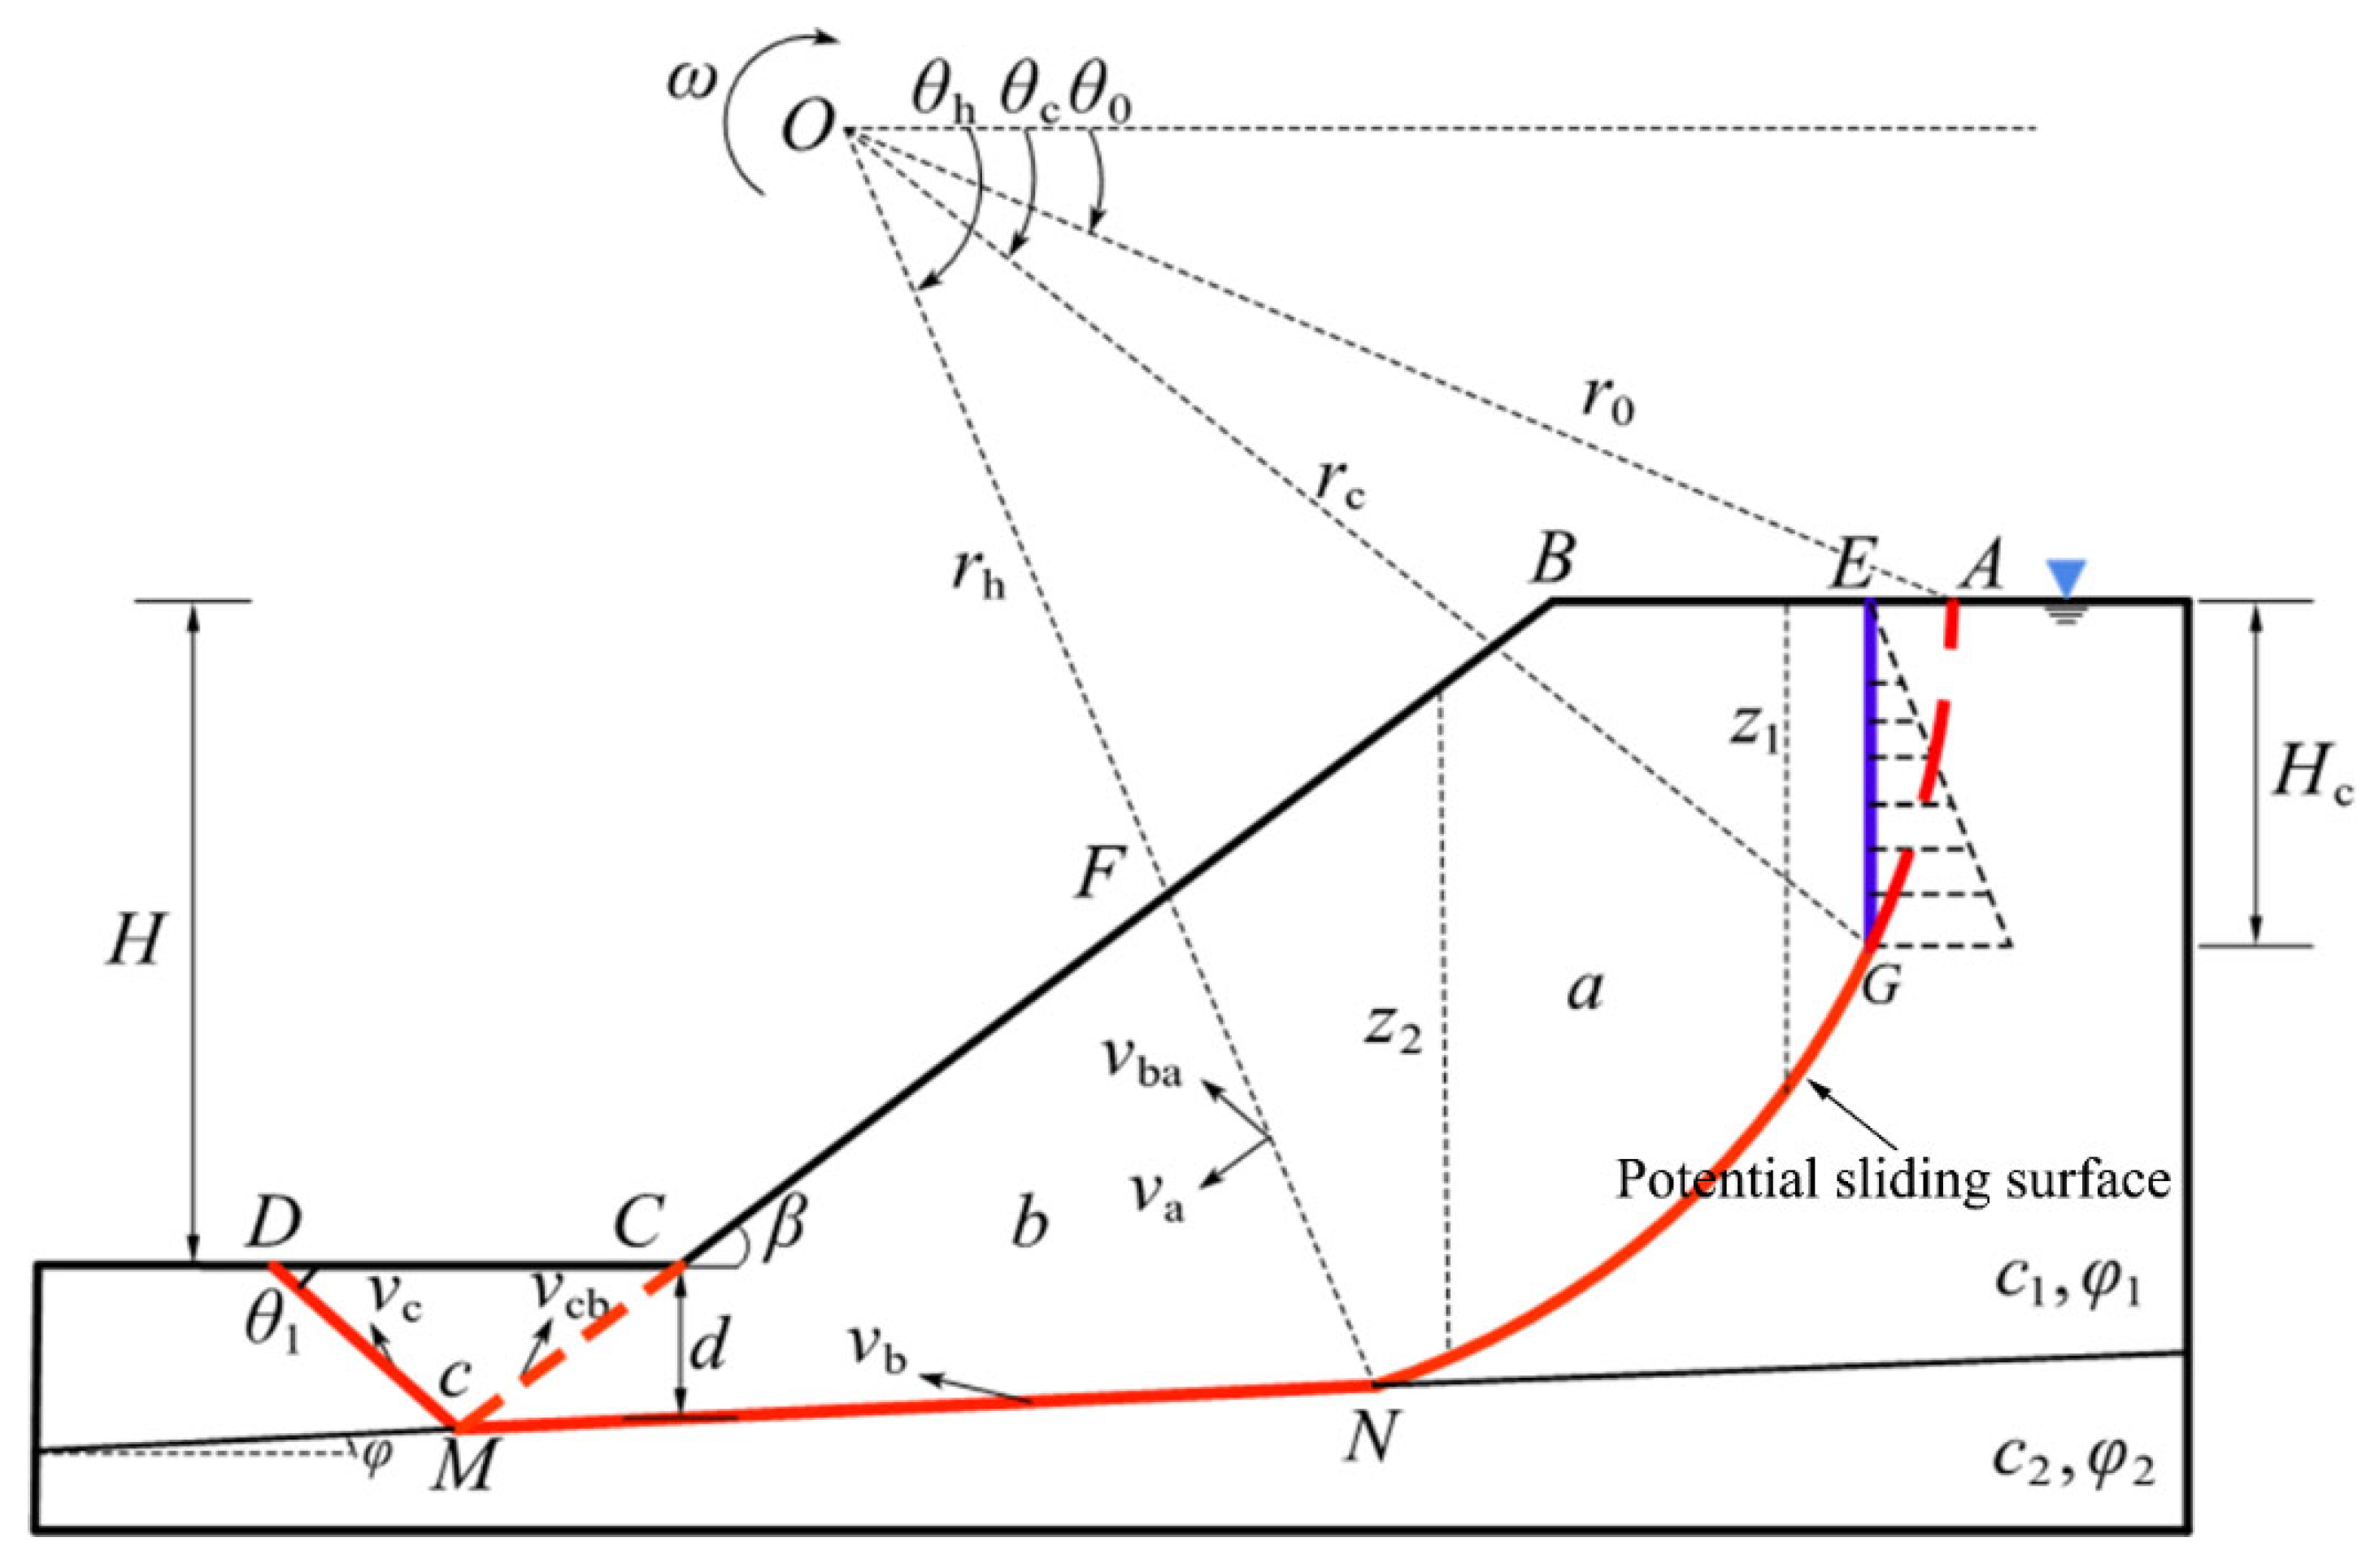
By combining the upper bound theorem with FELA numerical simulation results, a theoretical failure mechanism is established for embankments with inclined interlayers under pore water pressure, incorporating slope crest cracks. As shown in Figure 4, the red arc AN represents a logarithmic spiral sliding surface, while the red straight line NMD denotes a translational sliding surface. The dashed triangular frame indicates the impact of hydrostatic pressure on the crack, where z1 and z2 represent the vertical depths from the logarithmic spiral sliding surface to the slope shoulder and slope face, respectively. Referring to the work of Huang et al. [12], the following improvements are introduced:
(1)
The midpoint velocity of discontinuity NF is selected as the reference to establish the velocity relationship between sliding blocks a and b;
(2)
The angle between discontinuity NF and the weak interlayer surface is assumed as an arbitrary value θh + δ, with θh being treated as an optimization parameter;
(3)
The sliding surface at the slope toe is modified by setting the shear surface at the intersection of the slope toe and weak interlayer parallel to the slope face, ensuring compliance with velocity compatibility conditions.

3. Upper-Bound Theorem Derivation

The upper-bound theorem of limit analysis determines the minimum stability number (or maximum load) that causes collapse by equating the work rate achieved by external forces to the rate of internal energy dissipation along a kinematically admissible failure mechanism. This theorem is applied to analyze the stability of the cracked embankment slope shown in Figure 4, considering the critical case where the water table is at the crest (i.e., saturated condition). To derive the upper-bound solution, the following simplifying assumptions are made:
(1)
The soil is idealized as a perfectly plastic material, neglecting phenomena such as strain softening, and follows the Mohr–Coulomb failure criterion with an associated flow rule;
(2)
The deformation of the soil at the limit state is assumed to be small, and the slope is sufficiently long to be treated as a plane strain problem;
(3)
The slope is under steady-state seepage conditions, considering only hydrostatic pressure. The pore water pressure distribution within the soil is vertical, and its magnitude at any point corresponds to the vertical distance from that point to the groundwater level.
Within the framework of the kinematic theorem, pore water pressure is treated as an external force acting on the soil mass. The key step involves expressing the total work rate achieved by pore water pressure throughout the failing soil mass. This work rate is mathematically equivalent to the combined work rates of buoyancy and seepage forces [34]. For a kinematically admissible velocity field, the internal energy dissipation and external work rates must satisfy the virtual work principle. This leads to the generalized expression for pore pressure work rate along discontinuities:
W u = V u ε ˙ ii d V S u n i v i d S
where u represents the pore water pressure, V represents the volume of the disrupted soil, εii represents the volumetric strain rate, vi is the velocity field that satisfies the geometric compatibility condition, S is the velocity discontinuity surface, and ni is the unit vector perpendicular to dS.
The distribution of pore water pressure along the sliding surface can be obtained by solving the seepage differential equation incorporating hydraulic boundary conditions. However, when the boundary conditions are complex, it becomes significantly challenging to directly calculate the pore water pressure distribution using analytical methods. Evaluating the pore pressure u along the complex sliding surface directly is difficult. To overcome this practical challenge, a widely used simplification method is adopted: Bishop’s pore water pressure coefficient ru [35]. This coefficient represents the ratio of pore water pressure u to the total vertical stress due to soil weight γz at a given depth z. Using ru, the pore pressure distribution is approximated simply as follows:
u = r u · γ · z
In Equation (2), ru denotes the pore water pressure coefficient, representing variations in pore pressure distribution; γ is the unit weight of the soil; and z is the vertical distance from the calculation point to the ground surface. Here, the pore water pressure coefficient ru approximates the influence of pore water pressure on system stability. To facilitate subsequent calculations, following Michalowski’s approach, the equipotential lines of the flow field are assumed to be vertical, and the pore water pressure at any point on the sliding surface aligns with its normal direction. The hydraulic head is defined as the vertical distance difference between the point and the phreatic surface or external slope water level. This framework is then used to derive the energy dissipation formulation [36].
A slope stability evaluation model neglecting interlayer thickness effects is formulated using plastic limit analysis theory by introducing a boundary condition where the interlayer thickness approaches zero. As depicted in Figure 5, a two-dimensional Cartesian coordinate system is established with the slope toe point C as the origin. The straight line MN is defined as y1 = k1xb, while the slope surface line CA is expressed as y = kx. Points M and N, located on the weak interlayer line with coordinates (xM, yM) and (xN, yN), respectively, satisfy the following geometric relationships:
x M = b k 1 k y M = k b k 1 k x B = H cot β y B = H
x F = X N tan θ h + k 1 b k + tan θ h y F = tan θ h + k 1 X N b k k + tan θ h x D = k b k k 1 k + k b tan θ 1 k 1 k y D = 0
The lengths of the line segments illustrated in Figure 4 are subsequently calculated based on the geometric coordinates of each point, as follows:
L MN = x M x N 2 + y M y N 2 L NF = x N x F 2 + y N y F 2 L CM = x C x M 2 + y C y M 2 L DM = x D x M 2 + y D y M 2 L BF = x B x F 2 + y B y F 2
After nondimensionalizing H, L1, and L2, the equation of the logarithmic spiral on the sliding surface AN is
r θ = r 0 e θ θ 0 tan φ
H + y N r 0 = e θ h θ 0 tan φ sin θ 0
Since the x-coordinate xN of point N is an optimization parameter, it can be considered a known quantity; thus,
r 0 = H + y N e θ h θ 0 tan φ sin θ 0 H r = H r 0
When the depth of the crack is known, the geometric angle θc of the crack can be expressed as a function of variables θ0 and θh:
sin θ c e θ c θ 0 tan φ = ( e θ h θ 0 tan φ sin θ h Y N e θ 0 tan φ r 0 ) ( H c H ) + e θ 0 tan φ sin θ 0 ( 1 H c H )
The expression related to the crack location and the distance from the location of the crack to the slope shoulder (line EB) can then be expressed as follows:
L r = L 1 r L 2 r L 1 r = L 1 r 0 = sin θ h θ 0 sin θ h L BF sin θ h + β r 0 sin θ h L 2 r = L 2 r 0 = cos θ 0 cos θ c e θ c θ 0 tan φ
In accordance with the associated flow rule, the angle between the relative velocity direction of the sliding surface and the velocity discontinuity is equal to the internal friction angle of the soil. Consequently, the angles between the relative velocity direction and velocity discontinuities GN, NF, CM, and DM are defined as φ1, while the angle at discontinuity MN is specified as φ2. Assuming the velocity of sliding block NMCF is vb, with its direction forming an angle of δ-φ2 with the horizontal line, the relative velocities between sliding blocks and discontinuities are derived based on the velocity compatibility diagram, as illustrated in Figure 5.
From Figure 5 and the sine theorem, it can be derived that
v b sin π 2 + φ 1 = v a sin θ h φ 1 φ 2 + δ v b sin π 2 + φ 1 = v ab sin π 2 θ h + φ 2 δ
v b sin π θ 1 β 2 φ 1 = v c sin β + φ 1 + φ 2 δ v b sin π θ 1 β 2 φ 1 = v cb sin θ 1 + φ 1 φ 2 + δ
where θ1, θh, δ, and β are geometric angle parameters in Figure 4; φ1 and φ2 are the strength parameters of the slope body and the weak interlayer, respectively; va is the midpoint velocity of discontinuity NF, expressed as va = (rh-LNF/2)ω (where ω is the rotational angular velocity of the sliding mass GNFBE); vb and vc are the velocity of the sliding mass NMCF and CMD, respectively.
The velocity vectors between the sliding masses and discontinuities are derived based on the velocity compatibility conditions.
v a = ω · r h L NF / 2 v b = v a cos φ 1 / sin θ h φ 1 φ 2 + δ v ab = v b cos φ 1 / cos θ h φ 2 + δ v c = v b sin β + φ 1 + φ 2 δ / sin θ 1 + β + 2 φ 1 v cb = v b sin θ 1 + φ 1 φ 2 + δ / sin θ 1 + β + 2 φ 1
The external work rate of the soil weight Wr contributed by the sliding region can be written as follows:
W r = W ra + W rb + W rc
where the subscripts a, b, and c represent the sliding regions GNFBE, NMCF, and CMD in Figure 4, respectively.
Considering that directly solving the external power of the work done by the soil weight in the sliding failure zone GNFBE through integration is highly complex, the superposition method is adopted here. Specifically, the gravitational work done by the soil in the OAN region is calculated by subtracting the corresponding values in the OAB, OBF, and AEG regions. Furthermore, the work rate contribution from the AEG region is calculated by subtracting the work done by the soil weight in the OAE and OGE regions from that of in the OAG region.
W ra = γ r 0 3 ω f 1 f 2 f 3 f 4 + f 5 + f 6
where the expressions f1~f6 are dimensionless functions that are clearly explained by trench geometry and variable parameters and can be listed as follows:
f 1 = e 3 θ h θ 0 tan φ 3 tan φ cos θ h + sin θ h 3 tan φ cos θ 0 sin θ 0 3 1 + 9 tan 2 φ 1 f 2 = sin θ 0 2 cos θ 0 L 1 r 6 L 1 r f 3 = 1 6 r 0 3 L BF sin θ h + β r h L NF 2 r h L NF cos θ h + L BF cos β f 4 =   e 3 θ c θ 0 tan φ 3 tan φ cos θ c + sin θ c 3 tan φ cos θ 0 sin θ 0 3 1 + 9 tan 2 φ 1 f 5 = sin θ 0 2 cos θ 0 L 2 r 6 L 2 r f 6 = 1 3 cos 2 θ c e 2 θ c θ 0 tan φ e θ c θ 0 tan φ sin θ c sin θ 0
The work done by gravity on the soil mass within the sliding bodies NMCF and CMD is calculated as follows:
W rb = γ · S NMCF · v b sin δ φ 2 = γ r 0 3 ω f 7 W rc = γ · S CMD · v c cos 45 ° φ 1 2 = γ r 0 3 ω f 8
where
S NMCF = 1 2 L MN L NF sin θ h + δ S CMD = 1 2 L CM L DM sin θ 1 + β
and the expression of f7 and f8 can be written as follows:
f 7 = L MN L NF sin θ h + δ r h L NF / 2 cos φ 1 sin δ φ 2 2 r 0 3 sin θ h φ 1 + φ 2 δ f 8 = L CM L DM sin θ 1 + β r h L NF / 2 cos φ 1 sin β + φ 1 + φ 2 δ cos 45 ° φ 1 / 2 2 r 0 3 sin θ h φ 1 + φ 2 δ sin θ 1 + β + 2 φ 1
The total work rate due to the gravity of the slope sliding mass is obtained as follows:
W γ = γ r 0 3 ω f 1 f 2 f 3 f 4 + f 5 f 6 + f 7 f 8
In this model, the pre-existing crack at the crest is treated as a predefined boundary; energy dissipation during its formation is not modeled. Therefore, internal energy dissipation D is considered to occur only along the velocity discontinuity surfaces of the failure mechanism (GN, NF, MN, CM, and DM in Figure 4). The dissipation rate on each discontinuity is calculated as the product of the soil’s cohesion, the length of the discontinuity, and the magnitude of the relative velocity jump across it. Summing the dissipation over all discontinuities gives the total internal dissipation rate D:
D = D GN + D NF + D MN + D CM + D DM
where
D GN = c 1 r 0 2 ω 2 tan φ e 2 θ h θ 0 tan φ 1 D MN = c 2 · L MN · v b cos φ 2 D NF = c 1 · L NF · v ab cos φ 1 D CM = c 1 · L CM · v cb cos φ 1 D DM = c 1 · L DM · v c cos φ 1
The work done by pore water pressure comprises two components: (1) water acting on the sliding surface—water seeping along the potential sliding surface creates pressure that reduces the soil’s ability to resist sliding; (2) water in the crest crack—water trapped in the vertical crack at the top of the slope pushes outward on the crack, adding force that could make the slope slide.
Mathematically, the work done by pore water pressure on the sliding surface can be written as follows:
W u = W ua + W ub + W uc
where Wua, Wub, and Wuc in the sliding bodies NFBEG, NMCF, and CMD are given by
W ua = γ r 0 3 ω · r u f u 1 + f u 2 W ub = γ · r u · S NMM′CF · v b sin δ φ 2 W uc = γ · r u · S MDM′ · v c cos 45 ° φ 1 / 2
where
f u 1 = tan φ 1 θ c θ 2 z 1 r 0 e 2 θ θ 0 tan φ 1 d θ f u 2 = tan φ 1 θ 2 θ h z 2 r 0 e 2 θ θ 0 tan φ 1 d θ
The expression of z1/r0 and z2/r0 can be written as
z 1 r 0 = e θ θ 0 tan φ 1 sin θ sin θ 0 z 2 r 0 = e θ θ 0 tan φ 1 sin θ e θ h θ 0 tan φ 1 sin θ h + e θ θ 0 tan φ 1 cos θ e θ h θ 0 tan φ 1 cos θ h
The parameter SNMM’CF in Equation (24) is computed using the superposition method: Perpendiculars drawn from points N and M in Figure 4 intersect lines BC and CD at points N’ and M’, respectively. Based on geometric relationships, it follows that
S NMM′CF = d + y M x M 2 + d + L N   N   x N 2 L N   N   L NF sin θ h + β 2
The work done by water pressure in the crack can be written as
W w = γ r u r 0 3 ω f w
where
f w = 1 2 H c r 0 2 e θ c θ 0 tan φ 1 sin θ c 1 3 H c r 0
Based on the upper bound theorem of limit analysis, the energy equilibrium equation for an embankment slope containing an inclined interlayer with crest cracks under pore water pressure can be expressed as follows:
W γ + W u + W w = D
The expression for the slope stability number Ns can be derived from the above equation as
N S = γ H c 1 = d GN + d NF + d MN + d CM + d DM H r f 1 f 2 f 3 f 4 + f 5 + f 6 + f 7 f 8 + r u f w + f u 1 + f u 2 + f u b + f u c
The implicit equation for the safety factor (FS) of an embankment with an inclined interlayer and crest cracks under saturated conditions is obtained by applying reduction factors to the cohesion and internal friction angle of both the embankment soil and weak interlayer:
N f = c 1 γ H tan ϕ 1 = f 1 f 2 f 3 f 4 + f 5 + f 6 + f 7 f 8 + r u f w + f u 1 + f u 2 + f u b + f u c d GN + d NF + d MN + d CM + d DM H r tan φ 1 / F S
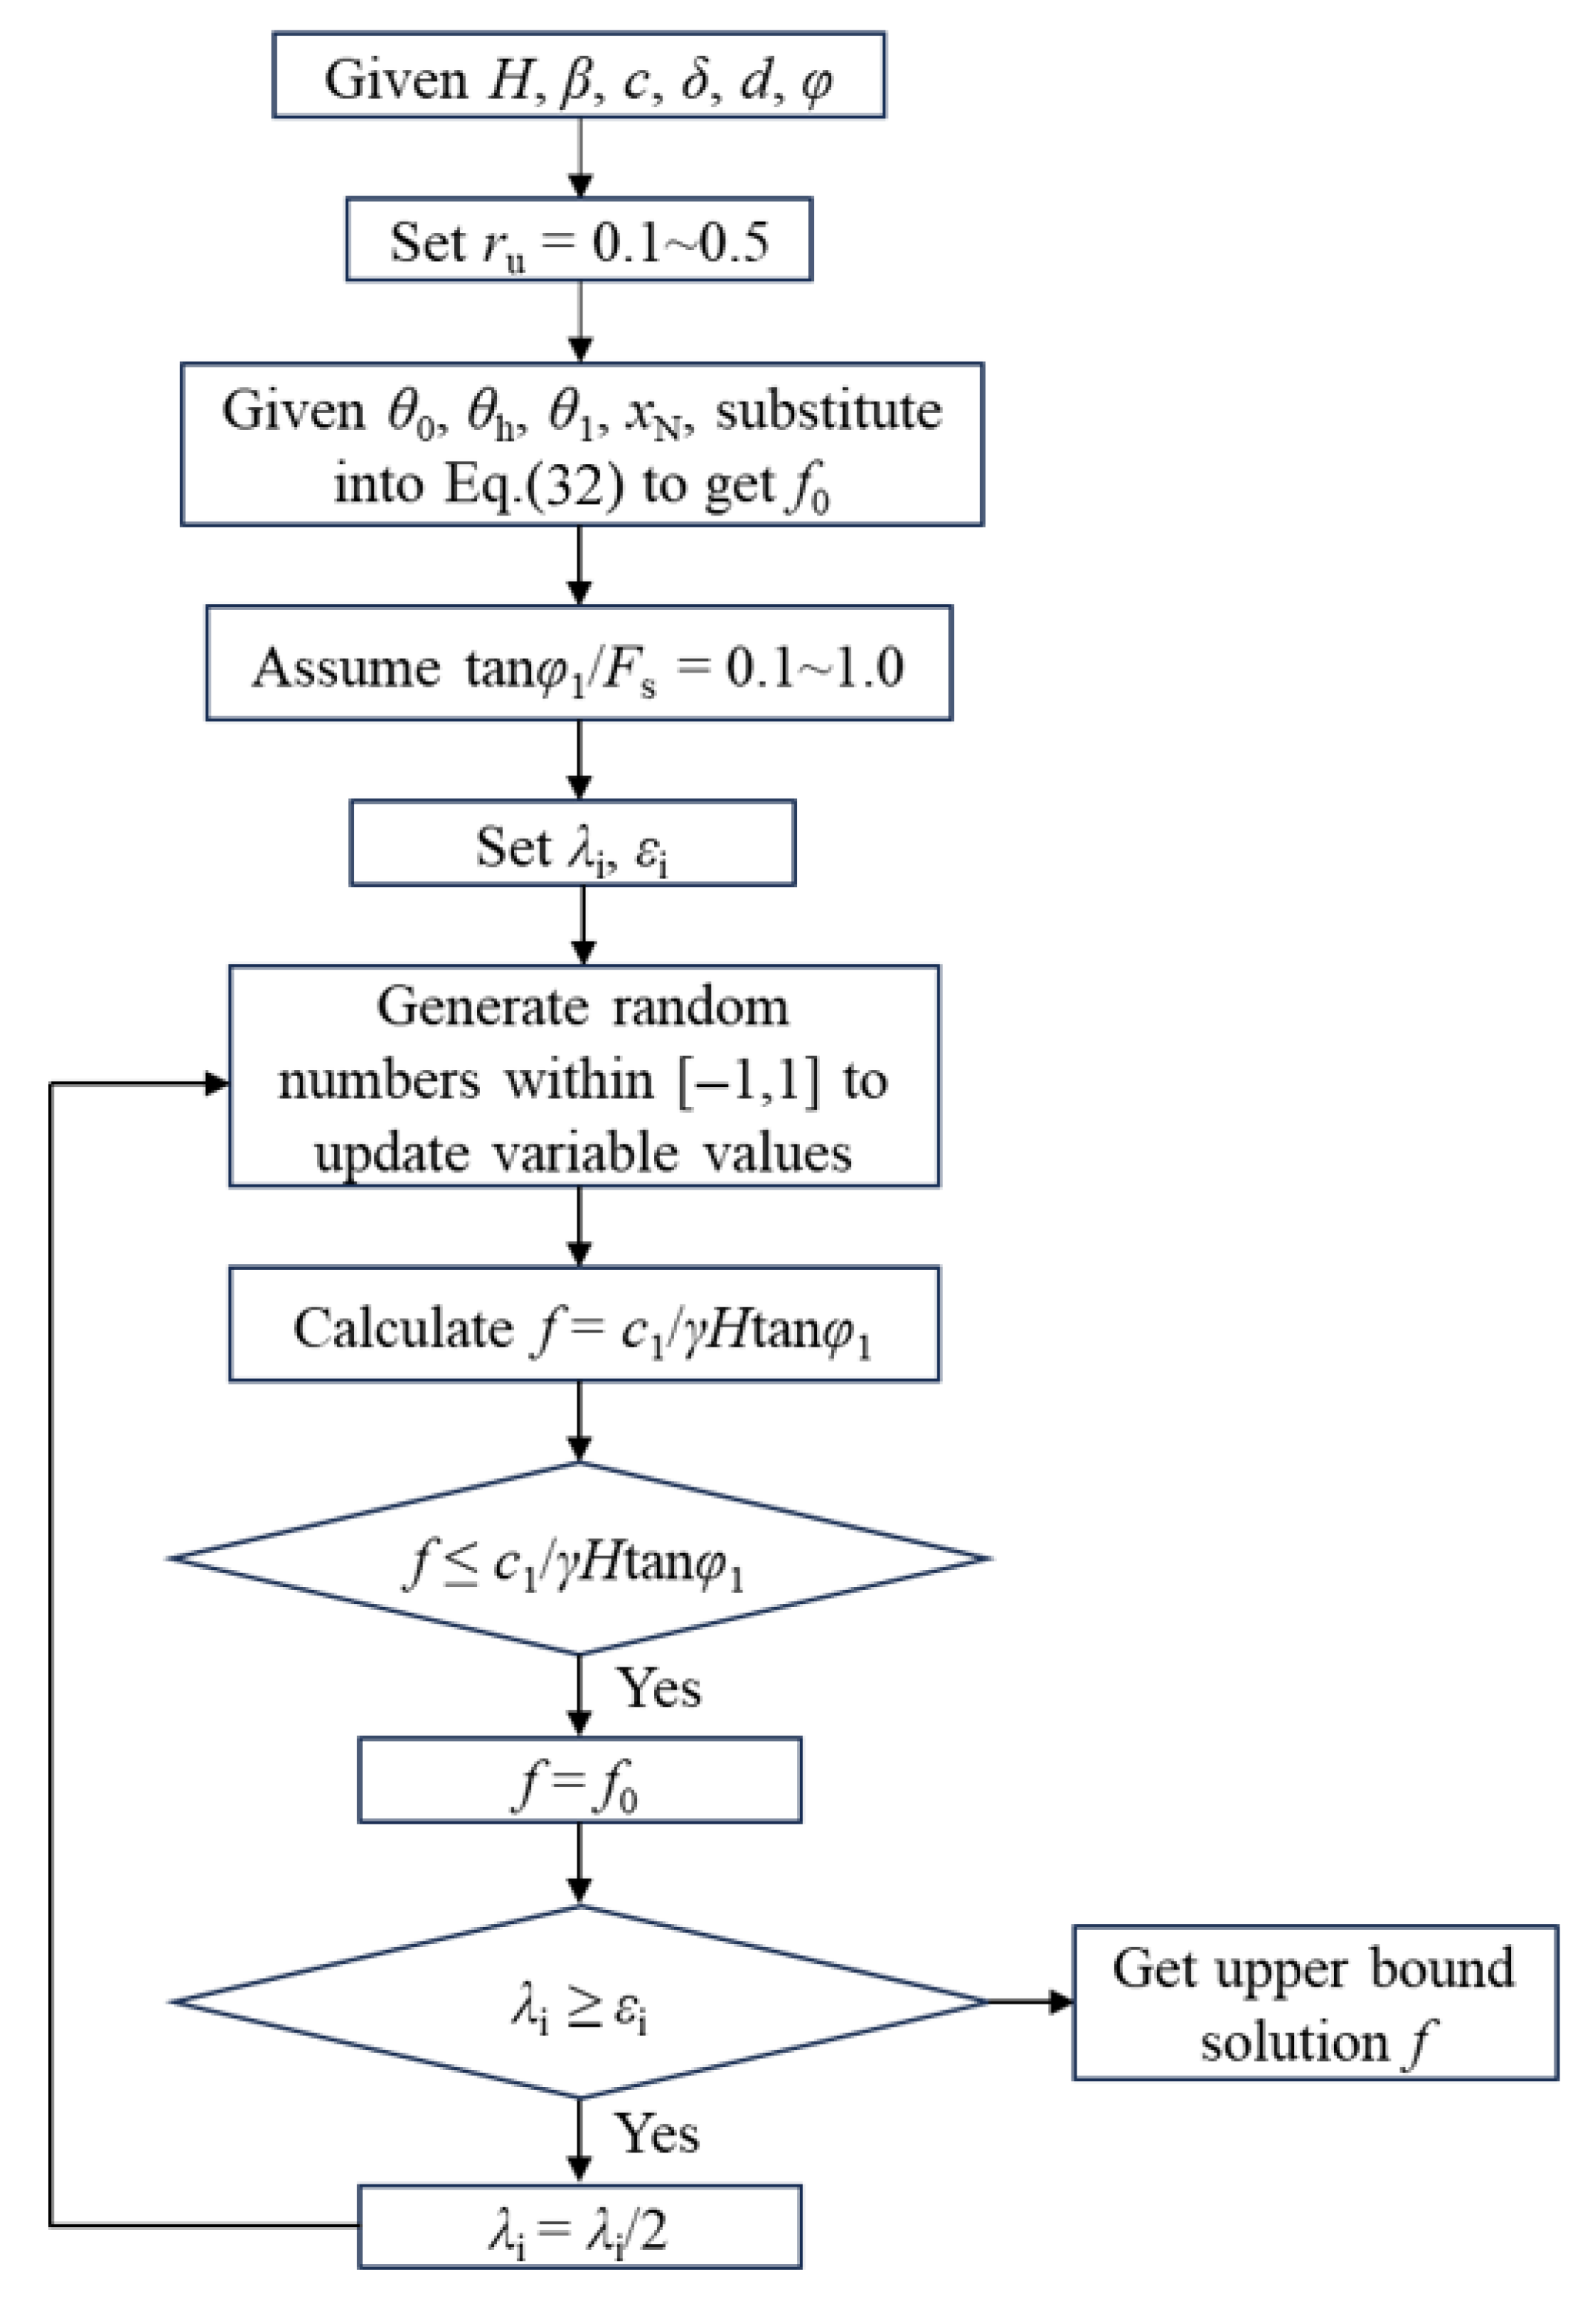
Figure 6 illustrates the computational procedure of Equation (32). The minimum upper-bound solution for Nf is determined by implementing a stochastic search optimization method in MATLAB (R2017a), with f2(θ0, θh, θ1, xN) as the objective function.

4. Results and Discussion

4.1. Comparative Analysis

To verify the validity of the calculation method proposed in this paper, two cases are presented for a comparative analysis of safety factors.
For a slope with a gradient of 1:2, height of H = 12.2 m, no cracks at the crest, and containing a weak interlayer [37], the dip angle δ of the weak interlayer is 0°. The distance from the slope toe to the underlying stratum of the weak interlayer d = 1.5 m, with a weak interlayer thickness of 0.4 m. The material parameters adopted in the calculation are as follows: the unit weight γ of both the weak interlayer and overlying soil is 18.8 kN/m3, the cohesion of the overlying soil is c1 = 28.7 kPa, the internal friction angle is φ1 = 20°, the cohesion of the weak interlayer soil is c2 = 0, and the internal friction angle is φ2 = 10°. Table 2 presents the comparison between the calculated safety factors of the slope under saturated conditions and solutions from other analytical methods.
It can be observed from Table 2 that the safety factor derived from this paper lies between the upper and lower bounds from Kim’s limit analysis, indicating that the results are closer to the true value. Moreover, the results obtained from this paper’s method are close to those of the Morgenstern–Price method.

4.2. Critical Crack Location L/H

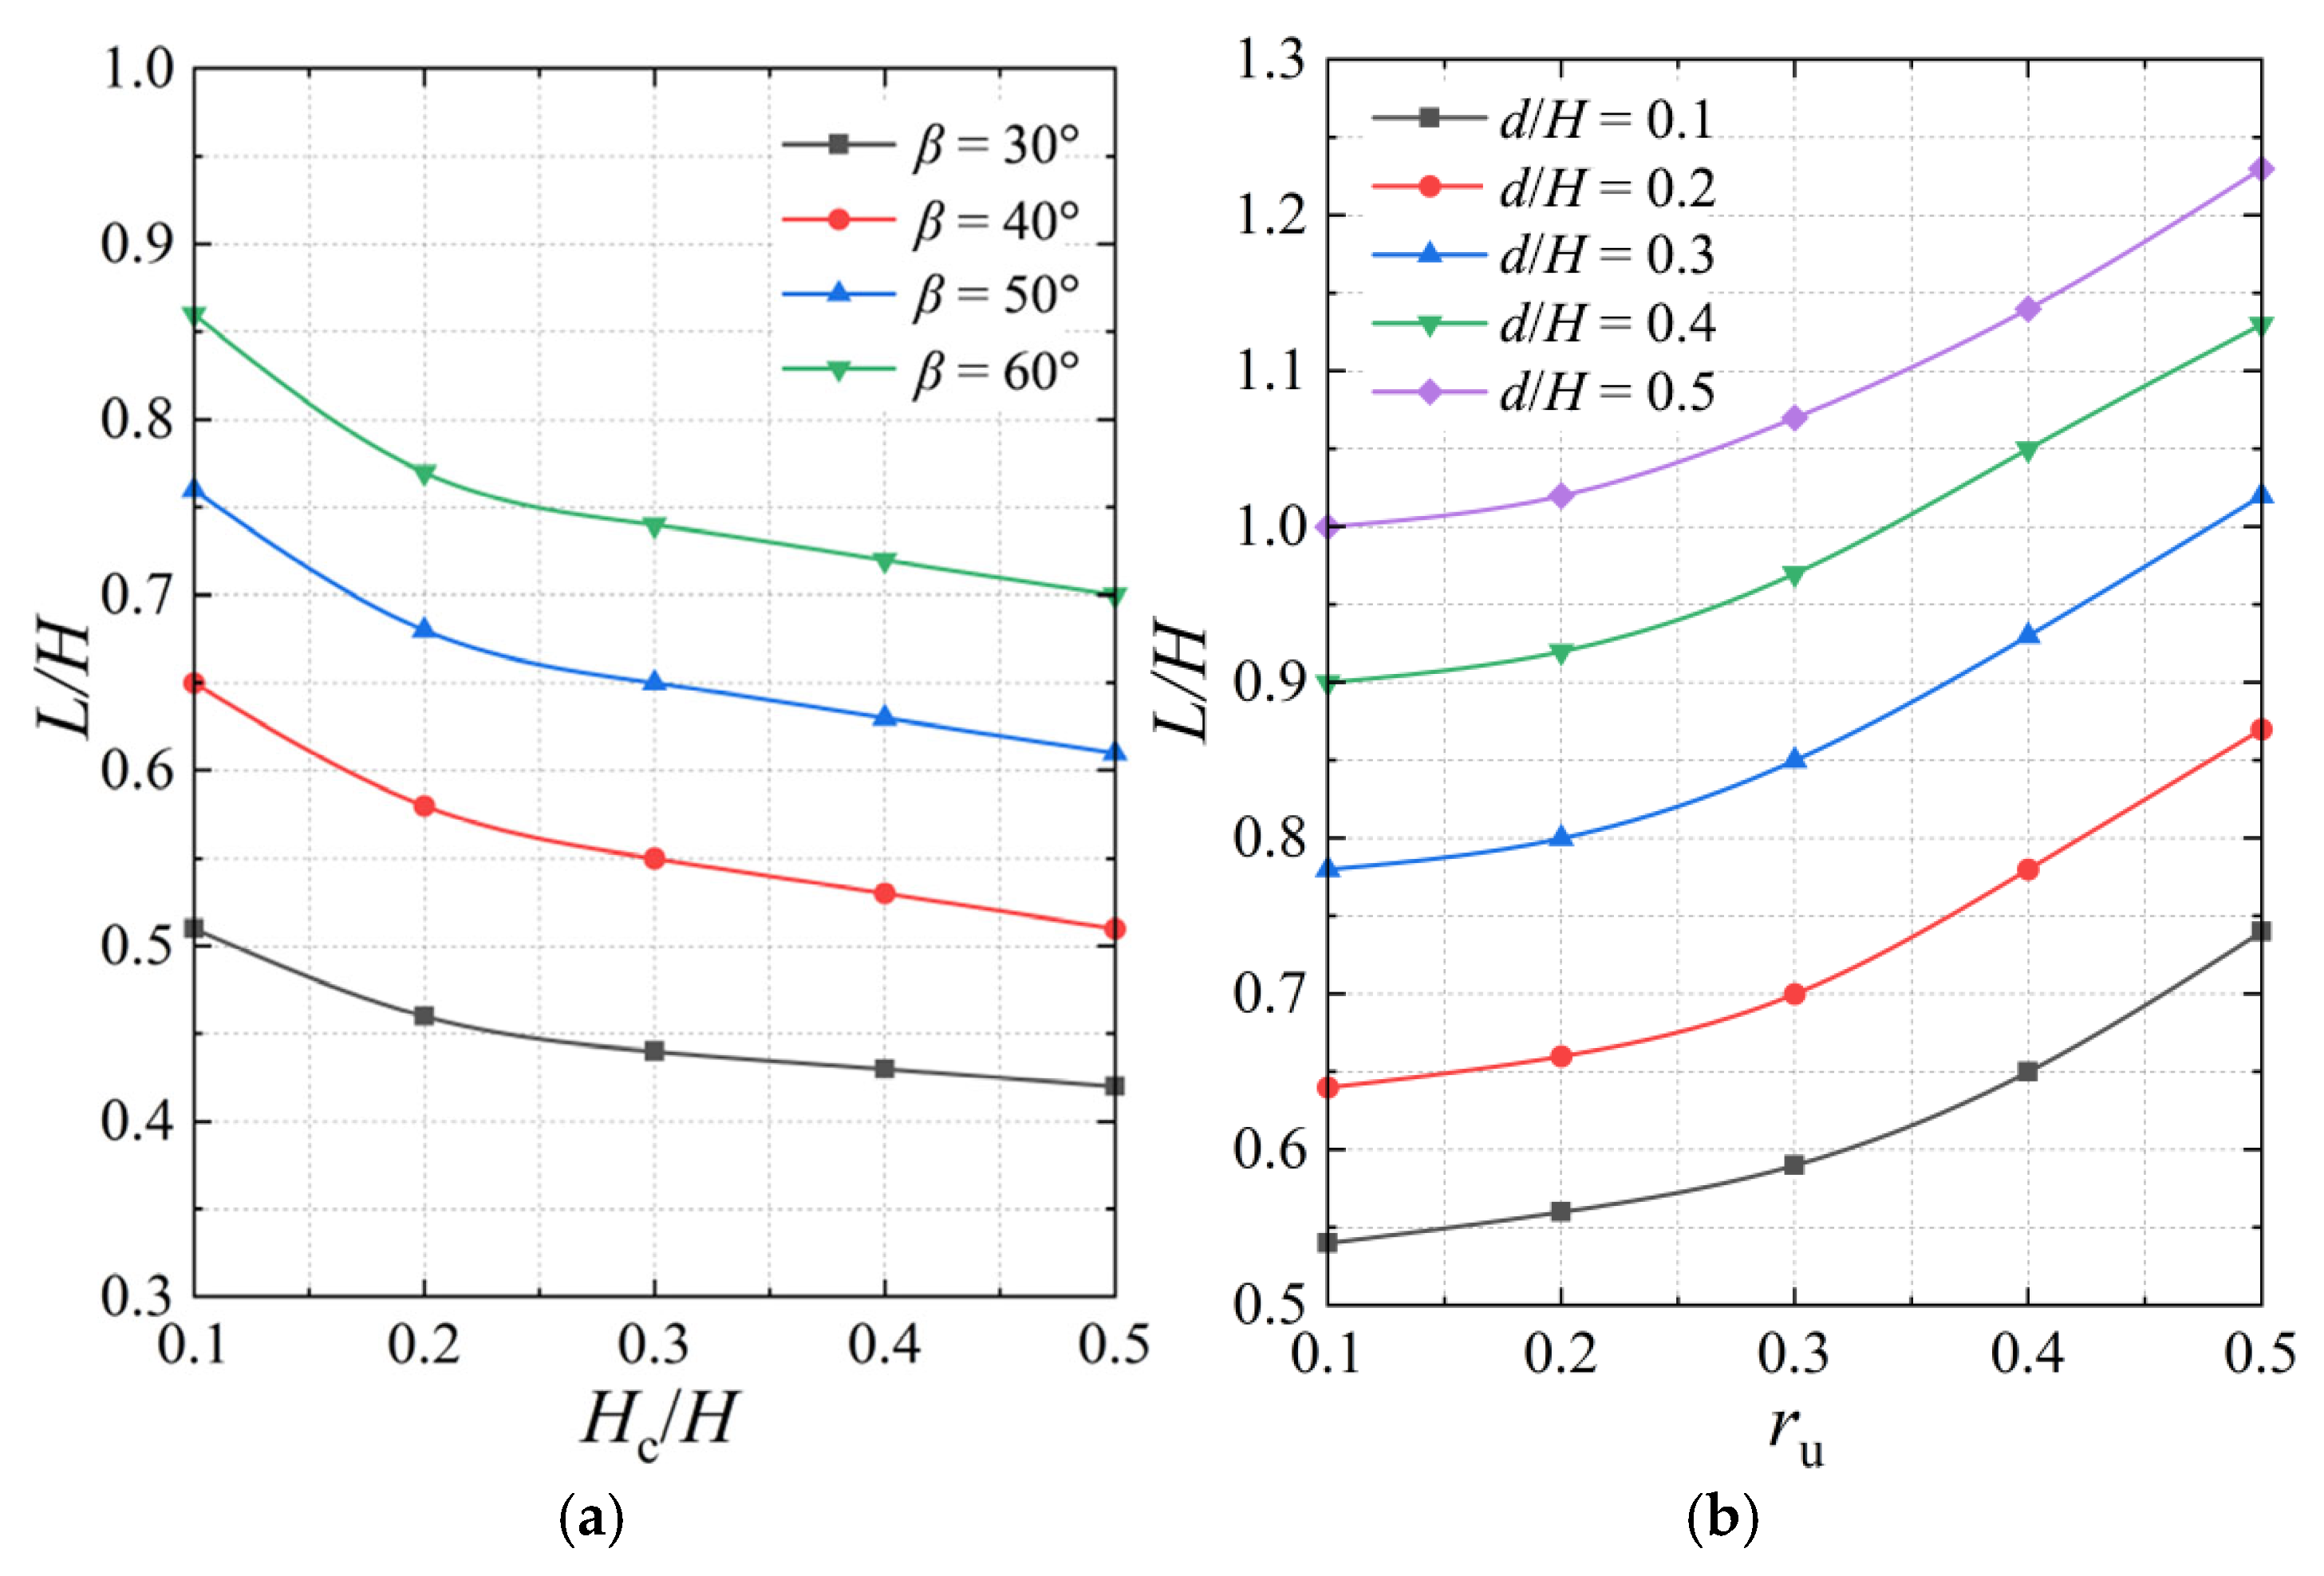
The parameters are set as follows: crack depth at the slope crest of Hc/H = 0.1~0.5, slope angle of β = 30°~60°, weak interlayer dip angle of δ = 4.76°, soil strength ratio of c2/c1 = 0.5, weak interlayer burial depth of d/H = 0.1~0.5, and pore water pressure coefficient of ru = 0.1~0.5. Figure 7 illustrates the influence of these parameters on the most critical crack location at the slope crest. It is shown that as the crack depth Hc/H increases, the normalized distance L/H decreases, implying that the crack position is closer to the slope shoulder. Conversely, with an increase in the pore water pressure coefficient ru, slope angle β, and weak interlayer burial depth d, the normalized distance L/H increases, indicating that the crack initiation position migrates toward the rear edge of the slope crest.

4.3. Stability Number Ns

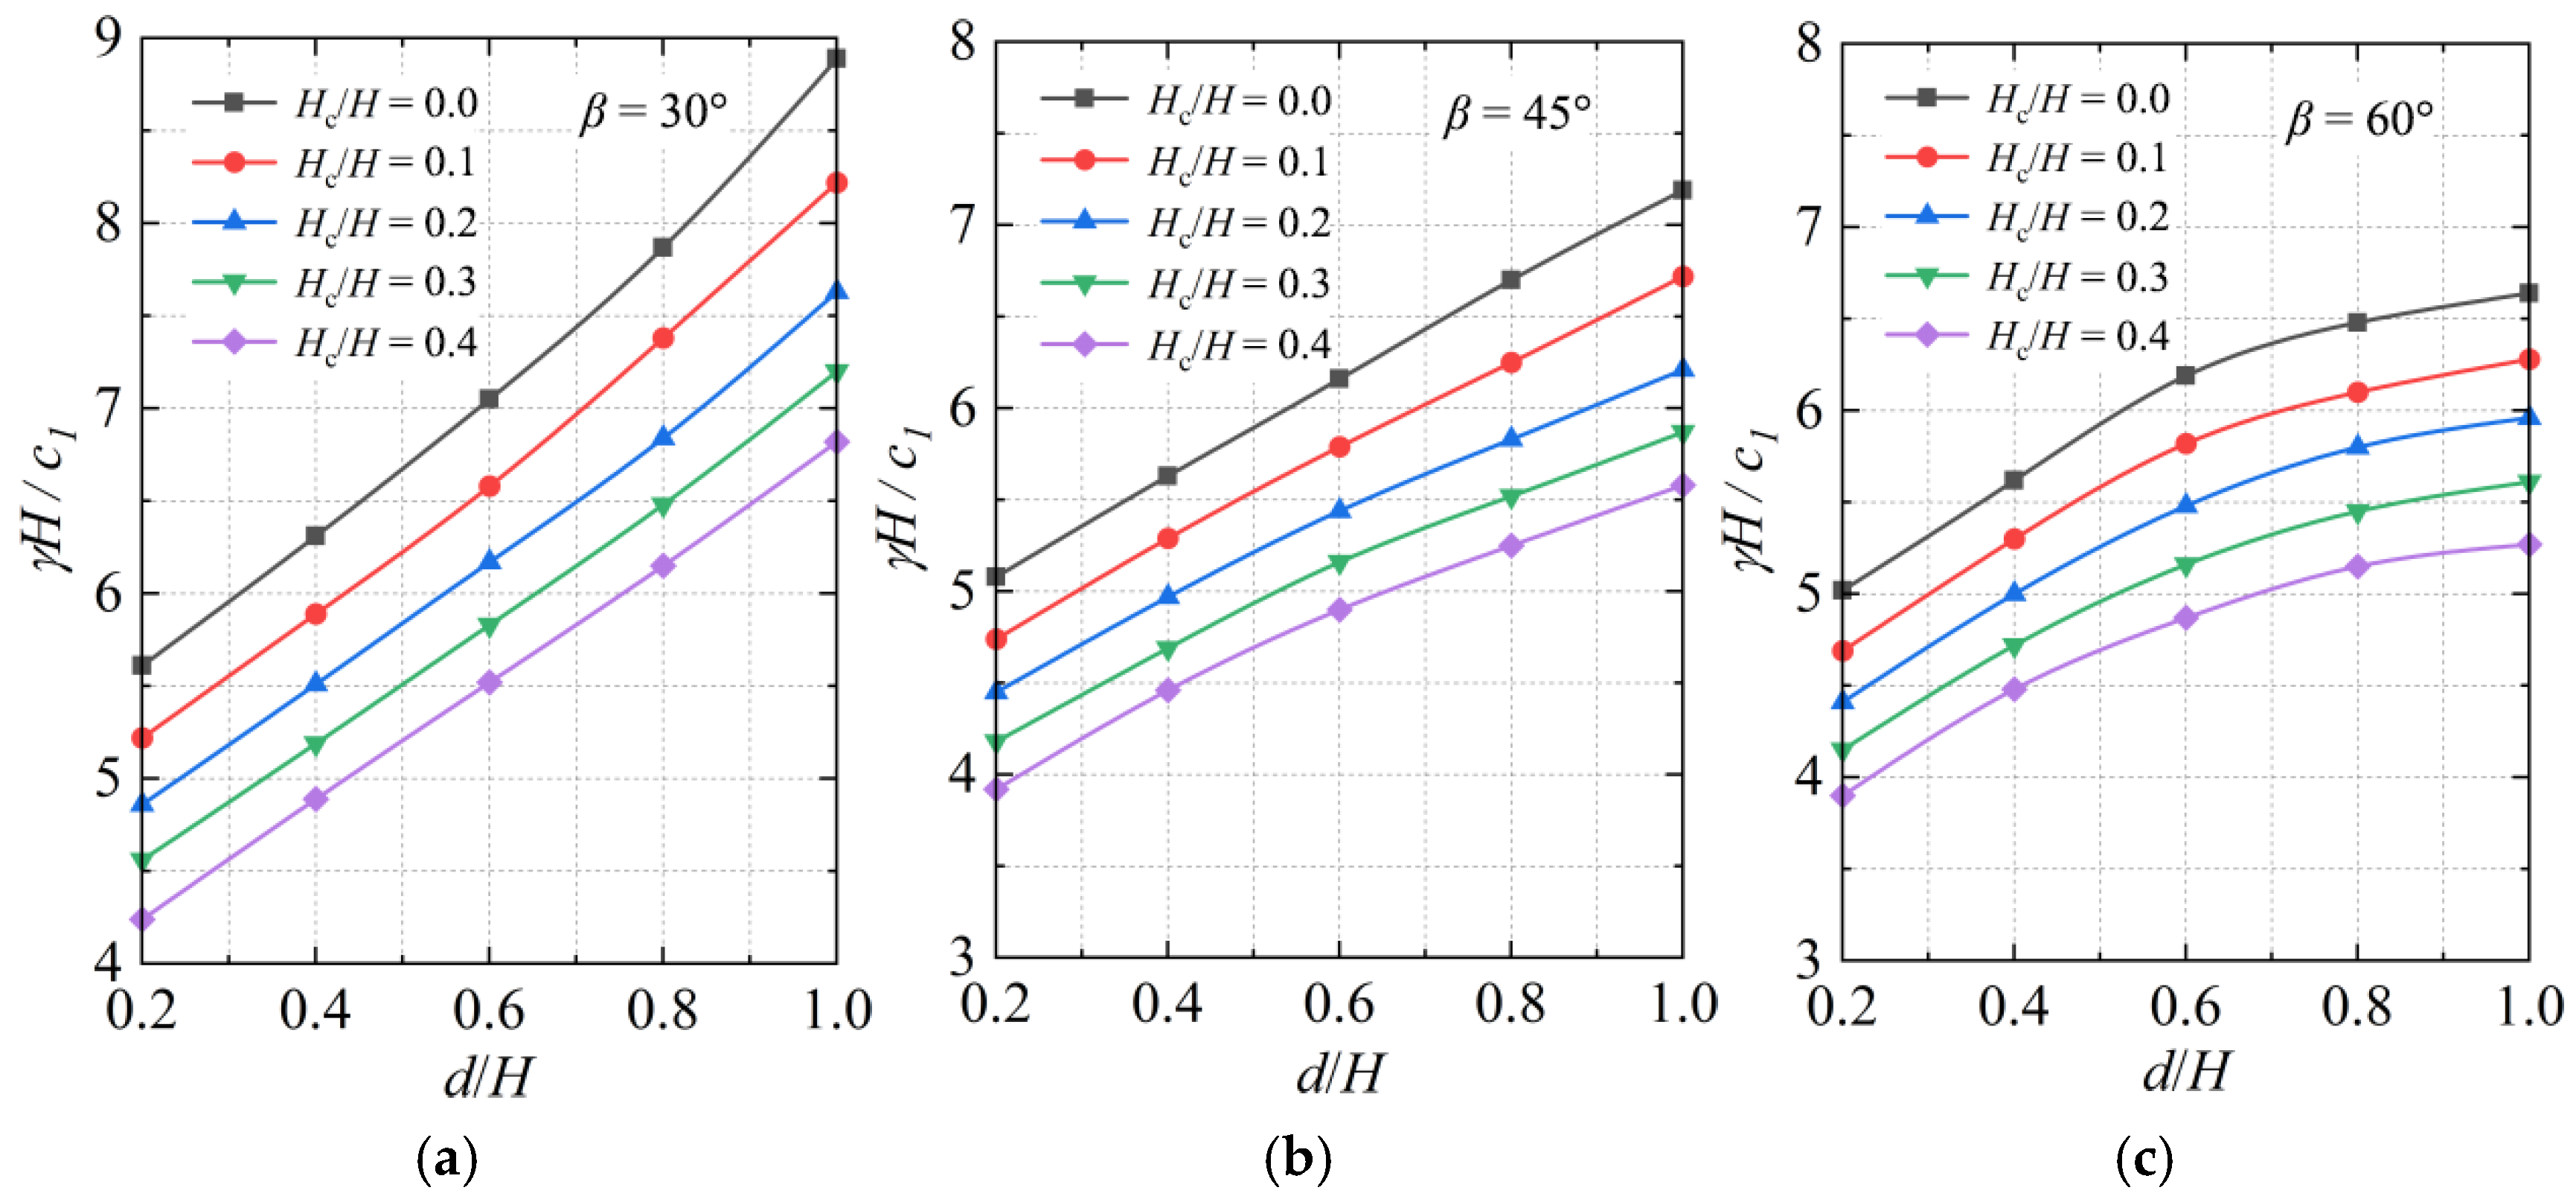
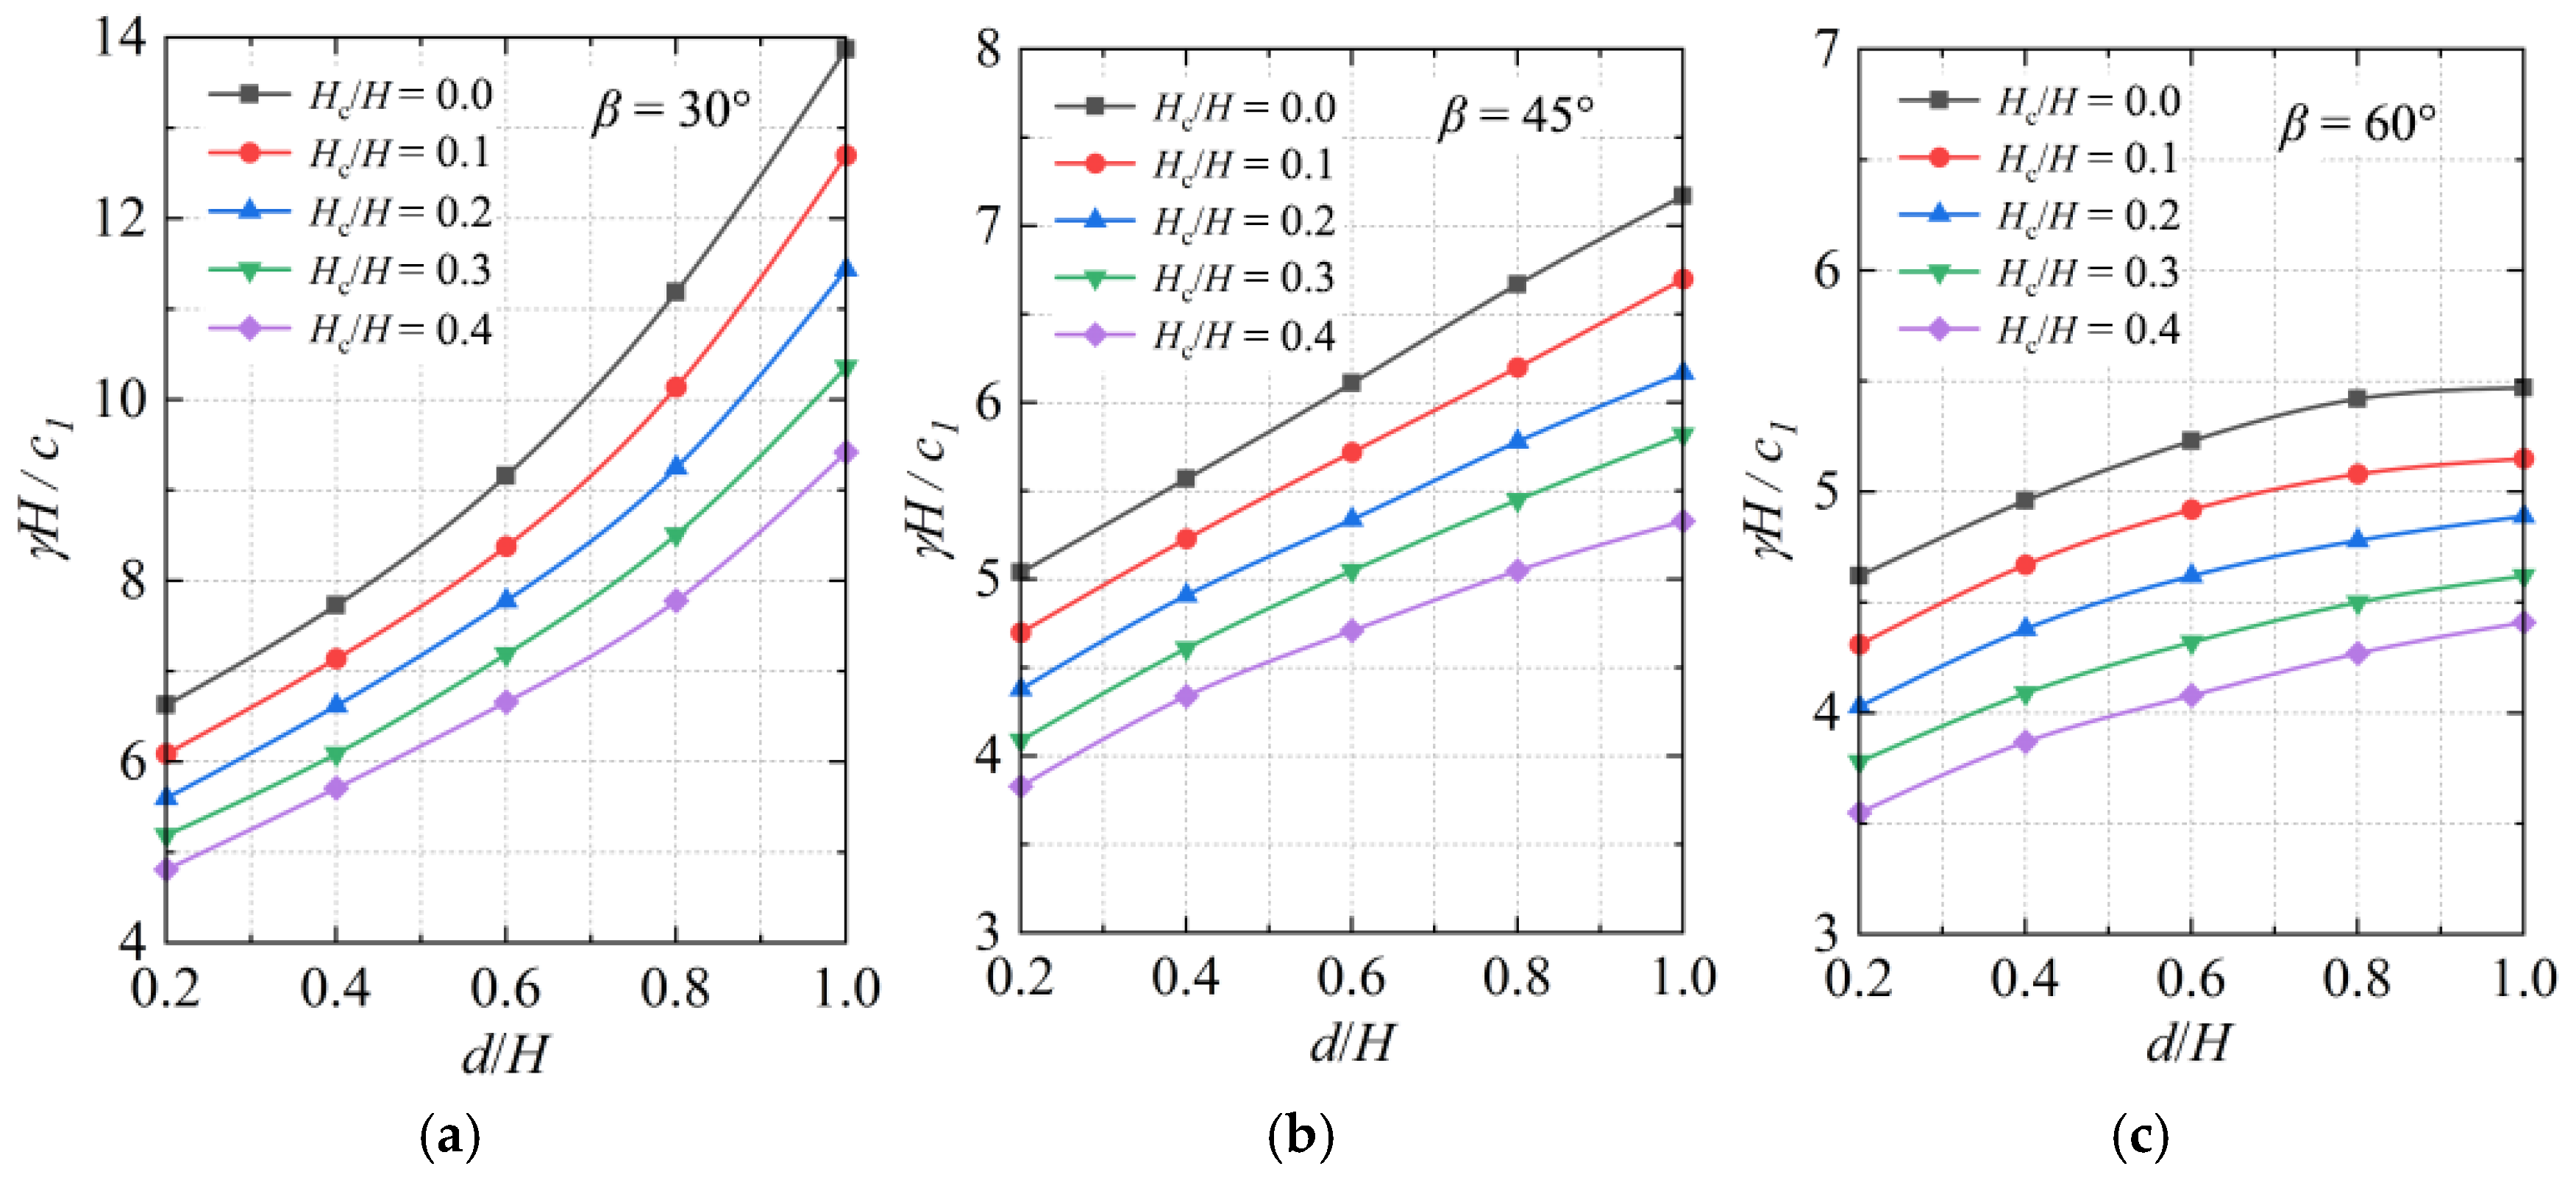
Three sets of soil relative strength parameters are defined to calculate the stability number γH/c1 for embankment slopes with vertical cracks at the crest under different slope angles β, as shown in Table 3. The minimum upper bound solution of the stability number under the action of pore water pressure is obtained.
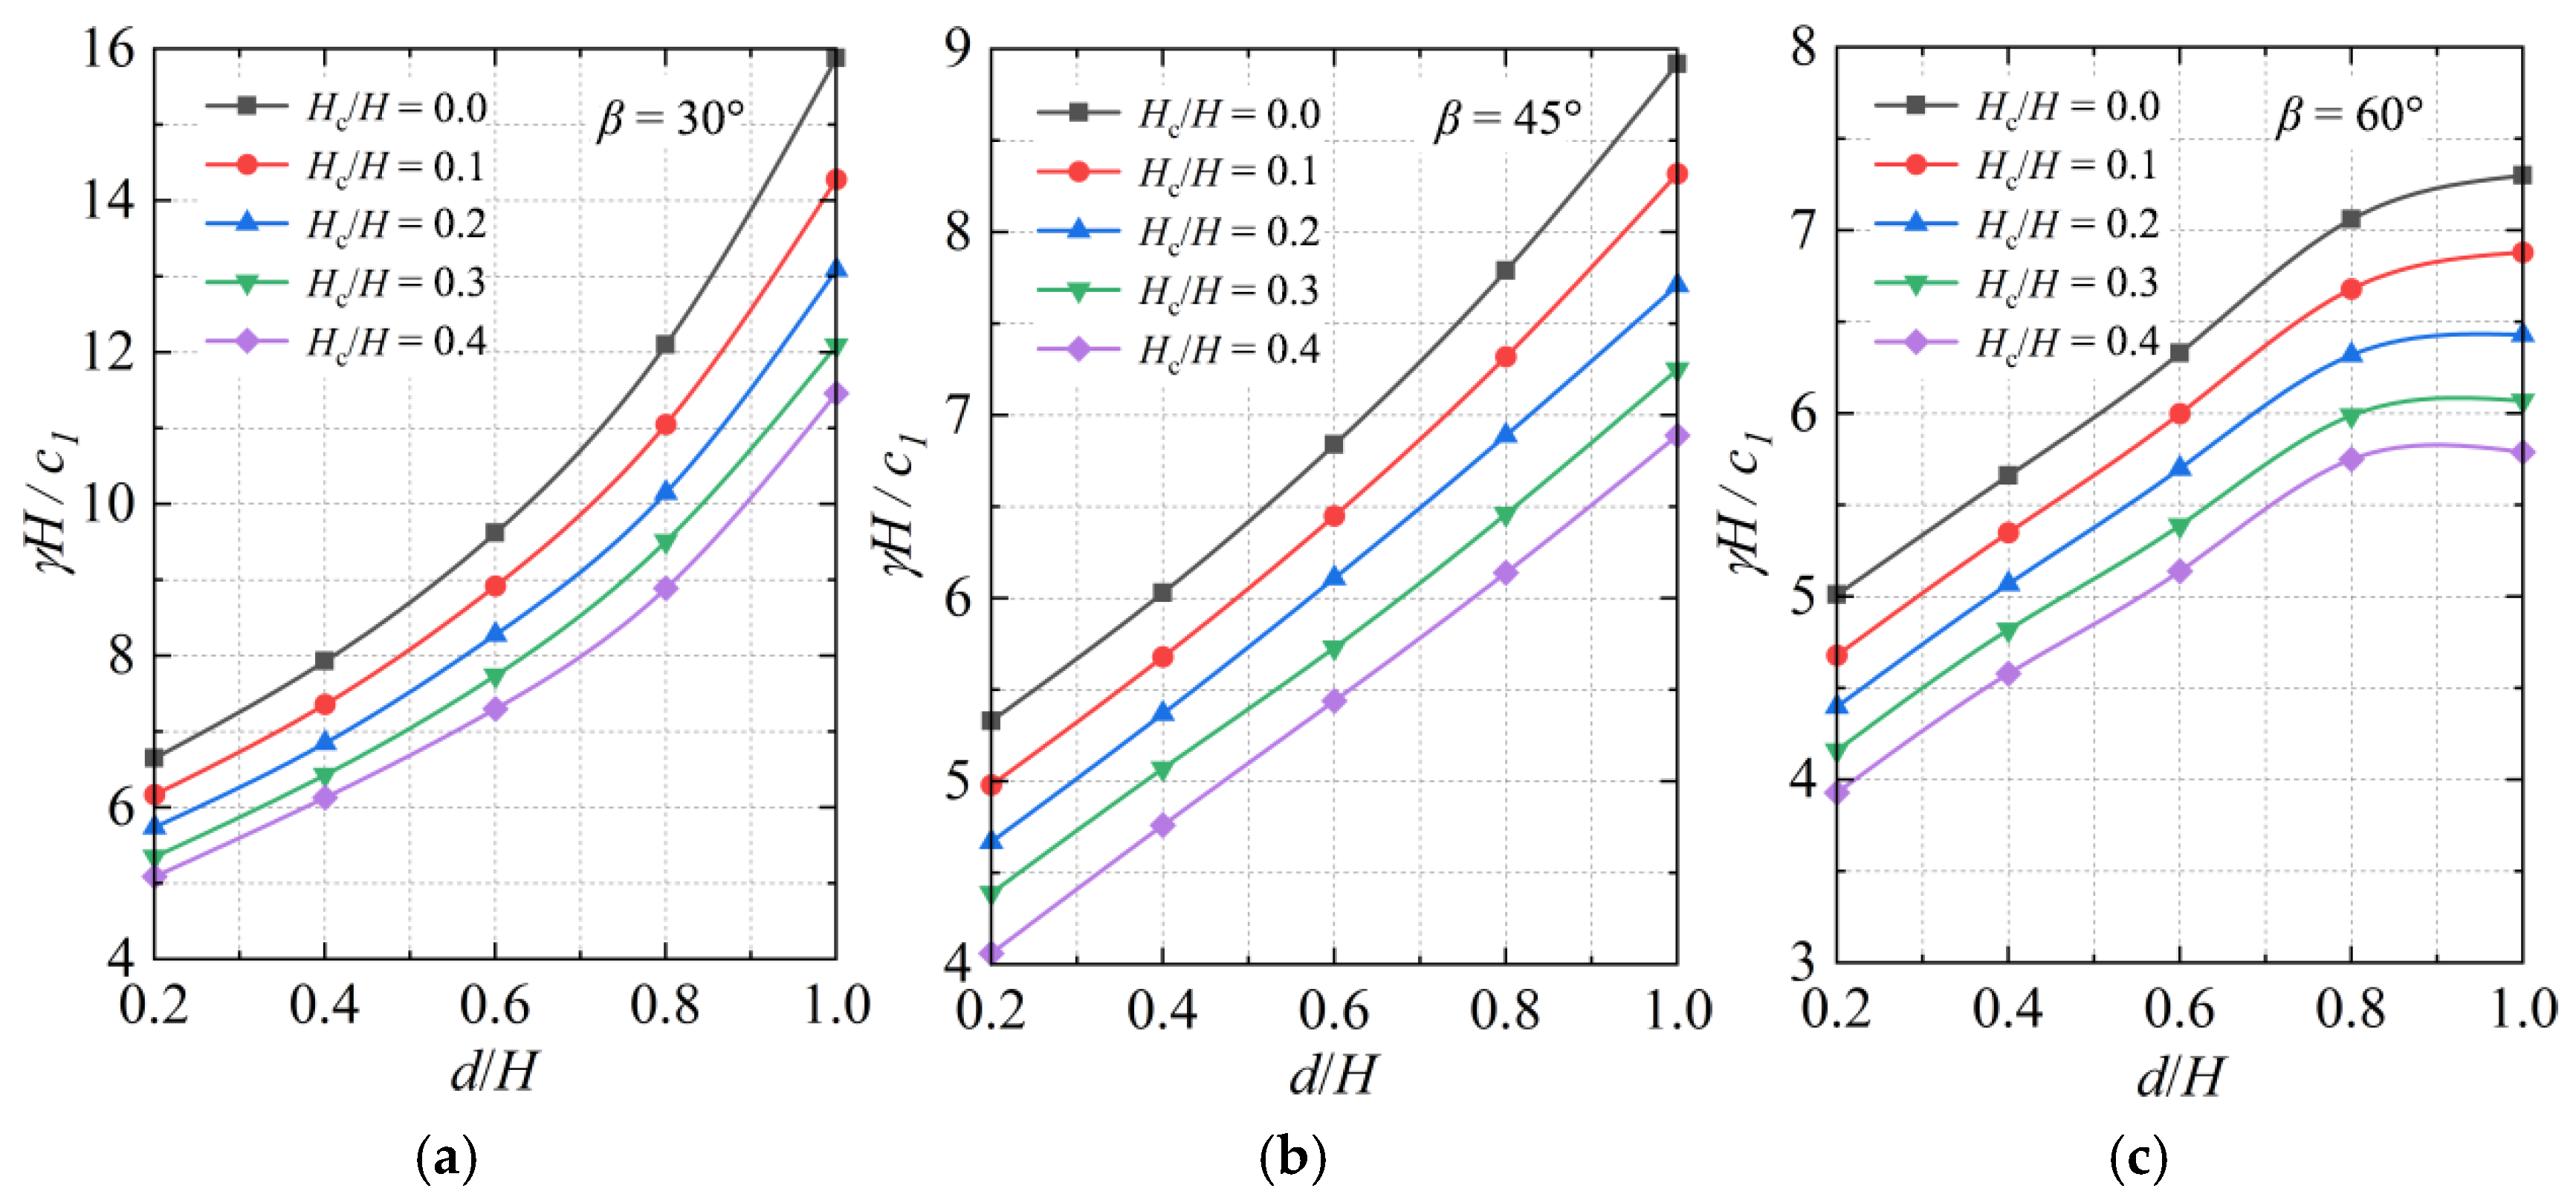
Figure 8, Figure 9, Figure 10, Figure 11, Figure 12 and Figure 13 present the stability number γH/c1 for embankment slopes containing inclined interlayers with crest cracks under pore water pressure coefficients of ru = 0.25 and 0.5, corresponding to soil relative strength Groups I to VI, respectively. As observed in Figure 8, Figure 9 and Figure 10, the stability number γH/c1 of the interlayered embankment slope progressively increases with a higher embedment position ratio d/H of the weak interlayer, while progressively decreasing with a greater normalized crack depth Hc/H at the slope crest.
It can also be found that under the influence of pore water pressure, when the slope angle β, the crack depth ratio Hc/H, the interlayer embedment position d/H, and the relative soil strength parameters (c2/c1, φ2/φ1) remain constant, the slope stability number γH/c1 decreases as the pore water pressure coefficient increases (ru rises from 0.25 to 0.50). When ru increases from 0.25 to 0.5, γH/c1 decreases by 7% to 13%. For steeper slopes (slope angle of β = 60°), the increasing trend of the stability number γH/c1 for an embankment slope with an inclined interlayer and cracks gradually levels off as the interlayer embedment position increases.
Table 4 presents the optimal values of the slope stability number γH/c1 for an embankment slope with an inclined interlayer and cracks under dry conditions (i.e., pore water pressure coefficient ru = 0) and ru = 0.25, with the weak interlayer depth at d/H = 0.4, and identical geotechnical material parameters (i.e., Group I). From the data in the table, it can be observed that when the slope angle β, the crack depth ratio Hc/H, and the soil strength parameters remain constant, the slope stability number γH/c1 decreases as the pore water pressure coefficient increases. The reduction range is approximately 26% to 36%. However, influenced by the slope angle, this range diminishes to about 23% to 28% (as slope angle β increases from 30° to 60°), indicating that a steeper slope angle weakens the impact of pore water pressure on slope stability. Furthermore, as the crack depth increases, the slope stability number γH/c1 also decreases, although this effect is not pronounced. Similarly, the influence of crack depth on the stability number gradually diminishes as the slope angle increases.
Table 5 shows the optimal values of the stability number γH/c1 for embankment slopes with inclined interlayers and cracks, under pore water pressure coefficients ru of 0.25 and 0.5, with weak interlayer depths at d/H = 0.2 and d/H = 1.0, for geotechnical material parameter sets Group III and Group VI. It can be observed that as the pore water pressure coefficient ru increases, with the crack depth ratio Hc/H at the slope crest and the interlayer position d/H held constant, the larger slope angle β experiences a greater percentage reduction in the stability number. When β = 60° and d/H = 1.0, the reduction in the stability number γH/c1 can reach 26.06%. This demonstrates that steeper slopes are more significantly affected by pore water pressure.

4.4. Safety Factors FS

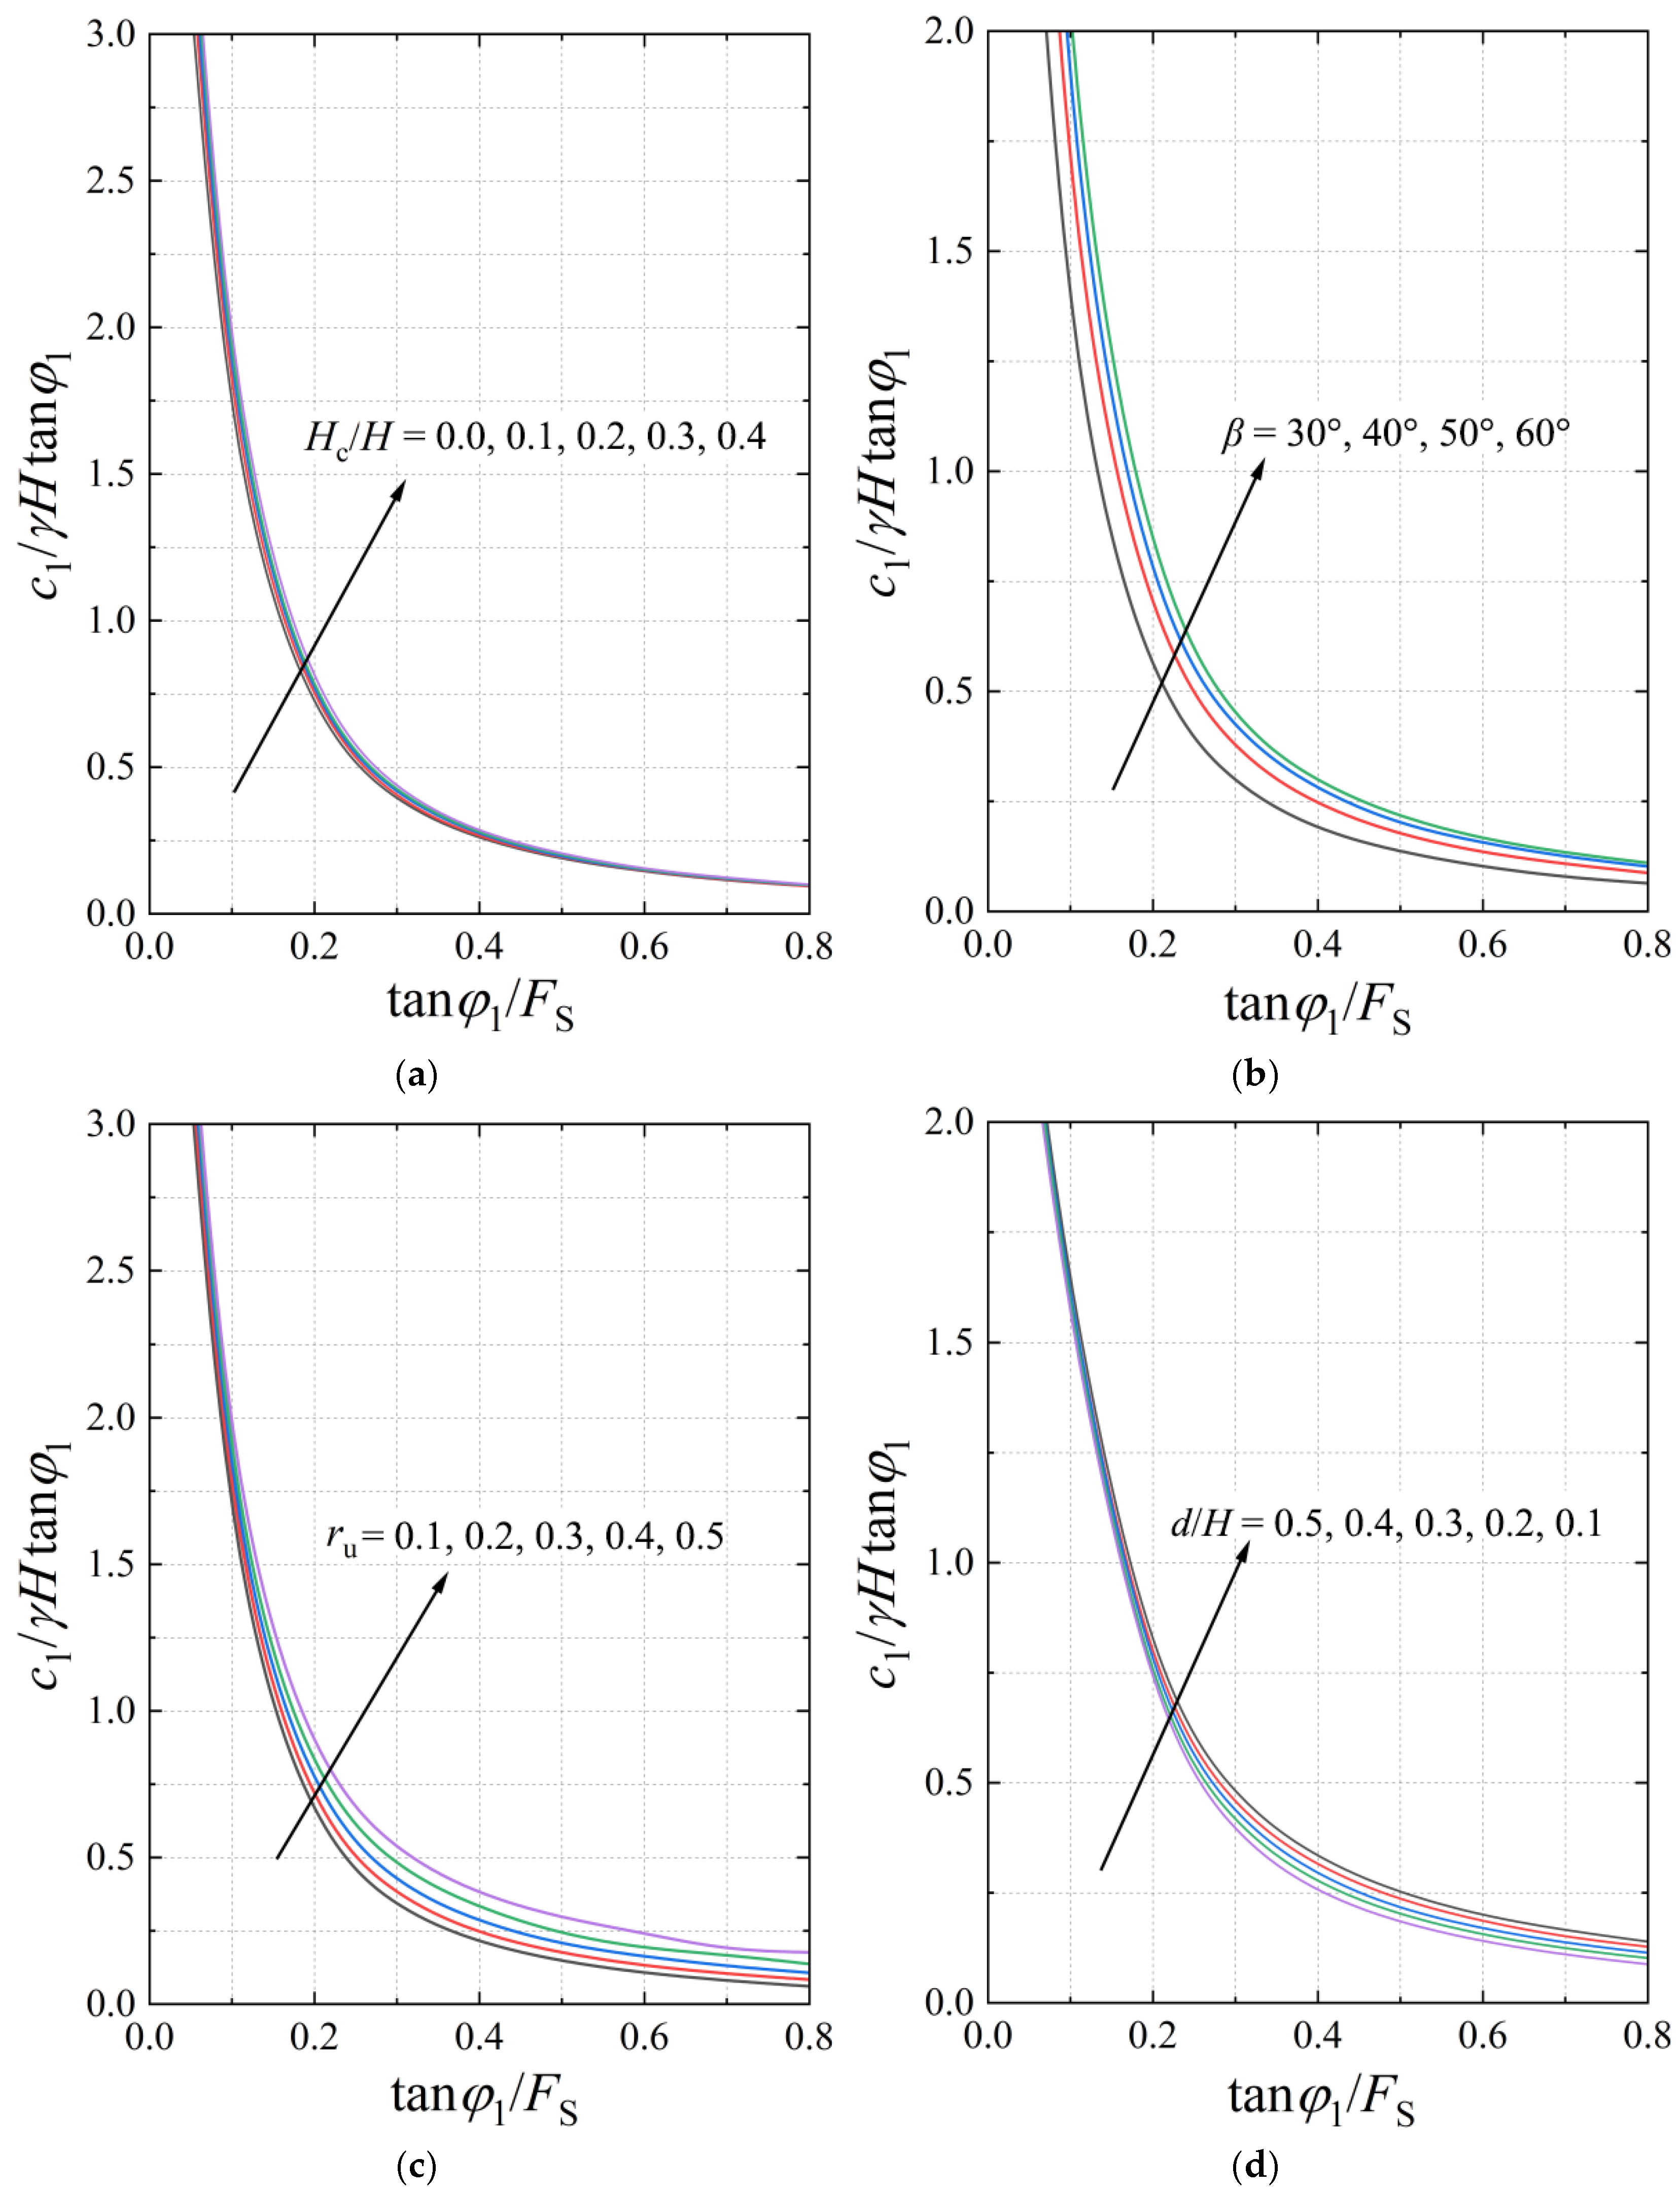
Since Equation (32) represents an implicit function of the safety factor Fs that cannot be directly solved, this study proposes an indirect method for determining slope safety factors. The specific procedure is as follows: for a 6 m high embankment slope containing inclined interlayers under cracked crest conditions, parameters are set as Hc/H = 0.0~0.4, β = 30°~60°, c2/c1 = 0.0~0.5, φ2/φ1 = 0.5, φ1 = 10°, c1 = 20 kPa, weak interlayer dip angle of δ = 4.76°, interlayer burial depth ratio of d/H = 0.1~0.5, pore water pressure coefficient of ru = 0.1~0.5, and uniform unit weight of γ = 20 kN/m3 for both the embankment soil and interlayer materials. Based on these parameters, the dimensionless parameter c1/γHtanφ1 is calculated as 0.9452 using Equation (33). A stability chart is then plotted with the vertical coordinate representing c1/γHtanφ1 and the horizontal coordinate representing tanφ1/FS. Finally, the safety factor Fs is determined through back-calculation using the known internal friction angle φ1 of the soil.
N f = c 1 γ H tan ϕ 1 = 20 20 × 6 × tan 10 ° = 0.9452
Figure 14 illustrates stability charts for embankment slopes under the influence of parameters including the slope crack depth-to-height ratio (Hc/H), embankment slope angle β, pore water pressure coefficient ru, and weak interlayer burial depth-to-height ratio (d/H). The nonlinear distribution of curves in the figure indicates that as the parameter tanφ1/FS increases, the stability number c1/γHtanφ1 gradually decreases. When tanφ1/FS > 0.8, the stability number progressively approaches 0. Additionally, Figure 11a shows nearly overlapping curves, indicating minor differences in the stability number c1/γHtanφ1 under varying Hc/H ratios, suggesting limited influence of crack depth relative to slope height on stability.
To investigate the influence of a weak interlayer inclination angle on the safety factor of embankment slopes with cracks, Figure 15 presents the variation in safety factor Fs for cracked embankments under horizontal interlayer conditions (i.e., δ = 0°) with different parameters. Figure 15a displays the curves of Fs versus pore water pressure coefficient ru for Hc/H = 0, 0.1, 0.2, 0.3, and 0.4. The results indicate that Fs decreases as ru increases. A smaller Hc/H corresponds to a higher Fs, reflecting greater slope stability. Figure 15b illustrates Fs versus ru for slope angles β = 30°, 40°, 50°, and 60°. Similarly, Fs decreases with increasing ru, and steeper slopes (larger β) exhibit lower Fs values. Figure 15c and Figure 15d show Fs versus ru for varying d/H and c2/c1 (cohesion ratio of interlayer to embankment soil), respectively. Both figures demonstrate a consistent reduction in Fs with increasing ru. Additionally, a larger d/H and c2/c1 yield a higher Fs value, emphasizing the stabilizing effects of deeper interlayer burial and stronger interlayer cohesion.
Figure 16a depicts the variation curves of the factor of safety FS with crack depth at the slope crest for slope angles β of 30°, 45°, and 60°. The figure shows that, under the influence of the inclined weak interlayer (i.e., δ = 4.76°), the factor of safety gradually decreases as the crack depth increases, with values approximately seven percentage points lower than those mentioned previously. For steeper embankment slopes, the factor of safety is smaller, exhibiting reductions ranging from approximately 13% to 23%. A higher relative cohesion ratio of the soil corresponds to a larger factor of safety and greater slope stability, with increases ranging from about 6% to 21%. Notably, for a slope angle β of 60°, the influence of the cohesion ratio on the factor of safety is only about 6%. This indicates that the impact of the inclined weak interlayer on the overall stability of the embankment diminishes as the slope angle increases.
Figure 16b illustrates the variation curves of the factor of safety with the pore water pressure coefficient, ru, for weak interlayer embedment positions d/H of 0.2, 0.3, 0.4, and 0.5. Compared with a horizontal weak interlayer, the factor of safety decreases significantly as ru increases. For an inclined weak interlayer, a larger embedment position d/H results in a higher factor of safety, which is more favorable for slope stability. As ru increases from 0.1 to 0.5, the factor of safety decreases by twelve percentage points for d/H = 0.2. However, for d/H = 0.5, the magnitude of this decrease remains largely unchanged. This demonstrates that the influence of pore water pressure on slope stability is essentially unaffected by the embedment position of the weak interlayer.

4.5. Critical Failure Surface

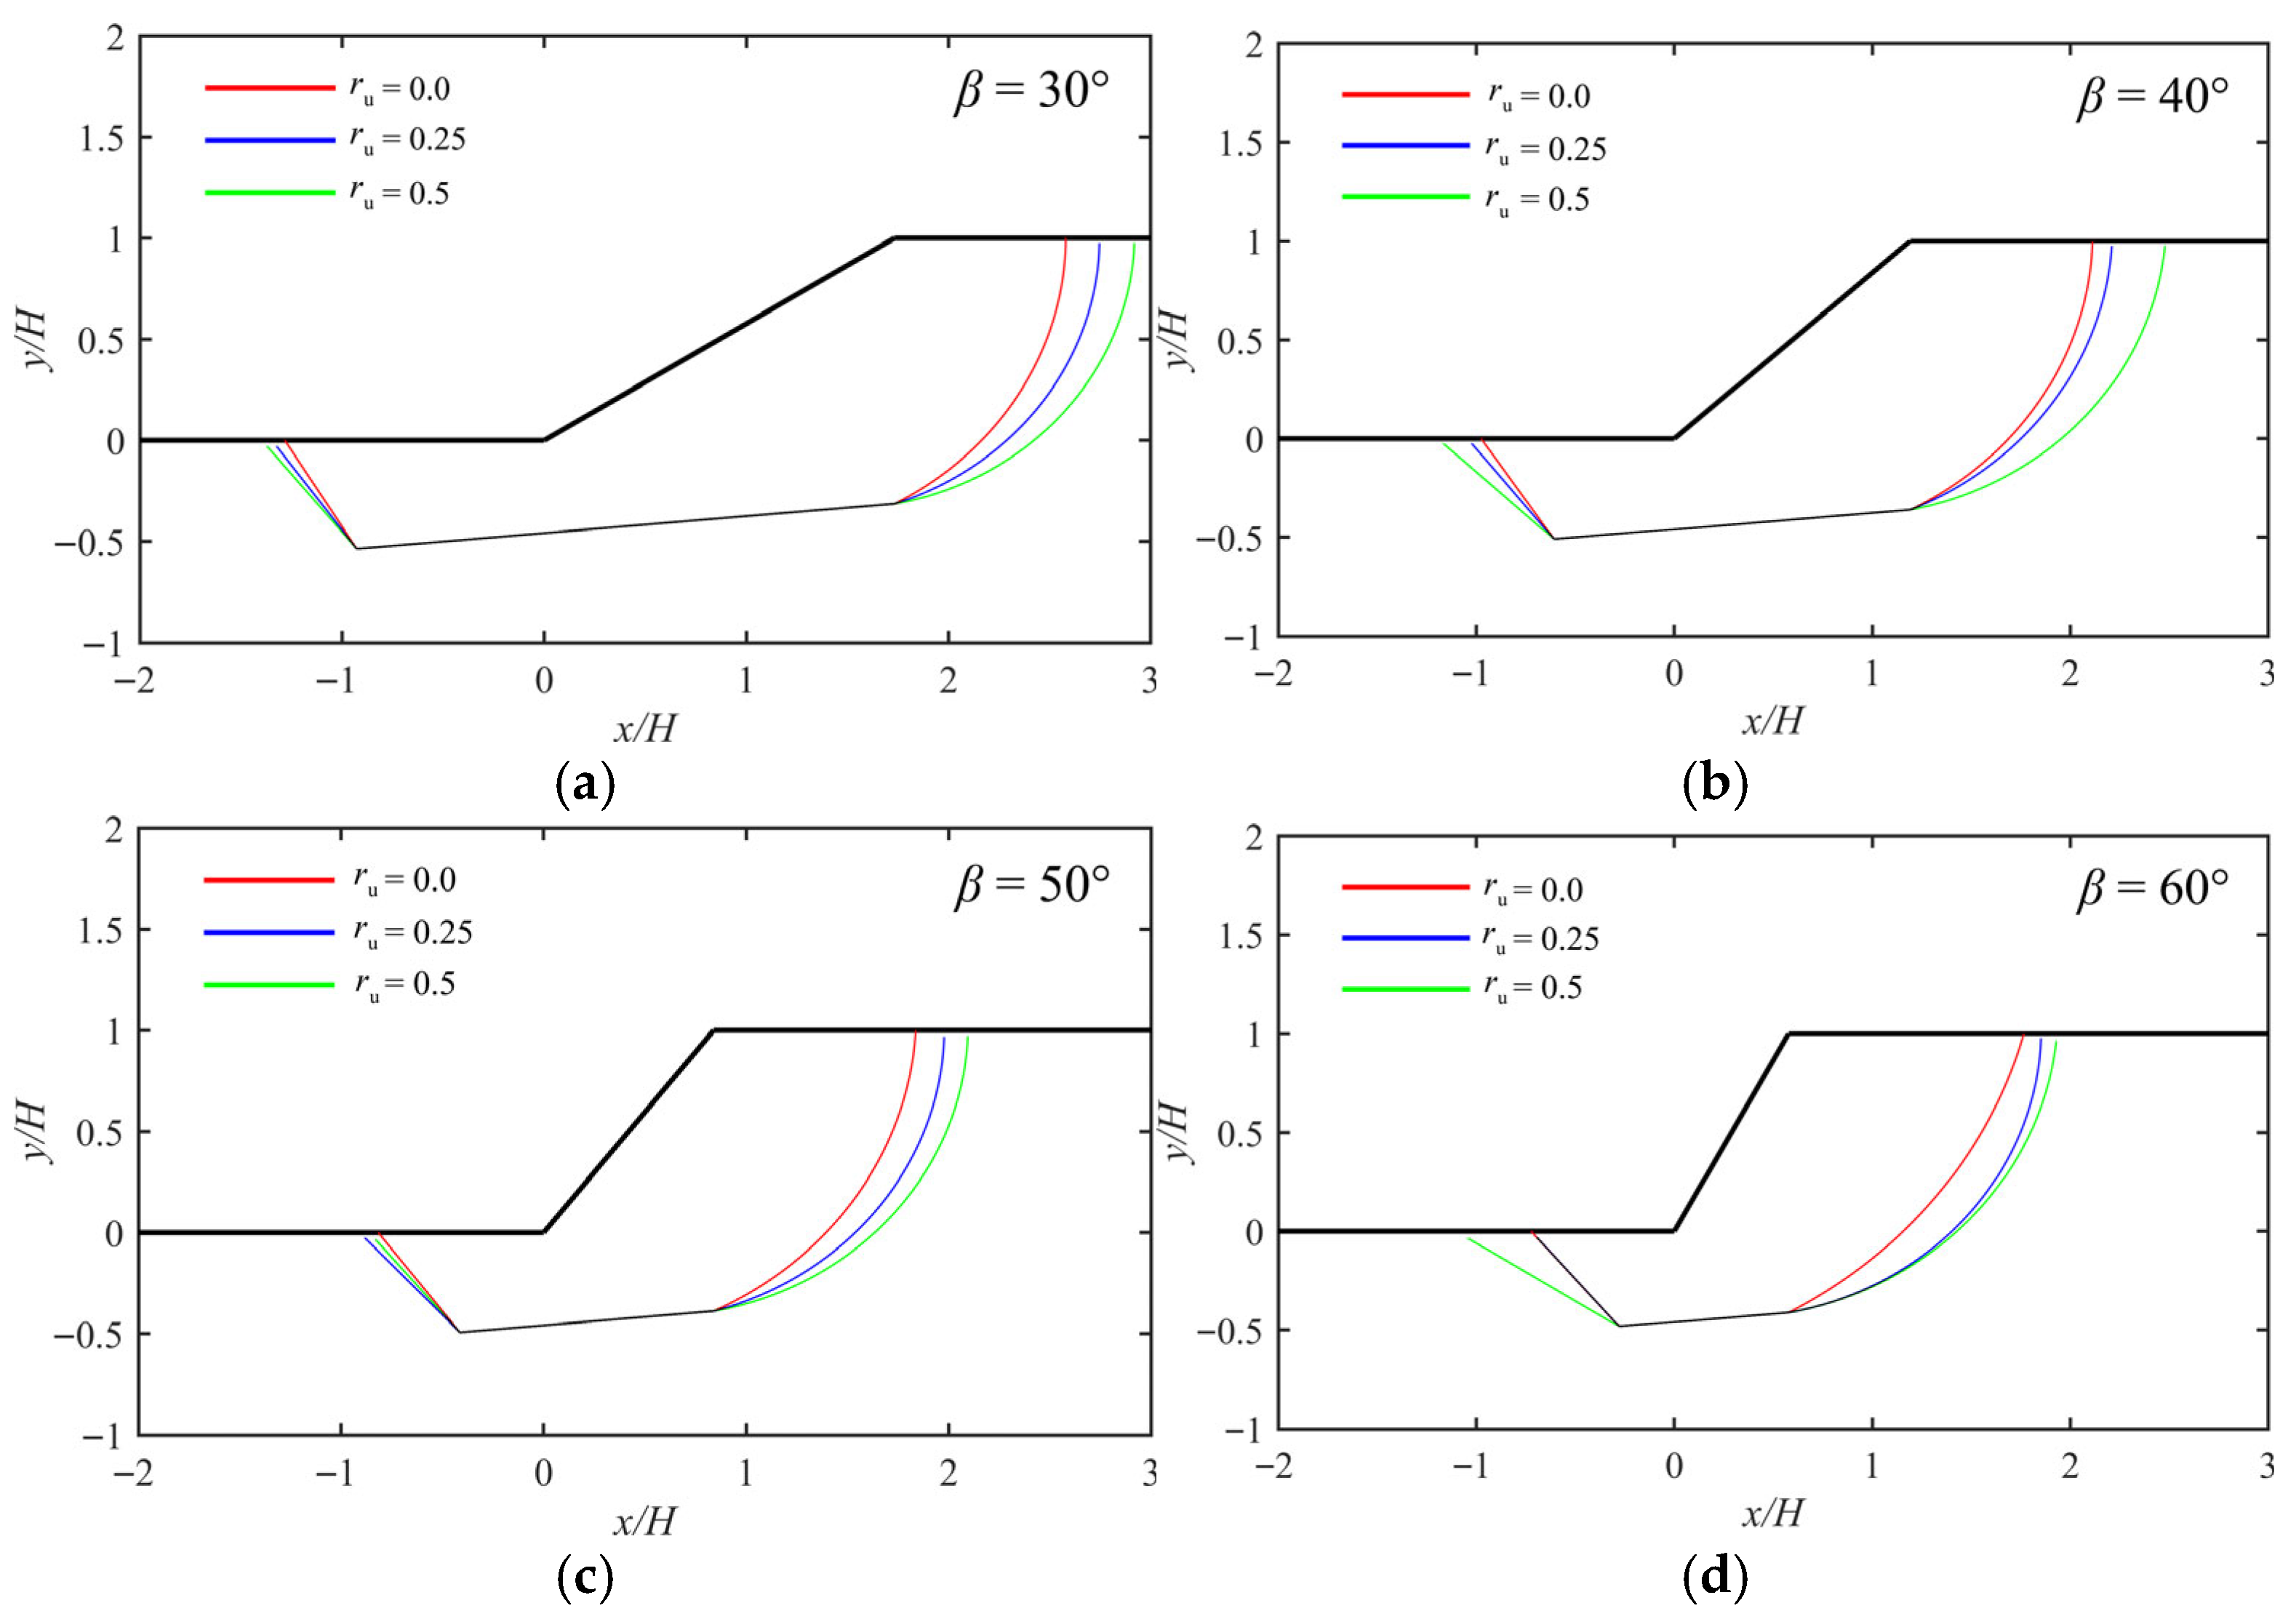
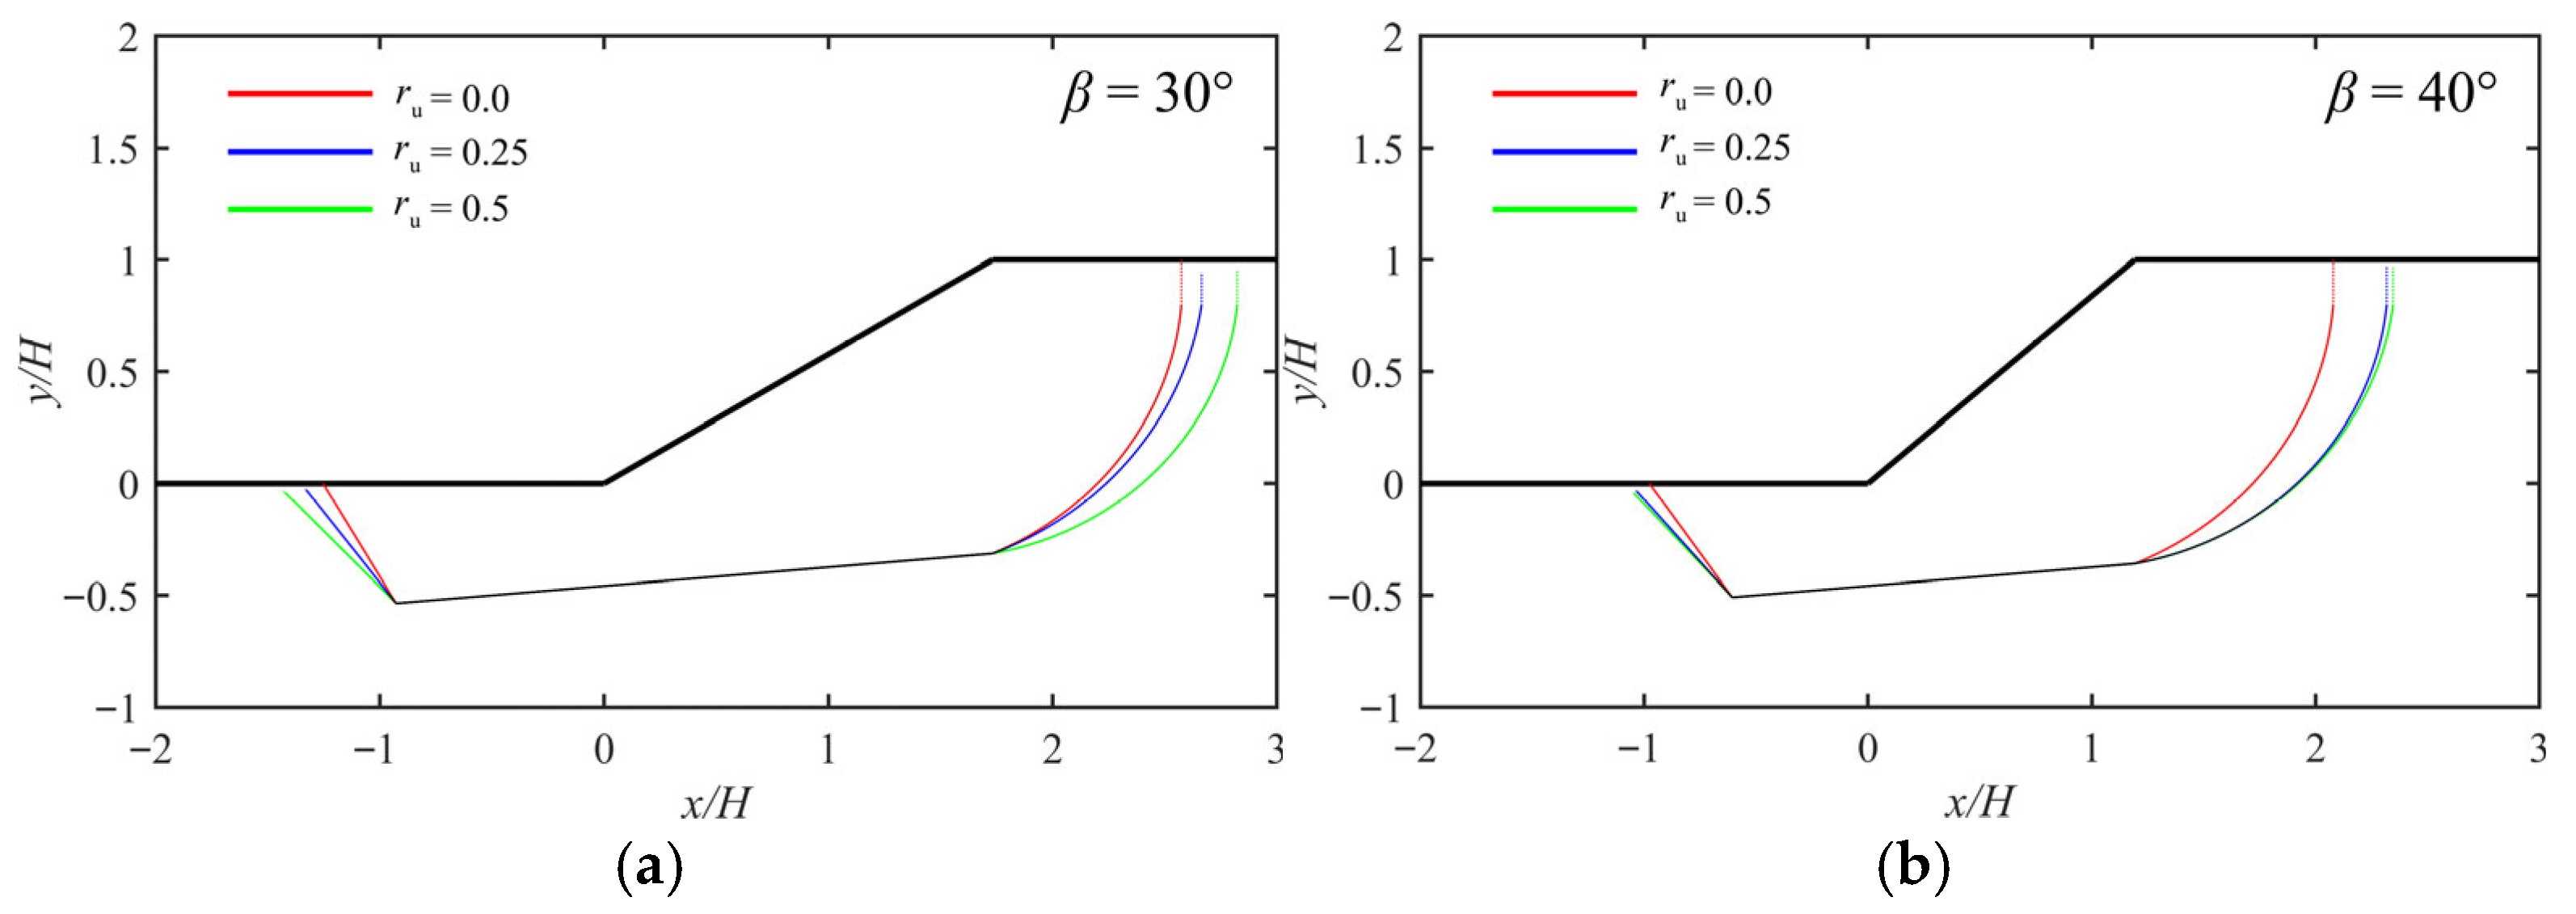
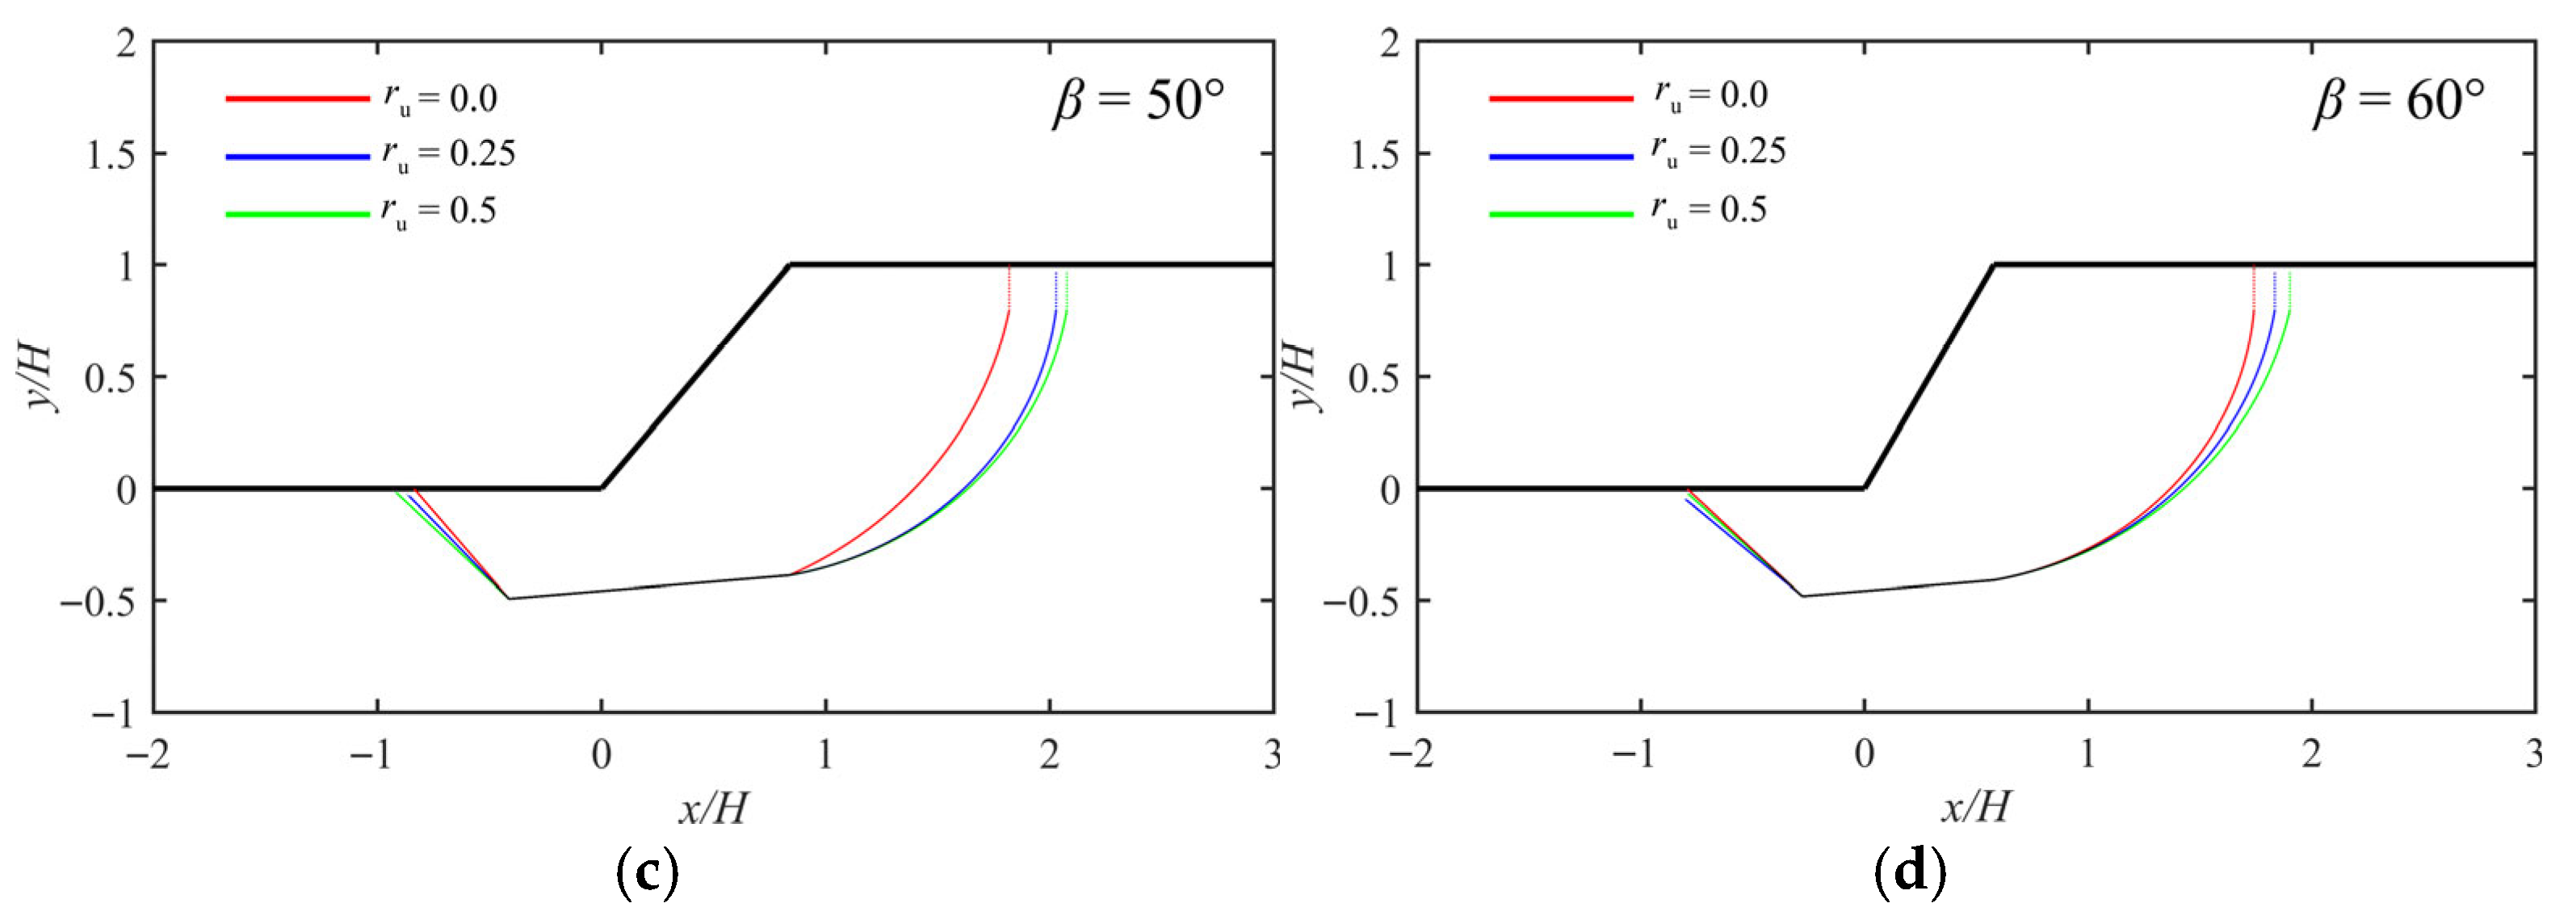
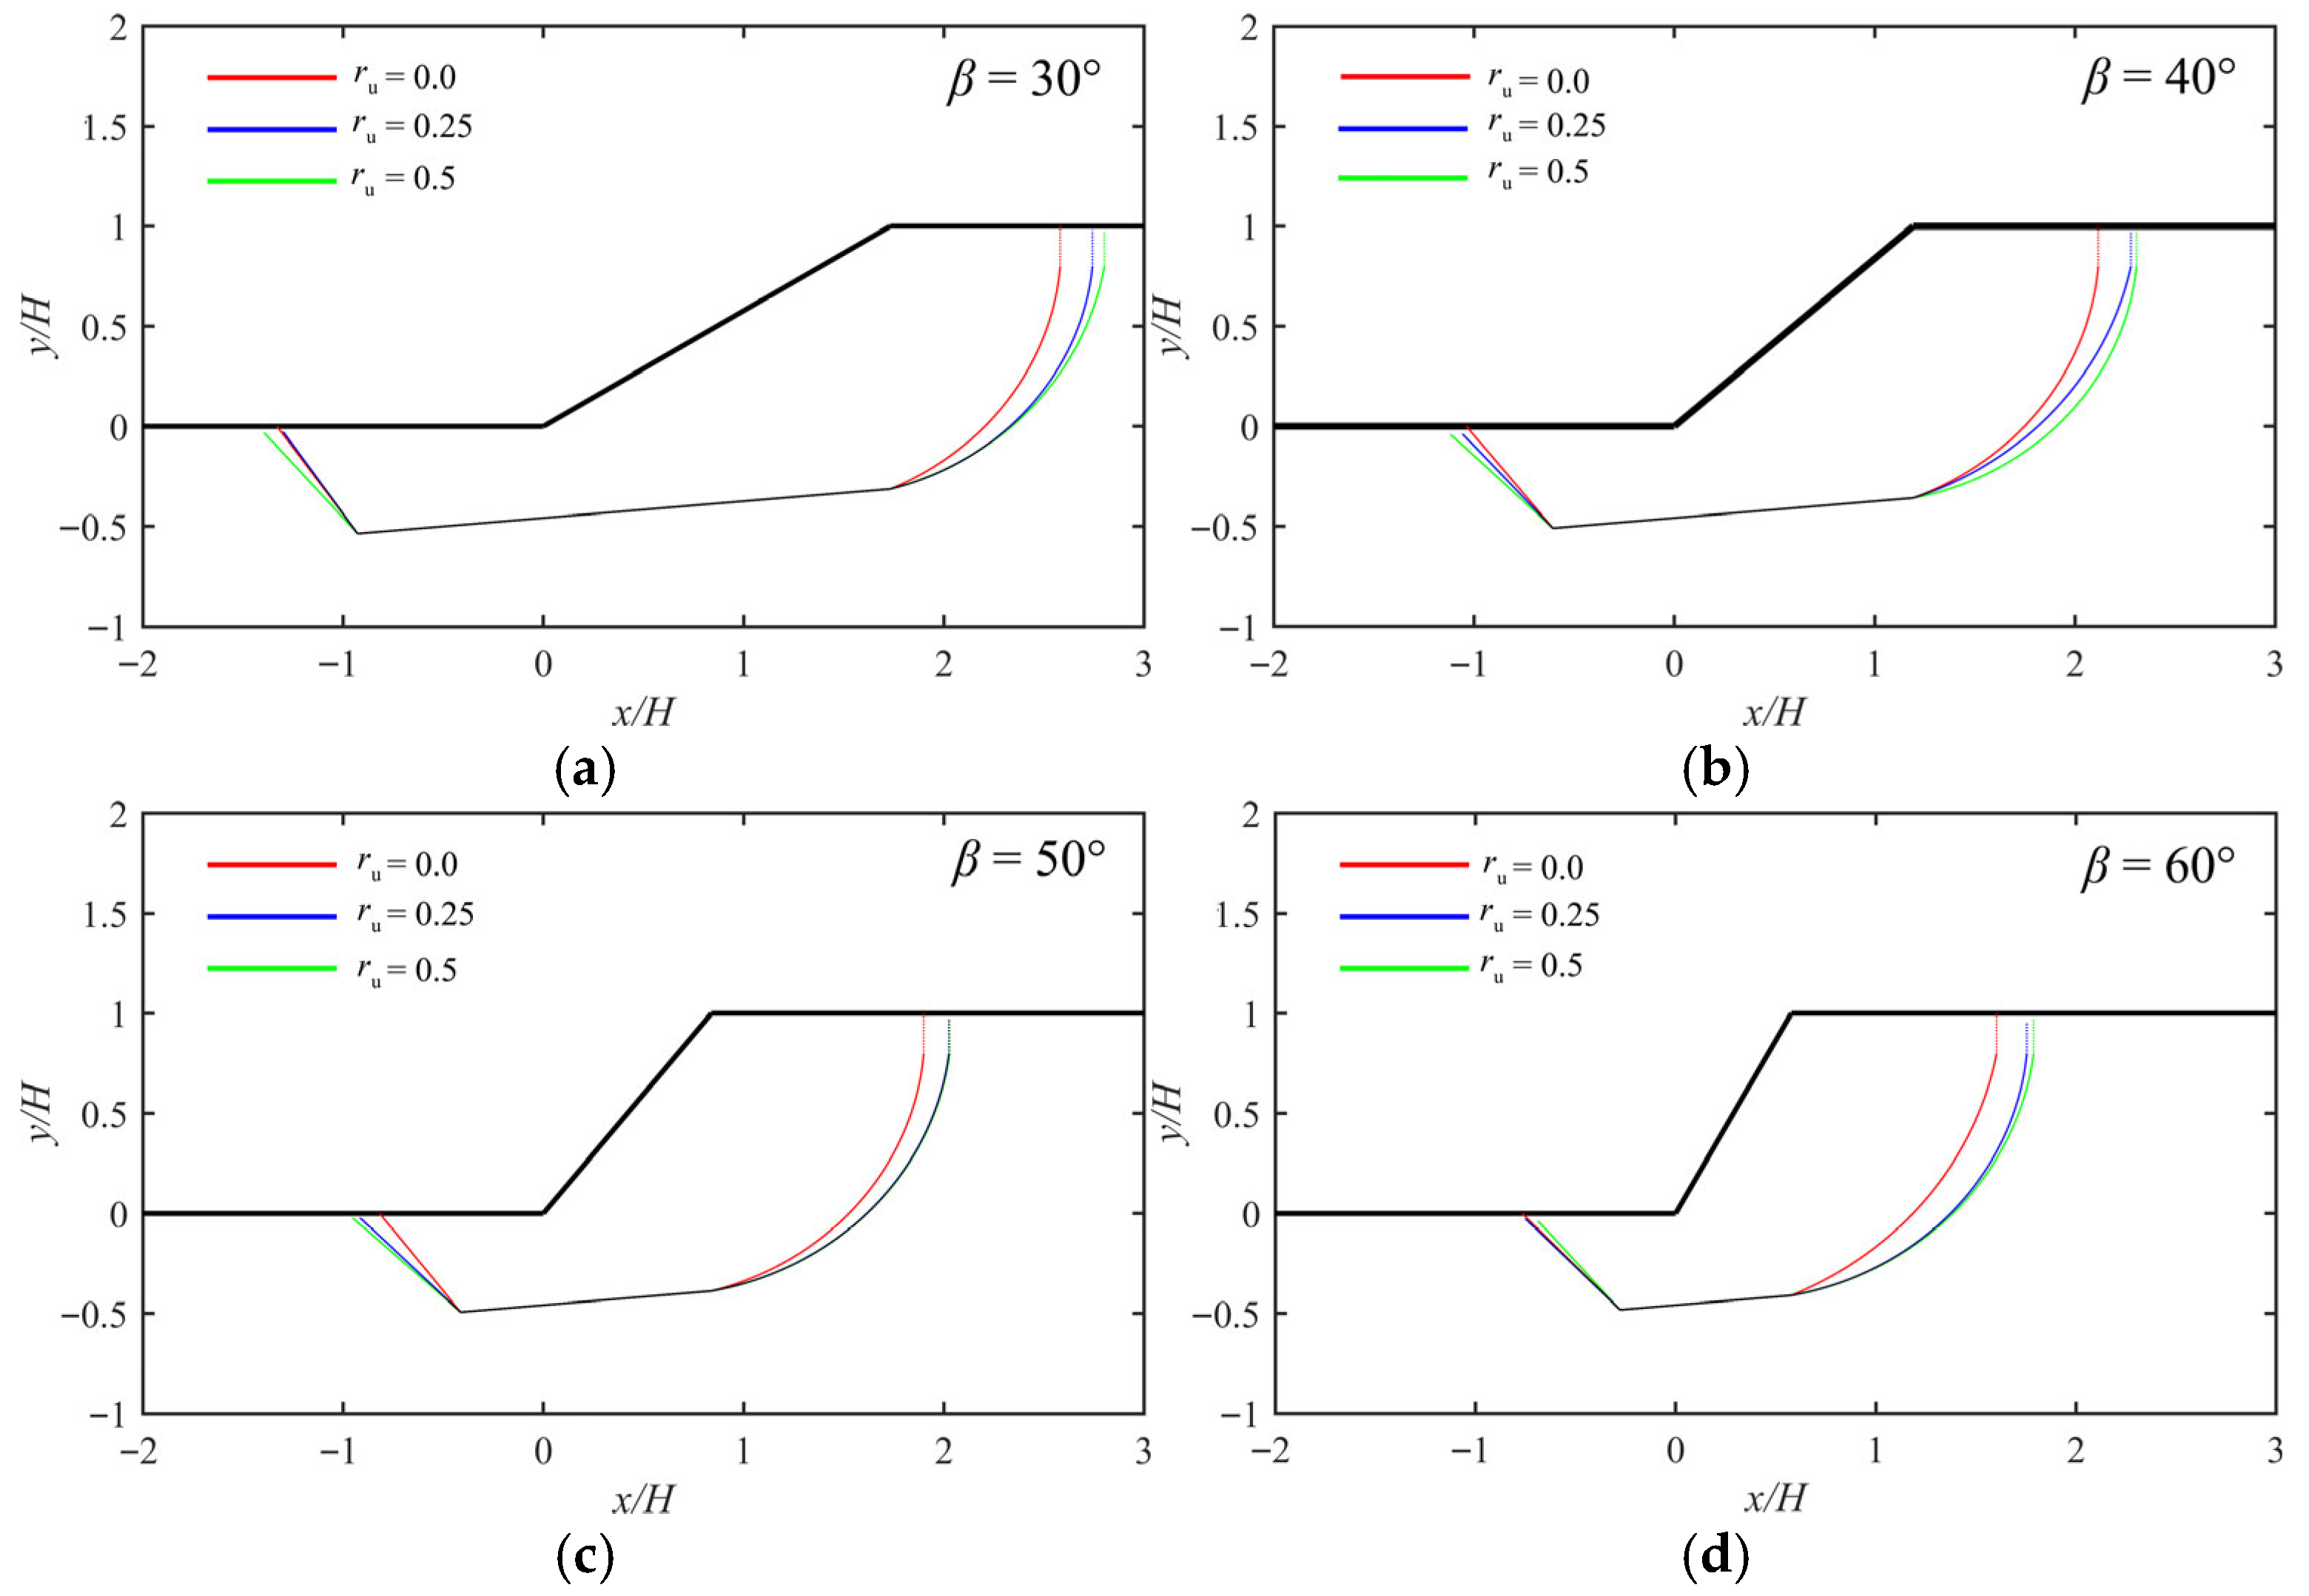
With the ratio of the weak interlayer embedment position to slope height set at d/H = 0.5, different mechanical and geometric parameters are selected: embankment slope height of H = 6.0 m, relative soil strength parameters of c2/c1 = 0.1 and c2/c1 = 0.5, crack depth to slope height ratios of Hc/H = 0.0 and Hc/H = 0.2, and four different slope angles (β = 30°, 40°, 50°, 60°). The distributions of sliding surfaces are plotted for different pore water pressure coefficients (i.e., ru = 0.0, 0.25, 0.5) to investigate the distribution patterns of the most critical sliding surfaces for embankment slopes with inclined interlayers and cracks under these three pore water pressure conditions.
Figure 17, Figure 18 and Figure 19 illustrate the distributions of critical sliding surfaces for embankment slopes with inclined interlayers (i.e., δ = 4.76°) and cracks under conditions of varying slope angle β, crack depth Hc/H, cohesion ratio c2/c1, and pore water pressure coefficient ru with the upper soil layer friction angle φ1 = 10°. As shown in Figure 17, when the crack depth at the slope crest Hc/H = 0 (i.e., no crack at the crest), the initiation point of the critical sliding surface progressively shifts toward the slope crest as the pore water pressure coefficient (ru) increases. Concurrently, the depth and range of the rotational portion of the sliding surface exhibit a significant increase. The shear exit point of the sliding surface also moves progressively leftward (away from the slope toe) with increasing ru. Furthermore, consistent with previous findings, as the embankment slope angle β increases, the depth and range of the most critical sliding surface gradually decrease. Additionally, the variation in the position and depth of the most critical sliding surface under different ru values diminishes as the slope steepens. Compared with gentler slopes (β = 30°), the most critical sliding surfaces for a steep slope (β = 60°) under different ru values largely coincide.
Figure 18 illustrates the distribution of the most critical sliding surfaces for the embankment slope under the influence of cracking (Hc/H = 0.2). The figure reveals that as the pore water pressure coefficient ru increases, the depth and range of the most critical sliding surface also increase, though to a lesser extent than in Figure 17. Furthermore, as the slope angle β increases, the depth and range of the most critical sliding surface progressively decrease. Additionally, the variation in the depth and extent of the most critical sliding surface under different ru values diminishes progressively and even overlaps as the slope angle increases.
In Figure 19, it can be observed that under identical conditions of crack depth at the slope crest Hc/H, slope angle β, and pore water pressure coefficient ru, a decrease in the relative cohesion ratio of the soil leads to a certain increase in the depth and extent of the most critical sliding surface. Furthermore, the magnitude of this increase becomes more obvious as the slope angle increases. This indicates that steeper slopes exhibit a more significant influence of the relative soil strength parameters on the characteristics of the most critical sliding surface in embankments with inclined interlayers.

5. Conclusions

A composite failure mechanism for embankments with inclined interlayers and vertical tensile cracks at the slope crest under saturated conditions is established based on a finite element limit analysis. An upper-bound solution equation for the stability of such cracked slopes considering pore water pressure is derived. A comparative analysis of the safety factor with existing examples demonstrates the rationality of the proposed calculation method. Through an analysis of the distribution of the most critical crack locations, stability coefficients, safety factors, and critical sliding surface locations for the embankment slope with an inclined interlayer considering pore water pressure, the following conclusions are drawn:
(1)
Increased crack depth Hc shifts the crack location toward the crest edge, whereas a larger slope angle β, higher pore pressure ru, or increased embedment depth d cause opposite migration.
(2)
The stability number γH/c1 decreases by 7–13% when the pore water pressure coefficient ru increases from 0.25 to 0.5 under constant conditions. For slopes with β = 30°, γH/c1 decreases by 26–36% as ru rises from 0 to 0.25, while for β = 60°, the reduction rate diminishes to 23–28%. Additionally, γH/c1 decreases by 3–8% with Hc/H increasing from 0 to 0.4, and it increases by 5–15% when d/H increases from 0.1 to 0.5, though this increasing trend weakens by 30–40% for β = 60° compared with β = 30°.
(3)
The safety factor Fs decreases with increases in the pore water pressure coefficient ru, crack depth Hc, and slope angle β. When ru increases from 0.1 to 0.5, the safety factor decreases by approximately 12 percentage points for a given interlayer embedment depth (d/H = 0.2). On the positive side, Fs increases with higher interlayer embedment depth d and higher cohesion ratio c2/c1, with the latter leading to increases of 6% to 21% when c2/c1 rises from 0 to 0.5, though this is only about 6% for β = 60°.
(4)
For embankment slopes with inclined interlayers and no cracks, the emergence of pore water pressure significantly increases both the depth and extent of the critical sliding surface. However, steeper slopes reduce the depth and range of this critical sliding surface. When a vertical tension crack exists at the crest, the influence of the pore water pressure coefficient on the sliding surface depth and range diminishes compared with no-crack conditions. Furthermore, a lower cohesion ratio c2/c1 extends the critical sliding surface.

Author Contributions

Conceptualization, J.Z.; methodology and writing—original draft, J.Z. formal analysis, Z.Y.; writing—review and editing, J.Y.; software, Z.Y.; funding acquisition, J.Z.; data curation, J.Z.; visualization, Z.Y.; supervision, J.Y. All authors have read and agreed to the published version of the manuscript.

Funding

This research was funded by the National Natural Science Foundation of China (12262001).

Data Availability Statement

All data, models, or code that support the findings of this study are available from the corresponding author upon reasonable request.

Conflicts of Interest

Author Zehao Yu was employed by Power China Jiangxi Electric Power Engineering Co., Ltd. The remaining authors declare no competing financial interests or personal relationships that could influence the work reported in this paper.

References

  1. Zhu, J.-F.; Chen, C.-F.; Zhao, H.-Y. An Approach to Assess the Stability of Unsaturated Multilayered Coastal-Embankment Slope during Rainfall Infiltration. J. Mar. Sci. Eng. 2019, 7, 165. [Google Scholar] [CrossRef]
  2. Temmerman, S.; Meire, P.; Bouma, T.J.; Herman, P.M.; Ysebaert, T.; De Vriend, H.J. Ecosystem-based coastal defence in the face of global change. Nature 2013, 504, 79–83. [Google Scholar] [CrossRef]
  3. Oumeraci, H. Review and analysis of vertical breakwater failures-lessons learned. Coast. Eng. 1994, 22, 3–29. [Google Scholar] [CrossRef]
  4. Zhang, L.; Jiang, X.; Qiu, F. Stability analysis of unsaturated soil slopes with cracks under rainfall infiltration conditions. Comput. Geotech. 2024, 165, 105907. [Google Scholar] [CrossRef]
  5. Konrad, J.M.; Ayad, R. An idealized framework for the analysis of cohesive soils undergoing desiccation. Can. Geotech. J. 1997, 34, 477–488. [Google Scholar] [CrossRef]
  6. Utili, S.; Castellanza, R.; Galli, A.; Sentenac, P. Novel approach for health monitoring of earthen embankments. J. Geotech. Geoenviron. 2015, 141, 04014111. [Google Scholar] [CrossRef]
  7. Rahardjo, H.; Lim, T.T.; Chang, M.F.; Fredlund, D.G. Shear-strength characteristics of a residual soil. Can. Geotech. J. 1995, 32, 60–77. [Google Scholar] [CrossRef]
  8. Vanicek, I.; Vanicek, M. Earth Structures: In Transport, Water and Environmental Engineering; Springer Science & Business Media: Berlin/Heidelberg, Germany, 2008. [Google Scholar]
  9. Huang, M.; Wang, H.; Liu, Y. Rotation-translation combined mechanism for stability analysis of slopes with weak interlayer under rainfall condition. Chin. J. Geotech. Eng. 2012, 34, 1561–1567. (In Chinese) [Google Scholar]
  10. Ogila, W.A.M. Analysis and assessment of slope instability along international mountainous road in north Africa. Nat. Hazards 2021, 106, 2479–2517. [Google Scholar] [CrossRef]
  11. Zhang, L.; Jiang, X.; Sun, R.; Cui, C.; Gu, H.; Qiu, Y. A novel analytical approach for 3D stability of unsaturated soil slopes with cracks under rainfall infiltration. Eng. Fail. Anal. 2025, 175, 109575. [Google Scholar] [CrossRef]
  12. Huang, M.; Wang, H.; Sheng, D.; Liu, Y. Rotational–translational mechanism for the upper bound stability analysis of slopes with weak interlayer. Comput. Geotech. 2013, 53, 133–141. [Google Scholar] [CrossRef]
  13. He, Y.; Liu, Y.; Zhang, Y.; Yuan, R. Stability assessment of three-dimensional slopes with cracks. Eng. Geol. 2019, 252, 136–144. [Google Scholar] [CrossRef]
  14. Shen, L.; Han, X.; Fei, L.; Ding, R. Case study on Feasibility and Performance of Embankment over Soft Soils with Beam-type Capped Piles. KSCE J. Civ. Eng. 2025, 29, 100208. [Google Scholar] [CrossRef]
  15. He, Y.; Yu, J.; Yuan, R.; Fang, Y. Stability Analysis of the Soil Slope with Cracks Considering the Upper Slope Inclination. China J. Highw. Transport. 2021, 34, 45–54. (In Chinese) [Google Scholar]
  16. Zhou, H.; Zheng, G.; Yang, X.; Diao, Y.; Gong, L.; Cheng, X. Displacement of Pile-Reinforced Slopes with a Weak Layer Subjected to Seismic Loads. Math. Probl. Eng. 2016, 2016, 1527659. [Google Scholar] [CrossRef]
  17. Li, C.; Jiang, P. Failure mechanism of two-layered slopes subjected to the surcharge load. Int. J. Geomech. 2020, 20, 06019024. [Google Scholar] [CrossRef]
  18. Fredlund, D.; Krahn, J. Comparison of slope stability methods of analysis. Can. Geotech. J. 1977, 14, 429–439. [Google Scholar] [CrossRef]
  19. Huang, C.; Tsai, C.; Chen, Y. Generalized method for three-dimensional slope stability analysis. J. Geotech. Geoenviron. 2002, 128, 836–848. [Google Scholar] [CrossRef]
  20. Chang, M. Three-dimensional stability analysis of the Kettleman Hills landfill slope failure based on observed sliding-block mechanism. Comput. Geotech. 2005, 32, 587–599. [Google Scholar] [CrossRef]
  21. Deng, D.; Li, L.; Zhao, L. Critical position of tensile cracks and stability analysis in slope near river. J. Cent. South Univ. (Sci. Technol.) 2013, 44, 3873–3883. (In Chinese) [Google Scholar]
  22. Utili, S. Investigation by limit analysis on the stability of slopes with cracks. Géotechnique 2013, 63, 140–154. [Google Scholar] [CrossRef]
  23. Zhang, J.; Zhang, C.; Yi, J.; Liu, Z.; Yu, Z.; Liu, H. Upper bound stability analysis of cracked embankment fill on soil with spatially varying shear strength. Geotech. Geol. Eng. 2025, 43, 112. [Google Scholar] [CrossRef]
  24. Baker, R. Tensile strength, tension cracks, and stability of slopes. Soils. Found. 1981, 21, 1–17. [Google Scholar]
  25. Leshchinsky, D. Slope stability analysis: Generalized approach. J. Geotech. Eng. 1990, 116, 851–867. [Google Scholar] [CrossRef]
  26. Liu, F.; Zhao, J. Limit analysis of slope stability by rigid finite-element method and linear programming considering rotational failure. Int. J. Geomech. 2012, 13, 827–839. [Google Scholar] [CrossRef]
  27. Tang, Z.; Li, L.; Zhao, L.; Zhou, F. Stability analysis of slopes with weak interlayer based on upper bound limit analysis. J. Railw. Sci. Eng. 2014, 11, 60–64. (In Chinese) [Google Scholar]
  28. Zheng, G.; Zhao, J.; Zhou, H.; Yang, X. Stability analysis of weak interlayer slopes reinforced with piles under seismic load. J. Chongqing Univ. 2019, 42, 47–55. (In Chinese) [Google Scholar]
  29. Drucker, D.C.; Prager, W. Soil mechanics and plastic analysis for limit design. Q. Appl. Math. 1952, 10, 157–164. [Google Scholar] [CrossRef]
  30. Chen, W.F. Limit Analysis and Soil Plasticity; Elsevier: Rotterdam, The Netherlands, 1975. [Google Scholar]
  31. Zhang, H.; Li, C.; Chen, W.; Xie, N.; Wang, G.; Yao, W.; Jiang, X.; Long, J. Upper-bound limit analysis of the multi-layer slope stability and failure mode based on generalized horizontal slice method. J. Earth Sci. 2024, 35, 929–940. [Google Scholar] [CrossRef]
  32. Yu, Q.; Zhang, Y.; Li, D.; Chen, Q.; Lin, L.; Zhang, S.; Jia, W. System reliability analysis of bedrock-soil layer slopes subject to seismic action based on the upper bound limit analysis method. Geomat. Nat. Haz. Risk. 2025, 16, 2442020. [Google Scholar] [CrossRef]
  33. Zuo, J.-Y.; Wang, B.-T.; Li, W.-W.; Zhang, H.-X. Upper-bound solution for the stability analysis of layered slopes. J. Eng. Mech. 2022, 148, 04022007. [Google Scholar] [CrossRef]
  34. Chen, Y.; Lai, Y.; Zhang, M.; Zhang, M.; Li, H.; Zhang, Y. Upper-bound optimized solution of unsaturated soil slope stability under steady and unsteady flows. Comput. Geotech. 2023, 164, 105815. [Google Scholar] [CrossRef]
  35. Michalowski, R. Slope stability analysis: A kinematical approach. Géotechnique 1995, 45, 283–293. [Google Scholar] [CrossRef]
  36. Bishop, A.-W. The use of pore-pressure coefficients in practice. Géotechnique 1954, 4, 148–152. [Google Scholar] [CrossRef]
  37. Kim, J.; Salgado, R.; Lee, J. Stability analysis of complex soil slopes using limit analysis. J. Geotech. Geoenviron. 2002, 128, 546–557. [Google Scholar] [CrossRef]
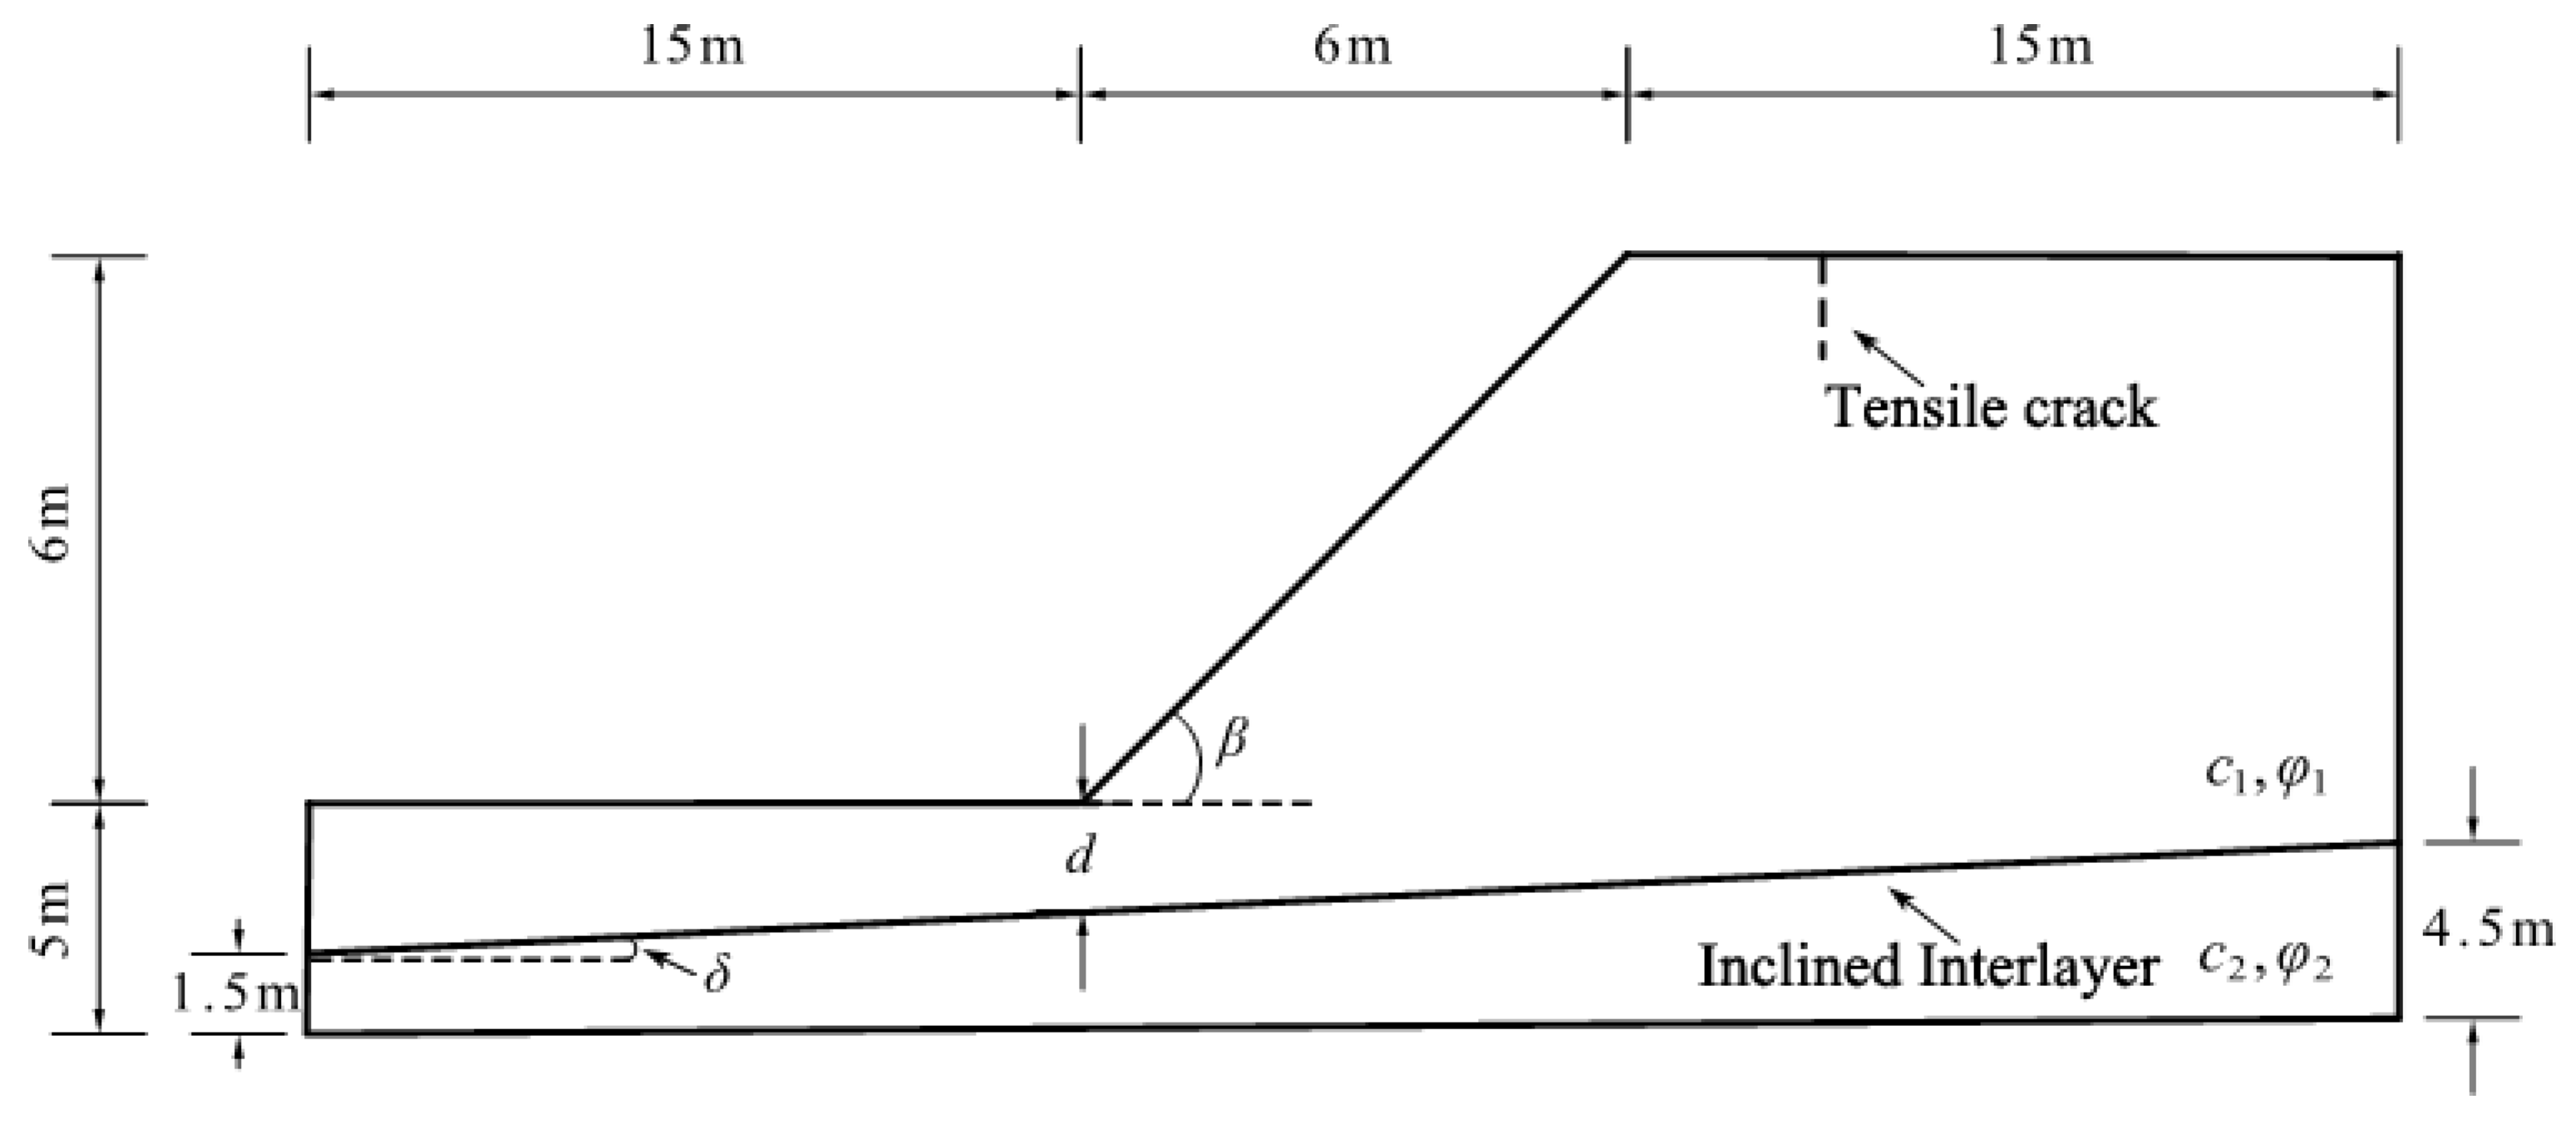
Figure 1. Embankment slope model.
Jmse 13 01594 g001
Figure 2. Numerical modeling of cracks at slope crest.
Jmse 13 01594 g002
Figure 3. Output of the numerical modeling: (a) stress distribution; (b) pore water flow direction; (c) shear dissipation.
Jmse 13 01594 g003
Figure 4. Schematic of the composite failure mechanism.
Jmse 13 01594 g004
Figure 5. Velocity hodograph: (a) velocity vector along the discontinuity surface NF; (b) velocity vector along the discontinuity surfaces CM and DM.
Jmse 13 01594 g005
Figure 6. Framework of the present study.
Jmse 13 01594 g006
Figure 7. The most critical crack location at the slope crest: (a) effects of crack depth and slope angle; (b) effects of pore water pressure and weak interlayer burial depth.
Jmse 13 01594 g007
Figure 8. Slope stability coefficients Ns for Group Ⅰ: (a) β = 30°; (b) β = 45°; (c) β = 60°.
Jmse 13 01594 g008
Figure 9. Slope stability coefficients Ns for Group Ⅱ: (a) β = 30°; (b) β = 45°; (c) β = 60°.
Jmse 13 01594 g009
Figure 10. Slope stability coefficients Ns for Group Ⅲ: (a) β = 30°; (b) β = 45°; (c) β = 60°.
Jmse 13 01594 g010
Figure 11. Slope stability coefficients Ns for Group Ⅳ: (a) β = 30°; (b) β = 45°; (c) β = 60°.
Jmse 13 01594 g011
Figure 12. Slope stability coefficients Ns for Group Ⅴ: (a) β = 30°; (b) β = 45°; (c) β = 60°.
Jmse 13 01594 g012
Figure 13. Slope stability coefficients Ns for Group Ⅵ: (a) β = 30°; (b) β = 45°; (c) β = 60°.
Jmse 13 01594 g013
Figure 14. Stability numbers of embankment slopes: (a) effect of crack depth; (b) effect of slope angle; (c) effect of pore water pressure coefficient; (d) effect of interlayer burial depth.
Jmse 13 01594 g014
Figure 15. Safety factors of embankment slopes (δ = 0°): (a) effect of crack depth; (b) effect of slope angle; (c) effect of interlayer burial depth; (d) effect of cohesion ratio of interlayer to embankment soil.
Jmse 13 01594 g015
Figure 16. Safety factors of embankment slope (δ = 4.76°): (a) effect of crack depth, slope angle, and cohesion ratio of interlayer to embankment soil; (b) effect of interlayer burial depth and pore water pressure coefficient.
Jmse 13 01594 g016
Figure 17. Distribution of critical sliding surface locations (Hc/H = 0, c2/c1 = 0.5): (a) β = 30°; (b) β = 40°; (c) β = 50°; (d) β = 60°.
Jmse 13 01594 g017
Figure 18. Distribution of critical sliding surface locations (Hc/H = 0.2, c2/c1 = 0.5): (a) β = 30°; (b) β = 40°; (c) β = 50°; (d) β = 60°.
Jmse 13 01594 g018aJmse 13 01594 g018b
Figure 19. Distribution of critical sliding surface locations (Hc/H = 0.2, c2/c1 = 0.1): (a) β = 30°; (b) β = 40°; (c) β = 50°; (d) β = 60°.
Jmse 13 01594 g019
Table 1. List of model parameters.
c1/kPac2/kPaφ1/(°)φ2/(°)γ/(kN/m3)β/(°)δ/(°)d/mH/mHc/m
201210520454.762.760.6
Table 2. Comparative results of safety factor FS.
Analytical MethodsFS
Lower-bound limit analysis method [37]1.07
Upper-bound limit analysis method [37]1.16
Morgenstern–Price method1.12
This study1.14
Table 3. Soil strength parameters of different groups.
GroupPore Water Pressure Coefficientφ2/φ1c2/c1
I
II
III
ru = 0.251.0
0.5
0.5
0.0
0.0
0.5
IV
V
VI
ru = 0.51.0
0.5
0.5
0.0
0.0
0.5
Table 4. Comparison of stability numbers Ns considering pore water pressure.
Hc/Hβ/(°)ru = 0ru = 0.25Reduction Rate/%
d/H = 0.4
0.03010.837.9326.78
0.110.507.3629.90
0.210.176.8532.65
0.39.856.4334.72
0.49.596.1336.08
0.0457.786.0322.49
0.17.565.6824.87
0.27.395.3727.33
0.37.255.0730.07
0.47.074.7632.67
0.0607.355.6622.99
0.17.105.3524.65
0.26.915.0726.63
0.36.684.8227.84
0.46.434.5828.77
Table 5. Comparison of slope stability numbers Ns under different pore water pressure conditions.
Hc/Hβ/(°)(ru = 0.25, Group III)(ru = 0.5, Group VI)Reduction Rate/%
(1)(2)(3)(4)AB
d/H = 0.2d/H = 1.0d/H = 0.2d/H = 1.0
0.0307.9911.227.449.186.8818.18
0.17.4410.466.878.427.6619.50
0.26.979.76.397.798.3219.69
0.36.569.025.967.259.1519.62
0.46.238.535.546.7611.0820.75
0.0456.418.285.96.47.9622.71
0.16.027.75.455.989.4722.34
0.25.647.265.065.5810.2823.14
0.35.326.844.685.2912.0322.66
0.44.986.424.354.9912.6522.27
0.0605.787.334.835.4216.4426.06
0.15.436.894.495.1117.3125.83
0.25.116.424.24.8317.8124.77
0.34.816.053.954.6317.8823.47
0.44.525.683.764.4216.8122.18
Disclaimer/Publisher’s Note: The statements, opinions and data contained in all publications are solely those of the individual author(s) and contributor(s) and not of MDPI and/or the editor(s). MDPI and/or the editor(s) disclaim responsibility for any injury to people or property resulting from any ideas, methods, instructions or products referred to in the content.