Article

Estimation of Growth and Carrying Capacity of Porphyra spp. Under Aquaculture Conditions on the Southern Coast of Korea Using Dynamic Energy Budget (DEB)

Department of Marine Environment Research, National Institute of Fisheries Science, 216 Gijanghaean-ro, Gijang-gun, Busan 46083, Republic of Korea
*
Author to whom correspondence should be addressed.
J. Mar. Sci. Eng. 2025, 13(8), 1586; https://doi.org/10.3390/jmse13081586
Submission received: 1 June 2025 / Revised: 23 July 2025 / Accepted: 15 August 2025 / Published: 19 August 2025
(This article belongs to the Section Marine Environmental Science)

Abstract

Understanding the growth dynamics and ecological constraints of Porphyra spp. is essential for optimizing sustainable seaweed aquaculture. However, most existing models lack physiological detail and exhibit limited performance under variable environmental conditions. This study developed a mechanistic Dynamic Energy Budget (DEB) model to simulate structural biomass accumulation, carbon and nitrogen reserve dynamics, and blade area expansion of Porphyra under natural environmental conditions in Korean coastal waters. The model incorporates temperature, irradiance, and nutrient availability (NO3 and CO2) as environmental drivers and was implemented using a forward difference numerical scheme. Field data from Beein Bay were used for model calibration and validation. Simulations showed good agreement with the observed biomass, reserve content, and blade area, with root-mean-square error (RMSE) typically within ±10%. Sensitivity analysis identified temperature-adjusted carbon assimilation and nitrogen uptake as the primary drivers of growth. The model was further used to estimate dynamic carrying capacity, revealing seasonal thresholds for sustainable biomass under current farming practices. Although limitations remain—such as the exclusion of reproductive allocation and tissue loss—the results demonstrate that DEB theory provides a robust framework for modeling Porphyra aquaculture. This approach supports scenario testing, spatial planning, and production forecasting, and it is adaptable for ecosystem-based management including integrated multi-trophic aquaculture (IMTA) and climate adaptation strategies.

1. Introduction

The global expansion of aquaculture has raised sustainability concerns due to its interactions with marine ecosystems—particularly in the case of fed species that contribute to eutrophication and food web disruption [1,2]. In contrast, the cultivation of extractive species such as macroalgae offers a promising, environmentally beneficial alternative. Macroalgae can remove excess nutrients from coastal waters, sequester carbon, and contribute to habitat stabilization [3,4]. As a result, macroalgae farming is increasingly recognized as a climate-resilient and ecosystem-friendly component of future food systems [5,6].
Among macroalgae, Porphyra spp.—commonly known as gim in Korea and nori in Japan—are among the most valuable and widely cultivated red seaweeds globally. South Korea leads in worldwide production, with extensive aquaculture systems operating in nutrient-rich estuarine and coastal environments [7]. Porphyra holds significant economic and cultural importance in Northeast Asia and beyond [8,9]. However, Porphyra cultivation systems are sensitive to environmental variability, including changes in seawater temperature, seasonal light availability, and concentrations of key nutrients, particularly nitrate and dissolved inorganic carbon [10,11]. These environmental drivers influence not only photosynthesis but also internal energy dynamics and reserve accumulation, which ultimately determine growth rates and yield. In general, macroalgal productivity in aquaculture is tightly regulated by nutrient physiology, which governs nutrient uptake, internal allocation, and growth under fluctuating conditions [12,13,14].
Previous models of Porphyra growth have primarily relied on empirical or regression-based approaches. While these models capture general biomass accumulation trends, they often fail to account for the internal physiological processes that regulate growth [2,15]. For example, such models typically overlook internal nutrient storage, reserve mobilization, growth under suboptimal conditions, and trade-offs in energy allocation. These limitations reduce their utility under variable environmental conditions or for management applications such as optimizing stocking density and harvest timing [16,17]. However, recent advancements in mechanistic modeling, particularly with Dynamic Energy Budget (DEB) theory, offer a more comprehensive approach. These physiologically explicit models can better simulate internal processes like nutrient storage and energy allocation, providing improved predictions for macroalgal growth under various environmental conditions and for optimized aquaculture management [11].
To address these gaps, Dynamic Energy Budget (DEB) theory provides a robust mechanistic framework for modeling how organisms acquire and allocate energy and nutrients. DEB models describe how energy is taken up from the environment, stored in reserves, and distributed for maintenance, growth, and reproduction, based on the first principles of mass and energy conservation [18]. Although originally developed for heterotrophs, DEB theory has been successfully extended to autotrophs by incorporating light-driven photosynthesis, surface-to-volume scaling, and parallel reserve dynamics [19,20,21,22].
Recent applications of DEB models to macroalgae such as Saccharina latissima (sugar kelp) have demonstrated the approach’s ability to simulate growth under constraints imposed by light, temperature, and nutrient availability [23,24]. These models integrate light-limited carbon uptake, nutrient assimilation, reserve turnover, and structural growth to provide a biologically coherent understanding of macroalgal physiology in aquaculture systems. Given the morphological and functional similarities between kelp and Porphyra—both being blade-forming, photoautotrophic macroalgae—adapting such a framework for Porphyra is both logical and feasible.
Despite the success of DEB models in other macroalgal systems, their application to Porphyra aquaculture remains limited. Furthermore, few studies have attempted to link DEB model outputs to carrying capacity estimation or farm-scale management indicators. Carrying capacity, defined here as the maximum sustainable biomass under specific environmental conditions, is a critical metric for optimizing harvest timing, assessing nutrient loading, and avoiding overstocking [25].
In this study, we develop and apply a DEB model specifically tailored to Porphyra spp. cultivation in Korean coastal waters. The model incorporates key physiological processes, including light-limited carbon assimilation, nitrate uptake, temperature-dependent metabolic rates, reserve dynamics, and a self-limiting function for carrying capacity. Field observations from a monitored aquaculture site in Beein Bay are used for model calibration and validation. We aim (1) to construct a physiologically explicit DEB model for Porphyra; (2) to validate the model against observed data, including biomass, carbon and nitrogen content, and blade area; and (3) to assess its applicability in estimating dynamic carrying capacity under varying environmental regimes. We hypothesize that a DEB model incorporating environmental drivers will reliably predict Porphyra growth and carrying capacity. This work introduces a mechanistic modeling tool for seaweed aquaculture, enhancing our ability to predict biomass dynamics and inform management decisions for Porphyra farming under real-world field conditions.

2. Materials and Methods

2.1. Model Assumptions and Framework

We developed a Dynamic Energy Budget (DEB) model to simulate the growth dynamics of Porphyra spp. cultivated in Beein Bay, Korea. The model tracks three key state variables: structural biomass (M_V), carbon reserve density (m_EC), and nitrogen reserve density (m_EN). The organism is modeled as a V1-morph, meaning that its surface area scales with volume to the power of 2/3, consistent with the standard DEB assumptions for flat, sheet-like organisms [18].
Carbon assimilation is modeled using a three-stage synthesizing unit (SU) framework adapted from Venolia et al. [23], comprising SU1 (light absorption), SU2 (excitation relaxation), and SU3 (CO2 fixation). The model assumes the availability of dissolved CO2 in seawater, including uptake from bicarbonate (HCO3), which is known to support photosynthetic carbon fixation in macroalgae under high-pH conditions [26].
Nitrogen uptake from the environment follows a saturation-type kinetics model consistent with Michaelis–Menten dynamics observed in macroalgae under aquaculture conditions [27]. When the assimilated carbon or nitrogen fluxes exceed the capacity for reserve storage or structural conversion, the surplus is either rejected (unused energy) or excreted (waste nitrogen), depending on the type of nutrient.
A conceptual diagram of the model structure and physiological flux pathways is presented in Figure 1. This diagram distinguishes external environmental inputs—irradiance, temperature, NO3, and CO2—from internal compartments representing energy reserves and structural biomass. The temperature-dependent growth response of Porphyra was parameterized using principles from metabolic theory, specifically through a Sharpe–Schoolfield temperature correction function, and calibrated using experimentally observed optimal thermal conditions for Laminaria species [28].

2.2. Study Site and Environmental Forcing

Macroalgal growth is strongly influenced by light availability, which decreases with depth due to attenuation in the water column. Field studies on Laminaria saccharina have demonstrated reduced growth at greater depths, underscoring the limiting effect of light availability [29].
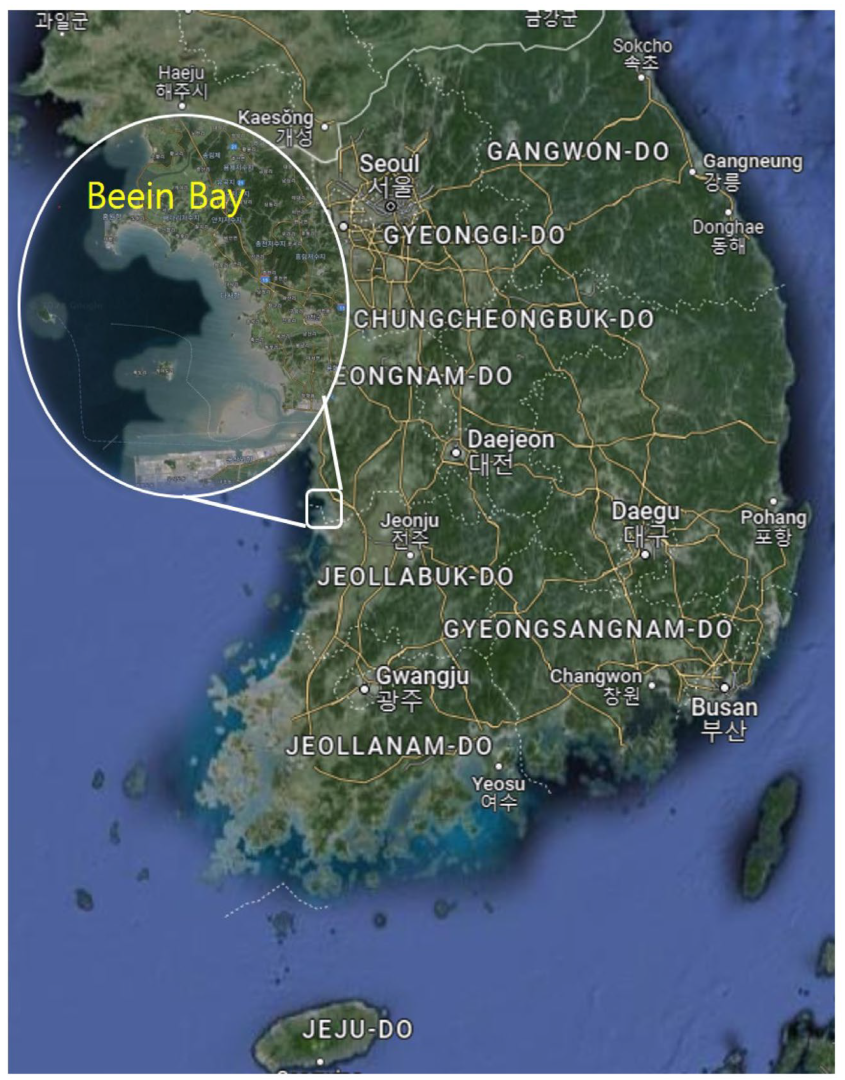
This study was conducted at a commercial Porphyra aquaculture site in Beein Bay, located on the southern coast of Korea (see Figure 2). The approximate coordinates of the study site are 34.8°N, 126.4°E. Time-series environmental data—including water temperature (°C), photosynthetically active radiation (irradiance in µmol photons m−2 s−1), nitrate concentration (NO3, µM), and dissolved inorganic carbon (CO2, µM)—were obtained from the National Aquaculture Environmental Monitoring Program jointly operated by the MOF, NIFS, GIST, and KIOST [30].
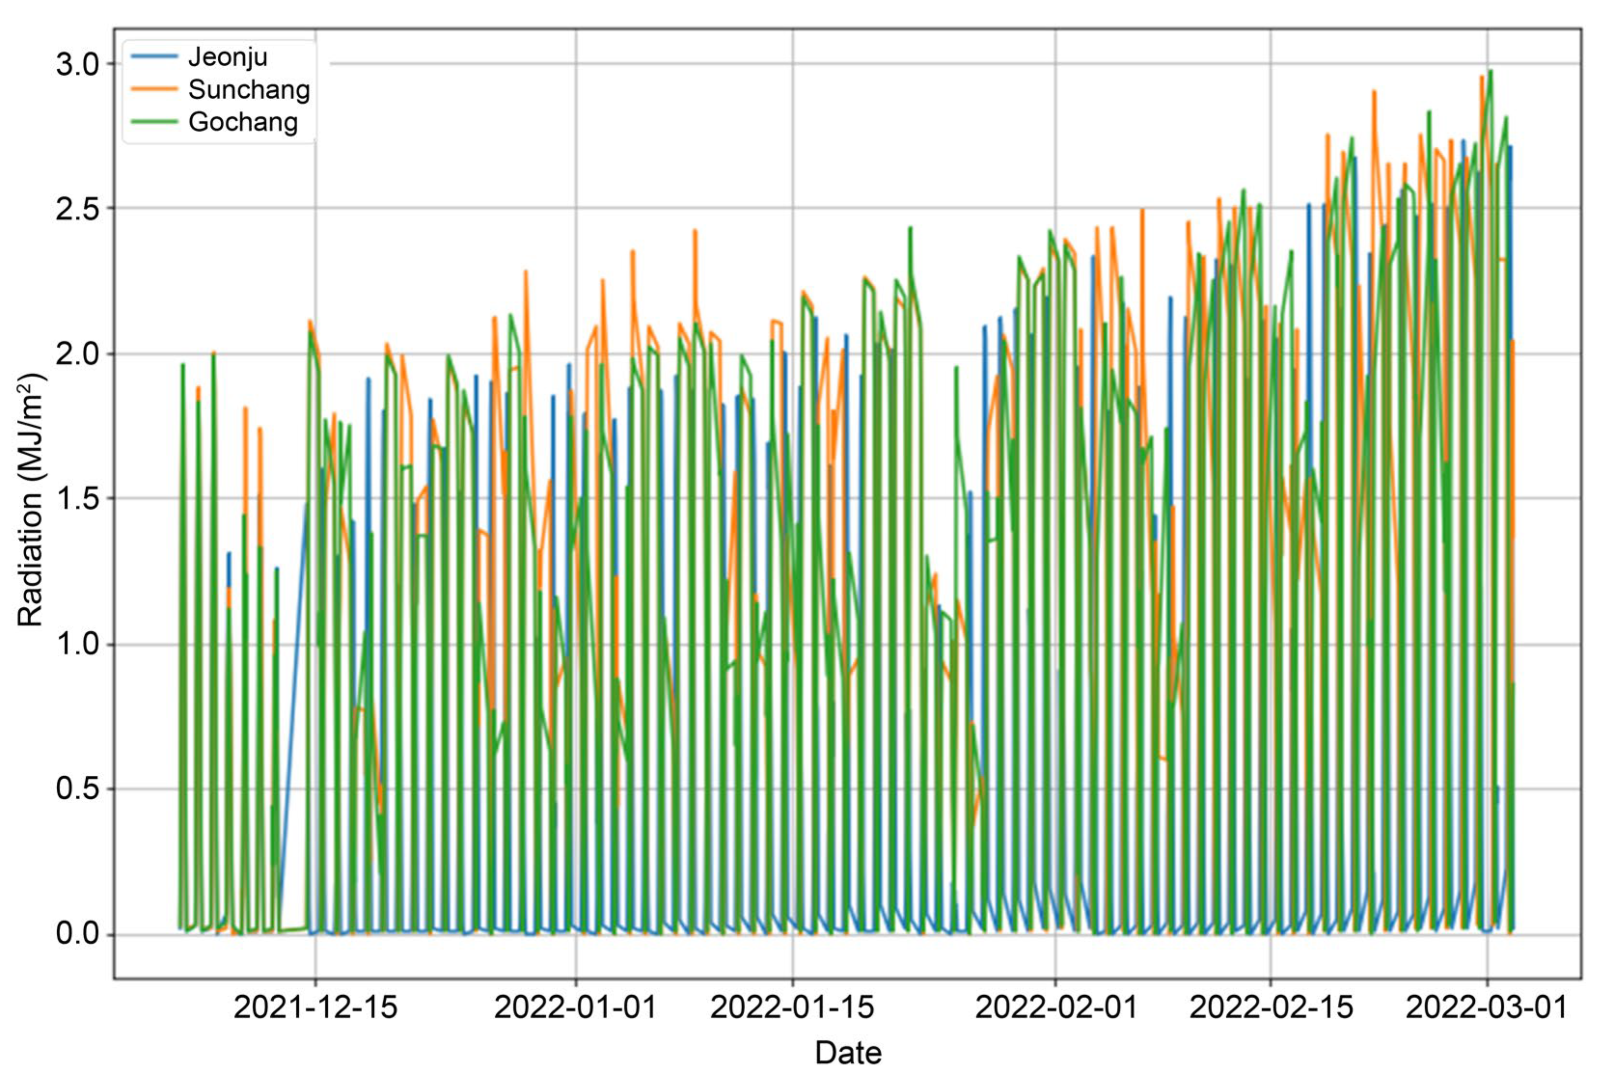
Measurements were collected at daily intervals and interpolated to an hourly time scale to match the DEB model’s resolution. Where direct irradiance data were unavailable, photosynthetically active radiation was estimated from solar radiation data (MJ m−2 day−1) recorded at nearby weather stations (Jeonju, Sunchang, and Gochang), using a standard empirical conversion factor. Additionally, missing values in the time-series data were filled in using linear interpolation.
Figure 3 shows the time series of daily solar radiation (MJ m−2 day−1) at Jeonju, Sunchang, and Gochang from December 2021 to March 2022. The ranges of environmental and biological variables used for model forcing and validation are summarized in Table 1.

2.3. Core Equations and Parameterization

The model formulation follows the standard autotrophic Dynamic Energy Budget (DEB) framework [18], as implemented by Venolia et al. [23]. The following equations represent the key physiological fluxes illustrated in Figure 1:
Nitrate uptake (nitrogen assimilation):
J E N = j E N A m · C T · [ N O 3 ] K N + [ N O 3 ]
where j E N A m is the maximum nitrate uptake rate (mol N m−2 h−1), K N is the half-saturation constant for nitrate (µM), and C T (T) is the temperature correction factor.
Carbon uptake (CO2-limited):
J C O 2 = j C O 2 m · C T T · [ C O 2 ] K c + [ C O 2 ]
where J C O 2 m is the maximum CO2 uptake rate (mol C m−2 h−1) and Kc is the CO2 half-saturation constant (µM).
Photosynthetic carbon assimilation:
J E C = ( 1 J C O 2 + 1 J l i g h t + 1 J P S U ) 1
where J l i g h t is the light-limited carbon flux, and J P S U reflects limitations due to the density of photosynthetic units (PSUs), which may saturate under high-light conditions.
Specific growth rate:
r = k · p c p M E G + ( k · p c M V )
where p c is the reserve mobilization flux (J mol−1), p M is the somatic maintenance cost (J mol−1 h−1), E G is the cost of synthesizing structural biomass (J mol−1), and Mv is the structural biomass (mol).
Temperature correction factor (Sharpe–Schoolfield equation):
C T ( T ) = e x p T A T 0 T A T 1 + e x p T A L T 0 T A L T L + e x p T A H T H T A H T 0
1 + e x p T A L T T A L T L + e x p T A H T H T A H T 1
where T is temperature (K), T A is the Arrhenius temperature, and T A L ,   T A H define high and low deactivation energies, respectively.
Selected parameter values used in the model include the following:
j C O 2 m = 0.01   m o l   C   m 2 h 1 , j E N A m = 0.0001 , m o l   N   m 2 h 1
k E C = 0.1   h 1 , k E N = 0.05   h 1 , k = 0.6
E G = 0.8   J   m o l 1 ,   p M = 0.02   J   m o l 1 h 1 T A = 6500 k , T L = 260 k , T H = 280 k
Most of the DEB model parameters were determined through a calibration process using the observed Porphyra growth data collected in this study. Specifically, parameters categorized as ‘This study’ in Table 2 were determined by numerical optimization using the minimize function from the scipy.optimize library in Python 3.11.4 (Python Software Foundation, Wilmingtion, DE, USA; SciPy v1.11.3), employing the ‘L-BFGS-B’ method. The objective function for this optimization was to minimize the mean squared error (MSE) between the simulated dynamic carrying capacity and the observed biomass. The remaining parameters categorized as ‘Calibrated’ in Table 2 were iteratively adjusted manually through a trial-and-error approach to achieve a visually good fit with the corresponding field observations of model outputs (e.g., biomass, carbon and nitrogen content, blade area), as depicted in Figure 4, and further validated in Figure 5, Figure 6, Figure 7, Figure 8, Figure 9, Figure 10. The specific values and their respective sources are detailed in Table 2.

2.4. Numerical Scheme

To align with the hourly resolution of the environmental input data and enable transparent tracking of state variables, the model was implemented using an explicit forward difference scheme with a fixed time step of one hour [23,31]. This discrete time formulation avoids the need for computationally intensive ODE solvers and ensures stability over the simulation period, which spans the entire cultivation season (approximately 120 days). The chosen time step corresponds directly to the temporal resolution of the environmental forcing data, and it was validated to provide numerical stability under all tested conditions. Adaptive methods were not used, as the model operates with externally observed environmental inputs rather than dynamically changing internal stiffness.
State variables were updated as follows:
Carbon reserve:
m E C t + 1 = m E C t + t · ( J E C t k E C · m E C t j E C M + φ R t )
Nitrogen reserve:
m E N t + 1 = m E N t + t · ( J E N t k E N · m E N t j E V M )
Structural biomass:
M V t + 1 = M V t + t · M V t · r t
Initial values for Mv, mEC, and mEN were calculated from field observations of biomass, carbon, and nitrogen content, and they were converted to molar units using molar masses (structure: 29.89 g mol−1, carbon reserve: 54 g mol−1, nitrogen reserve: 17 g mol−1).

2.5. Flux Diagnostics and Growth Limitation Analysis

To diagnose physiological limitation, we tracked the ratio of rejected flux ( ϕ R ) to total assimilated carbon and nitrogen fluxes. The rejected flux represents the portion of assimilated energy or nutrients that exceeds the storage or growth capacity and is therefore not retained. It is calculated as follows:
ϕ R = J r e j e c t e d J E C + J E N
A higher ϕR value indicates that environmental constraints—typically low light or nutrient availability—are limiting the organism’s ability to utilize the assimilated substrates effectively.
In addition, oxygen production flux ( J C O 2 ) was estimated as a proxy for photosynthetic activity using the photon-based stoichiometry:
J O 2 = J I · y I O 2
where J I is the photon absorption rate (mol photons m−2 h−1) and yI O 2 = 0.125 mol of O2 per mol of photons absorbed. Comparing temporal trends in J O 2 and nitrate uptake fluxes ( J E N ) enabled identification of the primary growth-limiting factors under varying seasonal conditions.

3. Research Results

3.1. Numerical Stability Assessment
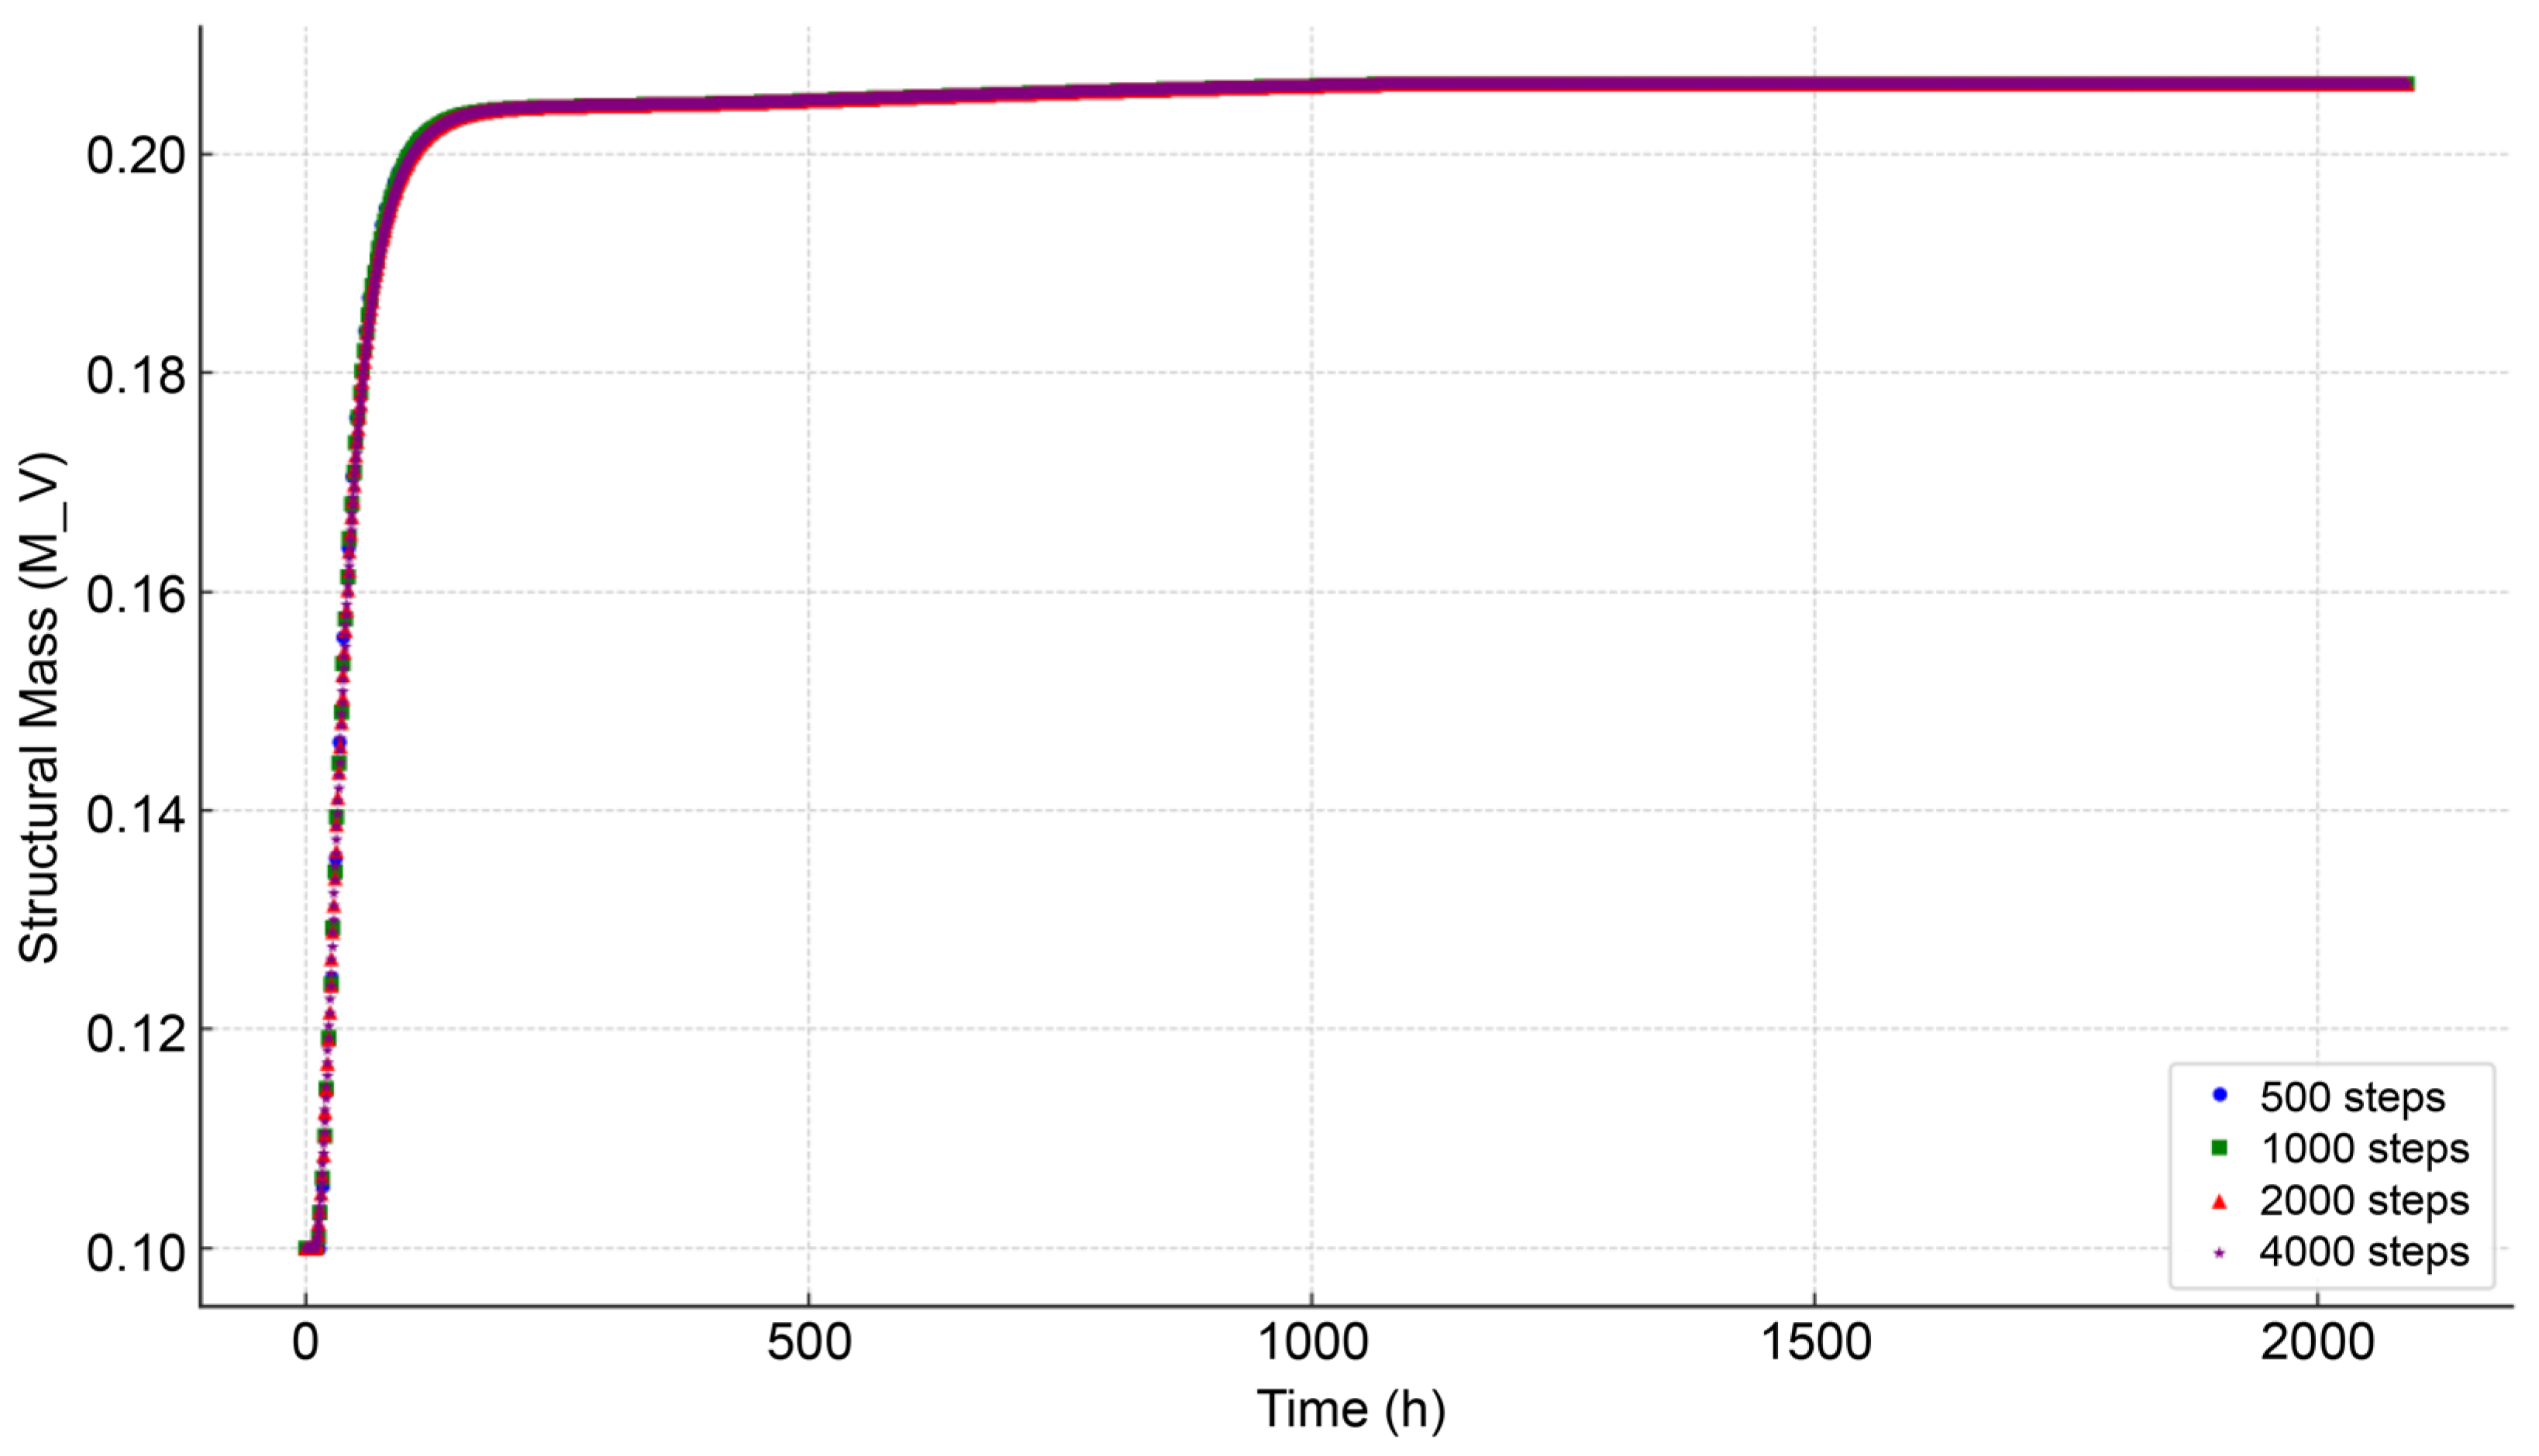
To verify the numerical robustness of the implemented full DEB model, we conducted a resolution sensitivity analysis by varying the number of discrete time steps—500, 1000, 2000, and 4000—over the same total simulation duration (120 days). The forward time step (Δt) was adjusted accordingly to maintain the fixed simulation length, with Δt ranging from 5.76 h (for 500 steps) to 0.72 h (for 4000 steps).
Structural biomass was used as the benchmark variable for assessing convergence behavior. The simulation result obtained with 4000 time steps (i.e., Δt = 0.72 h) served as the reference solution. Root-mean-square error (RMSE) values were calculated between each test simulation and the reference according to
R M S E = 1 n i = 1 n ( M V ,     i t e s t M V ,     i r e f ) 2
The results demonstrated consistent numerical convergence as the temporal resolution increased. The RMSE values for each time step scenario are summarized in Table 3.
These results confirm that the DEB model is numerically stable and reliable even at moderate resolution levels (e.g., ≥1000 steps, corresponding to Δt ≤ 2.88 h). As shown in Figure 4, the simulated structural biomass ( M V ) trajectories closely overlap across different temporal resolutions. This consistency indicates that the model produces stable, non-oscillatory solutions without numerical artifacts. The gradual reduction in RMSE values with increasing step count further supports the conclusion that numerical convergence is achieved as temporal resolution improves.
Figure 4. Simulated structural biomass ( M V ) trajectories under varying numerical resolutions (500, 1000, 2000, and 4000 time steps) over a fixed 120-day cultivation period. Each resolution corresponds to a specific time step (Δt), ranging from 5.76 h (500 steps) to 0.72 h (4000 steps). Numerical convergence is demonstrated by the increasingly overlapping trajectories and the decreasing RMSE relative to the 4000-step reference solution.
Jmse 13 01586 g004
Furthermore, all simulations exhibited a biologically realistic biphasic growth pattern—characterized by an initial phase of rapid biomass accumulation, followed by a slower, saturating phase. This dynamic reflects the core principles of DEB theory: during early growth, low structural biomass minimizes maintenance costs, allowing most assimilated energy to support growth. Over time, as structural mass increases, maintenance requirements rise, and nutrient uptake (particularly nitrogen and carbon) becomes limiting under environmental constraints, leading to growth deceleration.

3.2. Comparison with Observed Data
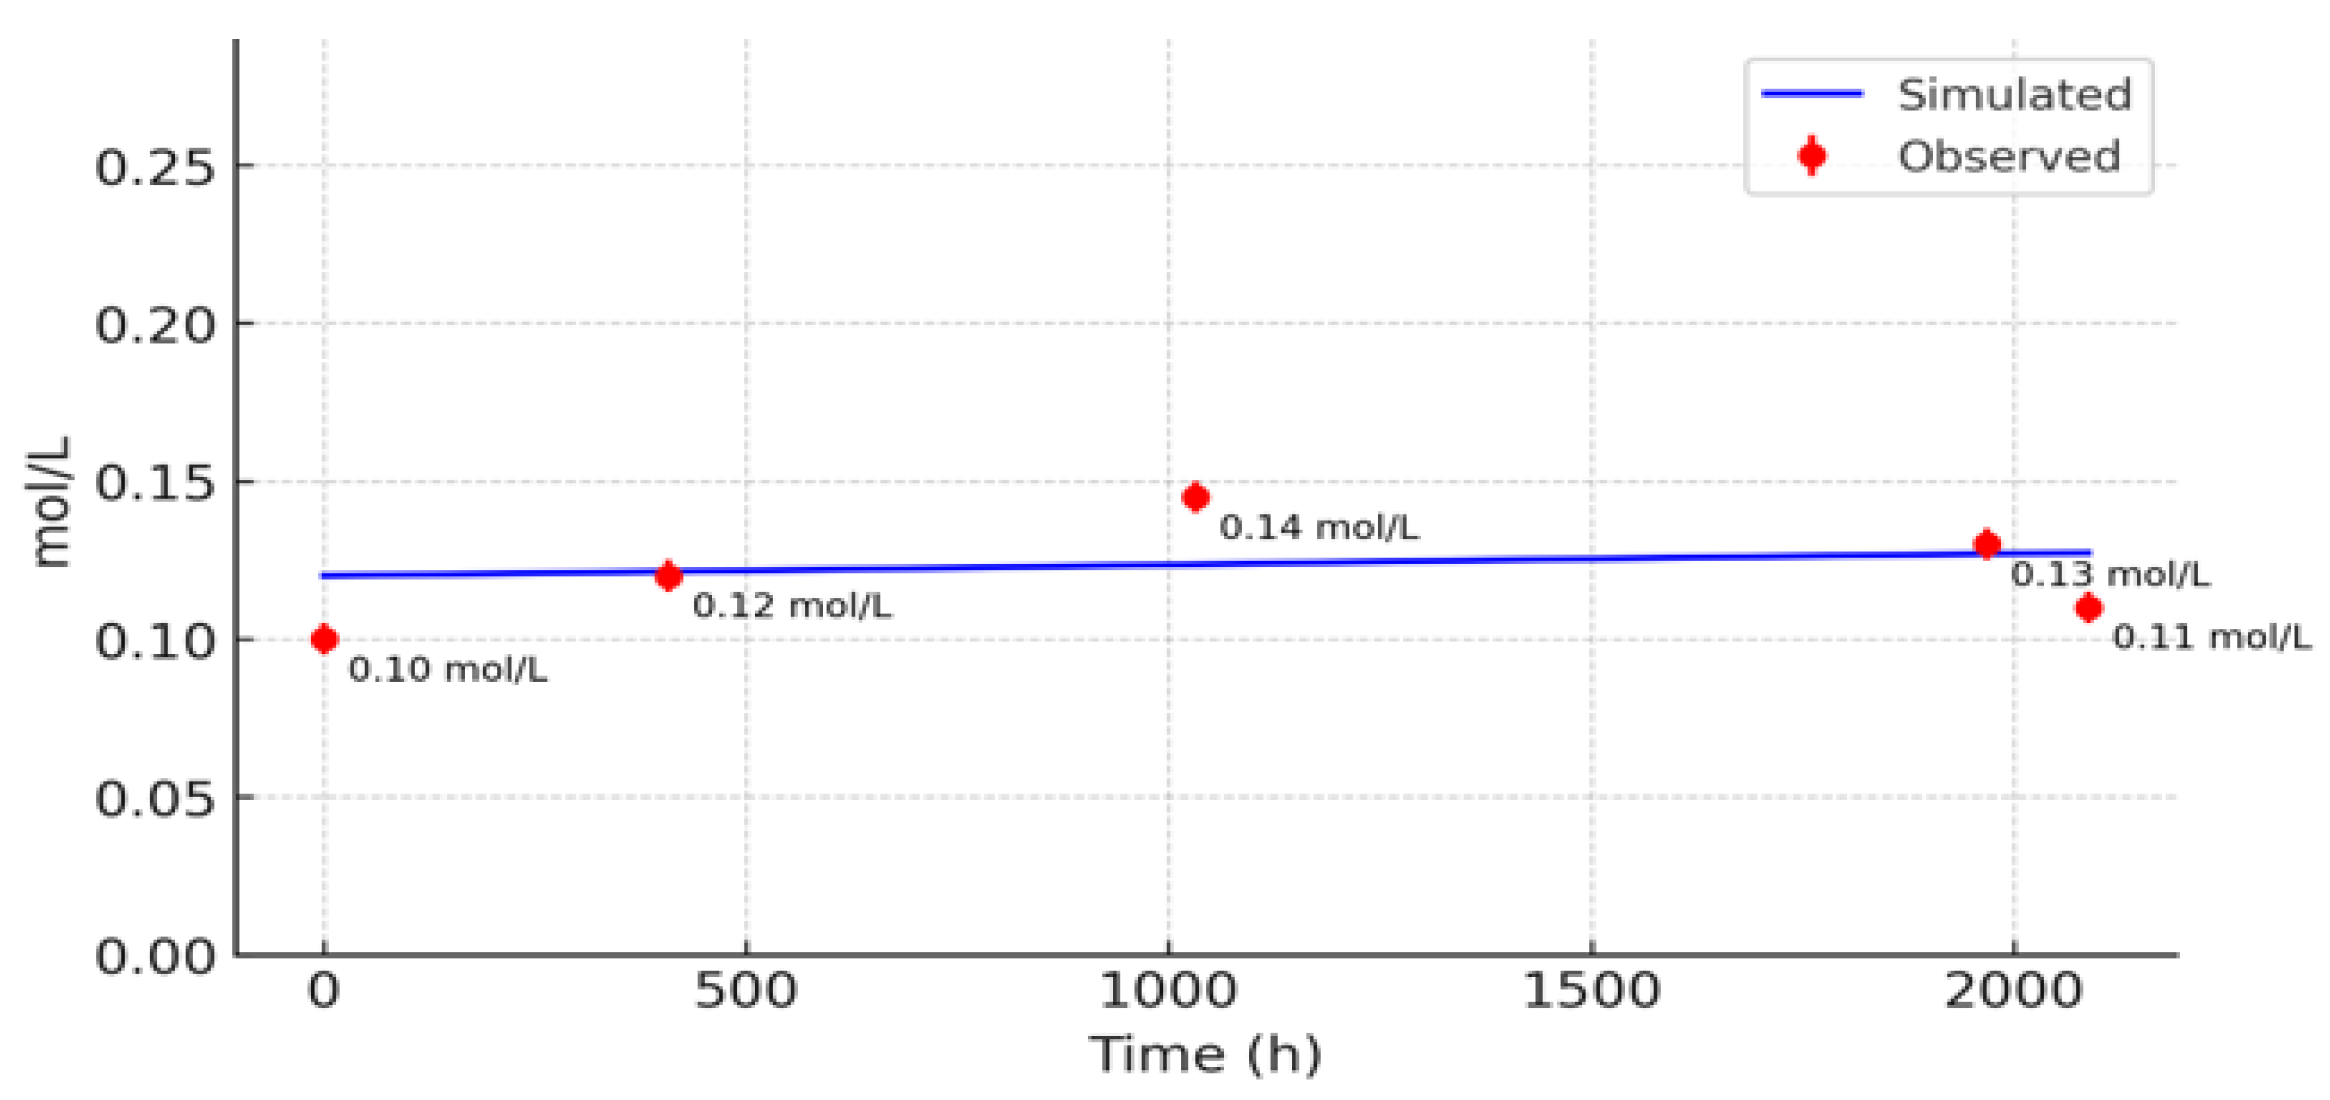
The performance of the full DEB model was evaluated by comparing simulation outputs with field observations of Porphyra spp. collected during a winter cultivation period in Beein Bay. The evaluation focused on structural biomass ( M V ), blade area, reserve content, nutrient concentrations, and dynamic carrying capacity.
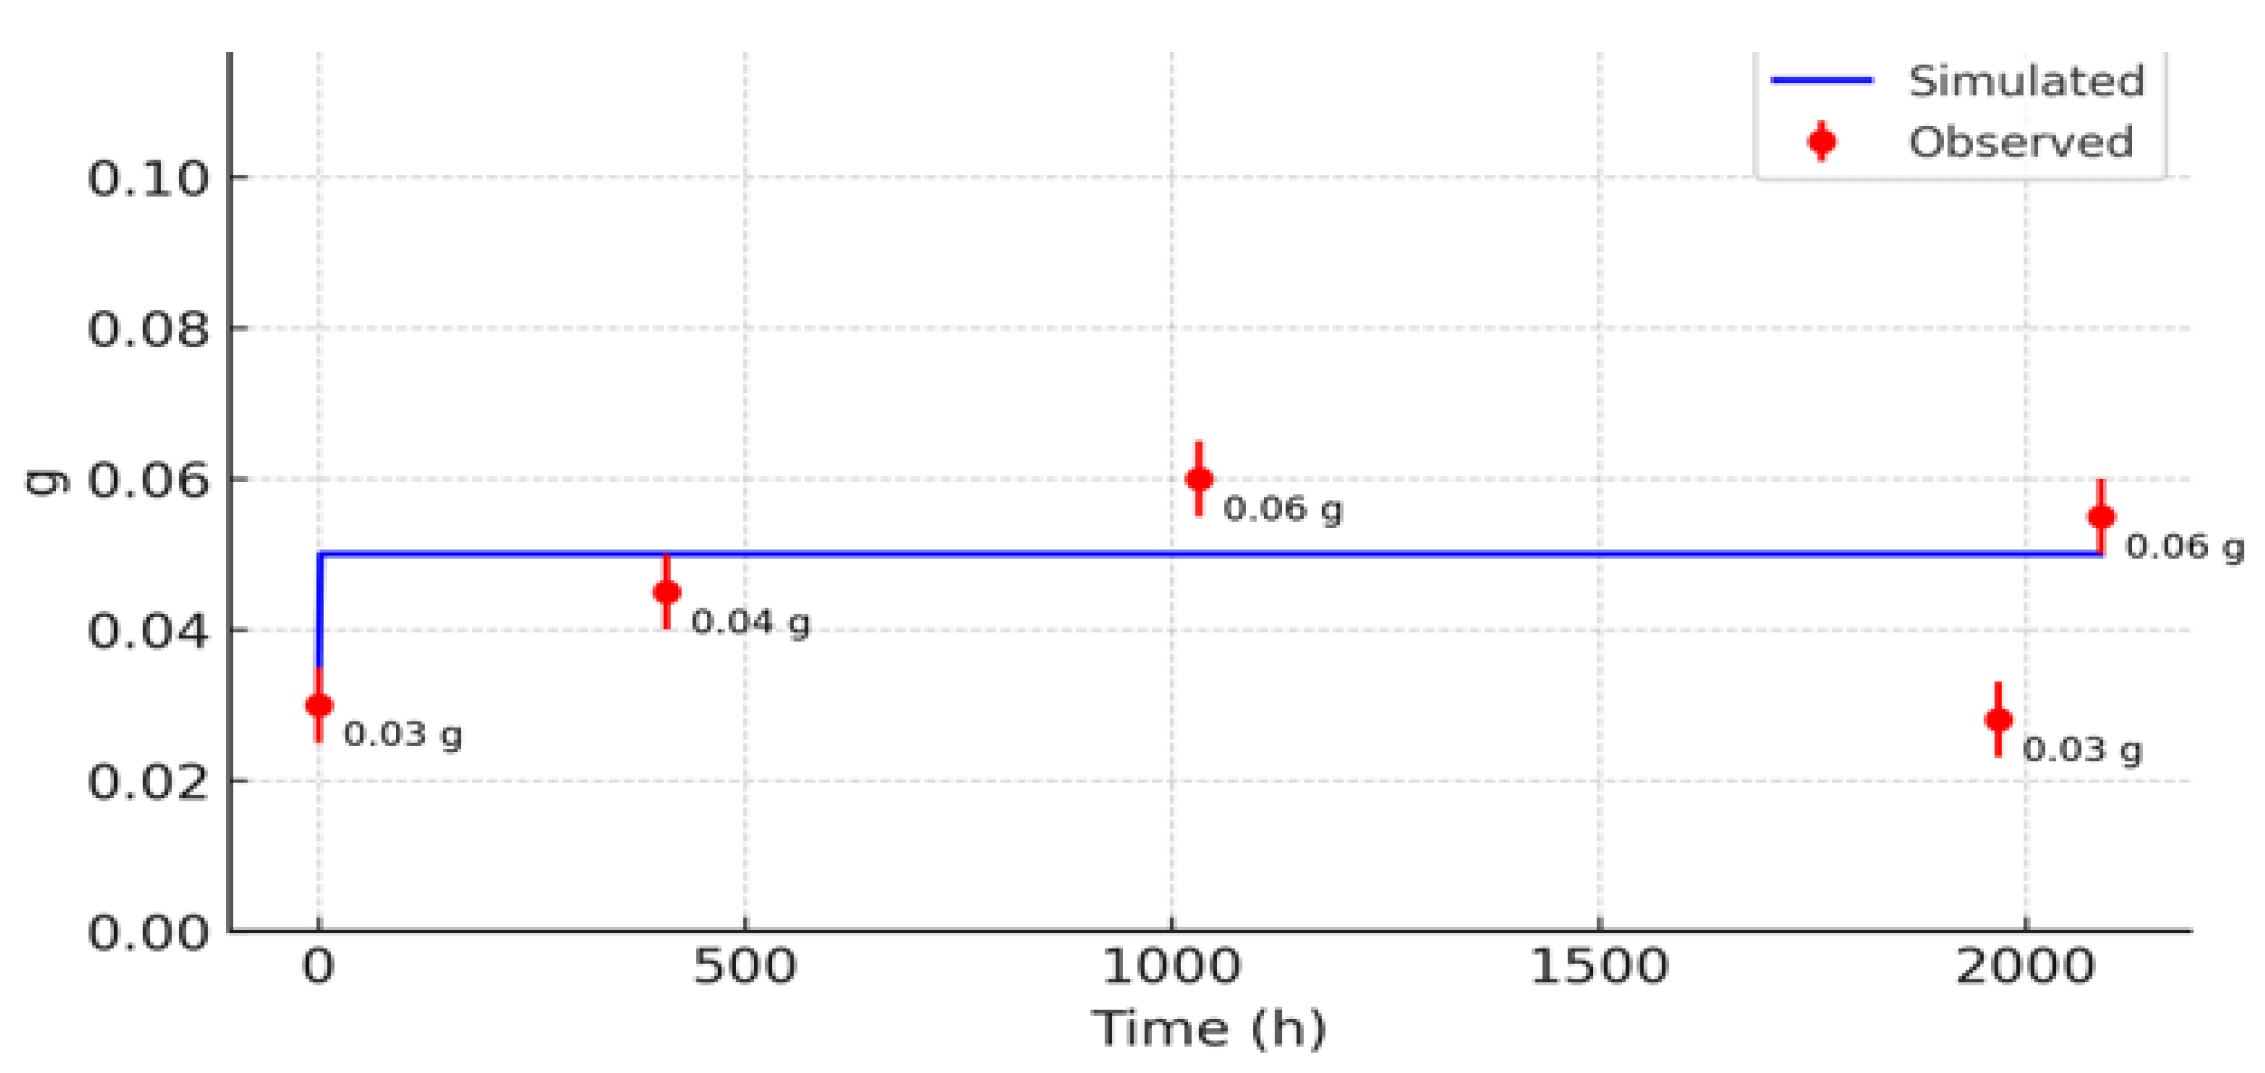
Figure 5 shows the comparison between simulated and observed structural biomass. The model accurately reproduced the overall growth trajectory, including the initial exponential phase and the gradual plateau as biomass approached a carrying limit. The RMSE between simulated and observed values remained within ±10% of the observed means for most of the cultivation period, demonstrating strong predictive accuracy. Minor deviations during the late growth phase may be attributed to unmodeled processes such as reproductive allocation, tissue degradation, or epiphyte accumulation.
Figure 6 presents the simulated carbon reserve mass ( m E C ) over time. Reserve levels increased during early winter, when nutrient availability was high, and then gradually declined during the peak growth period as stored carbon was mobilized for biomass production. This seasonal trend was qualitatively consistent with field tissue composition data obtained from field samples.
Figure 7 and Figure 8 illustrate modeled concentrations of CO2 and NO3, respectively. CO2 uptake dynamics followed seasonal variations in temperature and irradiance, while NO3 concentrations reflected the balance between nitrogen assimilation and external nutrient inputs. Both variables exhibited realistic ranges and temporal trends consistent with nutrient-limited macroalgal physiology.
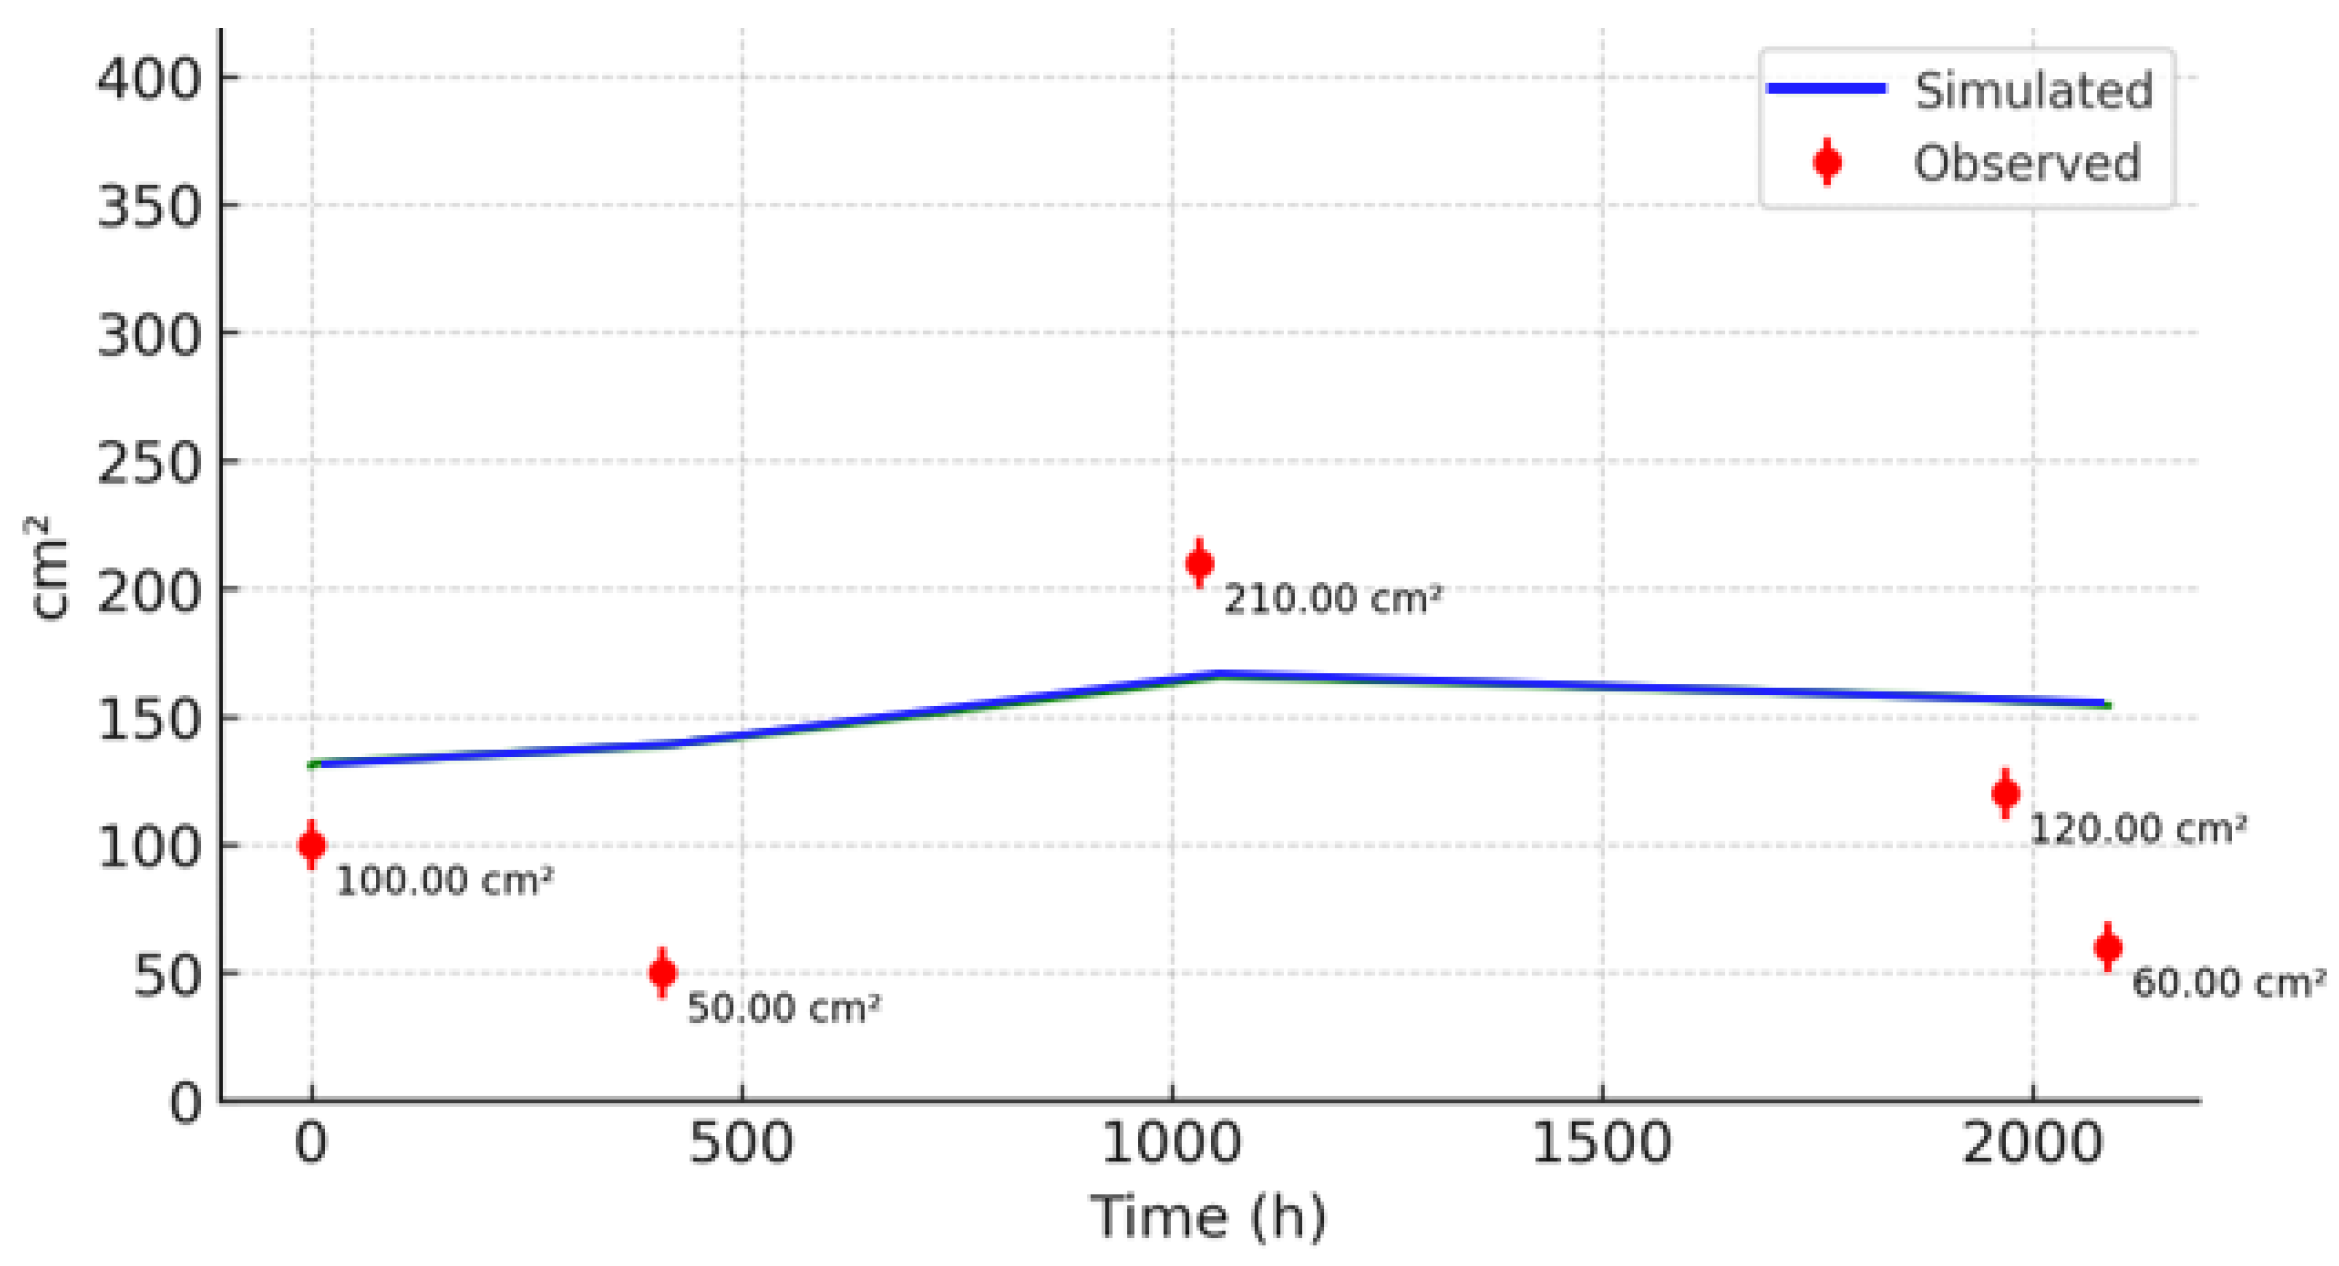
Figure 9 compares the simulated and observed blade area. The model effectively translated structural biomass into morphological surface area, capturing both the seasonal expansion and mid-season peak driven by temperature and light availability.
Figure 10 presents the simulated dynamic carrying capacity, alongside observed biomass. The model successfully estimated temporal changes in site-specific production limits, showing good agreement during the peak growth period. Slight overestimation in the late season may be due to unaccounted loss factors such as biofouling or partial harvest.
Overall, these comparisons validate the physiological realism of the DEB model and confirm its ability to dynamically simulate macroalgal growth in response to environmental drivers. The model demonstrates strong potential for use in site-specific aquaculture planning, yield forecasting, and productivity assessment under variable coastal conditions.
Figure 5. Comparison of simulated and observed structural biomass ( M V ) for Porphyra spp. during the winter cultivation period in Beein Bay. The blue line represents the simulated trajectory from the DEB model, and red markers indicate observed field values with assumed measurement uncertainty (±5%).
Jmse 13 01586 g005
Figure 6. Comparison of simulated and observed carbon reserve mass ( m E i ) for Porphyra spp. during the winter cultivation period in Beein Bay. The blue line represents the simulated trajectory from the DEB model, and red markers indicate observed field values with assumed measurement uncertainty (±5%).
Jmse 13 01586 g006
Figure 7. Comparison of simulated and observed CO2 concentration for Porphyra spp. during the winter cultivation period in Beein Bay. The blue line represents the simulated trajectory from the DEB model, and red markers indicate observed field values with assumed measurement uncertainty (±5%).
Jmse 13 01586 g007
Figure 8. Comparison of simulated and observed NO3 concentration for Porphyra spp. during the winter cultivation period in Beein Bay. The blue line represents the simulated trajectory from the DEB model, and red markers indicate observed field values with assumed measurement uncertainty (±5%).
Jmse 13 01586 g008
Figure 9. Comparison of simulated and observed blade area for Porphyra spp. during the winter cultivation period in Beein Bay. The blue line represents the simulated trajectory from the DEB model, and red markers indicate observed field values with assumed measurement uncertainty (±5%).
Jmse 13 01586 g009
Figure 10. Comparison of simulated dynamic carrying capacity and observed biomass for Porphyra spp. during the winter cultivation period in Beein Bay. The blue line represents the simulated carrying capacity from the DEB model, and red markers indicate observed field biomass values with assumed measurement uncertainty (±5%).
Jmse 13 01586 g010
Simulated values were generated using the full DEB model under hourly environmental forcing. Observed values were obtained from field measurements in Beein Bay.

3.3. Sensitivity Analysis

To evaluate the influence of physiological parameters on model outputs, a local one-at-a-time (OAT) sensitivity analysis was conducted. In this approach, each parameter was individually perturbed by ±10% while holding all other parameters constant, and the resulting changes in key output variables—structural biomass ( M V ), blade area, and carrying capacity (K)—were quantified. Percentage changes were calculated based on the peak or final value of each output over the simulation period.
Figure 11 presents the results as a tornado plot, illustrating the normalized average response magnitude for each parameter across all outputs. Among the tested parameters, the maximum carrying capacity (Kmax) exhibited the highest sensitivity, producing up to 12% variation in K and 8% in M V . The recycling efficiency ( k E i ) also significantly influenced the carrying capacity, emphasizing the role of rejected flux reallocation under nutrient-limited conditions.
The maximum carbon assimilation rate ( j E C m ) and the reserve turnover rates ( k E C ,   k E N ) had moderate effects on biomass and reserve dynamics. Conversely, temperature-related parameters such as the Arrhenius temperature ( T A ) and thermal tolerance thresholds ( T L ,   T H ) had negligible influence within the observed environmental range (3–14 °C).
These findings highlight the dominant roles of nutrient assimilation and reserve dynamics in Porphyra growth modeling. Parameters with higher sensitivity should be prioritized for empirical calibration or targeted experimentation to enhance predictive reliability.

4. Discussion

This study developed and validated a Dynamic Energy Budget (DEB) model for Porphyra spp., effectively capturing the physiological and environmental interactions that drive biomass production in Korean coastal aquaculture systems [32]. The model accurately reproduced seasonal growth dynamics observed in the field, including the characteristic biphasic pattern of rapid early growth followed by saturation as biomass accumulation increased and environmental limitations intensified [32]. Similar seasonal fluctuations have been reported in Macrocystis pyrifera, which shows strong spring growth and late-season decline [32,33]. The model demonstrated stable performance under daily environmental forcing, supporting its utility for time-series applications [34].
During the early growth phase, favorable light and temperature conditions and low maintenance costs supported rapid biomass accumulation [35]. As structural biomass increased, rising maintenance demands and self-shading reduced the light absorption per unit blade area, a morphology–light interaction well documented in macroalgae [35]. At the same time, declining nitrate availability led to progressive nitrogen limitation; similar seasonal constraints have been documented in Saccharina cultivation [34]. Although this study did not simulate fluxes such as ϕR or JO2 explicitly, the conceptual transitions in limitation align with previous DEB-based macroalgal studies [23,24]. Likewise, Broch and Slagstad emphasized the utility of dynamic reserve modeling in simulating seasonal growth and tissue composition in Saccharina latissima [36].
Sensitivity analysis revealed that carrying capacity (Kmax) and the reserve recycling fraction (κEi) were the most influential parameters [24]. For instance, a ±10% perturbation in Kmax resulted in an up to 12% variation in modeled carrying capacity, while changes in κEi led to ~10% variation in total biomass output [24]. The turnover rates of carbon (kEc) and nitrogen (kEN) reserves affected the magnitude and timing of growth, while photosynthetic parameters such as photon absorption cross-section (αl) and photosynthetic unit (PSU) density (ρPSU) notably influenced blade area expansion [24]. Notably, the strong influence of κEi suggests that minor changes in reserve reallocation under nutrient-limited conditions may have large impacts on productivity [37].
Compared to traditional empirical or regression-based models commonly used in macroalgal aquaculture [2,17], this DEB model offers greater mechanistic transparency, linking environmental forcing directly to energy allocation pathways and enabling biologically grounded predictions. While a logistic blade-area-based carrying capacity function was included, no spatial simulation or quantitative capacity estimation was performed here [38].
Nevertheless, several simplifications limit the model’s scope. Reproductive allocation and tissue loss were excluded, likely explaining deviations between simulated and observed biomass during late-season decline [5]. Environmental constraints such as thermal or nutrient stress near southern range limits have been shown to reduce productivity [39]. Physiological changes in maturation, senescence, or epiphyte load could be captured in future model extensions by adding reproductive compartments or variable canopy optical properties [40].
Despite these limitations, the model provides a robust framework for predictive applications [24]. Its compatibility with time-series environmental data enables integration with hydrodynamic or spatially explicit models, opening possibilities for farm-scale nutrient dynamics simulations, spatial yield optimization, and management strategy evaluation under climate variability [38]. The model structure is also suitable for decision-support tools in site selection, stocking density optimization, and aquaculture zoning.
In summary, this study demonstrates the feasibility and value of a DEB-based modeling approach for red seaweed aquaculture. By combining mechanistic rigor with numerical stability, the model enhances our ability to understand and manage Porphyra cultivation in dynamic and environmentally variable coastal systems.

5. Conclusions

This study presents a physiologically grounded Dynamic Energy Budget (DEB) model for Porphyra spp. aquaculture, mechanistically linking environmental drivers such as temperature, irradiance, and nutrient concentrations with internal energy storage, reserve turnover, and biomass production. The model successfully reproduced observed seasonal growth patterns, with RMSE values typically within ±10%, and demonstrated robust numerical stability under varying temporal resolutions. It also provided interpretable insights into seasonal growth limitations imposed by light availability and nutrient dynamics.
By explicitly simulating carbon and nitrogen reserve fluxes, maintenance costs, and a density-dependent carrying capacity, the framework captures macroalgal physiological responses under fluctuating environmental regimes. Sensitivity and flux diagnostics highlighted key parameters—such as carrying capacity, reserve recycling efficiency, and reserve turnover rates—that influence productivity. These findings can guide future efforts in empirical calibration and experimental design for parameter refinement.
The model is adaptable to diverse applications, including aquaculture yield optimization, nutrient load assessment, and ecosystem-based management strategies. Incorporating reproductive allocation, tissue senescence, and morphological plasticity in future model versions would enhance predictive accuracy, especially during late-season decline phases. This would support the development of site-specific decision-support tools for stocking density planning, harvest timing, and environmental impact mitigation in Porphyra cultivation.
Overall, this work delivers a novel modeling approach that bridges physiology and resource management, supporting the sustainable expansion of seaweed aquaculture in Korea and beyond.

Author Contributions

D.H.T.: Writing—Original Draft, Formal Analysis, Data Curation, Conceptualization, Methodology. S.E.P.: Writing—Review and Editing, Validation, Supervision, Funding Acquisition. J.Y.L.: Writing—Review and Editing, Data Curation, Validation. All authors have read and agreed to the published version of the manuscript.

Funding

This work was supported by a grant from the National Institute of Fisheries Science, Korea [grant number R2025043]. The funders had no role in study design, data collection, analysis, interpretation of data, writing of the report, or decision to submit the article for publication.

Data Availability Statement

The datasets generated and analyzed in the present study are available from the corresponding author upon reasonable request.

Conflicts of Interest

The authors declare no conflicts of interest.

Abbreviations

The following abbreviations are used in this manuscript:
DEBDynamic Energy Budget
IMTAIntegrated multi-trophic aquaculture
RMSERoot-mean-square error
SUSynthesizing unit

References

  1. FAO. The State of World Fisheries and Aquaculture 2022. In Towards Blue Transformation; Food and Agriculture Organization of the United Nations: Rome, Italy, 2022. [Google Scholar]
  2. Duarte, P.; Ferreira, J.G. A model for the simulation of macroalgal population dynamics and productivity. Ecol. Model. 1997, 98, 199–214. [Google Scholar] [CrossRef]
  3. Krause-Jensen, D.; Duarte, C.M. Substantial role of macroalgae in marine carbon sequestration. Nat. Geosci. 2016, 9, 737–742. [Google Scholar] [CrossRef]
  4. Alleway, H.K.; Gillies, C.L.; Bishop, M.J.; Gentry, R.R.; Theuerkauf, S.J.; Jones, R. The ecosystem services of marine aquaculture: Valuing benefits to people and nature. BioScience 2019, 69, 59–68. [Google Scholar] [CrossRef]
  5. Gentry, R.R.; Lester, S.E.; Kappel, C.V.; Bell, T.W.; Stevens, J.; Gains, S.D. Exploring the potential for marine aquaculture to contribute to ecosystem services. Rev. Aquacult. 2019, 12, 499–512. [Google Scholar] [CrossRef]
  6. Froehlich, H.E.; Afflerbach, J.C.; Frazier, M.; Halpern, B.S. Blue growth potential to mitigate climate change through seaweed offsetting. Nat. Geosci. 2019, 12, 998–1000. [Google Scholar] [CrossRef]
  7. Ministry of Oceans and Fisheries. Korean Statistical Yearbook of Oceans and Fisheries. Ministry of Oceans and Fisheries: Sejong, Republic of Korea, 2023. [Google Scholar]
  8. Buschmann, A.H.; Camus, C.; Infante, J.; Neori, A.; Israel, Á.; Hernández-González, M.C.; Pereda, S.V.; Gomez-Pinchetti, J.L.; Golberg, A.; Tadmor-Shalev, N.; et al. Seaweed production: Overview of the global state of exploitation, farming and emerging research activity. Eur. J. Phycol. 2017, 52, 391–406. [Google Scholar] [CrossRef]
  9. Kim, J.K.; Yarish, C.; Hwang, E.K.; Park, M.; Kim, Y. Seaweed aquaculture: Cultivation technology, challenges and its ecosystem services. Algae 2017, 32, 1–13. [Google Scholar] [CrossRef]
  10. Kim, J.K.; Kraemer, G.P.; Neefus, C.D.; Chung, I.K.; Yarish, C. Effects of temperature and ammonium on growth, pigment production and nitrogen uptake by four species of Porphyra (Bangiales, Rhodophyta) native to the New England coast. J. Appl. Phycol. 2007, 19, 431–440. [Google Scholar] [CrossRef]
  11. Sohn, C.H.; Kim, J.H.; Lee, Y.S. Seasonal nitrogen dynamics and their effects on Porphyra spp. productivity in Korean coastal waters. Algae 2019, 34, 211–224. [Google Scholar]
  12. Harrison, P.J.; Hurd, C.L. Nutrient physiology of seaweeds: Application to aquaculture. Cah. Biol. Mar. 2001, 42, 71–82. [Google Scholar]
  13. Chen, X.; Yang, B.; Du, X.; Li, Q.; Li, Z.; Yang, Y.; Jiang, Z.; Zhu, Y.; Ni, H.; Miao, X. Rapid prediction of Porphyra photosynthetic pigments based on colorimetric parameters. Front. Sustain. Food Syst. 2025, 9, 1553250. [Google Scholar] [CrossRef]
  14. Zhang, W.; Pan, M.; Wang, P.; Xue, J.; Zhou, X.; Sun, W.; Hu, Y.; Shen, Z. Comparative analysis of XGB, CNN, and ResNet models for predicting moisture content in Porphyra yezoensis using near-infrared spectroscopy. Foods 2024, 13, 3023. [Google Scholar] [CrossRef]
  15. Soto, D.; Aguilar-Manjarrez, J.; Hishamunda, N. (Eds.) Building an Ecosystem Approach to Aquaculture. Proceedings of the FAO/Universitat de les Illes Balears Expert Workshop, Palma de Mallorca, Spain, 7–11 May 2007; FAO Fisheries and Aquaculture Proceeding No. 14; Food Agriculture Organization of the United Nations: Rome, Italy, 2008. [Google Scholar]
  16. Grant, J.; Bacher, C.; Cranford, P.J.; Guyondet, T.; Carreau, M. A spatially explicit ecosystem model of seston depletion in dense mussel culture. J. Mar. Syst. 2008, 73, 155–168. [Google Scholar] [CrossRef]
  17. Petrell, R.J.; Tabrizi, K.M.; Harrison, P.J.; Druehl, L.D. Mathematical model of Laminaria production near salmon farm. J. Appl. Phycol. 1993, 5, 1–14. [Google Scholar] [CrossRef]
  18. Kooijman, S.A.L.M. Dynamic Energy Budget Theory for Metabolic Organisation; Cambridge University Press: Cambridge, UK, 2010. [Google Scholar]
  19. Lika, K.; Kearney, M.R.; Kooijman, S.A.L.M. The covariation method for estimating DEB model parameters I: Philosophy. J. Sea Res. 2011, 66, 270–277. [Google Scholar] [CrossRef]
  20. van der Meer, J. An introduction to dynamic energy budget (DEB) models with special emphasis on parameter estimation. J. Sea Res. 2006, 56, 85–102. [Google Scholar] [CrossRef]
  21. Pu, T.; Keretz, S.S.; Elgin, A.K.; Godwin, C.J.; Rowe, M.D.; Carrick, H.J.; Glyshaw, P.W.; Pietscher, R.M.; Vanderploeg, H.A. Dynamic energy budget (DEB) parameter estimation for the globally invasive Quagga Mussel (Dreissena rostriformis bugensis). Ecol. Model. 2025, 505, 111100. [Google Scholar] [CrossRef]
  22. Lanjouw, M.; Jansen, H.M.; van der Meer, J. Exploring aquaculture related traits of the grooved carpet shell (Ruditapes decussatus) in relation to other bivalve species using Dynamic Energy Budget theory. Ecol. Model. 2024, 498, 110883. [Google Scholar] [CrossRef]
  23. Venolia, C.T.; Lavaud, R.; Green-Gavrielidis, L.A.; Thornber, C.; Humphries, A.T. Modeling the growth of sugar kelp (Saccharina latissima) using DEB theory. Ecol. Modell. 2020, 430, 109151. [Google Scholar] [CrossRef]
  24. Lavaud, R.; Filgueira, R.; Nadeau, A.; Steeves, L.; Guyondet, T. A dynamic energy budget model for the macroalga Ulva lactuca. Ecol. Modell. 2020, 418, 108922. [Google Scholar] [CrossRef]
  25. Filgueira, R.; Grant, J.; Strand, Ø. A comparison of shellfish carrying capacity determination tools: A case study in Sungo Bay, China. Aquaculture 2014, 434, 484–494. [Google Scholar]
  26. Axelsson, L.; Mercado, J.; Figueroa, F. Utilization of HCO3 at high pH by the brown macroalga Laminaria saccharina. Eur. J. Phycol. 2000, 35, 53–59. [Google Scholar] [CrossRef]
  27. Ahn, O.; Petrell, R.J.; Harrison, P.J. Ammonium and nitrate uptake by Laminaria saccharina and Nereocystis luetkeana originating from a salmon sea cage farm. J. Appl. Phycol. 1998, 10, 333–340. [Google Scholar] [CrossRef]
  28. Bolton, J.J.; Lüning, K. Optimal growth and maximal survival temperatures of Atlantic Laminaria species in culture. Mar. Biol. 1982, 66, 89–94. [Google Scholar] [CrossRef]
  29. Boden, G.T. The effect of depth on summer growth of Laminaria saccharina (Phaeophyta). Phycologia 1979, 18, 405–408. [Google Scholar] [CrossRef]
  30. MOF; NIFS; GIST; KIOST. National Report on the Carbon Absorption and Ecosystem Services of Seaweed Farming in Korea; Ministry of Oceans and Fisheries: Busan, Republic of Korea, 2021. (in Korean) [Google Scholar]
  31. Soetaert, K.; Petzoldt, T.; Setzer, R.W. Solving differential equations in R: deSolve package. J. Stat. Softw. 2010, 33, 1–25. [Google Scholar] [CrossRef]
  32. Brown, M.T.; Nyman, M.A.; Keogh, J.A.; Chin, N.K.M. Seasonal growth of the giant kelp Macrocystis pyrifera in New Zealand. Mar. Biol. 1997, 129, 417–424. [Google Scholar] [CrossRef]
  33. Bell, L.E.; Kroeker, K.J. Standing crop, turnover, and production dynamics of Macrocystis pyrifera and understory species in high-latitude giant kelp forests. J. Phycol. 2022, 58, 773–788. [Google Scholar] [CrossRef]
  34. Handa, A.; Forbord, S.; Wang, X.; Broch, O.J.; Dahle, S.W.; Størseth, T.R.; Reitan, K.I.; Olsen, Y.; Skjermo, J. Seasonal- and depth-dependent growth of Saccharina latissima near salmon aquaculture. Aquaculture 2013, 414, 191–201. [Google Scholar] [CrossRef]
  35. Johansson, G.; Snoeijs, P. Macroalgal photosynthetic responses to light in relation to thallus morphology and depth zonation. Mar. Ecol. Prog. Ser. 2002, 244, 63–72. [Google Scholar] [CrossRef]
  36. Broch, O.J.; Slagstad, D. Modelling seasonal growth and composition of the kelp Saccharina latissima. J. Appl. Phycol. 2012, 24, 759–776. [Google Scholar] [CrossRef]
  37. Heinrich, S.; Valentin, K.; Frickenhaus, S.; John, U.; Wiencke, C. Transcriptomic analysis of acclimation to temperature and light stress in Saccharina latissima (Phaeophyceae). PLoS ONE 2012, 7, e44342. [Google Scholar] [CrossRef]
  38. van Oort, P.A.J.; Verhagen, A.; van der Werf, A.K. Can seaweeds feed the world? Modelling global offshore seaweed production potential. Ecol. Model. 2023, 484, 110486. [Google Scholar] [CrossRef]
  39. Brady-Campbell, M.M.; Campbell, D.B.; Harlin, M.M. Productivity of kelp (Laminaria spp.) near the southern limit in the NW Atlantic. Mar. Ecol. Prog. Ser. 1984, 18, 79–88. [Google Scholar] [CrossRef]
  40. Gerard, V.A. Ecotypic differentiation in light-related traits of the kelp Macrocystis pyrifera. Mar. Biol. 1988, 97, 25–36. [Google Scholar] [CrossRef]
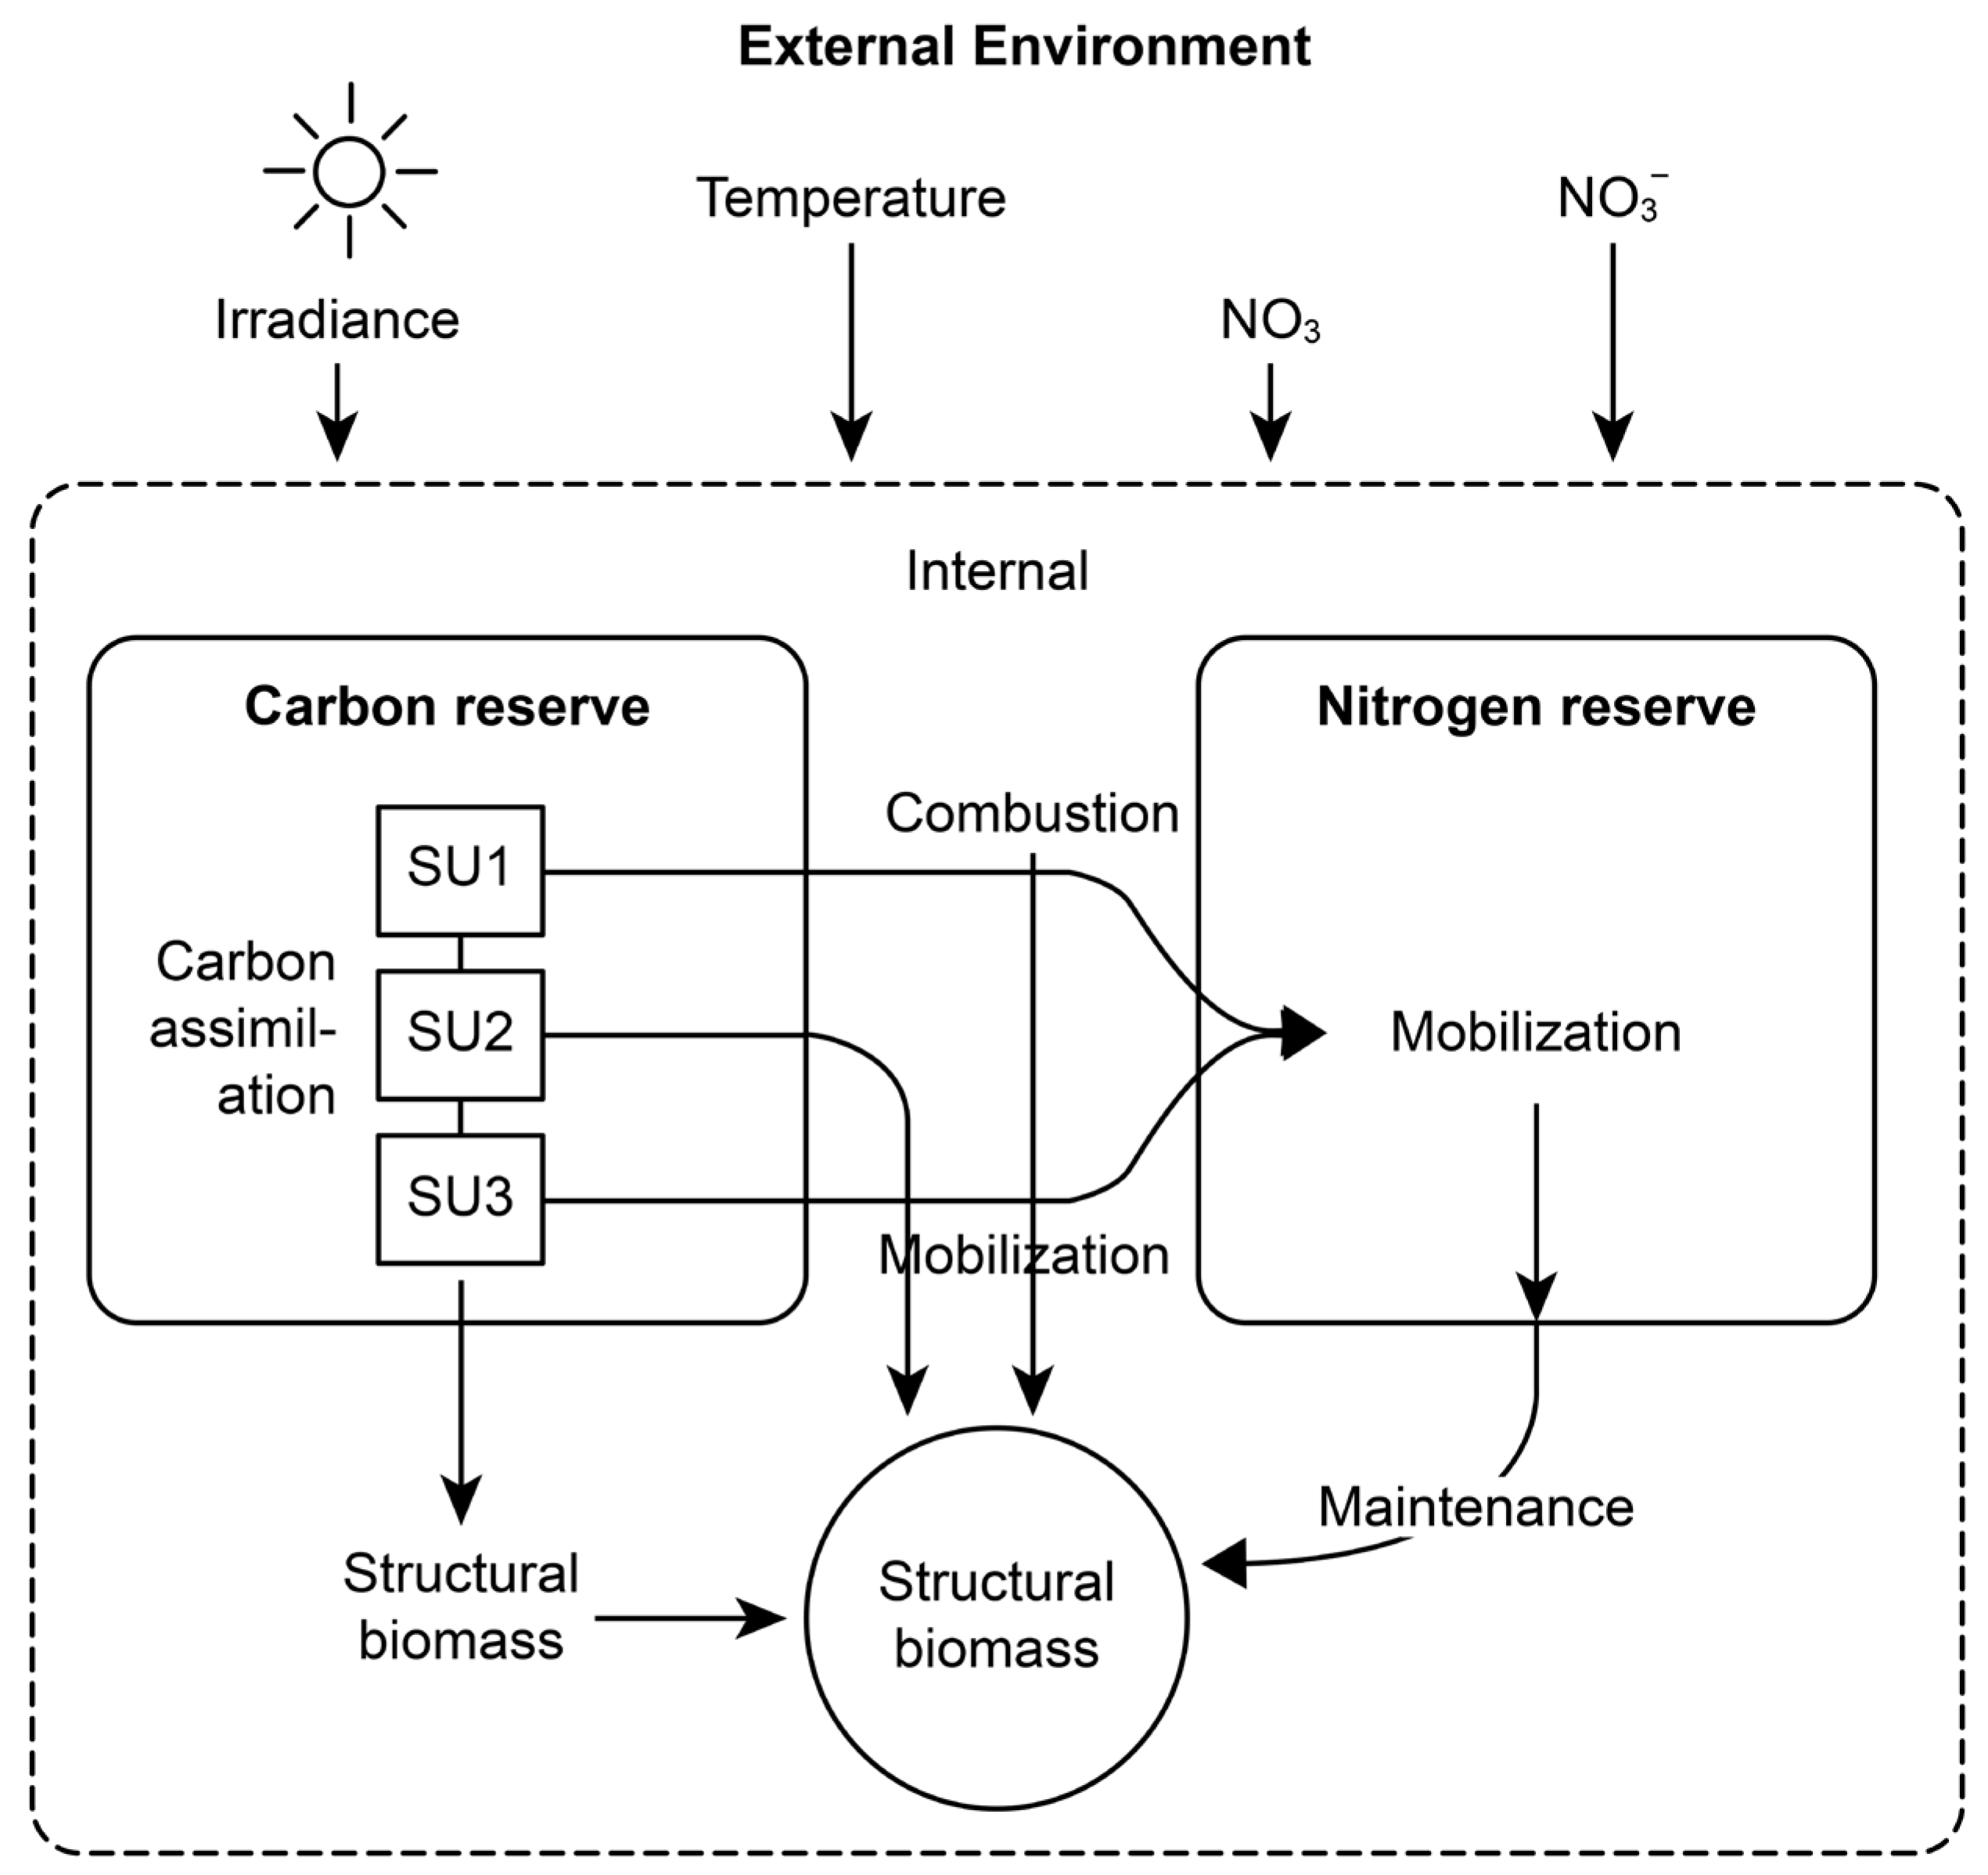
Figure 1. Conceptual diagram of the DEB model applied to Porphyra spp., illustrating the flow of environmental inputs (irradiance, temperature, CO2, and NO3) into internal reserves and structural biomass.
Jmse 13 01586 g001
Figure 2. Geographic location of Beein Bay, the study site used for simulating seaweed aquaculture dynamics. The base map is sourced from Google Maps (Google LLC, Mountain View, CA, USA).
Jmse 13 01586 g002
Figure 3. Time series of solar radiation (MJ m−2) measured at Jeonju, Sunchang, and Gochang from December 2021 to March 2022.
Jmse 13 01586 g003
Figure 11. Tornado plot of sensitivity analysis, showing the percentage change in model outputs in response to ±10% perturbation of each physiological parameter. Each bar represents the effect on structural biomass (blue), carrying capacity (orange), and blade area (green). Results highlight the strong influence of Kmax and k E i , whereas temperature-related parameters ( T A ,   T L ,   T H ) had minimal effects under the observed environmental conditions.
Jmse 13 01586 g011
Table 1. Summary of environmental and biological parameters observed at Beein Bay, based on the 2021 national monitoring report.
Environmental DataValueUnit
Temperature8.3–9.2°C
Salinity28.9–31.7PSU
DIN1.67–11.19µM
DIP0.05–0.79µM
Light intensity0.952–1.4μmol m−2 s−1
Rainfall0mm
Growth rate0.405–1.206d−1
Blade area31.3–199.7m2
Biomass0.071–0.2g
Carbon content0.026–0.05G
Nitrogen content0.002–0.008g
C/N ratio6.57–16.88-
Chlorophyll0.54–3.21µg L−1
Primary production0.12–2500µgC L−1 h−1
CO20.119–1.5µM
NO30.02–0.143µM
Table 2. DEB model parameters.
ParameterDescriptionValueUnitSource
j_E_CmMax specific carbon assimilation rate0.002mol L−1 h−1This study
j_EN_AmMax specific nitrogen assimilation rate0.00015mol L−1 h−1This study
K_NHalf-saturation constant for NO3 uptake0.8mol L−1This study
j_CO2_mMax CO2 uptake rate0.102mol L−1 h−1Calibrated
K_maxMax carrying capacity1gThis study
max_blade_areaMax blade area100cm2This study
max_m_EiMax reserve mass0.08gThis study
K_cHalf-saturation constant for CO20.0000001mol L−1[23]
ρ_PSUPhotosynthetic unit density0.5-[23]
b1Photon binding probability0.5-[23]
alpha_KLight saturation constant0.2-This study
α_lPhoton cross-section1m2 mol−1[23]
k_IPhotosynthate dissociation rate0.075h−1[23]
y_ICYield of C reserve per photon10mol C mol−1 photon[23]
y_CO2CYield of C reserve per CO21mol C mol−1 CO2[23]
y_IO2Yield of O2 per photon0.125mol O2 mol−1 photon[23]
kappaFraction of mobilized energy to soma0.2-This study
k_ENN reserve turnover rate0.05h−1This study
k_ECC reserve turnover rate0.1h−1This study
k_MMaintenance rate coefficient0.02h−1[18]
j_E_VMVolume-specific maintenance (N)0.000004mol L−1 h−1[23]
j_E_CMVolume-specific maintenance (C)0.05mol L−1 h−1[23]
y_EVYield of N reserve to structure0.06mol N mol−1 V[23]
y_EC_VYield of C reserve to structure0.5mol C mol−1 V[23]
κ_EiFraction of rejection flux to reserve1-[23]
T_AArrhenius temperature6000K[18]
T_0Reference temperature278.15K[18]
T_HUpper boundary of tolerance288.15KThis study
T_LLower boundary of tolerance275.15KThis study
T_AHArrhenius temp above T_H15,000K[18]
T_ALArrhenius temp below T_L4391.9K[18]
w_VMolar weight of structure29.89g mol−1[18]
w_ECMolar weight of C reserve54g mol−1[18]
w_ENMolar weight of N reserve17g mol−1[18]
w_O2Molar weight of O232g mol−1[18]
K_decayDecay coefficient (exp model)0.3-Calibrated
T_decayTemp stress threshold0.01-Calibrated
I_decayLight stress threshold0.001-Calibrated
decay_coeffOverall decay rate0.12-Calibrated
Table 3. RMSE of structural biomass ( M V ) against the 4000-step reference simulation under different time resolutions.
Time Step Count RMSE (vs. 4000 Step)
5005.29 × 10−4
10002.14 × 10−4
20006.96 × 10−5
4000
Disclaimer/Publisher’s Note: The statements, opinions and data contained in all publications are solely those of the individual author(s) and contributor(s) and not of MDPI and/or the editor(s). MDPI and/or the editor(s) disclaim responsibility for any injury to people or property resulting from any ideas, methods, instructions or products referred to in the content.