Article

Study on the Influence of Fluid Fields on the Impact Force of Ships Colliding with Bridges

1
College of Civil Engineering, Nanjing Tech University, Nanjing 210037, China
2
School of Naval Architecture and Ocean Engineering, Huazhong University of Science & Technology, Wuhan 430074, China
3
Shanghai Merchant Ship Design and Research Institute, Shanghai 201210, China
4
School of Naval Architecture, Ocean and Energy Power Engineering, Wuhan University of Technology, Wuhan 430062, China
*
Author to whom correspondence should be addressed.
J. Mar. Sci. Eng. 2025, 13(8), 1573; https://doi.org/10.3390/jmse13081573
Submission received: 26 June 2025 / Revised: 31 July 2025 / Accepted: 8 August 2025 / Published: 16 August 2025
(This article belongs to the Section Ocean Engineering)

Abstract

This study employs a fluid–structure interaction (FSI) collision-modeling approach to investigate the hydrodynamic effects on impact forces during collisions involving ships and bridges. The influences of the collision speed, the mass of the ship, and the water-flow velocity on the impact force are investigated. The constant added-mass (CAM) method is a widely employed technique in relevant studies to account for water influence due to its efficiency in conserving computational resources and reducing analysis time. This method is also employed in numerical simulations for comparative analysis. The impact force and dynamical response of a container ship using the FSI and CAM methods are investigated to determine whether the CAM method is suitable for considering the influence of the water surrounding the ship. The impact forces assessed by numerical simulations are also compared with the existing formulae. It is found that the water flow significantly affects the collision force, which must be taken into account in high-energy collision situations.

1. Introduction

This study employs a fluid–structure interaction (FSI) approach to investigate the hydrodynamic effects on impact forces during ship–bridge collisions [1,2]. The issue of ship–bridge collisions has received increasing attention [3,4]. It is essential to predict the impact loads of ships for the safety assessment of a bridge’s anti-collision structure performance.
Early research on ship–bridge collisions was rooted in experimental exploration. Based on experimental data in 1958, Minorsky [5] established an empirical correlation linking penetration resistance to energy dissipation during collisions. Woisin [6] revised Minorsky’s formula and put forward a new empirical equation for ship–bridge collisions. Carlebur [7] carried out a number of full-scale collision tests on ships. Predictions of damage to ship structures during collisions or groundings were verified using the results. Sha & Hao [8] conducted impact tests to assess the impact force and put forward empirical formulae to forecast the maximum force. Meanwhile, practical design guidelines began to emerge: the AASHTO [9] guide proposed a simplified method for determining equivalent static forces in barge impacts. The IABSE [3] released preliminary collision risk assessment guidelines in 1983, providing early operational references for engineering practice. In addition, the TB [10] and JTG [11] formulae were subsequently developed.
Impact force can differ greatly among various ship types despite having the same mass and impact velocity [12,13]. The advent of the numerical method has compensated for a lack of experimentation, and the reliability of the method has been proven [14,15]; it has been widely used in collision investigations between bridges and ships [16,17] or flotillas [18,19].
The fluid surrounding the ship influences its motion and dynamical response. The CAM method is typically employed in current studies to take into account hydrodynamic effects. Minorsky [5] advised that the added mass is 0.4 times the hull mass for transverse motion based on experimental results. Through a set of model experiments, Motora [20] showed that the additional mass of the vessel was not a constant value. Petersen [21] developed a numerical model for ship collisions that considered the transient effects of ship longitudinal and transverse swings and bow sway as well as hydrodynamic loads. The results show that the value of the transverse additional mass coefficient should be greater than 0.4 when calculating the deformation energy of a ship collision using the additional mass method. Pedersen & Zhang [22] proffered a series of CAM coefficients for the purpose of modeling the motion of ships in collisions. The coefficients were as follows: 0.05 for surge, 0.85 for sway, and 0.21 for yaw. Kim et al. [23] used the CAM method to compare the force and deformation of steel panels with experimental data.
Employing the Arbitrary Lagrangian–Eulerian (ALE) approach, Gagnon & Wang [24] resolved hydrodynamic interactions during laden tanker–bergy bit collisions through fully coupled fluid–structure simulations. Song et al. [25] utilized the FSI method to simulate ship–ship and ship–ice collisions. The findings revealed that the FSI method yields superior outcomes for the dynamics of floating structures. Chen et al. [26] conducted collision experiments between barge bows and bridge simulations considering superstructure inertia, soil–pile coupling, and hydrodynamic effects, and then developed triangular and multiple linear impact force models.
Ye et al. [27] found that the simplified CAM simulation considerably underestimated the impact duration and impulse in the case of an oblique angle collision despite the coefficient being large. The fluid–structure coupling approach could provide more information on collision scenarios and collision loads, resulting in more accurate calculation results. Their study revealed limitations of the CAM method in oblique ship–bridge collisions under static water conditions without considering the hydrodynamic effects of water current. Both the CAM and FSI methods have been applied to account for water influence in such collisions. However, their comparative effectiveness, especially the accuracy of collision force prediction under different collision conditions, has still not been fully explored. This study aims to identify the limitations and effectiveness of the CAM method in predicting collision force under varying conditions. The impact force and dynamical response of a container ship using the FSI and CAM methods are investigated to determine whether the CAM method is suitable for considering the influence of the water surrounding the ship. Factors including impact velocity, ship mass, and water-flow velocity that affect collision force are investigated to clarify the applicability of CAM in engineering practice.

2. Numerical Simulation of Container Ship and Bridge Collision

2.1. Description of the Container Ship

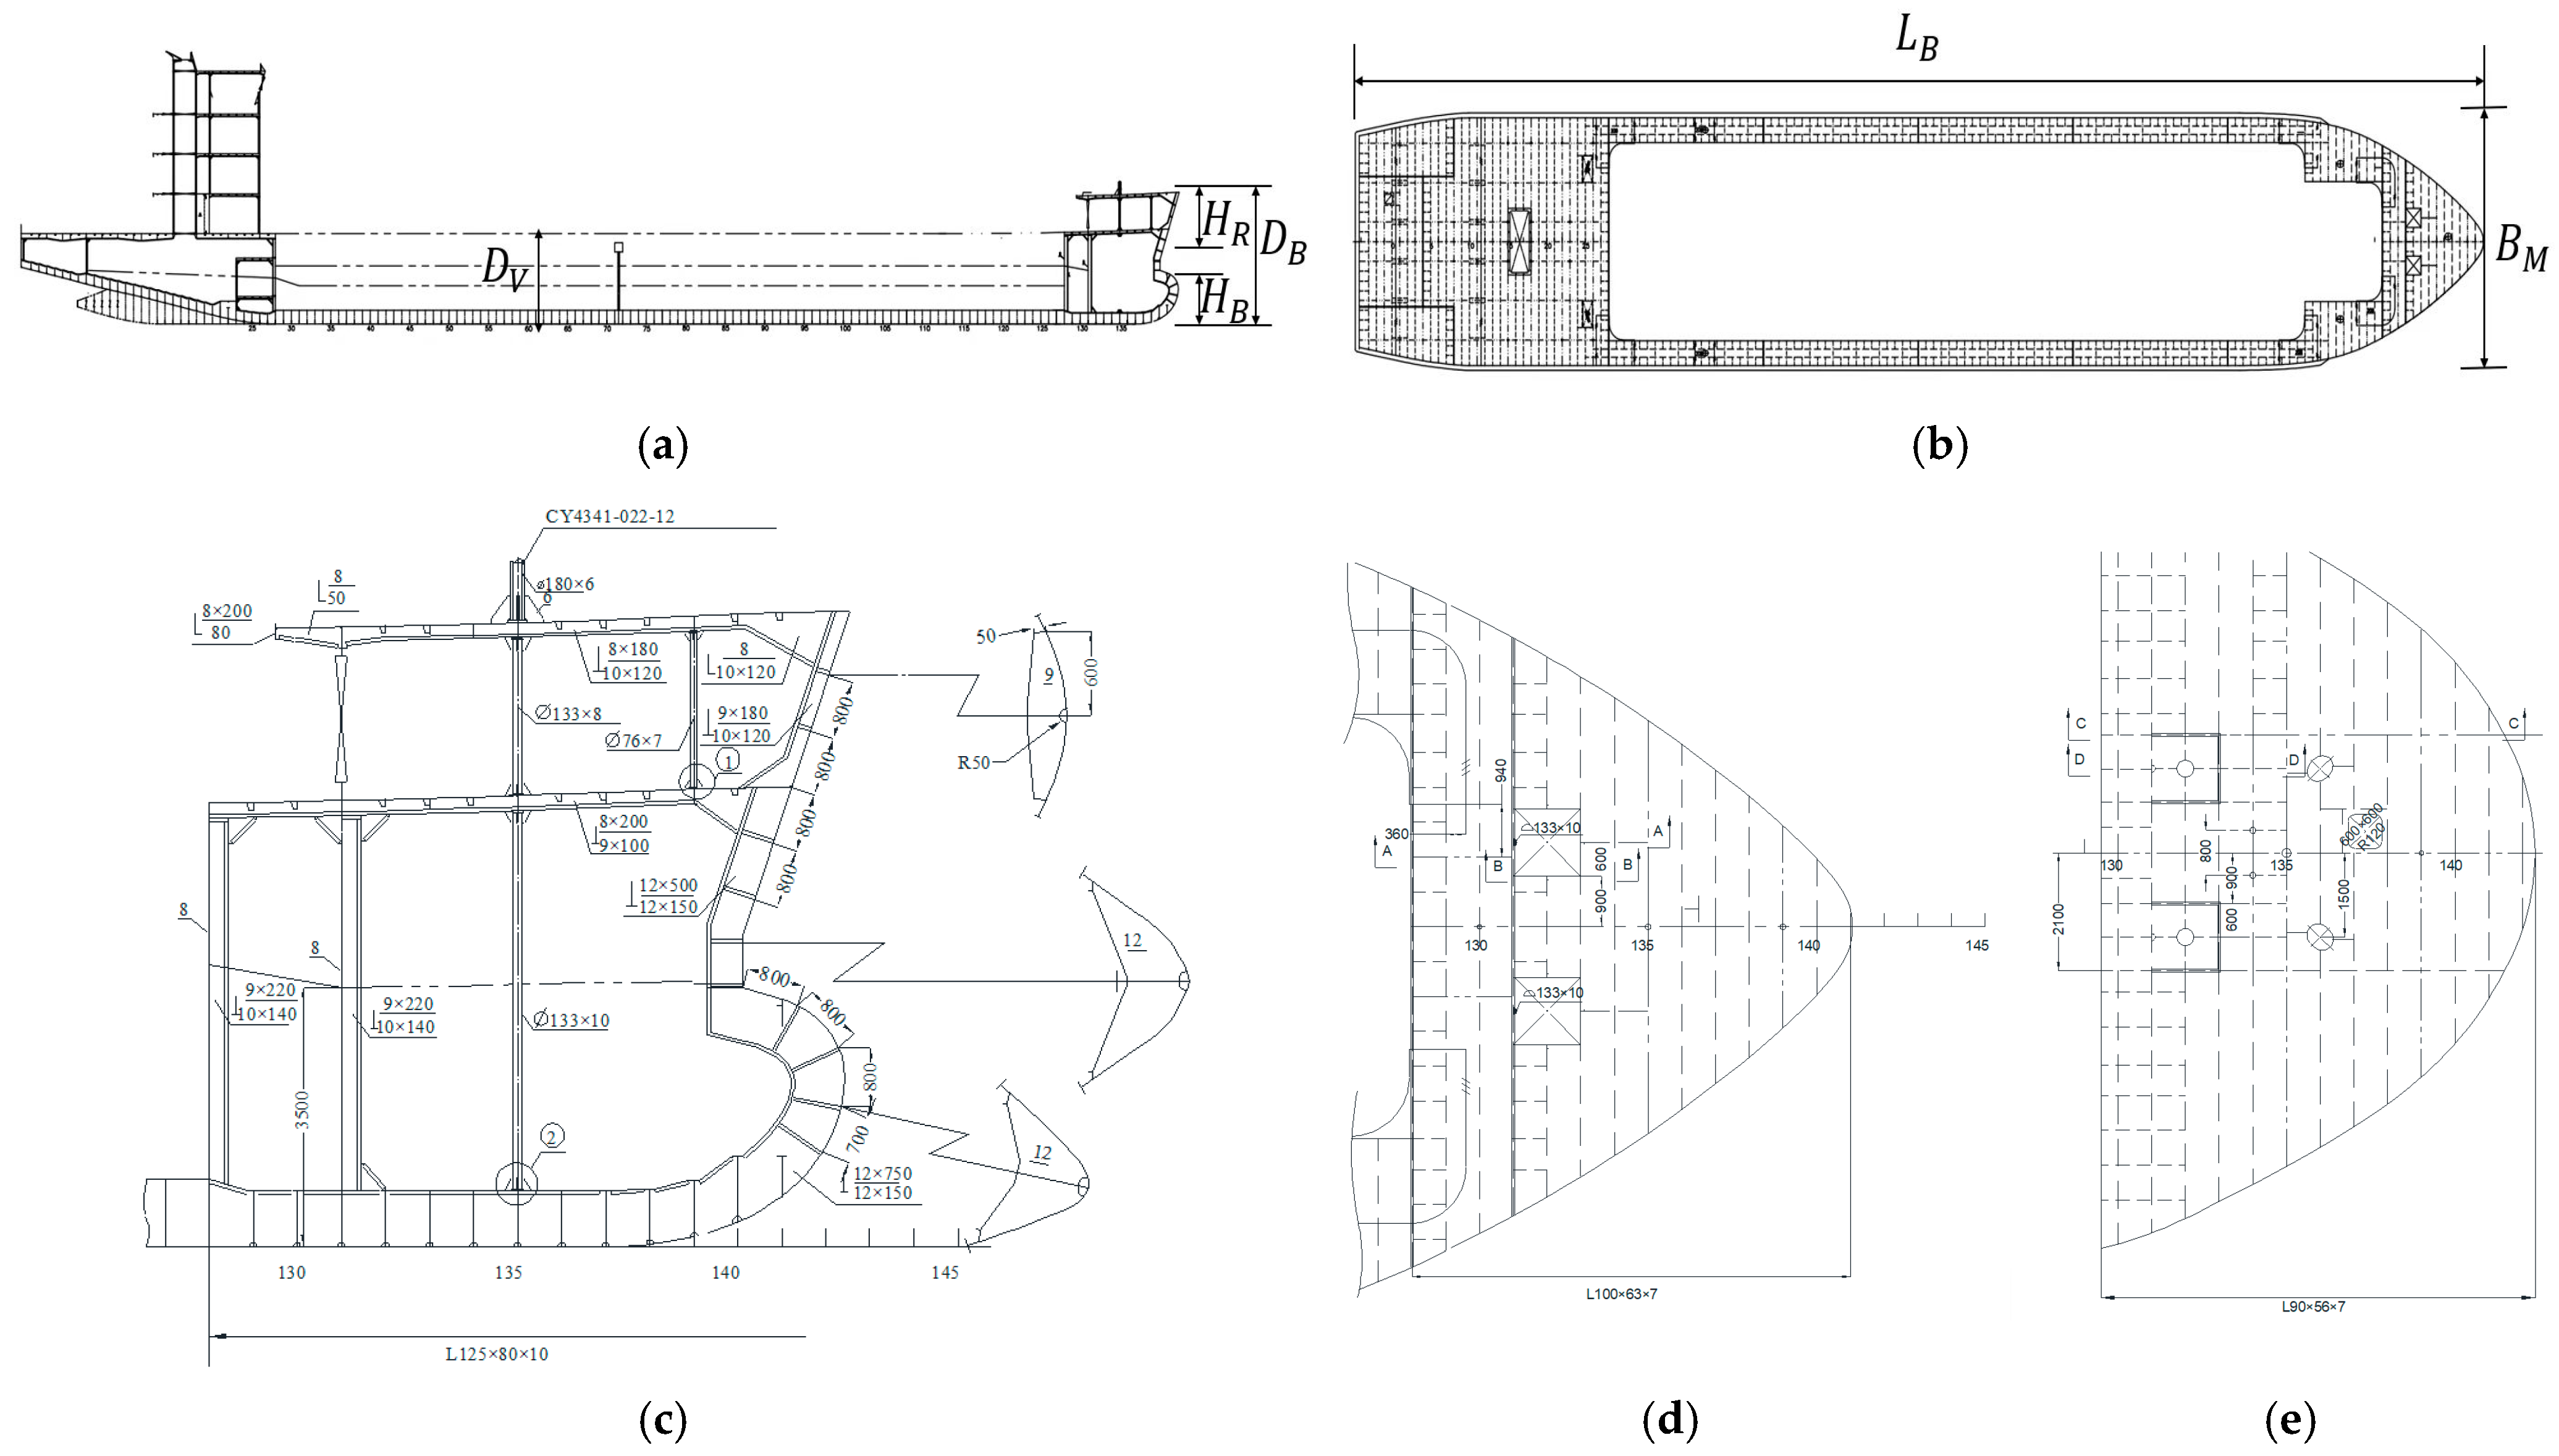
Based on AIS data, Pan et al. [28] statistically analyzed the weight displacement, navigation speed, and principal dimensions of ships passing the Yangtze River Bridge in China. The tonnage distributions of the passing ships are given in Figure 1, in which the average tonnage of the ship is around 3000 t. Hence, a container vessel with 3000 t DWT (Figure 2) is considered herein, and the corresponding overall length (LB), molded breadth (BM), depth (DB), and lightweight are 88.2 m, 15.6 m, 5.6 m, and 1012 t, respectively. The masses of the ship vary between 1000 t and 5000 t, which considers various load conditions including lightweight, deadweight, ballast load, and full-load displacement.

2.2. Finite-Element Models

In NORSOK N-004 [29], the anti-collision analysis in bridge design provides three strategies, which consider the relative stiffness between ship and bridge (Figure 3), namely ductile design, strength design, and shared energy design. LS-DYNA Solver R11 is utilized to simulate the collision process of the ship–bridge. The SHELL163 element with Belytschko–Tsay 4-node is used to model the deck, compartments, frame structures, and other plate structures of the hull. Alsos & Amdahl [30] suggested that the ratio of element size to plate thickness for shell elements should be between 5 and 10. The plate and stiffener of the ship bow use shell elements with 100 mm to capture the buckling and folding. The BEAM161 element with large displacements, rotations, and strains is used for the stiffener at the middle section of the ship. The number of shell and beam elements is 40,775 and 2186, respectively.
The *MAT_PLASTIC_KINEMATIC model is used to consider the elastoplasticity of the material. The Cowper–Symonds constitutive can consider the influence of strain rate and is employed as follows:
σ 0 σ 0 = 1 + ε ˙ B 1 f
where σ 0 represents the dynamically yielding stress under ductile strain rate ε ˙ , and σ 0 is the stress at static yield; B and f are constants [31]. The material properties are listed below: fracture strain is 0.3, Young’s modulus is 210 GPa, Poisson’s ratio is 0.3, and yield strength is 235 MPa.
The *INITIAL_VELOCITY keyword is used to apply the initial speed of the vessel. The striking ship is subjected to the gravity and buoyancy of water as well, which assumes the ship has lost engine power and is moving freely. The collision force principally depends on the kinetic energy and stiffness of the ship bow [32,33]. The main purpose of the present paper is to study the effect of the fluid surrounding ships on impact forces. The stiffness of the bridge is generally greater than that of the ship bow; hence, the bridge pier is assumed to be rigid to reduce the computational time using *MAT_RIGID. The dimensions of the bridge pier are 3.5 m in the longitudinal direction, 11.35 m in the transverse direction, and 20 m in height. The finite-element models of the container ship and bridge pier are plotted in Figure 4.

2.3. Modeling of the Water Surrounding the Ship

2.3.1. Constant Added-Mass Method (CAM)

The CAM method simplifies the consideration of hydrodynamic effects by converting the forces exerted by the surrounding fluid on the ship into inertial forces [34], which is often used in ship–bridge collision simulations to reduce computational resources. The added mass resulting from sway and yaw motions is frequently neglected in the case of head-on collisions. The additional mass coefficient can be determined by the following methods:
(1)
Theoretical calculation: A theoretical analysis is conducted based on fluid-mechanics principles and the geometric shape of the object, and the additional mass coefficient is estimated in conjunction with boundary conditions.
(2)
Empirical formulae and charts: Empirical formulae or charts from industry standard literature and research findings are used. These resources provide reference values for the additional mass coefficient of objects of different types and sizes at various speeds and attitudes.
(3)
Numerical simulation: Computational fluid dynamics (CFD) with high resolution is used to simulate the dynamic behavior of the ship in fluid to determine the additional mass effect.
(4)
Experiment: Using a physical model experiment in a tank to determine the added-mass coefficient by measuring the acting forces during motion, see Table 1.
For vessels traveling in a straight direction, the hydrodynamic mass coefficient is 0.05 for large underkeel clearances in the AASHTO requirement [9], which is adopted in the present paper. The mass of the ship in the simulation is the total of the original mass of the ship and the additional mass.

2.3.2. Fluid–Structure Interaction Method (FSI)

The FSI method can consider the interaction coupling between the ship and the fluid. The ALE method integrates the advantages of both the Lagrangian and Eulerian formulations and can overcome the numerical computational difficulties caused by the severe distortion of the element [36]. The ALE method can simulate the dynamic analysis of coupled fluids and structures and is used in the analysis of ship–bridge collisions. To study the FSI behavior, a penalty-based algorithm was utilized in the coupling [37]. The ship is coupled to the ALE fluid domain (water/air) using *CONSTRAINED_LAGRANGE _IN_SOLID, in which DIREC with 2 means the coupling is in the normal direction (only in the direction of compression), and CTYPE with 4 means the coupling is in the penalty function manner. Penalty scaling is reduced to 0.1 to minimize artificial energy dissipation. The INITIAL_VOLUME_FOR_FRACTION_GEOMETRY keyword is used to model the air field. Gravitational acceleration is also included. Under the action of gravity and buoyancy, the ship maintains balance at the waterline.
The MAT_NULL and EOS are both defined in the fluid field at the same time [37]. MAT_NULL is expressed as follows:
σ ij = μ ξ ij
where σ ij is deviatoric viscous stress, μ is the kinematic viscosity, and ξ ij represents the deviatoric strain rate.
The linear state equation of polynomial form is given as follows:
P = [ C 0 + C 1 μ + C 2 μ 2 + C 3 μ 3 ] + [ C 4 + C 5 μ + C 6 μ 2 ] E
P represents the stress, E is Internal energy per unit volume, and C1~C6 are constants.
The detailed parameters of the material and EOS can be found in Ref. [25]. Equations (2) and (3) consider the kinematic viscosity terms, since the range of water surrounding the ship is very wide and can be considered to be an infinite fluid field, which is simulated by non-reflecting boundary conditions with the BOUNDARY_NON_REFLECTING keyword. The inflow velocity boundaries and outflow velocity boundaries for the fluid are set by *BOUNDARY_PRESCRIBED_MOTION_SET. The fluid domain is set as 120 m in length and 30 m in width, and the heights of the air and water domains are set as 4 m and 6 m to consider the coupling between the ship and the surrounding fluid. The mesh size of the fluid domain is set as 1.2 m. The numbers of air and water domain elements are 15,000 and 22,500, respectively. The velocity of water flow is defined by inflow and outflow velocity boundaries in the longitudinal direction.
Chen et al. [37] compared the results of numerical simulation with the FSI method with the full-scale barge impact tests conducted on the St. George Island Seawall Bridge [38], as shown in Figure 5. It can be seen that the peak force and acceleration test results and simulation results are very close. The FSI modeling parameters and coupling algorithm applied in the present study are the same as those in Ref. [37].

2.4. Load Conditions

The influence of the velocity and mass of the striking ship and water-flow velocity on the dynamical response of ship collisions is considered herein. According to the statistics from AIS data, the range of the mass and speed of the vessels passing the bridge is mainly between 1000 and 5000 tons, and 1 m/s and 5 m/s for inland waterways. According to an investigation of the Yangtze River, the average speeds of downstream and upstream waters are 2 m/s and 4 m/s. Hence, the velocities of water flow with −4, −2, 0, 2, and 4 m/s are considered, in which the negative value is the direction of water flow opposite to the direction of ship movement, and the zero value means that the water is still. To explore the effect of ship draft, three cases with the same kinematic energy of 13.5 MJ are used, but their combinations of masses (1000 t, 3000 t, and 5000 t) and velocities (5.2 m/s, 3.0 m/s, and 2.3 m/s) are different. The load conditions are plotted in Table 2, in which Ms is the mass of the container vessel, Vf is the speed of water flow, and Vs is the impact speed of the vessel.

3. Numerical Results Analysis

3.1. Effect of Initial Distance

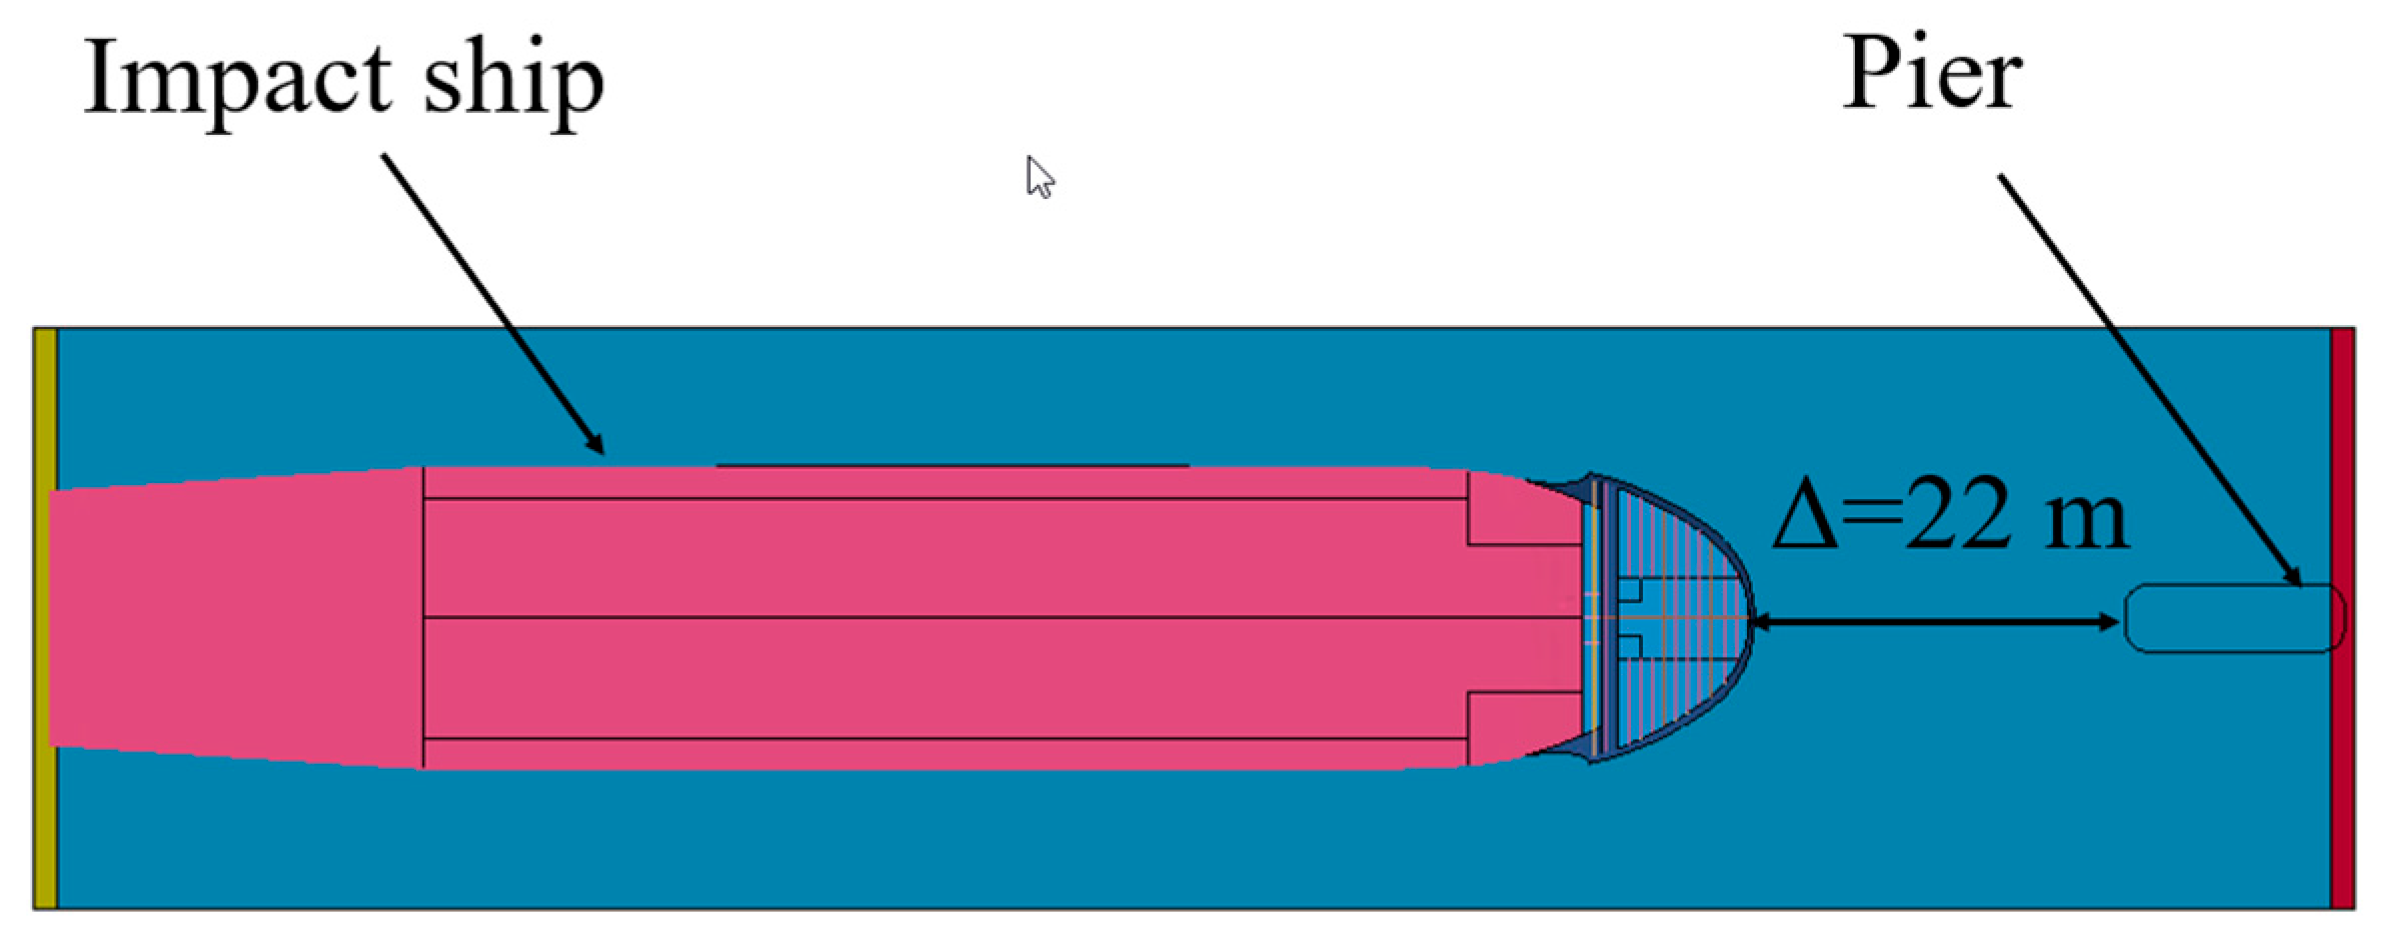
The movement of a ship before a collision could produce waves, which might influence the collision procedure [33]. To investigate the influence of waves caused by a ship’s movement, around 1/4 of the ship’s length of 22 m between the vessel and the bridge is considered (see Figure 6). The initial velocity of the ship with a 22 m length is set as 4.8 m/s with water velocity Vf = 0 m/s and displacement weight Ms = 3000 t. The time history of speed is illustrated in Figure 7. The speed of the ship is constantly falling. The velocity of the ship before impact, after traveling 22 m, is 2.3 m/s due to the resistance. For comparison, the other circumstance is that the initial speed of the ship close to the bridge is also set as 2.3 m/s.
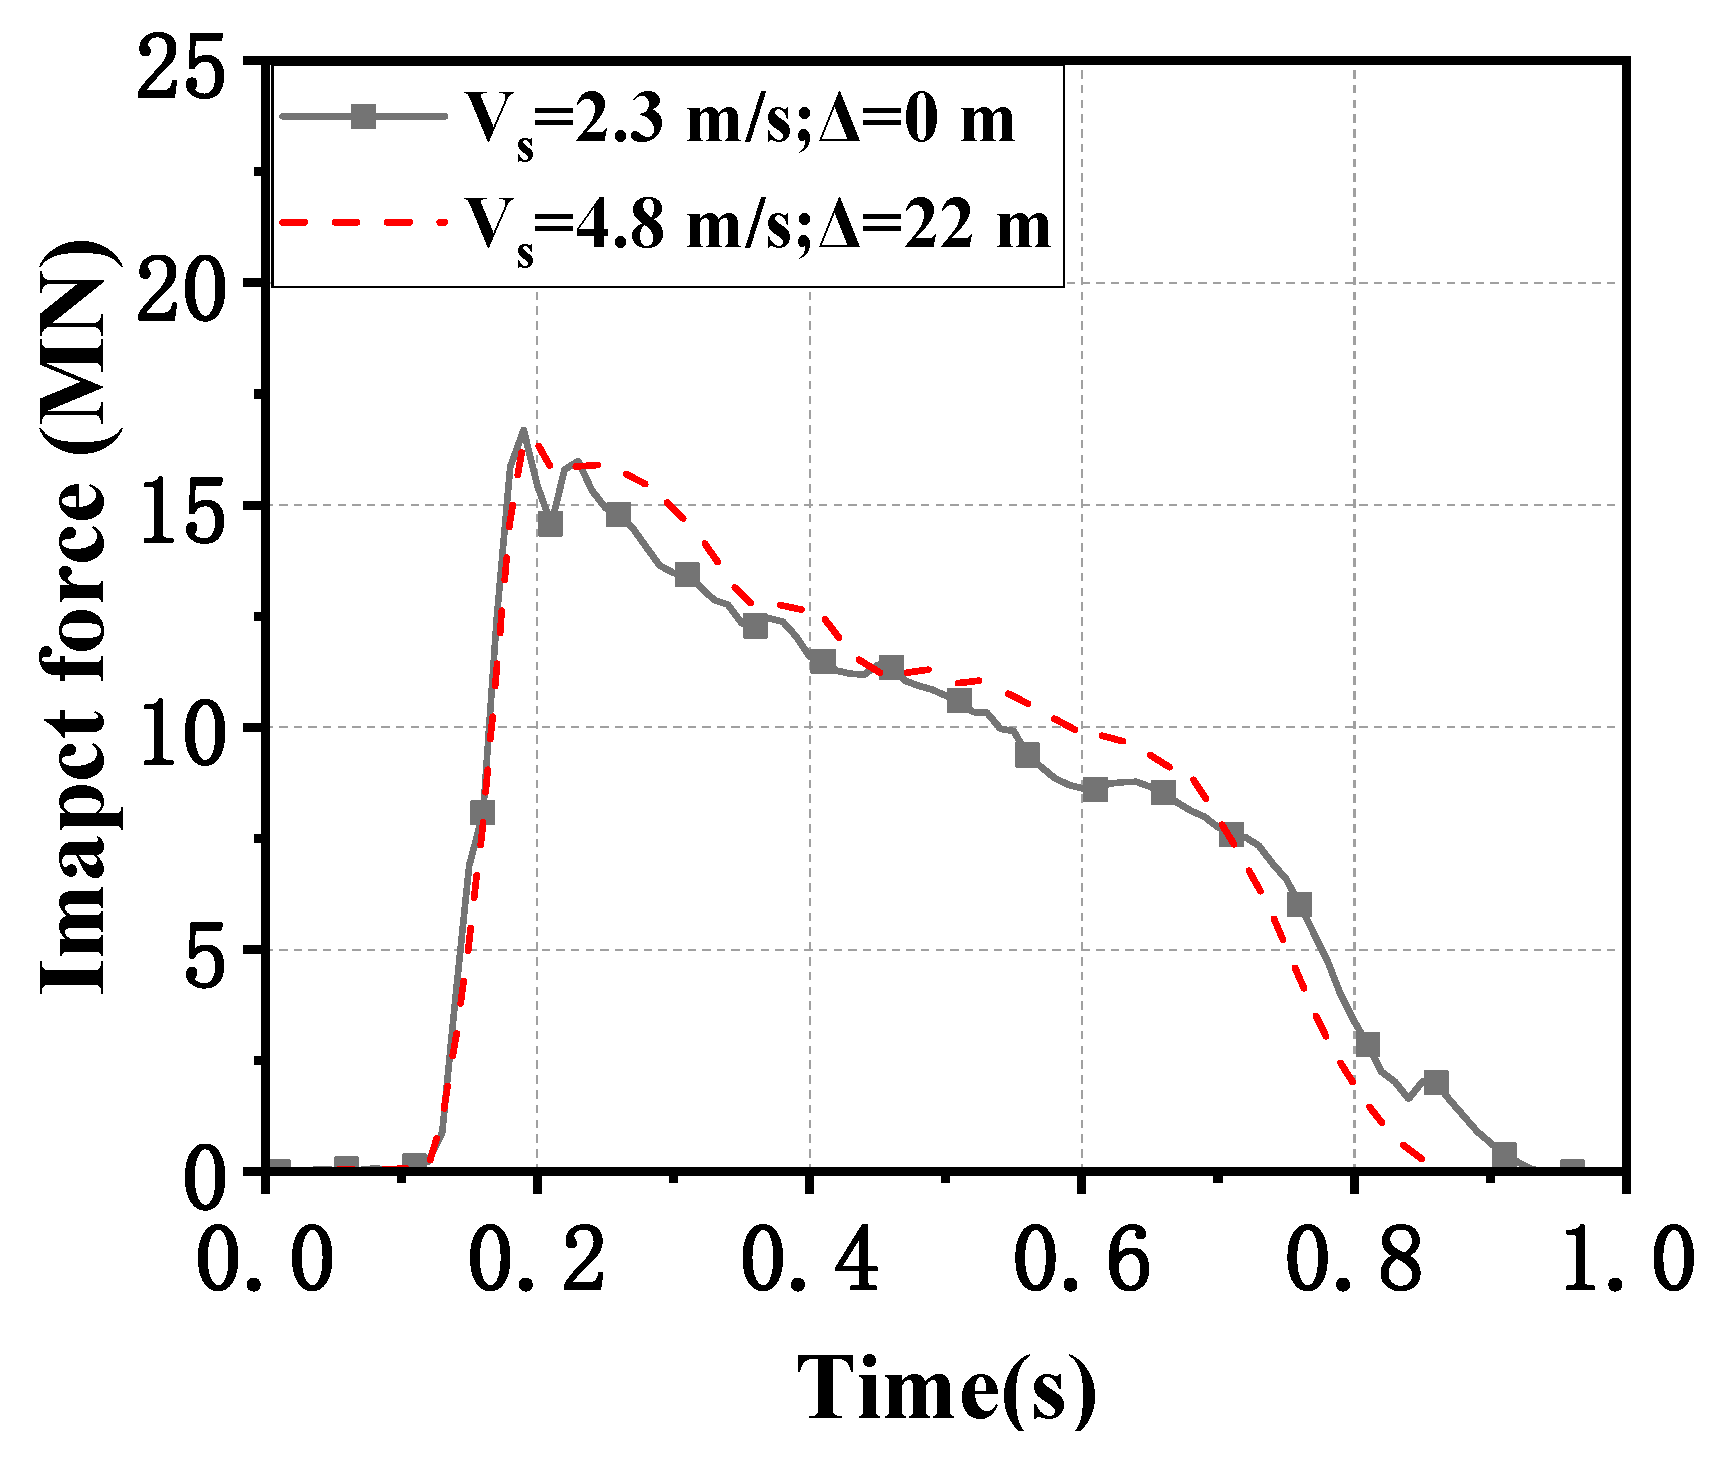
The time histories and maximum impact force and the duration at different impact distances in still water are similar to those shown in Figure 8. The initial distance between the ship and the bridge slightly affects the impact force. Specifically, the wave and current of fluid caused by the movement of the ship during sailing slightly influence the dynamic response. However, the calculation times are 142 h and 48 h for an initial distance of 22 m and 0 m. This indicates that the fluid field would significantly increase the computation resources, as expected. This difference is caused not only by the element number, but also by the coupling algorithm between the structure and fluid. Several factors lead to the large difference in CPU time: (1) The fluid domain causes an increasing number of elements; (2) In order to produce hydrodynamic interactions during the phase of nearing the pier, the FSI method needs to simulate the ship’s approach to the pier; (3) The ALE method needs additional advection, interface reconstruction, and coupling computation involved [37]. Hence, to save computation time, the initial distance between the striking ship and the bridge could be set as zero.

3.2. Effect of Impact Velocity

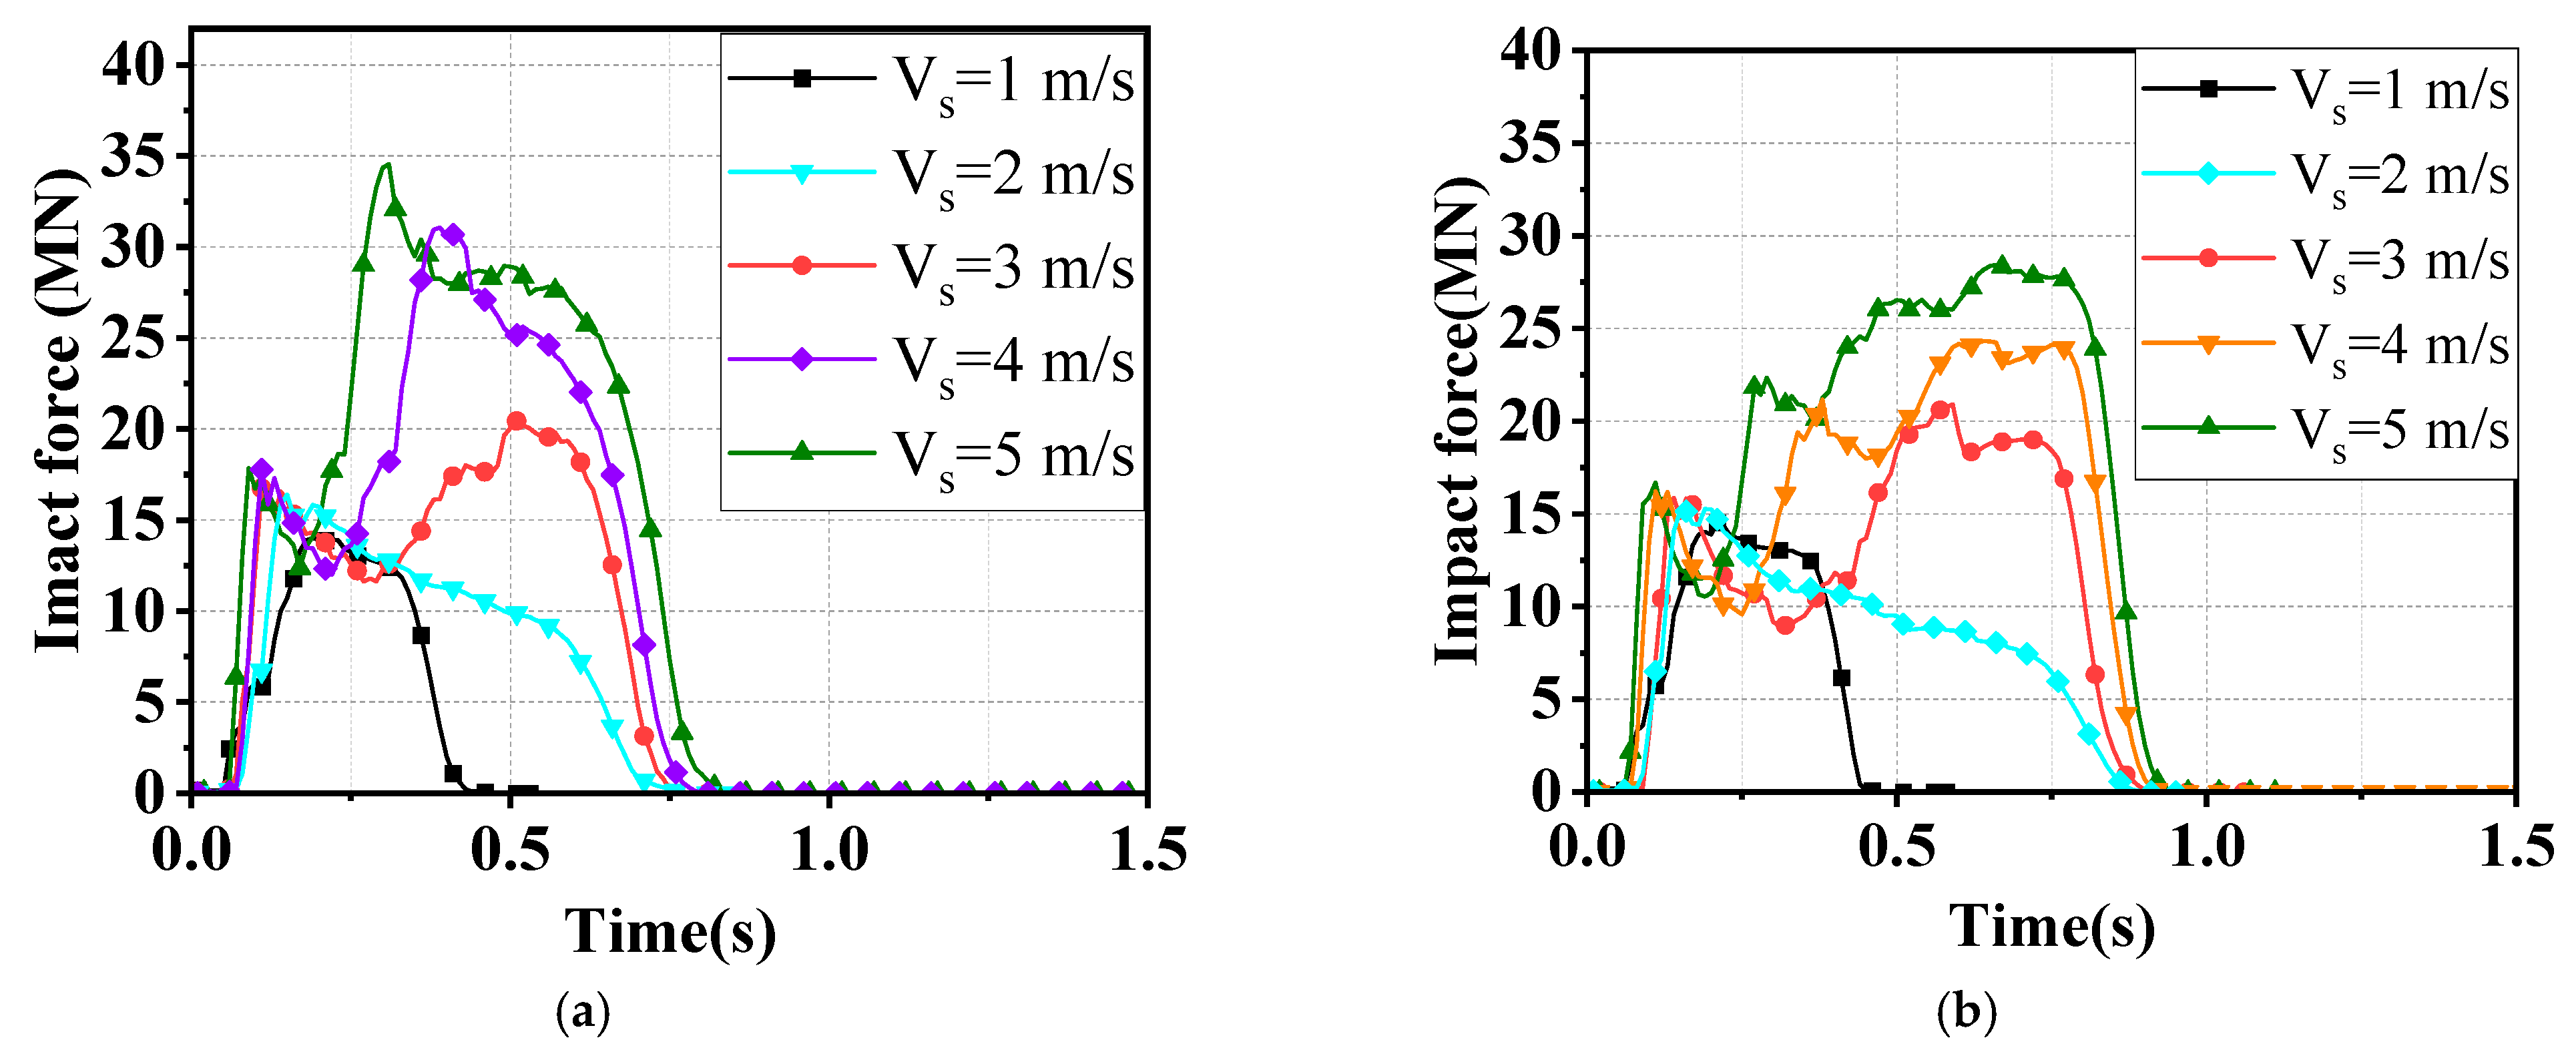
In this section, the FSI and CAM methods are both used in the numerical simulations for a ship of 3000 tons in still water (Vf = 0). The force–time curves for various impact speeds are shown in Figure 9. The impact durations with Vs = 2, 3, 4, and 5 m/s are almost the same, which are significantly larger than that of Vs = 1 m/s. The impact durations do not change linearly with the impact speed of the ship. Because the crushing depth of a ship with high impact speed is also larger than that of a low impact speed. As the impact velocity increasing, the impact force also rises rapidly, which is accompanied by the appearance of a second peak when the velocity is greater than 3 m/s. The force–time curves at different impact velocities under CAM and FSI methods are shown in Figure 10. The impact duration in the CAM method is longer than that of the FSI method. The FSI method can consider the influence of the water surrounding the ship. Consequently, when a ship is traveling in the water, the resistance could reduce the ship’s speed. The trend of the curves is approximately the same before the first peak value is achieved. The motion of the ship could cause the surrounding water to move. At the same time, the water affects the ship’s motion state as well. The difference in impact force for FSI and CAM is slightly, which means that the still water surrounding the ship slightly affects the impact force.
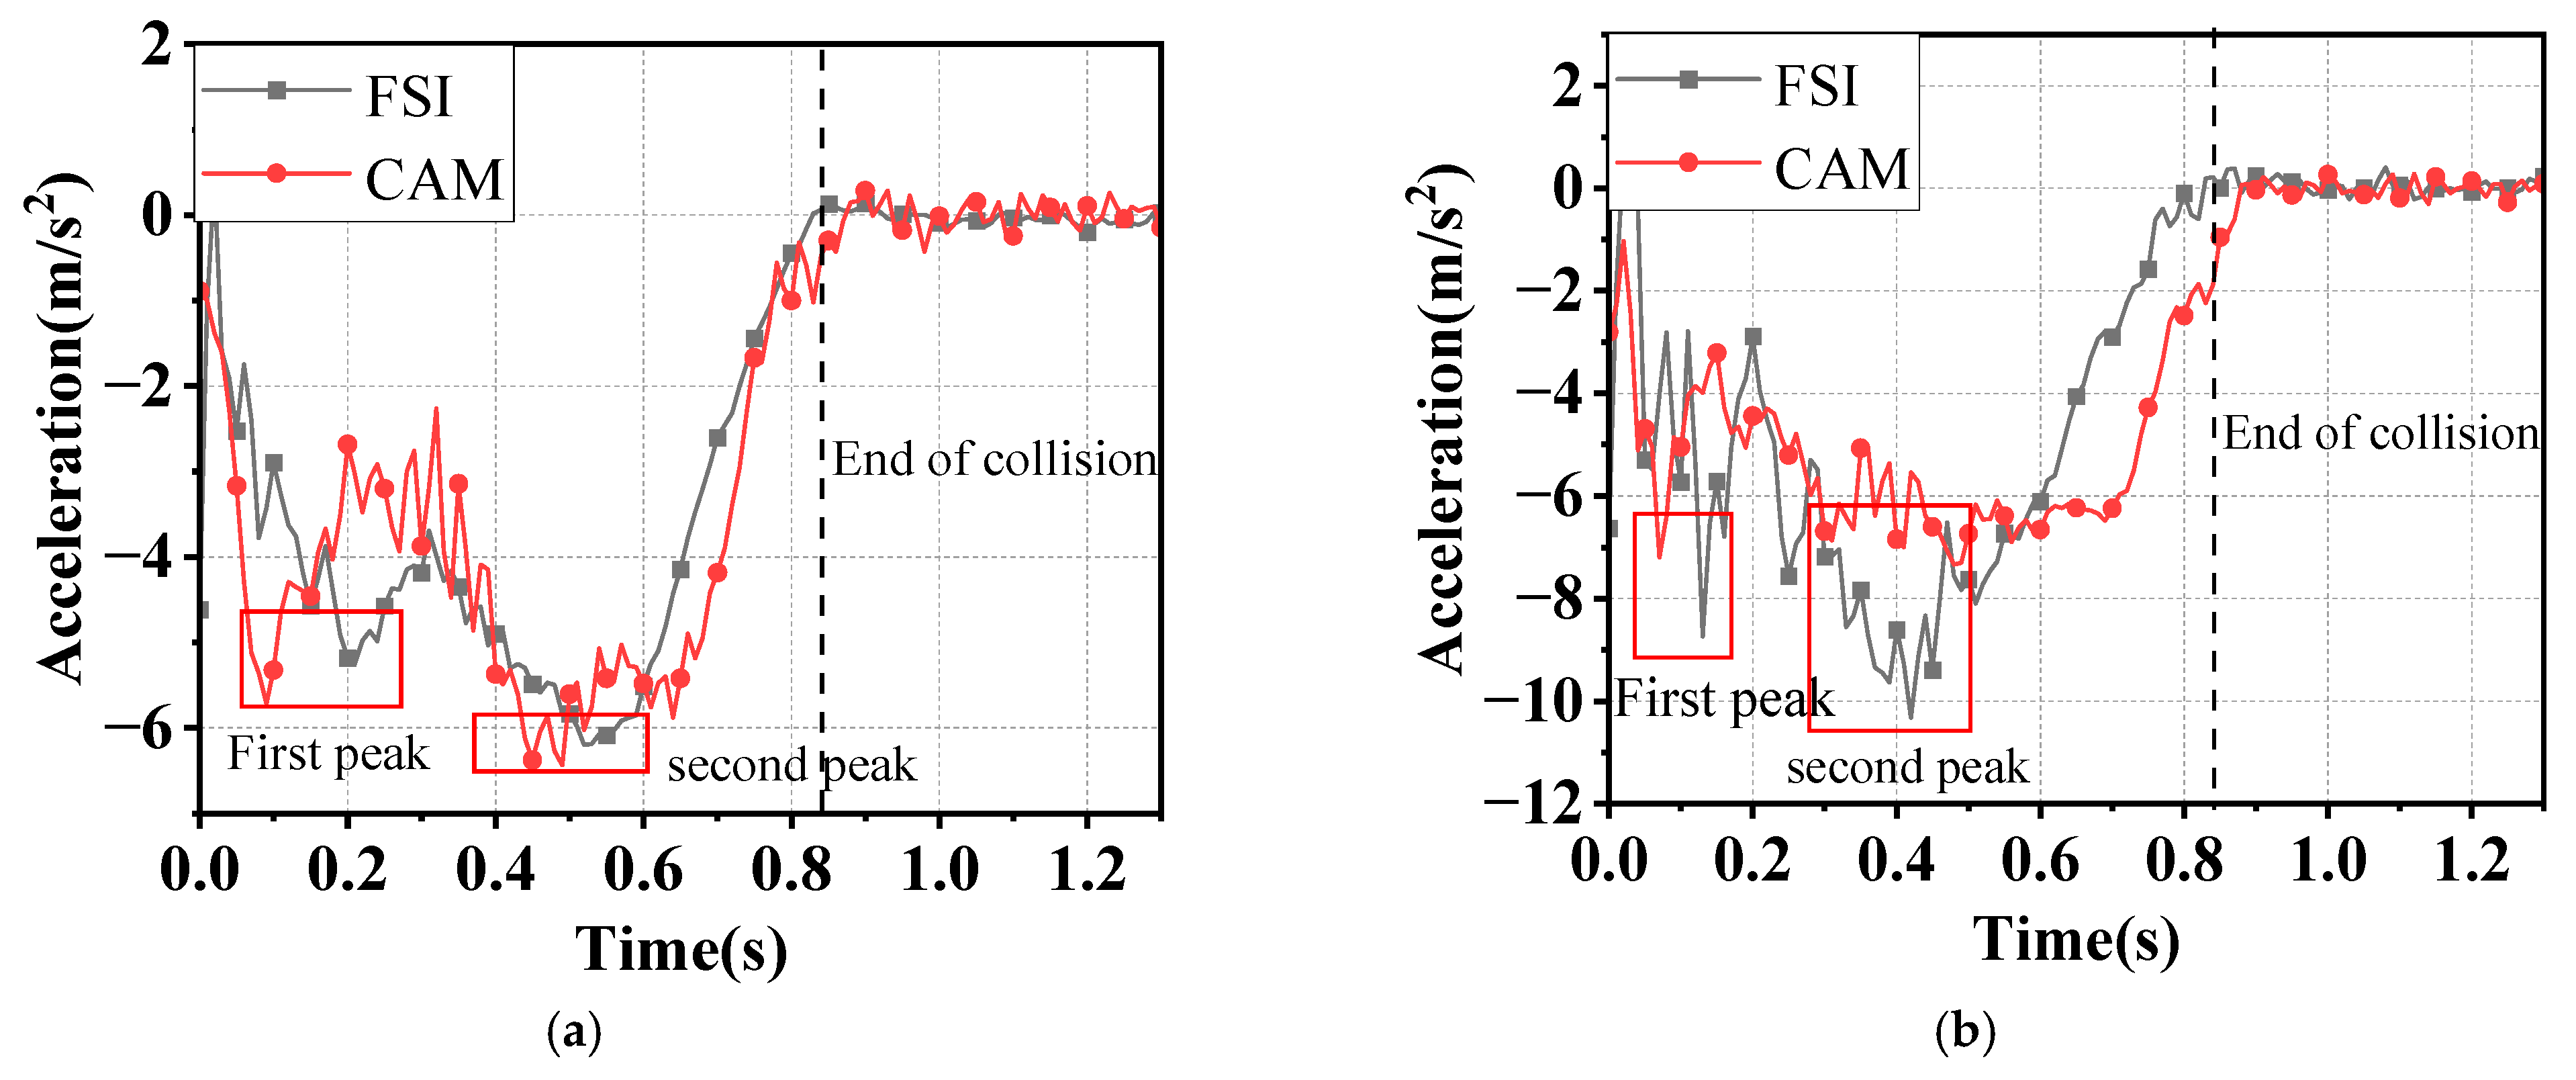
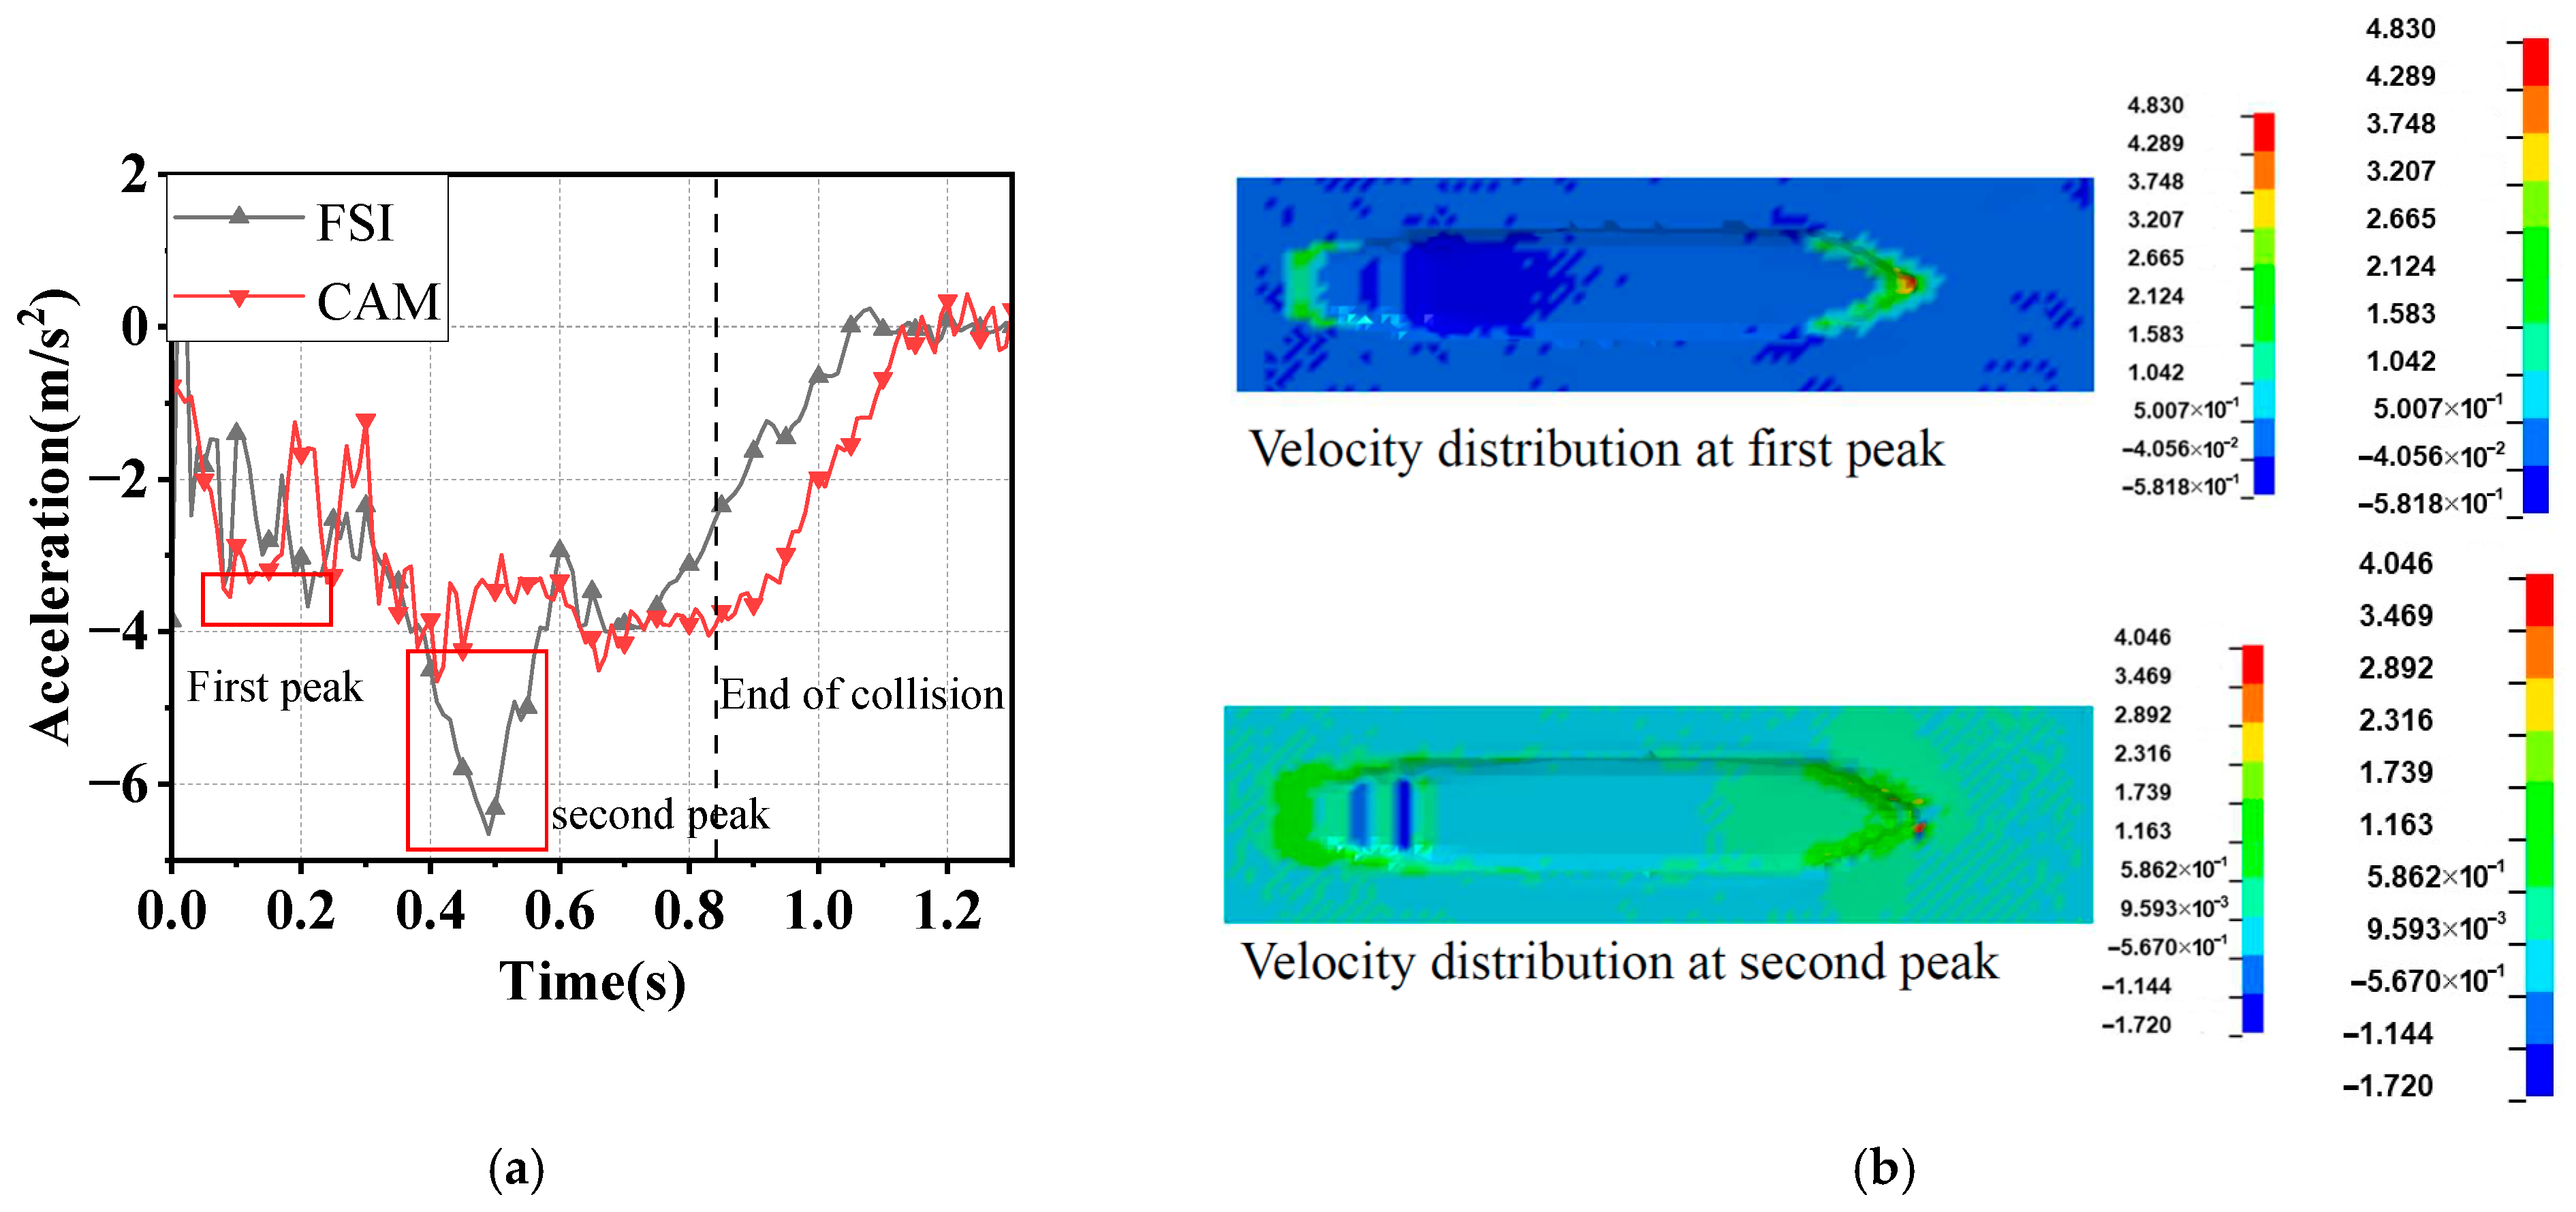
For Vs < 4 m/s, the force–time curves with FSI and CAM methods have a similar trend after the first peak. However, for Vs = 4 m/s, the second peak force in the FSI method is significantly larger than that of the CAM method. This is because the water initially moves with the ship, which could push the ship to move during the collision. The influence of water on the ship’s movement is more obviously for high impact speed, which can be observed from Figure 11. The fluid velocity surrounding the ship at the second peak moment for Vs = 4 m/s is significantly larger than that of Vs = 3 m/s. As the collision progresses, the bulb bow of the striking ship begins to participate in the collision, and the force reaches a second peak. At this point, the average fluid velocity at the bow and stern reaches 3 m/s, and the highest velocity at the bow is 4.56 m/s. Compared to Vs = 3 m/s at the second peak, the maximum fluid velocity surrounding the bow is 2.72 times higher. Therefore, the high-velocity fluid at the stern acts on the ship hull, increasing the ship’s forward acceleration. As can be seen from Figure 12, for Vs = 4 m/s, the acceleration of the ship at the second peak under the FSI method is significantly higher than that of the CAM method. This leads to a substantial difference in the maximum impact force between the two methods.
The impact velocity, peak force and impact depth of the ship under different methods are shown in Figure 13. The impact depth is defined as the displacement of the ship during collision. The impact depth in the CAM method increases linearly, while the FSI method exhibits a nonlinear characteristic. For Vs < 3 m/s, the peak force and impact depth with the CAM and FSI methods are very close. However, the differences in maximum impact force between them are 21.5% and 27.7% for Vs = 4 and 5 m/s. This indicates that the effect of the water surrounding the ship on impact force is more obviously for large impact speeds. In this circumstance, the CAM method might underestimate the impact force for high impact speed. Hence, the CAM method can only be used instead of the FSI method when the speed of the impact ship is smaller than 3 m/s in the scenarios under consideration. For Vs > 4 m/s, the numerical simulation needs to consider the effect of the fluid. Specifically, the added water mass is not constant, especially for high-energy impacts. The fluid field significantly affects the impact force of the ship, which can push the ship at the stern and prevent the ship from moving at the bow during collision at the same time.
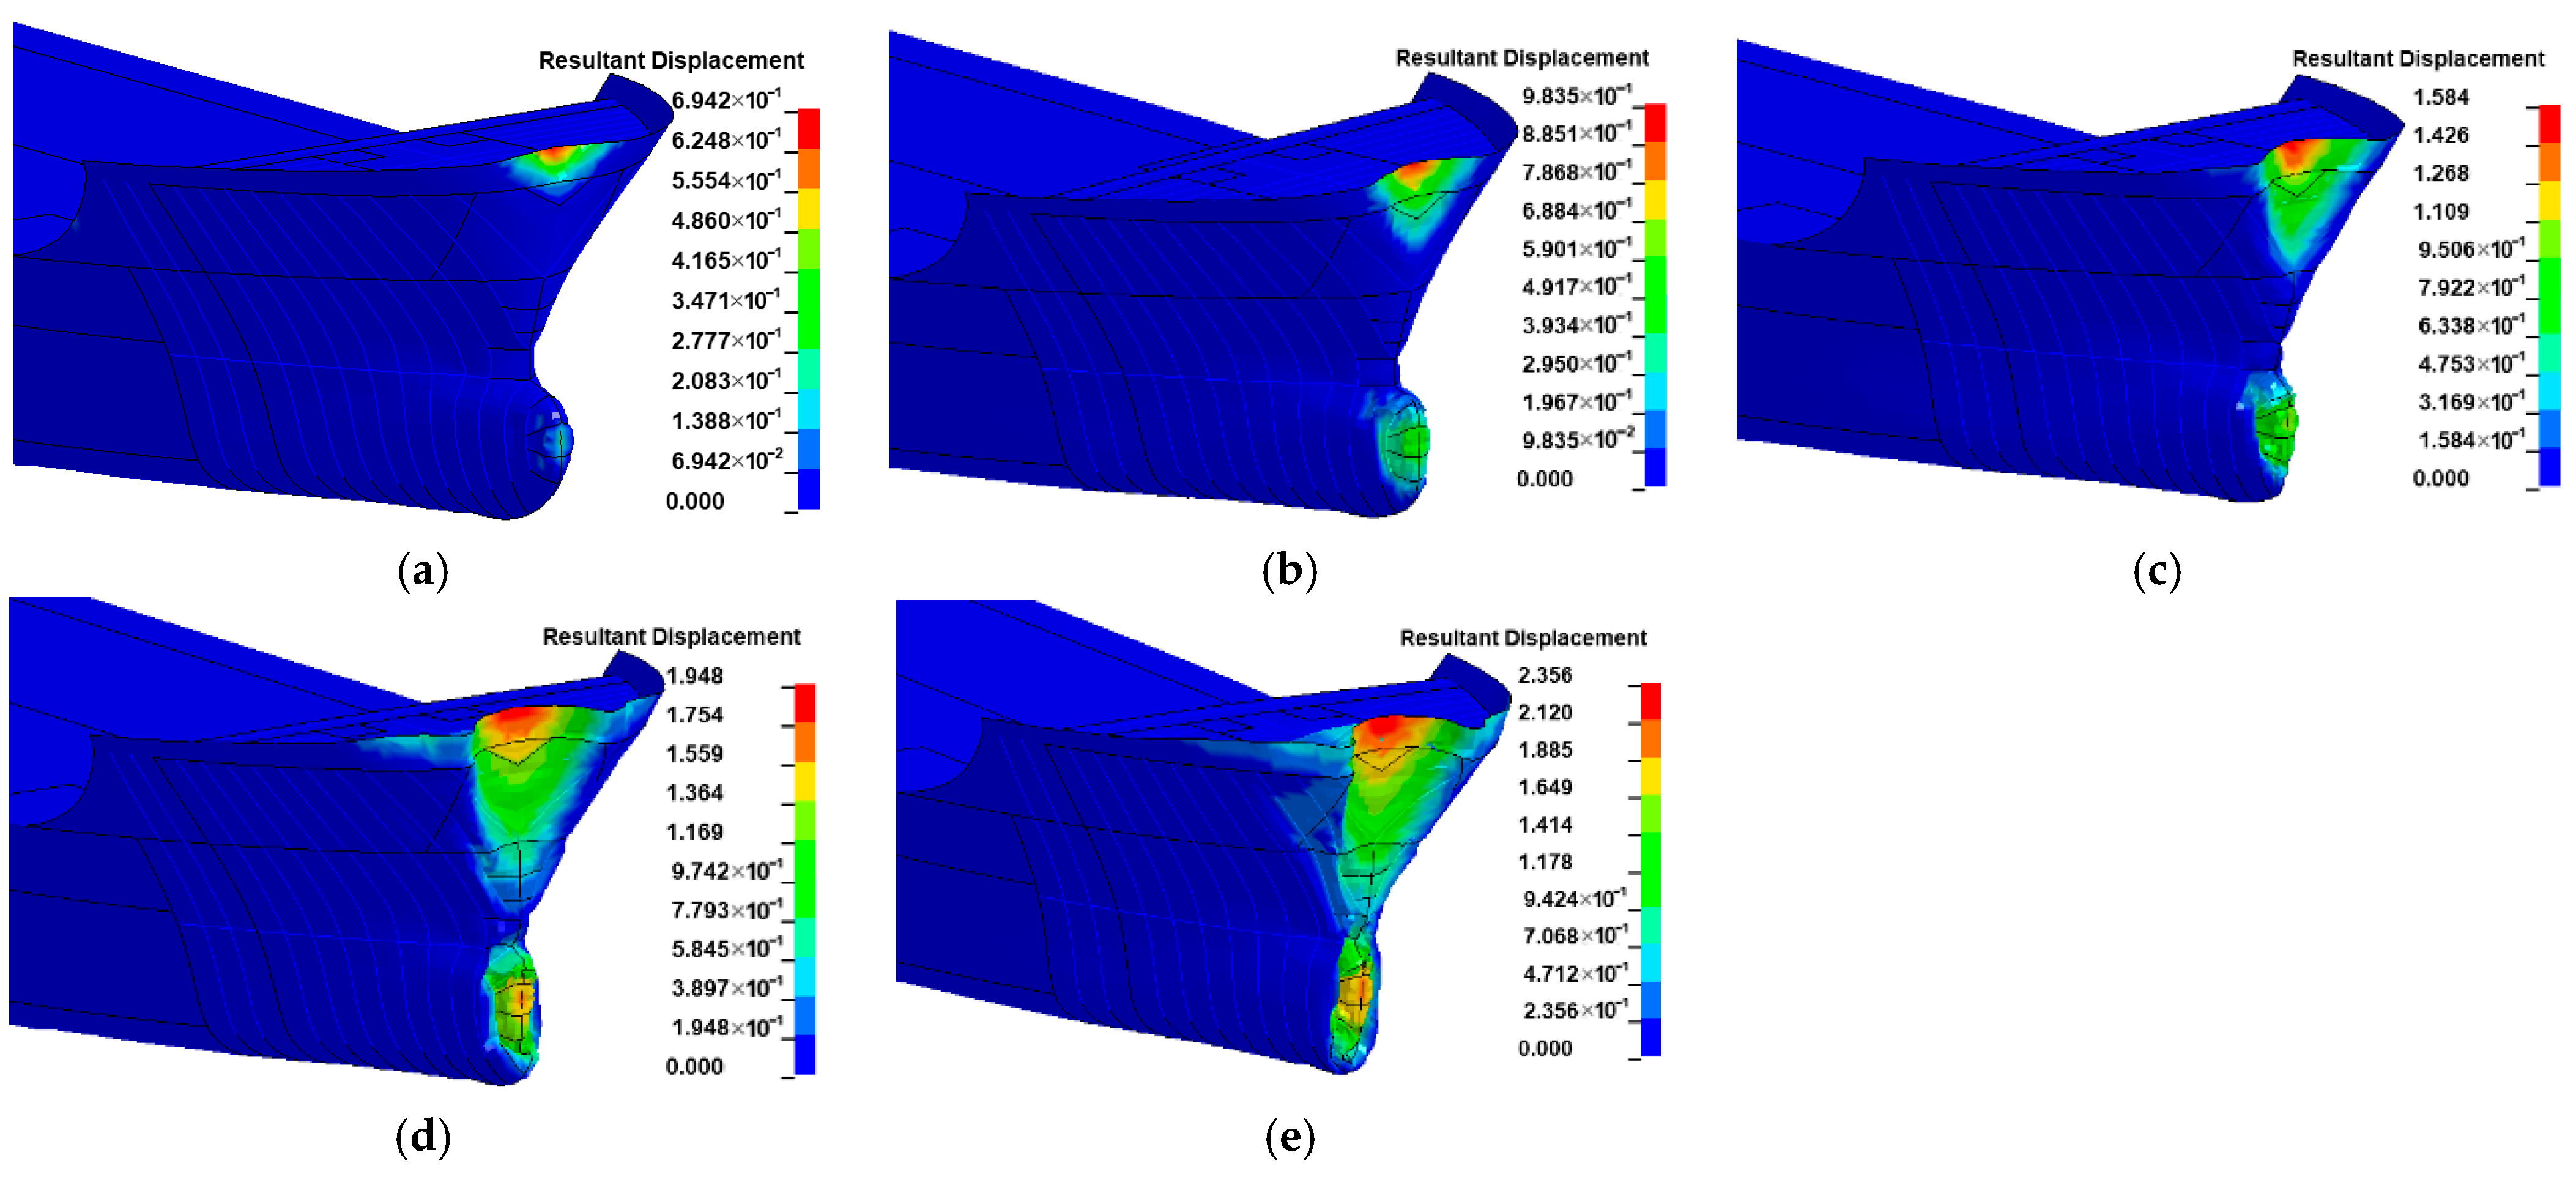
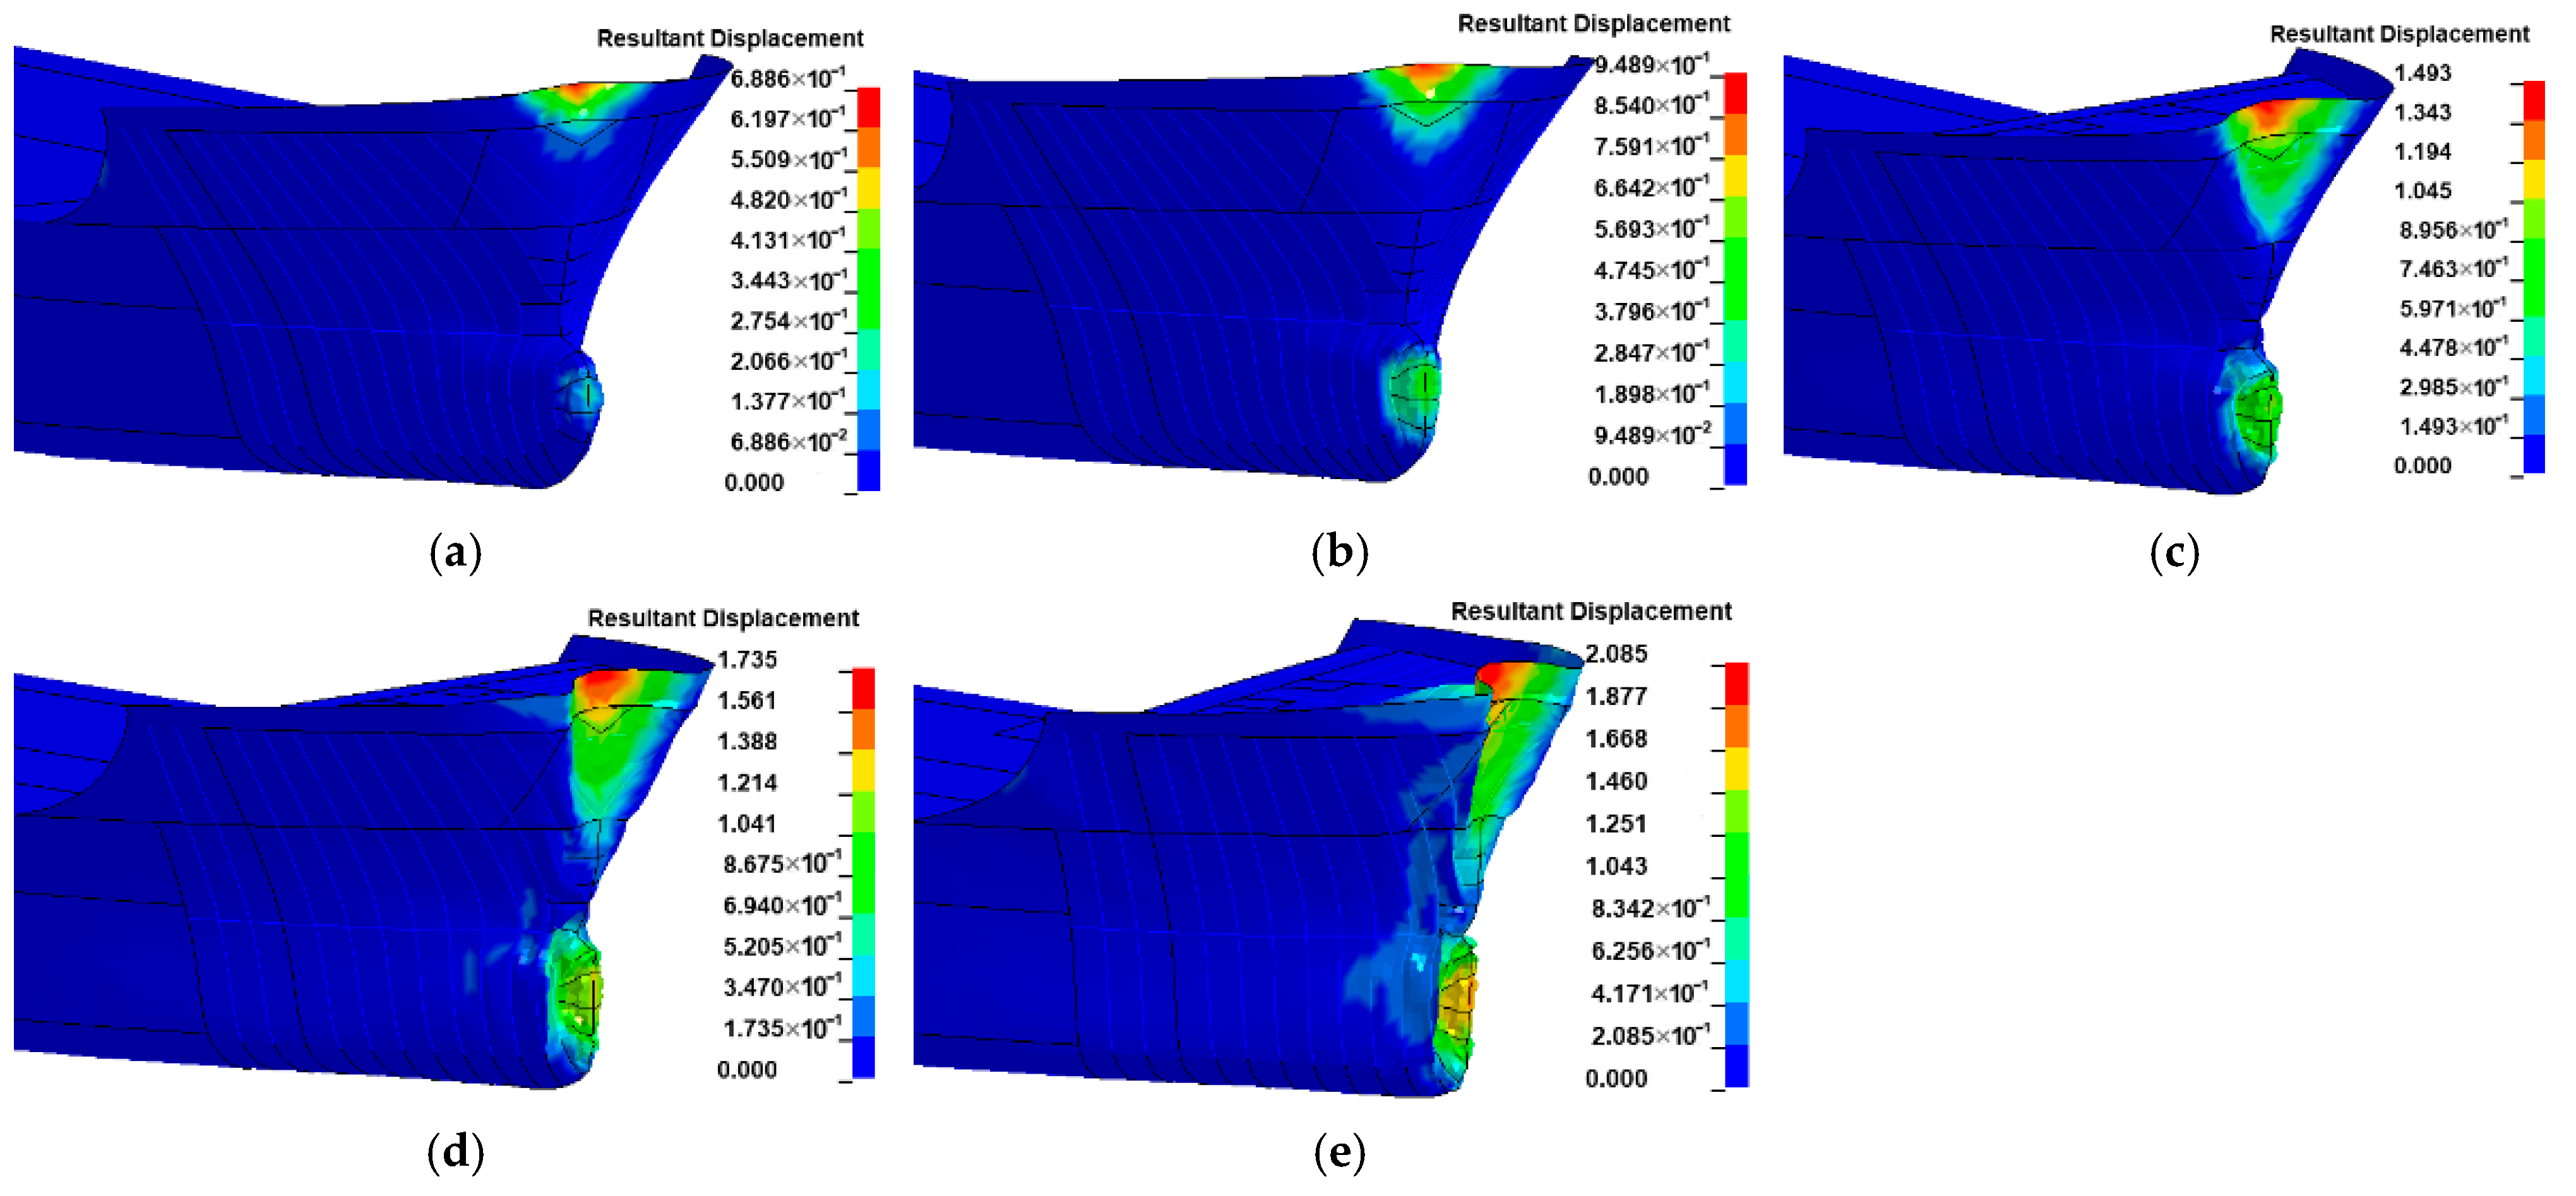
The maximum impact depth and damage deformations are similar for both FSI and CAM methods in Figure 14 and Figure 15. However, their difference increases with the increment of the collision velocity of the ship, which can be observed in Figure 13b. With the increment of the impact velocity, the reduction of impact depth is 0.81%, 3.47%, 5.74%, 10.93%, and 11.50% compared to the CAM method, respectively. This indicates that the influence of water on the damage to the ship increases with the increase in impact velocity.

3.3. Effect of Water-Flow Velocity

In the section, the impact velocity is 3 m/s in the numerical. To investigate the influence of water current, five velocities of water flow with Vf = −4, −2, 0, 2, and 4 m/s are considered. The minus value of velocity means that the direction of the water flow is opposite to the direction of the ship’s movement. The impact force curves of a ship with Vs = 3 m/s are similar for both FIS and CAM methods in still water in the previous section, and there is a slight difference in the peak force. Hence, the mass and speed of the striking ship are considered to be 3000 t and 3 m/s. The force–time curves at different velocities of water flow under the FSI method are shown in Figure 16. The impact durations with various speeds of water flow are almost the same.
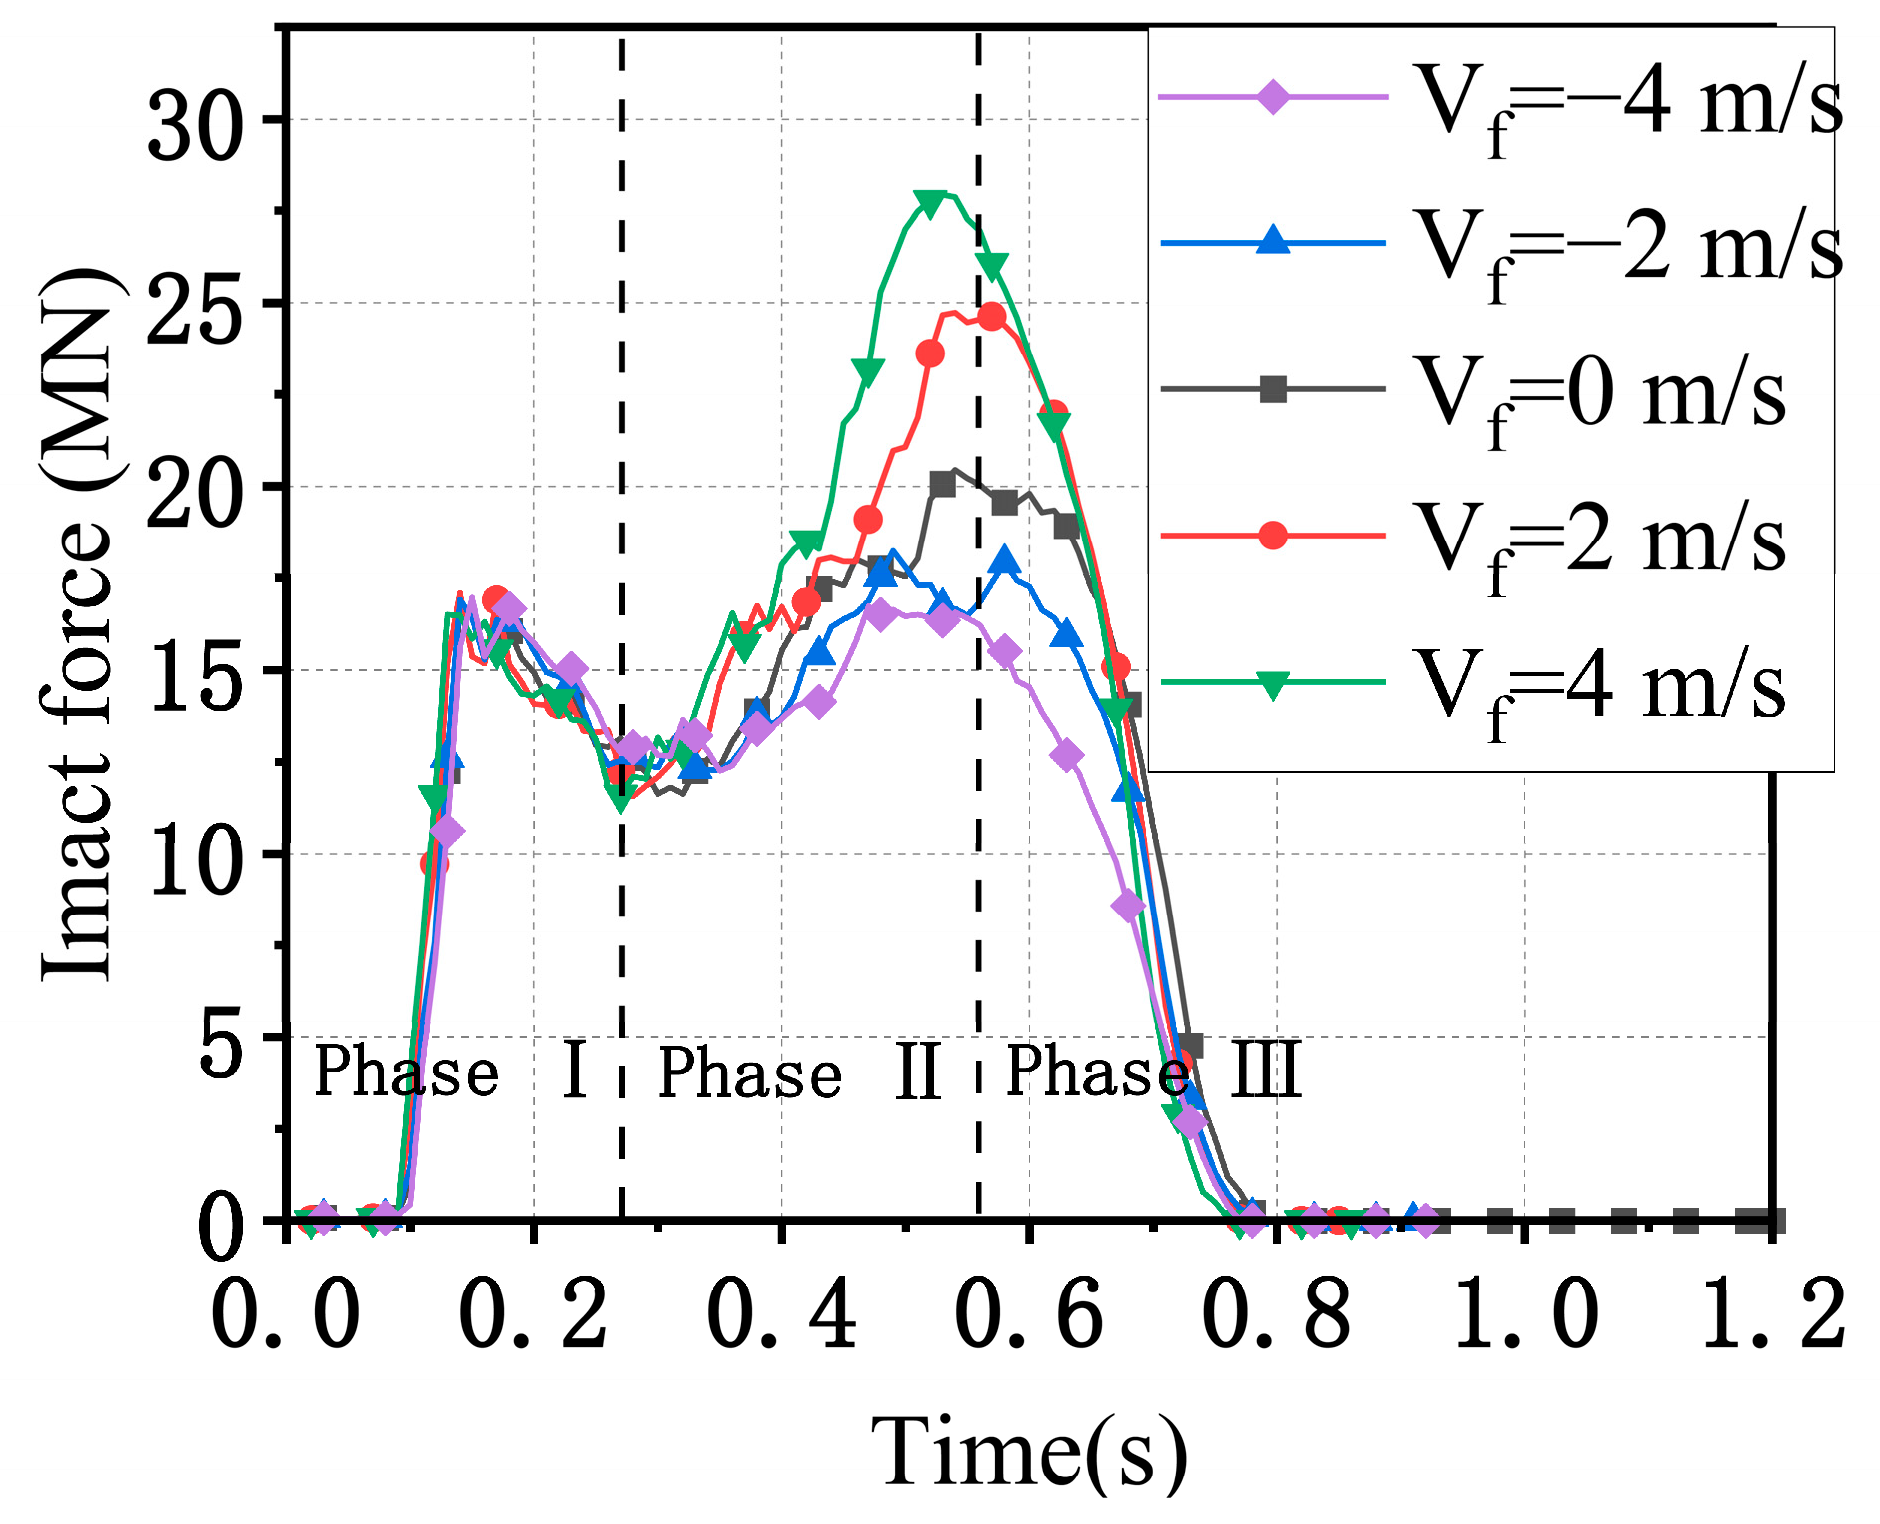
Three stages of impact force can be observed from Figure 16: the initial contact stage (Phase I), the loading plateau stage (Phase II), and the release phase (Phase III). Phase I is marked by the emergence of the initial peak force, which arises from the yielding of the first frame after the ship initially contacts. During this phase, the ship’s bow hits the bridge pier, and the force rises rapidly, reaching the first peak force. Then the rake bow of the ship begins to crush, and the force is reduced. Due to the short duration of Phase I, for different water-flow velocities, the force–time curves show the same trend at the first peak.
In Phase II, with the impact depth increasing, the bulb bow begins to participate in the collision, and the impact forces increase again. The forces reach a second peak as the bulb bow is significantly damaged. The second peak impact force increases with the increase in water-flow velocity. The effect of the water flow on the impact forces mainly occurs in this phase. When Vf = 4 m/s, the peak force is 27.93 MN. The third stage (Phase III) is the unloading process, in which the impact force rapidly reduces until the ship’s bow is out of contact with the bridge pier. The velocity of the fluid field at different moments is symmetrically distributed along the longitudinal axis of the ship, as shown in Figure 17 and Figure 18. This is primarily due to the symmetrical distribution of the ship and the flow-field velocity direction along the ship’s centerline.
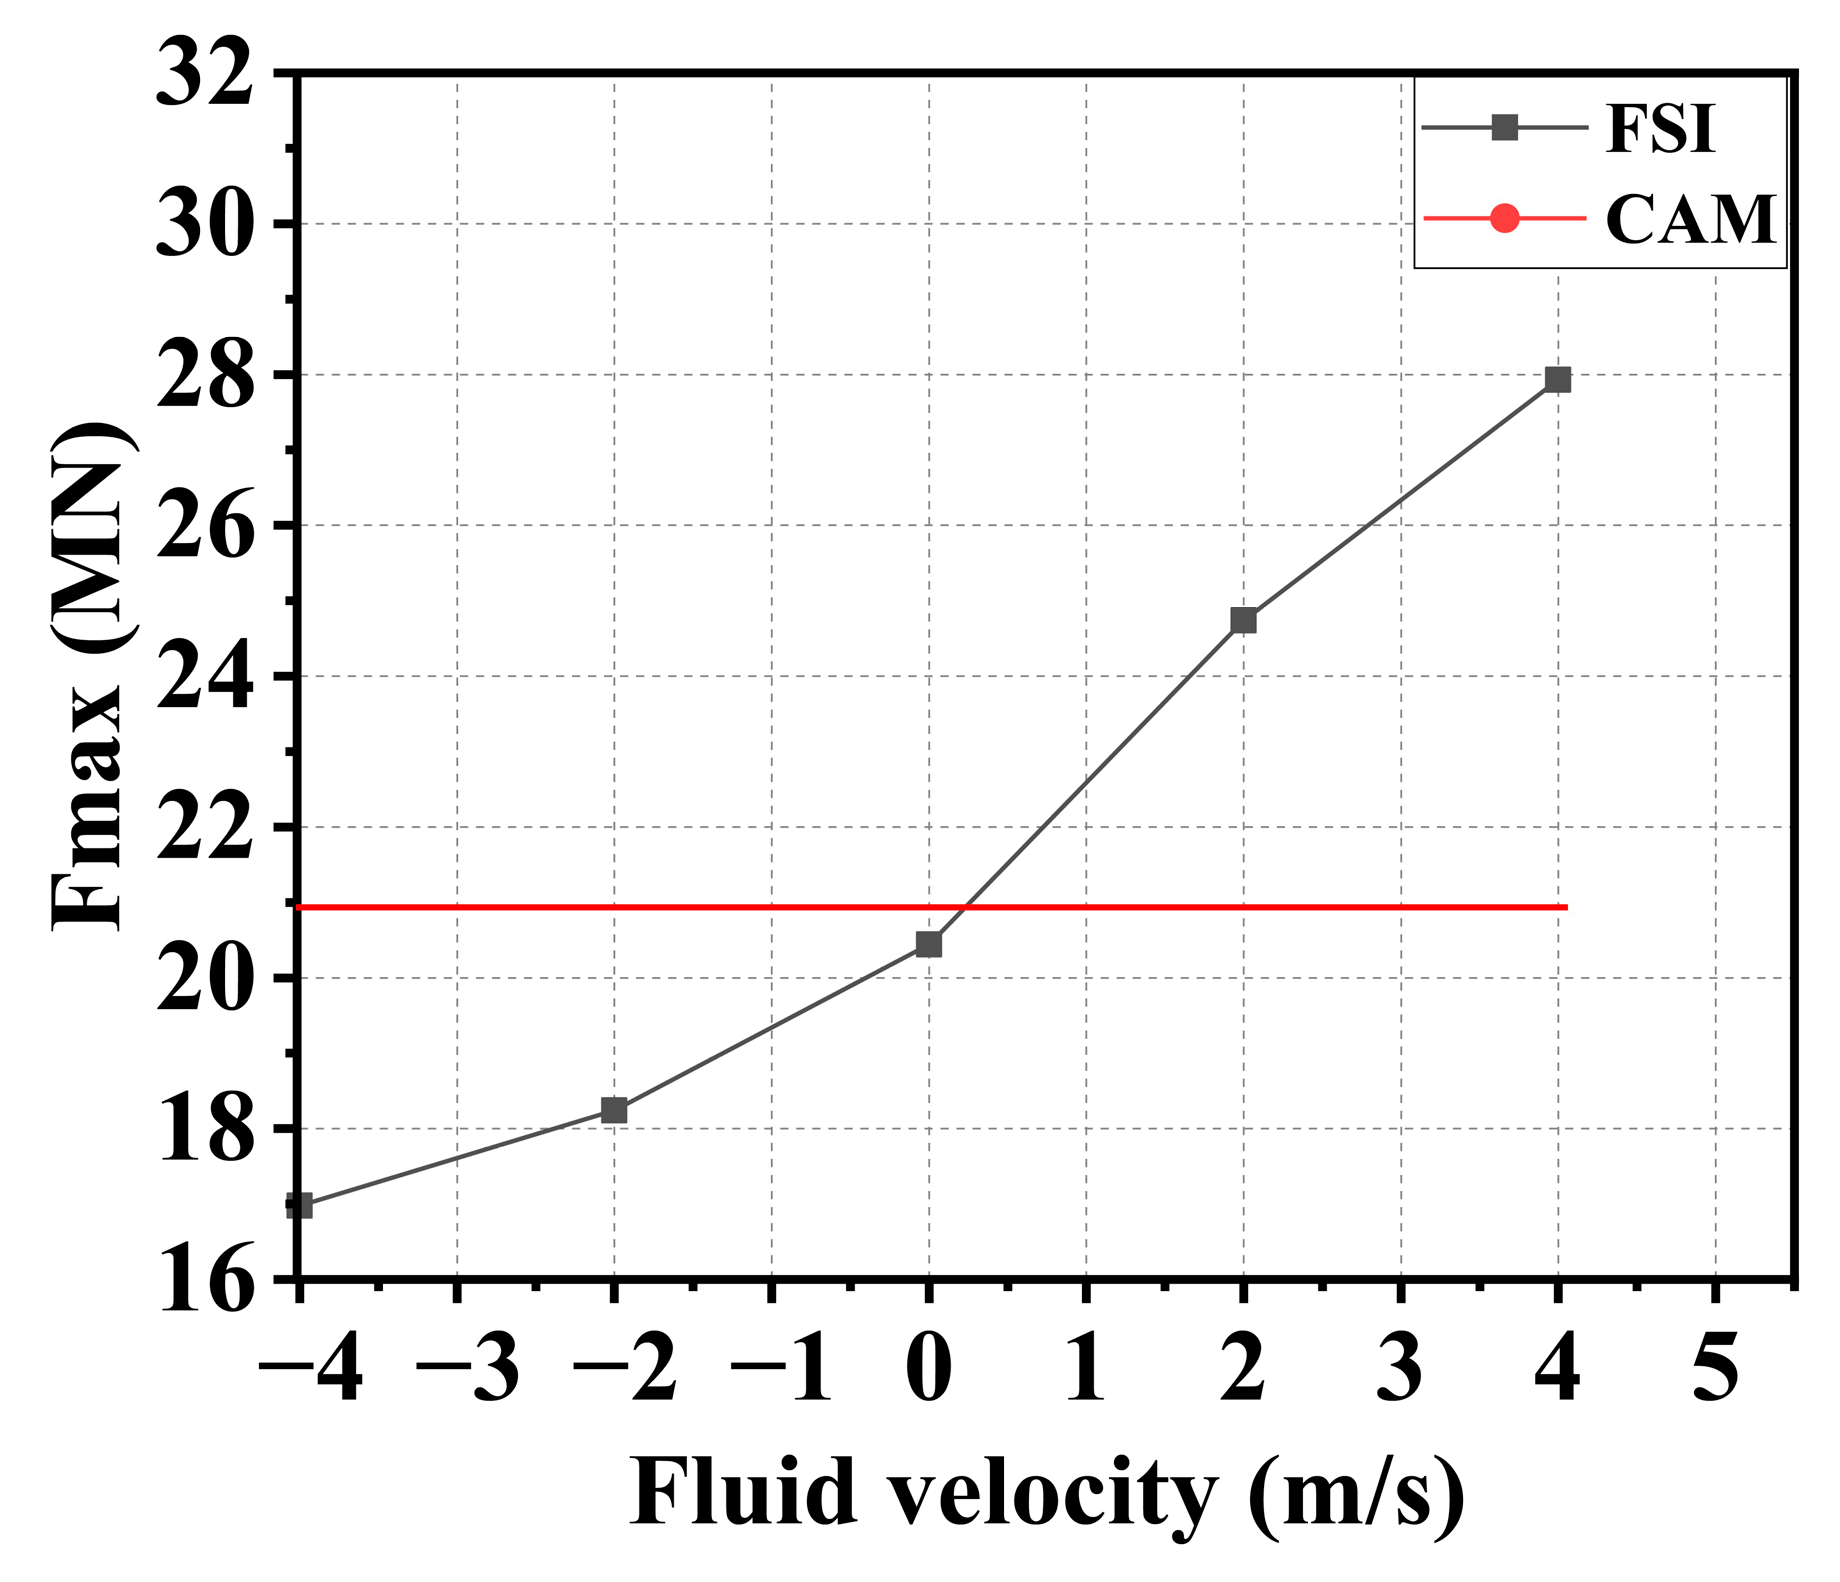
The peak force–velocity of water-flow relationship in the FSI method is given in Figure 19. The influence of the water-flow velocity on the impact peak force increases as the velocity increases. The differences of the peak forces between FSI and CAM methods are 12.1% and 21.0% for Vf = −2 m/s and Vf = 2 m/s. If the CAM method is adopted for saving computation time, it suggests using it for Vf < 2 m/s. The maximum impact forces are 16.98 MN, 20.44 MN, and 27.93 MN for water-flow velocities with Vf = 4 m/s, 0 m/s, and 4 m/s. When the direction of water flow is the same as the striking ship, the water flow significantly increases the impact force. Conversely, the water current reduces the impact force when the direction of the water current is opposite to the direction of the ship’s movement. The maximum impact force in the CAM method, without considering the influence of water current velocity, remains the same at 20.92 MN. Hence, the effect of water current speed in the numerical simulations of ship–bridge collisions should be considered using the FSI method, especially when the velocity of the water current is larger than 2 m/s.

3.4. Effect of Ship Displacement Weight

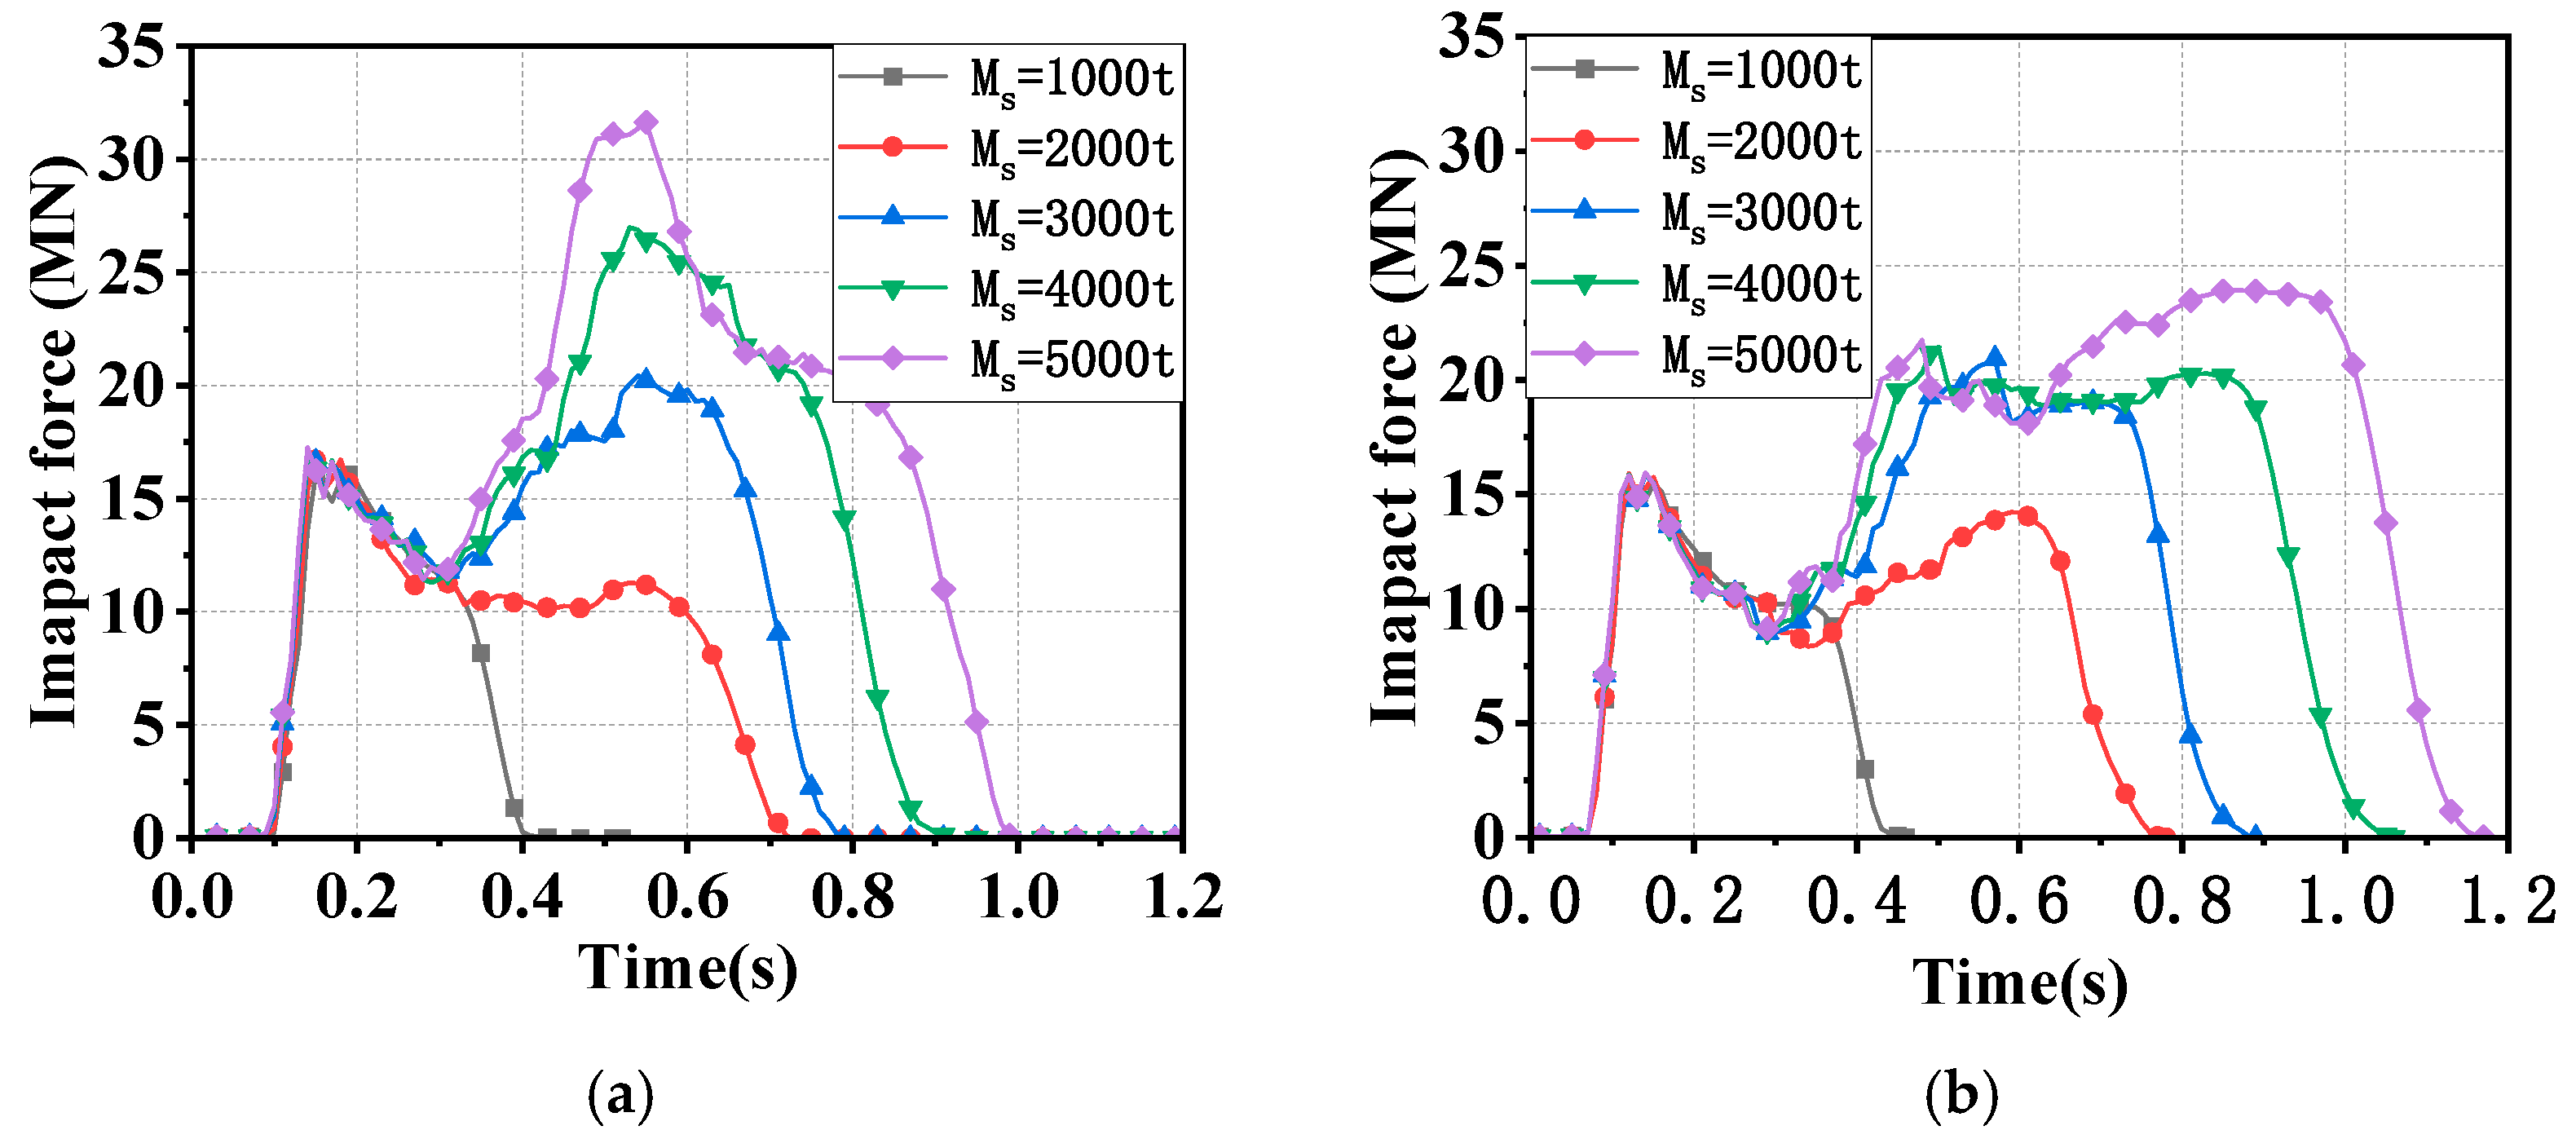
The force–time curves at different ship weights are plotted in Figure 20, in which Ms is the mass of the striking ship. For Ms < 2000 t, there is only one peak value in the curves. As the ship’s weight increases, there are two peak values in the curves, and the peak force increases with the ship’s weight, as expected. When the ship’s weight increases, the kinetic energy becomes greater, and the bulb bow is required to absorb more energy through its own destruction.
The relationship of impact force and crush depth with the CAM and FSI methods is shown in Figure 21. Before the first peak value, the curves of the ship are very close for both methods. This is because, at this moment, the water current surrounding the ship is still small and slightly effect on the ship’s motion state. The maximum impact forces of the ship are very similar for Ms < 3000 t, but are very different for Ms > 4000 t. For a larger ship mass with Ms = 5000 t, the impact force with the FSI method increases sharply at the second peak and is larger than that in the CAM method. At first peak, the acceleration history of the ship is close between both methods in Figure 22. As the ship continues to move, the fluid surrounding the ship is driven by the ship’s movement and becomes larger during the second peak, which could push the ship and then result in a larger ship impact force at the second peak.
Another reason is that the draft of the ship increases as ship tonnage increases; see Figure 23. The relationship between the maximum impact force and mass of the striking ship is shown in Figure 21b, which is nonlinear. The nonlinear trend of the impact force is more obviously in the FSI method. The higher the ship mass, the greater the effect of the fluid field. With the increasing in ship mass, the difference of peak force between the CAM and FSI methods increases as well. For the full-load case with Ms = 5000 t, the difference in maximum impact force between the two methods reaches 31.2%. The mass of the ship not only influences the kinematic energy, but also the draft, which cannot be considered in the CAM method. Hence, in the circumstance of full-load condition with deep draft, the influence of the fluid field is more significant.
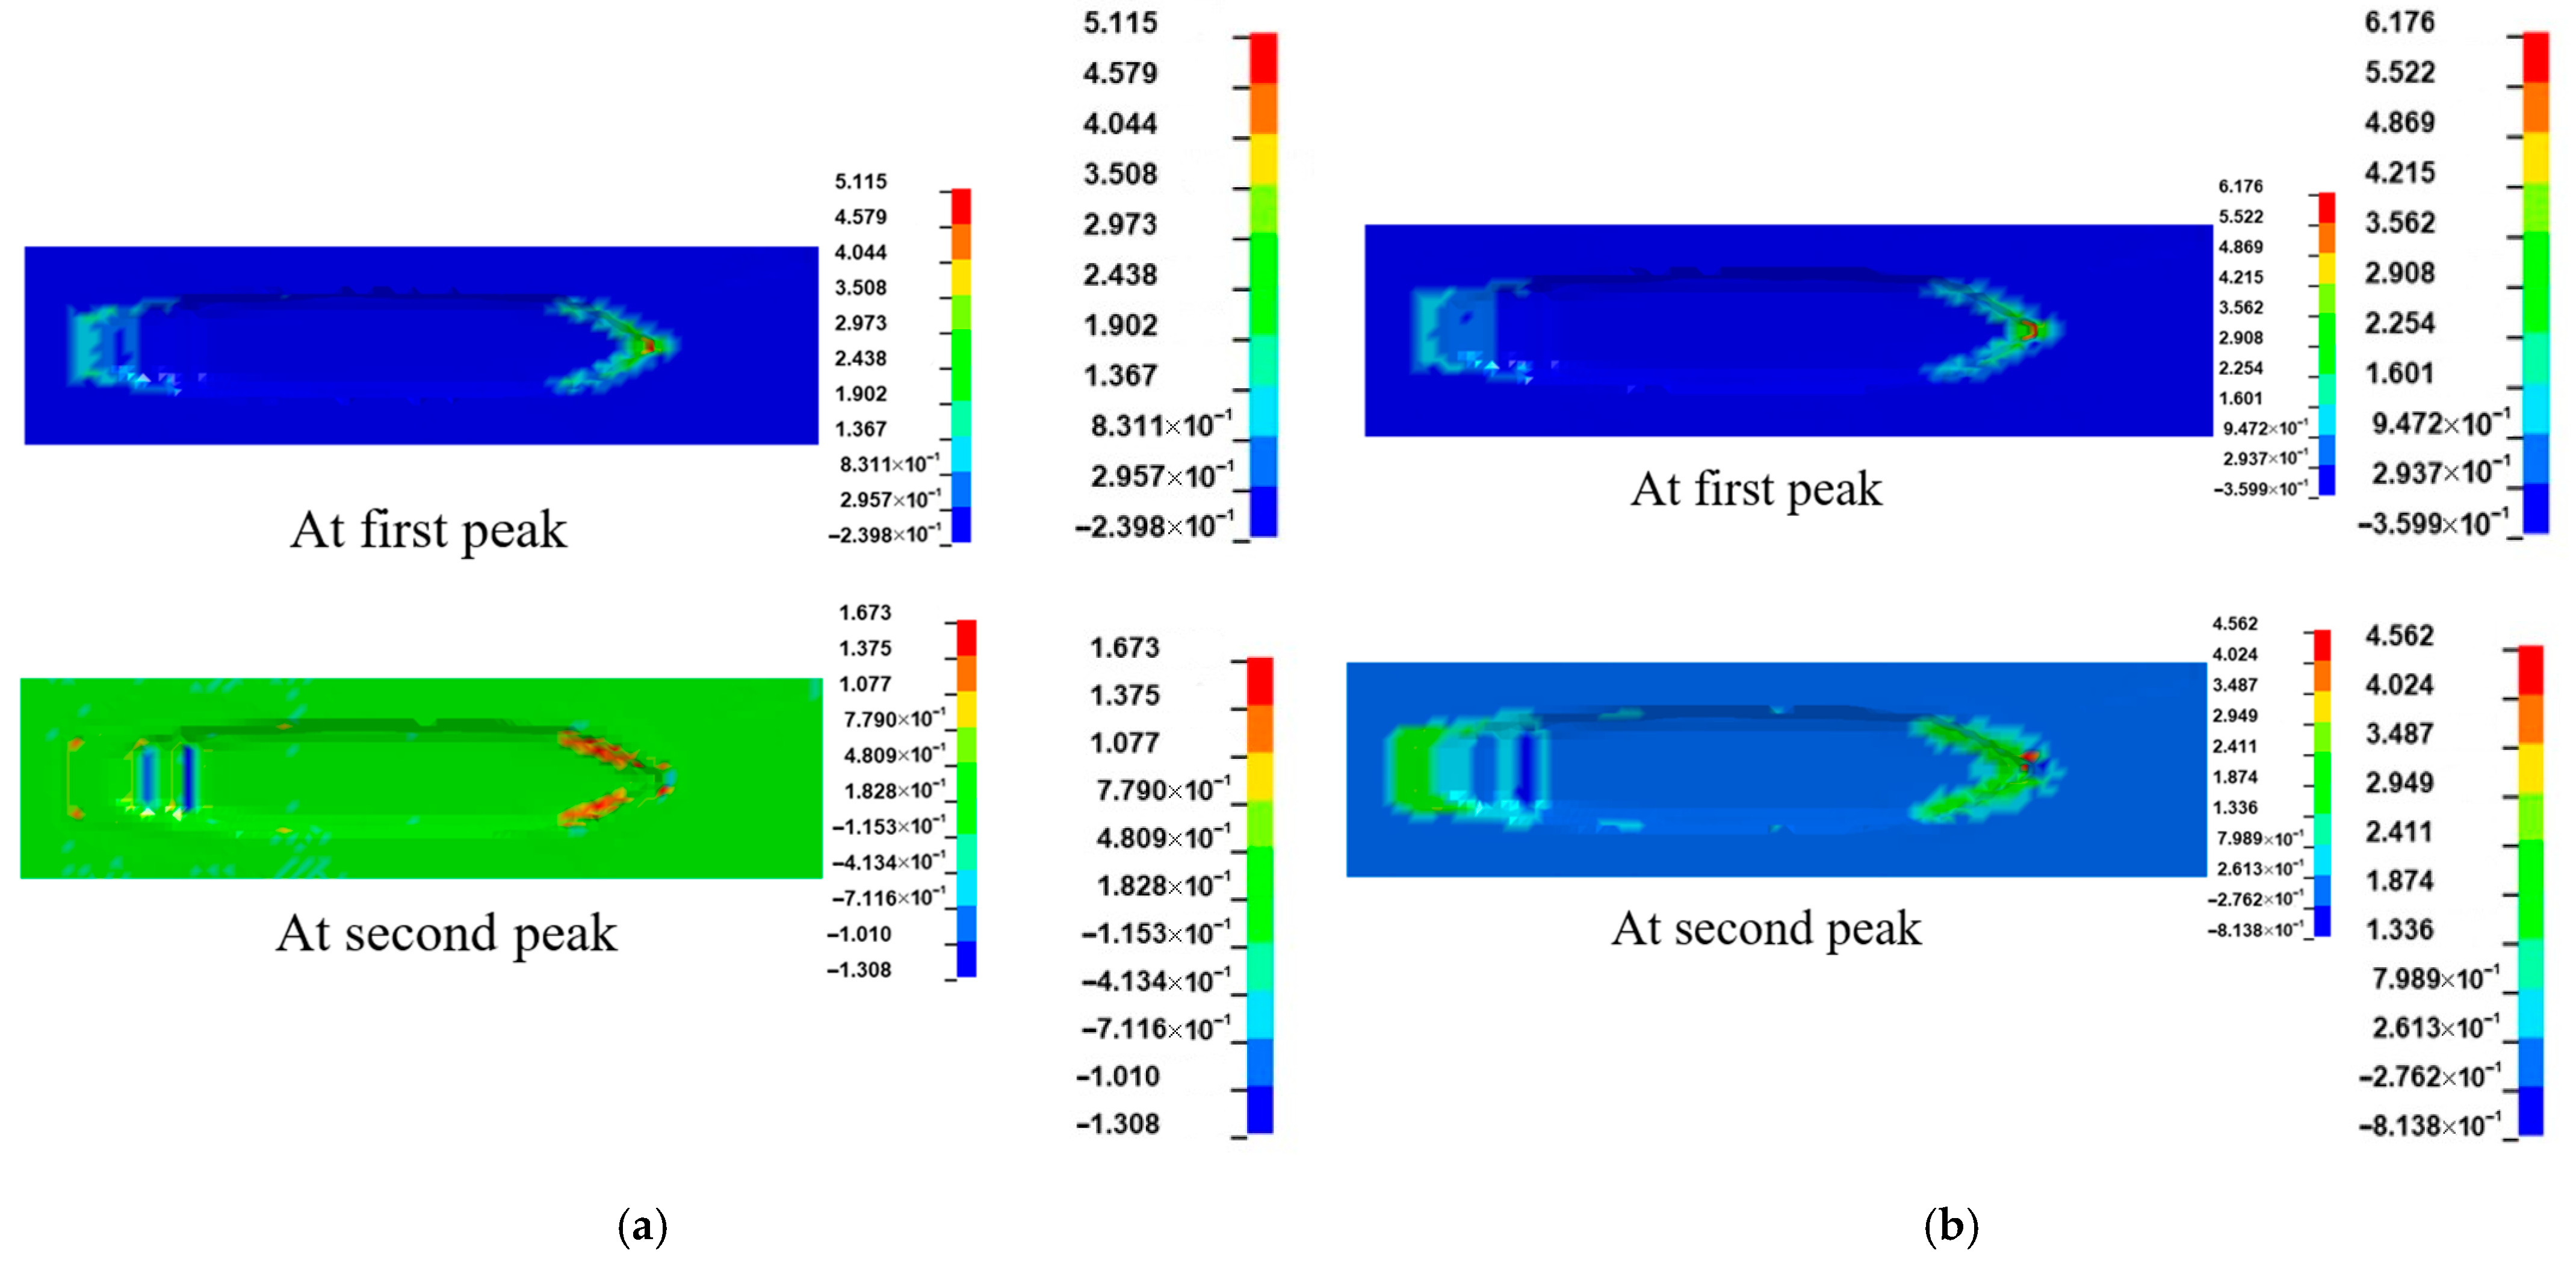
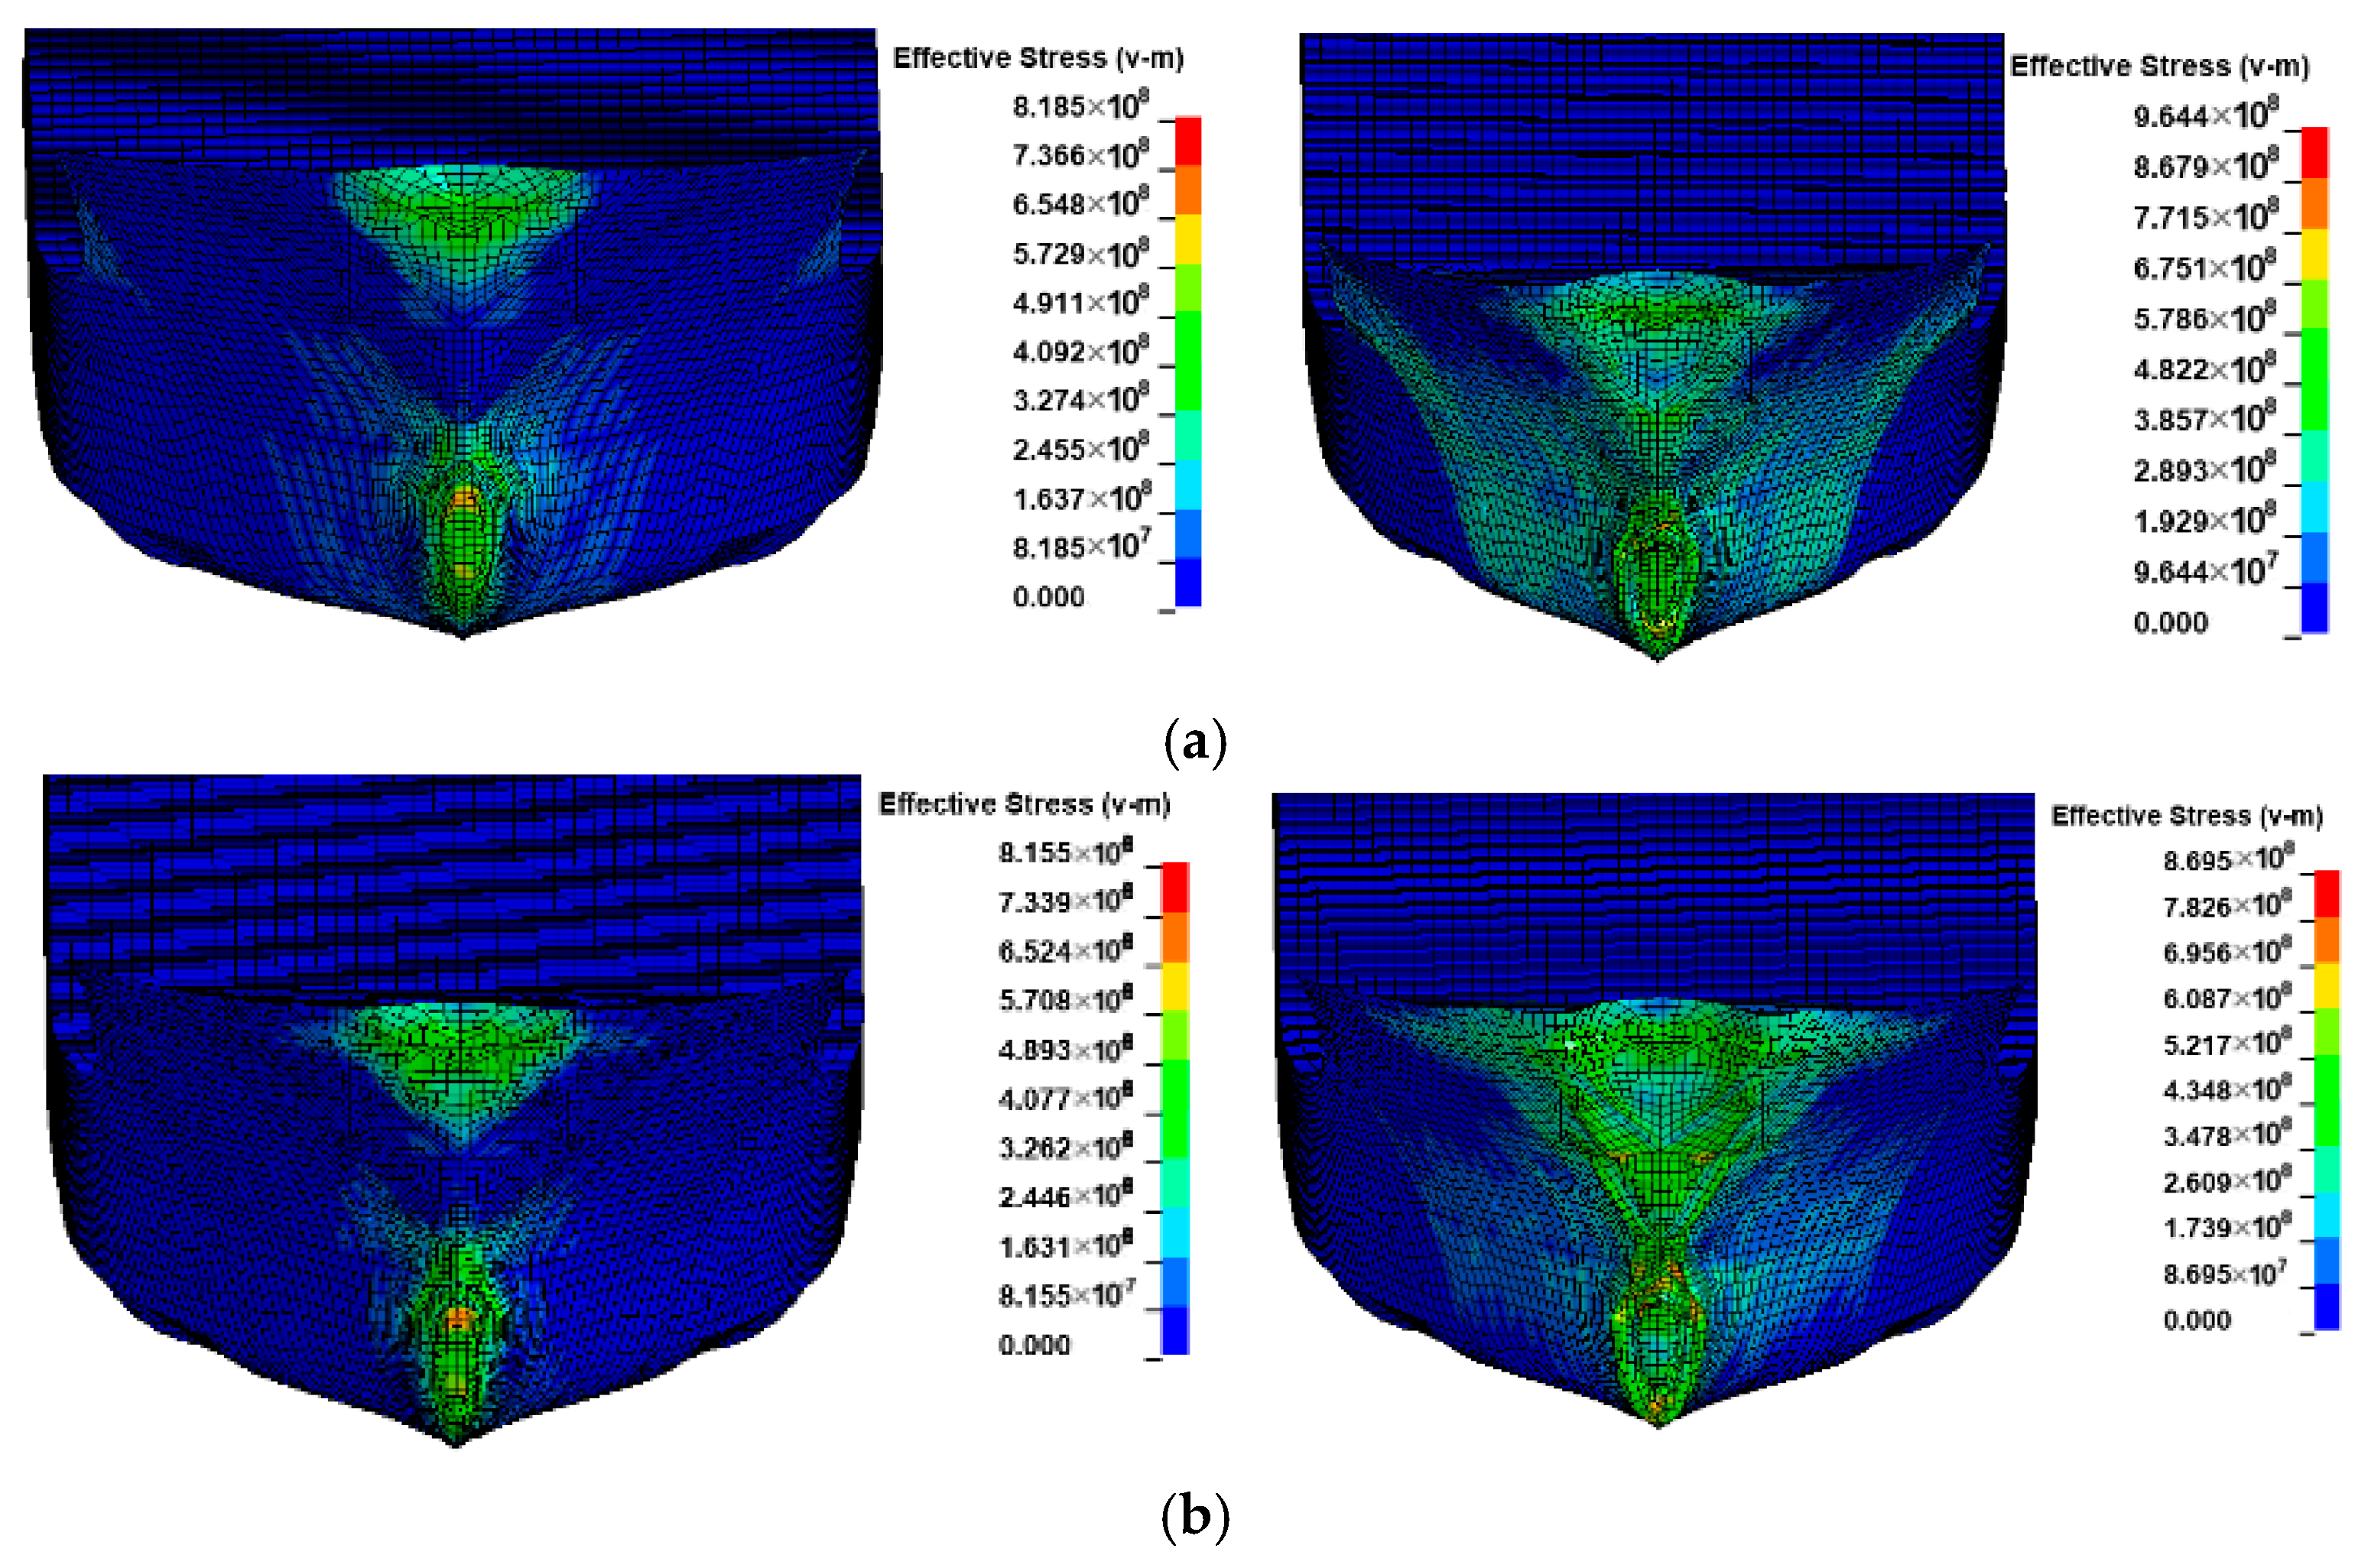
The stress distributions at different moments under different analysis methods are shown in Figure 24. When the first peak occurs, there is a slight difference in the magnitude of stresses in the ship bow between the two methods. When the second peak appears, the material at the bulb bow failure with a larger range. The stress and impact depth calculated using the CAM method are larger than those of the FSI method. This illustrates that the resistance of the ship due to water could reduce the damage to the ship.

3.5. Influence of Kinematic Energy

Due to the difference in ship draft, the dynamical responses of the striking ship with the same kinematic energy are also different. Hence, the kinematic energy of the striking ship is set as 13.5 MJ, in which three cases are considered with different combinations of velocities (5.2 m/s, 3.0 m/s, and 2.3 m/s) and masses (1000 t, 3000 t, and 5000 t).
The force–time curves with different methods are shown in Figure 25. The impact durations are very different for different combinations of velocities and masses, which might influence the dynamic response of ships, because of the different drafts of the ship that involve the fluid field, as shown in Figure 23. The maximum impact forces of a ship with different combinations of velocities and masses are almost the same for the CAM method but are different for the FSI method, which is because of the difference in ship drafts. However, the maximum difference of the peak force is about 7.2% for the FSI method; the dynamic response of a ship with the same kinematic energy can be considered the same for simplification. Specifically, the influence of ship draft on the impact force is slightly different for the same kinematic energy. The stress distributions at different moments are shown in Figure 26 and Figure 27. The first peak force is mainly due to the damage of the raked bow. When the impact depth continues to increase, the bulb bow of the ship begins to participate collision, and then the impact force starts to increase rapidly again.

4. Impact Force with Various Methods

4.1. Empirical Formulae

For the bridge anti-collision safety assessment in the design stage, empirical formulae are generally adopted to predict the force, such as the requirement of AASHTO [9], IABSE [2], TB [10], and JTG [11]. In this section, the results of the finite-element simulations with CAM and FSI methods are compared with those of the empirical formulae. The assessment equation of the impact force in the requirement of AASHTO [9] is given as follows:
F max = 0.122 × D W T × V   ( MN )
where F (MN) represents the equivalent collision force, DWT (t) represents the deadweight tonnage of the ship, and V represents the impact velocity.
IABSE [2] proposes a formula given as follows:
F max = 0.88 × D W T × V / 8 2 / 3 × D a c t / D max 1 / 3   ( MN )
where F (MN) represents the collision force, V (m/s) represents the impact velocity, and D a c t (t) and D max (t) represent the ship’s actual draft and full-load draft.
TB [10] provides an empirical formula based on the theorem of kinetic energy. The formula is expressed as follows:
F A v e = γ V sin α W C 1 + C 2   ( kN )
where F (KN) represents the collision force; γ represents the coefficient of reduction in kinetic energy, which is assumed as 0.2 for oblique collision and is 0.3 for head-on collision; V (m/s) represents the impact velocity; α represents the angle of collision; W (KN) represents the weight of ship; and C1 and C2 (m/kN) represent the elastic deformation coefficients of the ship and bridge.
The formula in the requirement of JTG [11] is based on the momentum theorem, which is given by
F A v e = W V g T   ( kN )
where F (KN) represents the collision force; W (kN) represents the weight of the ship; V (m/s) represents the impact velocity; T (s) represents the duration time of the collision.

4.2. Comparative Analysis of Impact Forces

The impact forces assessed in different methods are shown in Figure 28, in which F max represents the peak 50 millisecond average force (PFMA) in the numerical simulations. There are several kinds of impact force in the FE analysis, including dynamic force history, equivalent static force, average force, the peak 50 millisecond average force (PFMA), and so on. The peak force calculated by various methods has the same trend, which rises with the velocity and weight of the ship as expected. When the ship navigates in still water (Vf = 0), the impact forces calculated by AASHTO and IABSE are close to that in the FE analysis. The formulae of AASHTO and IABSE were developed based on the research of the anti-collision requirement for the nuclear-powered ship, in which the assessment method of impact force was developed according to the 70% quantile of the probability density function, considering various ship types. The formulae of AASHTO and IABSE requirements are still recommended to calculate the impact force for the safety assessment of bridge anti-collision in the design stage. The results in the requirement of JTG and TB are significantly smaller than the peak 50 millisecond average force (PFMA) in the numerical simulations. Because the formulations predicting the impact force in the requirements of TB and JTG were derived from the kinetic energy theorem and momentum theorem, which are based on the quasi-static assumption and the average method.
The maximum impact force of different methods under different conditions is shown in Table 3. The formulae for calculating the impact force in these four requirements do not include the velocity of water flow. For Vf = 2 m/s, the Fmax-FSI in the FSI method is 29% and 43% larger than that in the requirements of AASHTO and IABSE, respectively. The average differences of the impact force between Fmax-FSI and the requirements of AASHTO are 15.5% for Vf < 4 m/s, and 10.8% for Vf < 2 m/s. This indicates that the requirements of AASHTO are considerable to be used when the velocity of water flow is smaller than 2 m/s; however, for larger velocities of water flow, it is suggested to use the FE analysis with the FSI method. From the perspective of bridge anti-collision design, the formula in these requirements needs to be improved to consider the influence of the velocity of water flow.

5. Conclusions

FE modeling technology with the CAM and FSI methods is established to simulate the collision procedure between ships and bridges. A series of numerical simulations is performed to explore the influences of water-flow velocities, weights, and impact velocities of the ship on the impact force. The main conclusions are given as follows:
  • The wave and current of water caused by the ship’s movement during sailing slightly influence the impact force; hence, the initial position of the ship can be close to the bridge pier to save computation time.
  • The velocity of the water current larger than 3 m/s significantly affects the impact force of the ship, which should be considered using the FSI method instead of the CAM method. Further experiments considering the influence of water current are suggested to be conducted to verify this conclusion.
  • Since the water could push the ship at the stern and prevent the ship at the bow during impact at the same time, the added water mass of a ship–bridge collision is not constant. Since the FE analysis with the CAM method is not able to consider the hydrodynamic effect, to save computation time, it is suggested that limitation conditions with a small velocity of the ship (<3 m/s) and water flow (<2 m/s) be adopted.
  • When the ship is in still water, the impact forces assessed by the AASHTO requirement are the closest to those of the numerical results. For bridge anti-collision design, the existing requirement formulae for predicting impact force need to be improved to consider the influence of water-flow velocity.

Author Contributions

E.J.: Validation, Investigation; Y.C.: Methodology, Writing—Original Draft; S.R.: Formal Analysis; M.X.: Funding Acquisition, Writing—Review; J.P.: Writing—Review and Editing; H.F.: Conceptualization, Supervision. All authors have read and agreed to the published version of the manuscript.

Funding

National Natural Science Foundation of China (Grant No. 52371319, 12372358).

Data Availability Statement

The authors declare that the data presented in this study are available upon request.

Conflicts of Interest

The authors declare no conflict of interest.

References

  1. Perera, L.P.; Soares, C.G. Collision risk detection and quantification in ship navigation with integrated bridge systems. Ocean Eng. 2015, 109, 344–354. [Google Scholar] [CrossRef]
  2. Larsen, O.D. Ship Collision with Bridges: The Interaction Between Vessel Traffic and Bridge Structures; IABSE: Copenhagen, Denmark, 1993. [Google Scholar]
  3. Copenhagen, I.C. Ship Collision with Bridges and Offshore Structures; IABSE: Zurich, Switzerland, 1983. [Google Scholar]
  4. Jones, N. Structural Aspects of Ship Collisions; Structural crashworthiness: London, UK, 1983. [Google Scholar]
  5. Minorsky, V.U. An Analysis of Ship Collisions with Reference to Protection of Nuclear Power Plants; Sharp (George G.) Inc. New York: New York, NY, USA, 1959. [Google Scholar]
  6. Woisin, G. Die Kollisionsversuche Der Gkss; Springer: Berlin/Heidelberg, Germany, 1976. [Google Scholar]
  7. Carlebur, A.F.C. Full-scale collision tests. Saf. Sci. 1995, 19, 171–178. [Google Scholar] [CrossRef]
  8. Sha, Y.; Hao, H. Laboratory tests and numerical simulations of barge impact on circular reinforced concrete piers. Eng. Struct. 2013, 46, 593–605. [Google Scholar] [CrossRef]
  9. Guide Specifications and Commentary for Vessel Collision Design of Highway Bridges, 2nd ed.; AASHTO: Washington, DC, USA, 2009.
  10. TB 10002.1; Fundamental Code for the Design of Railway Bridge and Culvert. Railway Publishing House: Beijing, China, 2005.
  11. JTG D60; General Code for the Design of Railway Bridge and Culvert. Communications Press: Beijing, China, 2004.
  12. Pan, J.; Huang, S.W.; Xu, M.C. Numerical analysis for impact force in high-energy ship-bridge pier collision. In Proceedings of the 35th International Conference on Ocean, Offshore and Arctic Engineering, Busan, Republic of Korea, 19–24 June 2016; p. 55119. [Google Scholar]
  13. Fan, W.; Shen, D.; Huang, X.; Sun, Y. Reinforced concrete bridge structures under barge impacts: FE modeling, dynamic behaviors, and UHPFRC-based strengthening. Ocean Eng. 2020, 216, 108116. [Google Scholar] [CrossRef]
  14. Kantrales, G.C.; Consolazio, G.R.; Wagner, D. Experimental and analytical study of high-level barge deformation for barge–bridge collision design. J. Bridge Eng. 2016, 21, 04015039. [Google Scholar] [CrossRef]
  15. Wang, J.J.; Song, Y.C.; Wang, W. Calibrations of numerical models by experimental impact tests using scaled steel boxes. Eng. Struct. 2018, 173, 481–494. [Google Scholar] [CrossRef]
  16. Wang, J.; Bu, L.; Cao, C. Code formulas for ship-impact design of bridges. J. Bridge Eng. 2012, 17, 599–606. [Google Scholar] [CrossRef]
  17. Gholipour, G.; Zhang, C.; Mousavi, A.A. Nonlinear numerical analysis and progressive damage assessment of a cable-stayed bridge pier subjected to ship collision. Mar. Struct. 2020, 69, 102662. [Google Scholar] [CrossRef]
  18. Yuan, P.; Harik, I.E. One-dimensional model for multi-barge flotillas impacting bridge piers. Comput.-Aided Civ. Infrastruct. Eng. 2008, 23, 437–447. [Google Scholar] [CrossRef]
  19. Harik, I.; Yuan, P.; Davidson, M. Equivalent Barge and Flotilla Impact Forces on Bridge Piers; Kentuky Transportation Center, College of Engineering, University of Kentuky: Lexington, KY, USA, 2008. [Google Scholar]
  20. Motora, S. On the measurement of added mass and added moment of inertia for ship motions. J. Zosen Kiokai 1959, 105, 83–92. [Google Scholar] [CrossRef]
  21. Petersen, M.J. Dynamics of ship collisions. Ocean Eng. 1982, 9, 295–329. [Google Scholar] [CrossRef]
  22. Pedersen, P.T.; Zhang, S. On impact mechanics in ship collisions. Mar. Struct. 1998, 11, 429–449. [Google Scholar] [CrossRef]
  23. Kim, E.; Storheim, M.; Amdahl, J. Laboratory experiments on shared-energy collisions between freshwater ice blocks and a floating steel structure. Ships Offshore Struct. 2017, 12, 530–544. [Google Scholar] [CrossRef]
  24. Gagnon, R.E.; Wang, J. Numerical simulations of a tanker collision with a bergy bit incorporating hydrodynamics, a validated ice model and damage to the vessel. Cold Reg. Sci. Technol. 2012, 81, 26–35. [Google Scholar] [CrossRef]
  25. Song, M.; Ma, J.; Huang, Y. Fluid-structure interaction analysis of ship-ship collisions. Mar. Struct. 2017, 55, 121–136. [Google Scholar] [CrossRef]
  26. Chen, T.L.; Wu, H.; Fang, Q. Impact force models for bridge under barge collisions. Ocean Eng. 2022, 259, 111856. [Google Scholar] [CrossRef]
  27. Ye, X.; Fan, W.; Sha, Y. Fluid-structure interaction analysis of oblique ship-bridge collisions. Eng. Struct. 2023, 274, 115129. [Google Scholar] [CrossRef]
  28. Pan, J.; Wang, Y.; Huang, S.; Xu, M.C. Statistical Investigation of the Influential Parameters for Probability Analysis of Ship-bridge Collision Based on AIS Data. In Proceedings of the International Ocean and Polar Engineering Conference, San Francisco, CA, USA, 25 June 2017. ISOPE-I-17-714. [Google Scholar]
  29. Standard, N. Design of Steel Structures; Standards Norway: Oslo, Norway, 2004. [Google Scholar]
  30. Alsos, H.S.; Amdahl, J. On the resistance of tanker bottom structures during stranding. Mar. Struct. 2007, 20, 218–237. [Google Scholar] [CrossRef]
  31. Jones, N. Structural Impact; Cambridge University Press: Cambridge, UK, 2011. [Google Scholar]
  32. Sha, Y.; Hao, H. Nonlinear finite element analysis of barge collision` with a single bridge pier. Eng. Struct. 2012, 41, 63–76. [Google Scholar] [CrossRef]
  33. Pan, J.; Wang, T.; Huang, S.W. Investigation of assessment method of axial crushing force of rake bow for bridge against ship collision. Ocean Eng. 2023, 269, 113498. [Google Scholar] [CrossRef]
  34. Song, M.; Kim, E.; Amdahl, J. A comparative analysis of the fluid-structure interaction method and the constant added mass method for ice-structure collisions. Mar. Struct. 2016, 49, 58–75. [Google Scholar] [CrossRef]
  35. Eurocode 1: Actions on structures-Part 1–7: General actions-Accidental actions. Eur. Comm. Stand. 2006, 54, 18–20.
  36. Zhao, H.O. LS-DYNA Dynamics Analysis Guide; The Publishing House of Ordnance Industry: Beijing, China, 2003. [Google Scholar]
  37. Chen, Y.H.; Xiao, Q.Y.; Pan, J.; Xu, M.C. Nonlinear dynamics of ship-bridge pier collisions using FSI method. In Proceedings of the International Conference on Collision and Grounding of Ships and Offshore Structures, Shanghai, China, 16–19 September 2025. [Google Scholar]
  38. Consolazio, G.R.; Cook, R.A.; McVay, M.C. Barge Impact Testing of the St. George Island Causeway Bridge, Phase III: Physical Testing and Data Interpretation, Engineering and Industrial Experiment Station; University of Florid: Gainesville, FL, USA, 2006. [Google Scholar]
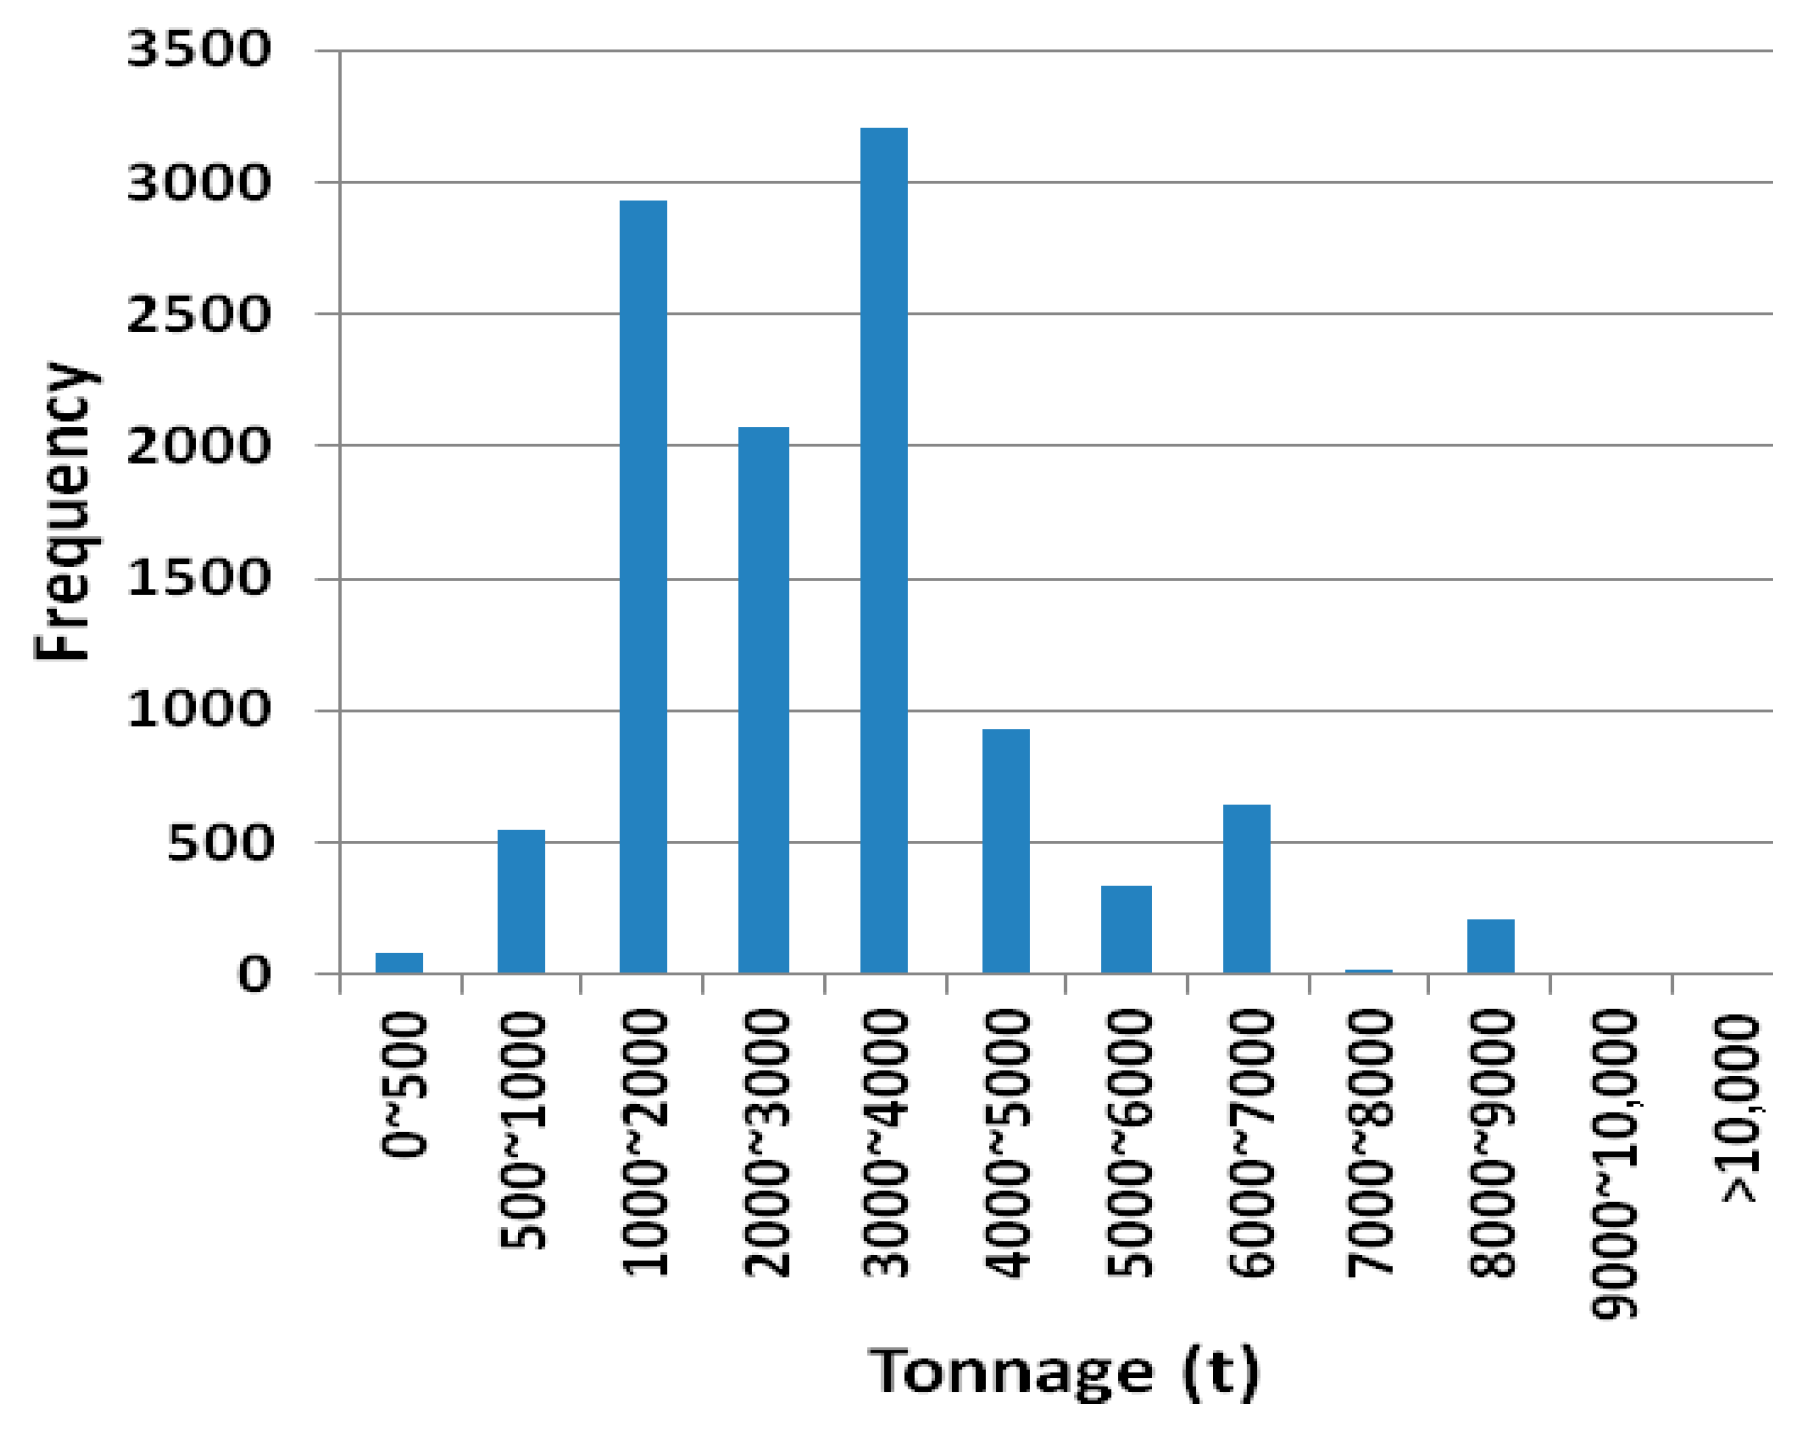
Figure 1. Tonnage distributions of the ships passing the Yangtze River Bridge [26].
Jmse 13 01573 g001
Figure 2. Structural arrangement of the container ship. (a) Side view. (b) Top view. (c) Longitudinal section in the center plane. (d) Main deck. (e) First-floor deck.
Jmse 13 01573 g002
Figure 3. Design principles based on relative strength.
Jmse 13 01573 g003
Figure 4. Finite-element models of the ship and pier. (a) FE model using CAM method. (b) FE model using FSI method. (c) Internal structure model of the ship bow.
Jmse 13 01573 g004
Figure 5. Time history curves of collision force and acceleration in the test and FE analysis with the FSI method [37]. (a) Acceleration. (b) Impact force.
Jmse 13 01573 g005
Figure 6. The initial distance between the ship and the abutment before the collision.
Jmse 13 01573 g006
Figure 7. Time history of ship speed (Ms = 3000 t; Vf = 0 m/s; Vs = 4.8 m/s).
Jmse 13 01573 g007
Figure 8. Force–time curves at different impact distances (Ms = 3000 t; Vf = 0 m/s).
Jmse 13 01573 g008
Figure 9. Force–time curves at different impact velocities (Ms = 3000 t; Vf = 0 m/s). (a) FSI method (b) CAM method.
Jmse 13 01573 g009
Figure 10. Force–time curves at different impact velocities under the CAM and FSI methods (Ms = 3000 t; Vf = 0 m/s). (a) Vs = 1 m/s. (b) Vs = 3 m/s. (c) Vs = 4 m/s.
Jmse 13 01573 g010
Figure 11. Velocity distribution of fluid field in the FE analysis with the FSI method (Ms = 3000 t; Vf = 0 m/s). (a) Vs = 3 m/s (b) Vs = 4 m/s.
Jmse 13 01573 g011
Figure 12. Acceleration-time curves at different impact velocities under the CAM and FSI methods (Ms = 3000 t; Vf = 0 m/s). (a) Vs = 3 m/s (b) Vs = 4 m/s.
Jmse 13 01573 g012
Figure 13. Maximum value of impact force and depth under different methods (Ms = 3000 t; Vf = 0 m/s). (a) Maximum impact force. (b) Maximum impact depth.
Jmse 13 01573 g013
Figure 14. Impact depth distributions of the ship after collision under the CAM method (Ms = 3000 t; Vf = 0 m/s). (a) Vs = 1 m/s. (b) Vs = 2 m/s. (c) Vs = 3 m/s. (d) Vs = 4 m/s. (e) Vs = 5 m/s.
Jmse 13 01573 g014
Figure 15. Impact depth distributions of the ship after collision under the FSI method (Ms = 3000 t; Vf = 0 m/s). (a) Vs = 1 m/s. (b) Vs = 2 m/s. (c) Vs = 3 m/s. (d) Vs = 4 m/s. (e) Vs = 5 m/s.
Jmse 13 01573 g015
Figure 16. Force–time curves at different fluid velocities (Ms = 3000 t; Vs = 3 m/s).
Jmse 13 01573 g016
Figure 17. Velocity distributions of water flow in the longitudinal direction (Ms = 3000 t; Vs = 3 m/s). (a) Before collision. (b) At the moment of the second peak force. (c) End of collision.
Jmse 13 01573 g017
Figure 18. Velocity distributions of water flow in the transverse direction (Ms = 3000 t; Vs = 3 m/s; Vf = 4 m/s). (a) Before collision. (b) At the moment of the second peak force. (c) End of collision.
Jmse 13 01573 g018
Figure 19. Relationship of the peak force to Vf (Ms = 3000 t; Vs = 3 m/s).
Jmse 13 01573 g019
Figure 20. Force–time curves at different ship weights (Vf = 0 m/s; Vs = 3 m/s). (a) FSI method. (b) CAM method.
Jmse 13 01573 g020
Figure 21. Impact force with various ship masses (Vf = 0 m/s; Vs = 3 m/s). (a) Correlation of impact force and depth. (b) Correlation of maximum impact force and ship weight.
Jmse 13 01573 g021
Figure 22. (a) Acceleration histories of ship impact (Ms = 5000 t; Vs = 3 m/s; Vf = 0 m/s). (b) Velocity distribution at peaks.
Jmse 13 01573 g022
Figure 23. Draft of the ship at the end of the collision. (a) Ms = 3000 t. (b) Ms = 4000 t. (c) Ms = 5000 t.
Jmse 13 01573 g023
Figure 24. Stress distributions of the ship bow at different moments (Ms = 5000 t; Vs = 3 m/s, Vf = 0 m/s). (a) FSI method at the first and second peaks. (b) CAM method at the first and second peaks.
Jmse 13 01573 g024
Figure 25. Force–time curves with the same kinematic energy of the ship. (a) FSI method. (b) CAM method.
Jmse 13 01573 g025
Figure 26. Stress distributions of the ship bow at the first peak under the FSI method (Vf = 0 m/s). (a) Ms = 1000 t; Vs = 5.2 m/s. (b) Ms = 3000 t; Vs = 3.0 m/s. (c) Ms = 5000 t; Vs = 2.3 m/s.
Jmse 13 01573 g026
Figure 27. Stress distributions of the ship bow at the second peak under the FSI method (Vf = 0 m/s). (a) Ms = 1000 t; Vs = 5.2 m/s. (b) Ms = 3000 t; Vs = 3.0 m/s. (c) Ms = 5000 t; Vs = 2.3 m/s.
Jmse 13 01573 g027
Figure 28. Comparison of the impact forces with various scenarios using different methods. (a) Influence of impact velocity (Ms = 3000 t, Vf = 0). (b) Influence of ship weight (Vs = 3 m/s, Vf = 0). (c) Influence of fluid velocity (Ms = 3000 t, Vs = 3 m/s).
Jmse 13 01573 g028
Table 1. Added-mass coefficient.
Motion ModeAdded-Mass Coefficient AuthorNotes
Sway0.4Minorsky [5]
Surge0.02–0.07Motora [20]
Sway0.4–1.3Motora [20]
Sway0.50Petersen [21]
Surge0.05Petersen [21]
Surge0.05AASHTO [9]large underkeel clearances (≥0.5 × Draft)
Surge0.25AASHTO [9]small underkeel clearances (≤0.1 × Draft)
Surge0.1European standard [35]
Table 2. Load conditions and peak impact forces.
NO.Ms/tVf/(m/s)Vs/(m/s)Fmax-FSI (MN)Fmax-CAM (MN)Errors
13000−4316.9820.92−23%
23000−2318.2420.92−15%
330000320.4420.92−2%
430002324.7420.9215%
530004327.9320.9225%
630000114.0214.53−4%
730000216.3915.267%
830000431.0624.3322%
930000534.5528.4318%
1010000316.0915.782%
1120000316.7315.925%
1240000326.9921.4321%
1350000331.6424.1024%
14100005.219.7820.31−3%
15500002.321.2120.553%
Note: Fmax-FSI—Peak impact force using the FSI method, Fmax-FSI—Peak impact force using the CAM method.
Table 3. Maximum impact force of different methods under different conditions.
No.Ms/tVf/(m/s)Vs/(m/s)Fmax-FSIFmax-CAMAASHTOIABSETBJTG
130000114.0214.536.577.594.592
230000216.3915.2613.1512.059.184
330000320.4420.9219.7215.7913.776
430000431.0624.3326.2919.1318.358
530000534.5528.4332.8622.1922.9410
610000316.0915.7811.3813.626.1563.6
720000316.7315.9216.118.2912.317.2
830000320.4420.9219.7222.7713.7712
940000326.9921.4322.7726.51815.0715.6
1050000331.6424.125.4529.816.2819.2
113000−4316.9820.9219.7215.7913.776
123000−2318.2420.9219.7215.7913.776
1330000320.4420.9219.7215.7913.776
1430002324.7420.9219.7215.7913.776
1530004327.9320.9219.7215.7913.776
Disclaimer/Publisher’s Note: The statements, opinions and data contained in all publications are solely those of the individual author(s) and contributor(s) and not of MDPI and/or the editor(s). MDPI and/or the editor(s) disclaim responsibility for any injury to people or property resulting from any ideas, methods, instructions or products referred to in the content.