1. Introduction
The growing demand for mineral resources has positioned deep-sea mining as a potential solution to resource shortages. The deep ocean contains abundant polymetallic nodules, cobalt-rich crusts, and polymetallic sulfides, which are rich in copper, nickel, cobalt, and rare earth elements that are essential for new energy technologies [
1]. According to the International Seabed Authority (ISA), an annual production of 3 million tons of dry nodules represents the baseline threshold for commercial mining operations [
2]. Recent progress by organizations such as The Metal Company (TMC) and the Changsha Research Institute of Mining and Metallurgy has achieved phased advancements in deep-sea mining technology, particularly in ore extraction and transportation systems [
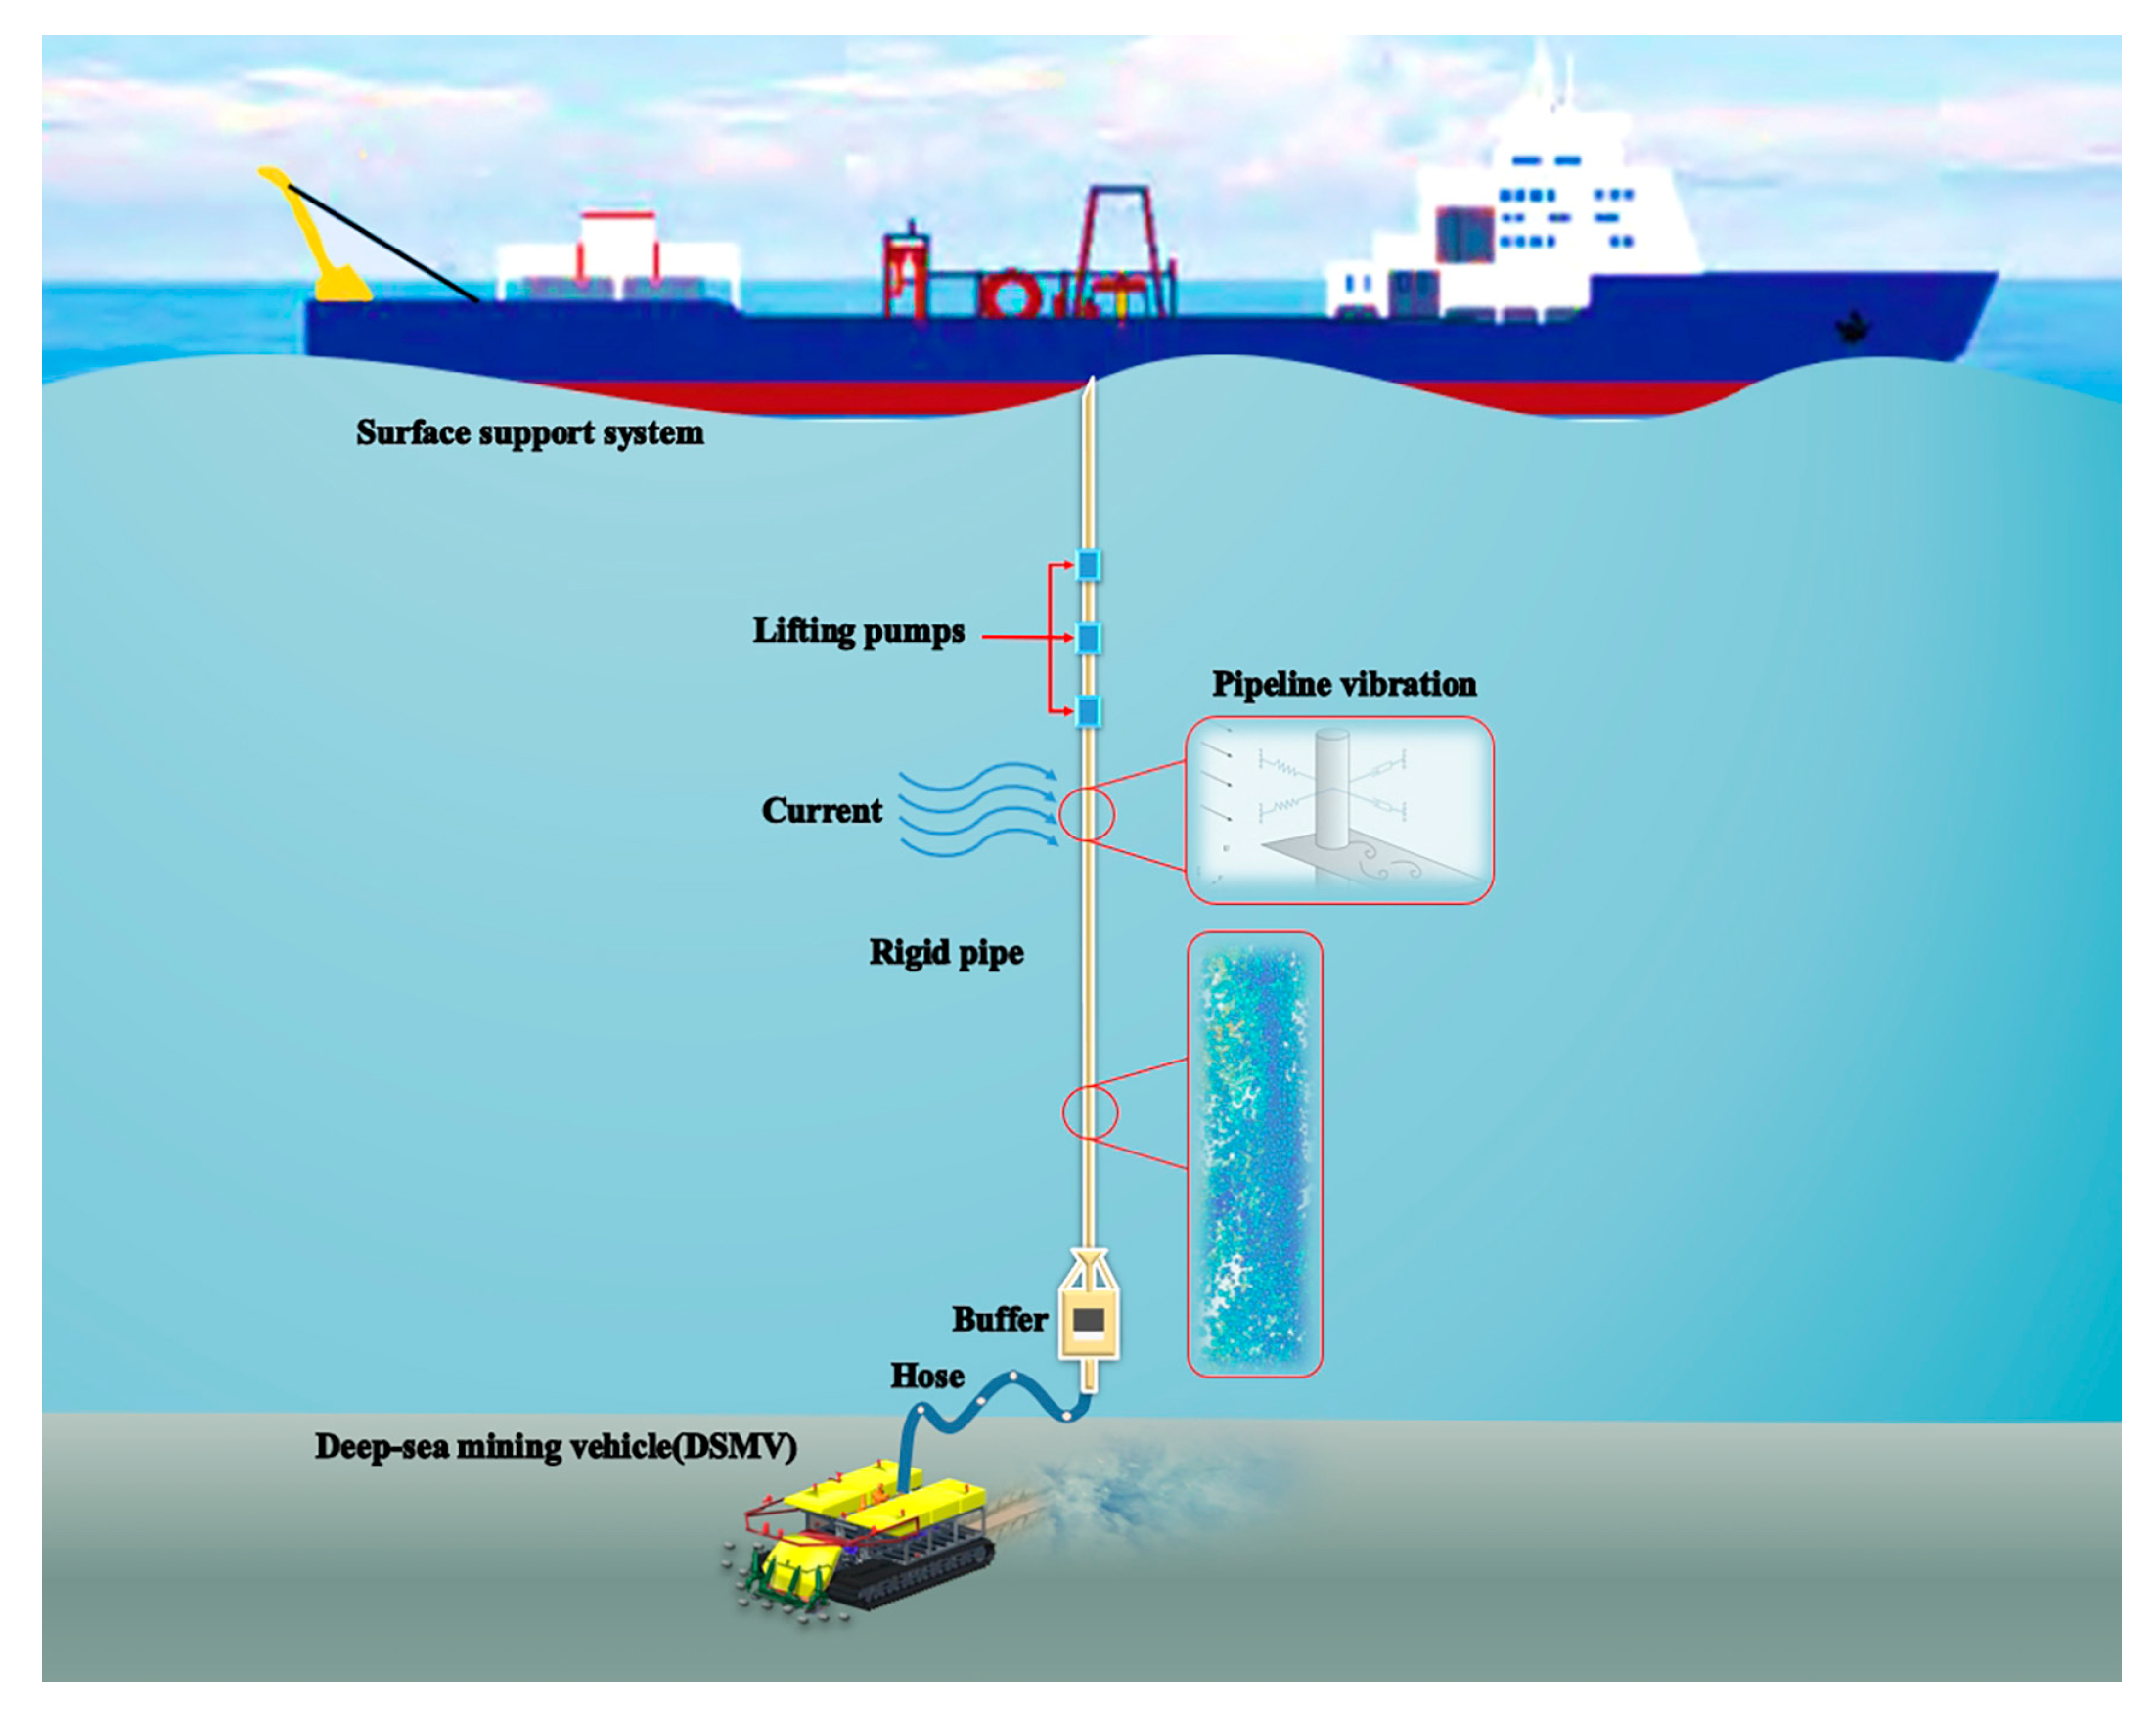
3]. A typical deep-sea mining system comprises surface vessels, riser systems, flexible hoses, and collector vehicles, as illustrated in
Figure 1. The primary technical challenges focus on three aspects: ore transportation and processing, equipment reliability, and marine environmental protection [
4,
5]. The hydraulic lifting system is the critical component connecting seabed operations with surface platforms, determines transportation efficiency, operational safety, and environmental impact [
6,
7]. Over the past decade, vertical transportation tests in depths between between 500–3000 m have demonstrated significant progress. While these systems confirm technical feasibility, scaling them to greater depths (exceeding 6000 m) and commercial payload capacities remain challenging, particularly regarding sustained operation under dynamic hydrodynamic loads [
8]. The most advanced trial approaching the commercial scale was conducted by TMC in 2022, achieving approximately 25% of commercial production [
9]. Despite these medium-scale tests, substantial gaps persist in realizing full commercial operations [
10].
The riser lifting system, as the core technology of deep-sea mining, represents a critical research frontier. An efficient and safe lifting system is supposed to address multiple challenges in slurry transportation. The design and optimization of hydraulic lifting systems are intrinsically linked to both the feasibility of deep-sea mining and its sustainable development [
6]. Major challenges include improving lifting efficiency, safely reinjecting wastewater at depth, and reducing vibration from ocean currents [
11]. This study analyzes the dynamics of riser lifting systems, covering wastewater discharge, pumps, pipes, and buoyancy modules. The goal is to provide useful data and guidance for commercial deep-sea mining operations. The riser system acts as the main channel from the seabed to the surface and must handle both internal slurry flows and external ocean forces [
12]. Particularly under commercial mining conditions at 6000 m depths, pressure loss and vibrational stability become paramount for operational efficiency and safety. Recent studies have used static and dynamic analysis to better understand riser systems. Fan et al. used wake oscillator models to study VIV and its effect on riser fatigue [
13]. Jin et al. combined discrete vortex and finite element methods to show how bottom weight and current speed affect riser motion [
14]. While these models are valuable, their value in commercial mining engineering needs further application research [
15].
Slurry flow characteristics within pumping pipelines constitute another critical research focus. In conventional research, the periodic movement of the pipeline wall is usually ignored. To establish a numerical simulation model for solid–liquid two-phase flow transportation while considering the dynamic boundary, it is necessary to conduct a dynamic study on the deep-sea mining lifting pipeline. Mao et al. used Morison equations and Van der pol wake oscillators to model ocean current effects, finding links between flow density, tension, and riser deformation [
16]. Wan found that vibration amplitude and frequency strongly affect particle motion and wall stress in vibrating risers [
17]. Masanobu et al. showed how pipe inclination and vibration parameters impact pressure drop and resistance loss [
18,
19]. Overall, these studies show that vibration greatly affects both the structure and the inner flow of mining risers. Most current research focuses on stationary pipes, with little attention to vibration effects [
20,
21]. This study aims to better understand the vibration of vertical riser systems under both static and dynamic conditions, reveal control rules for vibration, and lay a foundation for future research on the interaction of multiphase flow and vibration in deep-sea mining pipelines.
This study focuses on the VIV dynamics of a hydraulic lifting riser transport system for 6000 m applications in commercial deep-sea mining operations. Through integrated theoretical analysis and numerical simulations, this research focuses on transverse vibration. The research encompasses the following key aspects:
Dynamic analysis of a deep-sea mining riser system composed of pumps, buffer stations, buoyancy modules was approached through the Iwan-Blevins VIV model, analyzing the buffer drift distance and VIV characteristics under different current velocities, buffer station mass, and slurry densities. We computed the VIV amplitude and frequency of such a riser system with nonlinear tension and figured out the riser VIV amplitude and frequency under different current velocities.
We propose a method to control the VIV amplitude by adjusting internal flow density and buffer mass, which validates and reveals the adjusting mechanisms of ocean currents, internal flow density, and intermediate station weight on vibrational stability.
2. Overall Introduction for a 6000 m Commercial-Scale Deep-Sea Mining Rigid Pipe Lifting System
Based on comprehensive evaluations by the International Seabed Authority (ISA), such as economic feasibility assessments, commercial-scale deep-sea mining of polymetallic nodules requires an annual production capacity of 3 million metric tons of dry nodules (equivalent to 4.3 million wet tons) over a 20-year operational period. For metal sulfides and cobalt-rich crusts, a minimum annual production of 1 million metric tons of dry deposits (equivalent to 1.43 million wet tons) is deemed economically viable [
2]. This study adopts polymetallic nodule extraction as the baseline for design calculations.
Recent studies have demonstrated that riser systems, serving as critical vertical transport conduits between subsea mineral extraction equipment and surface vessel support platforms, represent a highly reliable deep-sea material transfer solution [
17,
22,
23]. In commercial-scale deep-sea mining operations, the design of riser functionality and performance parameters critically governs operational efficiency and safety assurance across the entire mining workflow, while simultaneously addressing multifaceted challenges including marine environmental protection, system sustainability, and compliance with circular economy principles in resource extraction.
2.1. Primary Dimension of Lifting Pipeline
The lifting pipeline’s dimensional design critically governs ore transport efficiency and overall system performance in deep-sea mining operations. This section elaborates on the key design considerations for primary pipeline sizing. Based on the current commercial-scale deep-sea mining requirements, the annual production must not be less than 3 million metric tons of dry nodules, which translates to an average pipeline lifting capacity of approximately 360 metric tons of dry nodules per hour. With the density of polymetallic nodules averaging at 2000 kg/m
3 and a maximum coarse particle size of approximately 50 mm, the settling velocity of non-spherical particles can be calculated using the following formula [
24], where
is the particle shape parameter (typically 0.8 for ore),
and
represent the particle diameter and density, respectively,
means the seawater density, and
is gravity acceleration. The calculated settling velocity is approximately 0.72 m/s.
In vertical pipeline transport design, the slurry lifting velocity is typically set at 3–5 times the particle settling velocity. Based on the calculated settling velocity of 0.72 m/s, the minimum vertical slurry transport velocity ranges from 2.15 to 3.58 m/s. To ensure operational reliability and accommodate potential flow variations, a design-rated velocity of 4 m/s is adopted. With a design-rated volumetric concentration of 12%, the minimum pipeline diameter
can be determined as follows:
In this context,
represents the minimum nodule production rate,
denotes the slurry lifting velocity, and
signifies the volumetric concentration of particles in the slurry. The calculated parameter
. Deep-sea mining riser systems can leverage numerous technologies and design principles from the offshore oil and gas industry, with equipment selection and design criteria often adhering to well-established standards in this field [
11]. The design of the lifting pipeline prioritizes structural strength while minimizing self-weight, requiring a careful balance between load capacity and material efficiency. Based on marine riser design standards, API-grade P110 oilfield steel is selected for its high performance, offering a tensile strength of 900 MPa and a yield strength of 750 MPa. According to API 5L and SCH wall thickness specifications, a 16-inch steel pipe is selected for an internal diameter close to 364 mm. This pipe has a nominal diameter of 400 mm and an actual outer diameter of 406.4 mm. The load-bearing capacity is calculated using the material’s yield strength. A SCH40-grade pipe is chosen, featuring an outer diameter of 406.4 mm, wall thickness of 12.7 mm, and inner diameter of 381 mm. It supports a maximum axial load of 1178 metric tons. Applying a safety factor of 2, the allowable top tension is limited to 589 metric tons during preliminary design. For a 5500 m pipe length, the submerged self-weight is approximately 591 metric tons. Therefore, buoyancy modules must be installed to actively regulate riser tension and ensure operational stability.
Based on the aforementioned calculations and a comprehensive consideration of factors such as pipe diameter, efficiency, and transport concentration, the 16-inch P110 stainless steel riser with an SCH40 wall thickness grade is selected for 6000 m class commercial deep-sea mining transport. This configuration meets the production rate requirements, featuring an outer diameter of 406.4 mm and an inner diameter of 381 mm.
Table 1 compares the primary pipeline dimensions across different commercial designs, demonstrating that the international community holds a consistent perspective on the current main pipeline sizing approach.
2.2. Overall Introduction of the Deep-Sea Mining Riser System
Metal pipelines spanning several kilometers can weigh hundreds of tons. Under the complex conditions of the ocean, the gravitational force of the pipeline generates significant top tension. Attaching buoyancy materials to the outer wall of the metal pipeline can substantially mitigate the self-weight effect, thereby reducing the tensile demand on the lifting system’s top. Commonly used high-strength, solid buoyancy materials are typically composed of low-density glass microspheres, composite foam materials, and resins. These buoyancy materials are uniformly distributed along the pipeline to ensure balanced buoyancy while facilitating maintenance and replacement. Additionally, the density and thickness of the buoyancy materials can be adjusted based on specific sea conditions to optimize buoyancy performance. However, the outer diameter of the pipeline increases significantly after attaching buoyancy materials, leading to more complex dynamic characteristics under ocean currents and operational conditions. This results in greater downstream drift of the pipeline. A detailed hydrodynamic analysis of the lifting system will be conducted in subsequent sections of this study.
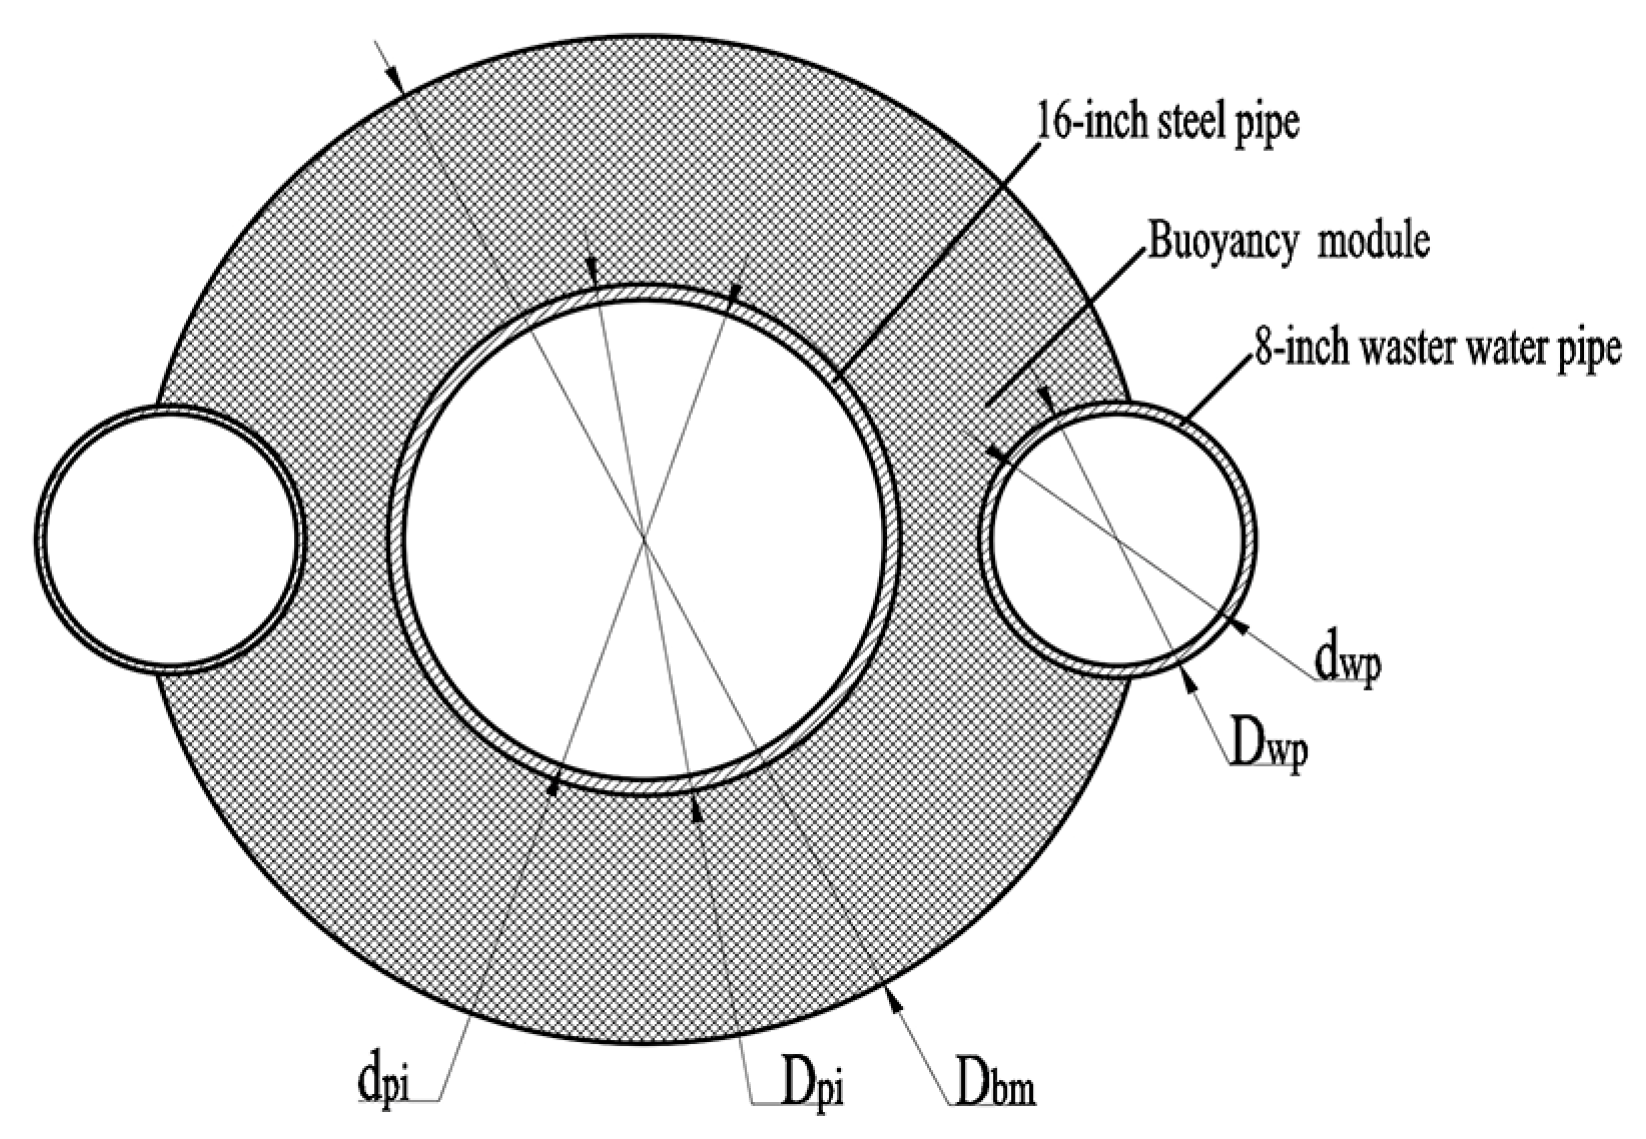
In most oceanic regions, surface currents exhibit higher velocities, particularly within the 0–100 m depth range. To minimize the drag force exerted on the riser at this depth due to ocean currents, buoyancy modules are not deployed within this section. The wastewater is discharged at a depth of 600 m, and the riser spanning 100–600 m is designed as shown in
Figure 2, which incorporates both buoyancy modules and wastewater pipes. For the pipeline section between 600 and 4000 m, the riser is configured as depicted in
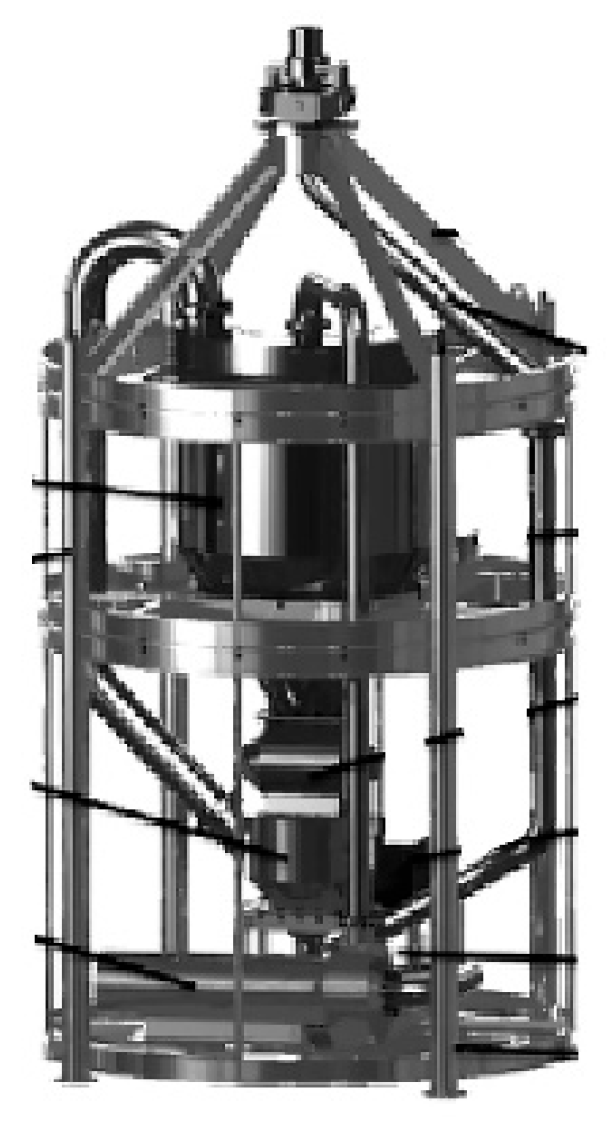
Figure 3, which includes buoyancy modules. The introduction of buoyancy modules significantly increases the outer diameter of the riser, consequently requiring more deck space. However, buoyancy modules are essential for controlling top tension. Proper arrangement and utilization of these modules ensure that the top tension remains within safe limits without incurring excessive costs. In this study, the 6000 m class deep-sea mining riser system employs bare pipes without additional buoyancy modules for the 4000–5500 m section. The riser terminates at a buffer station, as illustrated in
Figure 4.
The buffer station serves to stabilize the ore slurry concentration and provide bottom ballast, thereby enhancing the overall stability of the riser, the buffer at the bottom is also connected to the mining vehicle through a hose and is ignored in this study. Based on the design experience from the “13th Five-Year National Key R&D Program for Polymetallic Nodule Mining Pilot Project”, the total submerged mass of a commercial-grade buffer station, when fully loaded with nodules, is estimated to be approximately 50–100 tons. Under nominal operating conditions, the buffer station uniformly mixes seawater and ore through a Y-shaped pipe and a slurry pump. The lifting pumps are arranged in pairs, spaced 500 m apart, and deployed at depths below 600 m. Each pair of pumps provides a hydraulic head of 426 m under nominal conditions, with three pairs collectively delivering a total head of 1278 m. All hydraulic pressures are calculated based on seawater density. The overall system layout is summarized in
Table 2.
The numerical model of the 6000 m commercial-scale deep-sea mining lifting system is illustrated in
Figure 5. The streamwise direction is defined as the
X-axis and the CF direction is defined as the
Y-axis. The top of the riser is fixed at the water surface, and the motion response of the riser top is not considered in this study. The detailed parameters of the lifting system are not the focus of this paper. The research method of this paper is also applicable to different riser lifting systems. The detailed design process and parameters will not be elaborated here. This model is computed in OrcaFlex, the mining ship and top of the riser are fixed on the sea surface, while the buffer is free.
3. Methodology and Verification
In this study, the deep-sea mining lifting system introduced in the previous chapter will undergo modal analysis, static analysis, and dynamic time-domain analysis using a wake oscillator model under various ocean current conditions, operational scenarios, and bottom loadings. The relevant theoretical methodology is introduced as follows:
3.1. Modal Analysis Method
Modal analysis is a linear vibration theory aimed at determining the natural frequencies and mode shapes of a system. For the deep-sea mining riser, this involves analyzing the free vibration characteristics of the riser structure to identify its natural frequencies (the vibration frequencies in the absence of external excitation). It employs the finite element method (FEM) and the lumped mass method to discretize and model the riser, dividing it into multiple small elements. The mass matrix, stiffness matrix, and damping matrix of each element are then solved. By assembling these matrices, the dynamic equations of the entire system can be constructed. In this study, the riser is modeled with one end hinged to the vessel via a tensioner and stiffness reinforcement device, while the other end is connected to the buffer station through a hose. For simplicity, the influence of the hose on the buffer station and the lifting system is temporarily neglected, and the end is approximated as a free end.
The free vibration equation of an undamped system described by a multi-degree-of-freedom (MDOF) system is given as follows:
and
represent the mass and stiffness matrices of the n-degree-of-freedom system, respectively, and
and
denote the velocity and acceleration components of the system [
26].
Assuming the solution takes the form of Equation (4), substituting it into the above equation yields the eigenvalue equation [
26] as shown in Equation (5), where
represents the modal shape, and both
and
are n × 1 matrices, while
denotes the modal frequency, with
as the initial phase.
The frequency equation for modal analysis can be derived from the non-trivial solution condition of the algebraic eigenvalue equation as follows [
26]:
The positive real solutions of , arranged in ascending order as , represent the n-th order modal frequencies of the n-degree-of-freedom system.
3.2. Static Analysis Method
The static analysis of the pipeline is based on the finite element method (FEM) and the force equilibrium condition, where the sum of external forces acting on a micro-segment equals the bending internal forces within the segment. By neglecting asymmetric factors and torsional effects, the riser is simplified as an Euler–Bernoulli beam. The Euler–Bernoulli Beam Theory is a fundamental theory for describing bending beams and is widely applied in structural mechanics, particularly in the static and dynamic analysis of beams. This theory assumes that the cross-sections of the beam remain plane and undeformed during bending. Additionally, it presumes that the beam’s cross-sections are rigid and that deformation is primarily caused by bending, while shear deformation is neglected. These assumptions make the theory suitable for the analysis of long flexible risers.
The relationship between the bending moment and the curvature of the beam can be described as follows: Assuming the beam bends in a plane perpendicular to its axis, the bending and axial deformation of the beam can be expressed by the following equations [
23]:
In which,
represents the bending moment along the axial direction of the riser.
denotes the bending stiffness of the riser.
is the vertical displacement (i.e., deflection) of the riser along its axial direction.
signifies the axial strain of the riser.
represents the unit node length.
is the axial force acting on the riser.
denotes the tensile stiffness of the riser. For a beam subjected to external forces, the following equilibrium equation holds
represents the component load per unit length applied perpendicular to the axial direction of the riser. This includes the vertical components of ocean current drag, gravity, buoyancy, and other forces acting perpendicular to the riser’s axis. In this study, the internal flow is assumed to be a uniform-density flow, and the effects of internal flow pulsations are neglected.
For an ultra-long riser in equilibrium subjected to fluid resistance from ocean currents, the Morison equation is employed to calculate the fluid drag force and inertial force acting on the riser in static analysis. During static analysis, the inertial force can be neglected, whereas it must be considered in dynamic analysis. The fluid drag force along the x-direction (the direction of the current flow) is calculated as follows [
16]:
is the drag coefficient;
represents the projected area of the riser per unit length exposed to the flow;
is the velocity component of the ocean current in the x-direction;
denotes the added mass coefficient;
is the displacement volume of the riser per unit length [
27].
For the deep-sea riser studied in this paper, when the flow velocity ranges from 0.1 to 2 m/s and the riser diameter varies between 0.4 and 1 m, the Reynolds number can be calculated using Equation (11), where
is the relative velocity between the ocean current and the riser,
is the outer diameter of the riser, and
is the viscosity of seawater. The calculated Reynolds number ranges from 4 × 10
4 to 2 × 10
6. When the ocean current velocity is relatively high, the Reynolds number of the cylindrical riser approaches the critical Reynolds number, resulting in significant variations in the drag coefficient. For the fluid force calculation of deep-sea risers, the drag coefficient
Cd is a crucial parameter, typically ranging from 0.6 to 1.3. However, a uniform drag coefficient does not account for variations caused by changes in flow velocity and riser diameter, which affect the Reynolds number. To improve computational accuracy, this study adopts the drag coefficient which is used in Equation (10) based on the experimental data of Wiesel Berger [
28], as illustrated in
Figure 6.
3.3. Methodology of Dynamics
The dynamic analysis is based on the vibration response of the marine riser, and the behavior of the structure under dynamic environmental loads is described by establishing the differential equation of motion. The dynamic response of the system can be characterized using the classical mass–damping–stiffness model, whose equation is as follows [
29]:
Equation (12) can be solved using the Runge–Kutta numerical integration method, where represents the system damping matrix and denotes the external force matrix. For a riser system with n nodes, both matrices are of size n × 1.
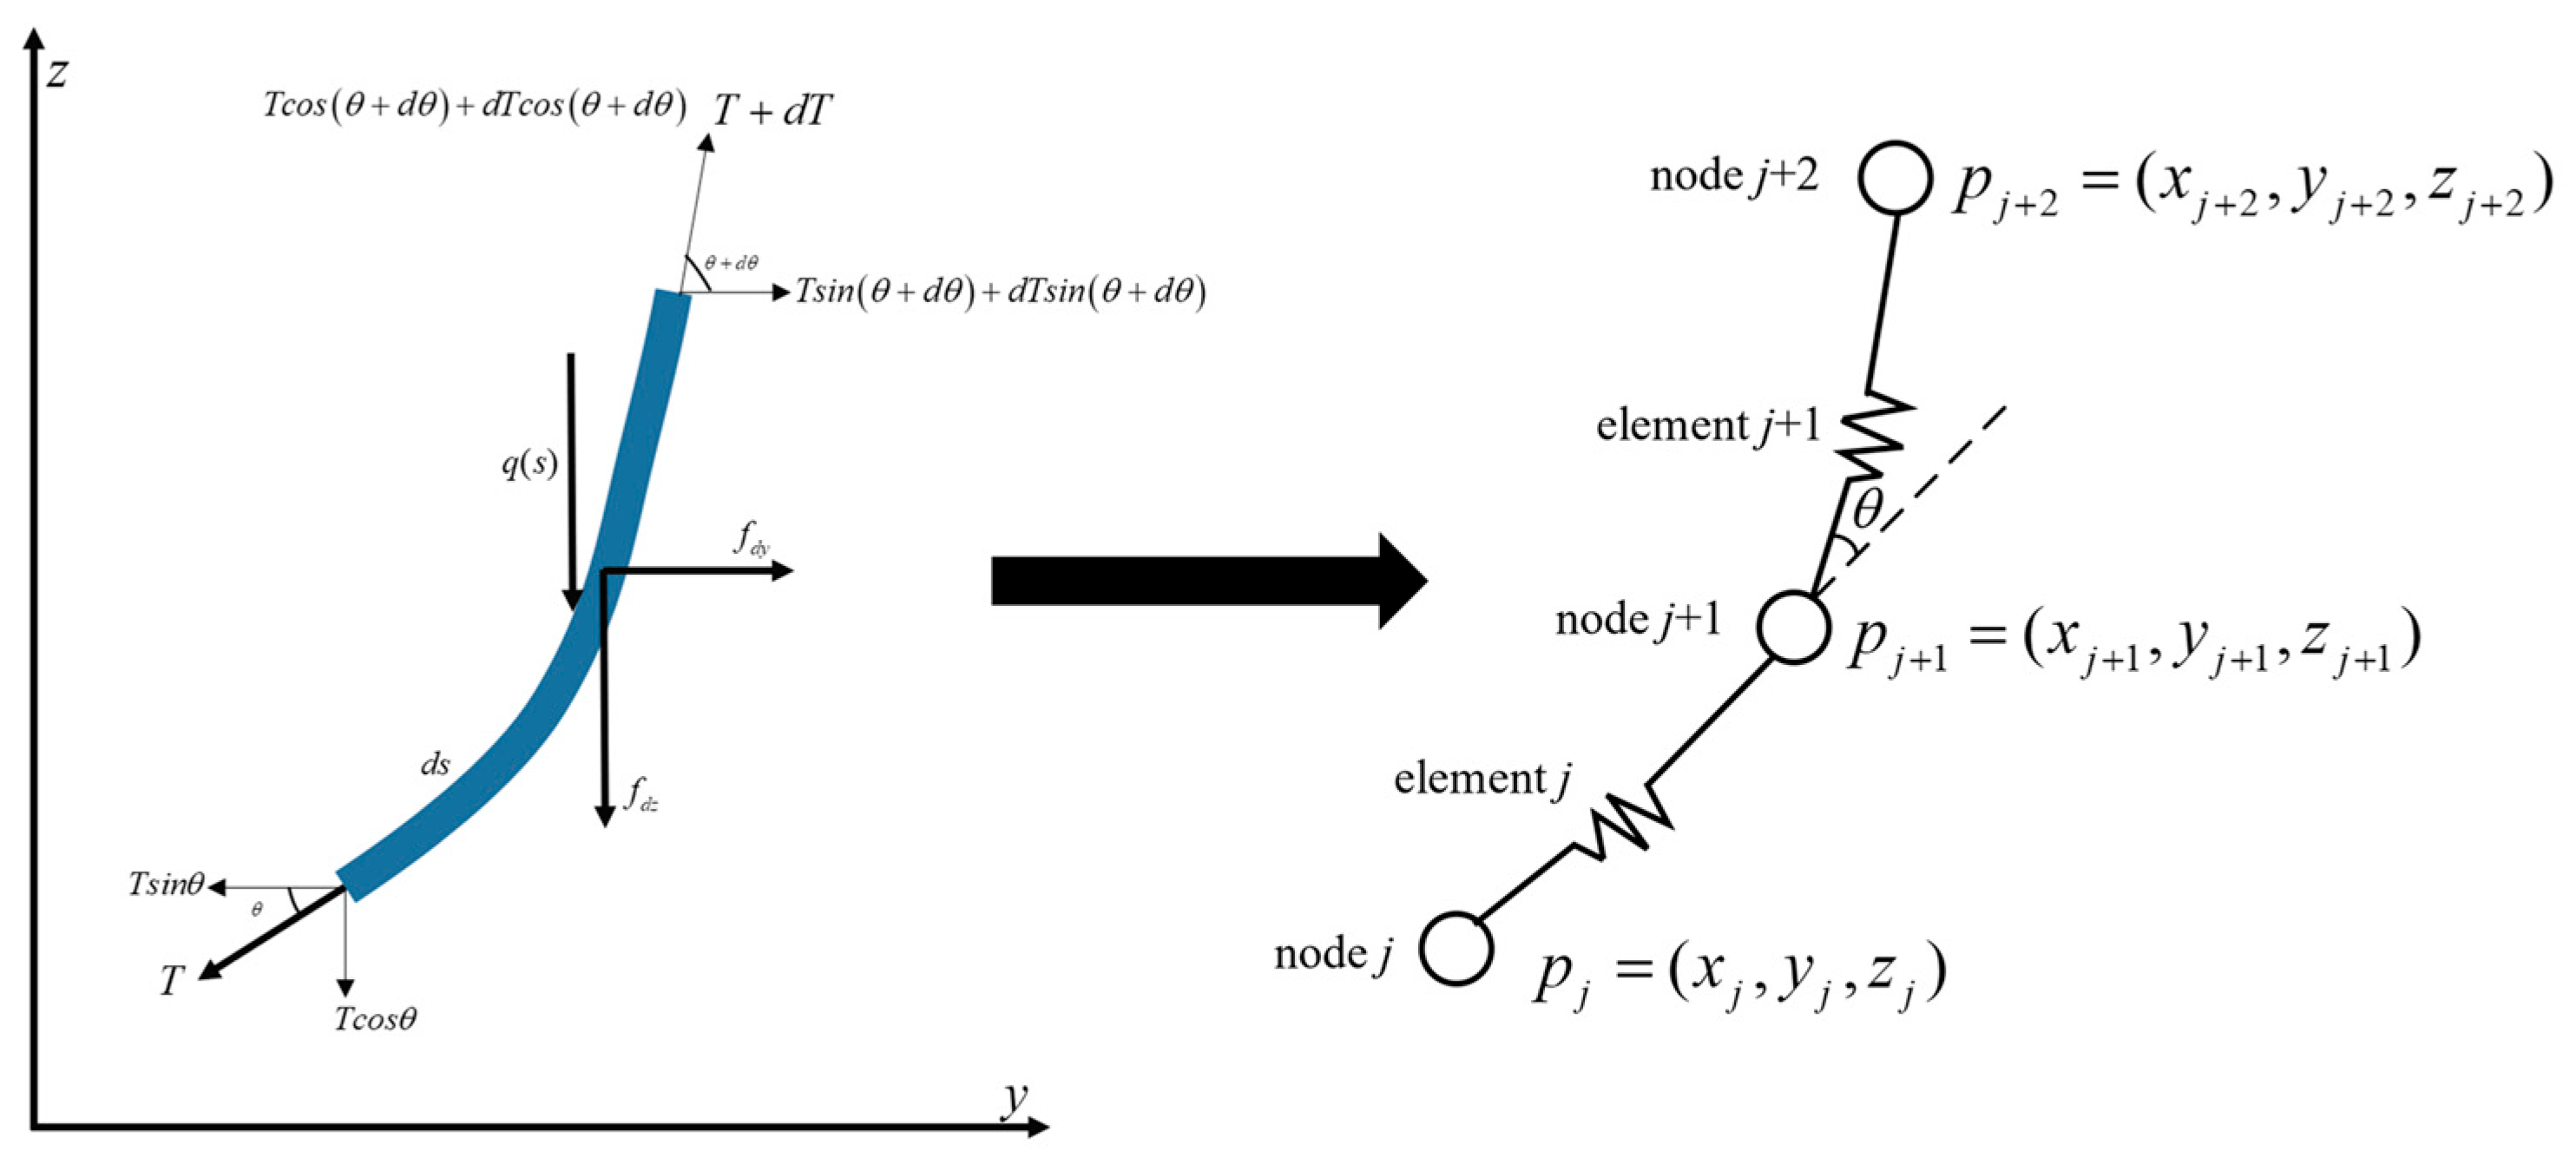
Figure 7 illustrates the schematic diagram of an Euler–Bernoulli beam subjected to external forces. For a micro-segment of the beam, Equation (12) can be further expressed as Equation (13), where
represents the mass per unit length of the beam segment;
denotes the external distributed load along the axial direction of the beam.
For the nonlinear system of equations represented by Equations (12) and (13), solutions are typically obtained using methods such as the multi-rigid body-discrete element method, the slender rod method, and the lumped mass method. In riser systems, the lumped mass method is often employed for numerical computations due to its higher computational efficiency.
The lumped mass method discretizes the riser into elements and nodes (shown in
Figure 8), where the nodes represent concentrated mass points that include the mass, gravity, buoyancy, and drag forces of the elements. The elements, on the other hand, are massless connecting segments that solely represent the damping-stiffness properties. This method simplifies computations while maintaining sufficient physical accuracy. As the number of nodes increases, the model becomes more refined, but the computational cost also rises significantly.
In this study, the explicit method is employed for computations. This method is fundamentally a semi-implicit Euler algorithm with a fixed time step. The initial conditions are derived from the results of the static analysis, and the computation proceeds iteratively with a fixed time step. Newton’s second law is applied to node
j with mass
[
30].
In above equation,
represents the coordinate position of node
j;
denotes the total external force acting on element
j, applied as a concentrated force at node
j;
is the internal structural damping force;
represents the internal structural elastic force. Once the initial acceleration
is obtained, the explicit method is used to advance the computation with a fixed time step [
30].
To ensure the accuracy of the computational results, the semi-implicit Euler method requires a sufficiently small time step to eliminate integration errors. To accurately simulate the VIV behavior of the riser in an ocean current environment, this study employs the Iwan-Blevins Wake Oscillator Model. This model is a significant tool for describing the nonlinear dynamic response of cylindrical structures undergoing VIV. It originated from the lift oscillator model proposed by Bishop and Hassan and was further refined by incorporating early theories from Hartlen and Currie as well as Skop and Griffin [
31]. The model aims to describe the dynamic coupling between the structure and the fluid by coupling the vortex-induced lift force into the structural vibration equations. Its numerical control form is as follows [
32]:
where
represents the wake coupling force variable in the transverse vibration (y-direction);
denotes the transverse vibration displacement of the pipeline;
and
are constant terms that could be calculated by
, derived from experimental data obtained by Blevins [
32];
represents the vortex shedding frequency of the wake, which is related to the Strouhal number
and is calculated as follows:
For the riser in the Iwan-Blevins Wake Oscillator Model [
32], the transverse external force is calculated as follows:
Equations (17) and (19) are coupled through the interaction between the wake variable
and the structural displacement
, forming a complete dynamic system that describes vortex-induced vibrations. The nonlinear terms in the equations constitute a high-order, nonlinear coupled system, capable of exhibiting typical nonlinear phenomena, including frequency lock-in, multi-stable behavior, amplitude jumps, and hysteresis. In particular, the nonlinear terms
and
provide the mechanism for self-excited oscillations in the system [
33].
3.4. Verification and Validation
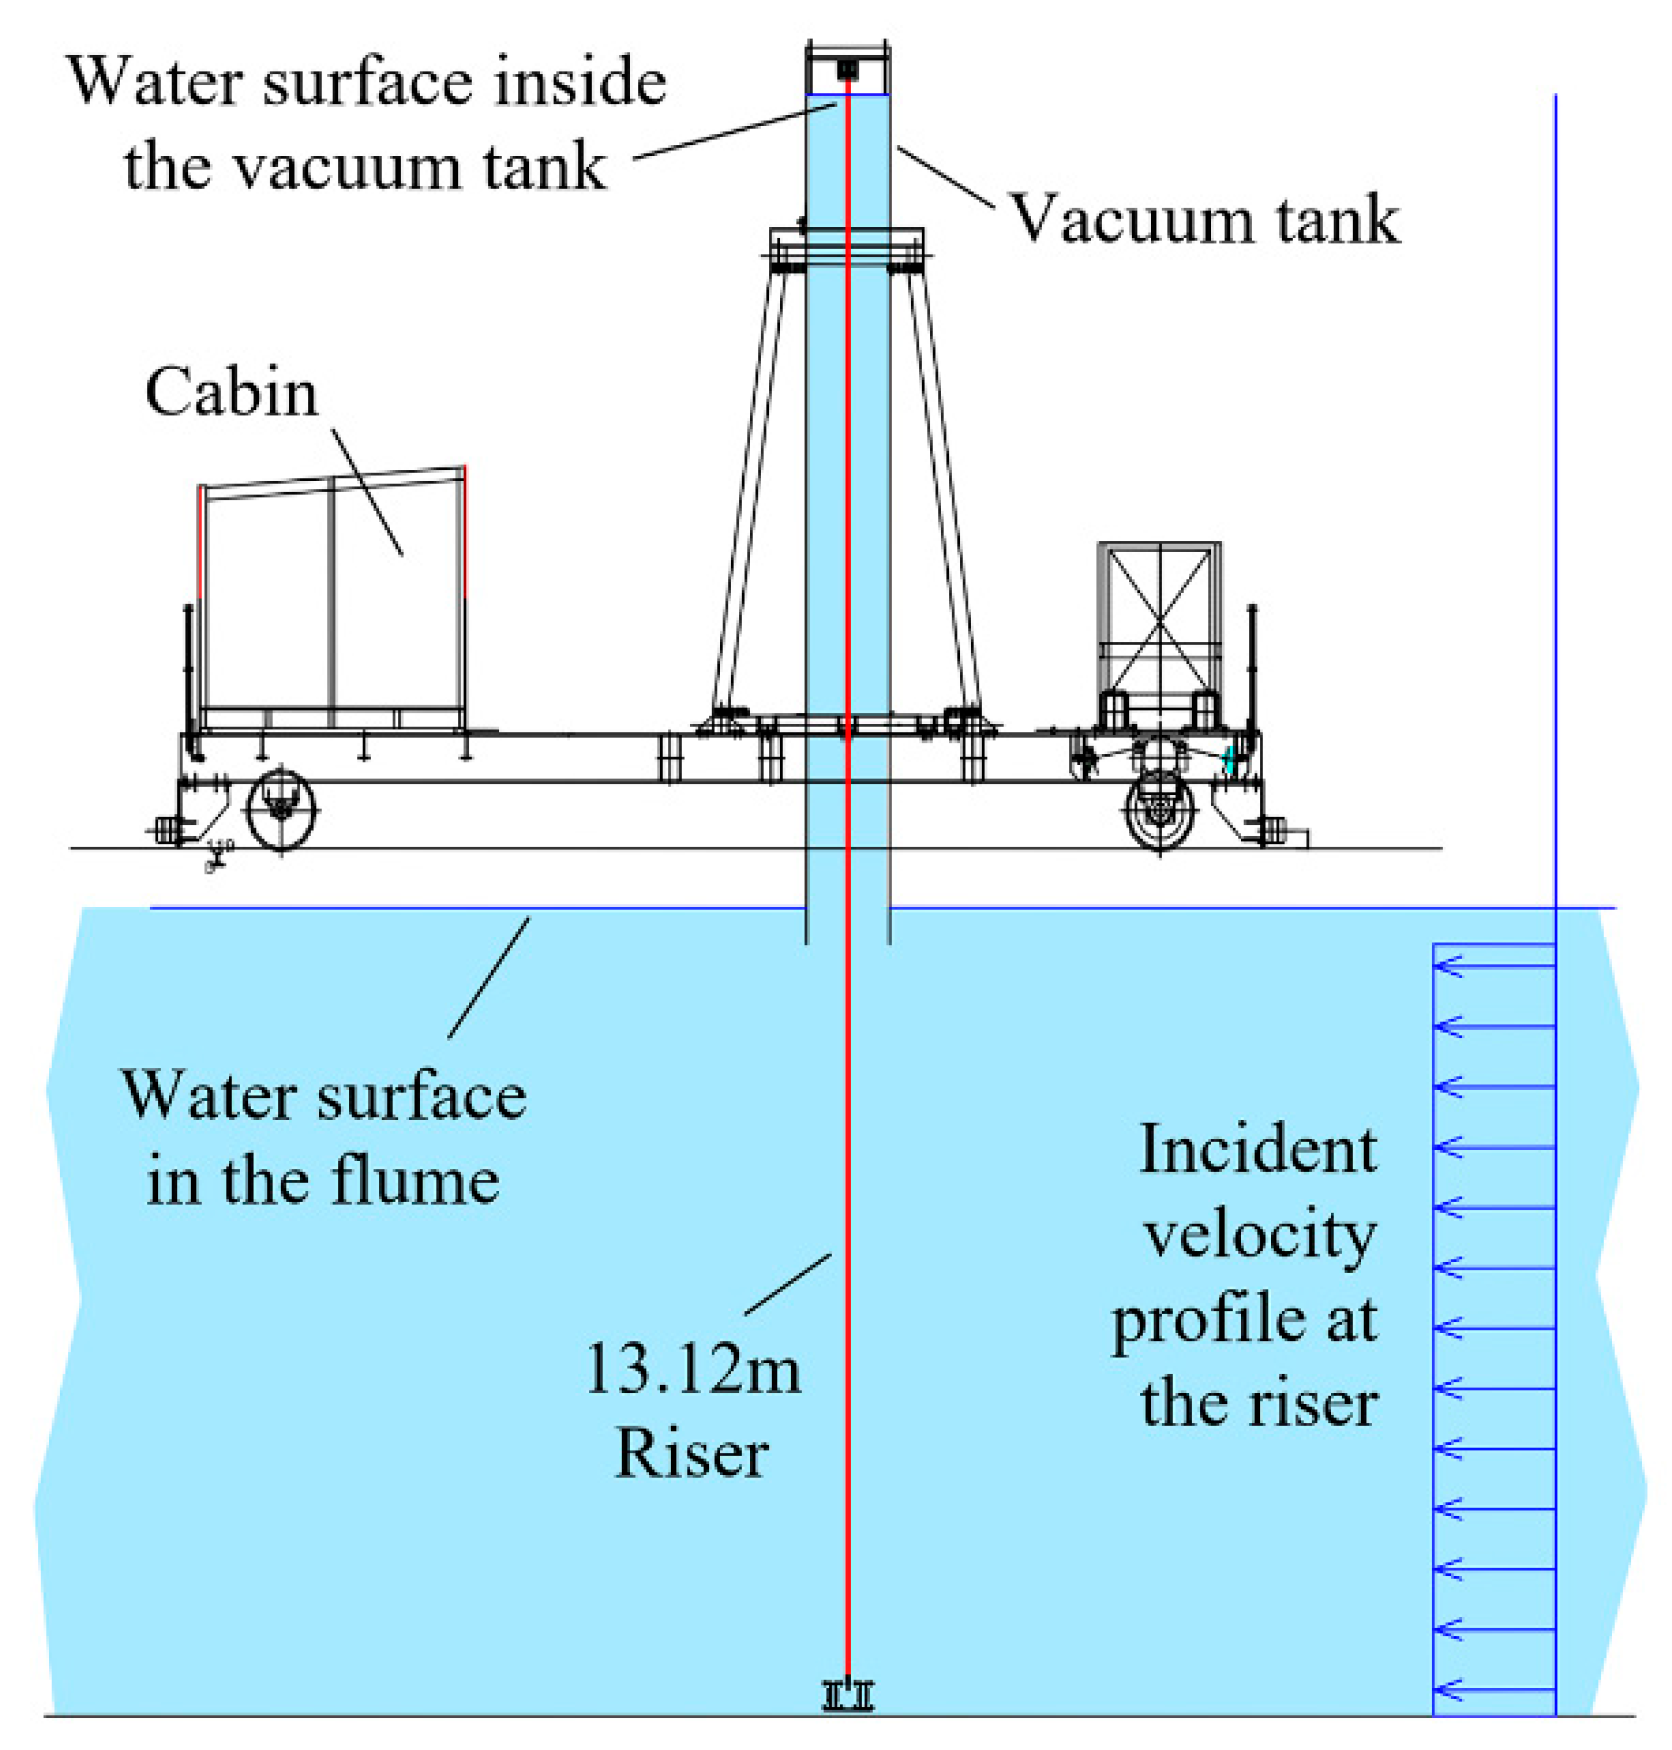
To validate the accuracy of the simulation method, a slender stepped riser case with an aspect ratio of 468 was simulated, and the results were compared with the experimental data from Chaplin et al. [
34]. The experiment was conducted in the Delta Flume at Delft Hydraulics, which measures 230 m in length, 5 m in width, and 6.5 m in depth. A towing carriage provided a uniform flow with a maximum velocity of 1 m/s. The experimental riser had a total length of 13.12 m, an outer diameter of 28 mm, a mass ratio of 3.0, a bending stiffness of 29.9 Nm
2, and a structural damping ratio of 0.33%. The riser was constructed using a phosphor bronze core rod and a fluoroplastic outer tube, with water filled inside to simulate actual marine conditions. During the experiment, the bottom 45% of the riser was exposed to the uniform flow, while the top 55% remained in still water. The experimental setup is illustrated in
Figure 9.
Chaplin et al. [
34] experimentally determined the first seven modal frequencies of the riser under different top tensions by adjusting the tension using a spring at the top. The comparison between the simulation results obtained in this study and the experimental data is presented in
Table 3. It can be observed that the simulation results are in close agreement with the experimental data, with small errors (less than 5%) across various top tension conditions. This demonstrates that the calculation of natural frequencies is reliable.
For the dynamic validation, a case with a top tension of 939 N and a uniform flow velocity of 0.85 m/s was selected. This case has been widely used as a benchmark in riser dynamics research by numerous scholars to validate the accuracy of numerical simulation methods [
14,
35,
36]. The first and second modal frequencies of the riser in still water for this case were calculated to be 0.711 Hz and 1.427 Hz, respectively. These results are consistent with the findings reported in Jin et al.’s study [
14].
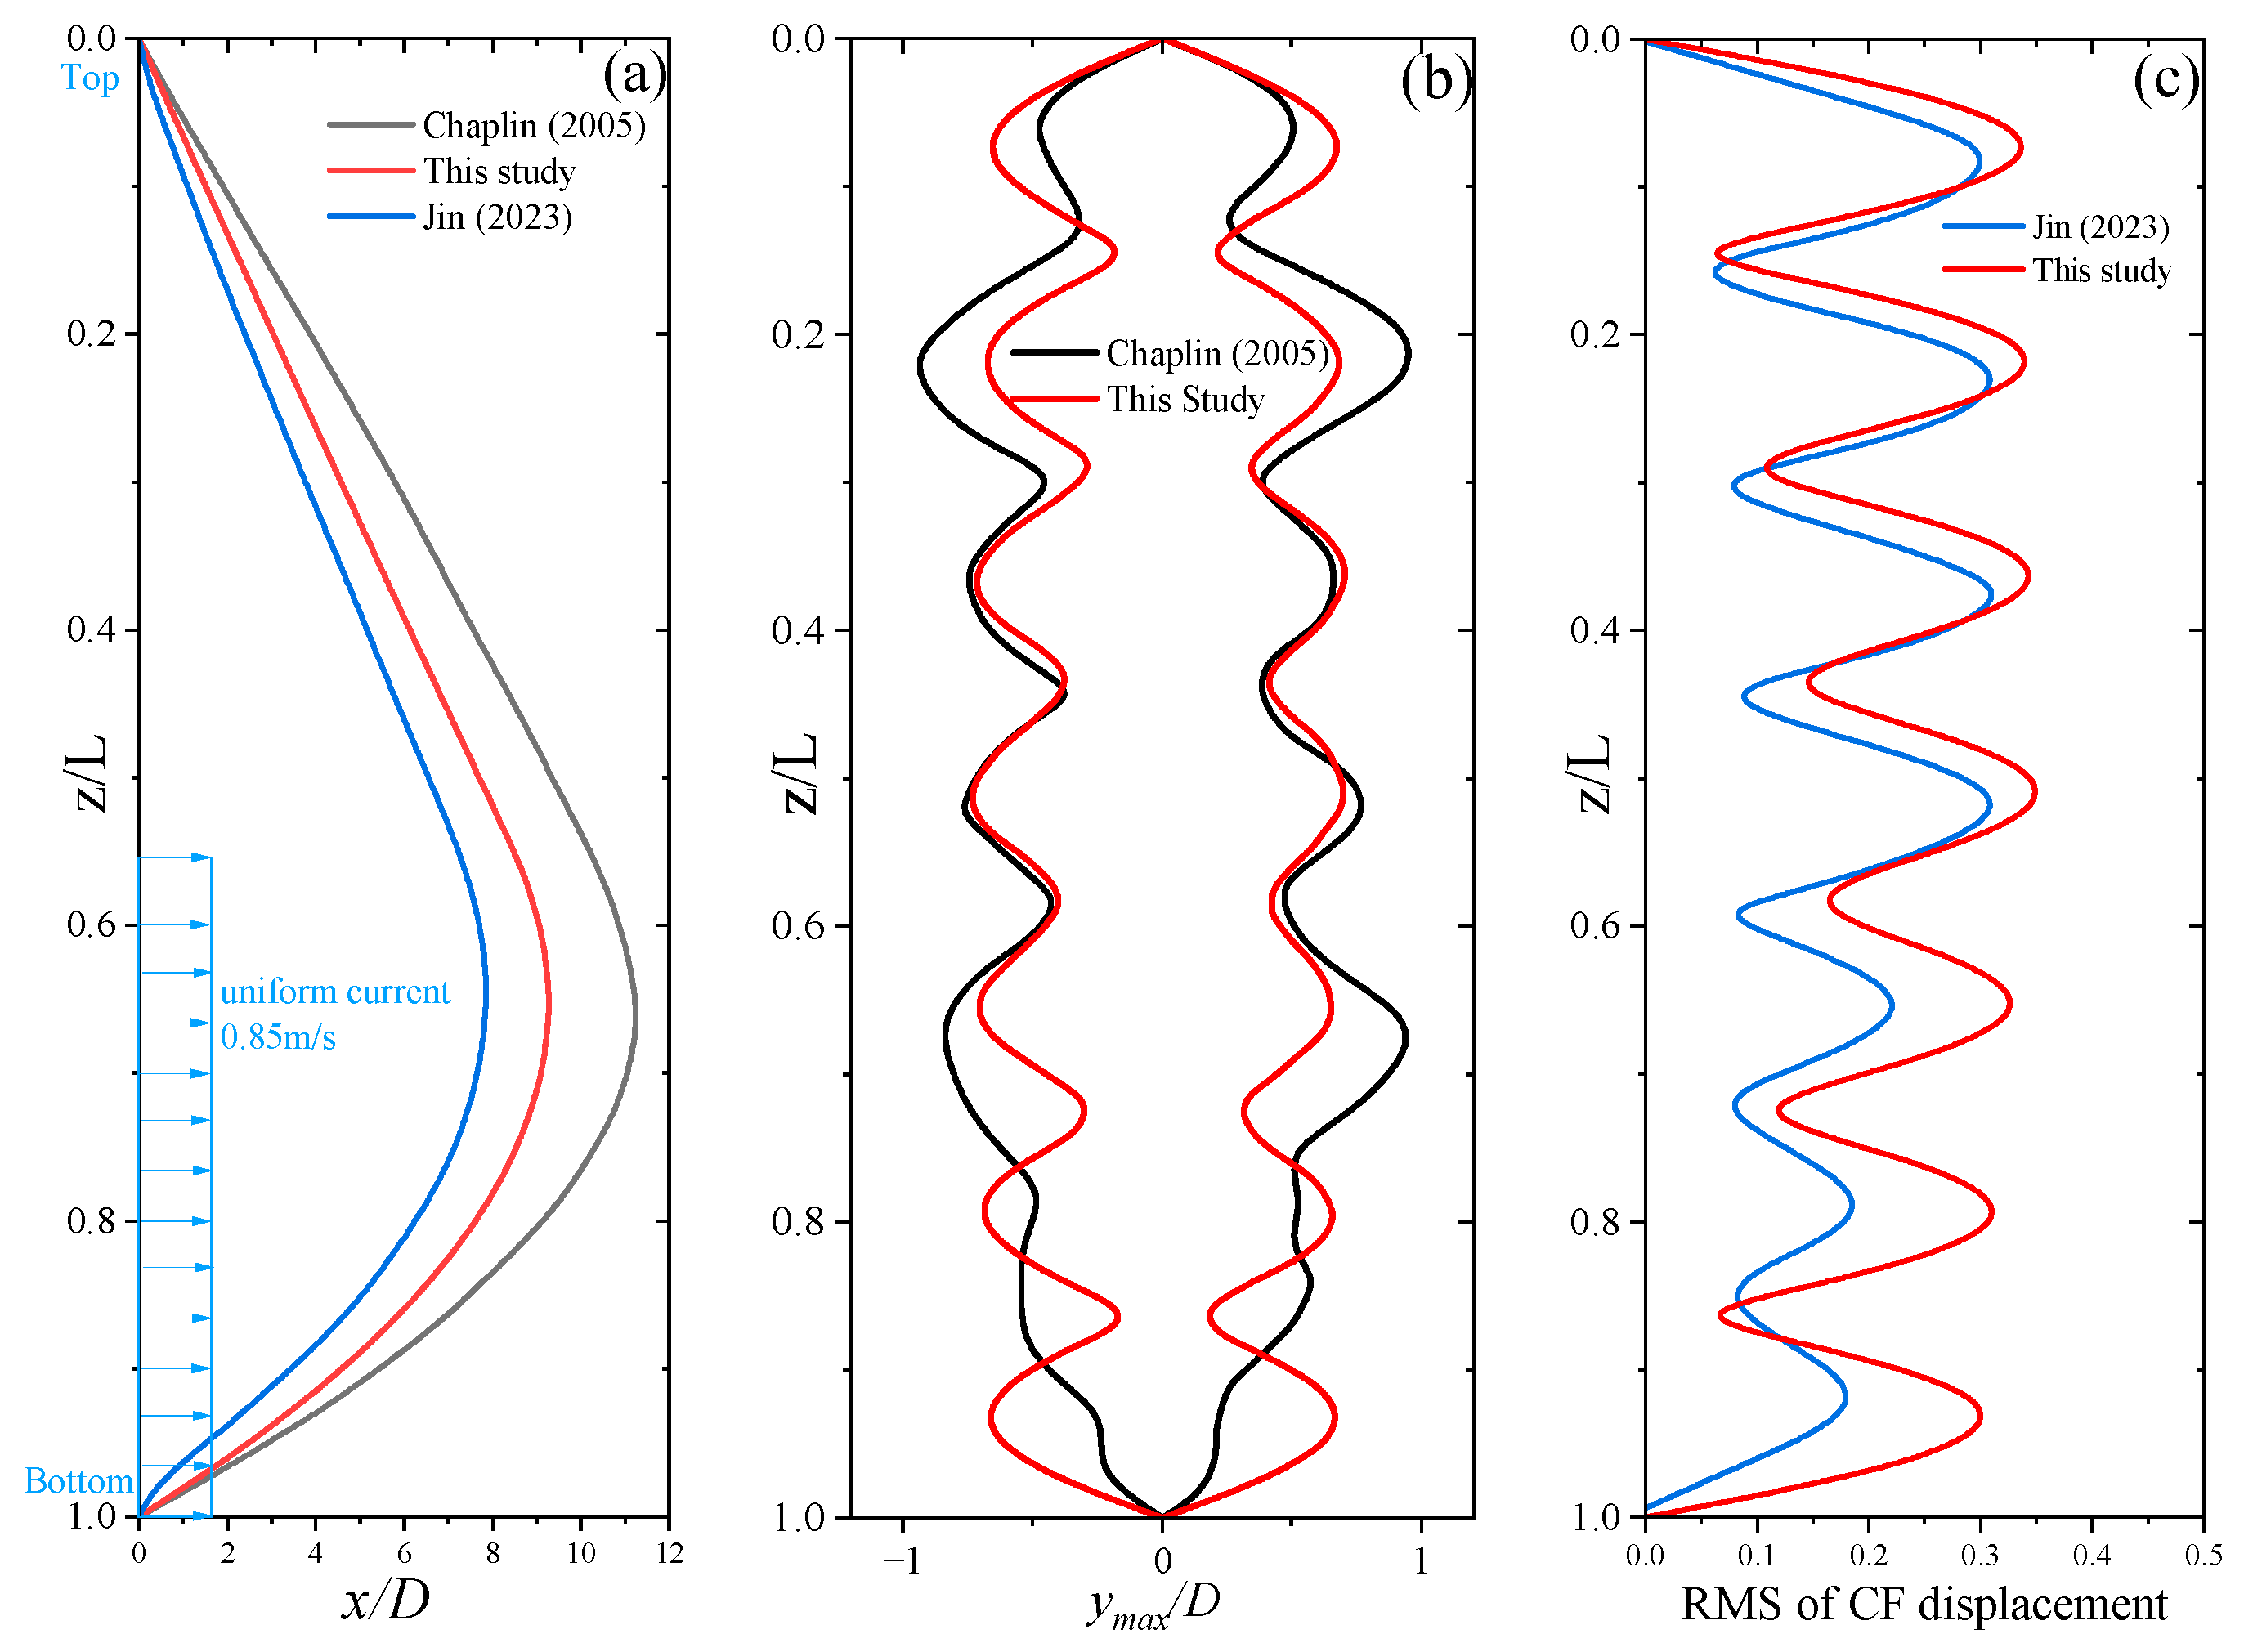
Figure 10 compares the results obtained using the numerical simulation method proposed in this study with the experimental results from Chaplin [
34] and the numerical simulation results from Jin et al. [
14]. Both studies are highly regarded for their credibility and accuracy. In
Figure 10a, the comparison of the mean displacement amplitude in the streamwise direction is shown. The results from this study are slightly smaller than the experimental results but slightly larger than Jin’s simulation results. This discrepancy arises because Jin employed a weakly coupled DVM-FEM, and Chaplin observed that the DVM method generally underestimates the streamwise motion amplitude by 30–50% [
36], which is also consistent with the result of
Figure 10a.
Figure 10b illustrates the maximum displacement envelope in the CF direction. The results from this study align closely with the experimental results in terms of the maximum displacement amplitude, with both exhibiting a vibration mode dominated by the seventh natural frequency. Chaplin et al. [
36] reached a similar conclusion using Orcina’s wake oscillator model. The slight differences may be attributed to the fact that the experimental riser was not perfectly homogeneous or simply supported, and the numerical method in this study simplified some nonlinear factors.
Figure 10c compares the RMS values of the CF vibration displacement. The results from this study show slightly higher amplitudes than those from Jin et al. [
14], with both being dominated by the seventh mode. The two sets of results exhibit high consistency in response frequency and amplitude.
Through the validation of the above cases, it is demonstrated that the numerical simulation method adopted in this study achieves high accuracy in calculating VIV responses of long flexible risers. Therefore, the results obtained by applying this method to the deep-sea mining lifting system introduced in
Section 2 are reliable and credible.
4. Statics and Modal Analysis of the Lifting System
A commercial-scale deep-sea mining lifting system with a length of 6000 m was introduced in the previous chapter. In deep-sea mining, static analysis of the riser system is crucial for ensuring its structural integrity, stability, and safety. The deep-sea mining lifting system connects the pump, buffer station, and other equipment such as cables through a steel riser. Its dynamic characteristics are directly related to the safety and efficiency of operations. The dynamic response of the deep-sea riser under ocean current excitation is intricately linked to its inherent vibration properties and VIV characteristics. Studying the inherent vibration properties of the lifting system facilitates further dynamic response analysis of the mining lifting system.
In this chapter, modal analysis and static analysis of the riser lifting system were conducted in OrcaFlex, the element length is set 1 m meter after grid independence verification. The Line component is used to construct the deep-sea mining lifting system, with the following simplifying assumptions: (1) the effects of cables and joint connections are neglected.; (2) the lifting pump and buffer station are simplified as cylindrical structures with a specific diameter; (3) torsional effects are ignored; (4) the influence of the hose system on the rigid riser lifting system is neglected; (5) the bending stiffness correction factor is applied to account for the bending variations caused by the non-uniform arrangement of the wastewater pipe and buoyancy materials; (6) asymmetric factors are ignored.
4.1. The Influence of Quality and Concentration on the Mode
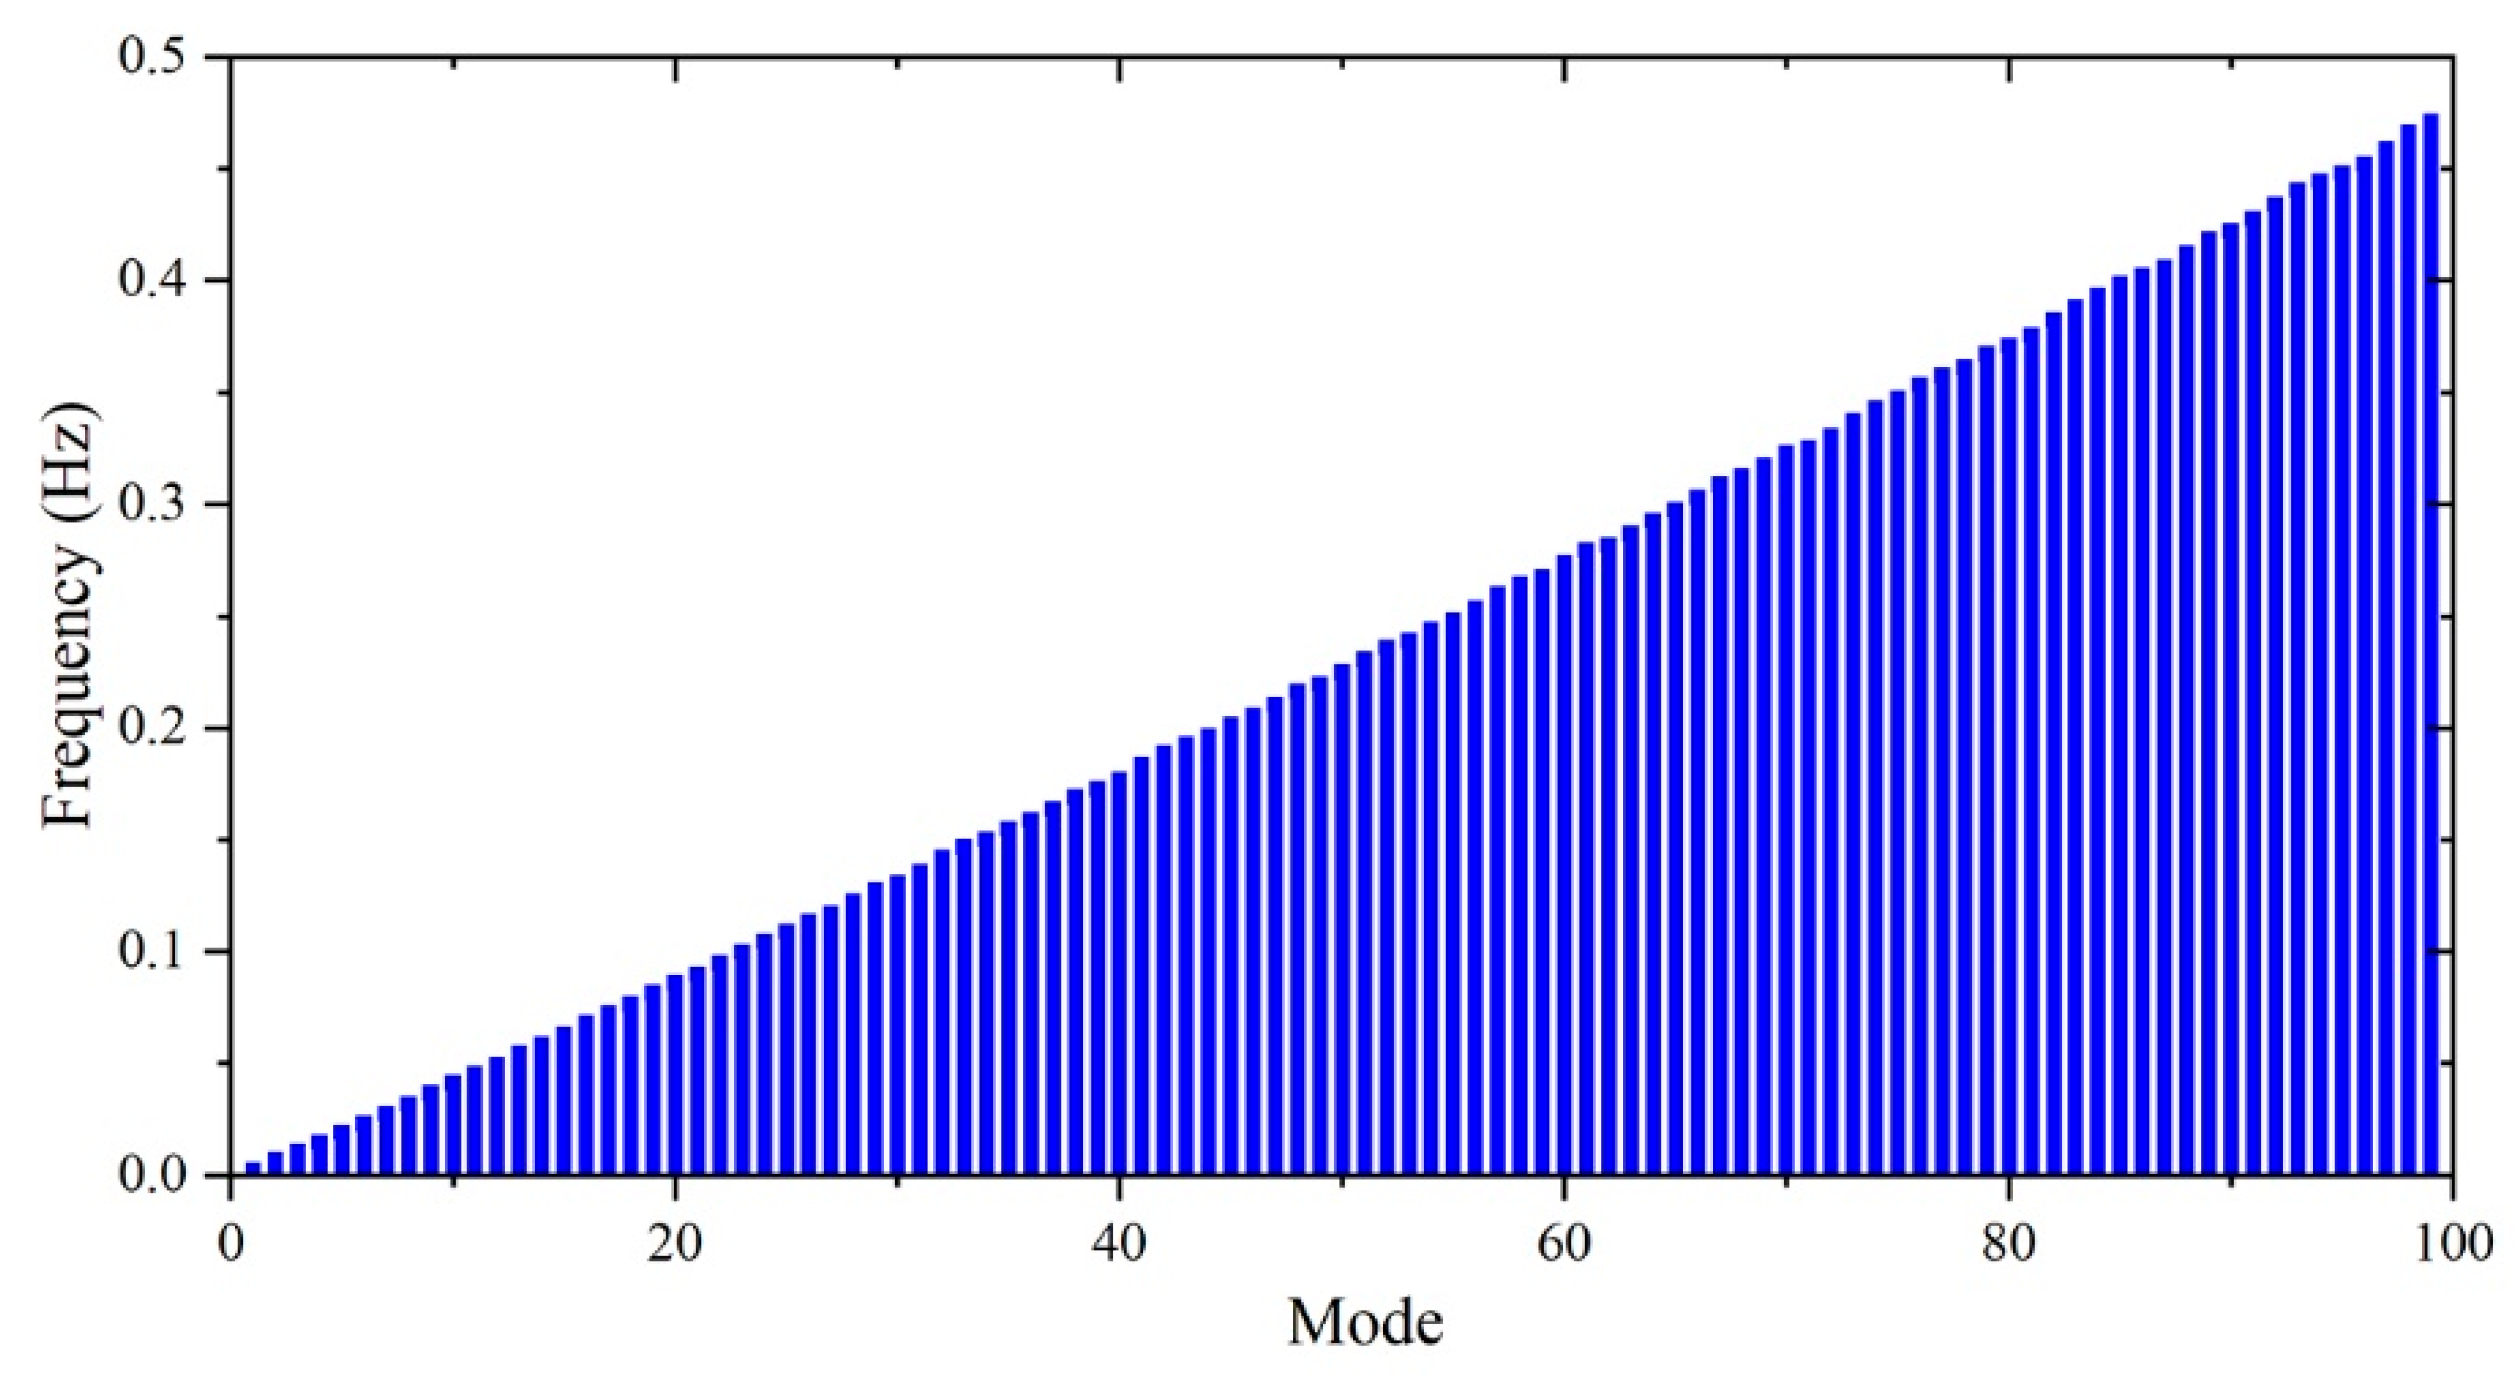
Due to symmetry, the mode shapes and natural frequencies of the lifting system are identical in two orthogonal planes. When the conveying system is stationary and the internal flow consists solely of seawater (i.e., the particle volume concentration is 0), the modal frequencies in the transverse direction are shown in
Figure 11.
The buffer serves to receive ore transported through the hose, temporarily store it, and then deliver a uniformly mixed slurry to the rigid pipe conveying system, ensuring a more stable particle concentration within the riser lifting system.
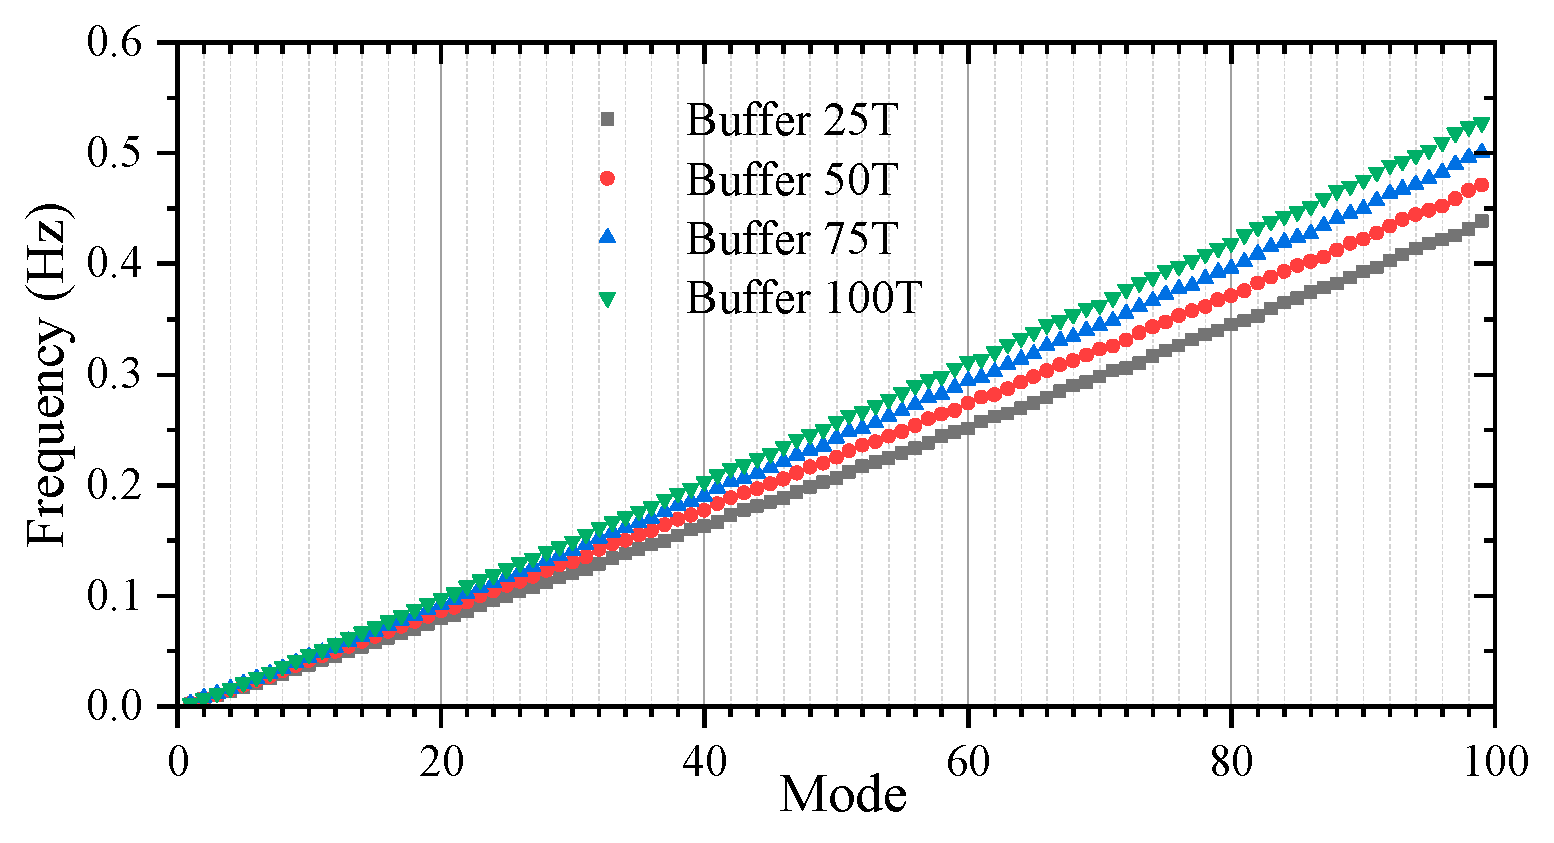
Figure 12 shows the first 100 modal frequencies of the lifting system for different underwater masses of the buffer. The underwater mass of the buffer significantly influences the frequency characteristics, with a linear increase in the relationship between mass and frequency changes.
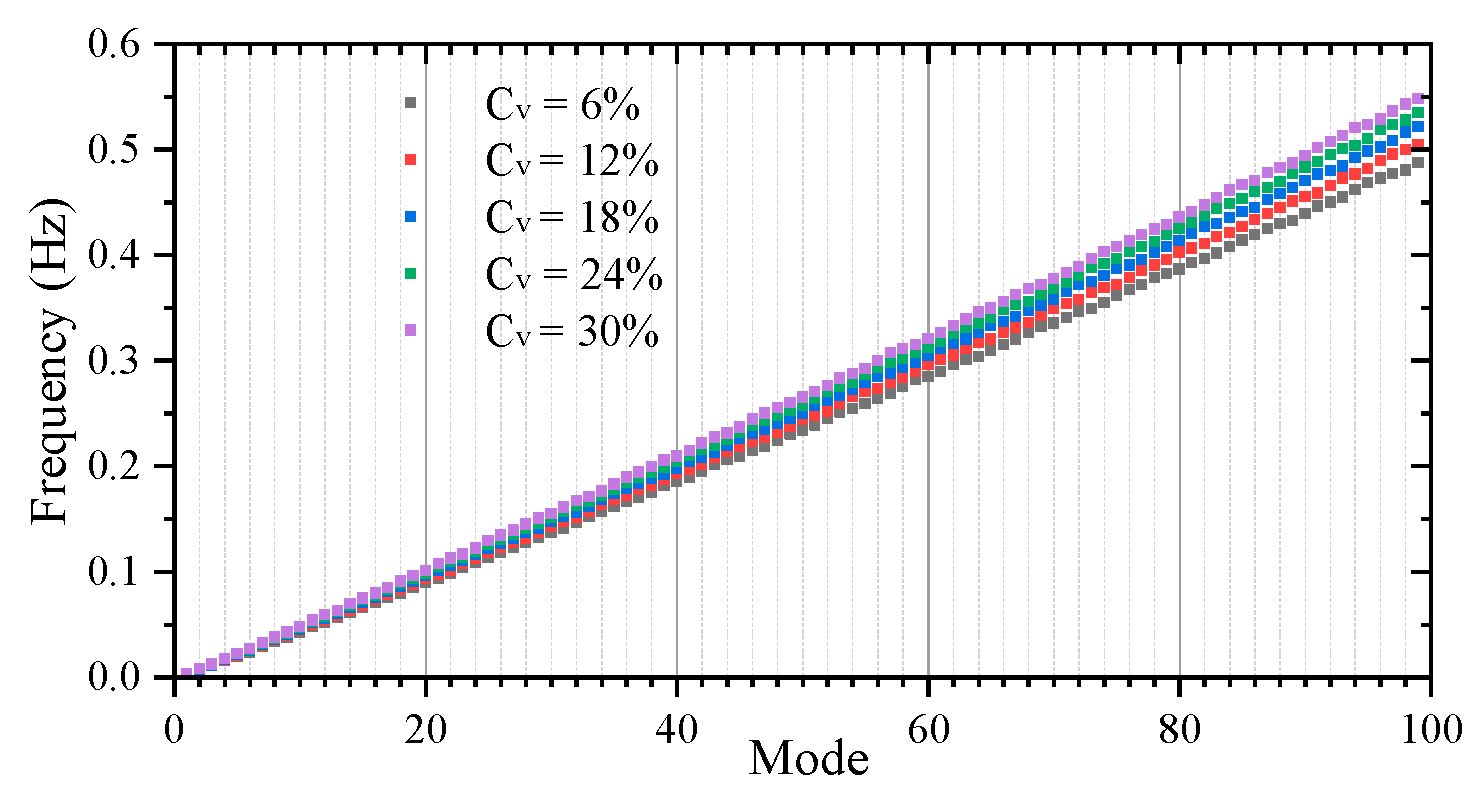
Figure 13 illustrates the first 100 modal frequencies of the lifting system for different particle volume concentrations, using manganese nodules as an example, with an average density of approximately 2000 kg/m
3. It can be observed that as the concentration increases, the frequencies of the lifting system exhibit a slight linear increase. In actual mining operations, the volume concentration typically fluctuates between 6% and 18%, resulting in insignificant changes in the lifting system’s frequencies.
4.2. The Influence of Ocean Current and Riser Tension on Buffer Drift
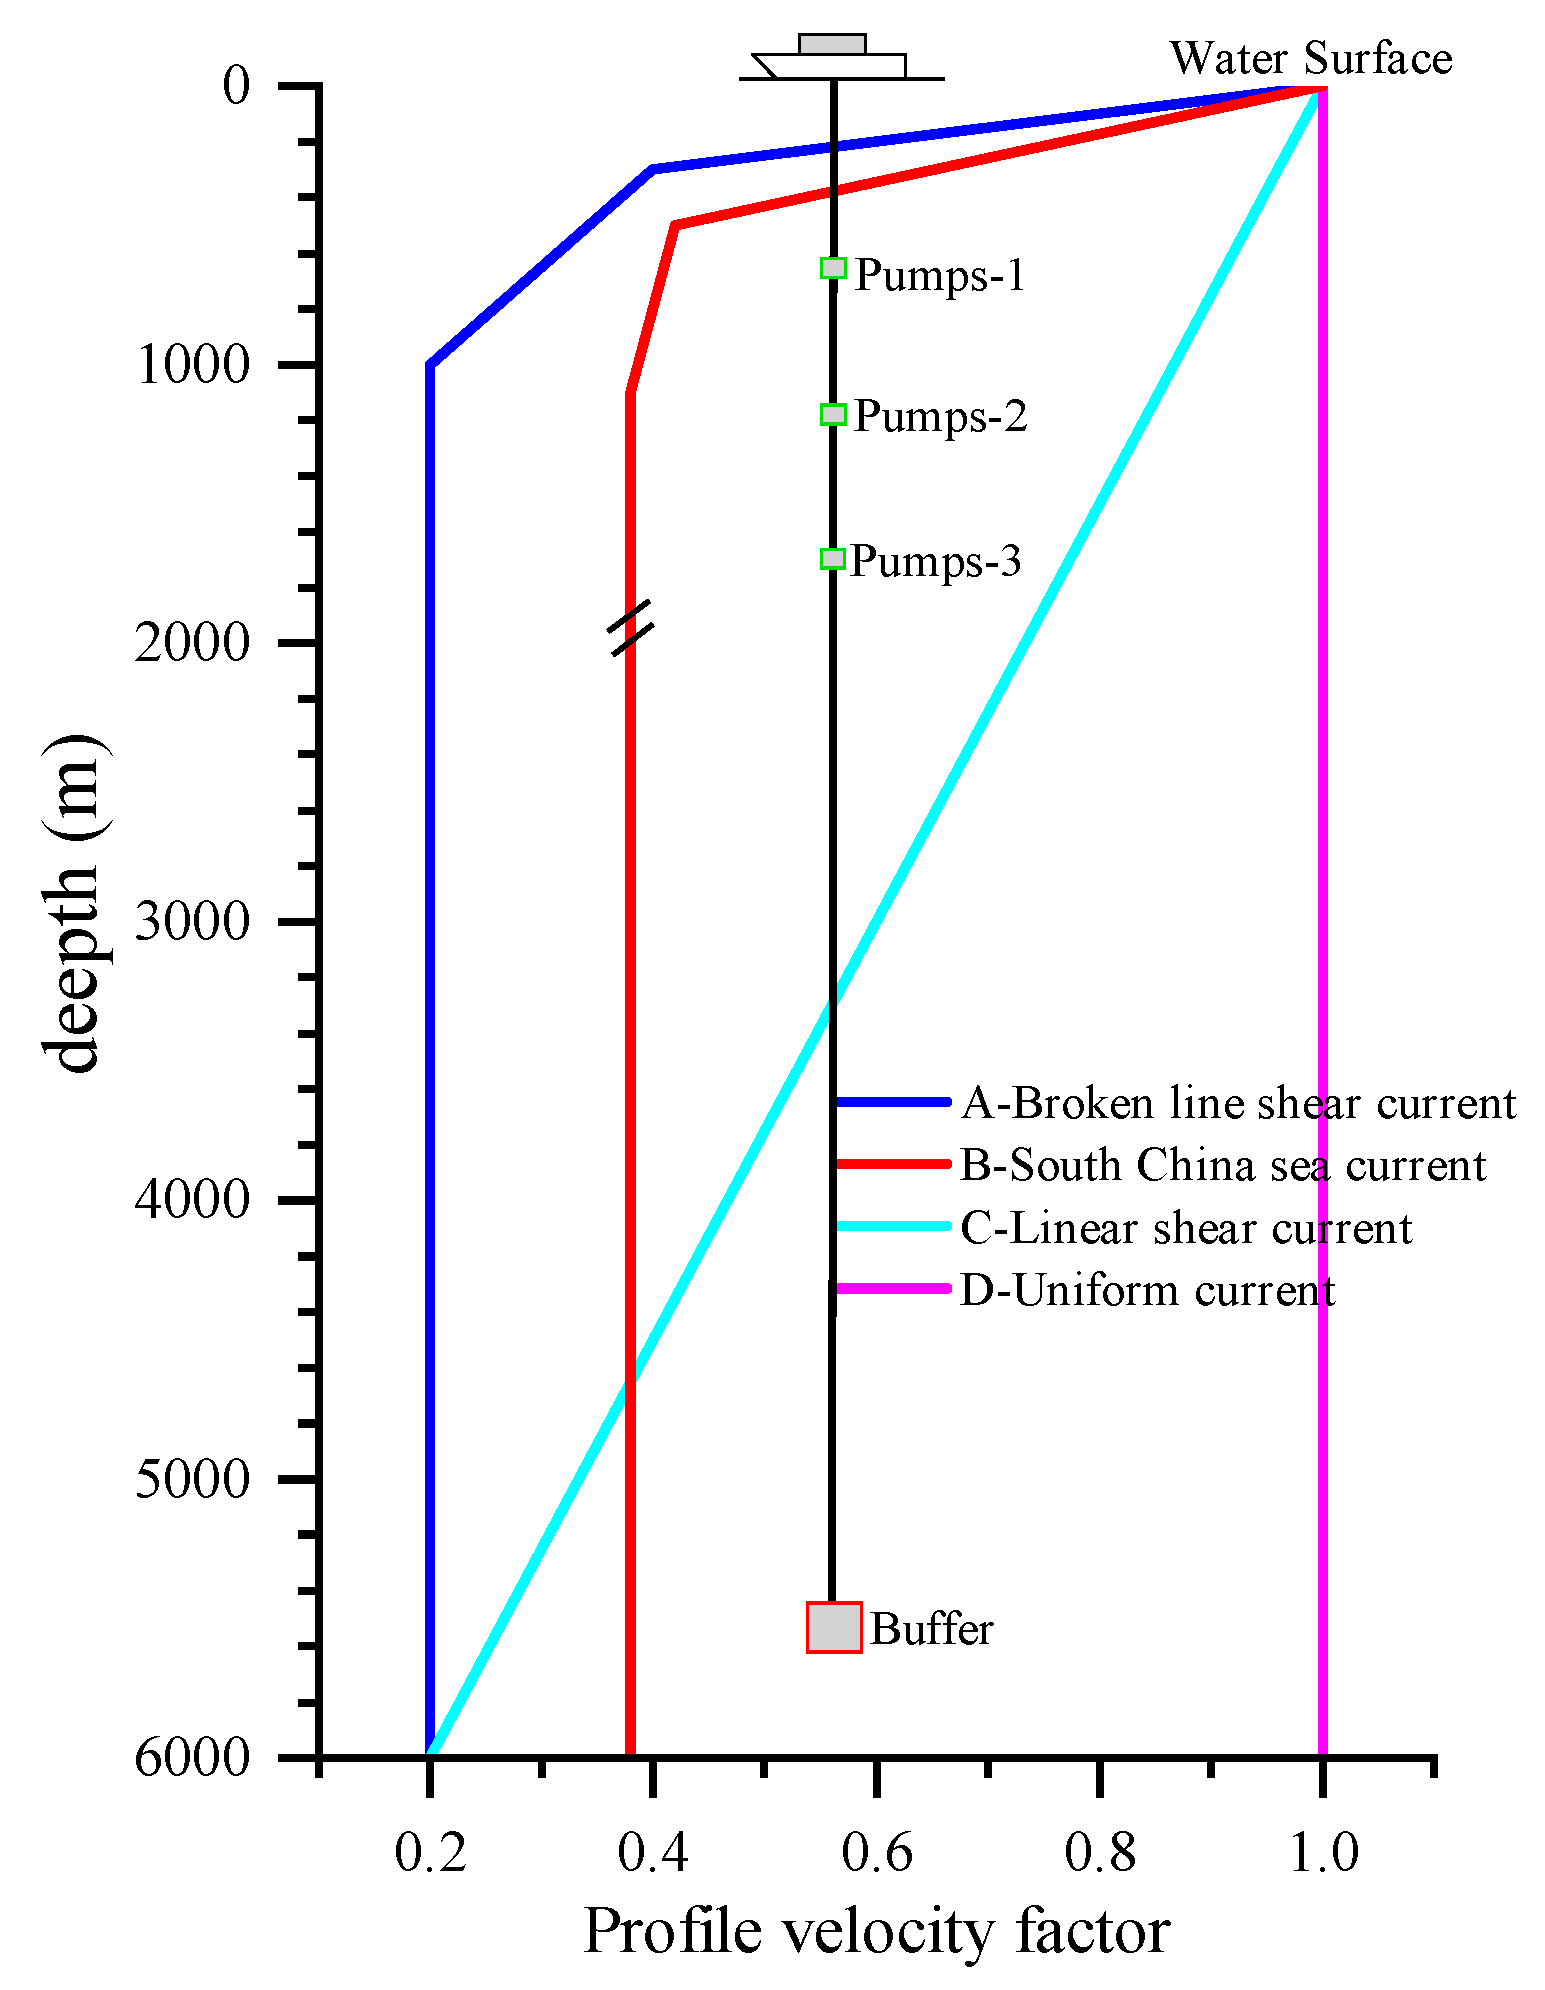
In this study, only unidirectional planar flow is considered, and the static analysis of the riser is conducted for the four flow profile conditions shown in
Figure 14. These include uniform flow, linear gradient flow, polyline gradient flow, and a gradient flow that closely resembles the ocean current profile characteristics of the South China Sea [
8]. Among these, the polyline gradient flow aligns more closely with the velocity distribution patterns of typical real-world ocean current profiles. The data in
Figure 14 represents the profile velocity factor, which is the ratio of the actual velocity to the surface ocean current velocity. In subsequent analyses, the flow velocity for each current condition refers to the surface velocity under the corresponding ocean current profile.
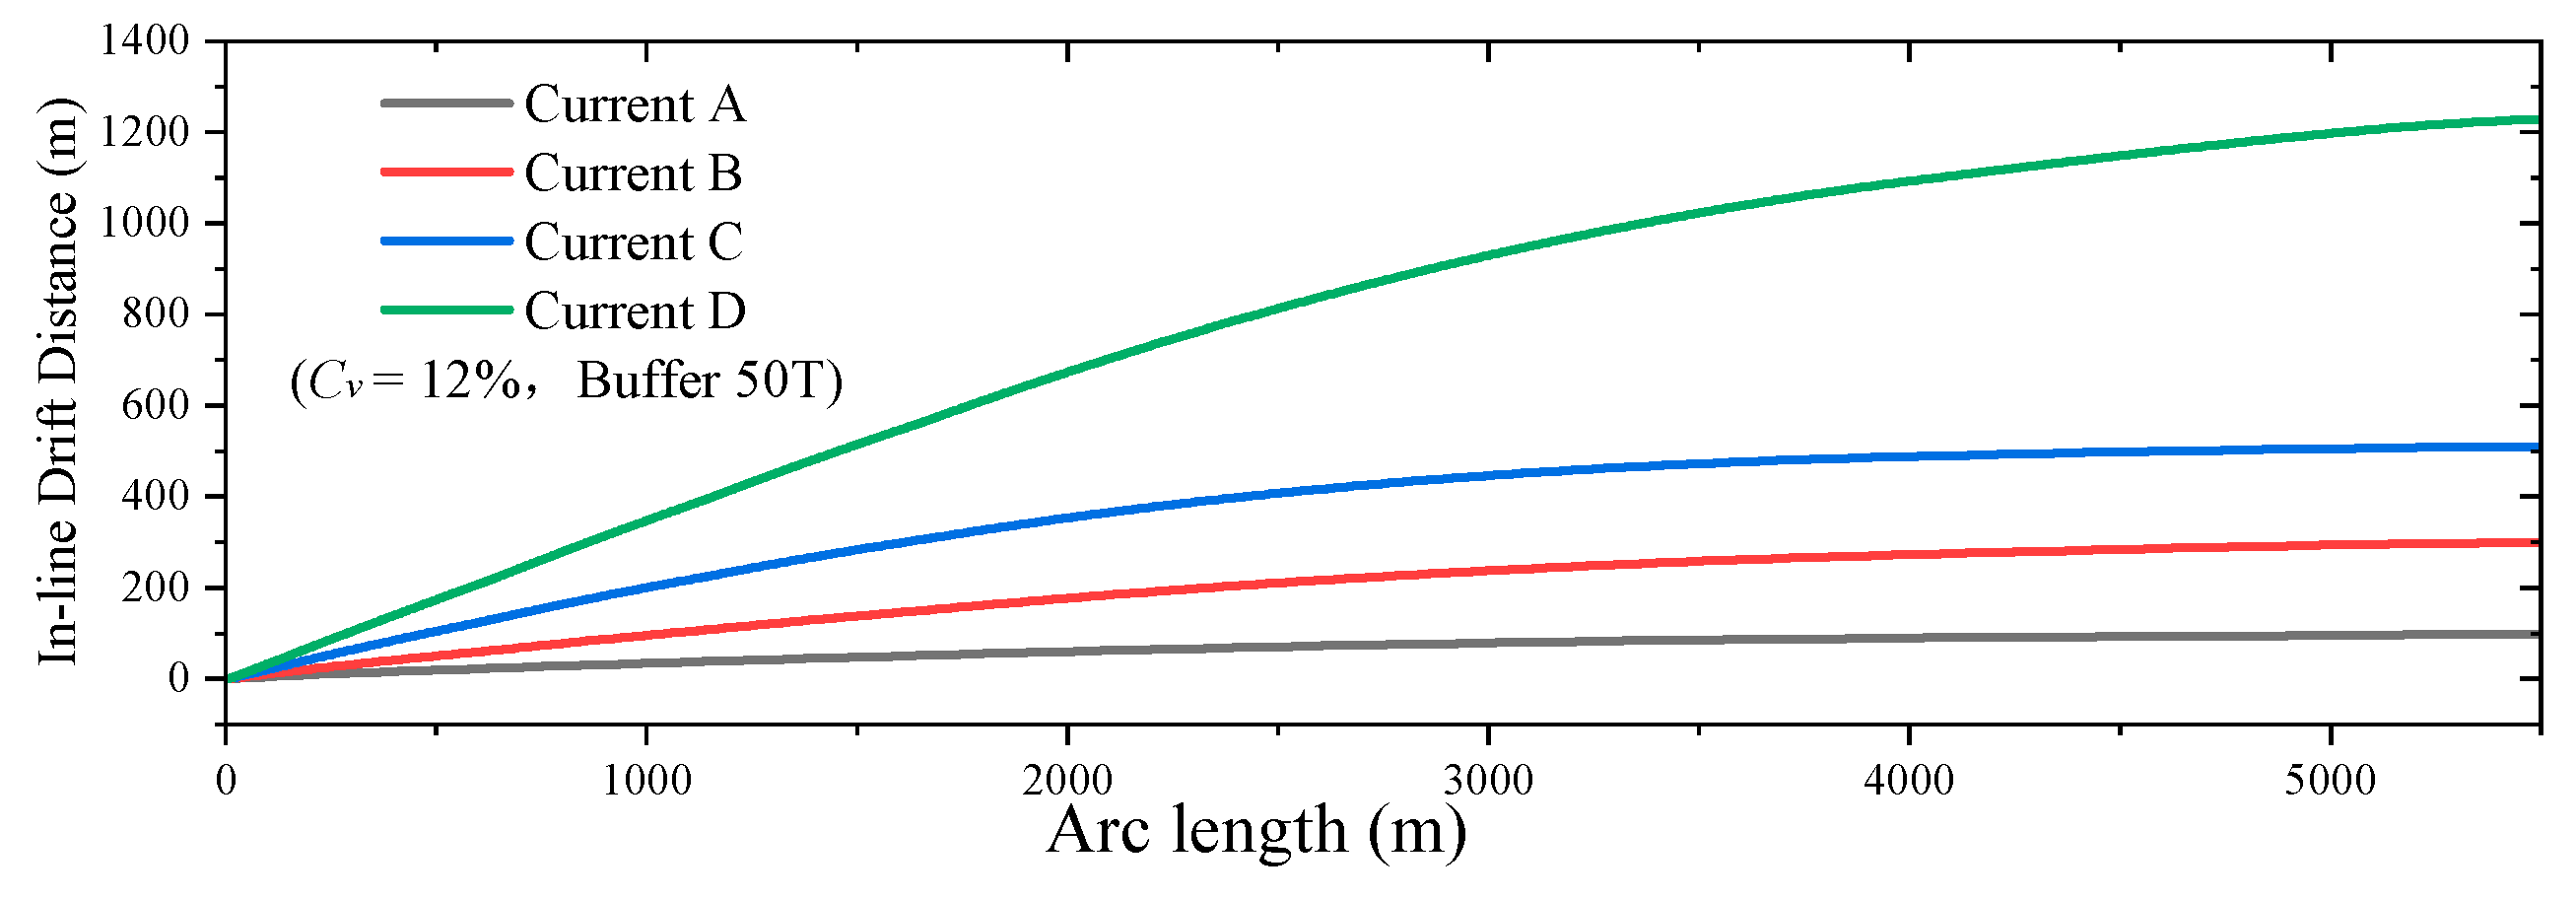
Figure 15 compares the drift distances (the horizontal distance that the buffer station deviates from its initial position due to the influence of ocean currents) of the riser system along the depth for the four ocean current profiles when the surface velocity is 1 m/s. The drift distance is an important safety parameter. An excessively large drift distance can lead to greater instability in the transportation operation. It can be observed that the drift distance at the buffer is at maximum in all cases. As the depth increases, the drift trend of the pipeline slows down, with a steeper slope near the surface and a gentler slope in deeper waters. Among the four ocean current profiles, the uniform flow results in the largest drift distance, with the buffer drifting over 1200 m. This is followed by the linear gradient flow, where the buffer drifts approximately 500 m. In contrast, Current-A and Current-B exhibit smaller drift distances of 97 m and 299 m, respectively.
Figure 16 compares the axial tension distribution along the pipeline for different buffer masses under conditions of no ocean current and no internal flow. The design employs a 16-inch, high-strength, stainless steel pipe with a wall thickness of 12.7 mm and a maximum tensile strength of approximately 1178 tons (about 11,556 kN). Since buoyancy materials are used in this design to control the axial tension, when the buffer mass ranges from 25 to 100 tons, the maximum top tension is 2492 kN, and the maximum tension occurs at 4000 m, slightly higher at 2583 kN, which is about 22.4% of the design’s maximum load.
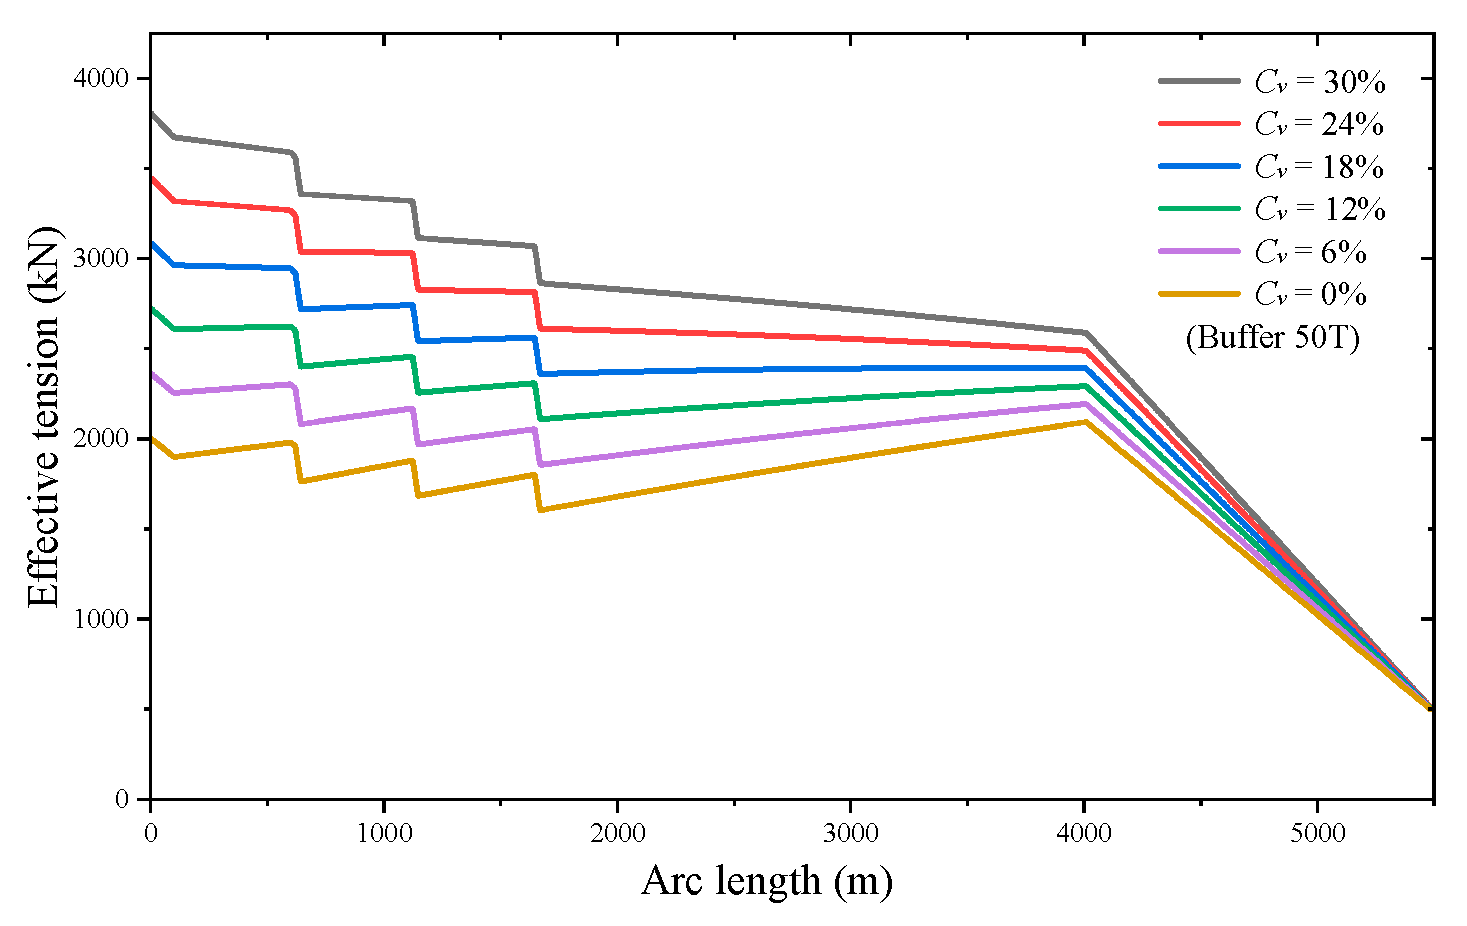
Figure 17 compares the axial tension distribution along the riser for different internal flow densities. As the particle concentration in the internal flow increases, the internal flow density also increases, and the additional load on the pipeline equals the increase in internal flow mass. When the internal flow density is at the rated condition, the top tension is the maximum axial tension, with a value of 2723 kN, about 23.6% of the design’s maximum load. When the particle volume concentration reaches 30%, the top tension increases to 3807 kN, approximately 32.9% of the design load. This is nearly twice the top tension under the no-particle condition with the same buffer mass, indicating that the slurry particle concentration can significantly influence the top tension.
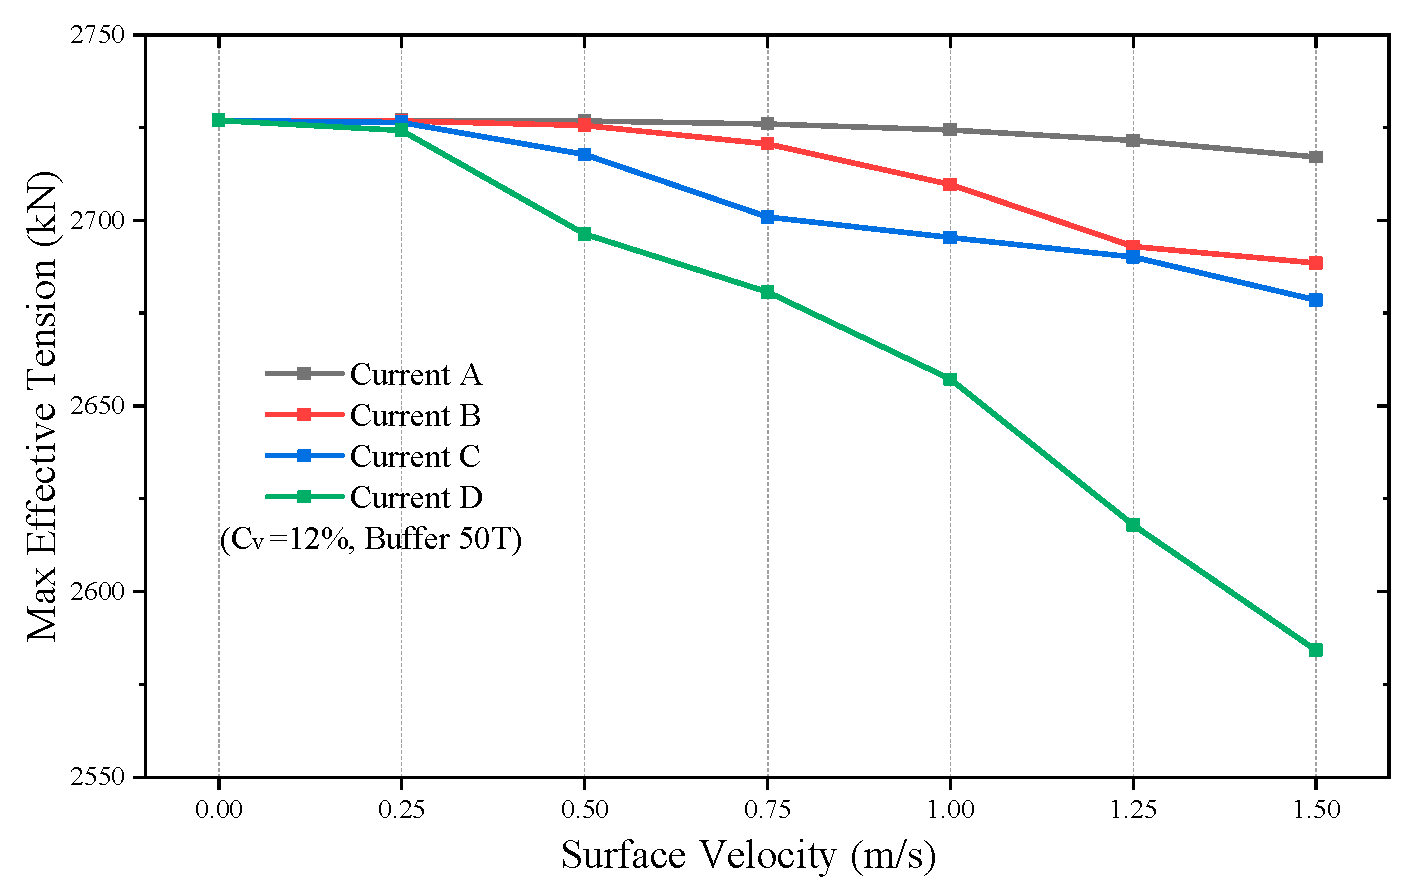
Figure 18 compares the top tension of the riser under different flow profiles and surface flow velocities. It can be observed that the influence of ocean currents on the top tension is relatively small, especially for Current-A.
Figure 19 compares the drift distance of the buffer under the rated condition for different flow velocities and flow profiles. It can be seen that the drift distance is positively and linearly correlated with the flow velocity. When the surface support vessel moves at a constant speed following the mining vehicle, the riser system can be simplified as being subjected to a uniform flow in the direction of movement. Under the uniform flow condition, the drift distance of the riser is very large, exceeding 1800 m at a flow velocity of 1.5 m/s. When the flow velocity decreases to 0.5 m/s, the drift distance of the buffer reduces to approximately 450 m. Such distances far exceed the safe working range of the hose’s flexibility, necessitating special attention to the following speed and buffer drift during operations.
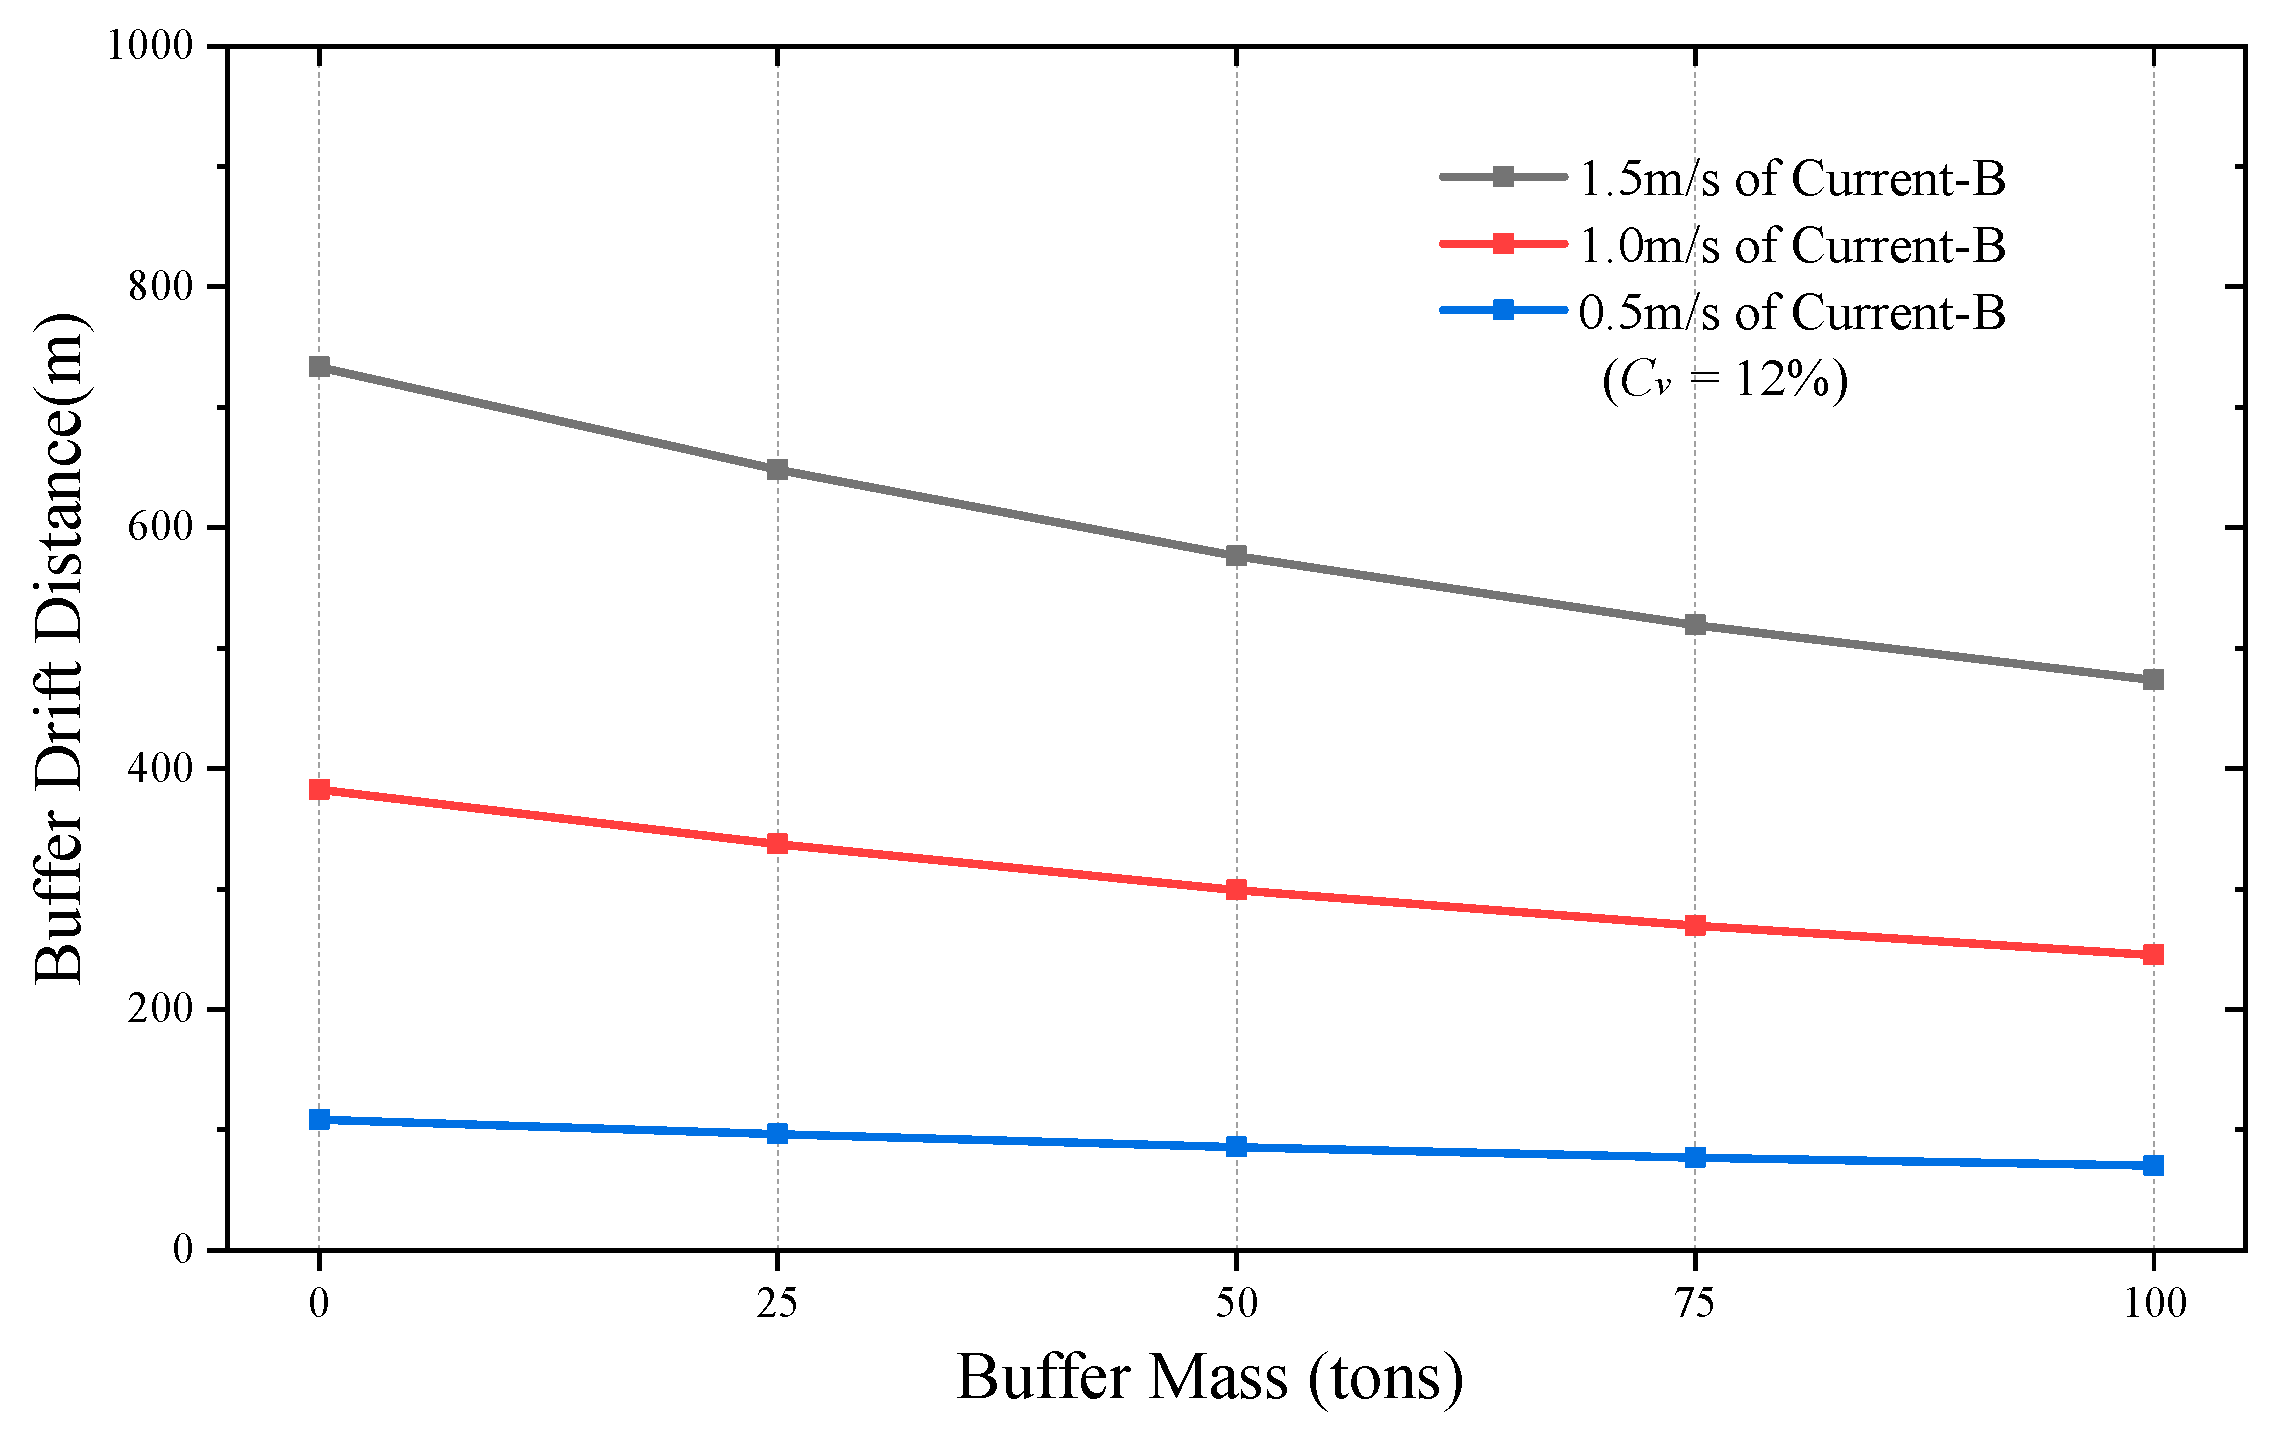
Figure 20 compares the buffer drift distance under Current-B conditions for different buffer masses and flow velocities, aiming to assess the impact of buffer mass on system stability. The results show that increasing the buffer mass has little effect at low flow velocities. However, at higher velocities, a larger buffer mass significantly reduces the drift distance. Under a flow velocity of 1.5 m/s, increasing the buffer mass from 25 tons to 100 tons reduces the drift distance from 733 m to 473 m—a 35.5% decrease. This demonstrates that adjusting the buffer mass is an effective strategy for controlling buffer drift under strong currents. In practical operations, the buffer mass can be increased by storing more ore particles in the transition hopper, thereby improving stability at high flow velocities.
5. Dynamic Analysis of Lifting System
The Iwan–Blevins wake oscillator model is adopted to construct a dynamic analysis framework for a 6000 m commercial-scale deep-sea mining lifting system. Comparative simulations are conducted under varying ocean current profiles (natural, gradient, and uniform), internal flow densities, buffer masses, and current velocities. Vibration characteristics—including mode shapes, frequencies, and amplitudes—are examined using vibration envelopes, root mean square (RMS) values, and axial vibration spectra. The aim is to clarify how environmental and operational parameters affect riser vibration behavior. The simulations cover a total duration of 4000 s, with data from the final 1000 s used for analysis. The maximum element length is set to 1 m based on grid independence results from 10 to 0.2 m, and the time step is fixed at approximately 0.002 s based on time step independence validation from 0.01 to 0.0005 s to ensure numerical accuracy. Numerical simulations show that further reducing the element size and time step significantly increases computational cost while yielding nearly identical results.
The study focuses on four ocean current profiles illustrated in
Figure 14. Uniform flow primarily occurs when the surface vessel follows the mining vehicle, while gradient flow represents a common profile in riser research. The remaining two profiles reflect realistic oceanic conditions [
8].
5.1. Dynamic Analysis Under Different Ocean Current Profile Conditions
This section examines the transverse VIV response of the rigid riser under varying current profiles. For the lifting riser, Reynolds numbers range from 8.1 × 10
4–8 × 10
5 across depths due to variations in buoyancy module outer diameters and flow velocities. Simulations assume a buffer submerged mass of 50 tons, a particle volumetric concentration of 12%, and rated flow conditions by default. Vibration envelopes (
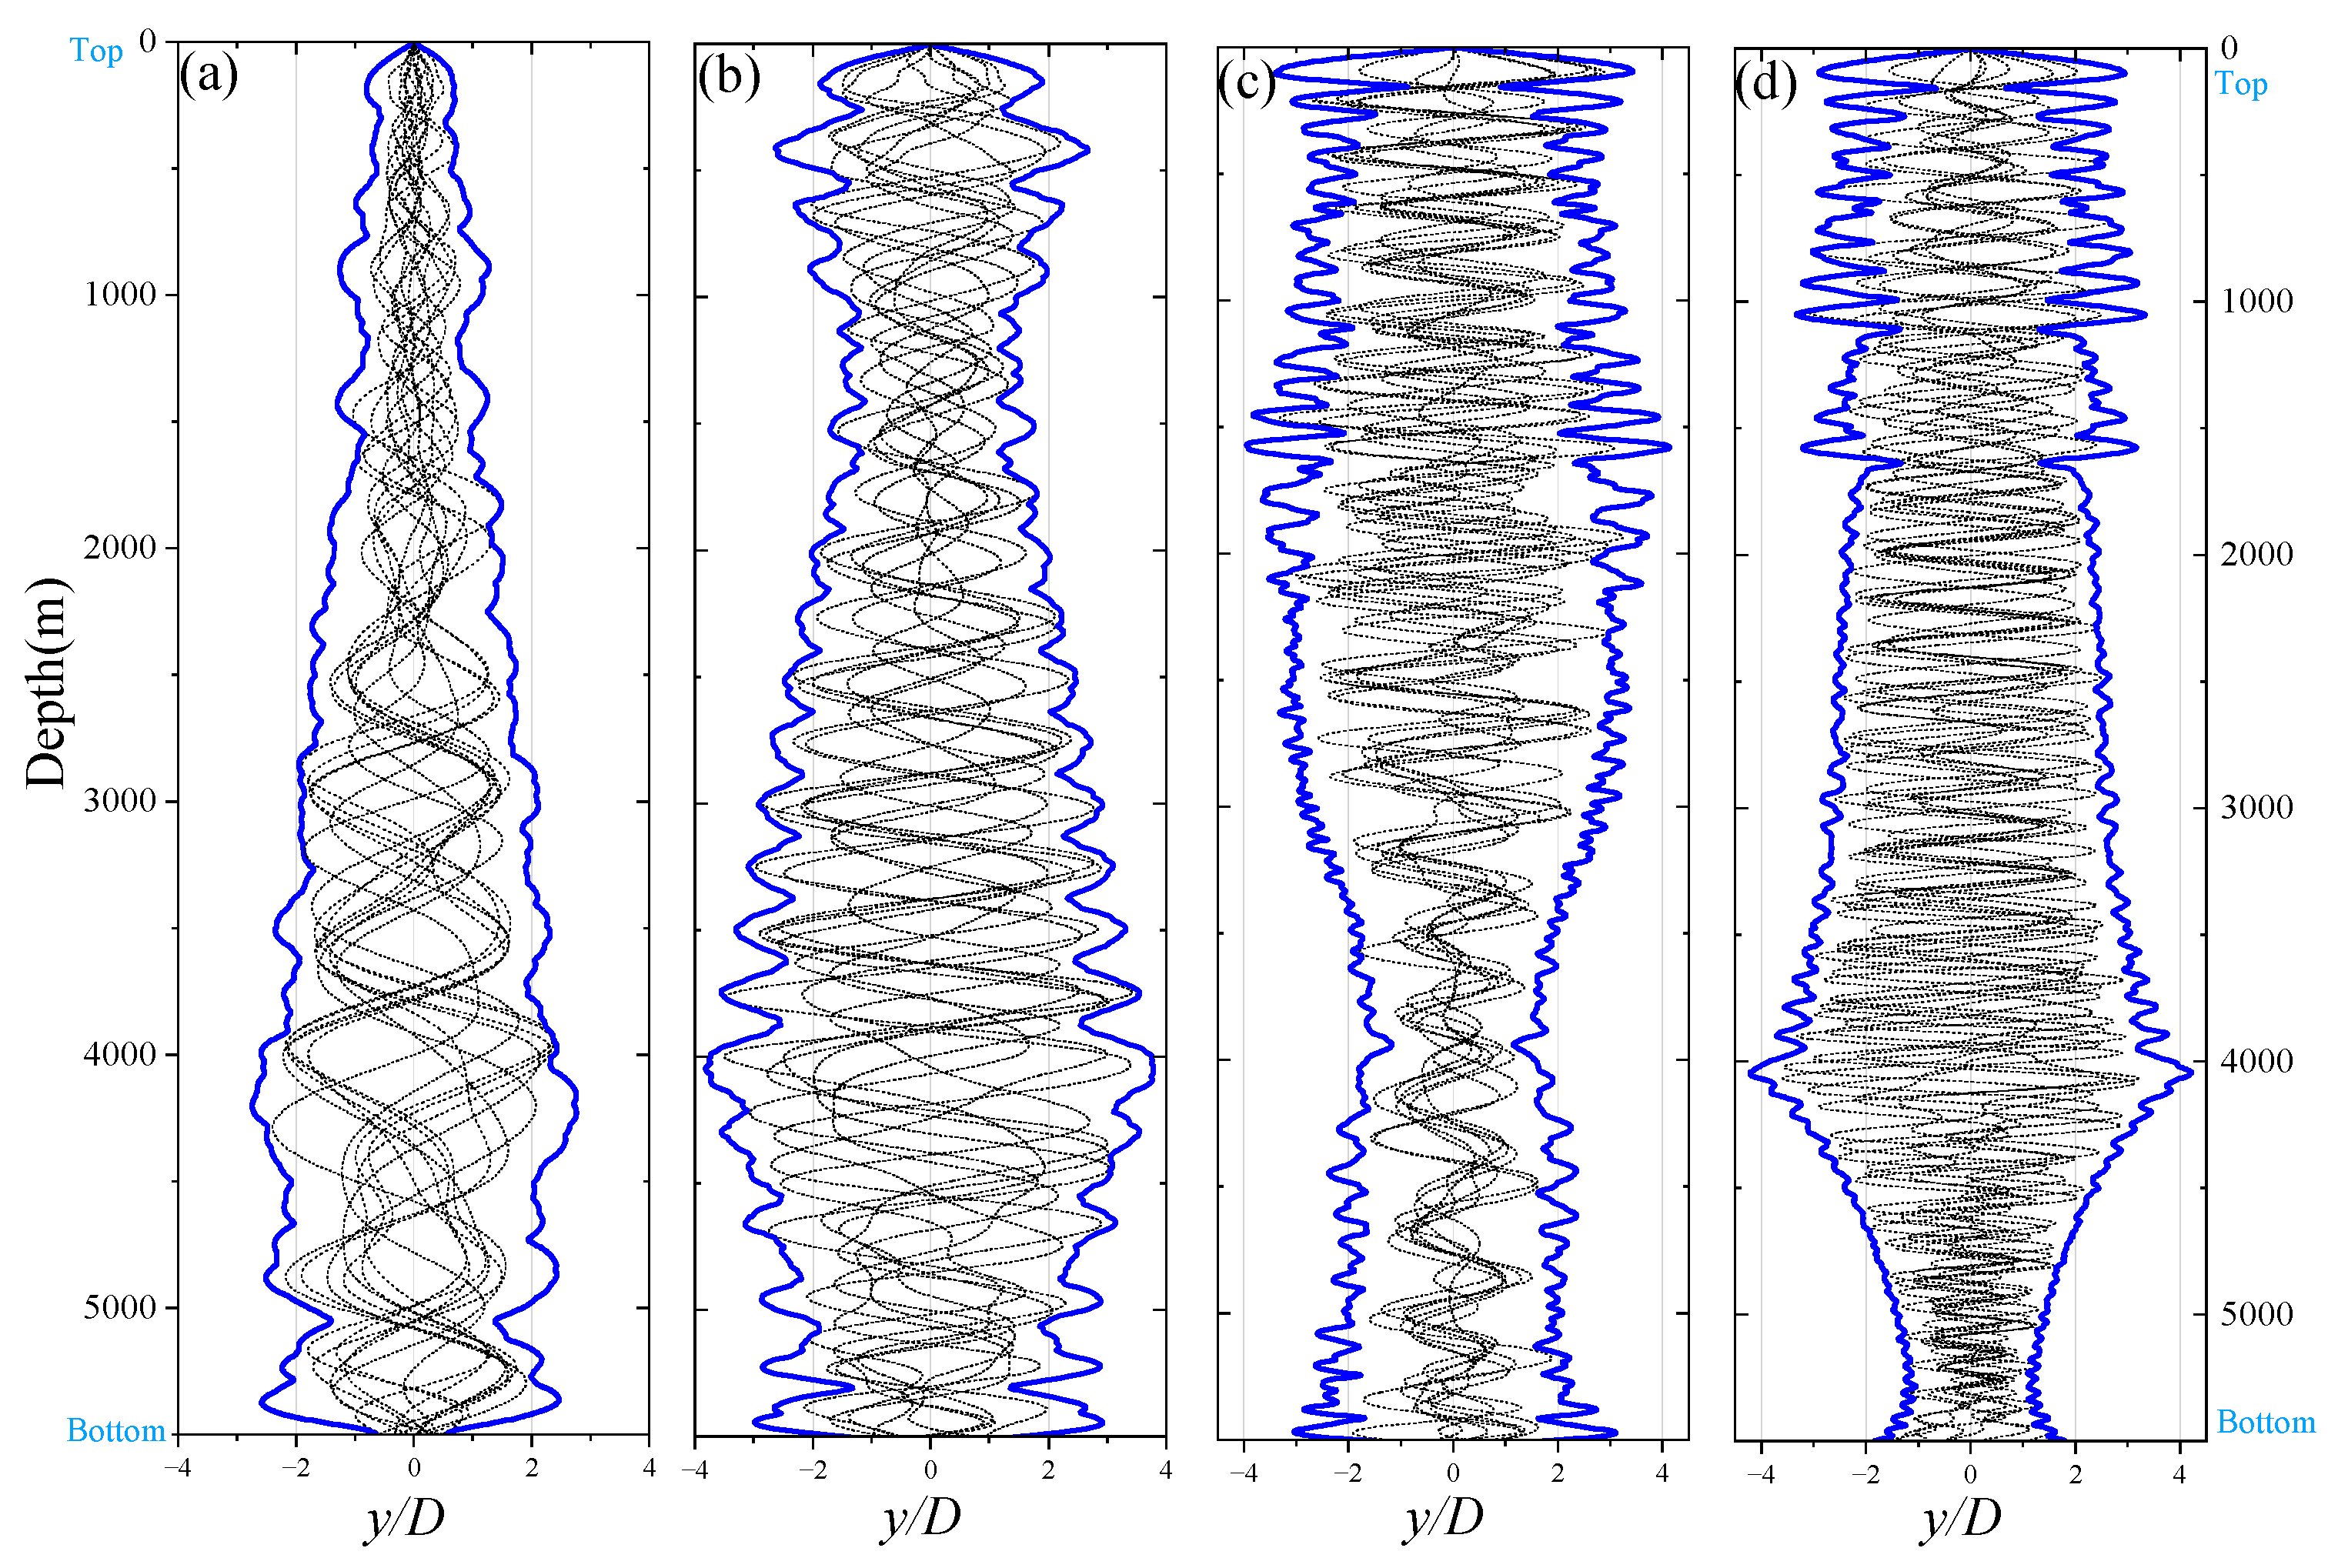
Figure 21) are derived by analyzing maximum/minimum displacements over the final 1000 s of simulation.
As illustrated in
Figure 21, the excited modes and vibration envelopes of the identical pipeline exhibit significant variations under different current profiles, with all dimensionless amplitudes normalized to the minimum diameter (D = 0.4064 m) of the lifting system for analytical consistency. For Current-A (Measured profile), the vibration amplitude remains relatively small above the lifting pump, progressively increasing within the 0–4000 m depth range to reach a maximum of 2.76D at approximately 4229 m, while larger amplitudes are observed in the lower section of the riser where buoyancy modules are absent. In Current-B (Polyline gradient profile), a distinct amplitude peak occurs at the first lifting pump cluster, followed by a gradual decrease, with the amplitude increasing steadily within the 1500–4000 m depth range to peak at 3.82D near 4049 m. For Current-C (Linear gradient profile), significant amplitudes are observed in the upper section of the third lifting pump cluster, with the maximum amplitude of 4.15D occurring at approximately 1581 m, after which the amplitude gradually attenuates. In Current-D (Uniform flow profile), a consistent amplitude of approximately 3D is maintained within the depth range of the second pump cluster, with the amplitude slightly decreasing between the second and third pump clusters before increasing slowly along the riser depth to reach a maximum of 4.22D near 4044 m, followed by a rapid reduction in amplitude beyond this peak. These findings highlight the profound influence of current profiles on the vibration characteristics of the pipeline system, particularly in terms of amplitude distribution and peak localization, underscoring the complex interplay between hydrodynamic forces and structural response in deep-sea lifting systems.
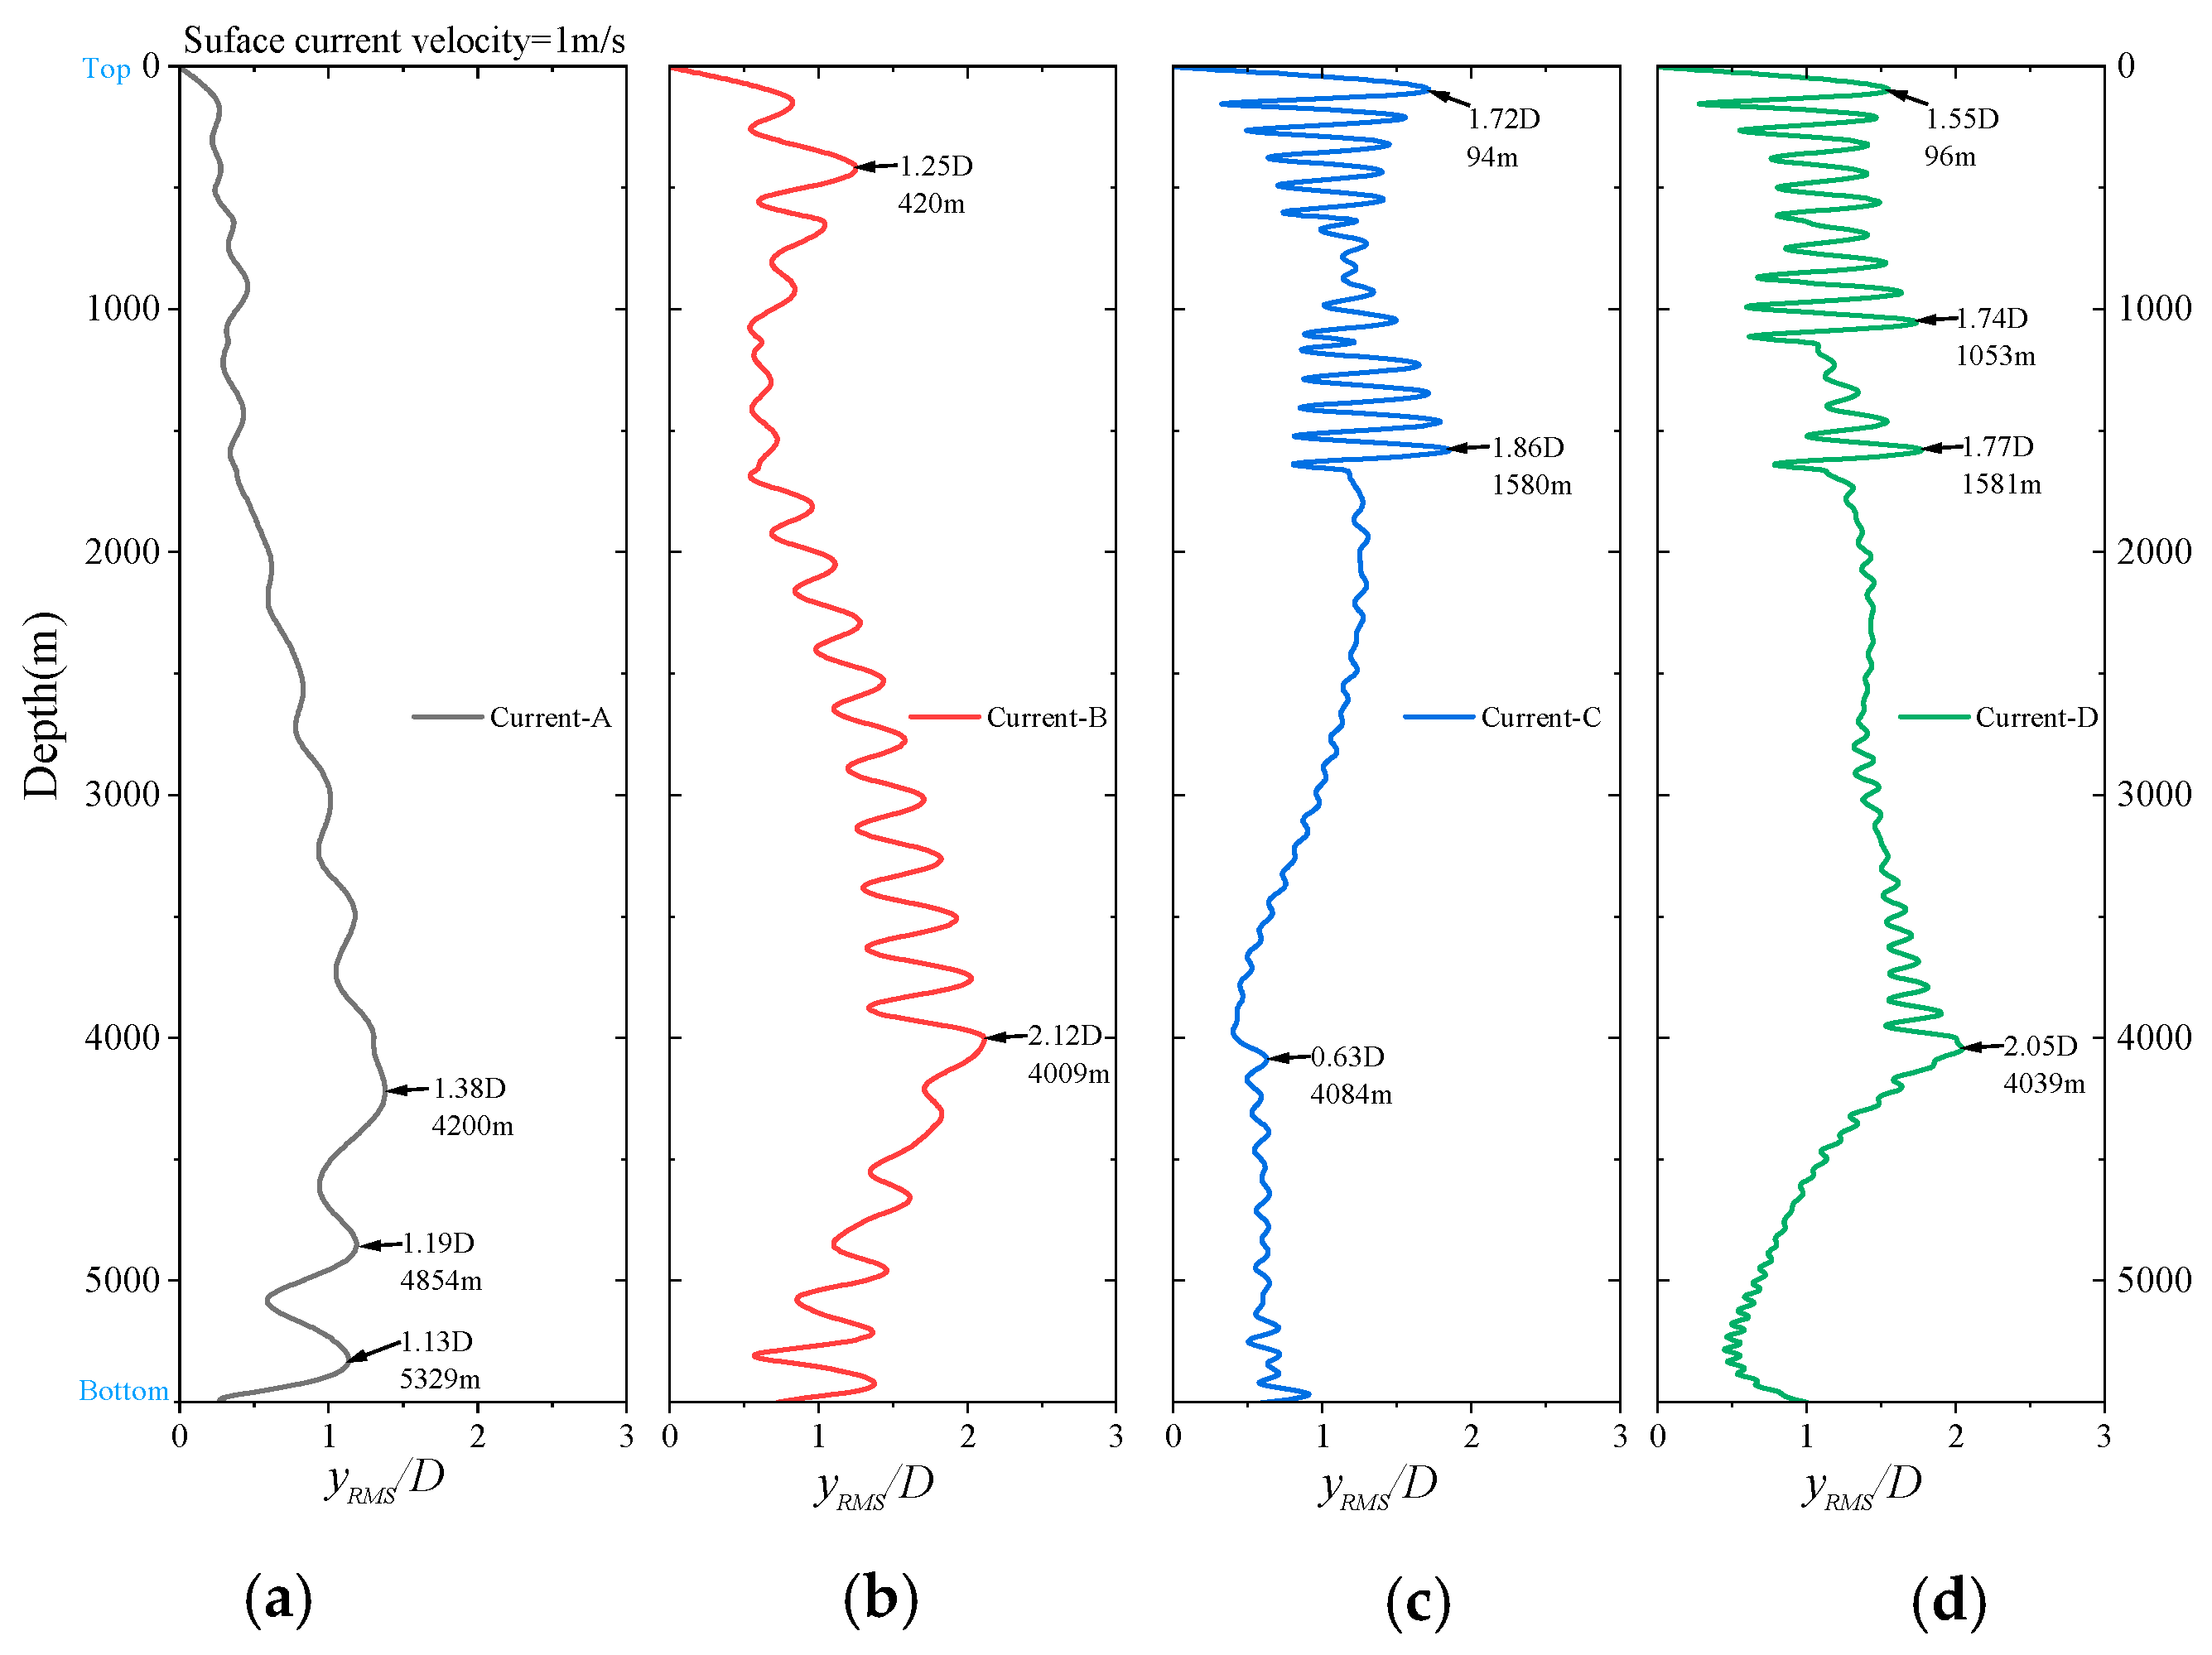
Figure 22 presents the time-averaged RMS values of the riser’s vibration amplitudes under different current conditions, revealing distinct vibration modes at various depths of the lifting hard pipe. In conjunction with
Figure 21, it is evident that the riser exhibits a multi-modal vibration pattern characterized by the coexistence of standing waves and traveling waves, each with varying intensities. This phenomenon arises from the variations in the riser’s diameter and external flow velocity along its axis, which lead to changes in the vortex shedding frequency. Consequently, the riser is subjected to multiple excitation forces at different frequencies, resulting in a complex vibration response pattern. This intricate behavior underscores the importance of considering both spatial and frequency-domain characteristics when analyzing the dynamic response of deep-sea riser systems under varying hydrodynamic conditions.
By integrating the insights from
Figure 21 and
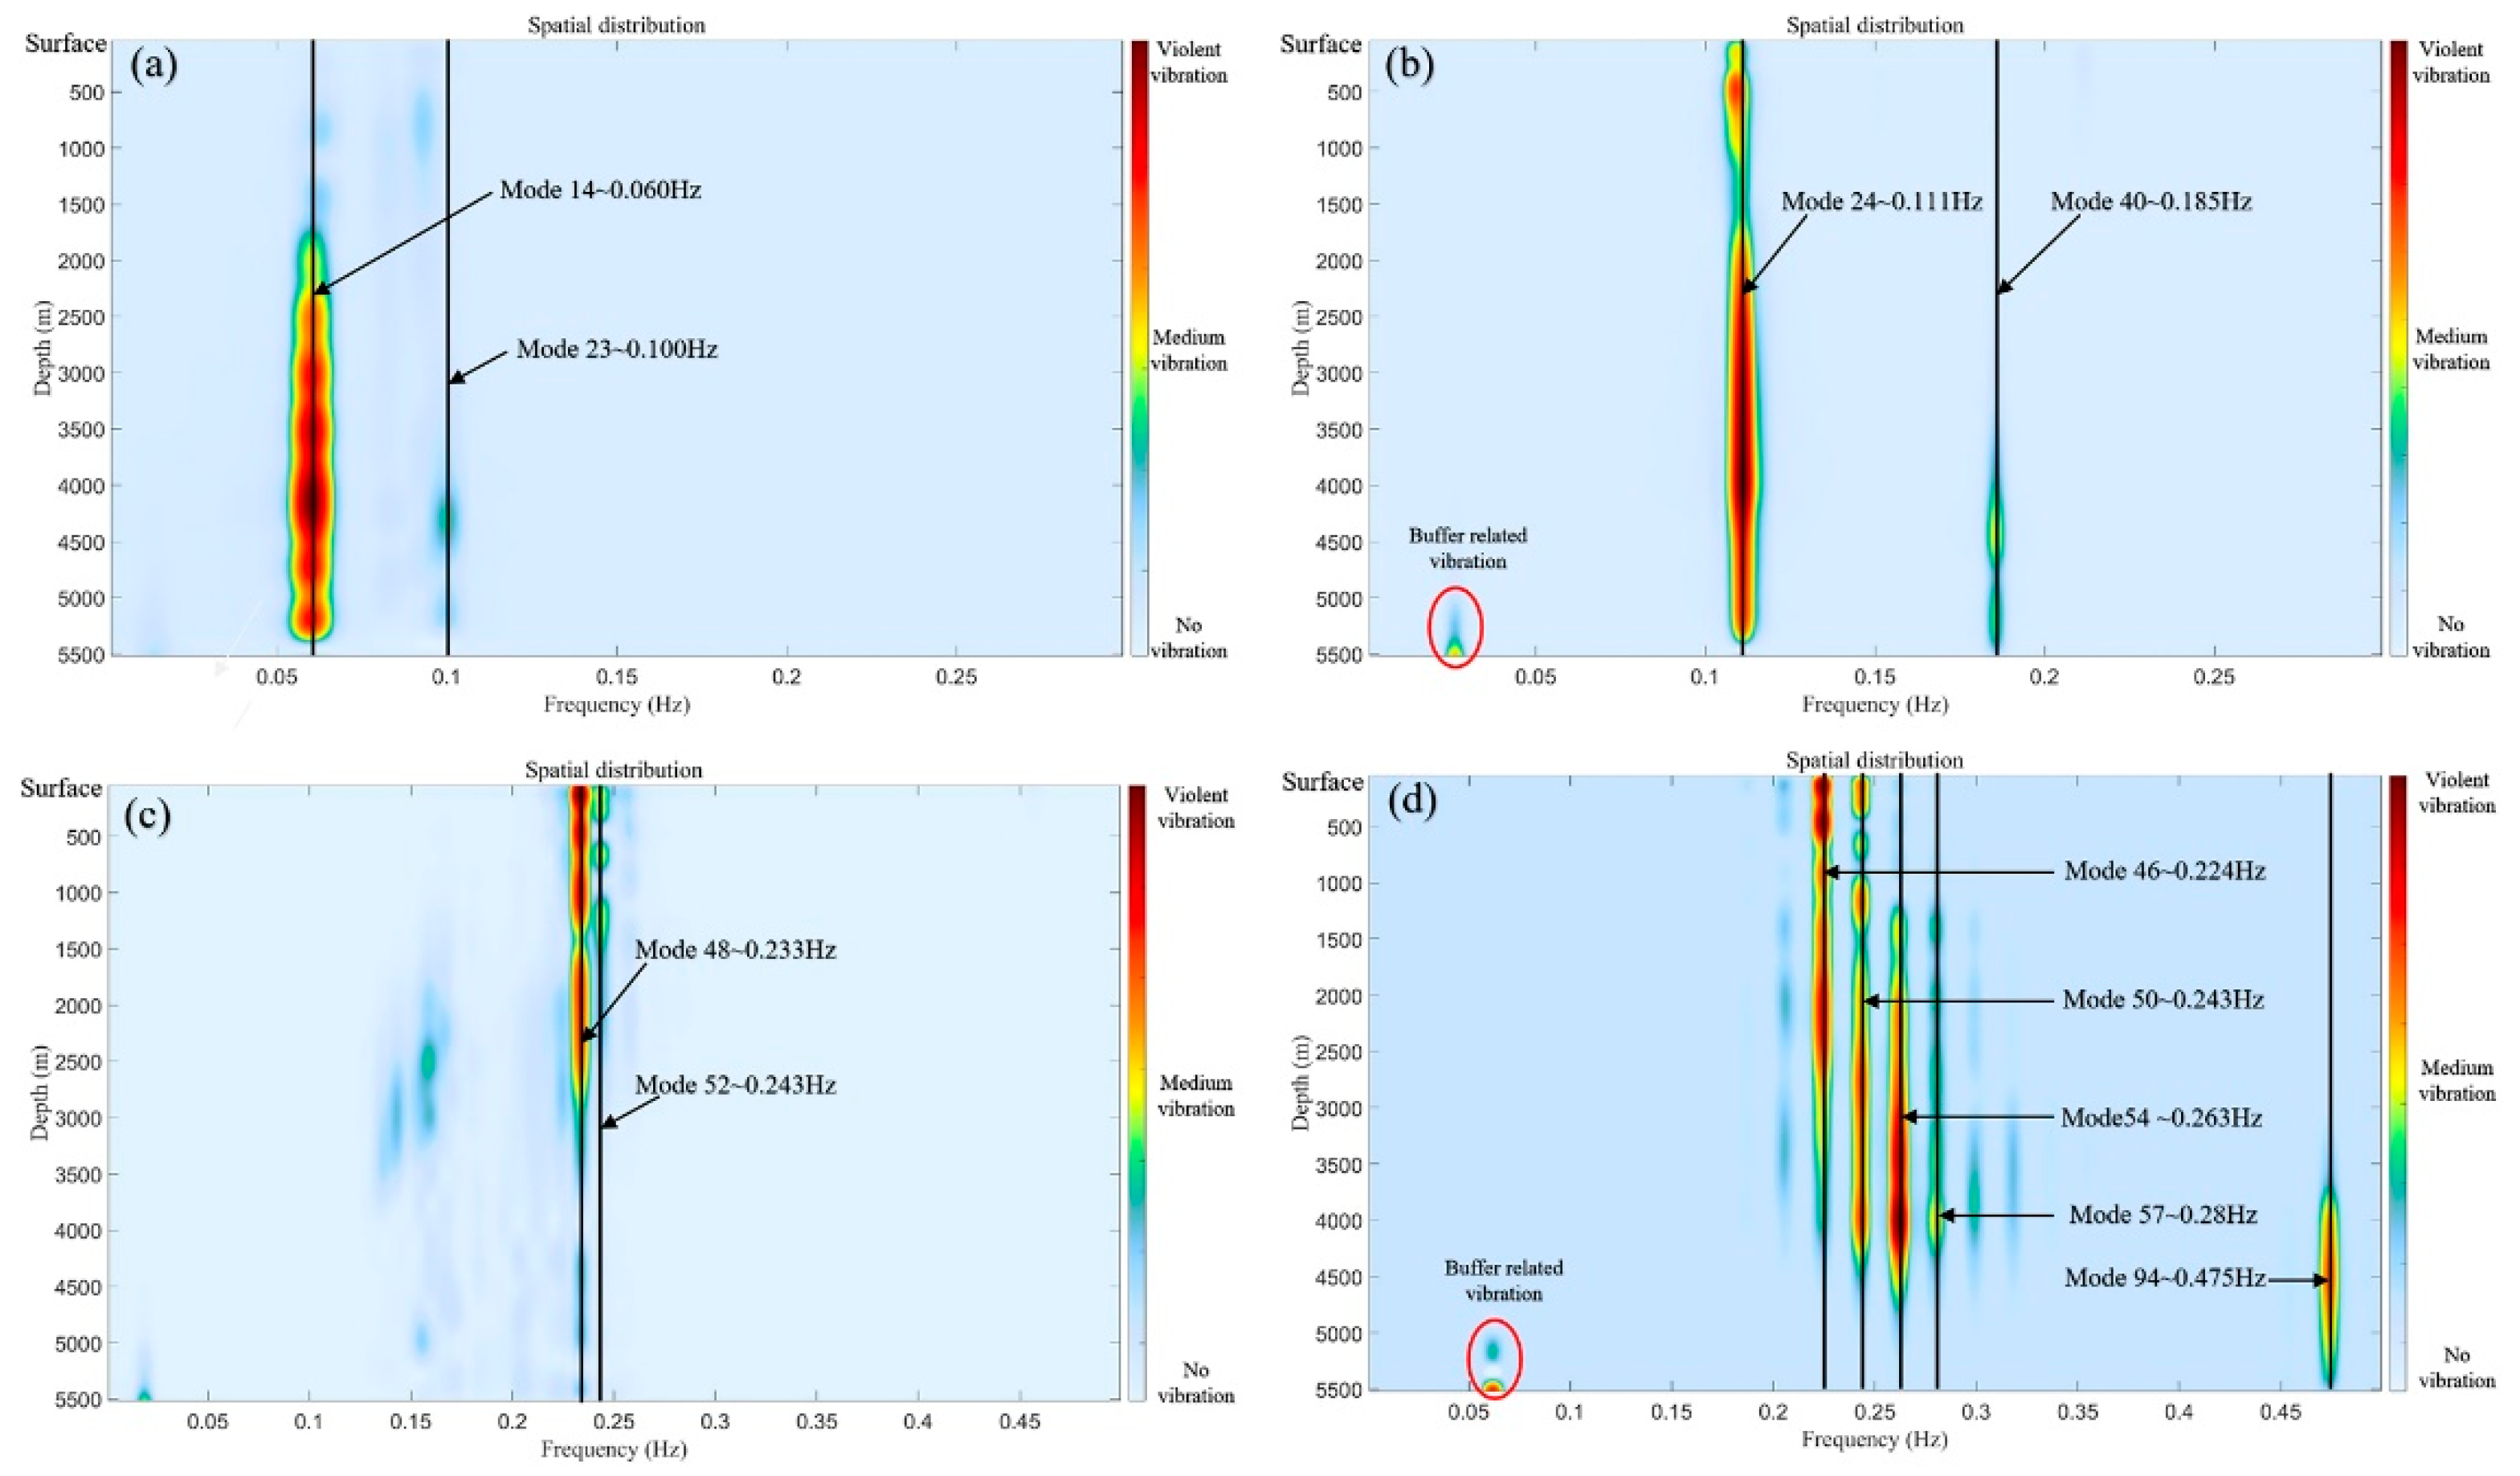
Figure 23, the spatial distribution of maximum amplitudes, vibration intensities, and frequencies at different depths of the riser can be readily identified. Under the Current-A profile, the dominant frequency is approximately 0.06 Hz, corresponding to the 14th natural frequency, with stronger vibrations observed in the lower half of the riser, consistent with the findings in
Figure 22. For the Current-B profile, the dominant frequency is 0.111 Hz, representing the 24th natural frequency, accompanied by multi-modal resonance at 0.185 Hz (40th natural frequency), with vibrations also concentrated in the lower half of the riser. In the case of the Current-C profile, the dominant frequency is 0.233 Hz (48th natural frequency), with additional resonance near the 52nd natural frequency and a broader spectral band between 0.13 and 0.2 Hz. This behavior arises from the uniform variation in flow velocity along the riser axis under a stable Strouhal number of 0.2, leading to a consistent change in vortex shedding frequency and the generation of multiple low-energy excitation sources, which prevents the formation of a distinct dominant mode in the lower section, as corroborated by
Figure 22. The Current-D profile produces the most complex excitation patterns due to the high average velocity of the uniform flow, which excites high-energy resonant frequencies along the entire riser. Near the water surface, the dominant frequency is 0.224 Hz; in the lower half, it shifts to 0.28 Hz, with a transition frequency of 0.243 Hz in between. At the bottom, where there are no buoyancy modules, the dominant frequency reaches 0.475 Hz. These results indicate that under uniform flow conditions, the riser undergoes intricate multi-modal resonance, with distinct dominant frequencies at different depths. This behavior is primarily caused by variations in the riser’s outer diameter and axial tension.
5.2. Dynamic Analysis at Different Internal Flow Densities
During riser operations, slurries with varying concentrations are typically transported. This section compares the dynamic characteristics of the pipeline under the influence of Current-B (1.0 m/s) while conveying ore particles at different volumetric concentrations, aiming to elucidate the correlation mechanisms and influence trends of internal flow density on pipeline dynamics.
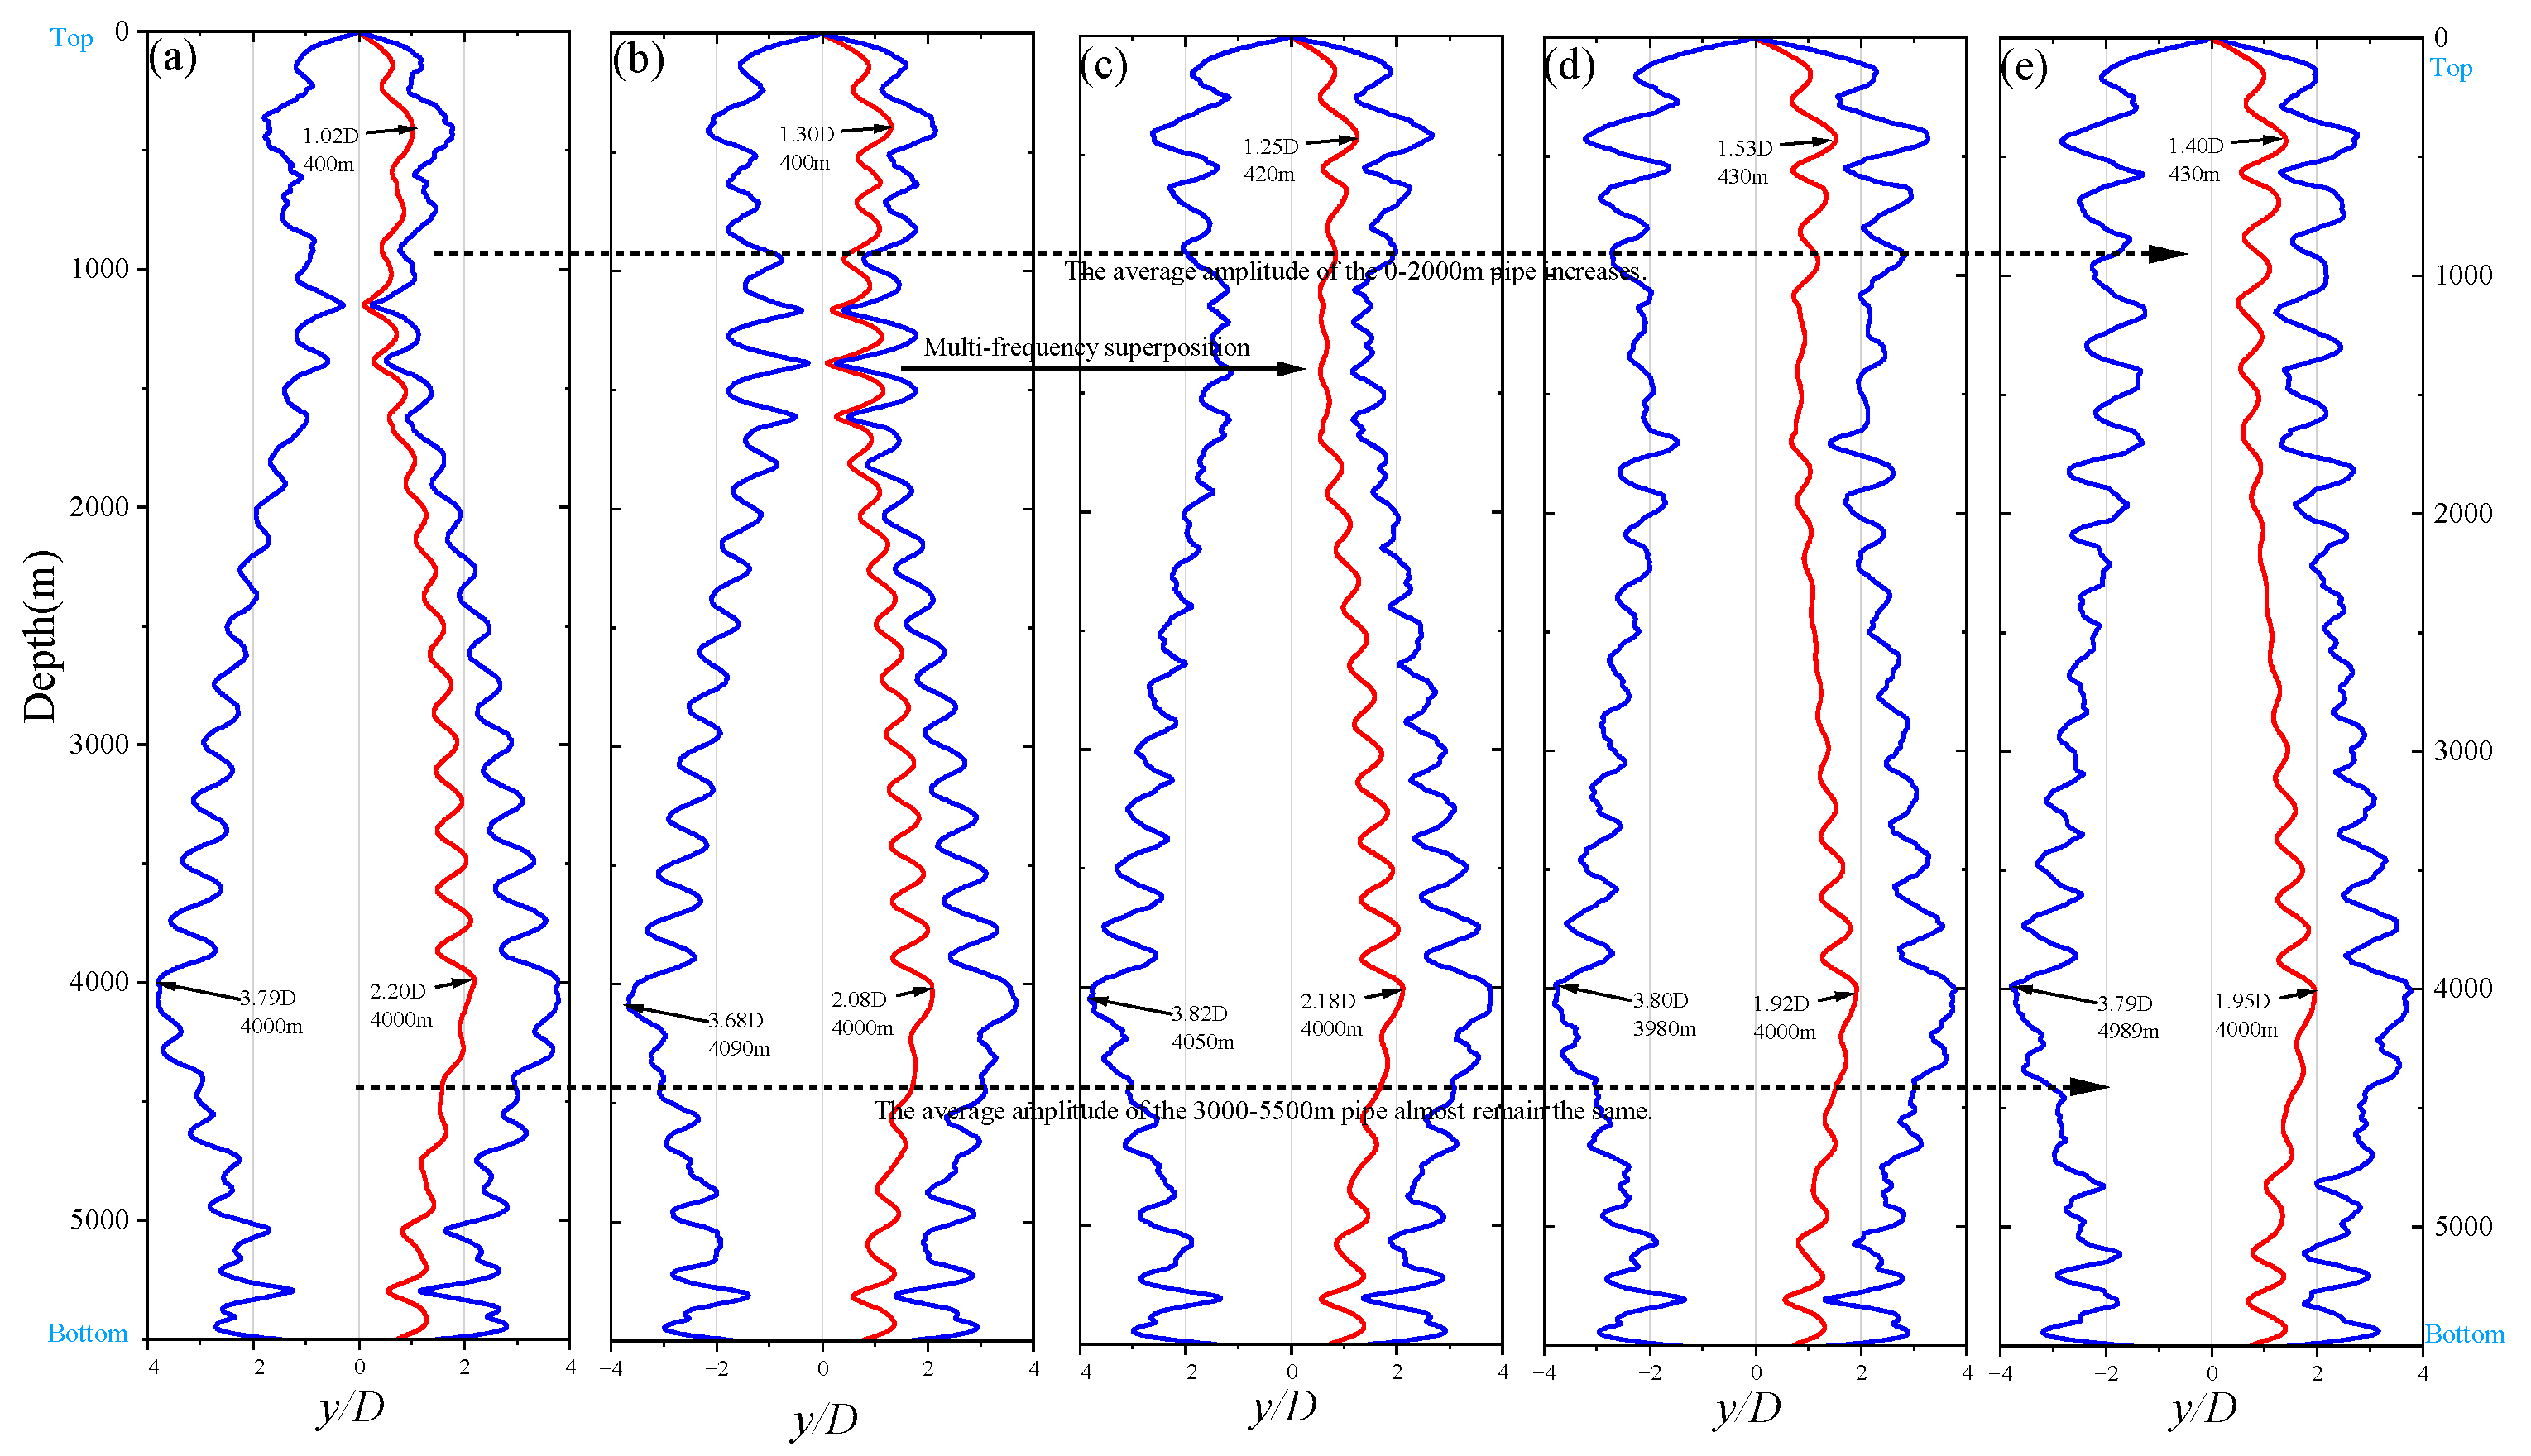
Figure 24 compares the vibration envelopes and root mean square (RMS) values of the pipeline under different internal flow densities. Under low-concentration conditions (
Figure 24b), the pipeline exhibits distinct standing wave characteristics in the upper section, with smaller vibrations in the upper part and increasing amplitudes toward the lower section as depth increases. As the slurry concentration increases, the vibration amplitudes in the upper section of the pipeline also increase, and the analysis of the vibration envelopes reveals more complex mode superposition or switching. However, the trends in the lower and bottom sections remain relatively unchanged. This is because the influence of internal flow density on the riser’s vibration characteristics primarily manifests through changes in axial tension. As shown in
Figure 17, internal flow density has a more pronounced effect on the top section, particularly on the riser segment above the pump installation and the top tension. Overall, internal flow density does not significantly alter the maximum vibration amplitude or the general trend of amplitude variation, but it has a notable impact on the vibration characteristics of the pipeline within the 0–2000 m depth range, primarily affecting the wastewater discharge pipes and pump cluster sections.
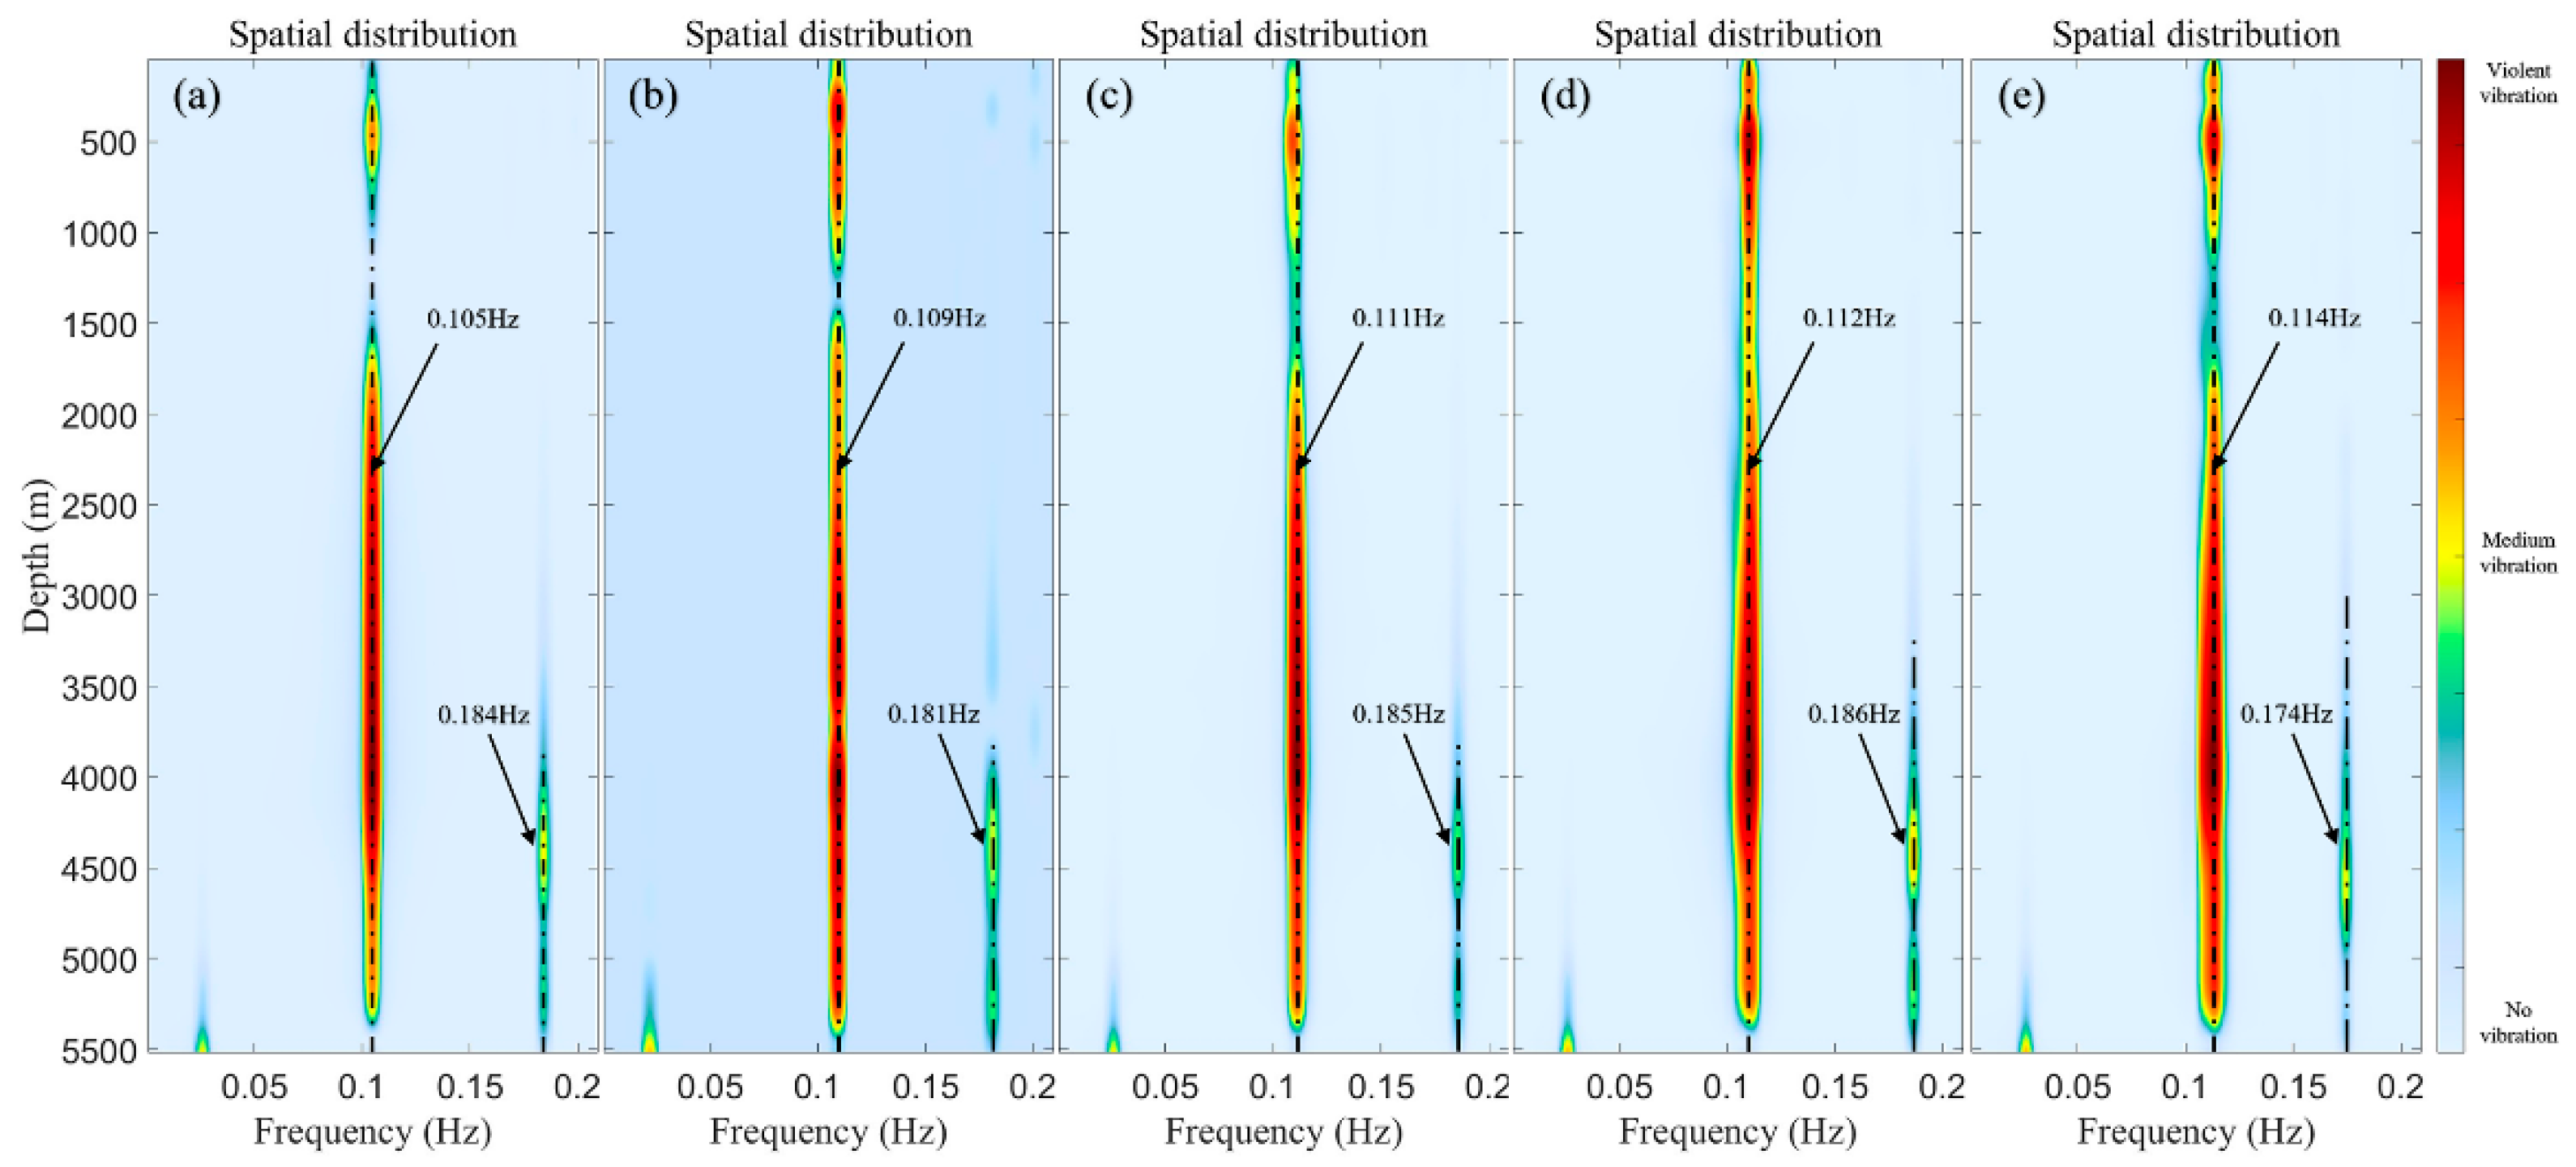
Figure 25 compares the vibration spectra under different internal flow densities, showing a clear trend of vibration enhancement within the 0–2000 m depth range, while the spectral characteristics in the bottom section remain largely unchanged, consistent with the conclusions from
Figure 24. As the internal flow density increases, the axial tension in the riser also rises, causing a slight increase in the dominant vibration frequency under otherwise constant conditions. However, during lifting operations, changes in flow density have a relatively minor effect on the riser’s vibration behavior. This influence is mainly limited to the 0–2000 m depth range. Therefore, the regulation of internal flow density should focus on safety, cost-efficiency, and operational feasibility rather than vibration control.
5.3. Dynamics Effect of Different Buffer Masses
In deep-sea mining operations, the mining vehicle typically traverses regions with varying ore abundances, resulting in different ore collection rates. The buffer station plays a critical role in storing the ore particles collected by the mining vehicle, remixing them to a predetermined concentration, and conveying the stabilized mixture into the riser, thereby buffering the fluctuations in ore concentration from the source. This section compares the dynamic characteristics of the pipeline under the influence of Current-B with varying buffer station masses, aiming to elucidate the correlation mechanisms and influence trends of buffer station mass on pipeline dynamics.
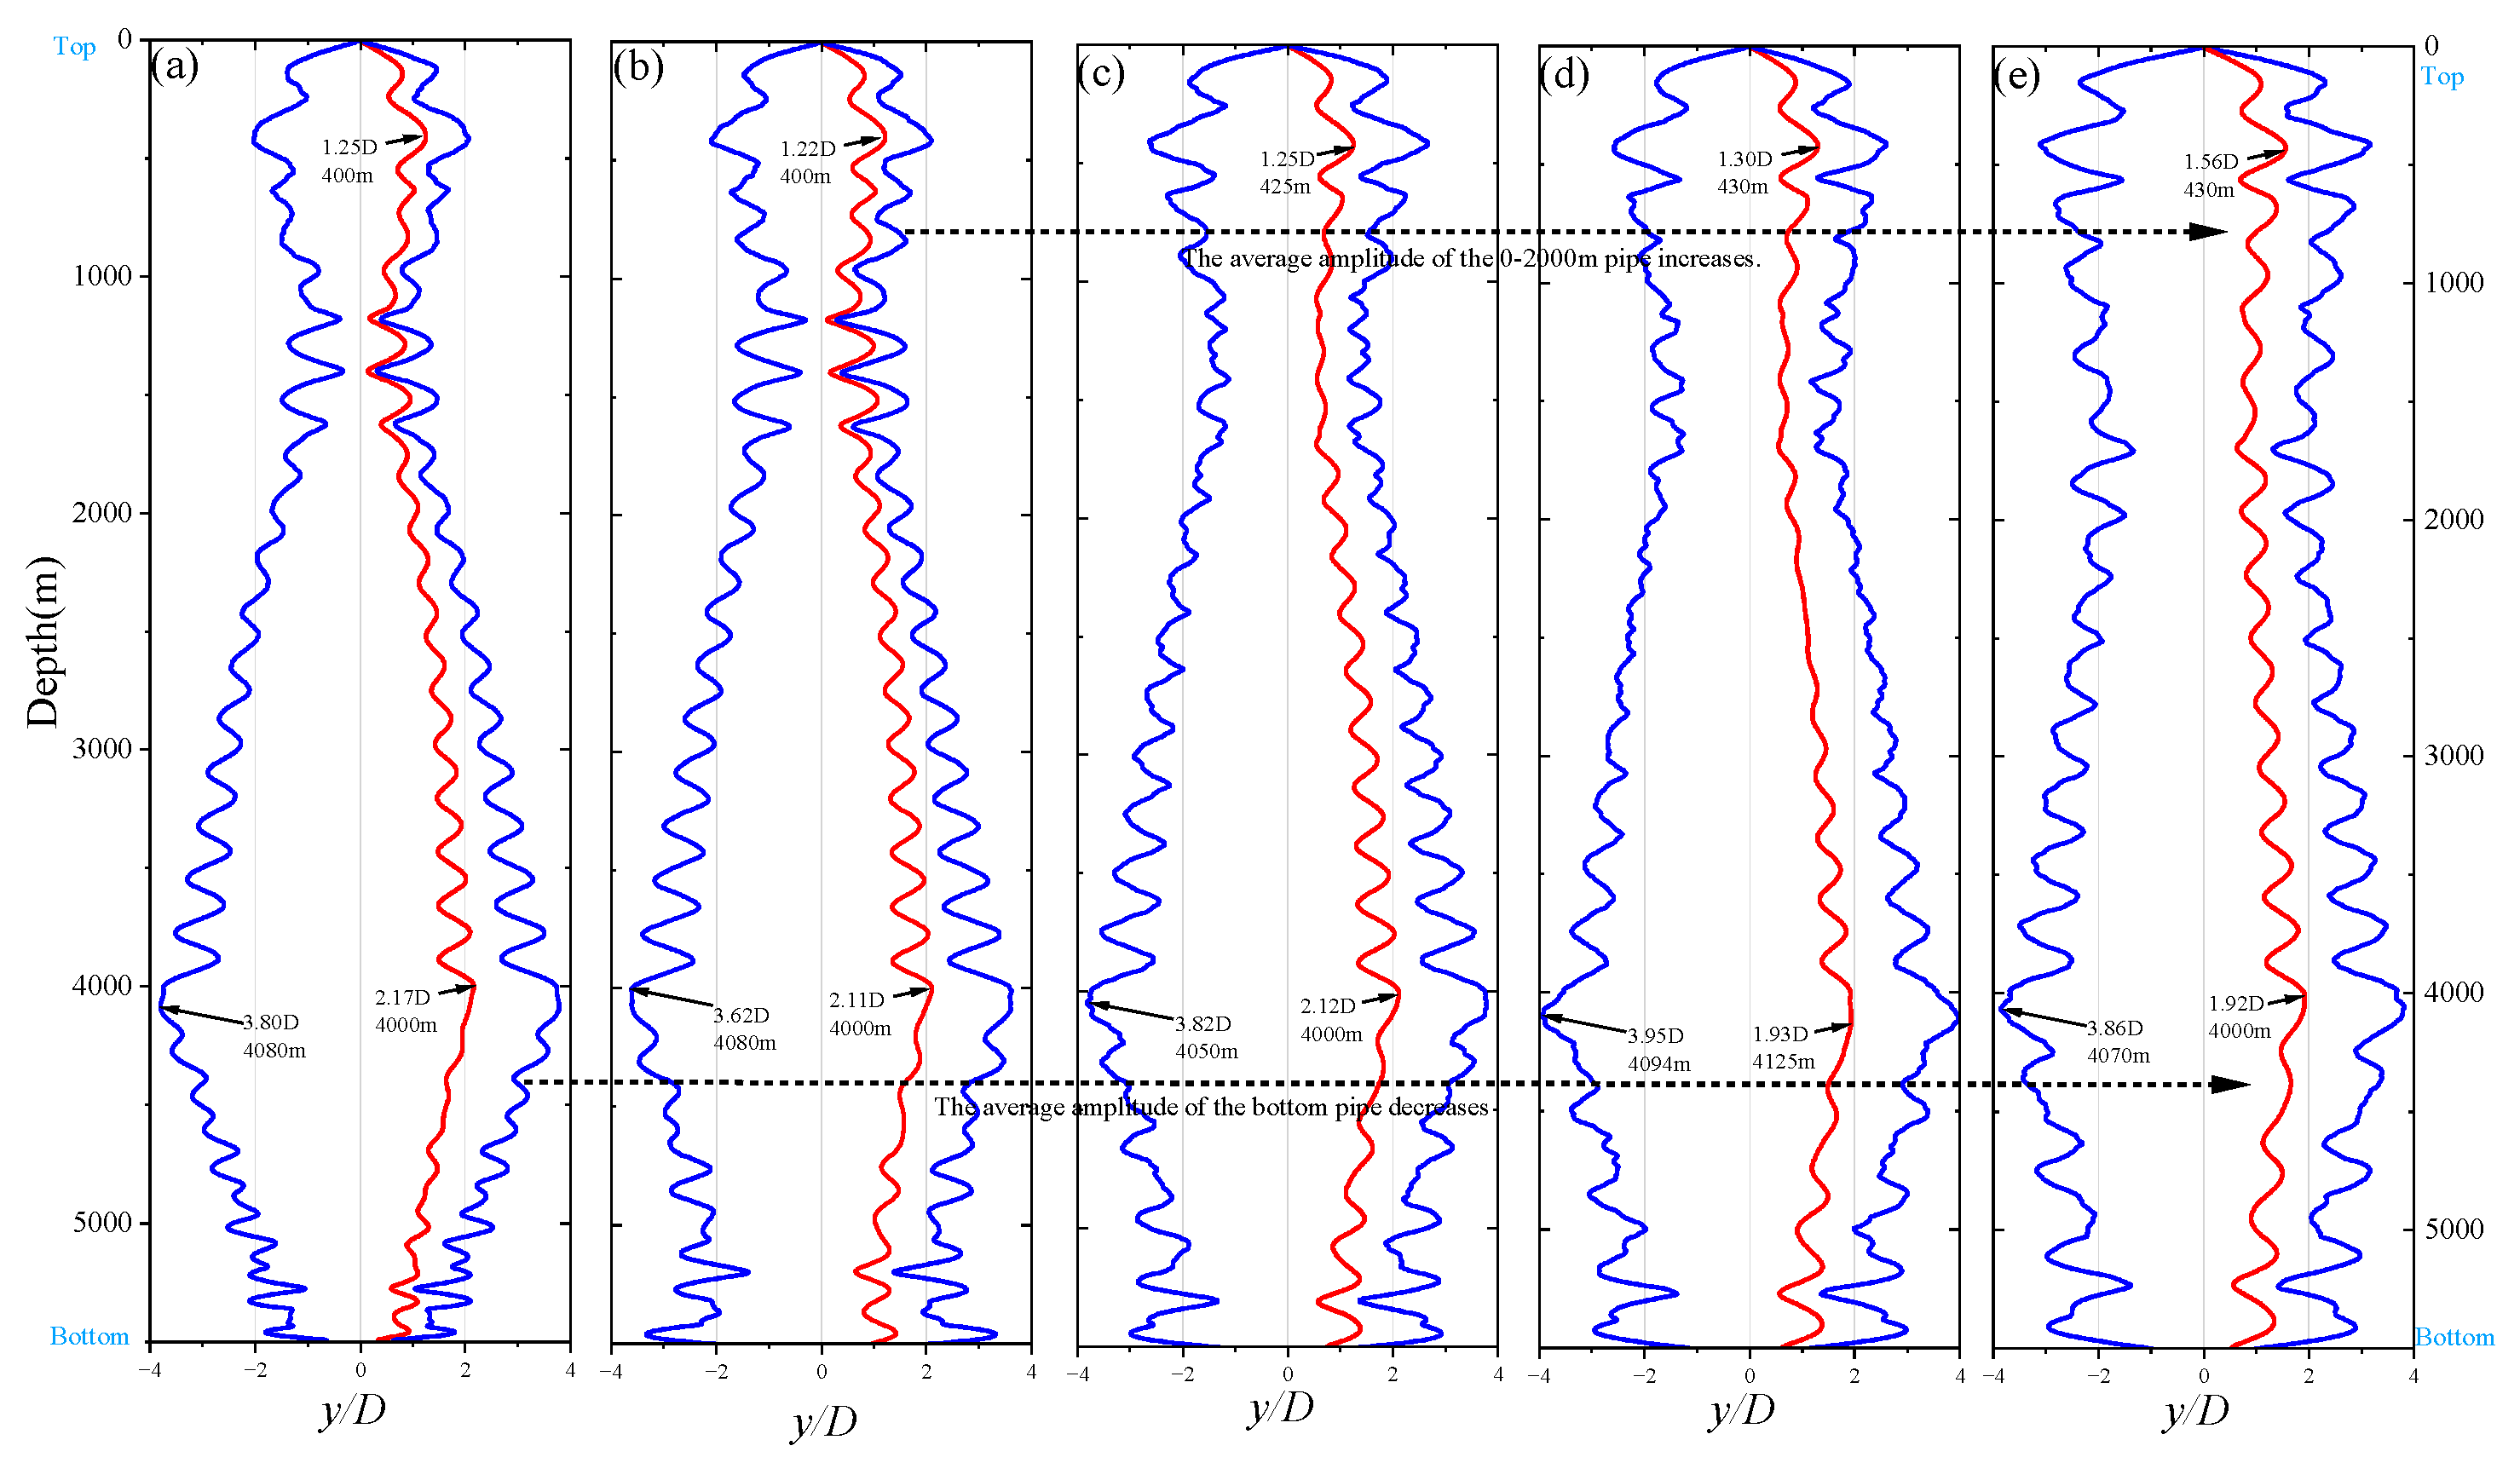
Figure 26 compares the lateral vibrations of the riser system under different buffer station masses, revealing that an increase in buffer station mass significantly affects the vibration amplitude of the top section of the riser. As the buffer station mass increases, the vibration amplitude in the top section also increases, while the amplitude in the bottom section remains relatively consistent, with a maximum amplitude of approximately 3.8–4 D occurring at a depth of 4000 m.
Figure 27 compares the vibration spectra of the riser system under different buffer station masses, showing that as the buffer station mass increases, the riser maintains a vibration state dominated by a primary mode at approximately 0.1 Hz and a secondary mode at around 0.18 Hz, with the modal frequencies remaining largely unchanged. Although the increase in buffer station mass leads to higher axial tension in the riser, which theoretically increases the natural frequencies of the same modes, the vibration frequencies in the spectrum remain stable because the riser’s vibrations are primarily governed by vortex shedding frequencies.
In summary, the buffer station mass mainly influences the vibration amplitude of the upper section of the deep-sea mining lifting system, particularly affecting the riser segments above the lifting pumps. Under constant operational parameters, reducing the buffer station mass can effectively mitigate the vibration amplitudes in the wastewater discharge pipes and the riser sections above the pump clusters, thereby achieving better vibration control of the riser system.
5.4. Dynamic Analysis at Different Flow Rates Under Current-B Profile Condition
In deep-sea mining, the riser system is affected by both vessel motion and ocean currents, causing variations in its flow-relative velocity under different operating conditions. This chapter uses the Current-B velocity profile as a case study to examine how changing flow velocities impact riser dynamics. By varying the near-surface current speed from 0.25 to 2 m/s, the dynamic responses of the riser are compared to reveal the correlation and influence of flow-relative velocity on pipeline motion.
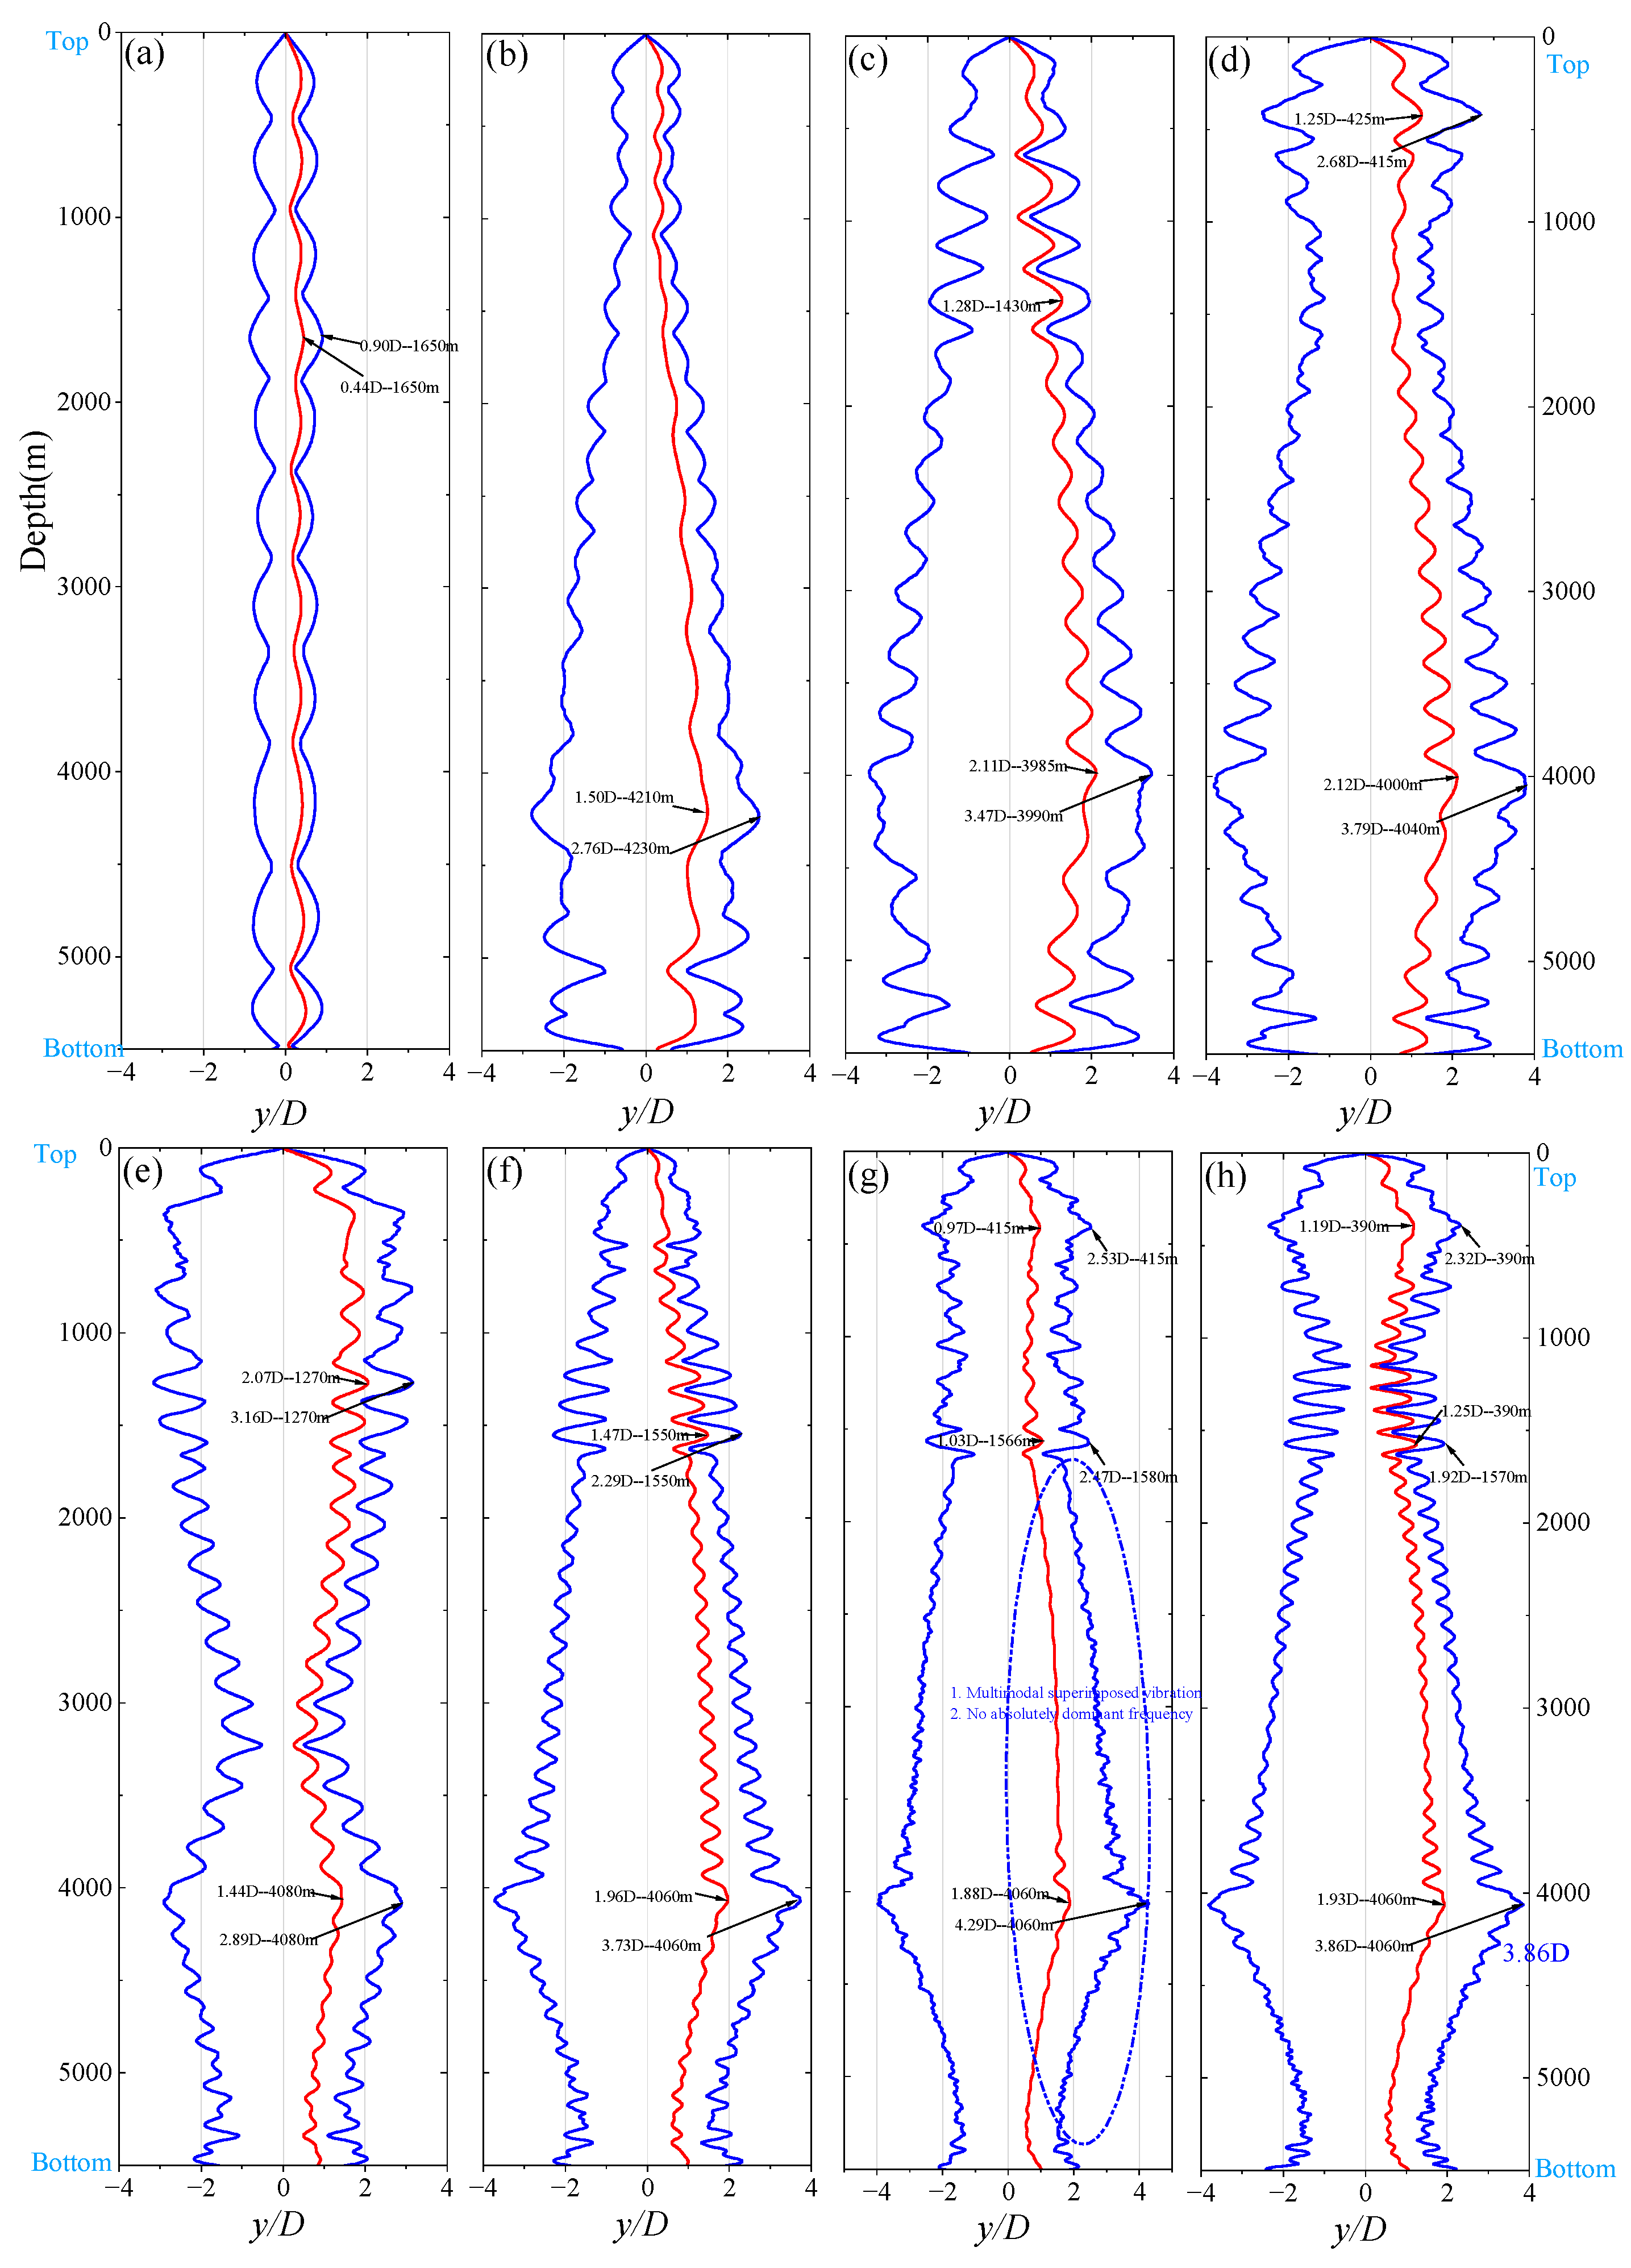
Figure 28 compares the root mean square (RMS) values and vibration envelopes of the riser under eight flow velocity conditions (0.25–2 m/s) within the Current-B velocity profile. At very low flow velocities (0.25 m/s), the riser exhibits minimal vibration. As the velocity increases, the maximum vibration amplitude also rises, and more complex vibration modes appear, characterized by the following features:
Nonlinear Response Relationship Between Flow Velocity and Amplitude: In the low-velocity range (0.25–0.75 m/s, subplots a–c), the vibration amplitude of the pipeline shows an approximately linear increase, indicating that the vibration energy is significantly enhanced with the square of the flow velocity. Except for
Figure 29g, the other conditions conform to the vortex shedding mechanism dominated by the Strouhal number, with the primary vibration originating from the vortex-induced vibrations of the riser section equipped with buoyancy modules between 600 and 4000 m.
High-Velocity Unstable Behavior: When the flow velocity exceeds 1 m/s, the rate of amplitude growth slows, and the vibration envelope tends to stabilize. Higher-order modes are excited, causing energy to redistribute across multiple modes. As shown in
Figure 28e, the vibration curve becomes nonlinear, which corresponds to the dominant mode shape. This suggests that vibration energy tends to shift into higher-order modes as flow velocity increases, leading to nonlinear energy distribution. The maximum lateral vibration amplitude stabilizes within 3.7–4.3 D, indicating that the riser enters a critical state of fluid-elastic instability. In this regime, structural damping limits further amplitude growth.
Figure 29 illustrates the vibration spectrum analysis results of the deep-sea mining lifting riser under different flow velocities. In the a–f flow velocity conditions, the pipeline’s vibration pattern is characterized by a dominant vibration frequency accompanied by a secondary modal resonance, with the secondary mode typically higher than the dominant mode (except for the 0.25 m/s condition). As the flow velocity increases, the dominant mode of the pipeline exhibits a near-linear increase, consistent with the vortex shedding mechanism governed by the Strouhal number. Under the Current-B profile at a surface velocity of 1.75 m/s, the pipeline exhibits modal superposition or switching within a broader frequency range of 0.153–0.208 Hz in the lower section, indicating a critical instability state. This behavior is also reflected in
Figure 28g, where the vibration envelope lacks a distinct waveform, and both analyses align. The superposition of multiple vibration modes leads to increased amplitude, with the maximum reaching 4.29D across all flow velocity conditions. When the velocity rises to 2 m/s, the vibration pattern shifts back to a state dominated by the combined effects of the primary and secondary modes.
Flow-induced vibration (FIV) in risers is mainly driven by vortex shedding caused by ocean currents. The vibration spectrum of the riser is often closely linked to the vortex shedding frequency. In the deep-sea mining lifting system, pipelines of varying diameters are distributed along the axial direction, with outer diameters ranging from 0.8 m at the top to 0.4064 m at the bottom. Under the typical current profile Current-B, the flow velocity varies with depth from 0.42 to 1 times the surface velocity, while the surface velocity ranges from 0.25 to 2 m/s. Estimated based on
, the vortex shedding frequency range is estimated to be approximately 0.03–0.5 Hz. The vibration spectrum of the pipeline can also be used to analyze the sources of vortex-induced excitation that dominates the pipeline’s vibration. In
Figure 29a, the 0.028 Hz peak matches the shedding frequency of a 0.7 m riser under the given flow conditions. Similarly, the 0.054 Hz peak corresponds to a 0.4064 m riser. This analysis approach can be extended to other operational conditions.
In
Figure 29b, the dominant frequency at 0.058 Hz indicates vortex-induced locking with the 0.7 m riser. A secondary peak at 0.098 Hz mainly results from the vortex shedding of the 0.4064 m bottom riser. Similar excitation sources and locking phenomena appear in
Figure 29b–f,h. In
Figure 29f, nonlinear instability causes the vibration frequency to fluctuate over a wider range. Still, the bottom riser—with its distinct diameter and shedding frequency—shows a clear dominant frequency at 0.313 Hz. This behavior is also observed under the conditions shown in
Figure 23d. Across these cases, a common feature is the depth-varying flow velocity under the Current-B profile. This variation alters the vortex shedding frequency with depth, reducing the strength of resonance and leading to lower vibration intensity near the top. This trend is further supported by the results in
Figure 28.
In conclusion, the deep-sea mining lifting system has a complex structure, consisting of pipes with varying diameters, lifting pumps, and buffer stations. The axial tension along the pipeline shows nonlinear variation, leading to both linear and nonlinear vibration patterns. The results indicate that the pipeline’s vibration amplitude varies nonlinearly with ocean current velocity, while the dominant modal frequency increases approximately linearly. However, within a certain velocity range, multiple vibration modes may overlap, causing higher amplitudes and more complex vibration behavior. To ensure operational stability, it is essential to avoid this instability range in practical engineering applications.
6. Conclusions
This paper introduced a commercialized deep-sea mining riser system with nonlinear arrangement of pipe, pump, buffer station, and buoyancy module. Through a numerical simulation that approached by Iwan-Blevins wake oscillator and the lumped mass method, the dynamics of the deep-sea mining riser system were studied. The main conclusions of this research are as follows:
- (1)
Internal slurry density and buffer station mass jointly regulate the riser’s vibration and buffer drift through changes in axial tension distribution. Riser top tension increases significantly with higher slurry concentration, and a heavier buffer station raises the system’s natural frequencies, indicating that adjusting these parameters can optimize axial tension. Ocean current velocity and buffer mass strongly affect buffer station drift. Uniform or high-speed currents can cause unacceptably large drift, whereas under moderate currents, a heavier buffer mass greatly reduces drift. Thus, tuning buffer mass and slurry density as well as avoiding operations under high-current conditions are effective strategies to control riser drift and vibrations.
- (2)
The riser VIV amplitudes and frequencies along the depth under different conditions are clarified. Ocean current velocity profiles strongly affect the riser’s dynamic response by altering the distribution of vibration energy and dominant frequencies. Under moderate, gradually varying currents, vibrations concentrate in the riser’s lower section at lower dominant frequencies, whereas steep gradient or uniform flows shift the vibration energy upward and increase the dominant frequencies. At certain critical flow velocities, multi-mode resonance is triggered, causing broadband excitation and a sharp rise in vibration amplitude. These results highlight that different current profiles produce distinct spatial vibration patterns along the riser, which should be accounted for in riser design and analysis.
- (3)
The effect and trend of slurry density and buffer station mass on VIV characteristics are clarified. Changes in internal slurry density and buffer station mass have a negligible effect on vibrations at the riser’s lower end but markedly influence the upper riser and pump regions. These parameters have little impact on overall vibration frequencies or mode shapes, yet a higher slurry density or heavier buffer station substantially amplifies vibrations in the upper ~2000 m of the riser, whereas reducing them lowers the upper-section amplitudes. This indicates that tuning slurry density and buffer mass is an effective strategy to control vibration in the critical upper sections with minimal impact on the lower portion.
Overall, the findings can guide future engineering design and operational planning of deep-sea mining riser systems. In particular, optimizing buffer station mass and slurry concentration as well as accounting for various ocean current conditions will help engineers mitigate riser vibration and drift, enhancing the safety and efficiency of large-scale commercial deep-sea mining operations.
