Article

Simulating the Coastal Protection Performance of Breakwaters in the Mekong Delta: Insights from the Western Coast of Ca Mau Province, Vietnam

1
Faculty of Water Resource Engineering, College of Engineering, Can Tho University, Can Tho 94000, Vietnam
2
Department of Harbor and River Engineering, National Taiwan Ocean University, Keelung 20224, Taiwan
3
College of Environment and Natural Resources, Can Tho University, Can Tho 94000, Vietnam
4
Faculty of Environmental Earth Science, Hokkaido University, N10W5 Sapporo, Hokkaido 060-0810, Japan
5
Institute of Liberal Arts and Sciences, Tohoku University, 41 Kawauchi, Aoba-ku, Sendai 980-8576, Japan
*
Author to whom correspondence should be addressed.
J. Mar. Sci. Eng. 2025, 13(8), 1559; https://doi.org/10.3390/jmse13081559
Submission received: 24 June 2025 / Revised: 29 July 2025 / Accepted: 11 August 2025 / Published: 14 August 2025
(This article belongs to the Section Coastal Engineering)

Abstract

The Vietnamese Mekong Delta (VMD) is experiencing accelerated coastal erosion, driven by upstream sediment trapping, sea-level rise, and local anthropogenic pressures. This study evaluates the effectiveness of pilot breakwater structures in mitigating erosion and supporting mangrove regeneration along the western coast of Ca Mau Province—one of the delta’s most vulnerable shorelines. An integrated methodology combining field-based wave monitoring, remote sensing analysis of shoreline and mangrove changes (2000–2024), and high-resolution Flow-3D hydrodynamic modeling was employed to assess the performance of four breakwater typologies: semi-circular, pile-rock, Busadco, and floating structures. The results show that semi-circular breakwaters achieved the highest wave attenuation, reducing maximum wave height (Hmax) by up to 76%, followed by pile-rock (69%), Busadco (66%), and floating structures (50%). Sediment accretion and mangrove stabilization were most consistent around the semi-circular and pile-rock types. Notably, mangrove loss slowed significantly after breakwater installation, with the annual deforestation rate dropping from 7.67 ha/year (2000–2021) to 1.1 ha/year (2021–2024). Simulations further revealed that mangrove width strongly influences wave dissipation, with belts under 5 m offering minimal protection. The findings highlight the potential of hybrid coastal protection strategies that combine engineered structures with ecological buffers. Modular solutions such as floating breakwaters offer flexibility to adapt with evolving shoreline dynamics. These findings inform scalable coastal protection strategies under sediment-deficit conditions. This study contributes to Vietnam’s Coastal Development Master Plan and broader resilience efforts under Sustainable Development Goals (SDGs) 13 and 14, providing evidence to inform the design and scaling of adaptive, nature-based infrastructure in sediment-challenged deltaic environments.

1. Introduction

Coastal erosion is a growing global concern, particularly in low-lying deltaic regions where sediment supply, sea-level rise, and anthropogenic interventions intersect to destabilize shorelines. Deltas are among the most densely populated and ecologically productive landscapes on Earth, yet they are disproportionately vulnerable to environmental change and human pressures. Coastal deltas like the Mississippi in the U.S., the Nile in Egypt, and the Ganges–Brahmaputra–Meghna in Bangladesh have all faced significant shoreline retreat in recent decades. This retreat is largely driven by declining sediment supply from upstream, land subsidence, and the unintended consequences of hard infrastructure such as dams and embankments [1,2,3,4]. These challenges are increasingly compounded by climate change-induced sea-level rise, altered precipitation regimes, and intensifying storm activity [5].
The Vietnamese Mekong Delta (VMD) is a striking example of these overlapping vulnerabilities and stands among the most rapidly degrading delta systems in Southeast Asia. The delta’s historically rich sediment dynamics have been severely disrupted by upstream dam construction, excessive sand mining, and land use conversion, resulting in accelerated erosion, saltwater intrusion, and loss of protective coastal ecosystems [6,7,8]. In recent years, coastal retreat in parts of the VMD has reached rates exceeding 30 m per year [6,9,10], with grave implications for both socioecological resilience and national food security. While policy attention to the VMD’s climate vulnerability has increased, including through Vietnam’s Coastal Development Master Plan (2021–2030), the effectiveness of implemented coastal protection strategies remains inadequately assessed, particularly in highly dynamic sediment-starved environments.
From an engineering perspective, the destabilization of deltaic coastlines raises urgent questions about the design, placement, and long-term viability of coastal protection structures. Traditional hard infrastructure—such as seawalls, revetments, and groynes—has shown varying degrees of success in controlling shoreline change, but may lead to ecological degradation or exacerbate erosion in adjacent areas [11,12,13]. In response, hybrid and nature-based approaches have gained prominence, combining engineered features like breakwaters with ecological buffers such as mangrove belts [14]. However, site-specific evaluations of these hybrid solutions—especially in rapidly evolving delta settings—remain scarce.
The scientific problem addressed in this study lies at the interface between hydrodynamic engineering and ecological restoration. Specifically, there is a critical need to assess the wave attenuation capacity and sediment stabilization performance of different breakwater types under real-world conditions. Moreover, understanding how these structures interact with mangrove ecosystems can inform the development of modular, adaptive strategies suited to dynamic coastal landscapes where sediment inputs are declining. Few studies have integrated in situ measurements, remote sensing, and high-resolution numerical modeling to evaluate both physical and ecological outcomes of breakwater deployment in deltaic environments. This urgency has been formally recognized in Vietnam’s national planning, particularly through Resolution 120 and the emerging Blue Economy framework, which emphasize integrated, adaptive, and ecosystem-based approaches to sustainable development in the VMD.
This research addresses that knowledge gap by evaluating the coastal protection performance of four breakwater typologies—semi-circular, pile-rock, Busadco, and floating structures—along the erosion-prone western coastline of Ca Mau Province in the VMD. The study integrates field-based wave monitoring, satellite analysis of shoreline and mangrove changes (2000–2024), and 3D Flow-3D hydrodynamic modeling to assess wave reduction efficiency, sediment accumulation, and ecological co-benefits. By doing so, it contributes to the design and optimization of hybrid infrastructure solutions that align with both engineering goals and ecological resilience.
In particular, the study seeks to:
  • Quantify and compare the wave attenuation capacity of different fixed and floating breakwater structures;
  • Analyze shoreline change and mangrove recovery dynamics over two decades, before and after breakwater installation;
  • Simulate the wave–structure–mangrove interactions under varying forest widths and coastal configurations;
  • Provide recommendations for adaptive, scalable coastal defense strategies in sediment-starved delta environments.
Positioned within the broader context of climate-resilient infrastructure, this research aligns with global sustainability frameworks including SDG 13 (Climate Action) and SDG 14 (Life Below Water). It also directly supports national planning objectives under Vietnam’s Blue Economy agenda, where sustainable coastal protection is considered integral to economic development and ecological preservation.

2. Study Area

The VMD is a geologically recent formation, shaped over the past four millennia by sedimentary deposits carried downstream from the lower Mekong River. This long-term depositional process has produced a fragile landscape, characterized by unconsolidated alluvial, marine, and wetland sediments [15]. Despite its geomorphological youth, the VMD has evolved into a densely inhabited and agriculturally vital region, supporting a population of over 17 million. Functioning as one of the world’s principal rice-producing regions, the delta plays a pivotal role in ensuring both national subsistence and global food security [16,17,18]. However, the delta ranks among the top three most climate-vulnerable delta’s worldwide, contending with accelerating environmental degradation driven by both climatic stressors and anthropogenic pressures [19,20]. A particularly urgent concern is the intensification of riverbank and coastal erosion, which undermines both socio-economic livelihoods and critical ecosystems across the delta. These hydrological shifts result from the compound effects of global climate change and regionally unsustainable socio-economic interventions [6,9,10,21,22].
Ca Mau Province, situated at the southernmost tip of the VMD, represents one of the most acutely affected regions in the deltaic landscape. Its expansive low-lying coastal plain renders it particularly susceptible to sea-level rise, storm surges, and the intensification of extreme weather events. Historically, a narrow fringe of mangrove forest functioned as a critical natural defense, mitigating wave energy and stabilizing the shoreline. However, decades of mangrove clearance, driven by aquaculture expansion, timber extraction, and insufficient regulatory enforcement, have severely compromised this ecological buffer. The degradation is starkly visible along Ca Mau’s 245 km coastline, where erosion has progressively widened breaches in the mangrove belt and destabilized residual headland formations. These landscape changes not only heighten physical exposure to coastal hazards but also weaken the province’s capacity for adaptive resilience amid accelerating climatic pressures. In the absence of effective and sustained intervention, the ongoing degradation of mangrove ecosystems will further amplify the vulnerability of coastal communities, leaving them increasingly exposed to storm surges, tidal inundation, and recurrent flooding events [23].
To combat these growing threats, a combination of structural and non-structural measures has been implemented to mitigate erosion in the VMD. Hard engineering structures, such as three types of breakwaters in Figure 1, have been deployed to dissipate wave energy and facilitate sediment deposition. A notable example is the installation of concrete breakwaters along the eastern coastline, which has helped stabilize shorelines and reduce wave heights by up to 62% [23]. Additionally, seawalls and revetments have been constructed in highly vulnerable areas to provide direct protection against wave-induced erosion. However, while effective in the short term, these structures can sometimes accelerate erosion in adjacent areas if not carefully designed [24].
Beyond engineering solutions, nature-based approaches have gained increasing attention as sustainable erosion control strategies. One of the most significant initiatives is mangrove reforestation, which recognizes the crucial role of mangroves as natural wave buffers. Between 2015 and 2020, approximately 11,184 hectares of mangroves were replanted across the VMD, strengthening coastal resilience [25]. In some regions, bamboo fences and geotextile tubes have been deployed to trap sediments and support mangrove regeneration. Other interventions include sediment nourishment and artificial dune creation, which involve strategically placing dredged materials along eroding shorelines to restore beach profiles. However, the long-term effectiveness of these methods depends on continuous maintenance and monitoring [26].
Despite ongoing efforts, challenges remain in ensuring the long-term sustainability of erosion control projects. The effectiveness of implemented measures varies depending on cost, local geography, and environmental conditions. Furthermore, comprehensive assessments of these approaches are still limited, highlighting the need for continuous evaluation and adaptive strategies [27,28,29,30,31,32]. Despite a range of implemented interventions, few studies have provided comprehensive evaluations combining in situ measurements, remote sensing data, and numerical modeling to assess both natural and engineered responses to coastal erosion in Ca Mau.

3. Materials and Methods

3.1. Wave Conditions and Shoreline Change Assessment

3.1.1. Wave Measurement

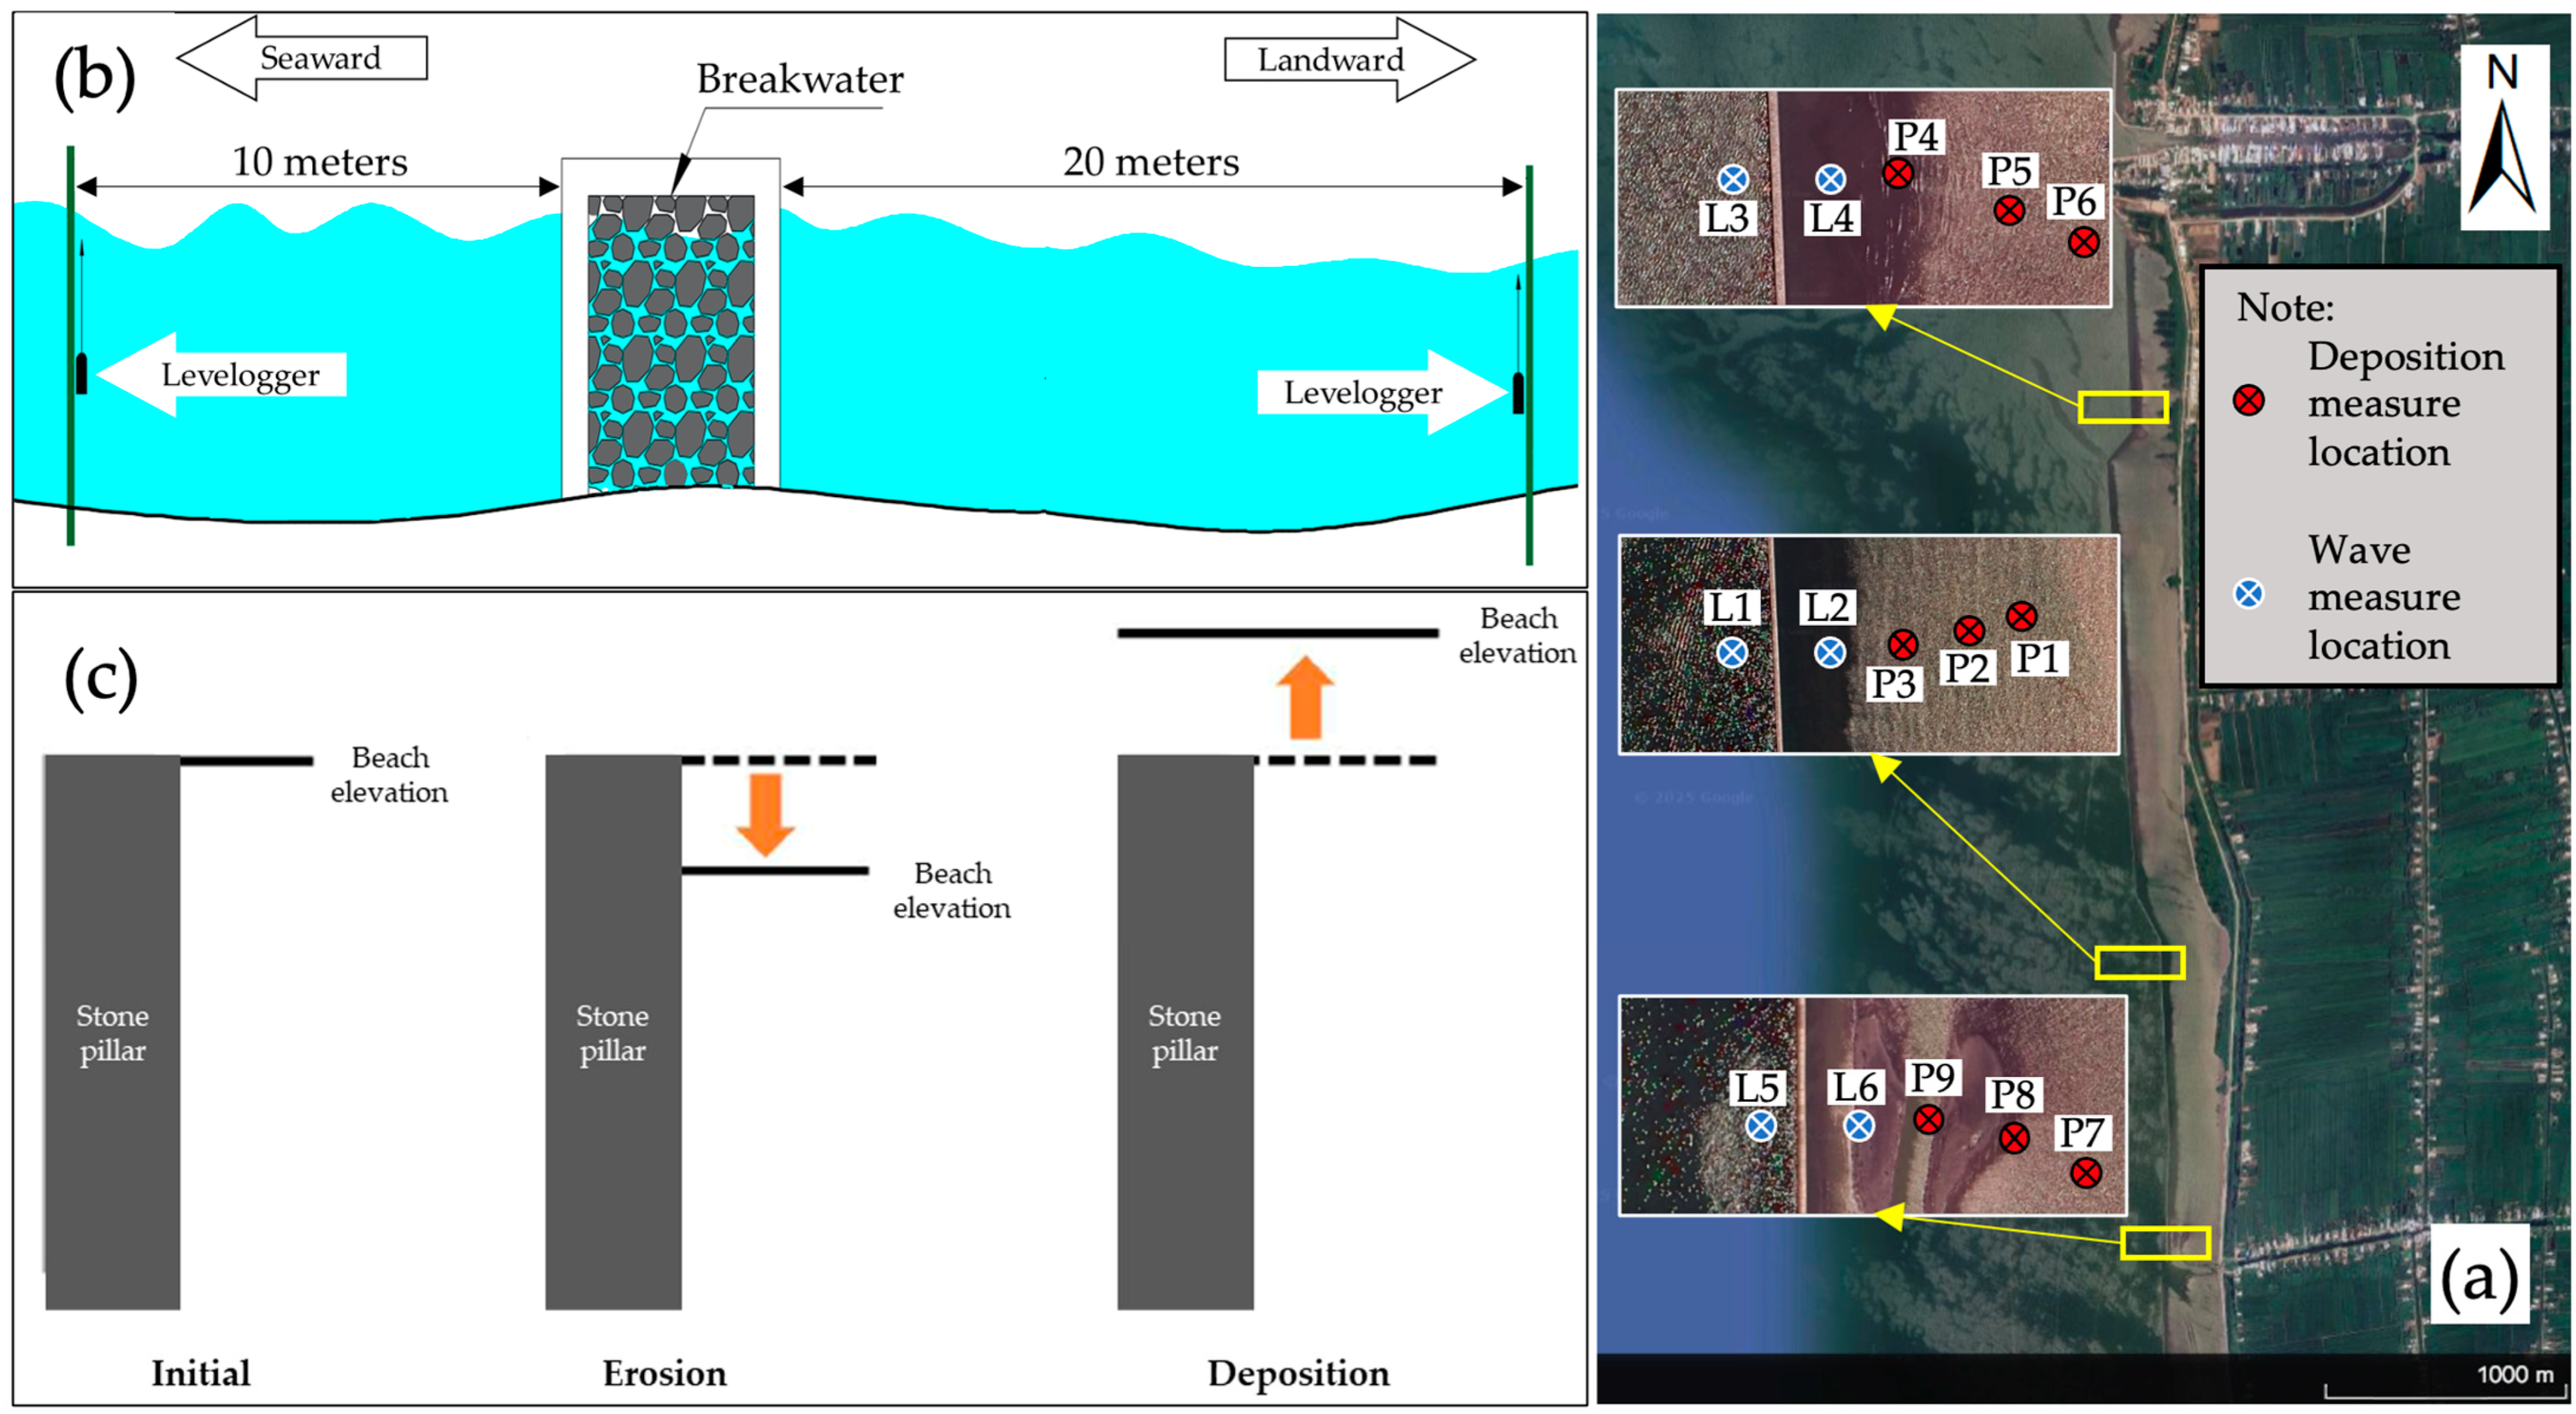
Levelogger 5 Junior sensors manufactured by Solinst Canada Ltd. (Halton Hills, ON, Canada) and the Infinity-WH AWH-USB sensors from JFE Advantech Co., Ltd. (Hyogo, Japan) were employed for continuous water level monitoring, facilitating the calculation of wave height over time. These sensors were securely attached to melaleuca trees and strategically positioned at two distinct locations: (1) 10 m seaward from the breakwaters and (2) 20 m landward from the breakwaters, as illustrated in Figure 2. The sensors were installed at an elevation of approximately 1.0 m above the seabed. The instrument was deployed continuously for 7 h, from 10:00 to 17:00 on 25 June 2023 during high-tide conditions.
Wave measurements were conducted at three designated sites where breakwaters had previously been installed. The study focused on three types of breakwaters: (1) Busadco, (2) centrifugal pile-rock, and (3) semi-circular breakwaters within the research area. For each breakwater type, two leveloggers were used, with one placed on the seaward side and the other on the landward side of the structure to capture wave conditions before and after interaction. Water level data were recorded at intervals of 0.5 s and converted into water column height, from which wave height was subsequently calculated [33]. The data processing procedures were programmed into functions using MATLAB (Version R2023b) and R programming languages [34]. Wave parameters, including significant wave height and wave period, were recorded and used as input for the FLOW-3D HYDRO (Version 2024R1) numerical simulation described in Section 3.2.

3.1.2. Deposition/Erosion Measurement

To calculate the coastal erosion, stone pillars are used as monitoring markers. The stone pillars are placed in a rectangular grid and their coordinates are stored by the RTK machine (Figure 2). Initially, the top elevation of the stone pillars is placed at the same level as the beach elevation. In this study, the monitoring pillars were installed on 19 March 2023. After measurement periods, the beach elevation will be surveyed and compared with the top elevation of the stone pillars to calculate the beach erosion/accretion. Measurements were conducted during two distinct periods: 6 August 2023 and 28 April 2024. The calculation details are shown in Figure 2c. At each type of breakwater, 3 stone pillars were arranged at 3 positions as shown in Figure 2.

3.1.3. Image Processing and Mangrove Area Dynamics

  • Data Sources
The satellite images used in this study include Landsat 5, 8, and Sentinel-2 imagery, acquired from the USGS and Copernicus Open Access Hub. Selected images were required to meet clarity and cloud cover criteria. Initially, images with less than 10% cloud cover were targeted. However, due to the limited availability of Landsat images in the study area, and the fact that many images with overall cloud cover below 10% had clouds concentrated along the coastline, the cloud cover threshold was increased to 15%. This adjustment allowed for clearer images in the research area, ensuring more reliable analysis.
For Sentinel-2 imagery, NDVI images were obtained directly without additional processing, also with a 15% cloud cover limit. Google Earth images, which offer very high resolution, were used to estimate mangrove forest areas based on actual image interpretation (Table 1).
b.
Image Processing
Landsat images were analyzed and processed using QGIS software (Version 3.38), which was also used for data interpretation, editing, and storage. Google Earth Pro was utilized for error correction and accuracy assessment. The collected Landsat images had been pre-processed with geometric correction using the global UTM/WGS-84 coordinate system (zone 48N), minimizing location errors and topographic discrepancies. The study focused on shoreline extraction, using various RGB band combinations for different analytical purposes (Table 2).
Image classification in remote sensing involves clustering pixels into categories based on similar attributes and probability assessments. This study employed both supervised and unsupervised classification methods to extract target features accurately. Supervised classification assigns Digital Number (DN) values of pixels into groups based on user-defined training areas. This method relies on prior knowledge of land cover types in the study area and is more accurate when sufficient representative samples are available. Unsupervised classification, in contrast, automatically groups pixels based on spectral properties without predefined training areas. While it does not always align perfectly with real-world conditions, it allows classification without prior land cover data.
For Landsat data processing, the Normalized Difference Water Index (NDWI) was used to distinguish water bodies from land areas, detecting subtle variations in water content. NDWI values range between −1 and +1, with positive values indicating water bodies [35,36]:
N D W I = G R E E N N I R G R E E N + N I R
where GREEN is the green light channel, which has a wavelength from 0.52 to 0.60 µm, and NIR is the near-infrared channel, which has a wavelength from 0.76 to 0.90 µm.
The Normalized Difference Vegetation Index (NDVI) was also utilized to assess mangrove coverage, leveraging vegetation reflectance properties.
N D V I = N I R R E D N I R + R E D
In which RED is the green light channel, which has a wavelength from 0.64 to 0.67 µm. NDVI values range from −1 to +1, where negative values indicate water, and positive values (closer to +1) indicate dense vegetation (Table 3). However, in coastal areas, NDVI values for mangroves were lower due to young plantations or newly formed mudflats, leading to potential misclassification with agricultural land [37].
Sentinel-2 NDVI images were processed directly without additional calculations, allowing direct extraction of mangrove areas.
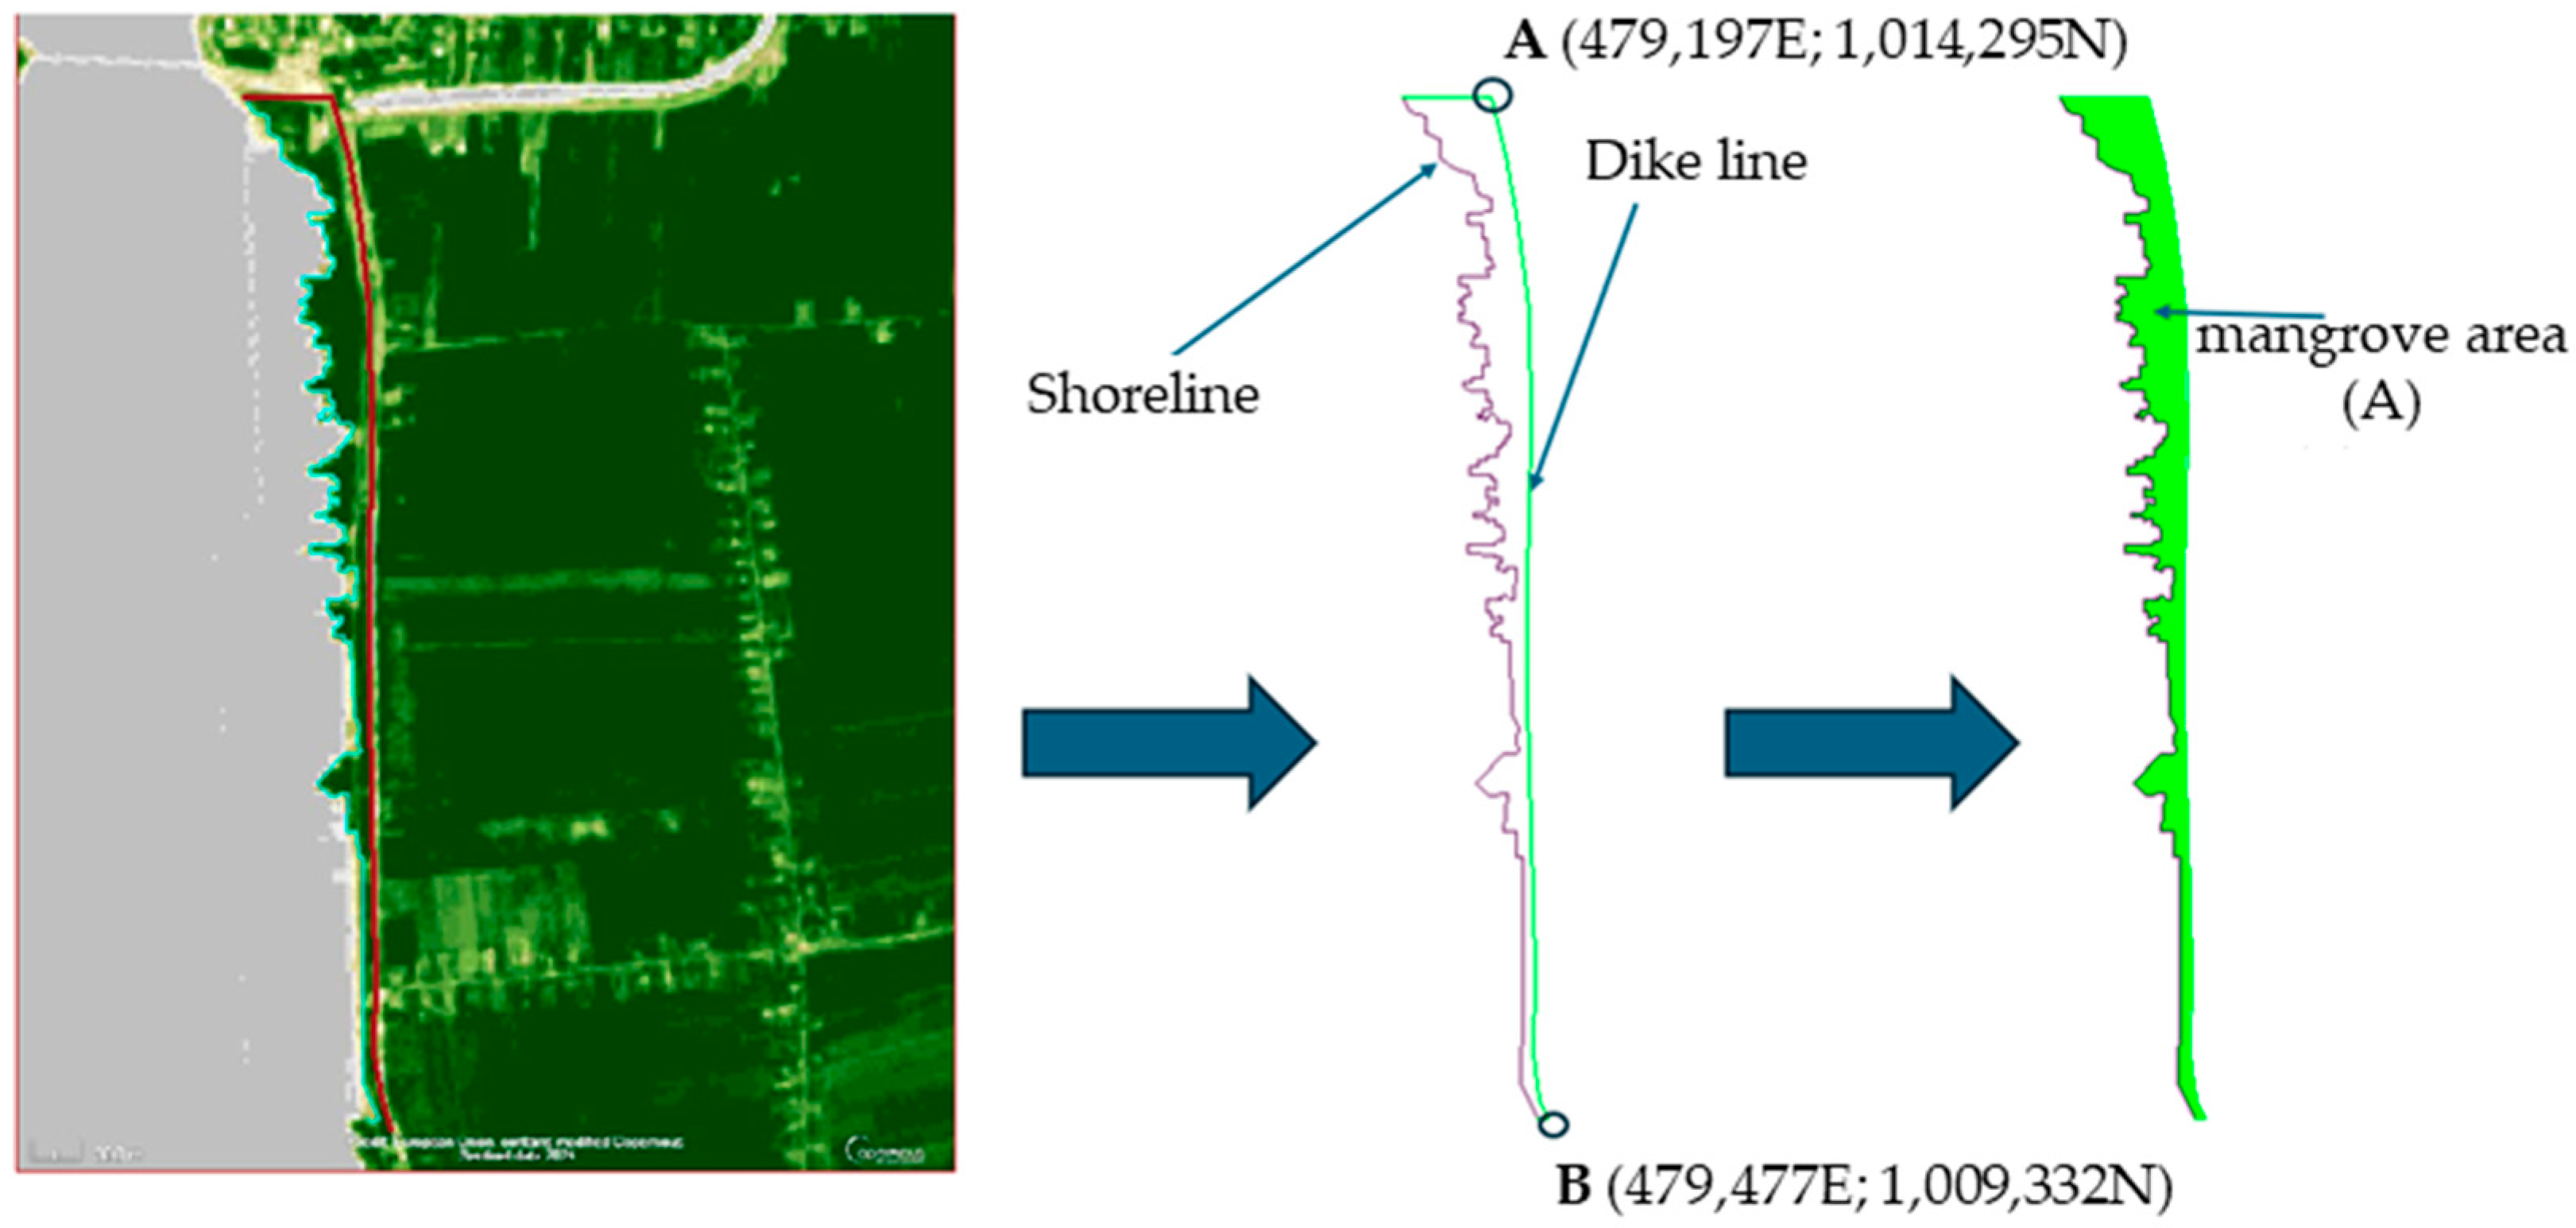
NDWI and NDVI classifications were performed using the Raster Calculator tool in QGIS. After multiple reclassification adjustments, the raster data were converted into vector format for further analysis. Manual interpretation was conducted to refine the classification results, ensuring alignment with actual conditions. A reference baseline was drawn across the study area to facilitate mangrove area change calculations over time (Figure 3).
Google Earth images, with a high resolution of approximately 1.0 m, were divided into eight smaller frames to maintain clarity. These frames were georeferenced due to image misalignment. Root Mean Square Error (RMSE) was calculated to evaluate correction accuracy.
R M S E = i = 1 n ( y ^ i y i ) 2 n
where y ^ i represents the actual (observed) values; yi represents the predicted or estimated values; and n is the total number of observations (Figure 4).
Automatic shoreline extraction was not feasible for Google Earth images due to their panchromatic nature. However, their high resolution enabled manual shoreline digitization based on visible features (e.g., infrastructure, vegetation, water bodies). This method, while effective, depends heavily on the expertise of the analyst and has an estimated error margin of 2.0–4.0 m [39] (Figure 4).

3.2. Hydraulic Model Simulation—Flow3D

3.2.1. Input Data

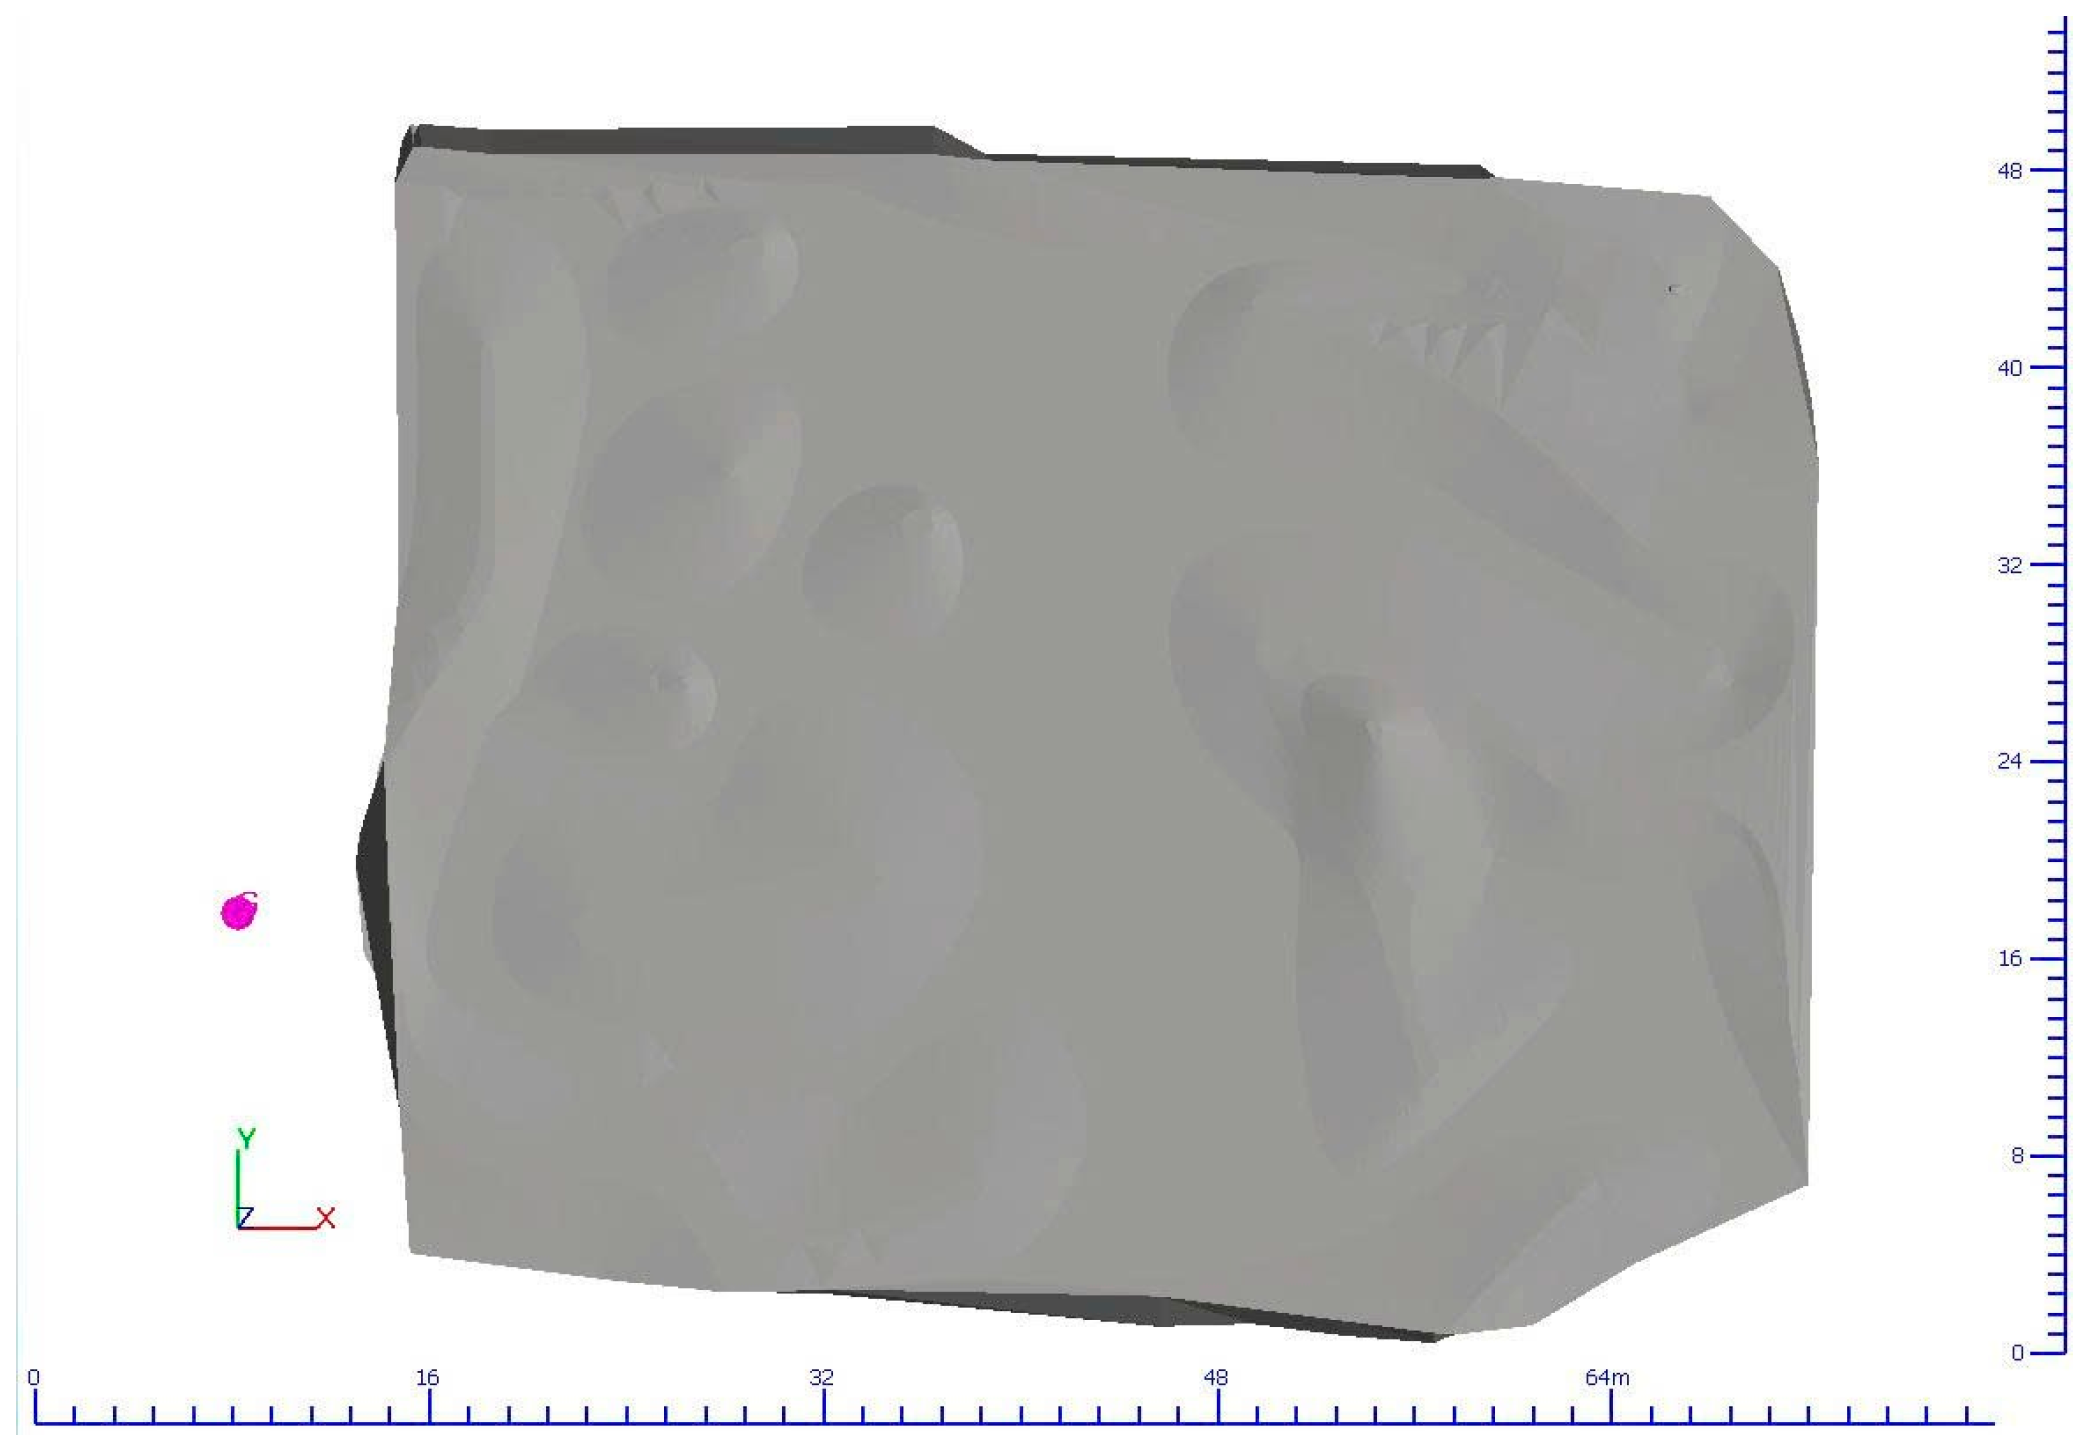
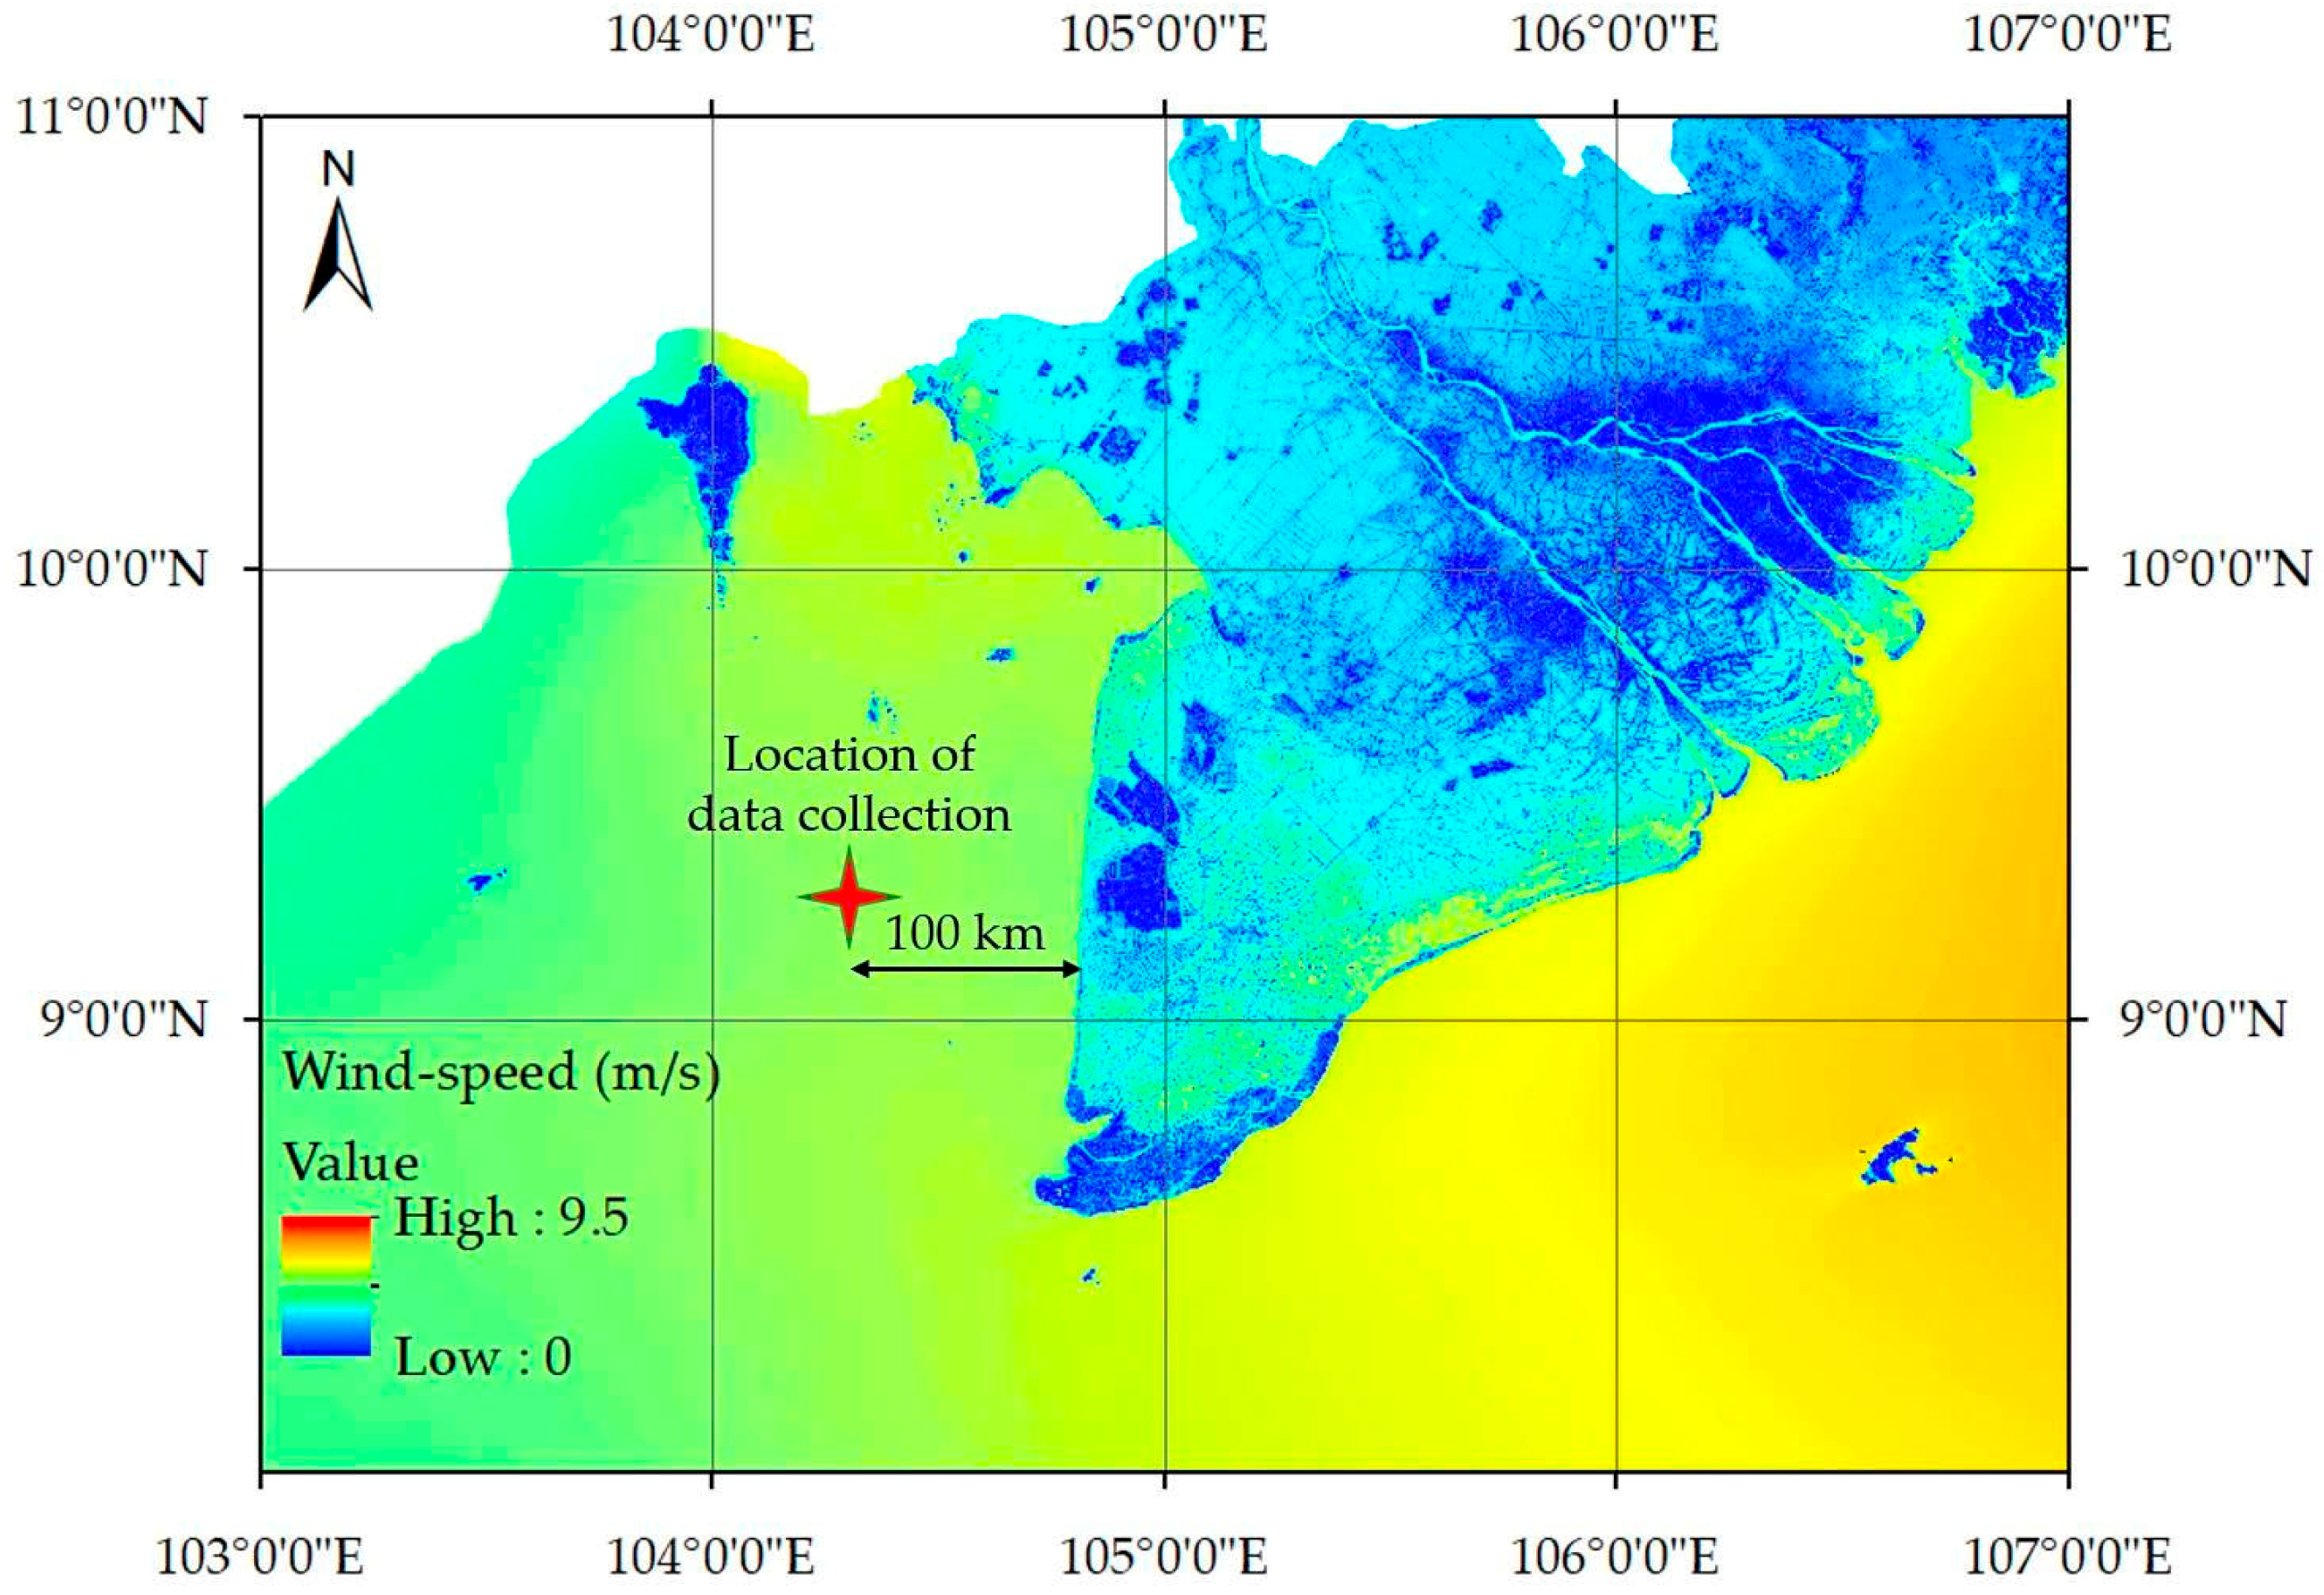
Secondary data, such as the geometric dimensions of the pile-rock breakwater, the seabed topography in the construction area, and offshore wind data, were collected from the design documents of the pile-rock breakwater for coastal erosion prevention in the western region of Ca Mau province and the Vortex homepage in Figure 5 [40].
The design water level data was used as input for the boundary and initial conditions in the Flow-3D model [40]. The geometric dimensions of the revetment were used to construct the 3D model of the revetment and the floating breakwater structure using AutoCAD software (Version 2023 for student). The model was then saved in .stl format for integration into the Flow-3D model. The 3D model of the pile-rock is illustrated in [40].
Wind data was obtained from the GLOBAL WIND ATLAS homepage, with statistical data representing the average wind speed at a height of 10 m. This wind speed value serves as the boundary condition in the Flow-3D model. The interface of the GLOBAL WIND ATLAS homepage is depicted in Figure 6. It can be observed that the average wind speed at the selected wind extraction point in Figure 6 is 5.23 m/s, which is also the value used as the boundary condition for wave simulation in the Flow-3D model. Furthermore, the wind data were downloaded for the same period as the measured wave data at the study area, i.e., from 10:00 to 17:00 on 25 June 2023, during high-tide conditions, to ensure accurate calibration and validation of the model.

3.2.2. Model Setting-Up

This section discusses the modeling approach for the floating breakwater structure, while other solutions are set up similarly based on the parameters of the floating structure. In this study, the floating breakwater is simulated to determine its ability to reduce wave height. Therefore, the model is constructed with the following simplified conditions:
-
A flat seabed topography;
-
A water column depth of 10 m;
-
Simulated waves are wind-generated waves following the Jonswap spectrum.
  • Defining the Physical Parameters of the Model
The geometric structures, after being constructed in Civil 3D software (Version 2023 for student), will be saved as .stl files and imported into the Flow-3D model through the STL tool. The geometric structures of the model include (1) floating structures and (2) mooring cables. The 3D object parameters, such as roughness and element type, are specified in Table 4 and Table 5.
The physical conditions of the Flow-3D model are declared in the Physics tab. In the scope of this study, which is to simulate waves through floating structures, it is only necessary to declare the conditions for (1) gravitational acceleration and (2) turbulent flow model as follows (Table 6):
b.
Mesh Creation
The computational mesh is built to ensure that the details of the floating structure are captured and not too fine to save resources and simulation time. For a simple model consisting of only a rectangular block such as a floating structure, the computational mesh is selected with the size of each grid cell equal to 1.0 m. Due to the constraints and limitations of the software, the model is only capable of simulating wave dynamics within a 1 m-wide wave trough.

3.2.3. Wave Height Reduction Evaluation

The wave reduction efficiency was evaluated according to two criteria: (1) reducing the height and (2) reducing the wave energy transmitted through the breakwaters. The height of waves in the area behind the breakwaters, symbol Ht, was determined using the following formula:
Ht = Ktr × Hsp
where Hsp is the height of waves in front of the structure (m), and Ktr is the wave trans- mission coefficient. Ktr depends on the distance from the top of the structure to the design to sea level (hc) and the wave height in front of the structure (Hsp). The wave reduction efficiency (ε) was calculated using the following formula:
ε = (1 − Ktr) × 100%
Considering cases for calculating wave reduction based on actual measurement results for three cases: (a) average 1/10 of the maximum wave height (1/10 Hmax); (b) average 1/3 of the maximum wave height (1/3 Hmax); and (c) maximum wave height (Hmax).

4. Results

4.1. Current Status of Different Measures

4.1.1. Wave Height Recorded

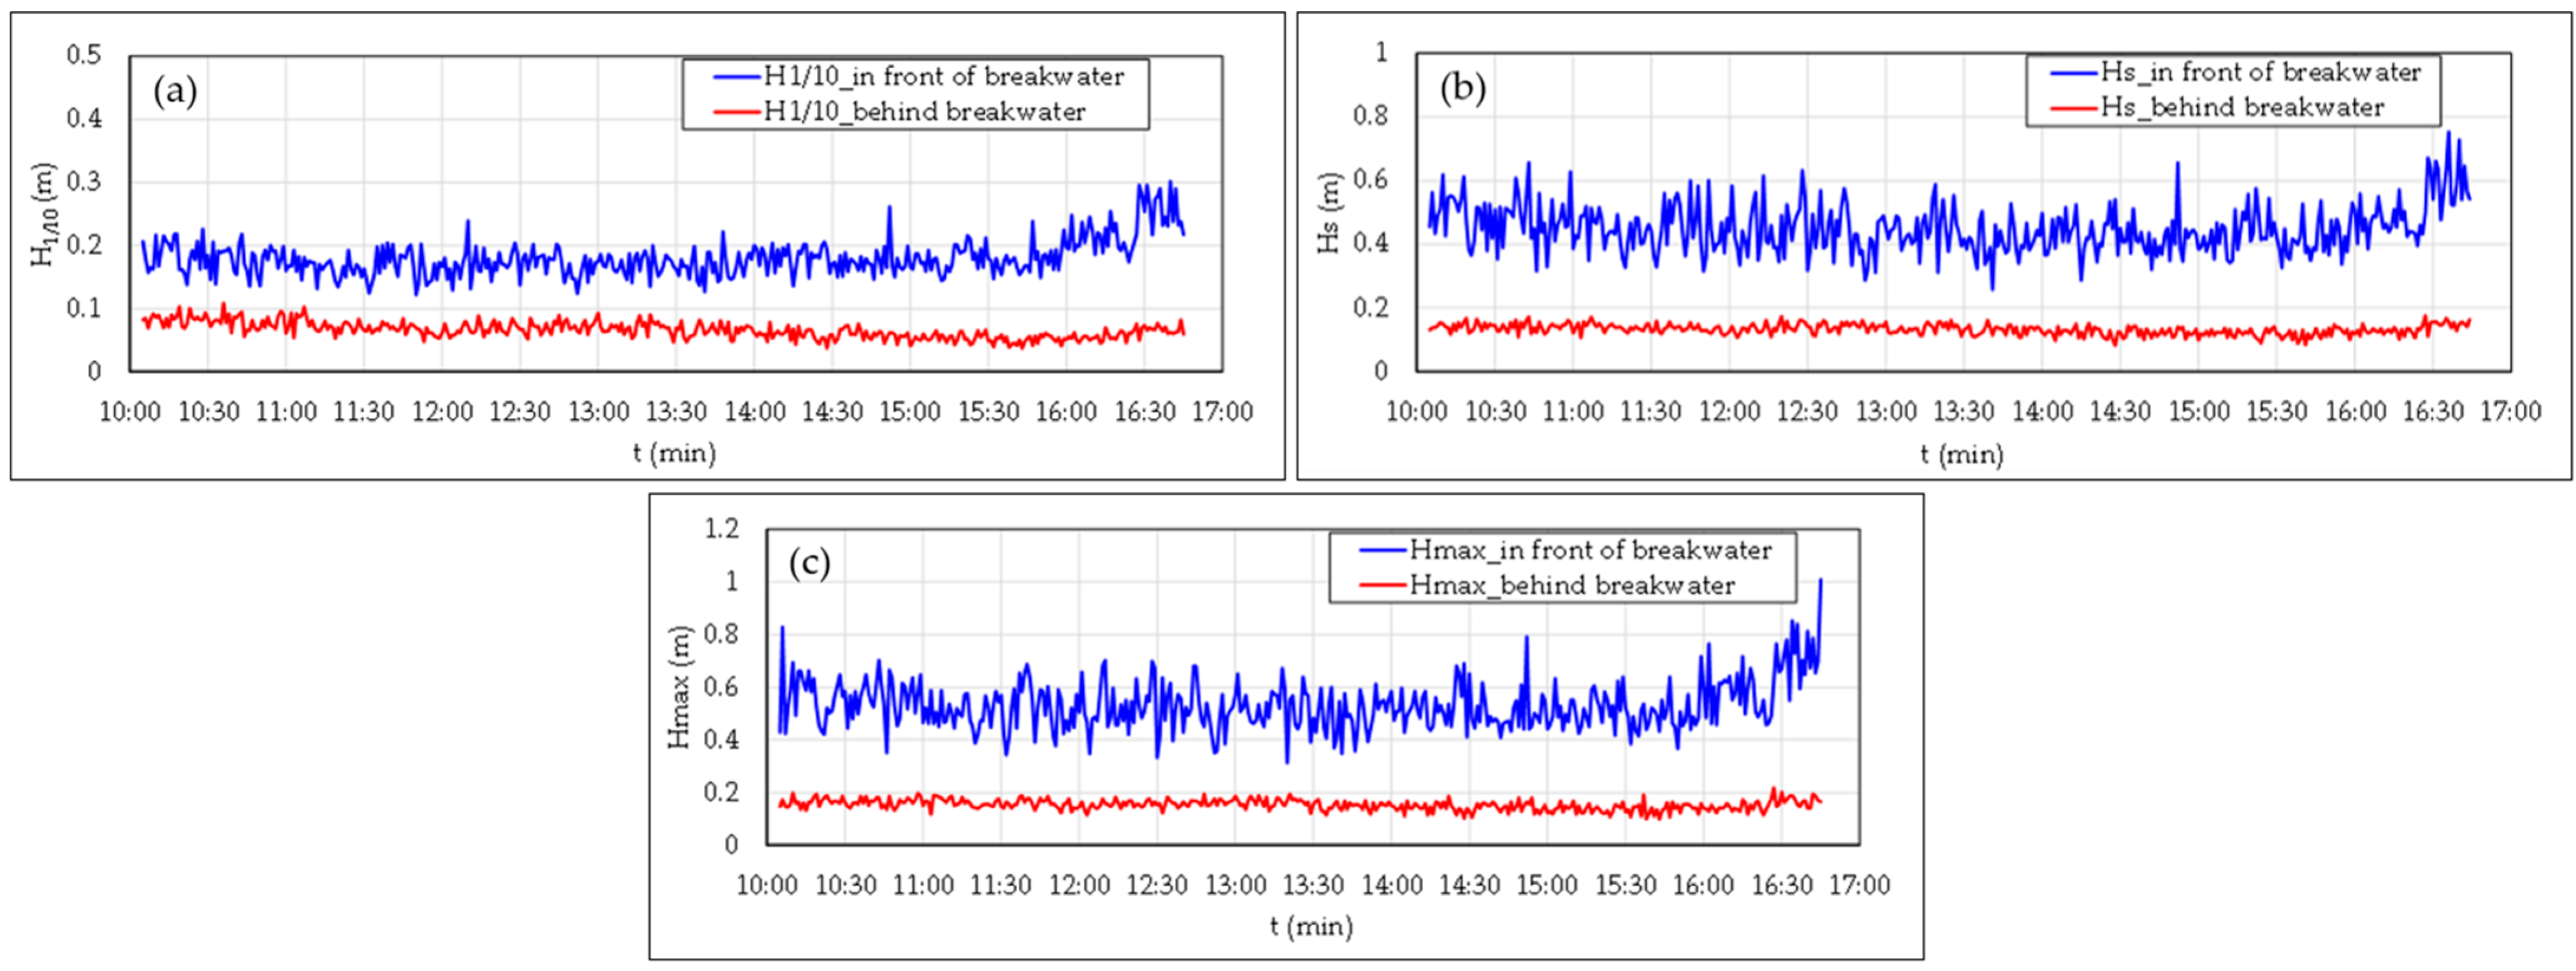
As shown in Figure 7a, the one-tenth highest wave height (H1/10) values in front of the breakwater generally fluctuate between 0.15 and 0.3 m, whereas values behind the breakwater remain consistently low, typically below 0.1 m. Figure 7b displays the significant wave height (Hs), with wave heights in front ranging from approximately 0.4 to 0.8 m, in stark contrast to the 0.1 to 0.2 m observed behind the structure. Figure 7c highlights the maximum wave height (Hmax), which frequently exceeds 0.8 m in front of the breakwater, while remaining mostly below 0.3 m behind it.
Overall, the results clearly demonstrate the wave attenuation capacity of the pile-rock breakwater. The substantial reduction in all three wave parameters behind the structure confirms its effectiveness in dissipating wave energy and protecting the shoreline from wave-induced impacts.

4.1.2. Deposition/Erosion Status

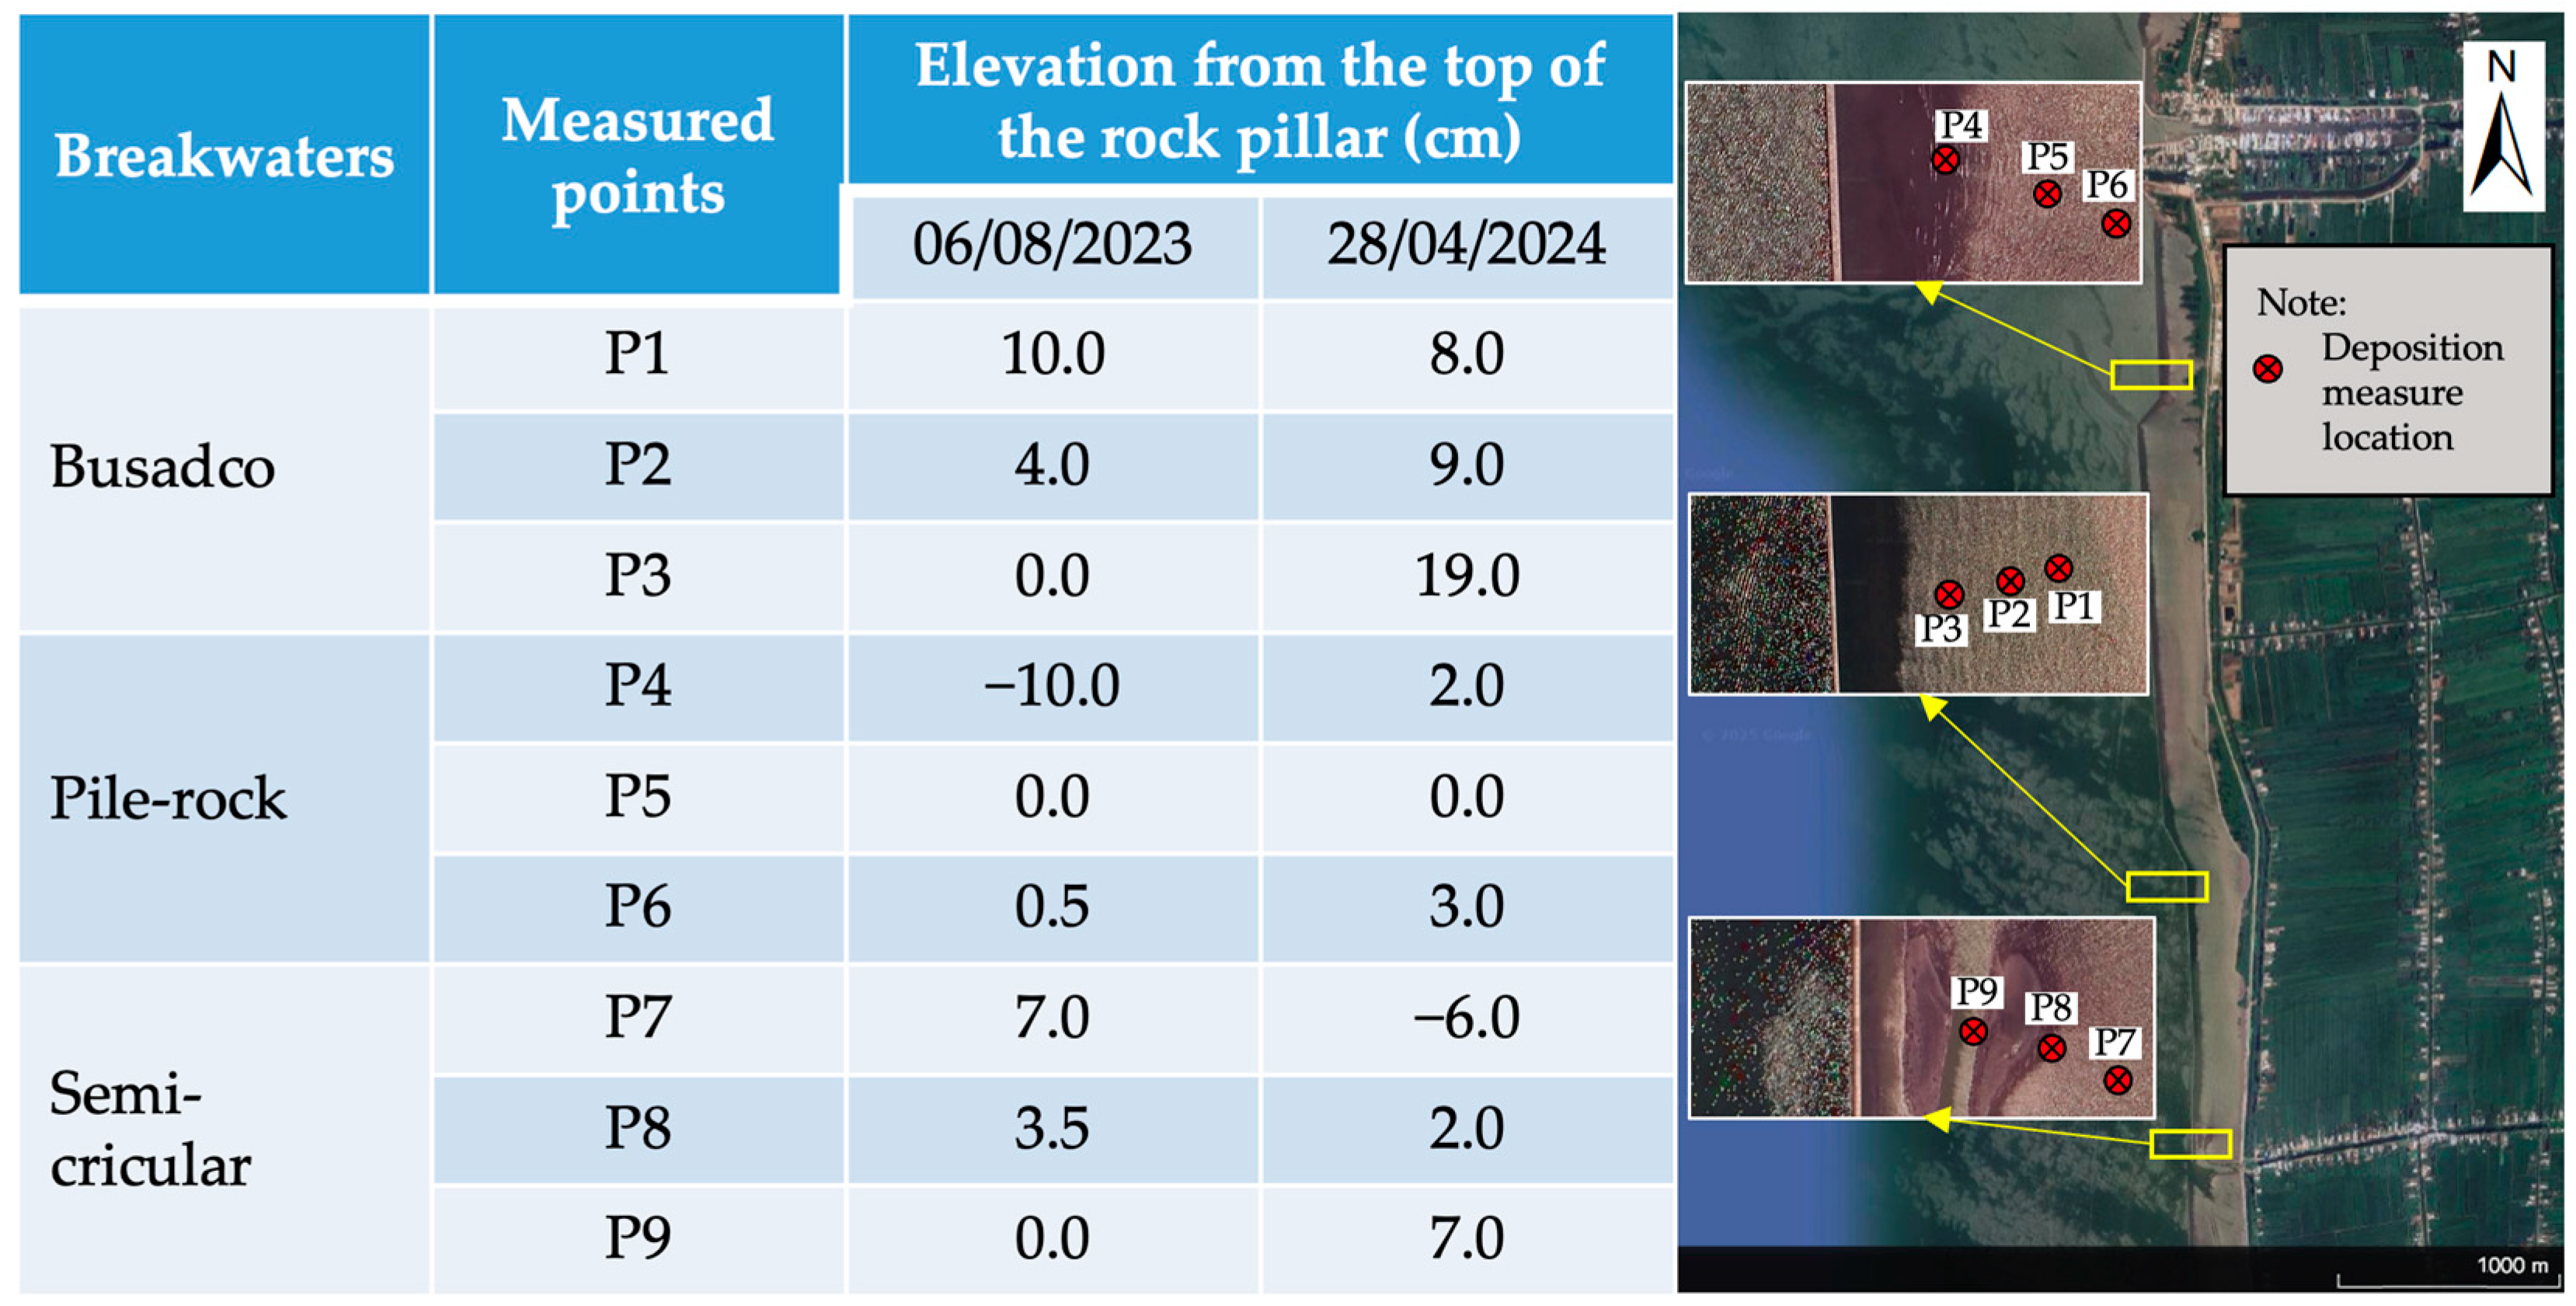
Figure 8 presents a combined satellite image and data table that illustrate changes in beach elevation relative to the top of the rock pillars for three different types of breakwaters—Busadco, pile-rock, and semi-circular—based on measurements taken at three points for each structure. On the left side, the satellite image shows the spatial arrangement of the breakwaters and their corresponding measurement points, which are numbered from 1 to 9. Points 1 to 3 correspond to the Busadco breakwater, Points 4 to 6 to the pile-rock breakwater, and Points 7 to 9 to the semi-circular breakwater. On the right, the table displays elevation data recorded on two occasions: 6 August 2023, and 28 April 2024. The monitoring equipment was installed on 19 March 2023, and the two measurement periods reflect changes in sediment deposition following the installation.
At the Busadco breakwater, beach elevation increased notably over time, with the most significant change observed at Point 3, where the elevation rose from 0 cm to 19 cm. In contrast, the pile-rock breakwater showed moderate but consistent elevation gains. In August 2023, beach levels ranged from −10 cm below the rock pillar top at Point 4 to 0.5 cm above at Point 6. By April 2024, all three points had positive elevations, reaching up to 3 cm, indicating progressive accretion over the monitored period. The semi-circular breakwater exhibited more varied results. This variation implies that the sediment dynamics around the semi-circular breakwater are less stable, potentially influenced by more complex hydrodynamic interactions. Overall, the data suggest that the Busadco and pile-rock structures are more effective in promoting beach elevation gain, whereas the semi-circular breakwater shows mixed performance with evidence of both accretion and erosion.

4.1.3. Mangrove Area

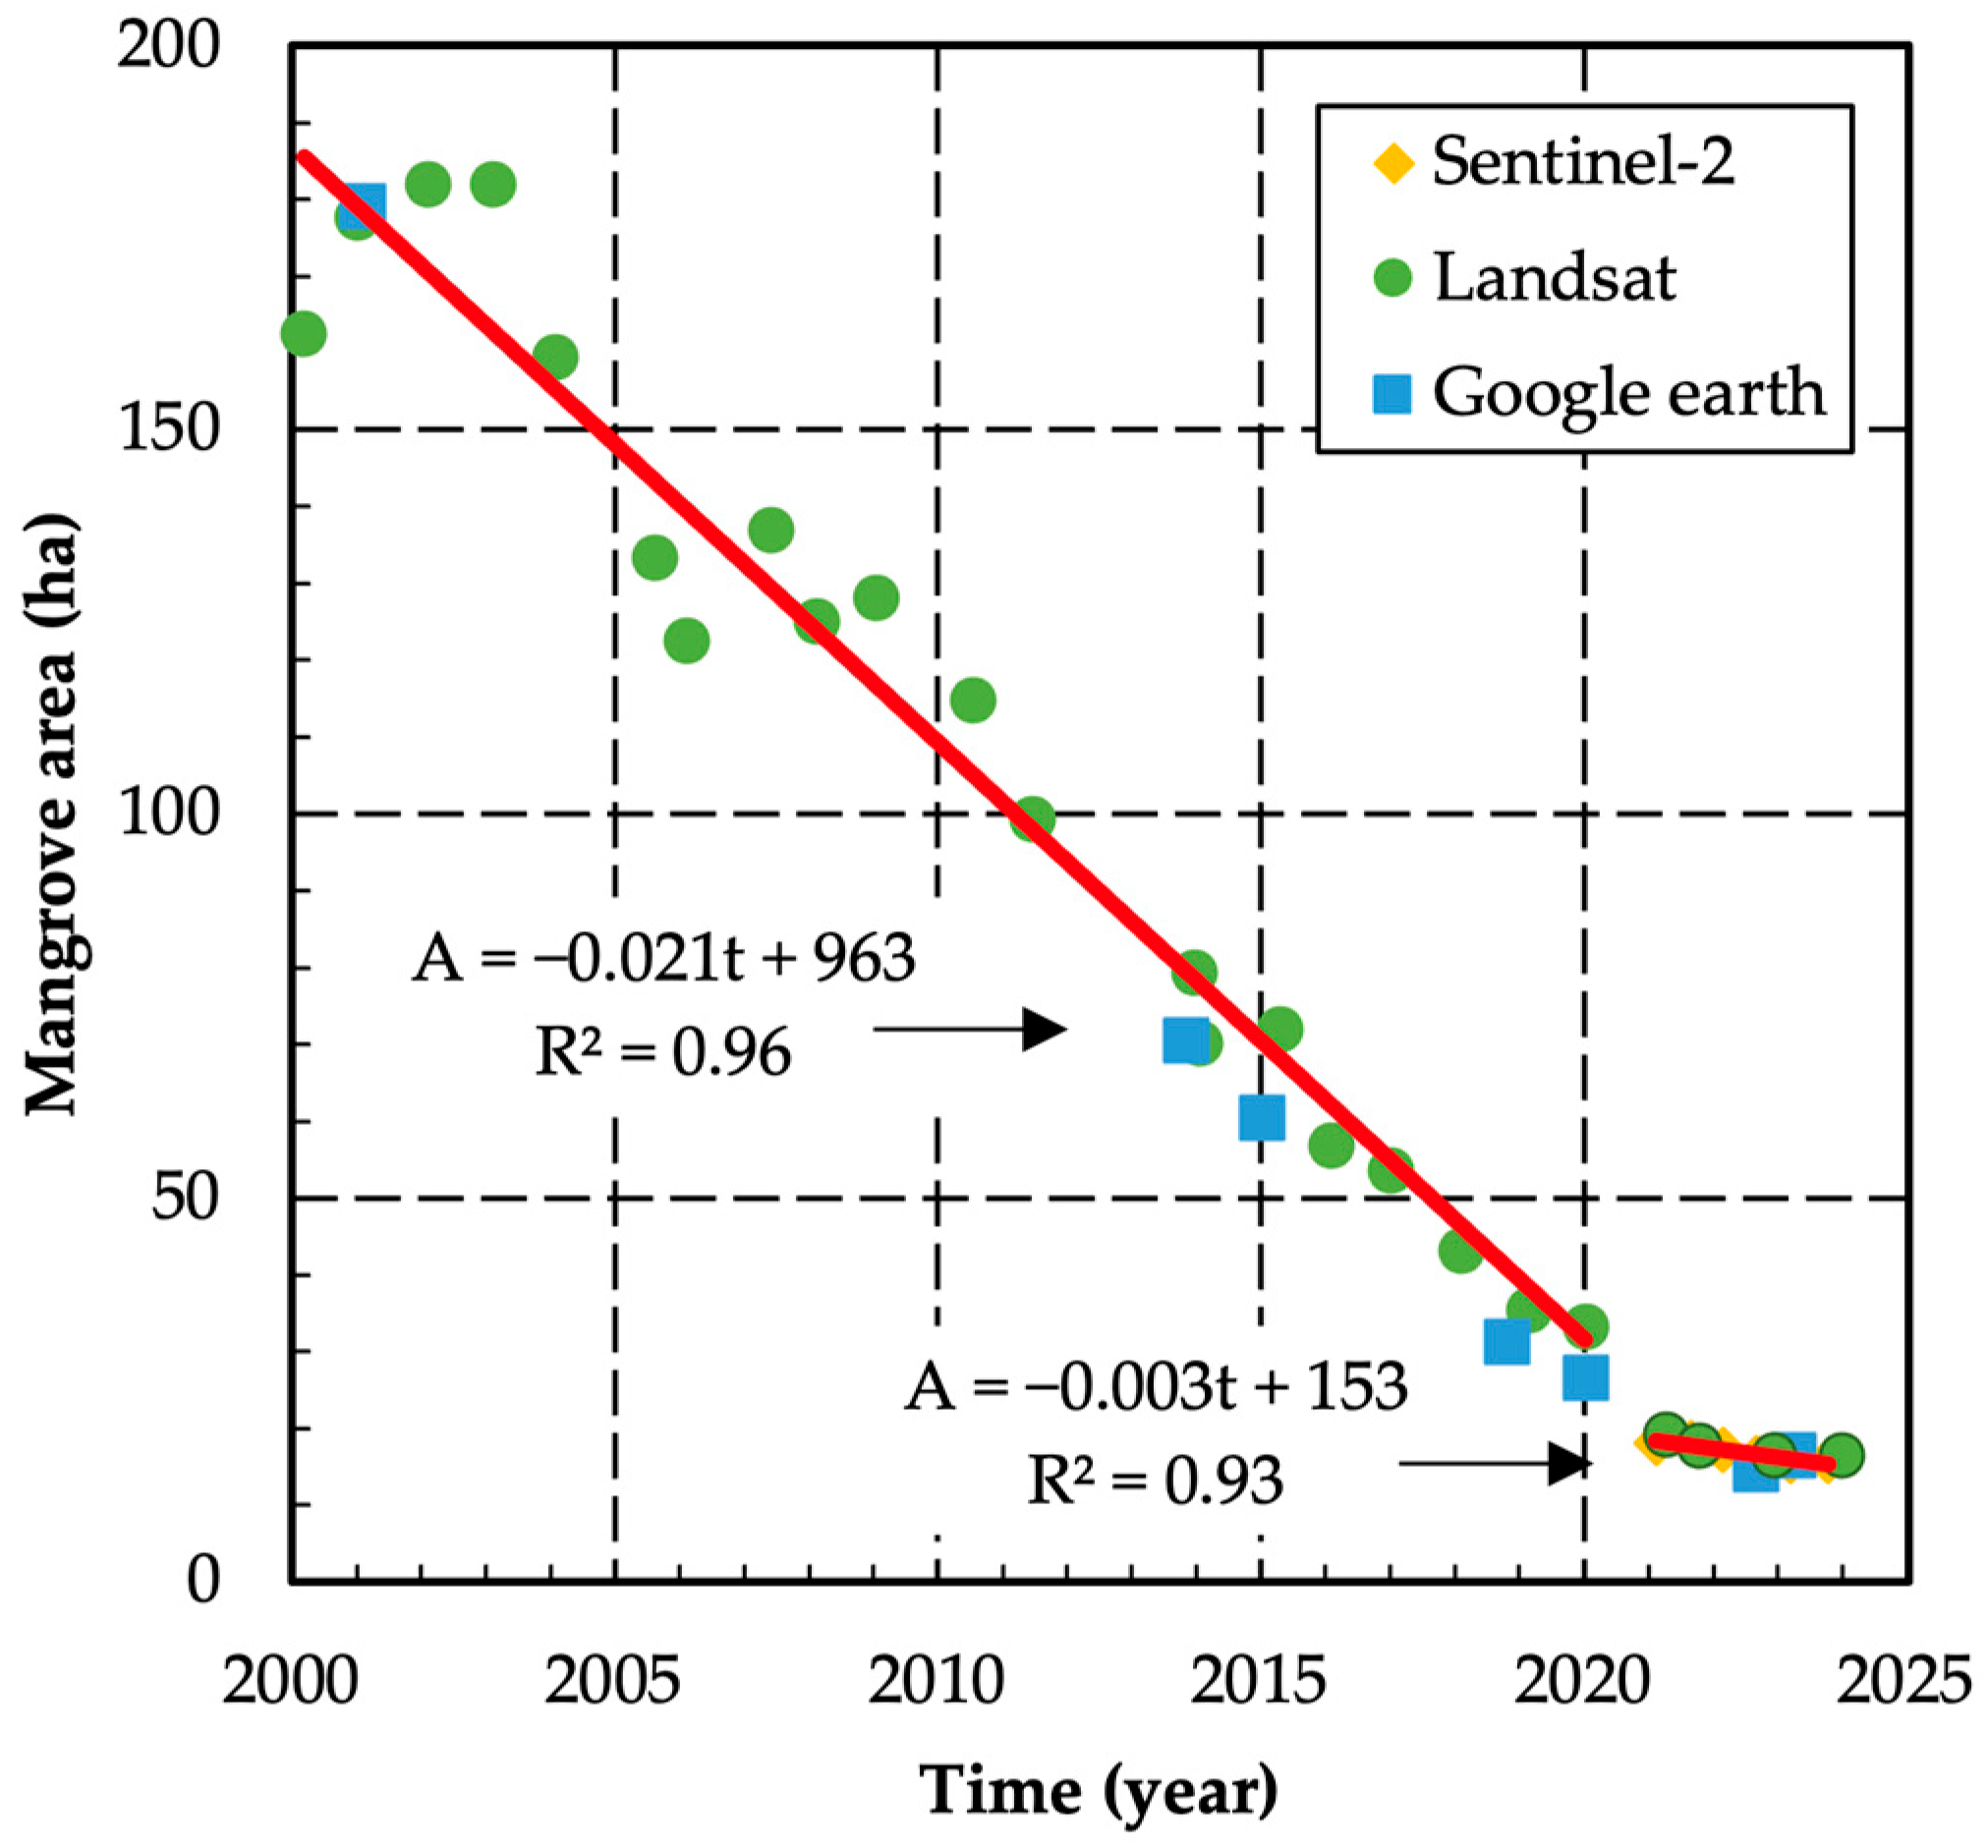
Figure 9 illustrates the temporal evolution of mangrove forest area within the pile-rock breakwater construction zone from 2000 to 2024. The dataset spanning 2000 to 2020 is derived from Thuan et al. (2021) [41], whereas data from 2021 to 2024 are analyzed in this study. The decreasing trend in mangrove area from 2000 to 2020 shows a high coefficient of determination (R2 = 0.96), indicating that 96% of the variation in mangrove area is explained by the fitted model. From 2020 to 2024, the mangrove area remains relatively stable, with a less steep trend and a coefficient of determination of R2 = 0.93. The trend of mangrove area change can be categorized into two distinct phases. Phase 1 (2000–2021) exhibited a pronounced reduction in mangrove coverage, with a deforestation rate of approximately 0.021 ha/day (equivalent to 7.67 ha/year). In contrast, Phase 2 (2021–2024) still experienced a decline but at a substantially mitigated rate of 0.003 ha/day (around 1.1 ha/year), which is nearly seven times lower than that of Phase 1.
Notably, the breakwaters was constructed in 2019. Although this occurred before 2021, the analysis divides the period into 2000–2021 and 2021–2024 to account for potential lag in ecological response observable via remote sensing. During the latter period, the mangrove forest transitioned from a severe regression to a relatively stable state, underscoring the effectiveness of the breakwater structures in mitigating further mangrove loss and facilitating ecosystem recovery (Figure 9). Additionally, it is important to acknowledge that Landsat 5 imagery, predominantly utilized before 2010, exhibits lower accuracy compared to the higher-resolution Landsat 8 data available post-2010, as well as imagery from Google Earth and Sentinel-2.
In recent years, the construction of breakwaters has demonstrated positive effects, as evidenced by the gradual recovery of mangrove forest and reduced erosion. However, this type of breakwater is rigid and cannot be relocated once mangrove coverage has become sufficient to buffer wave impacts naturally. Therefore, we propose a new movable breakwater design that can be repositioned to other vulnerable locations once the mangrove forest regains resilience. The effectiveness of this proposed solution in reducing wave energy will be presented in the following section.

4.2. Results of Hydraulic Model Simulation

4.2.1. Wave Reduction Effectiveness of Mangroves

The width of the mangrove forest along the western coast of Ca Mau Province has significantly decreased from 2000 to 2020. During the same period, coastal erosion has become increasingly severe and complex, especially in recent years. Therefore, it can be concluded that the reduction in mangrove forest width is one of the contributing factors to coastal erosion in this region.
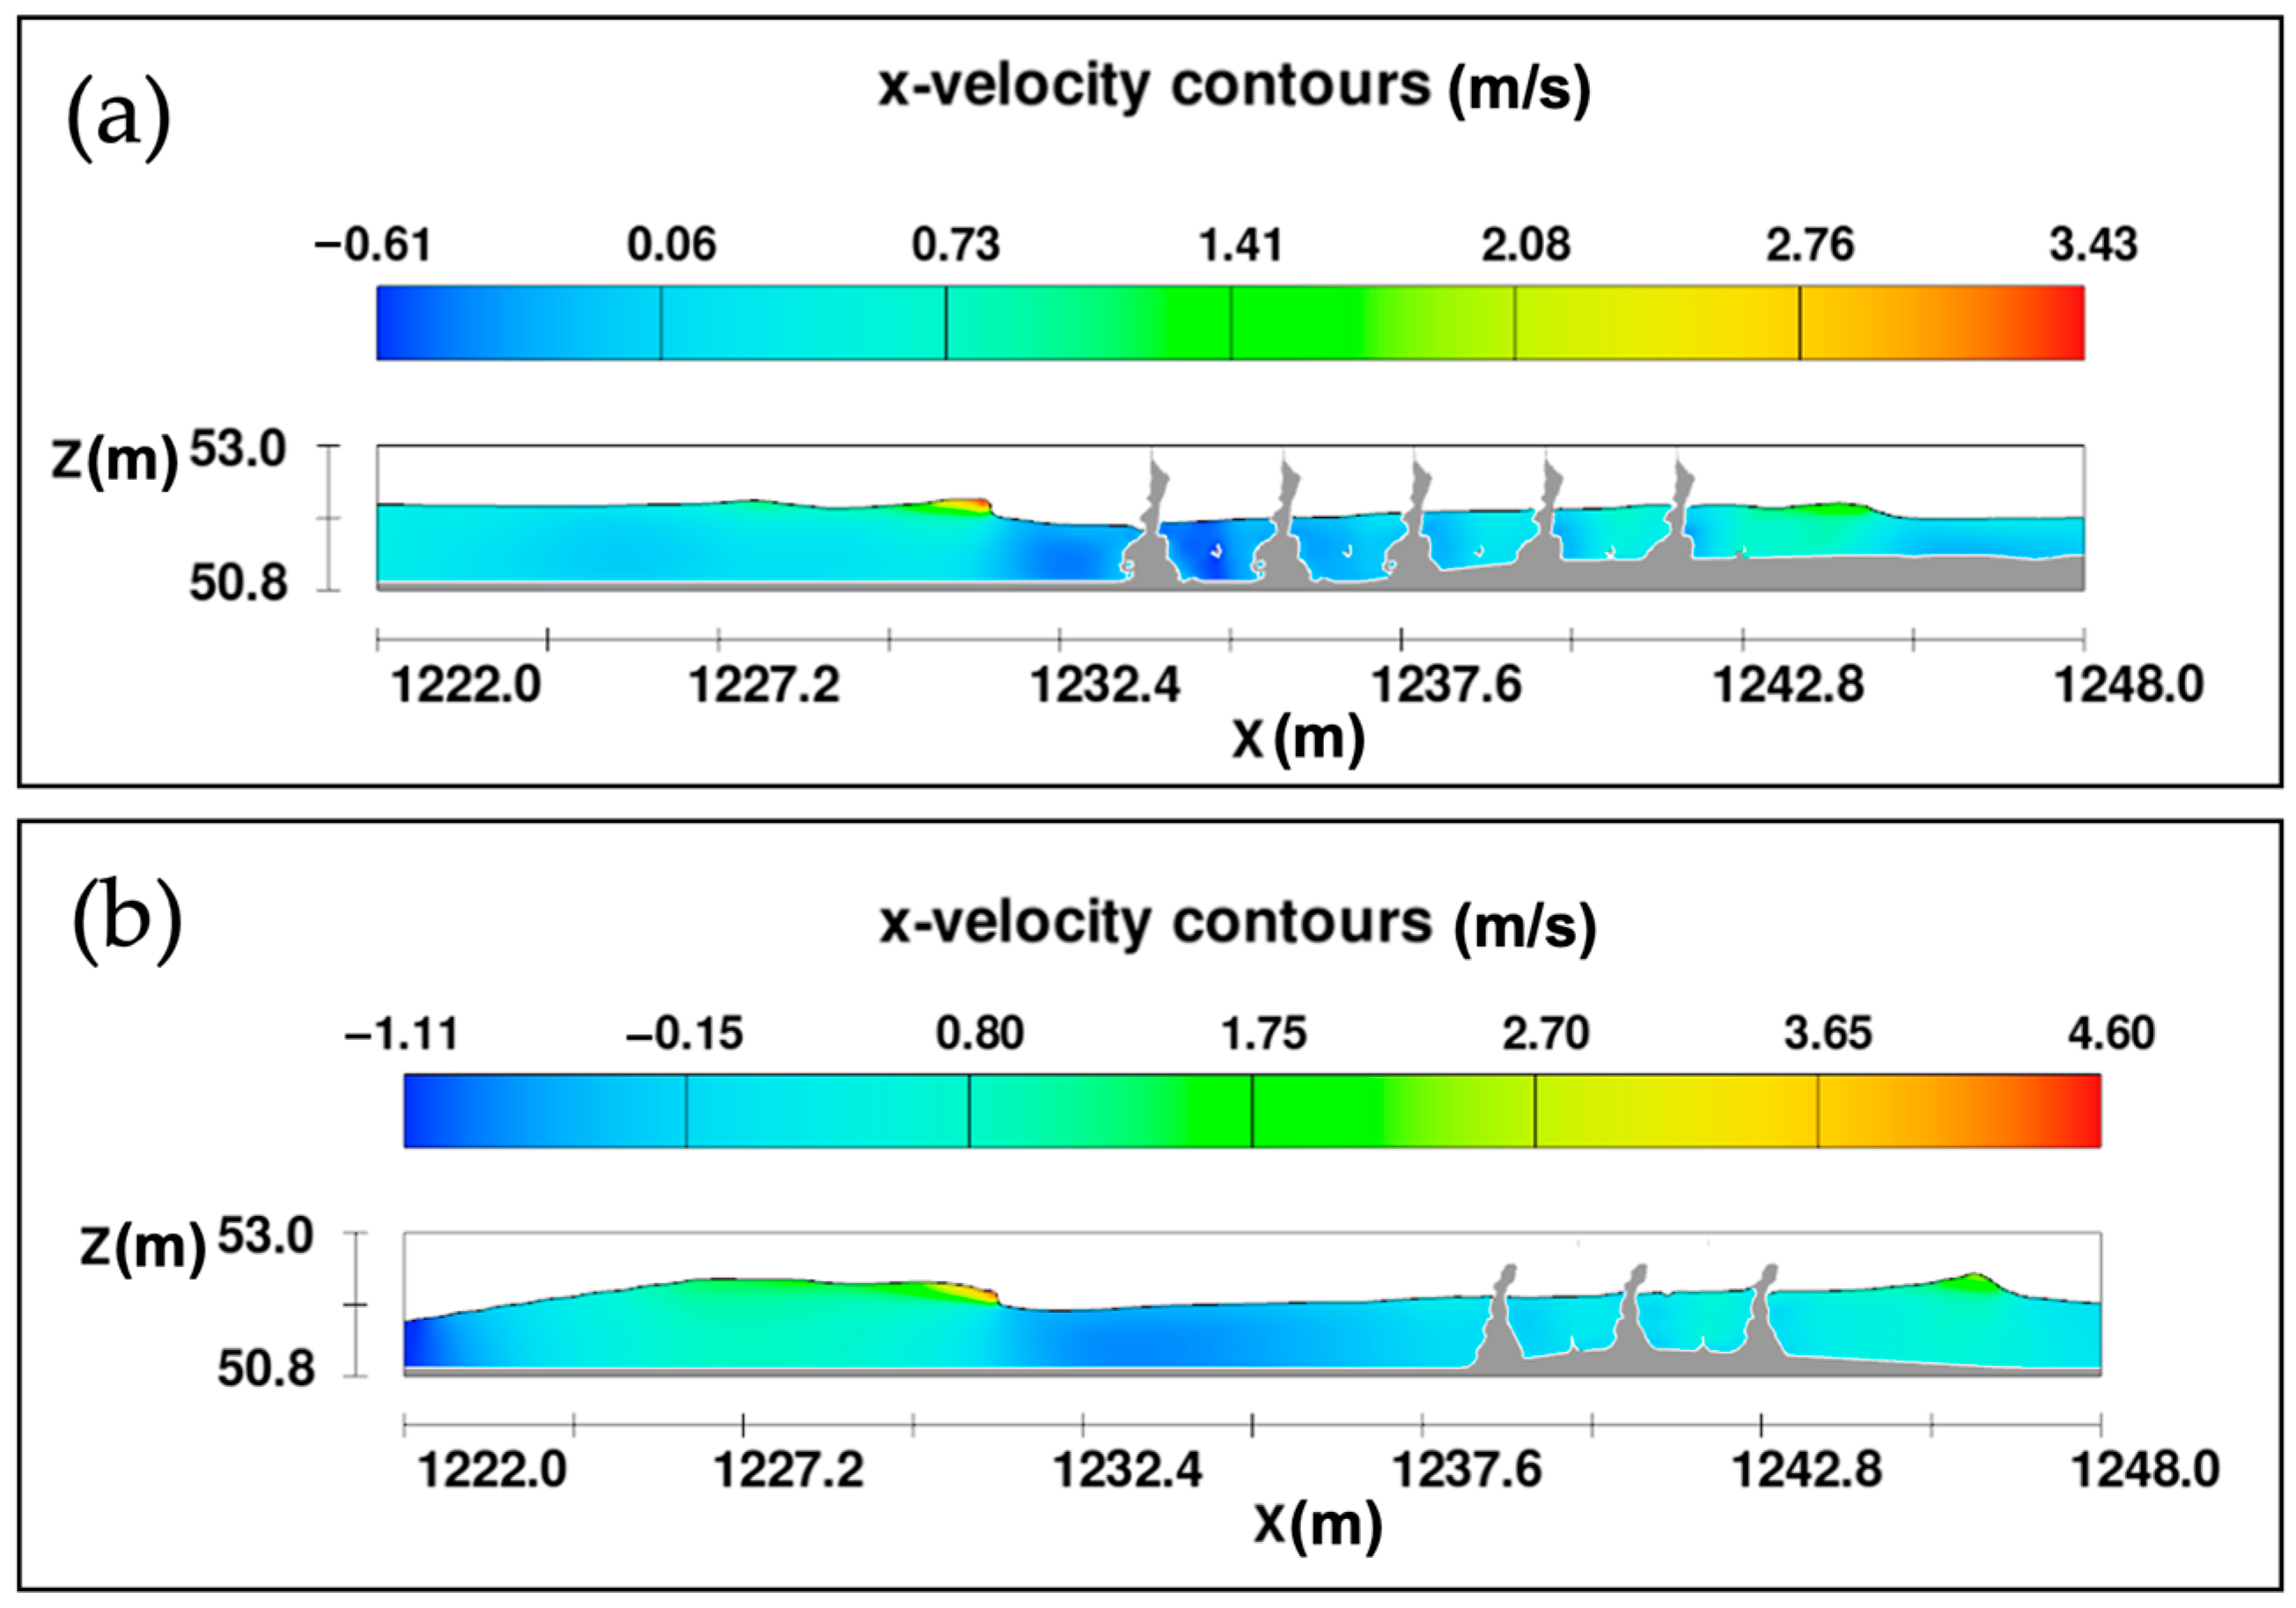
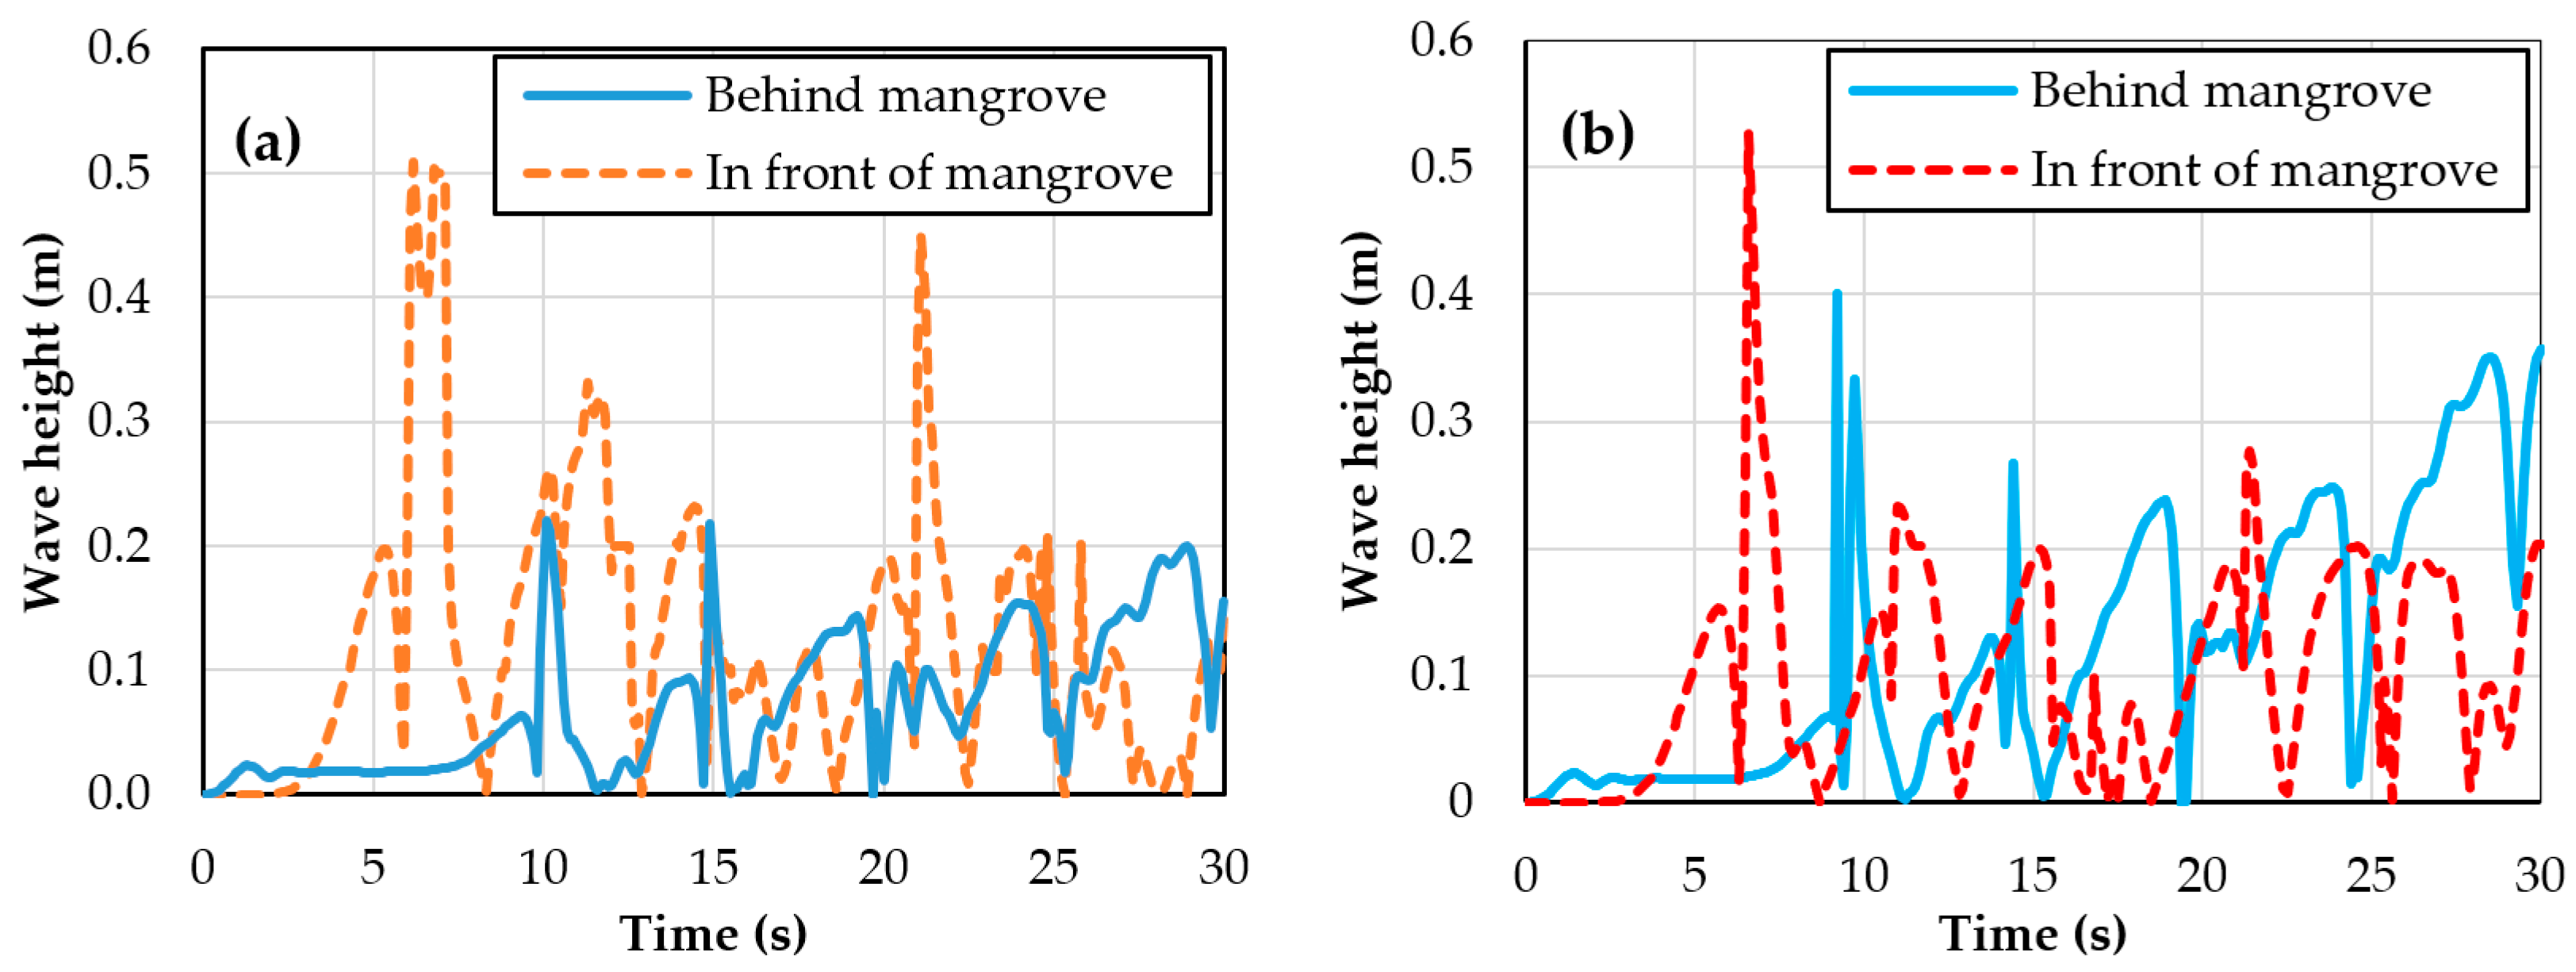
To assess the relationship between mangrove forest width and its wave energy dissipation capacity, two simulation scenarios were conducted in the Flow-3D model, where waves propagated through mangrove forest with a band width of B = 10 m and B = 5 m. Figure 10 illustrates velocity contours at a representative time step during the simulation, showing the spatial distribution of flow velocity across the domain. The x-axis in Figure 10 represents spatial distance along the wave propagation direction. Meanwhile, Figure 11 presents the time series of wave heights at two fixed positions, located before and after the mangrove forest, over the duration of the simulation. In this figure, “0 s” refers to the start of the Flow3D simulation. Together, Figure 10 and Figure 11 provide complementary perspectives: one shows a spatial snapshot of wave–mangrove interaction, while the other depicts the temporal evolution of wave attenuation. The results indicate that when waves travel through mangrove forest with a width of B = 10 m, wave height decreases significantly compared to the wave height before entering the forest (Figure 10a). In contrast, when the mangrove forest width is reduced to B = 5 m, the wave height before and after the mangrove forest remains nearly unchanged (Figure 10b).
To quantitatively evaluate the wave reduction efficiency in these two cases, water level data extracted from the Flow-3D model were used to calculate wave height and attenuation effectiveness. The wave height before and after propagating through the mangrove forest is illustrated in Figure 11. The results indicate that wave height decreases significantly after passing through the mangrove forest with a width of B = 10 m (Figure 11a), whereas there is almost no reduction in wave height for the mangrove forest with a width of B = 5 m (Figure 11b). Specifically, in the case of B = 10 m, the maximum wave height before the mangrove forest is Hmax = 0.5 m, which decreases to 0.2 m after passing through. In contrast, when the mangrove forest width is reduced to B = 5 m, although the maximum wave height before the mangrove forest remains 0.5 m, it only decreases slightly to approximately 0.4 m afterward.
The wave attenuation efficiency of the mangrove forest in both cases is presented in Figure 12. The results show that the wave reduction effectiveness for the 1/3 Hmax case is nearly identical in both scenarios. However, for the maximum wave height (Hmax) and the 1/10 Hmax case, there are substantial differences. Specifically, the reduction in Hmax in the B = 10 m case is approximately 2.4 times greater than in the B = 5 m case, and the attenuation of 1/10 Hmax waves also shows a significantly higher efficiency in the wider mangrove scenario. This highlights the substantial decline in wave attenuation capacity as mangrove forest width decreases.

4.2.2. Wave Reduction Effectiveness of Various Types of Pilot Breakwaters

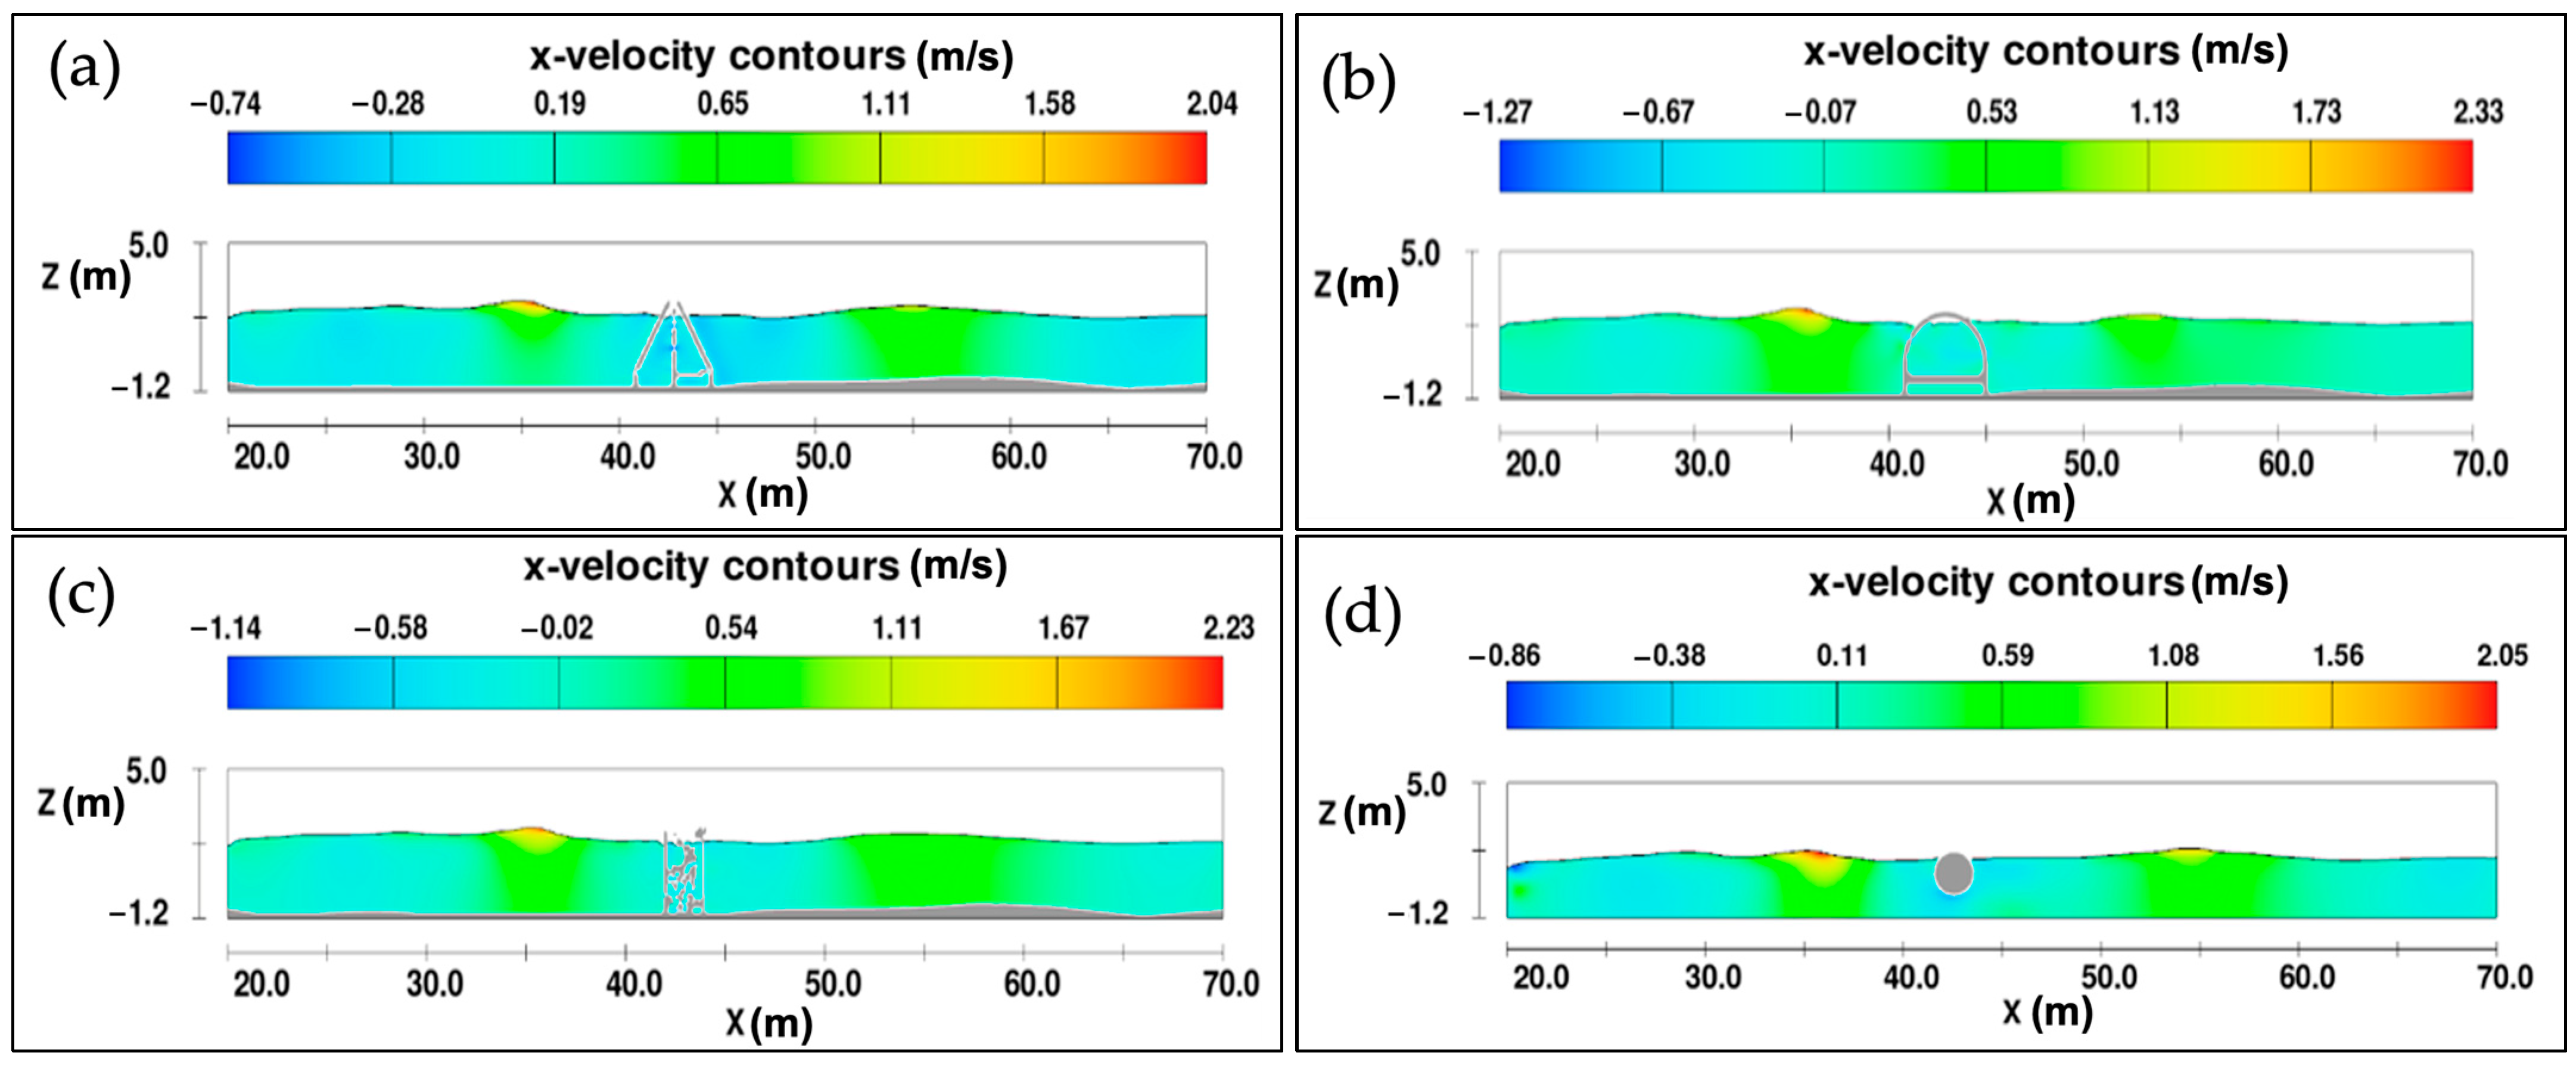
Figure 13 presents the cross-sectional profiles of four wave-breaking solutions: Busadco breakwater, pile-rock breakwater, semi-circular breakwater, and floating breakwater. It can be observed that the water level fluctuations exhibit higher amplitude in front of the structures and lower amplitude after passing through them.
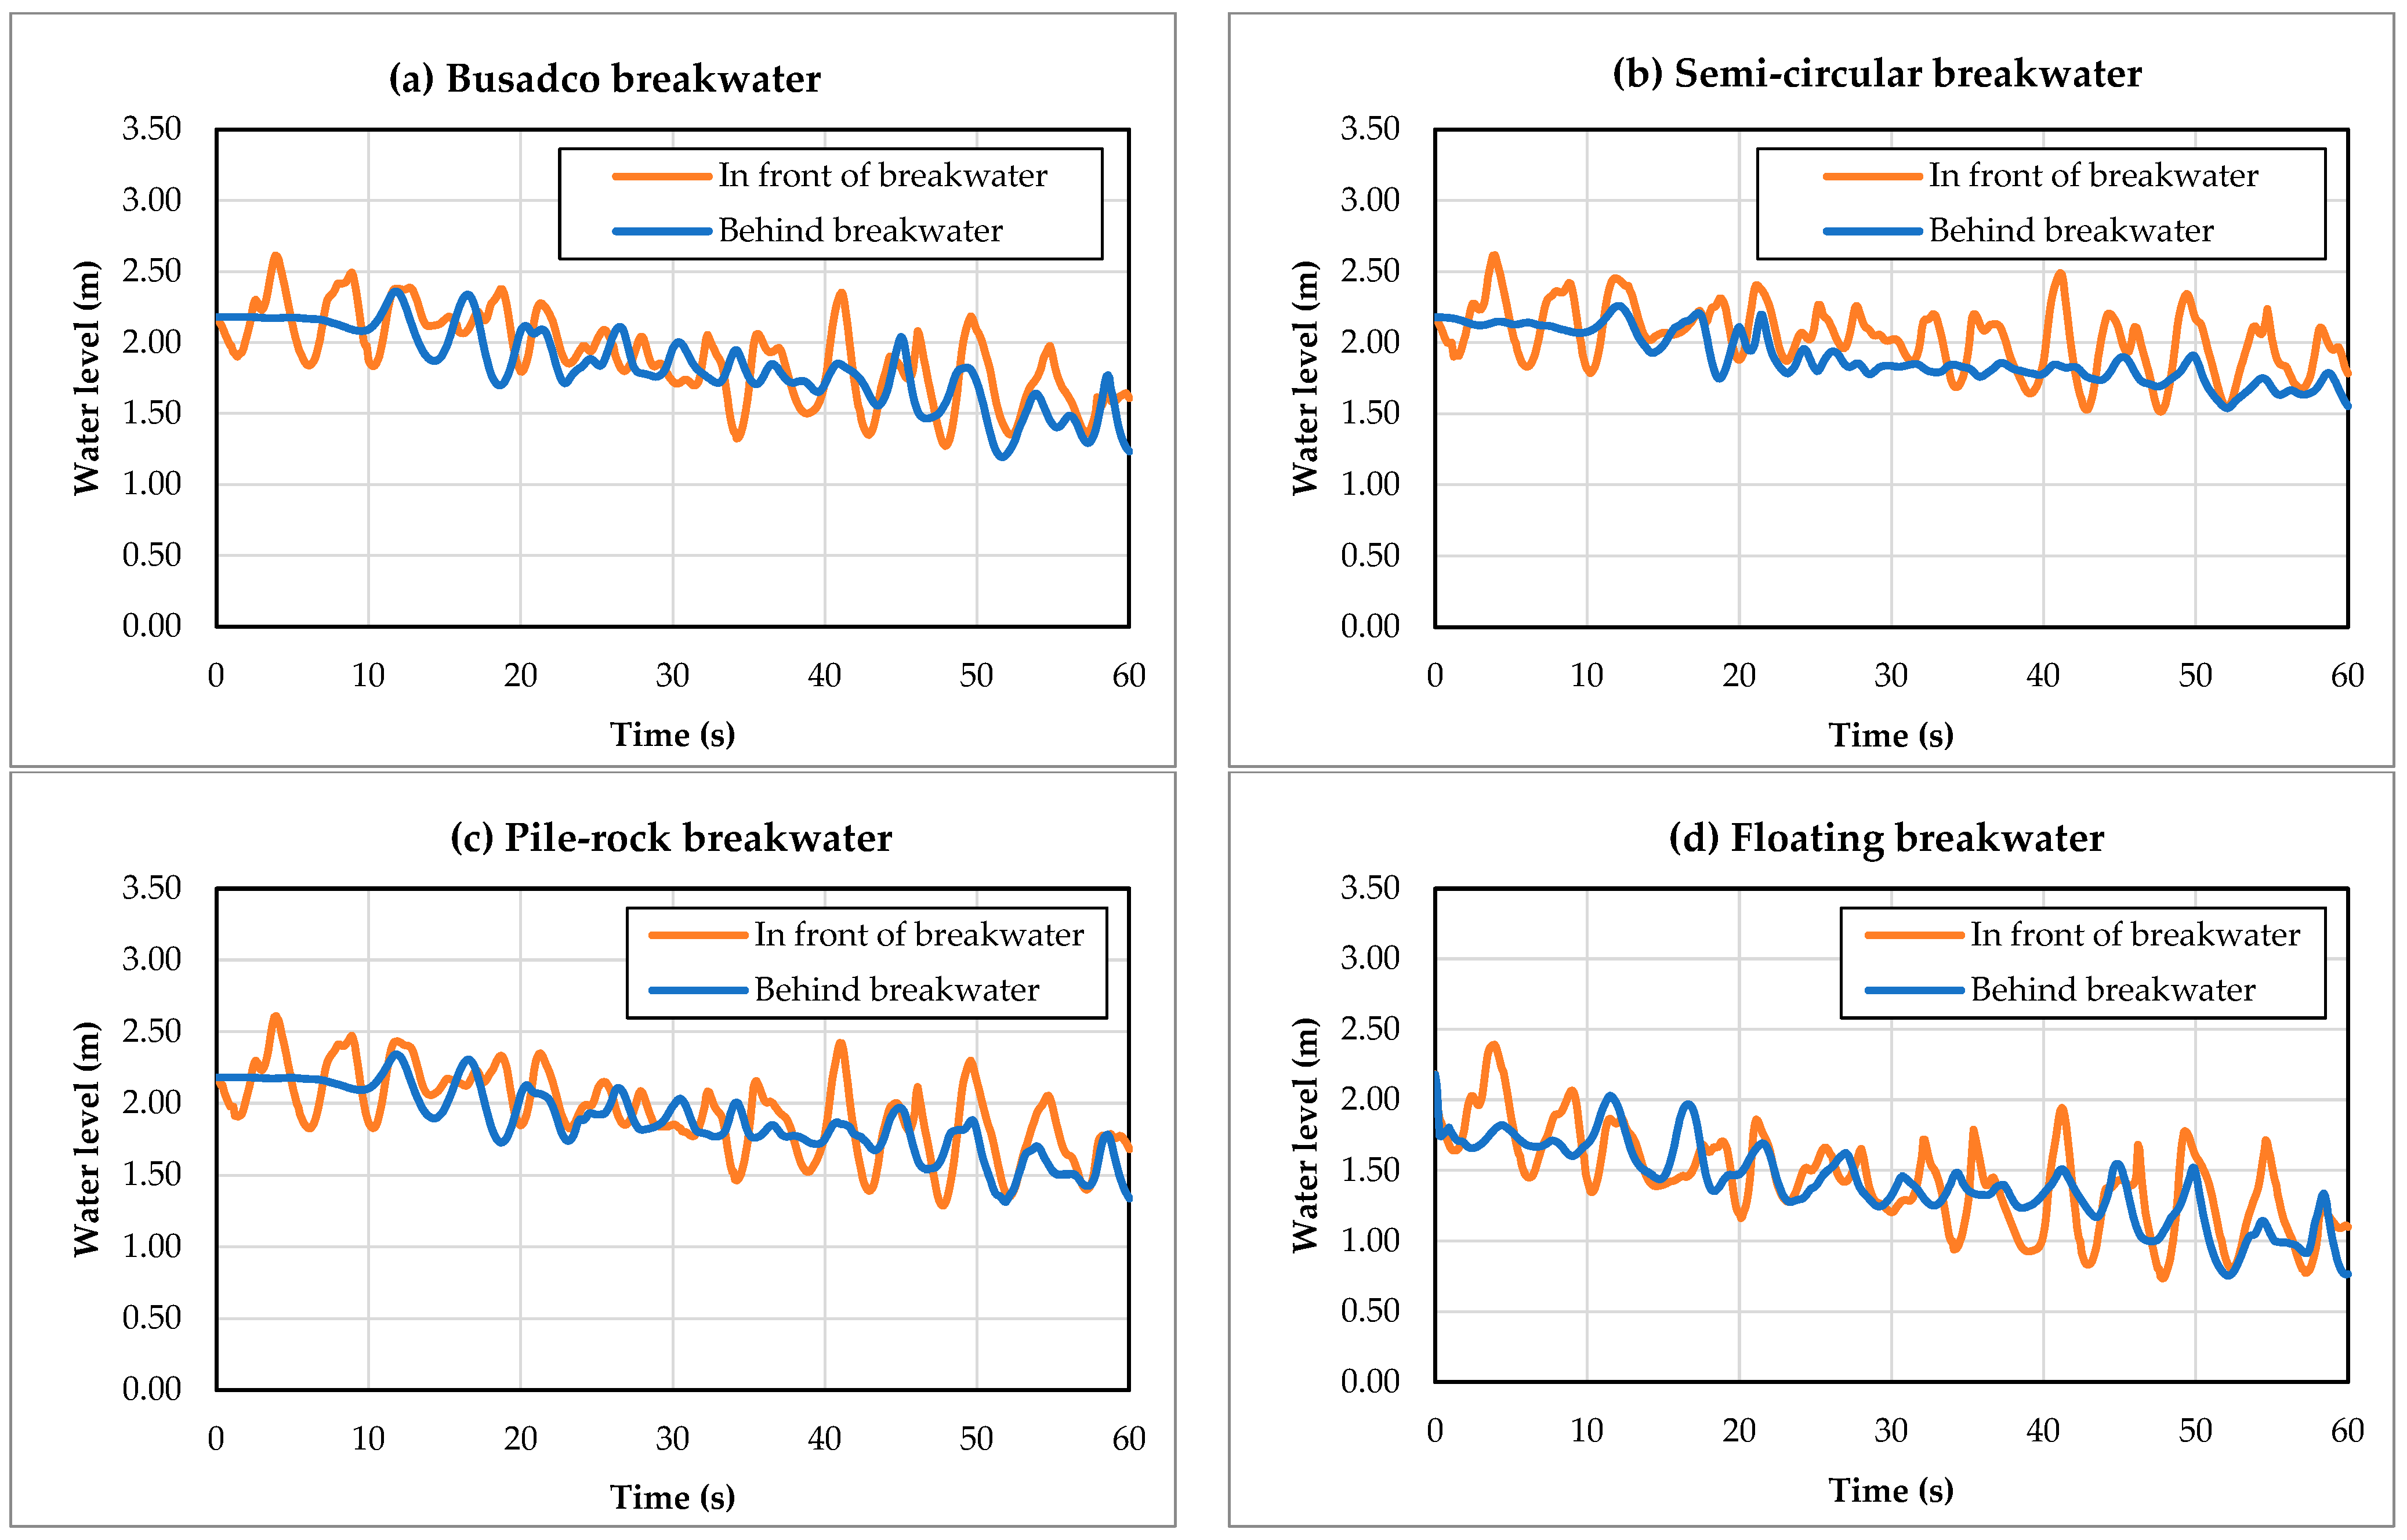
Figure 14 presents the simulated water level fluctuations in front of and behind four different breakwater types: (a) Busadco breakwater, (b) semi-circular breakwater, (c) pile-rock breakwater, and (d) floating breakwater.
-
Busadco breakwater (Figure 14a): This structure shows relatively high water level fluctuation in front of the breakwater, with a noticeable reduction behind it. The wave attenuation is evident, indicating its effectiveness in dissipating wave energy.
-
Semi-circular breakwater (Figure 14b): Similar to the Busadco design, the semi-circular breakwater also reduces the amplitude of water level fluctuations behind the structure. However, the attenuation appears slightly less pronounced compared to the Busadco breakwater.
-
Pile-rock breakwater (Figure 14c): The water level fluctuations in front of the pile-rock structure show a comparable amplitude to those observed in the Busadco case, but the reduction behind the structure is moderate due to the permeable nature of the pile-rock configuration.
-
Floating breakwater (Figure 14d): Among the four types, the floating breakwater exhibits the lowest difference between the in-front and behind measurements. This indicates that while it reduces wave energy to some extent, its performance is less effective compared to the solid breakwaters.
Overall, the Busadco and semi-circular breakwaters demonstrate stronger wave attenuation compared to the pile-rock and floating designs. The floating breakwater is the least effective in reducing water level fluctuation amplitude.
All four solutions effectively reduce wave height, stabilizing the water surface after interaction with the structures. In every case, the post-structure water levels exhibit less fluctuation compared to pre-structure levels, reinforcing their effectiveness in controlling water surface dynamics.
Figure 15 presents statistical wave heights before and after the solutions. The semi-circular breakwater achieves the highest reduction of 1.52 m, followed by the pile-rock breakwater (1.31 m), Busadco breakwater (1.24 m), and the floating structure (0.97 m). A substantial reduction in wave height, particularly in Hmax, is evident, confirming the wave attenuation capability of the floating structure.
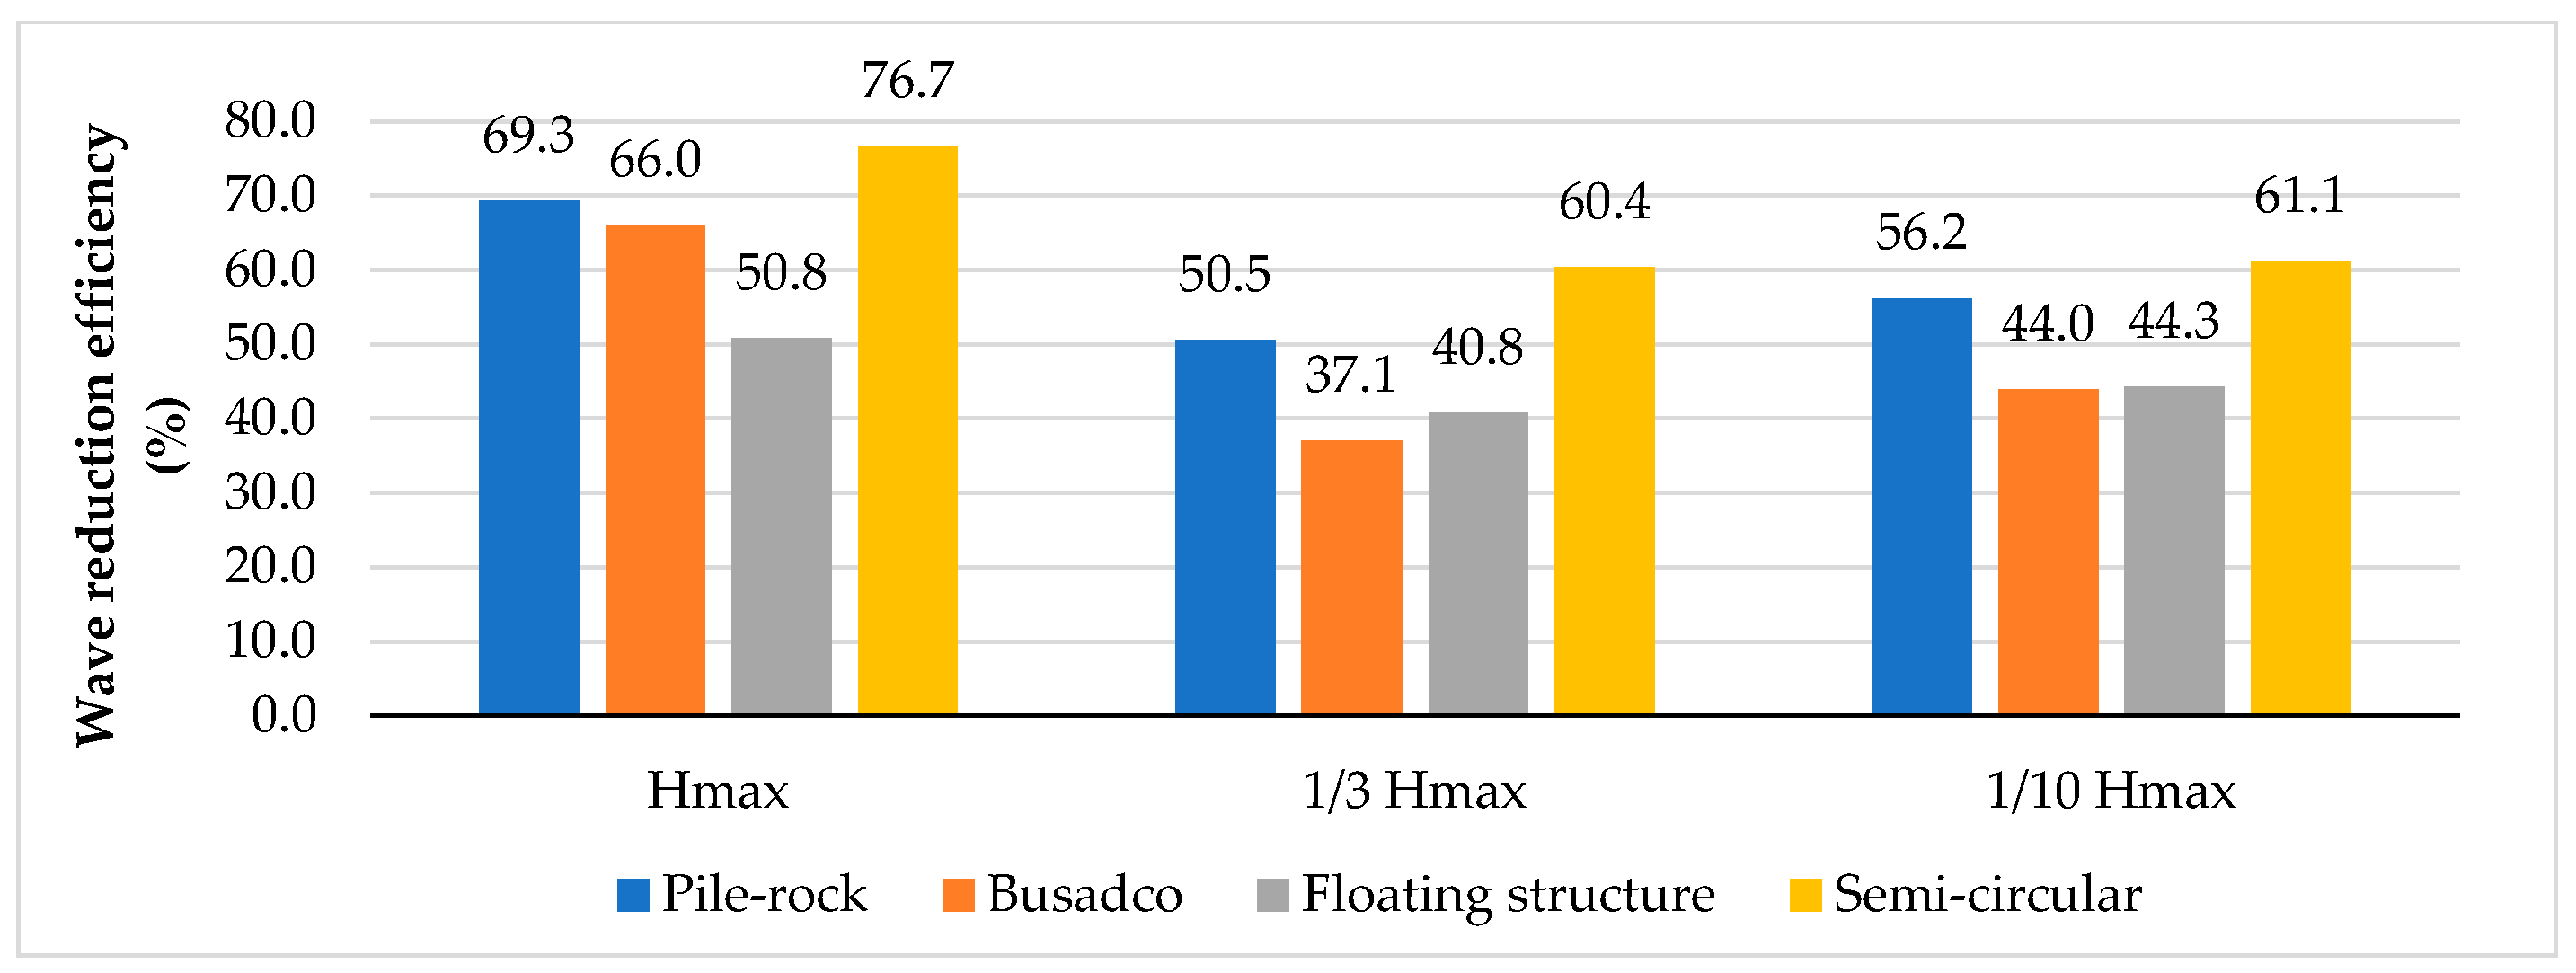
Figure 16 illustrates the percentage reduction in wave height after implementing the four breakwater solutions. Each structure is assessed using three indices: Hmax, 1/3 Hmax, and 1/10 Hmax, representing maximum, one-third, and one-tenth wave height reductions, respectively. The semi-circular breakwater demonstrates the highest wave reduction efficiency, with reductions of 76.7%, 60.4%, and 61% for Hmax, 1/3 Hmax, and 1/10 Hmax, respectively. The pile-rock and Busadco breakwaters show comparable performance in Hmax reduction (69.3% and 66.0%, respectively), but their performance differs significantly in 1/3 Hmax and 1/10 Hmax reductions (50.5% and 37.1% for the pile-rock breakwater, and 56.2% and 44.0% for the Busadco breakwater). The floating structure exhibits a lower but still significant reduction, with 50.8%, 40.8%, and 44.3% reductions for Hmax, 1/3 Hmax, and 1/10 Hmax, respectively. While the system is adaptable, its relatively low mass and anchoring limitations may constrain its ability to absorb wave energy under high-energy conditions.
Nevertheless, this simulated ranking contrasts with field-based measurements, which reported wave reduction efficiencies of 83%, 86%, and 79% for the semi-circular, pile-rock, and Busadco breakwaters, respectively. In practice, the semi-circular structure experienced foundation instability and tilting after deployment, which compromised its operational performance over time [23]. As a result, its actual wave attenuation was lower than predicted in the numerical model. This discrepancy highlights the importance of accounting for structural stability and construction quality when interpreting simulation outputs. In contrast, the pile-rock and Busadco breakwaters, although less efficient in simulations, delivered more stable and consistent results.

5. Discussion

This study offers new empirical and modeling-based insights into the performance of pilot breakwater structures and mangrove systems along the erosion-prone western coastline of Ca Mau Province. The integration of in situ wave measurements, time-series remote sensing, and Flow-3D simulations has enabled a multi-perspective assessment of both rigid and flexible protective interventions. These findings carry relevance not only for coastal engineering practices in Vietnam, but also for broader coastal governance and planning in the context of Vietnam’s Blue Economy strategy to leverage its marine resources for economic growth and SDG implementation.

5.1. Comparative Performance of Breakwater Types

The results highlight notable differences in wave attenuation capacity and sediment accretion effectiveness across the four studied breakwater types. Among the rigid structures, the semi-circular breakwater exhibited the highest reduction in wave height with up to 76% of Hmax—demonstrating its superior energy dissipation capacity due to its curved geometry and stable base. This was followed by the pile-rock and Busadco designs, which also showed consistent sediment accumulation and mangrove stabilization effects. Borsje et al. (2011) found that hybrid structures, when optimally designed, can provide not only immediate physical protection but also enhance sediment trapping and long-term accretion processes, aligning with ecological engineering principles [42]. In contrast, while the floating breakwater achieved lower attenuation efficiency (approximately 50% for Hmax), its modularity and relocatability present unique advantages. Unlike fixed structures, floating units can be repositioned as mangrove belts regenerate, thereby offering a dynamic complement to long-term ecosystem-based adaptation strategies. This design flexibility aligns with the need for adaptive and scalable infrastructure in highly dynamic sedimentary environments like the VMD. This approach resonates with proposals that advocate modular infrastructure that supports phased ecological succession and adaptive repositioning in deltaic zones [42,43].

5.2. Shoreline Dynamics and Mangrove Recovery

The integration of remote sensing data reveals a two-phase trajectory in mangrove area change. The first phase (2000–2021) was marked by significant deforestation, driven by anthropogenic pressures and coastal degradation. Although the breakwaters were constructed in 2019, the second phase (2021–2024) was defined to reflect the observable ecological response lag captured by satellite imagery. This approach accounts for the fact that remote sensing often detects ecosystem recovery with a delay due to gradual vegetative regrowth and seasonal variations. During the second phase, a marked decline in the rate of mangrove loss was observed, suggesting that the calmer hydrodynamic conditions created by the breakwater structures may have facilitated natural regeneration processes. While the overall mangrove loss was not fully reversed, the notable deceleration in degradation indicates that engineered structures, when appropriately sited, can create favorable conditions for mangrove stabilization and recovery. Simulation results further emphasize the role of mangrove width in coastal protection. A 10 m-wide mangrove belt led to a 60–65% reduction in wave height, while a 5 m width showed negligible protective function. These results are in line with field-based studies in Vietnam, which found that wave attenuation can exceed 50% over 100 m mangrove belts, with performance depending on species structure and planting density [44,45,46,47]. This highlights the non-linear relationship between mangrove density and protective performance, reinforcing the need to protect and restore wide, continuous mangrove corridors rather than fragmented belts [5,48].

5.3. Implications for Hybrid and Adaptive Solutions

The evidence points toward the value of hybrid coastal protection strategies—combining rigid or flexible structures with restored vegetative buffers. Globally, NBS, including mangroves and wetland buffers, have demonstrated cost-effective coastal protection compared to traditional hard infrastructure, particularly when designed for multi-functional roles [43]. While hard infrastructure provides immediate protection against high-energy events, it must be complemented by ecological infrastructure to deliver longer-term sustainability. This is especially important in contexts where sediment availability is declining and shoreline systems are increasingly disconnected from natural fluvial inputs due to upstream dam construction and sand mining [9,49,50]. The results support calls for modular, adaptive coastal interventions, as advocated in Vietnam’s Coastal Development Master Plan (2021–2030). Floating structures and sediment-trapping designs could be deployed in cycles: first to enable mangrove re-establishment, then removed or relocated once natural defenses regain function. Such an approach reduces long-term costs and environmental impacts while increasing the resilience and adaptability of coastal systems.

5.4. Socio-Economic and Policy Considerations

Beyond technical and ecological performance, the long-term success of coastal protection strategies hinges on their socio-economic viability and alignment with local community needs. Factors such as construction and maintenance costs, lifespan, scalability, and stakeholder preferences (e.g., fisherfolk, aquaculture operators, and local authorities) play a decisive role in whether protective structures are adopted, maintained, or replicated [12,43]. While this study did not include a formal cost-benefit analysis or participatory assessment, preliminary observations suggest that rigid structures like semi-circular and pile-rock breakwaters involve higher initial investments and more complex maintenance demands, whereas floating breakwaters offer greater modularity and potential for cost-effective repositioning [27,29,46,51]. However, a significant constraint remains the absence of standardized design and cost norms across breakwater types in Vietnam, which hinders consistent budgeting, performance benchmarking, and decision-making for scaling coastal infrastructure.
Importantly, the acceptance and involvement of local communities—who often play a role in maintaining mangrove buffers and managing aquaculture–protection interfaces—should be central to future evaluations. Integrating these socio-economic dimensions through co-designed surveys, participatory monitoring, and lifecycle costing will be critical for advancing hybrid coastal protection within Vietnam’s Blue Economy agenda and broader climate resilience planning frameworks. These considerations are especially relevant in light of Vietnam’s Resolution No. 120/NQ-CP (2017), which calls for sustainable and climate-resilient development of the Mekong Delta through nature-based, adaptive, and participatory approaches [52]. They are further reinforced by the National Green Growth Strategy (2021–2030) [53] and the Blue Economy Roadmap (2022) [54], both of which emphasize integrated coastal zone management, ecological infrastructure, and inclusive stakeholder engagement as pillars of Vietnam’s sustainable development trajectory.

5.5. Limitations and Future Directions

This study contributes methodologically by integrating multiple data sources across different spatial and temporal scales. The combination of Flow-3D simulations with in situ measurements improves confidence in the performance estimates of various breakwater typologies. However, several limitations remain.
First, the simulation domain was constrained by software parameters, which limited the spatial representation of complex wave dynamics and the interaction effects of structures across broader coastal areas. While the hydrodynamic modeling offers high-resolution insight into structure–wave interactions at localized scales, it does not fully capture the cumulative or long-range effects of sediment transport, seasonal monsoonal changes, or shoreline evolution under multi-year forcing conditions.
Second, the field monitoring period for wave height and sedimentation—conducted from June 2023 to April 2024, was relatively short. Although this timeframe allows us to capture baseline performance trends, it does not encompass the full spectrum of seasonal variability, interannual fluctuations, or the impacts of extreme events such as tropical storms or peak monsoon surges. These hydrodynamic conditions are particularly relevant for assessing the long-term effectiveness and durability of breakwater interventions.
To address this, future studies should prioritize extending wave and sediment monitoring to at least two to three years, enabling a more comprehensive evaluation of breakwater performance under diverse environmental conditions. Longitudinal datasets would allow for time-series analysis of morphodynamic feedbacks between structure type, sediment accumulation, and mangrove regeneration. In parallel, model refinement using expanded boundary conditions and validated calibration parameters will be necessary to better simulate complex, large-scale coastal processes.
Third, another limitation concerns the use of wind data sourced from an offshore point approximately 100 km from the study area. While the Global Wind Atlas provides reliable large-scale wind information, it may not fully capture nearshore wind dynamics influenced by shoreline geometry, surface roughness, and local topography. These factors can alter wind speed and direction, potentially affecting wave generation near the coast. Although this limitation does not invalidate the simulation results, future studies should consider incorporating local wind measurements or high-resolution mesoscale atmospheric models to improve nearshore wind boundary conditions.
Fourth, while this study focused on the immediate vicinity of each breakwater type, it did not assess potential downdrift erosion effects, which are a well-documented concern with rigid coastal structures. Spatial trade-offs—such as erosion risks in adjacent, unprotected areas—should be carefully evaluated using historical satellite imagery and shoreline change analysis tools such as the Digital Shoreline Analysis System (DSAS) within QGIS or ArcGIS. Due to image quality constraints and cloud cover over key shoreline segments, a full DSAS transect-based analysis was not feasible within this study.
Fifth, another limitation of this study is the lack of ground-truth validation using field survey points to confirm the accuracy of remote sensing–derived mangrove extent. While high-resolution imagery and consistent classification protocols were applied, the absence of in situ reference data may introduce uncertainty in the delineation of mangrove boundaries. Future studies should consider incorporating ground control points or drone-based validation surveys to enhance the spatial accuracy and confidence of remote sensing assessments.
Sixth, while this study focused on the physical and ecological dimensions of hybrid coastal protection, there remains a need for social-ecological assessments that capture local perceptions, governance readiness, and the cost–benefit trade-offs of different protection schemes. Embedding these perspectives will be critical to informing the design of context-sensitive and adaptive coastal resilience strategies. Finally, while this study acknowledges the role of upstream sediment trapping due to dam construction along the Mekong River, it did not quantitatively simulate sediment budget scenarios under reduced sediment supply conditions. Given the accelerating loss of fluvial sediment inputs, future modeling should incorporate sediment transport dynamics to evaluate the long-term sustainability of breakwater performance under both current and projected sediment-deficit scenarios.
Additionally, recent advances in Bragg reflection breakwater design (e.g., Gao et al., 2023; 2024) demonstrate how periodic seabed or floating breakwater configurations can significantly mitigate harbor resonance, including under irregular wave conditions [55,56,57,58,59]. Similarly, Liu et al. (2025) show via CFD modeling that arrays of independently moored floating breakwaters can achieve enhanced wave attenuation through Bragg resonance [60]. These findings suggest promising directions for extending the scope of future studies to include wave–structure–sediment resonance mechanisms. Moreover, emerging research on long-period wave influences (2024) indicates that these low-frequency components play a critical role in mobilizing sediment and driving morphological change, suggesting their inclusion could strengthen sediment budget modeling in deltaic environments [57].

6. Conclusions

This study has examined the interplay between engineered coastal structures and ecological processes along the erosion-prone western shoreline of Ca Mau Province, VMD. Through a combination of field measurements, satellite image analysis, and hydrodynamic modeling, we offer an integrated assessment of how different breakwater typologies and mangrove widths shape the socio-ecological stability of this vulnerable coastal landscape. The findings highlight that while rigid breakwaters—particularly semi-circular and pile-rock types—demonstrate substantial effectiveness in attenuating wave energy and stabilizing sediment, their functionality is spatially fixed and context-dependent. Conversely, the floating breakwater, though less efficient in reducing wave height, introduces a degree of modularity and spatial flexibility that may prove advantageous in the context of dynamic environmental change and phased ecosystem recovery.
Crucially, we highlight the continued erosion of mangrove buffer zones and the limited protective function of narrow, fragmented mangrove belts. Simulation results reinforce the threshold effect of mangrove width on wave attenuation, providing empirical support for the need to maintain or restore broad, contiguous vegetated corridors. However, mangrove degradation is not merely an ecological phenomenon but also a product of historical land-use transitions, institutional disjuncture’s, and uneven development priorities. As such, efforts to stabilize the coastline must not only be technically sound but also socially situated and politically attuned. The implications of this research extend beyond infrastructure design. They invite reflection on how hybrid approaches—linking structural and nature-based solutions—can be embedded within adaptive planning frameworks that are locally grounded yet responsive to broader climatic, economic, and sedimentary shifts. In contexts like the Mekong Delta, where socio-ecological vulnerabilities intersect with regional sediment scarcity and fragmented governance regimes, the design of coastal protection must move beyond fixed interventions to embrace temporality, mobility, and negotiated trade-offs.
Our findings from Ca Mau also underscore the urgency of embedding modular hybrid strategies into Vietnam’s coastal protection roadmap. They also highlight the need to co-design infrastructure with local communities and sediment realities in mind. Future research should deepen the place-based understanding of these trade-offs by incorporating local perspectives, institutional arrangements, and historical trajectories into technical evaluations. Such an approach will be vital in shaping coastal protection strategies that are not only materially effective but also socially equitable and ecologically regenerative. By attending to these interlinked dimensions, this work contributes to an emerging paradigm of climate adaptation that foregrounds relational resilience—one that sees infrastructure not as static defense but as part of an evolving landscape of human–environment interaction. Strengthening the science–policy interface through applied, site-specific knowledge will be essential to guide scalable and sustainable coastal adaptation in the VMD and similar deltaic regions worldwide.

Author Contributions

Conceptualization, D.V.D., T.V.T., and H.V.T.M.; methodology, D.V.D., and T.V.T.; formal analysis, L.T.P., H.V.T.M., and T.V.T.; investigation, N.D.G.N., H.V.T.M., and N.K.D.; resources, D.V.D., and T.V.T.; data curation, D.V.D., N.D.G.N., and L.T.P.; writing—original draft preparation, T.V.T., L.T.P., H.V.T.M., and D.V.D.; writing—review and editing, D.V.D., T.V.T., L.T.P., H.V.T.M., N.K.D., and N.D.G.N.; visualization, D.V.D., and L.T.P.; supervision, H.T., R.A., and N.K.D. All authors have read and agreed to the published version of the manuscript.

Funding

This study was funded by the Technical Cooperation Project of the Japan International Cooperation Agency (JICA).

Data Availability Statement

Data are contained within the article.

Acknowledgments

The authors would like to thank Flow Science, Inc. for providing the FLOW-3D software license to support training and research at the College of Engineering, Can Tho University.

Conflicts of Interest

The authors declare no conflicts of interest.

References

  1. Syvitski, J.P.; Vörösmarty, C.J.; Kettner, A.J.; Green, P. Impact of humans on the flux of terrestrial sediment to the global coastal ocean. Science 2005, 308, 376–380. [Google Scholar] [CrossRef] [PubMed]
  2. Allison, M.; Yuill, B.; Törnqvist, T.; Amelung, F.; Dixon, T.; Erkens, G.; Stuurman, R.; Jones, C.; Milne, G.; Steckler, M. Global risks and research priorities for coastal subsidence. Eos 2016, 97, 22–27. [Google Scholar] [CrossRef]
  3. Tessler, Z.D.; Vörösmarty, C.J.; Grossberg, M.; Gladkova, I.; Aizenman, H.; Syvitski, J.P.; Foufoula-Georgiou, E. Profiling risk and sustainability in coastal deltas of the world. Science 2015, 349, 638–643. [Google Scholar] [CrossRef]
  4. Walton, R.E.; Moorhouse, H.L.; Roberts, L.R.; Salgado, J.; Ladd, C.J.; Do, N.T.; Panizzo, V.N.; Van, P.D.T.; Downes, N.K.; Trinh, D.A. Using lake sediments to assess the long-term impacts of anthropogenic activity in tropical river deltas. Anthr. Rev. 2024, 11, 442–462. [Google Scholar] [CrossRef]
  5. Temmerman, S.; Kirwan, M.L. Building land with a rising sea. Science 2015, 349, 588–589. [Google Scholar] [CrossRef]
  6. Tri, V.P.D.; Yarina, L.; Nguyen, H.Q.; Downes, N.K. Progress toward resilient and sustainable water management in the Vietnamese Mekong Delta. Wiley Interdiscip. Rev. Water 2023, 10, e1670. [Google Scholar] [CrossRef]
  7. Biggs, D.; Miller, F.; Hoanh, C.T.; Molle, F. The delta machine: Water management in the Vietnamese Mekong Delta in historical and contemporary perspectives. In Contested Waterscapes in the Mekong Region; Routledge: Oxfordshire, UK, 2012; pp. 203–225. [Google Scholar]
  8. Park, E. Sand mining in the Mekong Delta: Extent and compounded impacts. Sci. Total Environ. 2024, 924, 171620. [Google Scholar] [CrossRef]
  9. Anthony, E.J.; Brunier, G.; Besset, M.; Goichot, M.; Dussouillez, P.; Nguyen, V.L. Linking rapid erosion of the Mekong River delta to human activities. Sci. Rep. 2015, 5, 14745. [Google Scholar] [CrossRef]
  10. Tran, D.Q.; Le, K.N.; Durand-Morat, A.; Nguyen, N.N.; Bairagi, S.K.; Huynh, M.V.; Tran, T.V. Is it worth it? Land-fallowing and saltwater intrusion control under uncertainty. Sci. Total Environ. 2025, 966, 178711. [Google Scholar] [CrossRef] [PubMed]
  11. Pontee, N.; Narayan, S.; Beck, M.W.; Hosking, A.H. Nature-based solutions: Lessons from around the world. Marit. Eng. 2016, 169, 29–36. [Google Scholar]
  12. Temmerman, S.; Meire, P.; Bouma, T.J.; Herman, P.M.; Ysebaert, T.; De Vriend, H.J. Ecosystem-based coastal defence in the face of global change. Nature 2013, 504, 79–83. [Google Scholar] [CrossRef] [PubMed]
  13. Masselink, G.; Scott, T.; Poate, T.; Russell, P.; Davidson, M.; Conley, D. The extreme 2013/2014 winter storms: Hydrodynamic forcing and coastal response along the southwest coast of England. Earth Surf. Process. Landf. 2016, 41, 378–391. [Google Scholar] [CrossRef]
  14. Sutton-Grier, A.E.; Wowk, K.; Bamford, H. Future of our coasts: The potential for natural and hybrid infrastructure to enhance the resilience of our coastal communities, economies and ecosystems. Environ. Sci. Policy 2015, 51, 137–148. [Google Scholar] [CrossRef]
  15. Zoccarato, C.; Minderhoud, P.S.; Teatini, P. The role of sedimentation and natural compaction in a prograding delta: Insights from the mega Mekong delta, Vietnam. Sci. Rep. 2018, 8, 11437. [Google Scholar] [CrossRef] [PubMed]
  16. Jordan, C.; Visscher, J.; Viet Dung, N.; Apel, H.; Schlurmann, T. Impacts of human activity and global changes on future morphodynamics within the Tien river, Vietnamese Mekong delta. Water 2020, 12, 2204. [Google Scholar] [CrossRef]
  17. Tiede, J.; Jordan, C.; Lojek, O.; Visscher, J.; Schlurmann, T. Hydro- and Morphodynamic Regime of the Tien River, Mekong Delta. In Coastal Structures 2019; Goseberg, N., Schlurmann, T., Eds.; Bundesanstalt für Wasserbau. S.: Karlsruhe, ND, USA, 2019; pp. 426–434. [Google Scholar] [CrossRef]
  18. Lavane, K.; Kumar, P.; Meraj, G.; Han, T.G.; Ngan, L.H.B.; Lien, B.T.B.; Van Ty, T.; Thanh, N.T.; Downes, N.K.; Nam, N.D.G. Assessing the effects of drought on rice yields in the Mekong Delta. Climate 2023, 11, 13. [Google Scholar] [CrossRef]
  19. Dang, A.T.; Reid, M.; Kumar, L. Coastal Melaleuca wetlands under future climate and sea-level rise scenarios in the Mekong Delta, Vietnam: Vulnerability and conservation. Reg. Environ. Change 2023, 23, 21. [Google Scholar] [CrossRef]
  20. Ty, T.V.; Lavane, K.; Nguyen, P.C.; Downes, N.K.; Nam, N.D.G.; Minh, H.V.T.; Kumar, P. Assessment of relationship between climate change, drought, and land use and land cover changes in a semi-Mountainous area of the Vietnamese Mekong delta. Land 2022, 11, 2175. [Google Scholar] [CrossRef]
  21. Minh, H.V.T.; Nam, N.D.G.; Ngan, N.V.C.; Van Thinh, L.; Nam, T.S.; Van Cong, N.; Nhat, G.M.; Lien, B.T.B.; Kumar, P.; Downes, N.K. Is Vietnam’s Mekong Delta Facing Wet Season Droughts? Earth Syst. Environ. 2024, 8, 963–995. [Google Scholar] [CrossRef]
  22. Hensengerth, O.; Lam, T.H.O.; Tri, V.P.D.; Hutton, C.; Darby, S. How to promote sustainability? The challenge of strategic spatial planning in the Vietnamese Mekong Delta. J. Environ. Policy Plan. 2024, 26, 91–103. [Google Scholar] [CrossRef]
  23. Ty, T.V.; Duy, D.V.; Phat, L.T.; Minh, H.V.T.; Thanh, N.T.; Uyen, N.T.N.; Downes, N.K. Coastal erosion dynamics and protective measures in the Vietnamese Mekong Delta. J. Mar. Sci. Eng. 2024, 12, 1094. [Google Scholar] [CrossRef]
  24. Tran, T.; Pham, D.; Tran, V.T. Shoreline evolution in adjacent to a coastal structure in Hiep Thanh commune, Duyen Hai district, Tra Vinh province. CTU J. Innov. Sustain. Dev. 2024, 16, 8–13. [Google Scholar] [CrossRef]
  25. Tinh, P.H.; MacKenzie, R.A.; Hung, T.D.; Vinh, T.V.; Ha, H.T.; Lam, M.H.; Hanh, N.T.H.; Tung, N.X.; Hai, P.M.; Huyen, B.T. Mangrove restoration in Vietnamese Mekong Delta during 2015–2020: Achievements and challenges. Front. Mar. Sci. 2022, 9, 1043943. [Google Scholar] [CrossRef]
  26. Albers, T.; Dinh, S.; Schmitt, K. Shoreline Management Guidelines: Coastal Protection in the Lower Mekong Delta; Deutsche Gesellschaft für Internationale Zusammenarbeit (GIZ) GmbH: Bonn/Eschborn, Germany, 2013; Volume 1, pp. 1–124. [Google Scholar]
  27. Le Xuan, T.; Ba, H.T.; Thanh, V.Q.; Wright, D.P.; Tanim, A.H.; Anh, D.T. Evaluation of coastal protection strategies and proposing multiple lines of defense under climate change in the Mekong Delta for sustainable shoreline protection. Ocean Coast. Manag. 2022, 228, 106301. [Google Scholar] [CrossRef]
  28. Veettil, B.K.; Ward, R.D.; Dung, N.T.K.; Van, D.D.; Quang, N.X.; Hoai, P.N.; Hoang, N.-D. The use of bioshields for coastal protection in Vietnam: Current status and potential. Reg. Stud. Mar. Sci. 2021, 47, 101945. [Google Scholar] [CrossRef]
  29. Albers, T.; Schmitt, K. Dyke design, floodplain restoration and mangrove co-management as parts of an area coastal protection strategy for the mud coasts of the Mekong Delta, Vietnam. Wetl. Ecol. Manag. 2015, 23, 991–1004. [Google Scholar] [CrossRef]
  30. Nguyen, N.-M.; Do Van, D.; Le, D.T.; Cong, S.D.; Pham, N.T.; Nguyen, Q.; Tran, B.; Wright, D.P.; Tanim, A.H.; Anh, D.T. Wave reduction efficiency for three classes of breakwaters on the coastal Mekong Delta. Appl. Ocean Res. 2022, 129, 103362. [Google Scholar] [CrossRef]
  31. Le Xuan, T.; Nguyen Cong, P.; Vo Quoc, T.; Tran, Q.Q.; Wright, D.P.; Tran Anh, D. Multi-scale modelling for hydrodynamic and morphological changes of breakwater in coastal Mekong Delta in Vietnam. J. Coast. Conserv. 2022, 26, 18. [Google Scholar] [CrossRef]
  32. Nguyen, N.-M.; Do Van, D.; Le, D.T.; Nguyen, Q.; Tran, B.; Nguyen, T.C.; Wright, D.; Tanim, A.H.; Thanh, P.N.; Anh, D.T. Physical and numerical modeling of four different shapes of breakwaters to test the suspended sediment trapping capacity in the Mekong Delta. Estuar. Coast. Shelf Sci. 2022, 279, 108141. [Google Scholar] [CrossRef]
  33. Turner, I.L.; Russell, P.E.; Butt, T. Measurement of wave-by-wave bed-levels in the swash zone. Coast. Eng. 2008, 55, 1237–1242. [Google Scholar] [CrossRef]
  34. Lyman, T.P.; Elsmore, K.; Gaylord, B.; Byrnes, J.E.; Miller, L.P. Open Wave Height Logger: An open source pressure sensor data logger for wave measurement. Limnol. Oceanogr. Methods 2020, 18, 335–345. [Google Scholar] [CrossRef]
  35. El Kafrawy, S.B.; Basiouny, M.E.; Ghanem, E.A.; Taha, A.S. Performance evaluation of shoreline extraction methods based on remote sensing data. J. Geogr. Environ. Earth Sci. Int. 2017, 11, 1–18. [Google Scholar] [CrossRef]
  36. Shashikant, V.; Mohamed Shariff, A.R.; Wayayok, A.; Kamal, M.R.; Lee, Y.P.; Takeuchi, W. Utilizing TVDI and NDWI to classify severity of agricultural drought in Chuping, Malaysia. Agronomy 2021, 11, 1243. [Google Scholar] [CrossRef]
  37. Pettorelli, N.; Vik, J.O.; Mysterud, A.; Gaillard, J.-M.; Tucker, C.J.; Stenseth, N.C. Using the satellite-derived NDVI to assess ecological responses to environmental change. Trends Ecol. Evol. 2005, 20, 503–510. [Google Scholar] [CrossRef] [PubMed]
  38. Pu, R.; Gong, P.; Tian, Y.; Miao, X.; Carruthers, R.I.; Anderson, G.L. Using classification and NDVI differencing methods for monitoring sparse vegetation coverage: A case study of saltcedar in Nevada, USA. Int. J. Remote Sens. 2008, 29, 3987–4011. [Google Scholar] [CrossRef]
  39. Li, R.; Di, K.; Ma, R. 3-D shoreline extraction from IKONOS satellite imagery. Mar. Geod. 2003, 26, 107–115. [Google Scholar] [CrossRef]
  40. ODA and NGO Project Management Board of Ca Mau. Package No. 03: Survey, Design Construction Drawings—Estimate for Construction of West Coast Protection Structures (from Sao Luoi to Ba Tinh); ODA and NGO project management board of Ca Mau: Ca Mau, Vietnam, 2018. [Google Scholar]
  41. Thuan, N.N.; Ty, T.V.; Hung, T.V.; Hong, H.T.C.; Nhan, H.N.; Lam, T.H.; Duy, D.V.; Hai, T.K.; Tuan, T.V.; Quang, T.M. Assessment of Wave Reduction Effectiveness of Detached Breakwaters along the West Coast of Ca Mau Province. Vietnam J. Hydrometeorol. 2021, 732, 93–105. [Google Scholar] [CrossRef]
  42. Borsje, B.W.; van Wesenbeeck, B.K.; Dekker, F.; Paalvast, P.; Bouma, T.J.; van Katwijk, M.M.; de Vries, M.B. How ecological engineering can serve in coastal protection. Ecol. Eng. 2011, 37, 113–122. [Google Scholar] [CrossRef]
  43. Narayan, S.; Beck, M.W.; Reguero, B.G.; Losada, I.J.; Van Wesenbeeck, B.; Pontee, N.; Sanchirico, J.N.; Ingram, J.C.; Lange, G.-M.; Burks-Copes, K.A. The effectiveness, costs and coastal protection benefits of natural and nature-based defences. PLoS ONE 2016, 11, e0154735. [Google Scholar] [CrossRef] [PubMed]
  44. Mazda, Y.; Magi, M.; Kogo, M.; Hong, P.N. Mangroves as a coastal protection from waves in the Tong King delta, Vietnam. Mangroves Salt Marshes 1997, 1, 127–135. [Google Scholar] [CrossRef]
  45. Schmitt, K.; Albers, T. Mangroves and Ecosystem-Based Coastal Protection in the Mekong River Delta, Vietnam. In Mangrove Biology, Ecosystem, and Conservation; IntechOpen: London, UK, 2023. [Google Scholar]
  46. Schmitt, K.; Albers, T.; Pham, T.; Dinh, S. Site-specific and integrated adaptation to climate change in the coastal mangrove zone of Soc Trang Province, Viet Nam. J. Coast. Conserv. 2013, 17, 545–558. [Google Scholar] [CrossRef]
  47. Thao, N.D.; Kiet, N.; Huynh, P.T.D.; Hiep, L.D.; Trang, D.D.T. Wave Attenuation in Coastal Mangroves: The case of Mekong Delta Vietnam. In IOP Conference Series: Earth and Environmental Science; IOP Publishing: Bristol, UK, 2023; Volume 1226, p. 012026. [Google Scholar]
  48. Van Coppenolle, R.; Temmerman, S. A global exploration of tidal wetland creation for nature-based flood risk mitigation in coastal cities. Estuar. Coast. Shelf Sci. 2019, 226, 106262. [Google Scholar] [CrossRef]
  49. Chan, F.K.S.; Paszkowski, A.; Wang, Z.; Lu, X.; Mitchell, G.; Tran, D.D.; Warner, J.; Li, J.; Chen, Y.D.; Li, N. Building resilience in Asian mega-deltas. Nat. Rev. Earth Environ. 2024, 5, 522–537. [Google Scholar] [CrossRef]
  50. Cremin, E.; Ladd, C.J.; Balke, T.; Banerjee, S.; Bui, L.H.; Ghosh, T.; Large, A.; Thi Van Le, H.; Nguyen, K.V.; Nguyen, L.X. Causes and consequences of tipping points in river delta social-ecological systems. Ambio 2024, 53, 1015–1036. [Google Scholar] [CrossRef]
  51. Gerona-Daga, M.E.B.; Salmo, S.G., III. A systematic review of mangrove restoration studies in Southeast Asia: Challenges and opportunities for the United Nation’s Decade on Ecosystem Restoration. Front. Mar. Sci. 2022, 9, 987737. [Google Scholar] [CrossRef]
  52. Government of Vietnam. The Resolution No. 120/NQ-CP on Sustainable and Climate-Resilient Development of the Mekong Delta; Office of the Prime Minister: Hanoi, Vietnam, 2017. [Google Scholar]
  53. Government of Vietnam. National Green Growth Strategy for the 2021–2030 Period, Vision to 2050; Ministry of Planning and Investment: Hanoi, Vietnam, 2021. [Google Scholar]
  54. Ministry of Industry and Trade (MOIT). Blue Economy Roadmap of Vietnam; Youth Publishing House: Hanoi, Vietnam, 2022. [Google Scholar]
  55. Gao, J.; Shi, H.; Zang, J.; Liu, Y. Mechanism analysis on the mitigation of harbor resonance by periodic undulating topography. Ocean Eng. 2023, 281, 114923. [Google Scholar] [CrossRef]
  56. Gao, J.; Ma, X.; Dong, G.; Chen, H.; Liu, Q.; Zang, J. Investigation on the effects of Bragg reflection on harbor oscillations. Coast. Eng. 2021, 170, 103977. [Google Scholar] [CrossRef]
  57. Gao, J.; Hou, L.; Liu, Y.; Shi, H. Influences of bragg reflection on harbor resonance triggered by irregular wave groups. Ocean Eng. 2024, 305, 117941. [Google Scholar] [CrossRef]
  58. Peng, J.; Tao, A.-F.; Fan, J.; Zheng, J.-H.; Liu, Y.-M. On the downshift of wave frequency for Bragg resonance. China Ocean Eng. 2022, 36, 76–85. [Google Scholar] [CrossRef]
  59. Xu, W.; Chen, C.; Htet, M.H.; Sarkar, M.S.I.; Tao, A.; Wang, Z.; Fan, J.; Jiang, D. Experimental investigation on Bragg resonant reflection of waves by porous submerged breakwaters on a horizontal seabed. Water 2022, 14, 2682. [Google Scholar] [CrossRef]
  60. Liu, W.; Luo, Z.; Mao, M. A Numerical Study on the Bragg Resonance Characteristics of Multiple Floating Breakwaters. J. Mar. Sci. Eng. 2025, 13, 1014. [Google Scholar] [CrossRef]
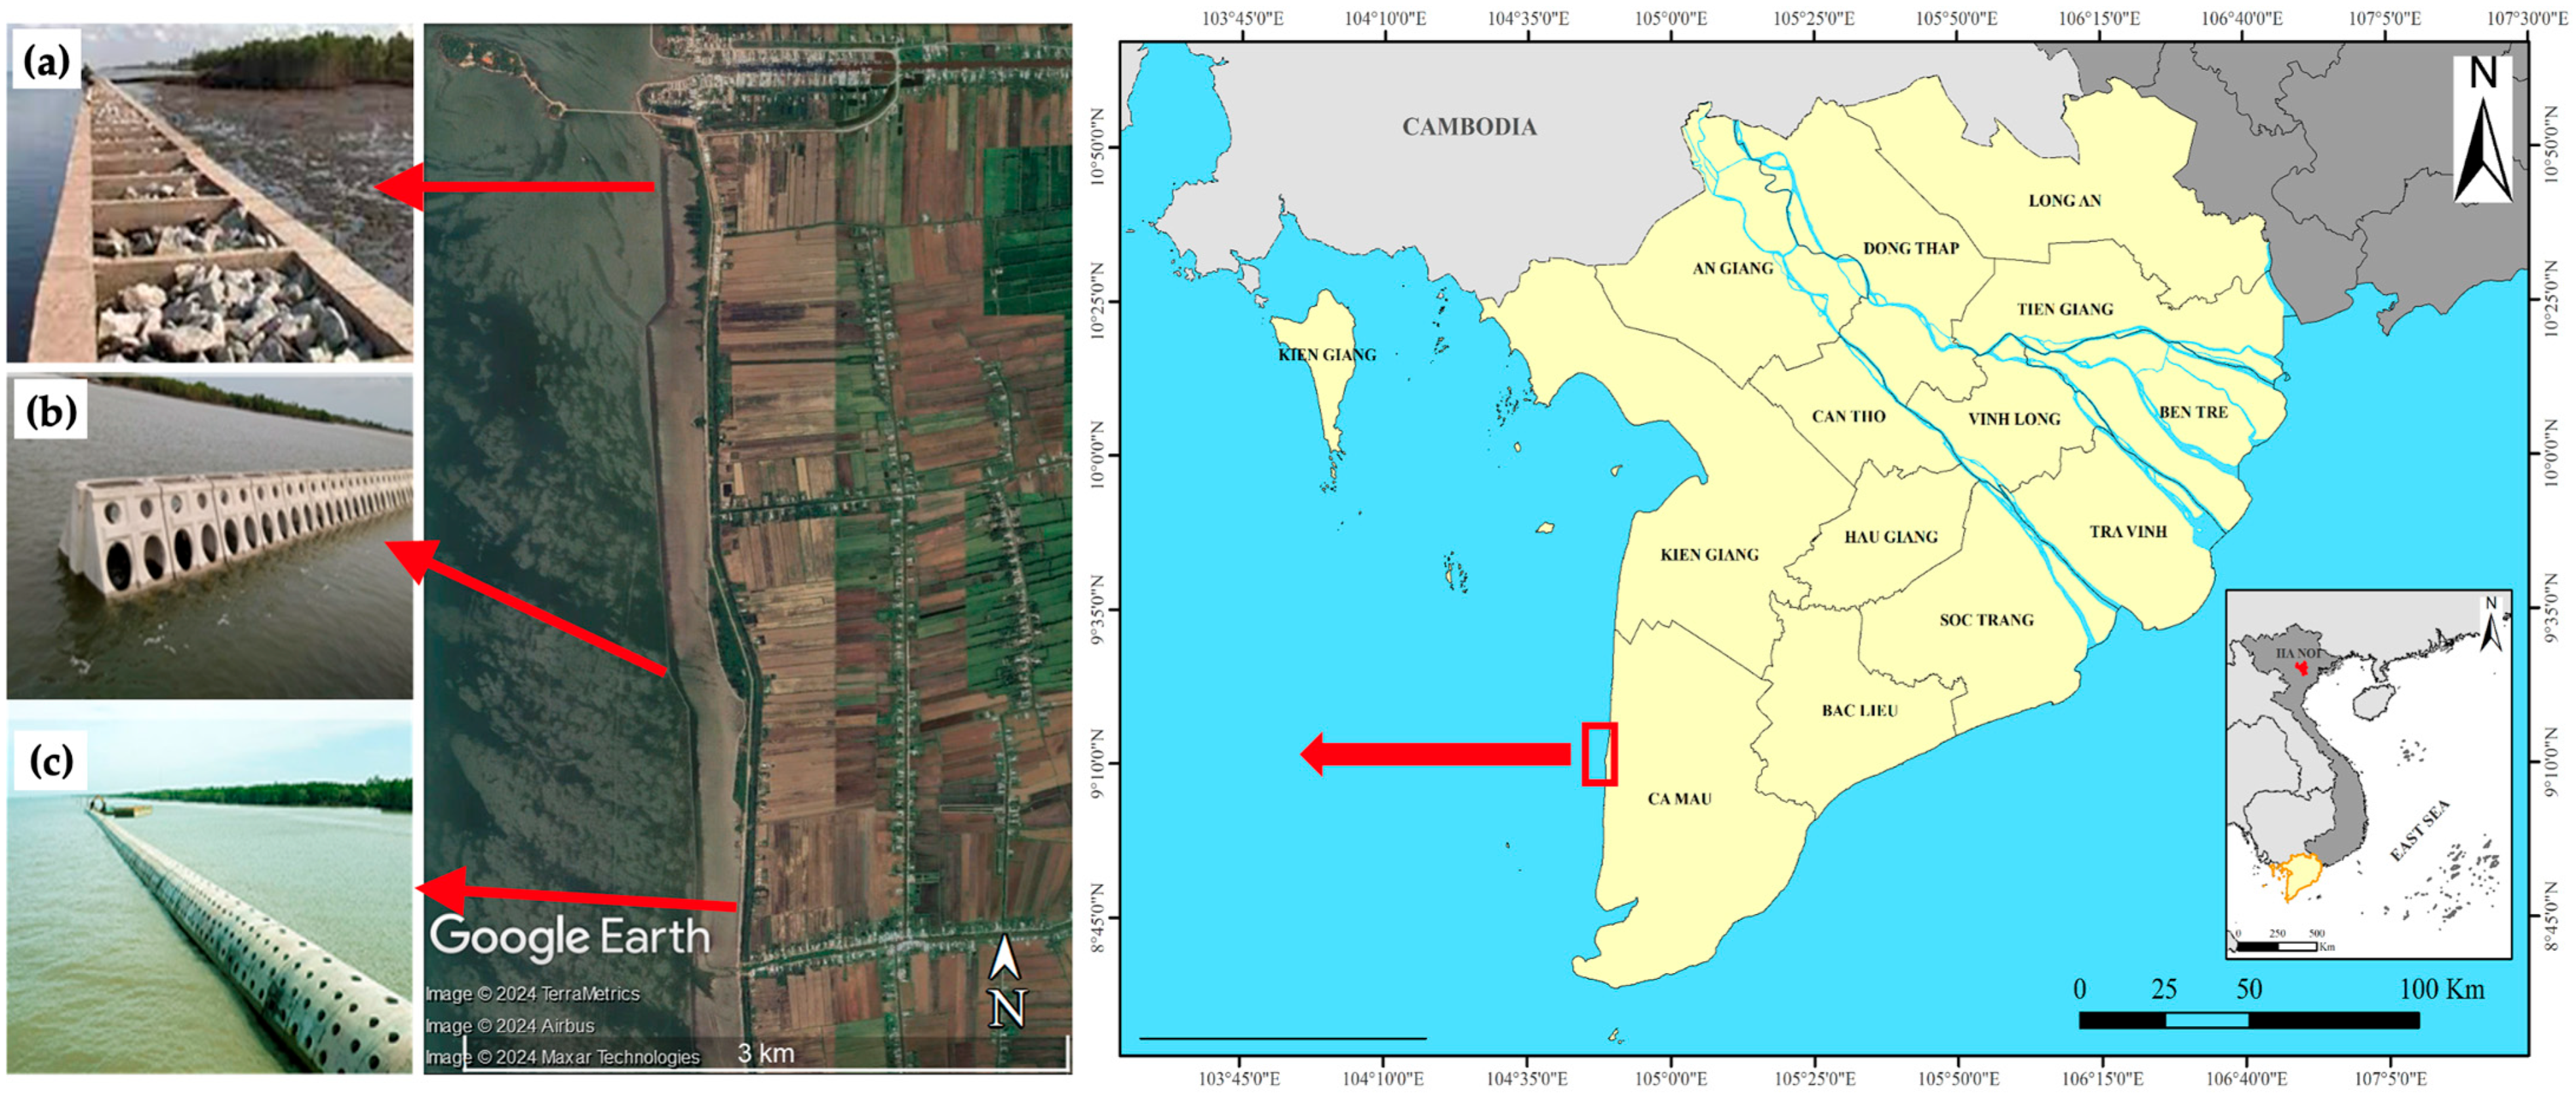
Figure 1. Study area in the Vietnamese Mekong Delta and locations of three types of breakwaters: (a) pile-rock breakwater, (b) Busadco breakwater, and (c) semi-circular breakwater.
Jmse 13 01559 g001
Figure 2. Method of wave and deposition/erosion measurement points of various types of breakwaters with (a) location of water level and deposition/erosion measurement points, (b) wave measurement equipment installation schematic, and (c) stone pillars as deposition/erosion monitoring markers.
Jmse 13 01559 g002
Figure 3. Method for determining the mangrove area, with points A (479,197 E; 1,014,295 N) and B (479,477 E; 1,009,332 N) fixed on the sea dike to define the georeferenced calculation boundary.
Jmse 13 01559 g003
Figure 4. Method of rectifying the images downloaded from Google Earth using 10 ground control points (GCPs) and manually extracting the shorelines.
Jmse 13 01559 g004
Figure 5. Simulated seabed topography.
Jmse 13 01559 g005
Figure 6. Location for downloading average wind speed data at an altitude of 10 m above sea level on the Global Wind Atlas website for use as a boundary condition in the Flow-3D model.
Jmse 13 01559 g006
Figure 7. Wave heights in front of and behind the pile-rock breakwater from 10:00 to 17:00 on 25 June 2023, (a) highest wave height (H1/10), (b) significant wave height (Hs), and (c) maximum wave height (Hmax).
Jmse 13 01559 g007
Figure 8. Changes in beach elevation relative to the top of the rock pillars for three different types of breakwaters.
Jmse 13 01559 g008
Figure 9. Analyze changes in mangrove area from 2000 to 2024.
Jmse 13 01559 g009
Figure 10. X-velocity contours showing wave propagation through mangrove forests of different widths: (a) 10 m and (b) 5 m. The horizontal axis (X) represents distance along the wave direction (in meters), and the vertical axis (Z) indicates elevation (in meters). Velocity scale is unified across both subfigures for comparison.
Jmse 13 01559 g010
Figure 11. Change in wave heights when propagating through mangroves of different widths, (a) 10 m and (b) 5 m.
Jmse 13 01559 g011
Figure 12. Wave reduction efficiency of mangroves of different widths, (a) 10 m and (b) 5 m. B represents the width of the mangrove forest.
Jmse 13 01559 g012
Figure 13. X-velocity contours showing wave propagation through four types of breakwater structures, (a) Busadco breakwater, (b) semi-circular breakwater, (c) pile-rock breakwater, and (d) floating breakwater. The horizontal axis (X) represents distance along the wave direction (in meters), and the vertical axis (Z) indicates elevation (in meters). Velocity scale is unified across both subfigures for comparison.
Jmse 13 01559 g013
Figure 14. The water level profiles in front of and behind types of breakwater structures, (a) Busadco breakwater, (b) semi-circular breakwater, (c) pile-rock breakwater, and (d) floating breakwater.
Jmse 13 01559 g014
Figure 15. The statistics wave height in front of and behind types of breakwater structures, (a) Busadco breakwater, (b) semi-circular breakwater, (c) pile-rock breakwater, and (d) floating breakwater.
Jmse 13 01559 g015
Figure 16. Wave reduction efficiency (%) of different breakwater types.
Jmse 13 01559 g016
Table 1. Overview of used satellite images.
No.DateSourceSensorResolution
(m × m/Pixel)
Coordinates
110/03/2000Landsat 5TM30UTM
208/01/2001Landsat 5TM30UTM
307/02/2002Landsat 5TM30UTM
407/02/2003Landsat 5TM30UTM
502/02/2004Landsat 5TM30UTM
615/08/2005Landsat 5TM30UTM
707/02/2006Landsat 5TM30UTM
802/06/2007Landsat 5TM30UTM
913/02/2008Landsat 5TM30UTM
1014/01/2009Landsat 5TM30UTM
1128/07/2010Landsat 5TM30UTM
1229/06/2011Landsat 8OLI/TIRS30UTM
1327/12/2013Landsat 8OLI/TIRS30UTM
1428/01/2014Landsat 8OLI/TIRS30UTM
1521/04/2015Landsat 8OLI/TIRS30UTM
1619/02/2016Landsat 8OLI/TIRS30UTM
1720/01/2017Landsat 8OLI/TIRS30UTM
1812/02/2018Landsat 8OLI/TIRS30UTM
1927/02/2019Landsat 8OLI/TIRS30UTM
2013/01/2020Landsat 8OLI/TIRS30UTM
2114/10/2021Landsat 8OLI/TIRS30UTM
2220/12/2022Landsat 8OLI/TIRS30UTM
2331/12/2023Landsat 8OLI/TIRS30UTM
2403/02/2001Google Earth-1UTM
2503/11/2013Google Earth-1UTM
2613/01/2015Google Earth-1UTM
2731/10/2018Google Earth-1UTM
2823/01/2020Google Earth-1UTM
2902/09/2022Google Earth-1UTM
3004/04/2023Google Earth-1UTM
3119/02/2021Sentinel-2MSI10UTM
3202/09/2021Sentinel-2MSI10UTM
3301/03/2022Sentinel-2MSI10UTM
3402/09/2022Sentinel-2MSI10UTM
3526/03/2023Sentinel-2MSI10UTM
3627/10/2023Sentinel-2MSI10UTM
Table 2. Several RGB color combinations are used in classification.
Application ClassificationSpectrumCombination of Channels
Landsat 5Landsat 8, 9
Natural colorsRED, GREEN, BLUE3, 2, 14, 3, 2
Vegetation (Infrared colors)NIR, RED, GREEN4, 3, 25, 4, 3
Agricultural landSWIR-1, NIR, BLUE5, 4, 16, 5, 2
Land/waterNIR, SWIR-1, RED4, 5, 35, 6, 4
Table 3. Classification of NDVI index according to each subject [38].
NDVI Value RangeClassification
–1.0~0.0Water, Clouds
0.0~0.4Agricultural Land, Bare Soil, Urban Areas
0.4~1.0Mangrove Forest
Table 4. Structural elements and hydraulic roughness in the model.
No.SubjectTypes of ElementsManning Coefficient
1Floating structureBlocks0.011
2Mooring cablesSprings-
3SeabedBlocks0.023
Table 5. Numerical model setup parameters used in the simulation.
No.ParameterValue
1Model running time (s)60
2Fluid quantity1
3Fluid typeIncompressible fluid
4Unit systemSI
5Surface flow type Free
6Gravitational acceleration (m/s2)9.81
7Turbulent modelLarge Eddy Simulation (LES)
Table 6. Physical conditions of the model.
No.ParameterValue
1Gravity component (x, y, z)(0, 0, −9.81) m/s2
2Smagorinsky coefficient (Large Eddy Simulation model)0.1
Disclaimer/Publisher’s Note: The statements, opinions and data contained in all publications are solely those of the individual author(s) and contributor(s) and not of MDPI and/or the editor(s). MDPI and/or the editor(s) disclaim responsibility for any injury to people or property resulting from any ideas, methods, instructions or products referred to in the content.