1. Introduction
The escalating pollution of marine ecosystems presents severe challenges to human survival and marine biodiversity, with marine debris constituting a major pollutant. Since the 1980s, growing concerns regarding the impacts of marine debris have prompted extensive research efforts by the end of that decade [
1]. Marine debris is defined as persistent solid material that has been thrown, disposed of, or abandoned in marine and coastal settings. These materials are typically classified into plastics, paper, metals, textiles, glass, and rubber. The majority of them are plastic debris, which presents long-term hazards to marine ecosystems because it is non-biodegradable [
2].
The pervasive presence of plastic waste has polluted ecosystems globally; degraded the quality of water, air, and soil; and harmed both wildlife and human health, thereby drawing significant international attention [
3]. In line with this, the 2021 United Nations report, From Pollution to Solution: A Global Assessment of Marine Litter and Plastic Pollution, highlighted that plastics have even become new habitats for marine microorganisms. The report projected that the annual volume of plastic waste entering aquatic ecosystems, estimated at 9 to 14 million tons in 2016, could increase to 23–37 million tons by 2040 [
4]. The global distribution of marine plastic debris has resulted in serious environmental, public health, and economic consequences. Notably, 192 coastal countries produce approximately 275 million tons of plastic waste annually, with at least 4.8 million tons entering the oceans [
5].
Marine debris is transported across multiple depths under the influence of ocean currents. Therefore, to protect marine life, maintain ecological balance, and achieve sustainable ocean development, it is crucial to implement real-time and accurate detection systems that operate effectively at different depths.
With increasing attention being paid to marine observation and resource management, underwater image processing has become a rapidly evolving research field. However, the detection and identification of marine debris remain challenging due to complex imaging conditions, such as turbidity, low contrast, uniform lighting, and noise interference [
6]. Currently, the field measurement of large-scale floating debris primarily relies on manual visual inspection, which incurs high operational costs, is time-consuming, and offers limited spatial coverage [
7].
Deep learning has emerged as a promising solution for marine debris monitoring, offering scalable and effective capabilities for this pressing global issue [
8]. Several studies have shown that integrating underwater photography techniques with deep learning algorithms can more efficiently identify and localize marine debris. This integration provides scientific support for cleanup operations and affirms the feasibility of automated marine debris monitoring systems.
Previous studies have demonstrated the potential of deep learning in various marine debris detection tasks. For example, Hu et al. [
9] developed a deep convolutional neural network to extract features from hydroacoustic signals to classify and identify debris features. The detection results demonstrated the value of convolutional neural networks in marine detection applications. Fallati et al. [
10] achieved the detection and quantification of tourist beach trash in the Maldives by employing drone images and deep learning approaches, with a relatively high success rate compared to manual findings. Similarly, Garcia-Garin et al. [
11] used a convolutional neural network (CNN) to train and test 3723 aerial images from the northwestern Mediterranean Sea. At the same time, an application was developed using R language for the identification and quantification of floating debris in aerial images, which provides support for marine debris detection and assessment. Papakonstantinou et al. [
12] also used five CNNs integrated with drone platforms to quantify coastal debris loads, further supporting the applicability of deep learning. Armitage et al. [
13] demonstrated the effectiveness of YOLOv5s in detecting floating plastics with ship-mounted cameras. A classification accuracy of 95.2% was successfully achieved with this model. Huang et al. [
14] proposed a DSDebrisNet network based on a YOLOv5 architecture, which was trained on a self-constructed deep-sea debris dataset. The applicability results also demonstrated that deep learning has great potential and application value in marine debris detection. Furthermore, Ma et al. [
15] proposed the MLDet network based on the RetinaNet model using the TrashCan benchmark dataset. The AP50 of 0.689 of the MlDet network can alleviate the serious problem of inter-category similarity and intra-category variability of marine debris, but there are still objects that cannot be detected, and its accuracy needs to be upgraded.
Lyu et al. [
16] enhanced the YOLOX network, improving mAP50–95 by 5.2% for benthic organism detection. Hong et al. [
17] employed four mainstream models, including Faster-R-CNN, to train using deep-sea debris images from the TrashCan dataset. Experimental results demonstrated the feasibility of these models for marine debris detection, indicating their potential as critical tools for addressing marine pollution. Additionally, some researchers focus on optimizing detection accuracy and enhancing parameters. For instance, Bajaj et al. [
18] achieved 96% classification and 82% localization accuracy using InceptionResNetv2 on the J-EDI dataset. Tian et al. [
19] proposed a pruned YOLOv4 model retaining high performance with only 7.062% of its original parameters. Xue et al. [
20] demonstrated the effectiveness of ResNet50 as the backbone for marine debris detection using an enhanced YOLOv3 model. For the forward-looking sonar marine litter dataset, Li and Zhang [
21] established a lightweight multi-scale underwater debris segmentation network. While SeaFormer models can achieve significant performance improvements on four segmentation evaluation metrics, they slightly increase the number of model parameters. In contrast, this method improves the mIoU and mDice metrics by 3.99% (from 70.67% to 74.66%) and 2.97% (from 81.93% to 84.90%), respectively. Chen and Zhu [
22] utilized the lightweight character of the YOLO architecture to improve the YOLOv5 algorithm and validated its performance on the Orca dataset. The improved YOLOv5 model achieved a 4.3% increase in detection speed, with an mAP of 84.9% and an accuracy of 88.7%, while its parameter count was only 12% of the original model. This enhancement effectively alleviated the performance bottleneck issue caused by limited hardware resources on unmanned vessels.
Despite advancements in deep learning for marine debris detection, current models remain constrained by the limited quantity and homogeneity of available datasets. Most publicly accessible data originates from JAMSTEC’s J-EDI Deep-Sea Debris Dataset. This dataset is primarily derived from remotely operated vehicles (ROVs) and submersibles, SHINKAI6500 and HYPER-DOLPHIN, etc. The dataset includes video and imagery collected since 1983 [
23]. However, the unique and diverse morphology of marine debris is coupled with the visual similarity among different debris types, which poses a significant challenge for accurate identification. Furthermore, changes in object color and shape with increasing depth [
24] along with variations in lighting and turbidity—particularly near the sea surface [
25]—further complicate detection. These challenges highlight the urgent need for lightweight deep learning models capable of achieving high detection accuracy across varying depths. To address this, the UTNet model, a lightweight deep learning framework, is designed to enhance recognition accuracy and computational efficiency for real-time marine debris detection in both images and video under different oceanic conditions.
The paper is organized as follows:
Section 2 details the data and methodology,
Section 3 presents a comparative analysis of the models,
Section 4 assesses the real-time detection performance at varying depths, and
Section 5 concludes the study.
2. Materials and Methods
2.1. Data
The dataset is derived from the publicly available UTD2 Computer Vision Project, which contains 9625 images. It can be downloaded from the Kaggle and Roboflow websites “
https://universe.roboflow.com/utd-0dazj/utd2-hyo53 (accessed on 6 July 2024)”. This dataset is extended into the J-EDI dataset developed by the JAMSTEC through the inclusion of additional surface-layer debris imagery. Details regarding the sampling equipment and collection timeline are described in earlier sections. The deep-sea debris collection and submersible operation regions of the J-EDI dataset are illustrated in
Figure 1a. It is presented on the JAMSTEC official website “
https://www.godac.jamstec.go.jp/dsdebris/e/maps.html (accessed on 21 Marth 2025)”. Notably, only the deep-sea debris collection areas are indicated, while surface-layer regions are not marked.
The dataset is divided into three distinct categories: Bio, ROV, and Trash. It comprises 7308 images designated for training (75%), 1795 for validation (15%), and 473 for testing (5%). The dataset contains both surface-layer and deep-sea debris images, thereby encompassing a wide vertical range of marine debris distribution. Given widespread distribution, the multiple marine debris instances may be contained in individual images.
Due to the lack of multi-class segmentation annotations for marine debris in the UTD2 dataset, all types of debris are unified under the “Trash” category. This study adopts this labeling approach, which ensures consistency in the data and facilitates the model’s focus on effectively recognizing the diverse morphological features of marine debris. As depicted in
Figure 1b, the dataset exhibits class imbalance, while the spatial distribution and scale variation of bounding boxes are visualized in
Figure 1c. Additionally, normalized bounding box parameters (x, y, width, height) were analyzed from multiple perspectives. The aspect ratio distribution of debris objects is illustrated in
Figure 1d, which confirms considerable variation in object dimensions, while
Figure 1e reveals a tendency for object clustering near the center of the image.
These dataset characteristics underscore its diversity and spatial representativeness, making it well suited for training object detection networks capable of handling marine debris in varied underwater environments.
2.2. Methods
2.2.1. Receptive-Field Coordinate Attention and Convolutional Operation
The morphology and coloration of marine debris are highly complex and variable. However, the conventional parameter-sharing mechanism of standard convolutional operations significantly constrains the YOLOv8 model’s ability to learn these intricate features. In addition, underwater imaging is challenged by substantial noise and further quality degradation caused by varying illumination and increasing turbidity with depth. It is hard for conventional convolution to meet the demands of marine debris recognition under these unfavorable conditions.
To address these limitations, this study integrates RFCAConv, which enhances image noise reduction and feature extraction capabilities. Zhang et al. [
25] introduced the receptive-field attention (RFA) mechanism to overcome the limitations of conventional spatial attention approaches, providing a novel solution for enhanced spatial feature modeling. The core idea of RFCAConv lies in integrating RFA, an advanced attention mechanism developed to overcome the limitations of traditional spatial attention techniques in convolutional neural networks.
Unlike conventional spatial attention methods, RFA requires convolutional operations to function and thus cannot operate independently. This integrated design enables RFAConv to capture fine details and complex structural patterns more effectively in marine debris images. The formulation of RFAConv is presented as follows:
where
represents grouped convolution with a kernel size of
;
denotes normalization;
denotes the input feature map; and
indicates the element-wise multiplication between the attention map
and the transformed receptive field spatial features
.
The RFA mechanism separates the attention map from the shared receptive field kernel and focuses spatial attention on features within the receptive field. It dynamically evaluates the importance of each feature, similar to how self-attention works. This helps overcome the limitations of parameter sharing and insufficient information modeling, while reducing the high computational cost and complexity seen in coordinate attention (CA) [
26].
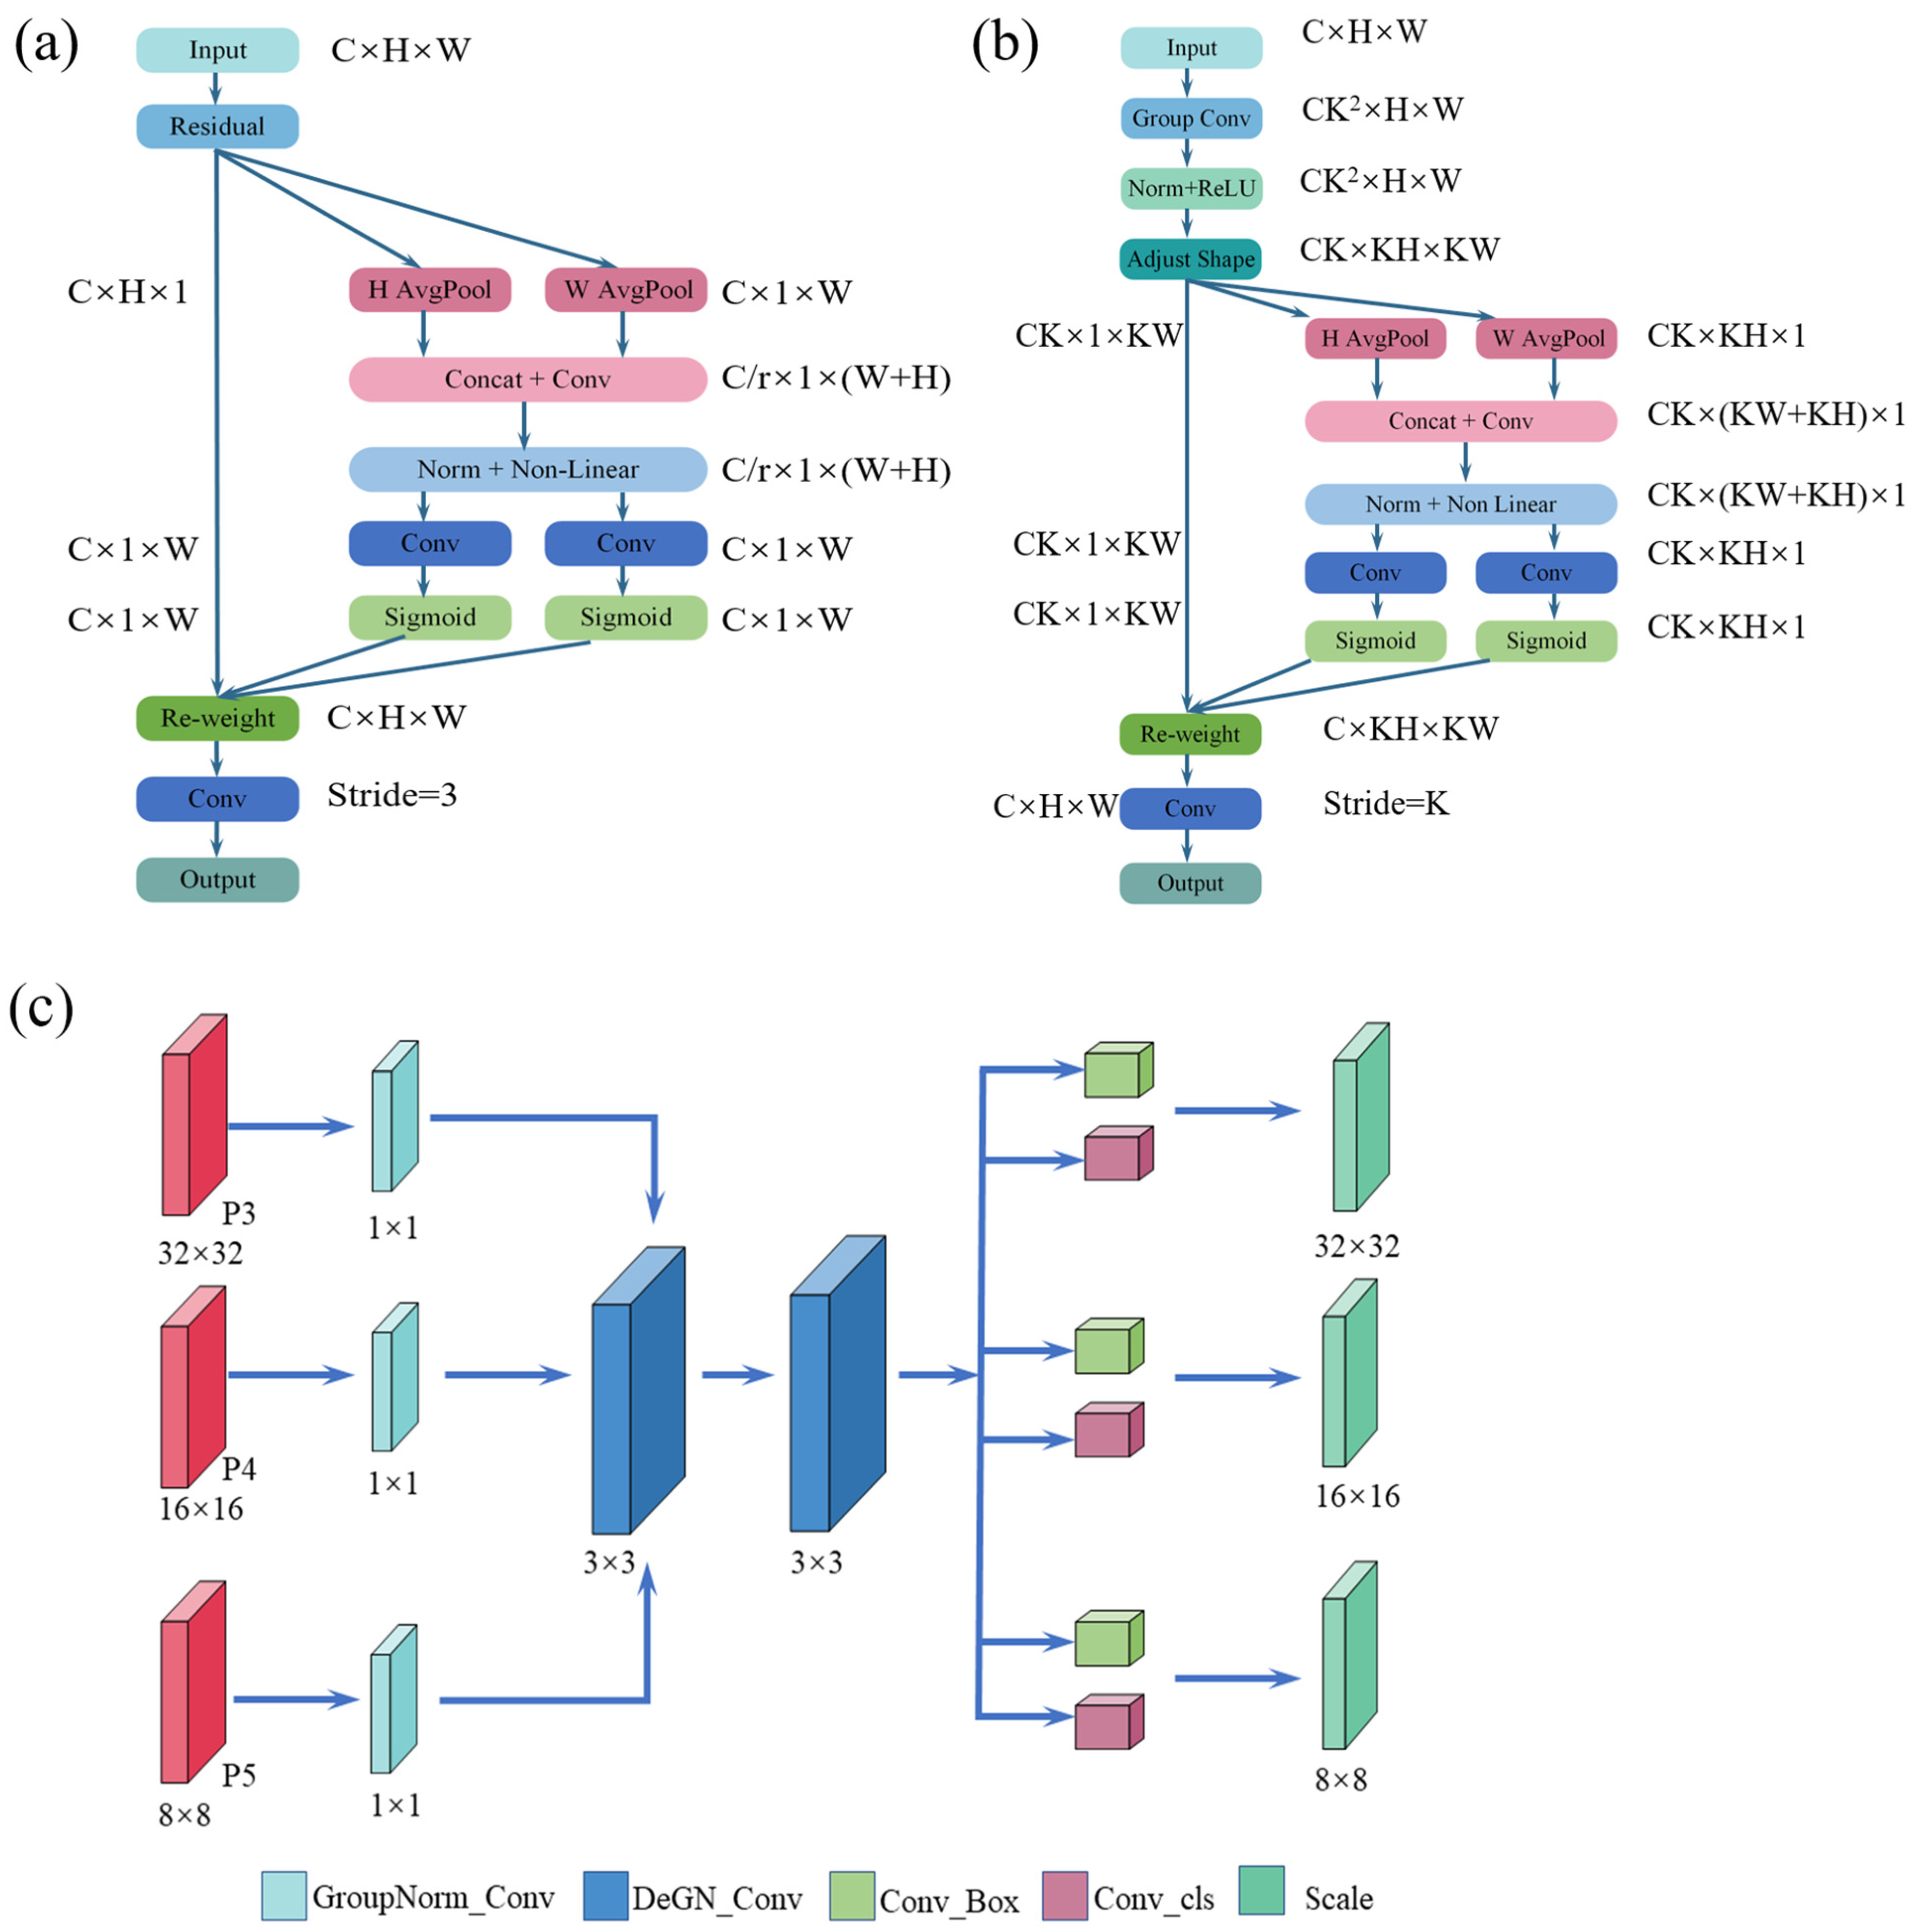
The structure of CAConv is illustrated in
Figure 2a, where coordinate attention is incorporated via horizontal and vertical pooling operations applied to the input feature maps. These operations encode directional spatial information into the pooled features, which are then transformed into two separate attention maps, preserving positional encoding. After feature fusion, the coordinate attention block is generated, followed by adding a 3 × 3 convolutional layer.
The core principle of coordinate attention is as follows: After the average pooling is performed on the feature map X with dimensions C × H × W, using kernel sizes of (H, 1) (H, 1) and (1, W) (1, W), respectively, it is first applied along the horizontal and vertical axes. For the channel, the pooled outputs at height and width are expressed as follows:
The resulting feature maps are fused along their respective directions, yielding two intermediate feature maps with dimensions C × H × 1 and C × 1 × W. These are then concatenated along the spatial dimension to form a combined feature map of size C × 1 × (H + W), expressed as follows:
where
denotes the 1 × 1 convolutional transformation function;
is a nonlinear activation function;
denotes the Intermediate feature map, and
denotes the spatial concatenation operation.
The combined feature map
is split along the spatial dimension into two independent tensors. These are then transformed using two 1 × 1 convolutional operations (
and
) to obtain
and
, as follows:
where
denotes the sigmoid function. The outputs
and
are expanded as attention weight factors along their respective spatial dimensions. The final coordinate attention block
is computed as follows:
As illustrated in
Figure 2b, the receptive-field coordinate attention convolutional operation (RFCAConv) combines the expressive feature representation and flexibility of coordinate attention (CA) with the receptive field mechanism. This enables convolutional operations to adjust to diverse characteristics of input features dynamically. By employing
strided convolutions for feature extraction, the network’s representational capability and overall performance are significantly enhanced. This design not only overcomes the limitations of parameter sharing inherent in conventional convolutional kernels but also integrates long-range contextual dependencies through pooling operations.
The integration of spatial attention mechanisms with standard convolutional operations effectively overcomes the limitations of parameter sharing. It emphasizes the significance of individual features within the receptive field, thereby augmenting the network’s spatial feature attention and enhancing the efficacy of standard convolutional operations.
2.2.2. Group Normalization Detail-Enhanced Shared Convolutional Detection Head (GDESCV Head) Structure
Normalization layers constitute a fundamental part of deep neural network architectures. They guarantee the consistency of input distributions across layers during training, thereby facilitating efficient and stable learning. While batch normalization and layer normalization are commonly used, they each present notable limitations. BatchNorm relies on sufficiently large batch sizes to function effectively, making it unsuitable for small-batch scenarios. In contrast, LayerNorm is batch-size-agnostic but incurs higher computational overhead when applied to high-dimensional feature maps, leading to reduced efficiency.
To address these issues, this study adopts group normalization [
27], which divides channels into groups and performs normalization independently within each group. This structure ensures stable performance under small batch sizes and is more effective for networks with limited channels. GroupNorm applies combined normalization across channels within each group, preserving inter-channel dependencies. This approach enhances performance in specific contexts. It reduces sensitivity to small batch sizes and maintains relative channel relationships and improves model robustness [
28]. GroupNorm processes an input tensor of size [N, C, H, W] by dividing the C channels into multiple groups and computing the mean and variance within each group. Owing to the independence of these groups, GroupNorm remains unaffected by batch size, making it suitable for small-batch scenarios. The features in each group are then normalized using the computed statistics.
To address the challenges of underwater imaging caused by light absorption and scattering, detail-enhanced convolution [
29] is integrated into convolutional layers. By replacing standard convolutions with center-, angular-, horizontal-, and vertical-difference convolutions, DEConv embeds prior knowledge and improves the representation and generalization of underwater features.
The core concept of shared convolution in object detection lies in reusing the weight parameters of a convolutional neural network (CNN) across various stages or modules. This approach enhances both efficiency and accuracy by applying the same convolutional kernel with identical weights at different spatial locations. It can effectively reduce redundant computations and memory usage by sharing the weight parameters of convolutional networks across multiple components. This approach significantly improves computational efficiency, enhances the speed and accuracy of object detection, reduces the risk of overfitting, and boosts generalization performance. By maintaining consistent weights of convolutional kernels across the entire image, shared convolution more effectively extracts image features while preserving spatial information. This enhances the model’s generalization and representation abilities, enabling it to deliver superior performance in image recognition tasks.
Based on the above components, the group normalization detail-enhanced shared convolutional detection head (GDESCV head) is designed, as illustrated in
Figure 2c. The GN_Conv 1 × 1 module combines GroupNorm with a 1 × 1 DEConv. The DeGN_Conv 3 × 3 module uses weight-shared 3 × 3 DEConv layers with GroupNorm. The detection head includes two branches. The bounding box regression module (Conv_Box) and the classification module (Conv_Cls) share convolutional weights. Additionally, the scale module dynamically adjusts the resolution of the feature maps produced by Conv_Box. This helps improve detection performance across objects of different sizes and depths.
In summary, UTNet improves key modules based on YOLOv8. As shown in
Table 1, it adds RFCAConv and C2f_RFCA modules in the backbone to enhance underwater feature extraction. The neck uses the C2f_RFCA module to strengthen multi-scale feature fusion. The detection head is redesigned as the GDESCV head with GroupNorm, shared convolution, DEConv, and a scale layer. These changes improve training stability with small batches, enhance detail representation, reduce computational complexity, and increase detection efficiency.
2.2.3. Model Architecture
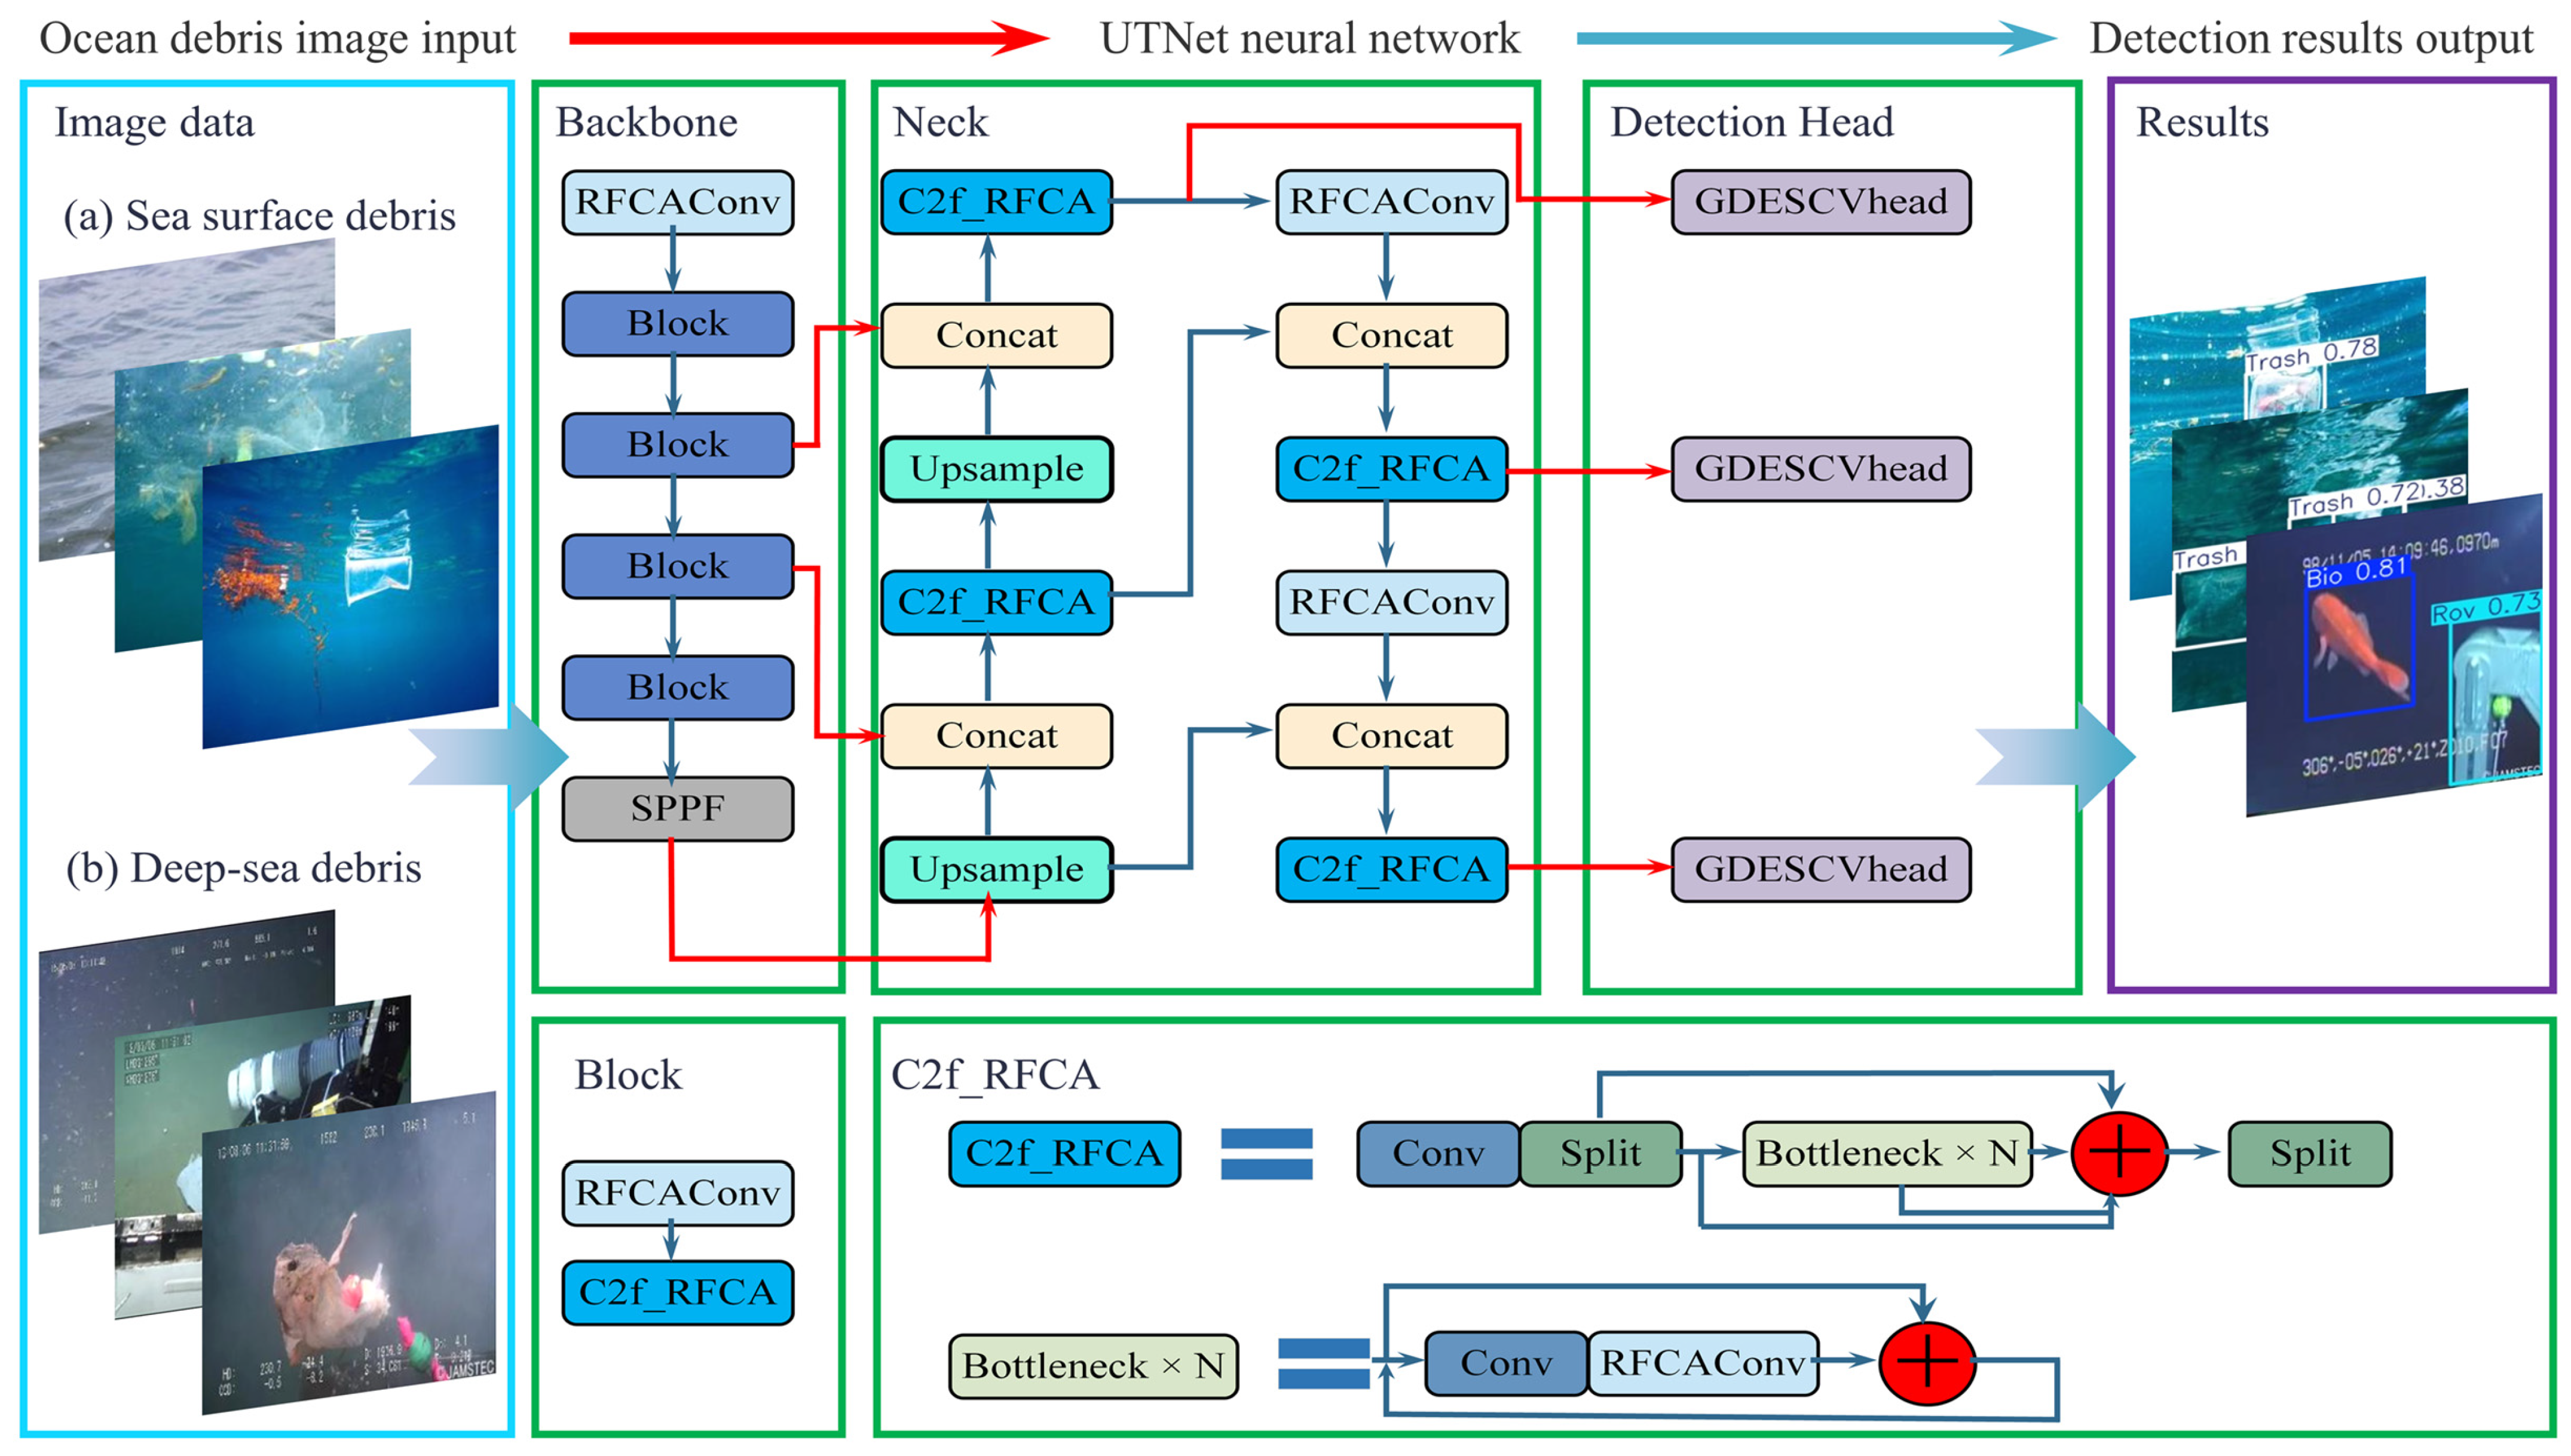
By integrating the proposed improvements discussed earlier, the overall architecture of the enhanced UTNet model is illustrated in
Figure 3.
Given the widespread applicability and flexibility of YOLO networks, this study focuses on improving the YOLOv8 architecture for underwater debris detection. YOLOv8 often struggles to balance detection accuracy with real-time performance under challenging underwater conditions, including rapid object motion and low image clarity. These challenges frequently lead to missed or false detections. To address these limitations, we propose UTNet, which retains the core structure of YOLOv8, including the backbone, neck, and detection head. Due to light scattering and absorption in underwater environments, the clarity of the detected videos and images is poor. This leads to a limited receptive field for the target debris. To address this, the backbone and neck networks employ the RFCAConv module. These modules integrate receptive-field attention (RFA) and coordinate attention convolution (CAConv). By redesigning the C2f and convolutional blocks, the model improves receptive field adaptability and feature recognition precision.
To meet the computational constraints of lightweight deployment devices, the detection head incorporates group normalization (GN), detail-enhanced convolution (DEConv), shared convolutional layers, and a scaling module. UTNet replaces the original YOLOv8 C2f modules in the backbone and neck with RFCAConv blocks. It also upgrades the detection head by introducing shared convolutions, group normalization, and adaptive scaling for input resolution. It processes images by first resizing them to 256 × 256. The resized images are then passed through the backbone to extract multi-scale features (P3, P4, P5). These features are fused by the neck and forwarded to the detection head. In the detection head, shared-weight 3 × 3 convolutional layers with GroupNorm ensure consistent feature representation. The output first passes through the 1 × 1 GroupNorm_Conv module and a shared-weight normalized 3 × 3 convolution module. It then goes through the bounding box regression module, Conv_Box, the classification module, Conv_Cls, and the scale layer for resolution adjustment. Finally, UTNet predicts the bounding boxes, confidence scores, and class labels for underwater debris detection.
Through these enhancements, optimized Lightweight UTNet achieves robust and real-time detection. It performs reliably even in underwater scenes with low clarity and fast motion, significantly improving accuracy while maintaining computational efficiency.
2.3. Loss Function Selection
The loss function consists of three components: bounding box loss (Box loss), distribution focal loss (DFL loss), and classification loss (Cls loss). Traditional intersection over union (IoU) metrics evaluate performance based only on the overlap between predicted and ground-truth bounding boxes. They ignore non-overlapping regions, which can lead to biased assessments.
To overcome this limitation, wise-IoU (WIoU) [
30] is proposed. By incorporating adaptive weighting factors, WIoU provides a more flexible framework for handling inter-class variability and mitigating class imbalance. Moreover, it exhibits scale-invariant properties, rendering it well suited for object detection tasks involving targets of diverse sizes and aspect ratios. The formulation is given as follows:
where
;
; and
,
denote the width and height of the minimum enclosing bounding box.
In many cases, the boundaries of detection targets are not exact values but probabilistic distributions. The distribution focal loss (DFL loss) [
31] is proposed to address class imbalance in object detection and enhance model performance on small objects and hard examples. DFL loss refines bounding box regression by modeling coordinates as probability distributions, thereby calibrating prediction errors. It converts predicted coordinates into a distribution and computes final values via weighted averaging, smoothing predictions and reducing bias. The formulation is defined as follows:
Given the discrete distribution property of the target coordinate
, the
can be achieved via a softmax layer
with
n + 1 units. Let the predicted probability distribution
be simplified as
:
As intuitively demonstrated by the formula, the distribution focal loss (DFL) aims to increase the probability of values near the target . Its global minimum solution (achieved when and are optimized) ensures that the regression target converges infinitely close to the ground-truth label .
Classification loss (Cls loss) is evaluated using the binary cross-entropy loss (BCE Loss) to assess the model’s classification performance. The formula is defined as:
where
is the number of samples,
is the number of classes,
denotes the ground-truth label for the
sample, and
represents the predicted probability that the
sample belongs to class
.
2.4. Evaluation Metrics
Bounding box positions and sizes are adjusted to fit debris objects. A detection is successful if the intersection over union (IoU) exceeds 0.5; otherwise, it is missed. The mean average precision at IoU = 0.5 (mAP50) measures average precision across all classes, with higher values indicating better recognition. Model performance is mainly evaluated by mAP50 and computational efficiency in GFlops. Precision reflects the closeness between the detection results and ground-truth, while recall quantifies the proportion of true positive samples correctly identified out of all actual positives. Their formulas are defined as follows:
where
(true positive) denotes the number of samples correctly predicted as positive,
(false positive) represents the number of samples incorrectly predicted as positive, and
refers to the number of samples erroneously predicted as negative.
As described above, the average precision (
AP) for each class is obtained by calculating the area under the precision–recall curve for that class. The mean average precision at IoU = 0.5 (mAP50) is derived by averaging the
AP values across all classes at an intersection over union (IoU) threshold of 0.5. The formula is defined as follows:
Confidence reflects the model’s certainty in its detections, with values ranging from 0 to 1. A confidence score approaching 1 correlates with higher prediction accuracy. The formula is defined as
where
represents the probability of an object’s presence within the bounding box, and
denotes the intersection over union (IoU) between the predicted and ground-truth bounding boxes.
2.5. Model Training
The UTNet model obtained in
Section 2.2 was trained on the partitioned training set of 7308 images described in
Section 2.1, with YOLOv8 serving as the baseline network. The differences in detection performance are presented in
Table 2, comparing the original YOLOv8 baseline network with UTNet variants that incorporate individual module improvements.
As shown in
Table 2, when the GDESCV head module is exclusively integrated into the baseline YOLOv8 model, a slight improvement in recall at 0.894 is observed, accompanied by modest increases in mAP50 at 0.935 and mAP50-95 at 0.719. Although a reduction in precision at 0.893 is recorded, the computational complexity is optimized to 6.5 GFlops, achieving the most efficient computation. This demonstrates that not only does GDESCV head enhance mAP50 performance; it also significantly reduces the costs of parameters and computations, which fully reflects its lightweight advantage.
When the RFCAConv module is used independently, detection performance improves significantly. Precision reaches 0.936, and recall increases to 0.888. The model also achieves higher mAP scores, with mAP50 at 0.940 and mAP50-95 at 0.728. Although there is a slight increase in computational complexity to 8.8 GFlops, the mAP gains confirm that RFCAConv is effective in enhancing marine debris recognition performance.
The highest recall value of 0.906 is achieved when RFCAConv is combined with the GDESCV head module. In this case, mAP50 reaches 0.941, and mAP50-95 is 0.723. Meanwhile, computational complexity decreases by 11%, dropping to 7.2 GFLOPs. This configuration achieves an optimal balance between accuracy and efficiency. These results confirm the improved model’s capacity for precise and efficient marine debris detection.
As shown in
Table 3, when only the GroupNorm module is used, high precision and recall are achieved, with precision at 0.93, recall at 0.87, mAP50 at 0.937, and mAP50-95 at 0.712. After the DEConv module is added, recall increases to 0.892, mAP50 rises to 0.939, and mAP50-95 improves to 0.714, indicating enhanced ability to capture complex features. It should be noted that the shared convolution in the detail-enhanced convolution introduces some randomness, leading to performance fluctuations in different training sessions. Following the addition of the scale module, precision drops to 0.893, but recall increases to 0.894, mAP50 decreases slightly to 0.935, and mAP50-95 rises to 0.719. This shows that the scale module improves multi-scale object detection. The scale module adjusts the scale of feature maps, enhancing the network’s sensitivity and accuracy in detecting small targets such as underwater marine debris. Overall, the combination of GroupNorm, DEConv, and scale modules achieves a good balance, resulting in significant improvements in detection performance.
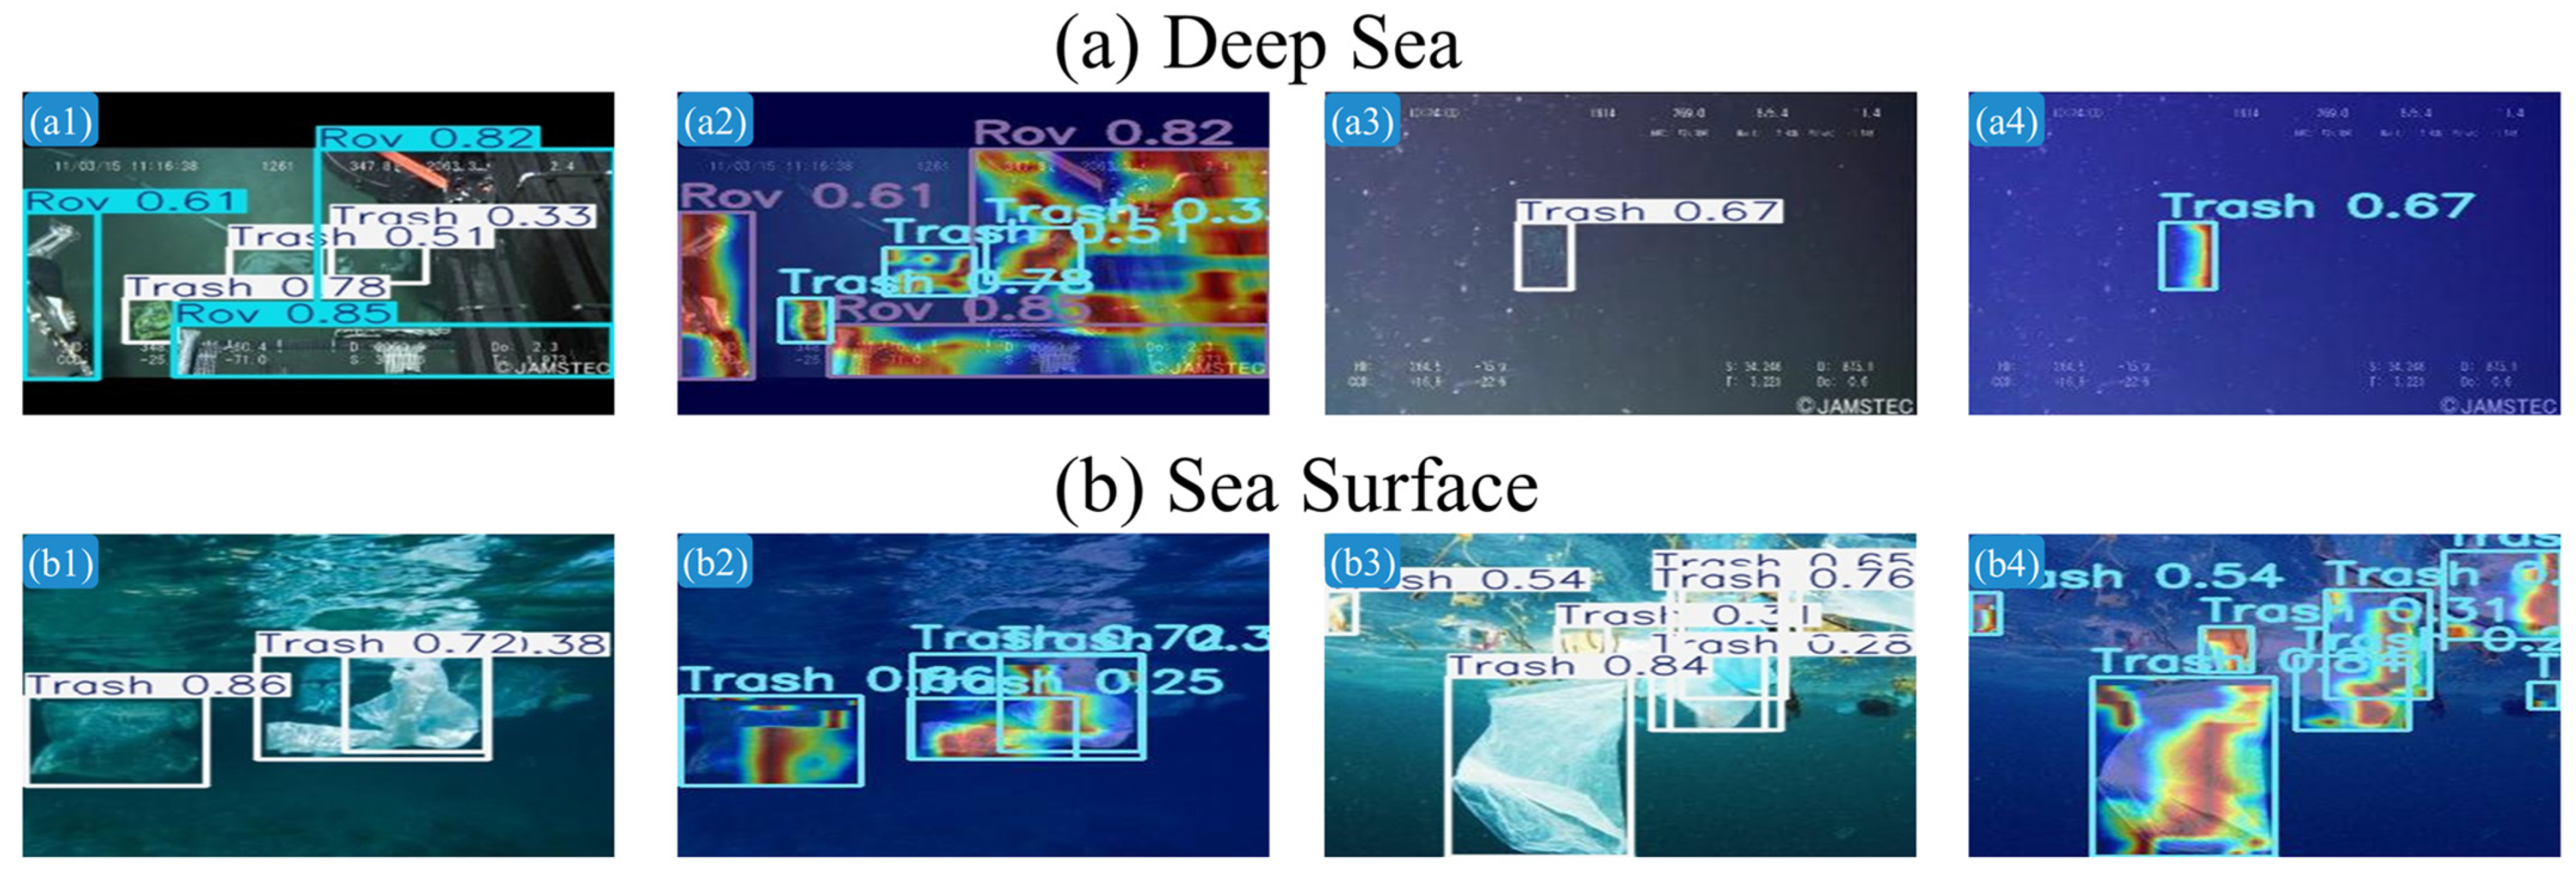
Additionally, the proposed UTNet model was analyzed using gradient-weighted class activation mapping [
32] to visualize its detection mechanism in both deep-sea and sea surface scenarios. As illustrated in
Figure 4, the heatmaps highlight the regions of high network attention, where red areas indicate stronger focus and darker hues correspond to higher detection confidence. The results demonstrate that marine debris is effectively distinguished by UTNet from surrounding environmental objects. Its detection mechanism exhibits broader spatial coverage and a more evenly distributed attention pattern. The detection results effectively encompass the majority of target regions. These results validate the model’s robustness and reliability in complex underwater environments.
3. Model Comparison
The originator of the two-stage detection network Faster R-CNN [
33], the single-stage detection SSD [
34], and the YOLO series (YOLOv5/v8/v11/v12) [
35] were selected as comparative detection models. Faster R-CNN uses ResNet50 [
36] as its backbone network, while SSD employs VGG16 [
37]. The evaluation metrics for these models-including mAP50, mAP50-95, parameters, and GFlops, are listed in
Table 4. GFlops represents the number of floating-point operations required per second, reflecting the computational cost; lower values indicate better suitability for deployment on embedded or edge devices [
38]. In addition, FPS is used to measure inference speed, with higher FPS indicating stronger real-time image processing capabilities, which is essential for real-time detection scenarios. Together, GFlops and FPS provide a comprehensive view of the trade-off between accuracy and efficiency across models.
As evident from
Table 4, lower precision compared to UTNet is exhibited by the six competing networks (Faster R-CNN, SSD, YOLOv8, and YOLOv5/v11/v12), while the lowest computational complexity (GFlops) and parameter count are achieved by YOLOv5. Faster R-CNN, SSD, and YOLOv8 are outperformed by UTNet in terms of mAP50, parameter efficiency, and computational efficiency. The UTNet model specifically reduces computational complexity to 7.2 GFlops and elevates the mAP50 metric to 0.941. This performance not only demonstrates its efficiency–accuracy balance but also surpasses six models in comparative evaluations.
Although the lowest GFlops are achieved by YOLOv5, YOLOv11, and YOLOv12, superior performance in mAP50 and mAP50-95 is demonstrated by UTNet, while competitive parameter efficiency is maintained. Through a moderate increase in computational complexity, significantly higher detection accuracy is achieved by UTNet, yielding the best overall performance for marine debris detection.
Notably, the FPS at 38.9 is exhibited by UTNet, primarily due to the added complexity from the RFCAConv module, which causes the inference time to be prolonged. However, this frame rate remains within the optimal range for human visual perception, ensuring real-time applicability in video-based marine debris monitoring. Therefore, the expectations for video detection are met by the performance of the proposed UTNet model. In addition, although UTNet’s GFlops is slightly higher than that of YOLOv5/11/12, the introduction of RFCAConv and the lightweight GDESCV head reduces the parameter count to 2.471 M, the lowest among all high-accuracy models. UTNet maintains high detection accuracy while effectively controlling computational complexity, reflecting an excellent balance among precision, complexity, and deployment cost.
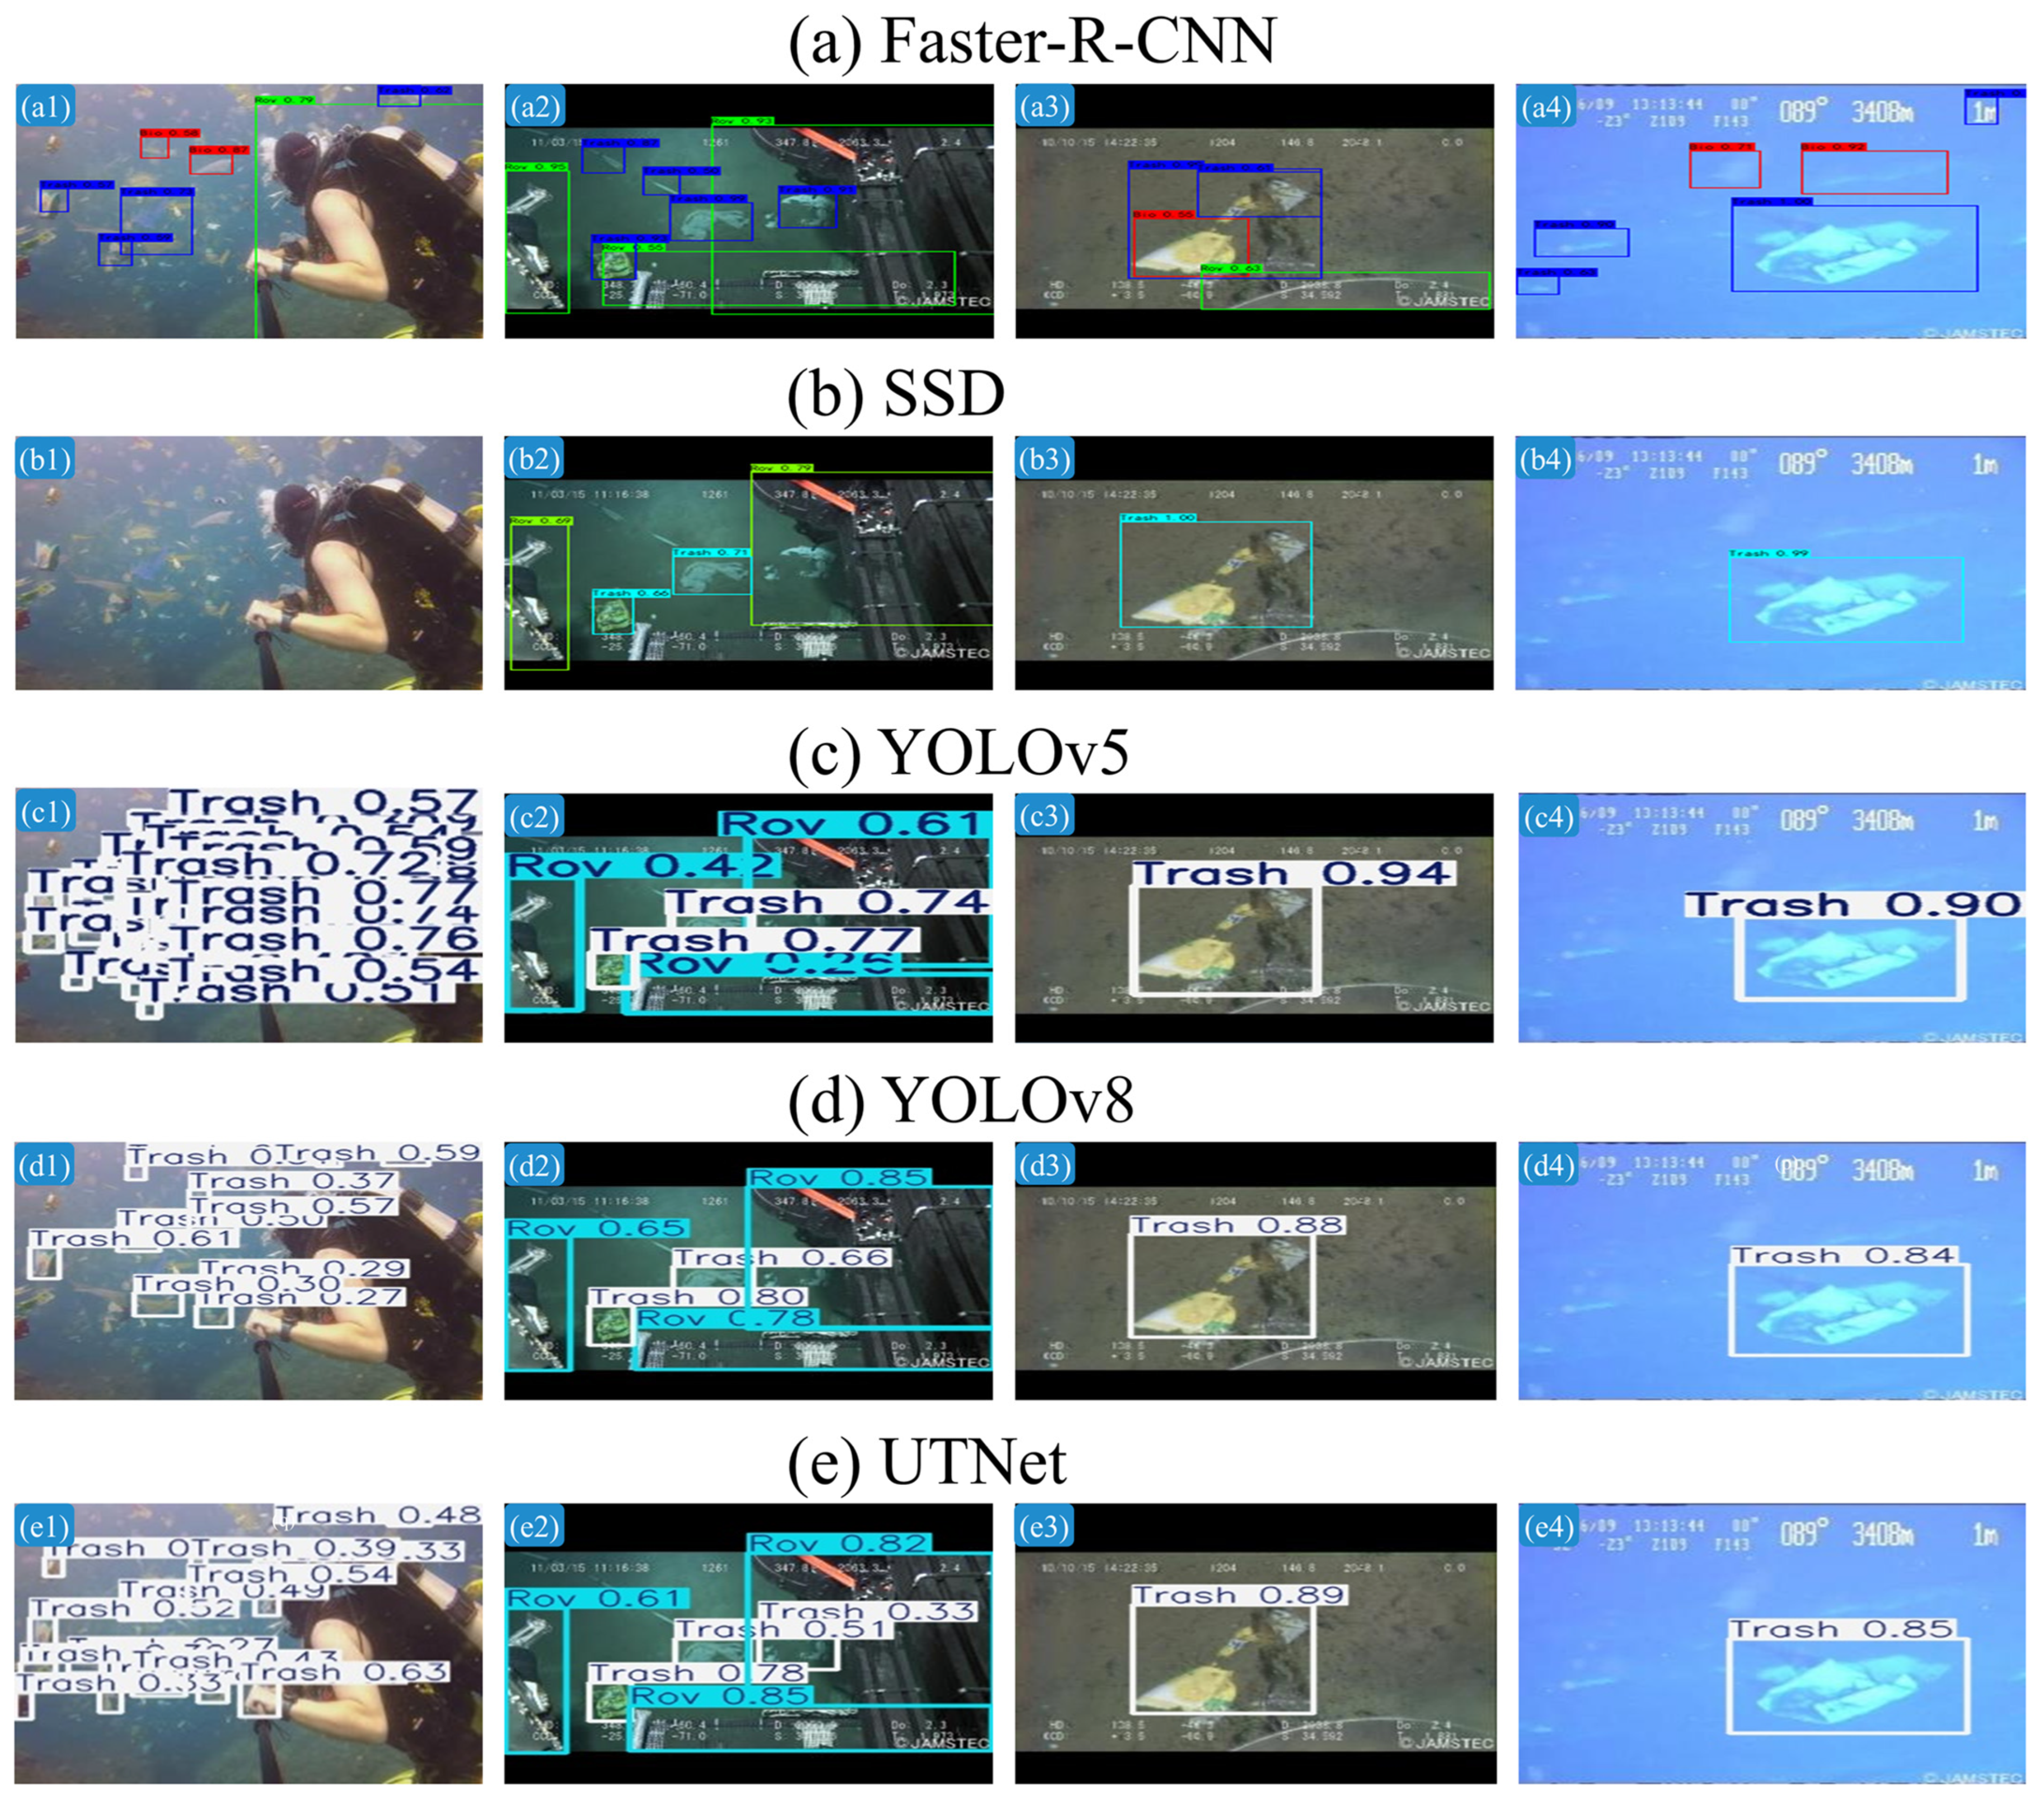
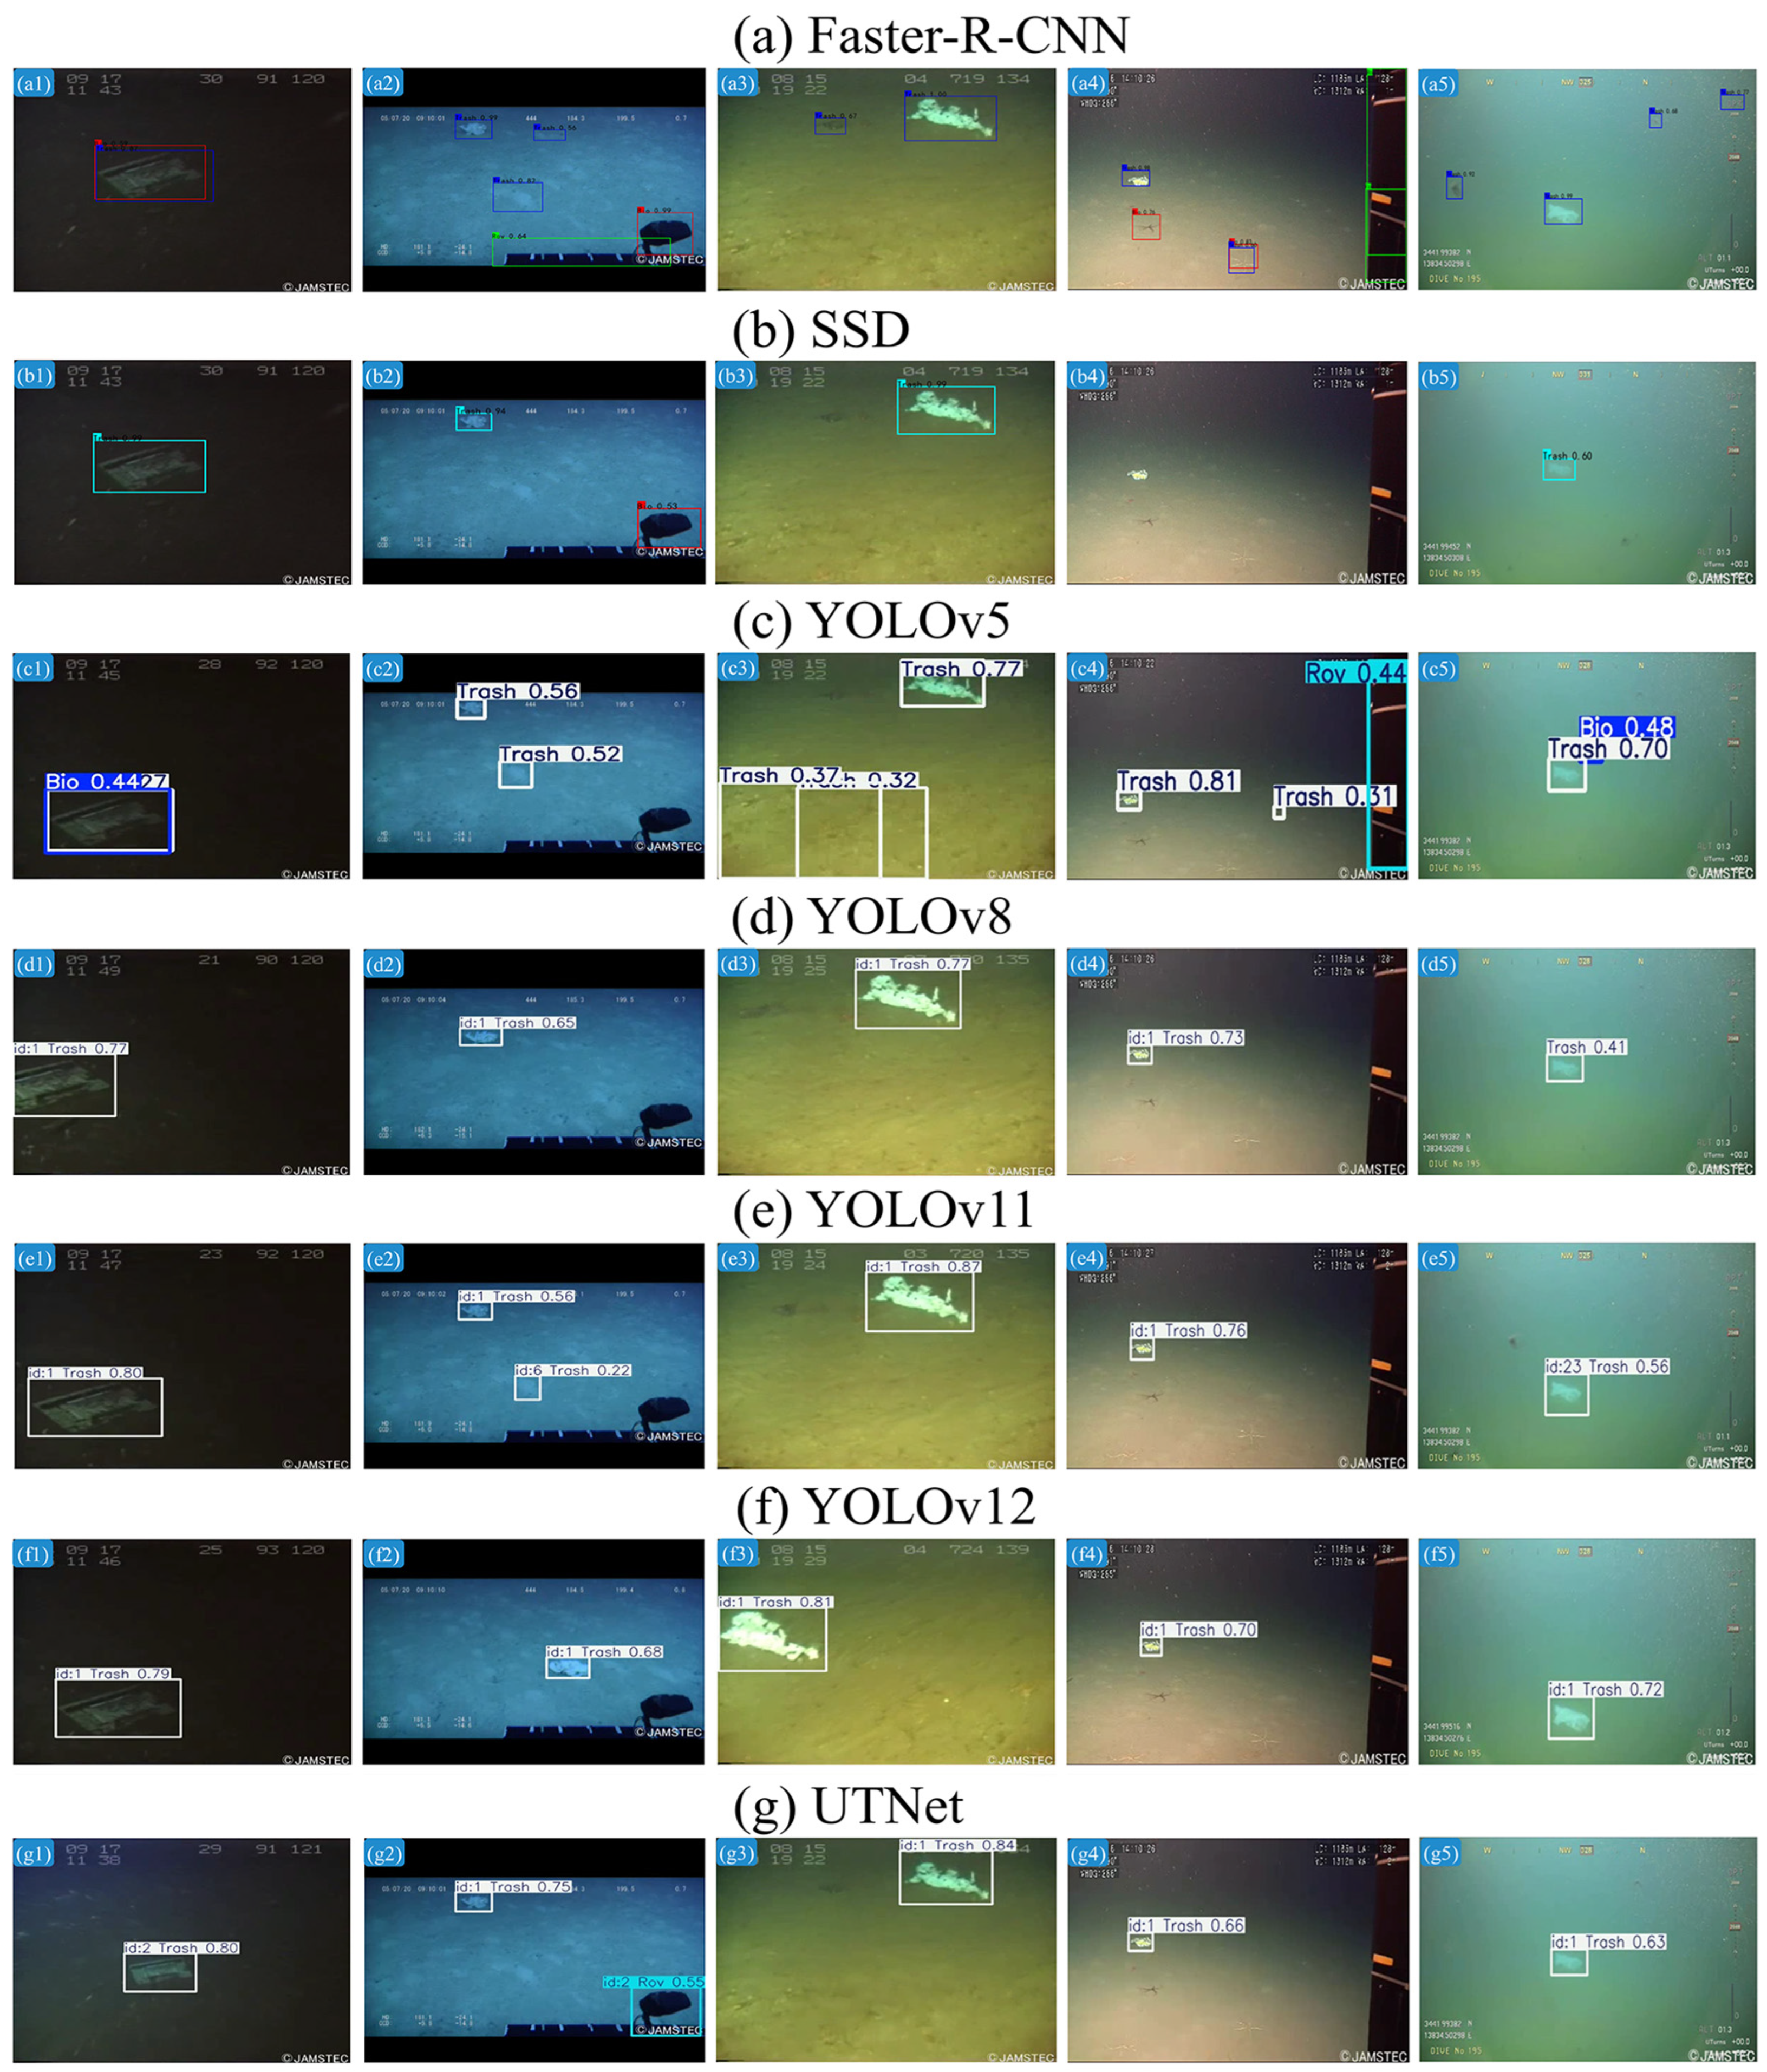
The experimental comparison evaluates UTNet, a model based on the YOLOv8 architecture, against several established detection frameworks. To ensure analytical consistency, variations within other YOLO series iterations were excluded. Four test images were randomly selected for prediction comparison across five models: Faster R-CNN, SSD, YOLOv5, YOLOv8, and UTNet.
As shown in
Figure 5, all four models displayed varying degrees of false and missed detections. SSD showed the most severe missed detections, particularly in scenes with dense floating debris. For example, in
Figure 5(b1), it failed to correctly identify marine debris. Faster R-CNN generated multiple redundant bounding boxes for single targets, indicating poor localization. YOLOv5 and YOLOv8 also produced suboptimal results. YOLOv5 struggled with false detections in shallow waters filled with floating debris (
Figure 5(c1)). The result of the detection indicates a failure to suppress background noise interference. YOLOv8 produced low confidence scores and missed many small debris targets. In contrast, UTNet achieved satisfactory performance, and provided more accurate category predictions and generated clearer, better-aligned bounding boxes.
Quantitative validation using mAP50 scores in
Table 5 supports the visual observations across three debris categories. UTNet achieved scores of 0.959 for Bio, 0.935 for ROV, and 0.935 for trash. It recorded the highest mAP50 for the trash category, outperforming all other models.
In the bio and trash categories, UTNet also surpassed other mainstream object detection models.
Compared with traditional detection models such as Faster R-CNN and SSD, UTNet shows a more significant advantage in underwater imagery. Faster R-CNN achieved relatively low mAP50 scores of 0.730, 0.680, and 0.700 for bio, ROV, and trash, respectively, indicating poor adaptability to complex underwater backgrounds. SSD performed better in ROV and trash categories with mAP50 of 0.850, but only reached 0.800 in the bio category, revealing limitations in biological object detection.
Within the YOLO series, YOLOv5 achieved the highest precision in the bio category at 0.944. YOLOv8 also performed well for bio with mAP50 at 0.947 but showed weaker performance for trash at only 0.914. YOLOv11 and YOLOv12 presented improvements in individual categories; however, the detection precision for trash was unstable, with YOLOv12 scoring only 0.706.
In contrast, UTNet delivered outstanding performance across all categories, demonstrating not only higher overall detection accuracy but also strong adaptability to challenging underwater conditions such as degraded image quality and complex environments.
These results highlight the practical advantages of UTNet in marine debris detection, which balances detection accuracy with computational efficiency. It reduces false alarms, improves the detection of small objects, and maintains real-time performance. These strengths make UTNet a reliable tool for marine environmental monitoring and pollution control. In summary, UTNet exhibits significant comprehensive advantages in multi-class underwater target detection, offering higher accuracy, improved stability, and broader application potential.
4. Real-Time Detection Across Varying Depths
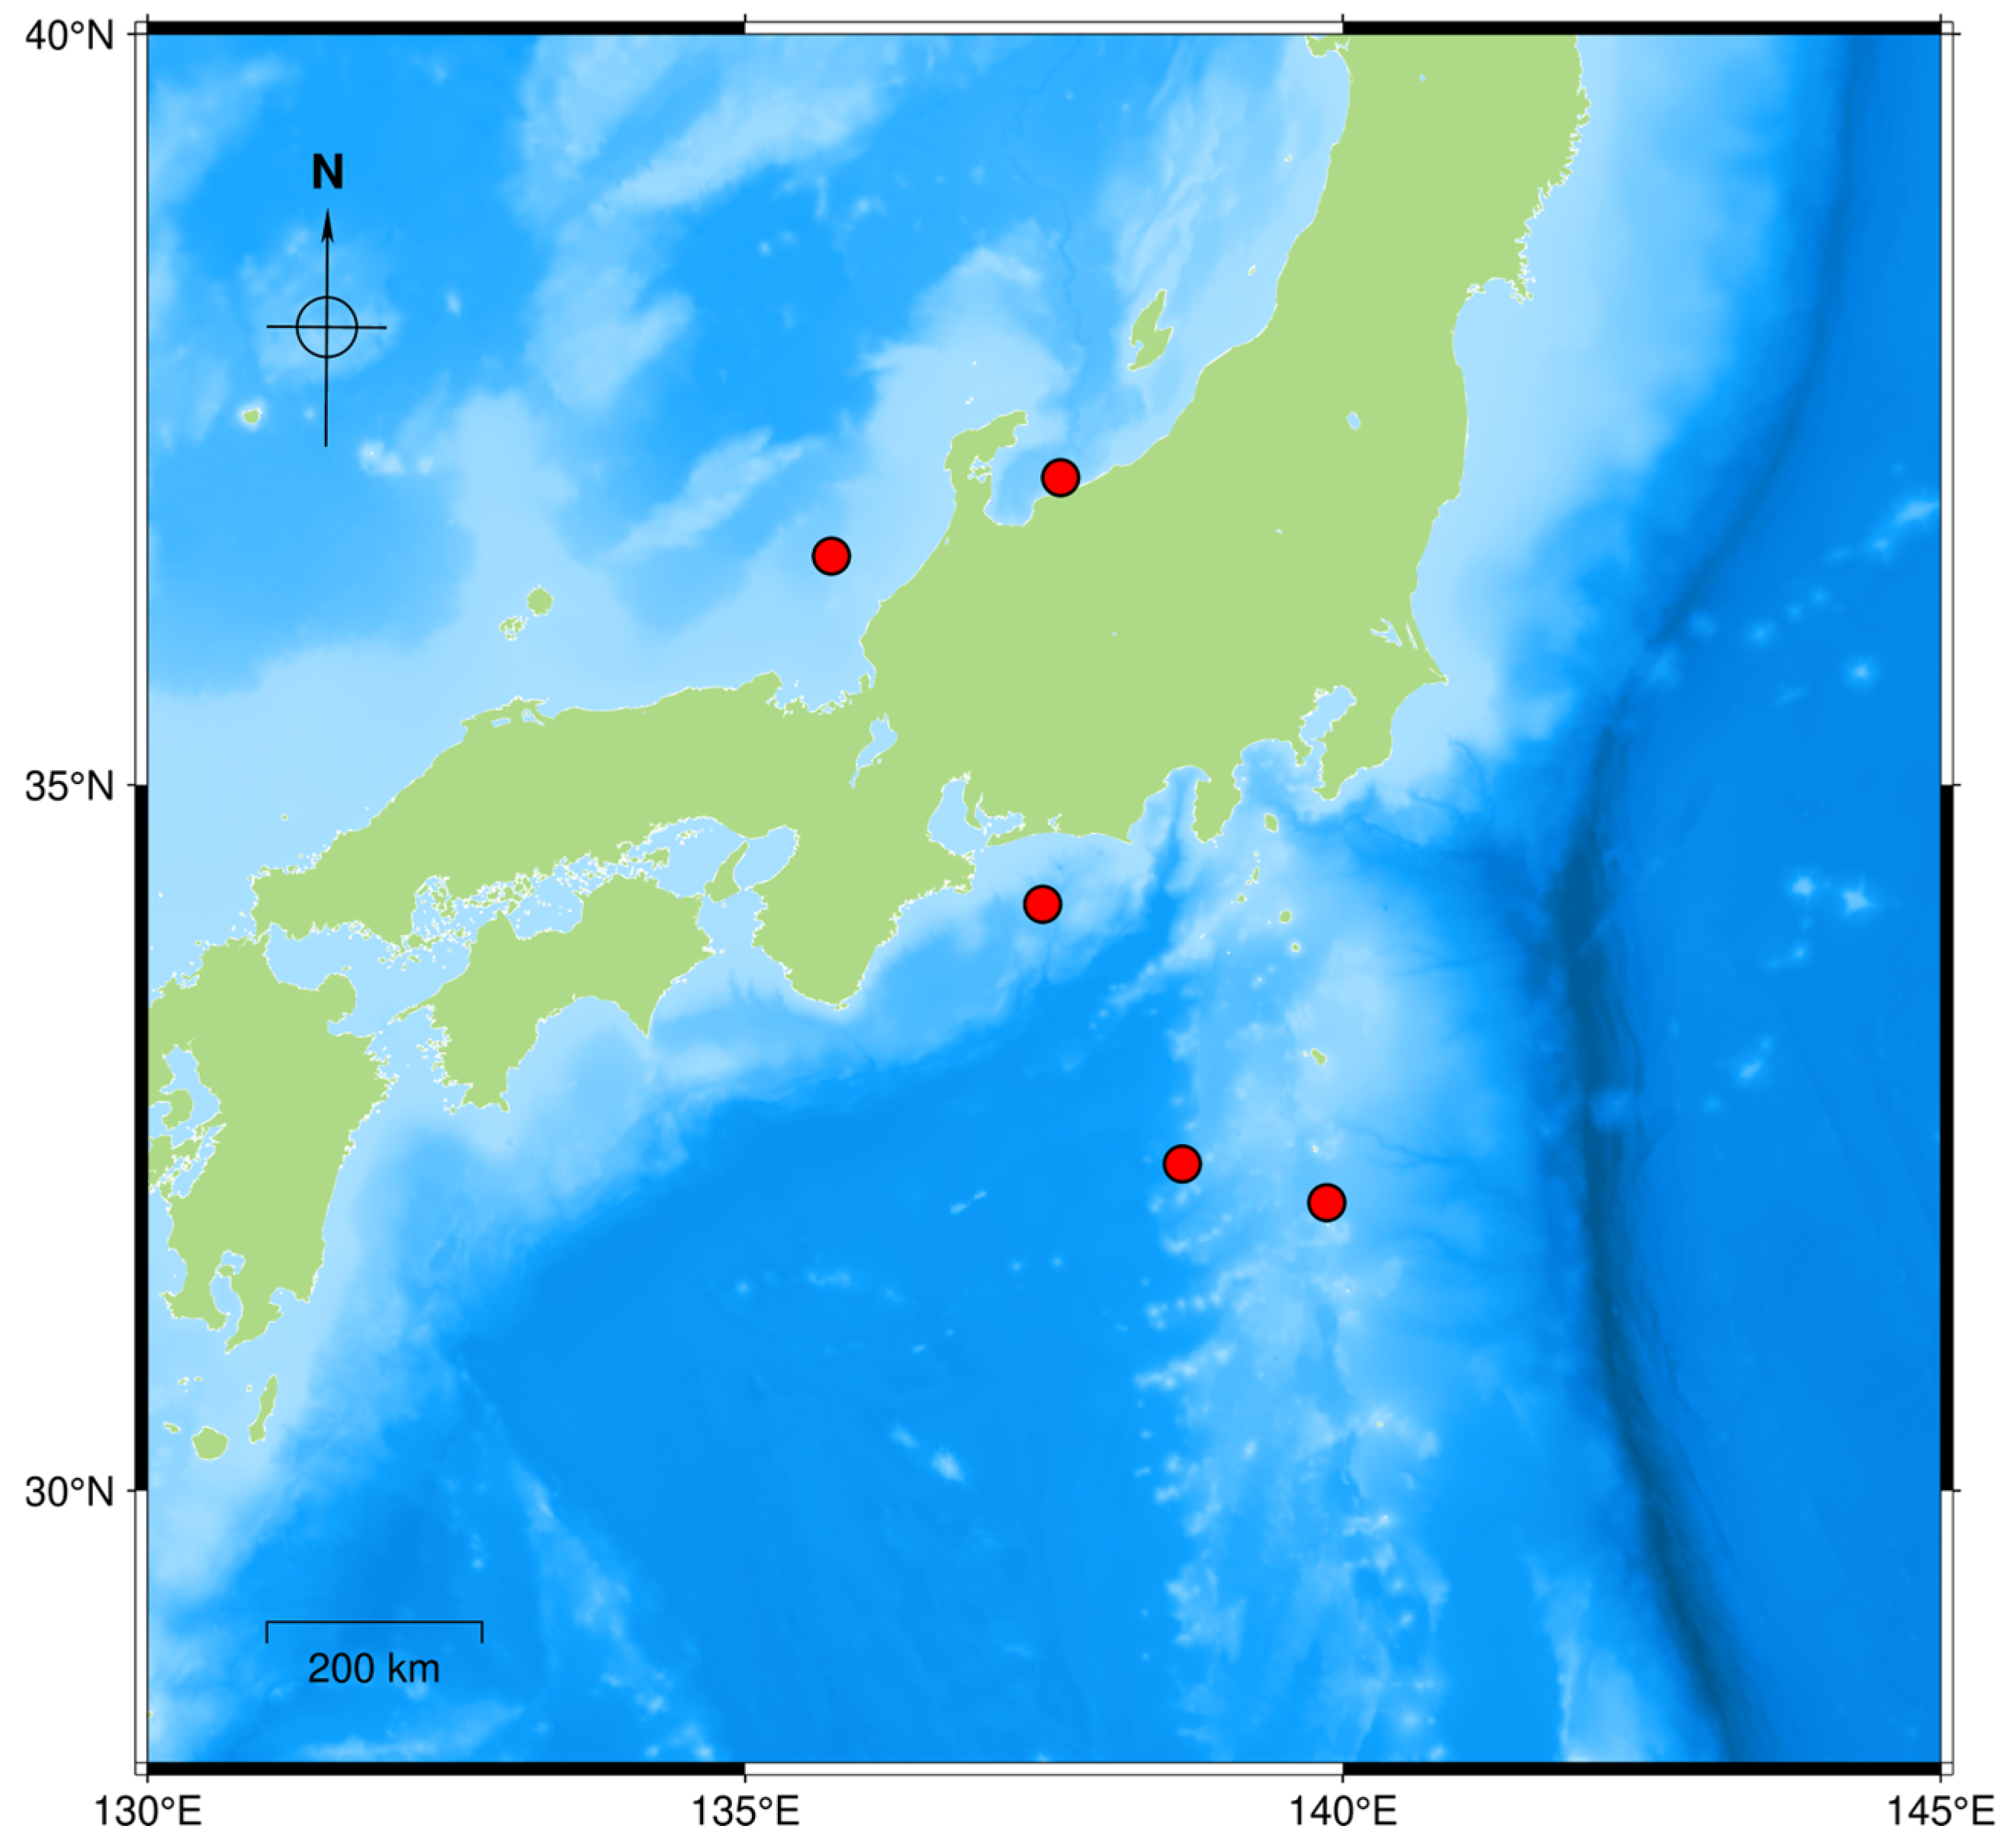
To validate whether the proposed UTNet can meet the requirements for real-time and accurate detection of marine debris across different depths, this chapter conducts rigorous testing on five underwater videos recorded in real-world marine debris detection scenarios at varying depths. Although the test videos were collected offline, the evaluation strictly simulates a real-time processing workflow by analyzing frames sequentially without frame buffering or post-processing optimization, fully replicating the data flow during underwater robotic operations. Since the training dataset UTD2 used here was constructed and extended based on parts of the J-EDI dataset, there is a certain correlation in data sources. To evaluate UTNet’s generalization capability, five publicly available videos from JAMSTEC’s J-EDI dataset were selected, representing realistic underwater robotic scenarios where a remotely operated vehicle (ROV) progressively detects deep-sea debris from long-range scanning to close-range verification. None of these videos were included in UTNet’s training and are completely independent of the UTD2 dataset. The sampling locations are marked as red dots in
Figure 6.
However, since the UTD2 dataset does not provide geographic location information for image acquisition, while the J-EDI dataset annotates each video with precise latitude and longitude, it is difficult to directly assess the geographic relationship between the training set and test videos. Nevertheless, by cross-referencing video IDs, mission backgrounds, and file sources, it has been confirmed that the test videos are not part of the UTD2 training set, thus maintaining the independence of the evaluation data.
Therefore, although geographic overlap cannot be completely ruled out, the test data remain separated from the training set in terms of mission paths and image content. Accordingly, the test results reasonably support the conclusion that UTNet possesses strong detection performance and generalization ability in unseen scenarios.
Although the test videos were collected offline, UTNet’s frame processing speed exceeds the typical human visual frame rate, demonstrating its real-time detection capability. During video testing, an observed frame rate (FPS) of approximately 35.6 was recorded. This frame rate is sufficient to ensure effective real-time detection of underwater marine debris, meeting the operational requirements of underwater robotic systems.
The performance characteristics of comparative models were analyzed through cases differing in depth in this study. As evidenced in
Figure 7(a1), debris at −93 m depth was misclassified into both trash and bio categories by Faster R-CNN, accompanied by elevated false detection across multi-depth scenarios. The results reveal inherent limitations in background interference resistance and depth adaptability. The detection results of SSD are systematically documented in
Figure 7b. A critical detection failure at −1311 m depth (
Figure 7(b4)) was observed, while its deployment feasibility was fundamentally restricted by excessive computational complexity and parametric demands, rendering it incompatible with a lightweight detection network.
YOLOv5’s performance irregularities are quantitatively demonstrated in
Figure 7c, where persistent false detection and biological debris classification confusion were attributed to insufficient background noise suppression, particularly under depth-specific conditions. Similar environmental susceptibility was identified in YOLOv11, as presented in
Figure 7(e2), with erroneous detections recorded at −919 m depth. Conversely,
Figure 7d–g exhibit that YOLOv8, YOLOv12, and UTNet showed consistently reliable debris discrimination across all depths. These results establish the technical dominance of YOLOv8/v12 and UTNet models in depth-variant marine debris monitoring systems with accuracy and a high level of confidence.
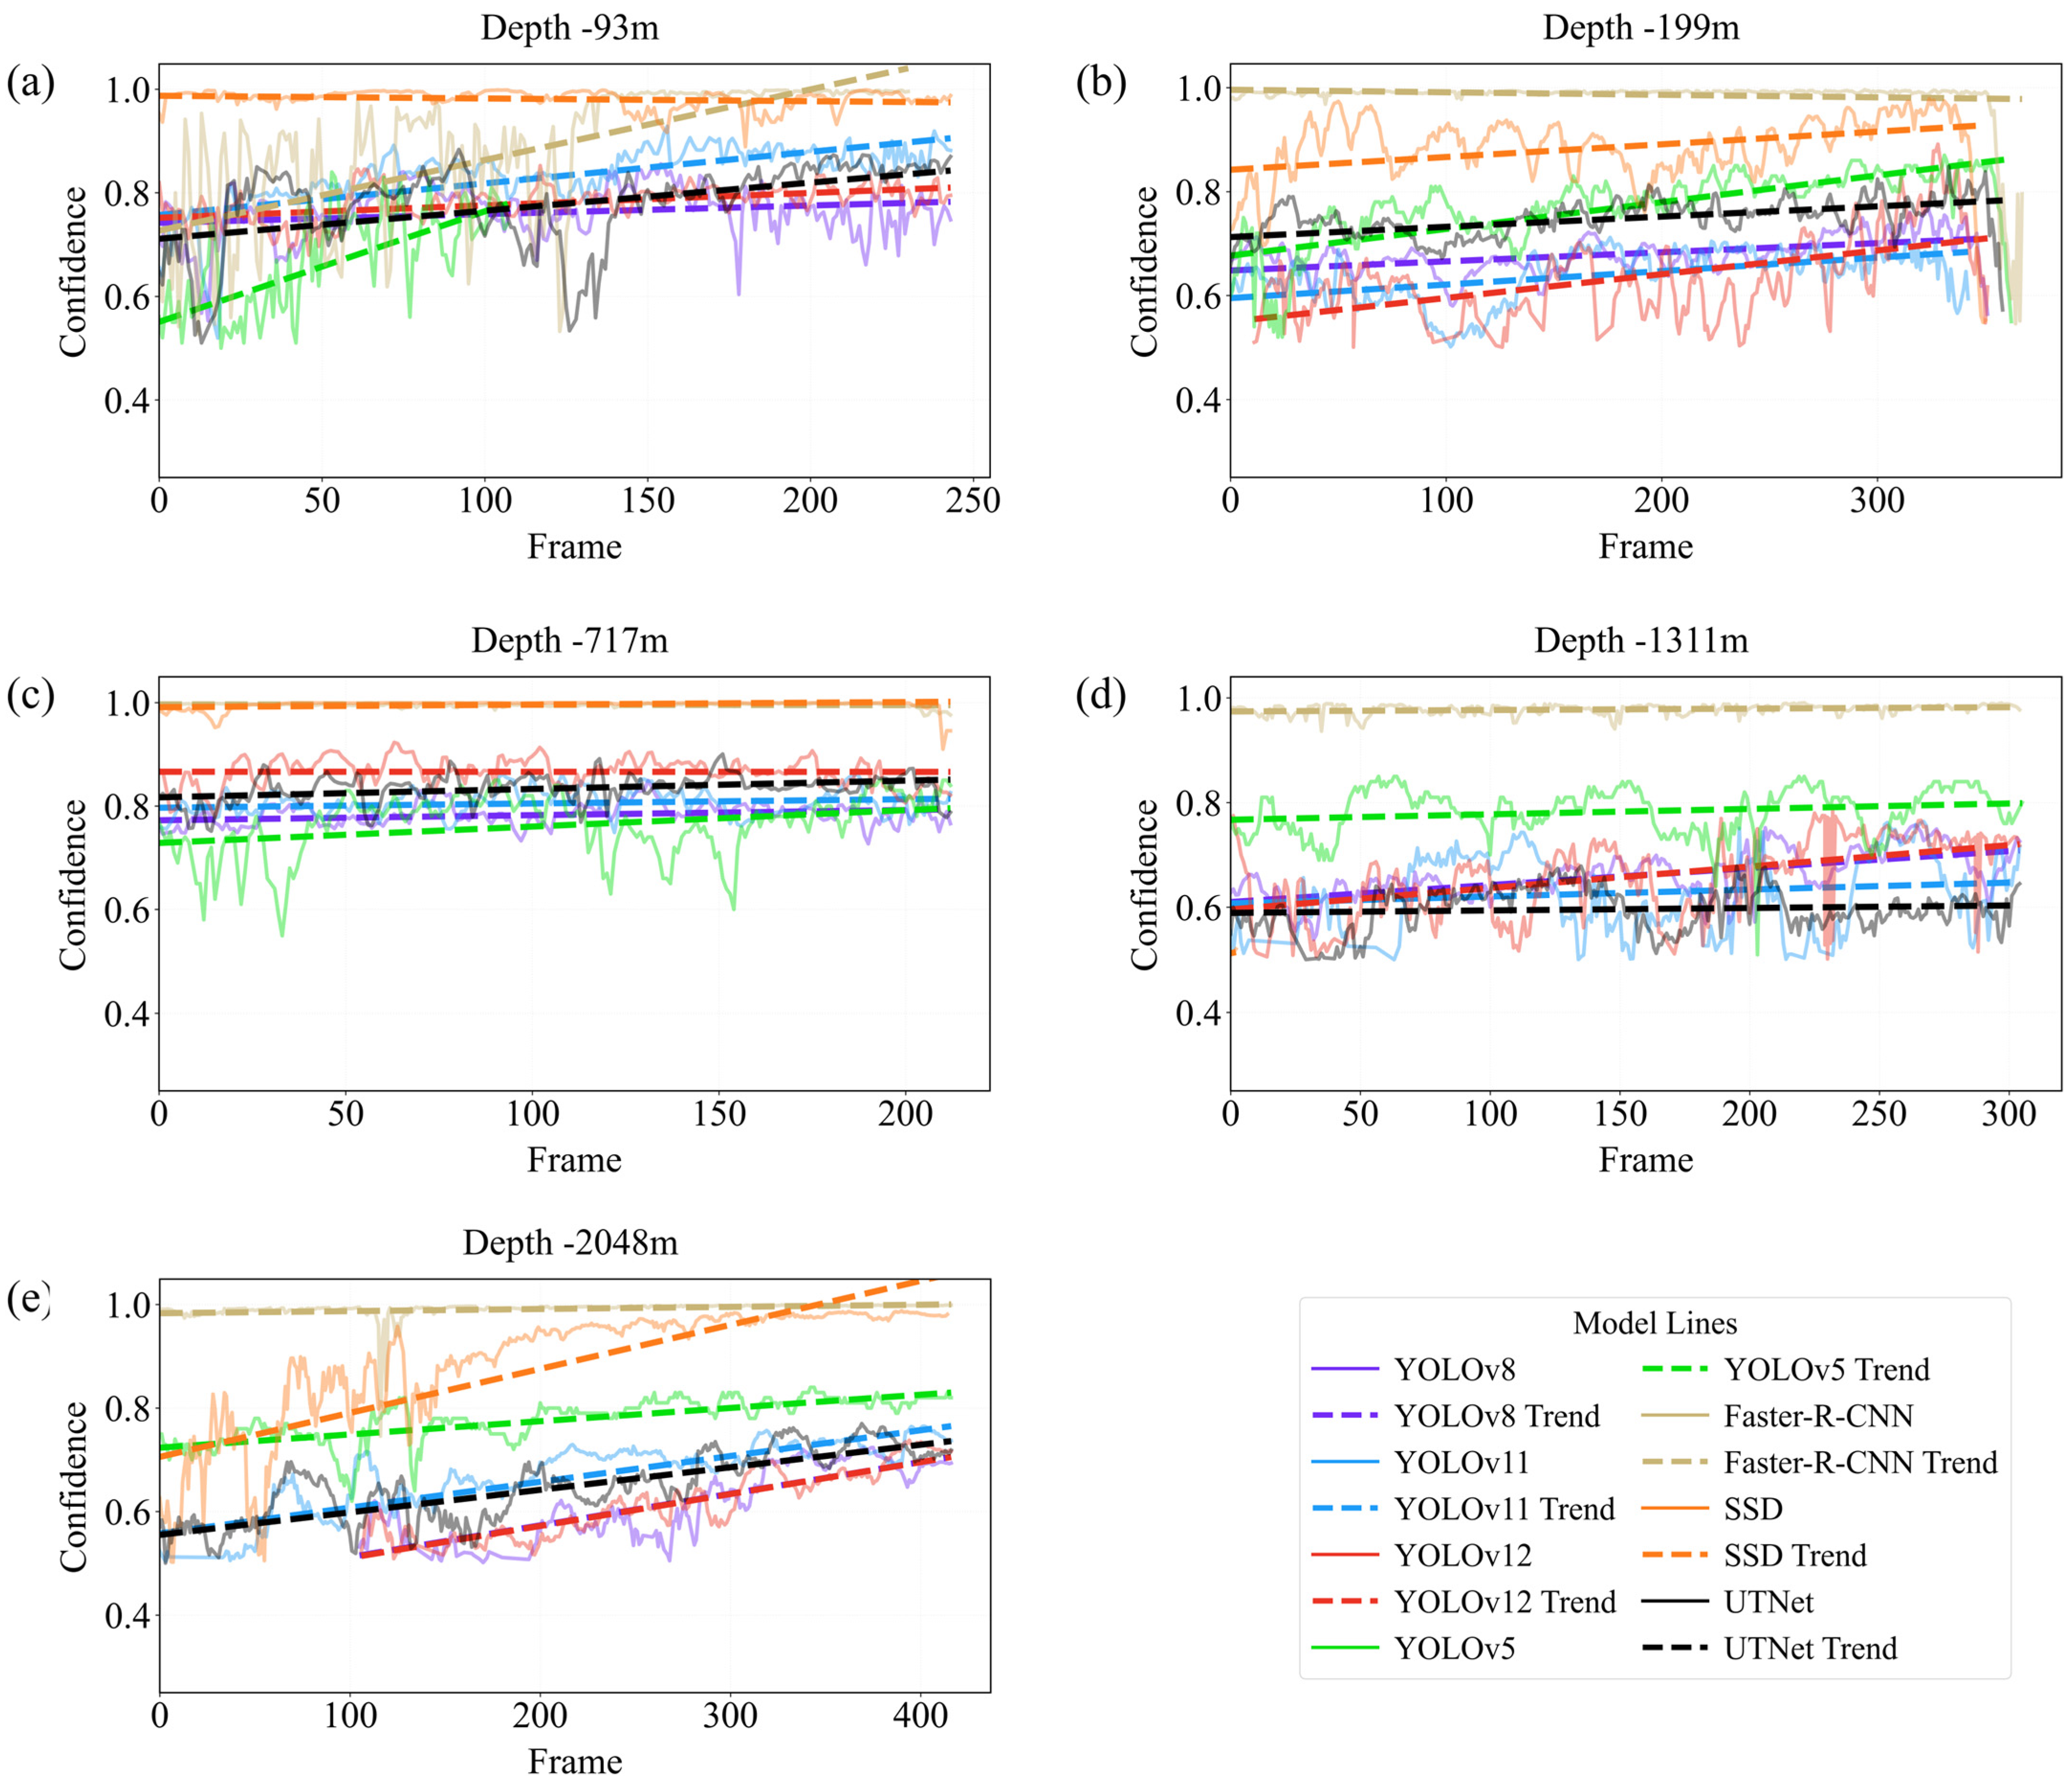
Furthermore, this study compares UTNet’s confidence in detecting the trash category confidence at various depths to other models, where the trash category confidence threshold is set to 0.5, and the model is considered to have successfully detected the object when the confidence exceeds 0.5.
As shown in
Figure 8, UTNet maintains confidence levels consistently above 0.5 during real-time video detection, indicating reliable performance in marine debris identification. The overall confidence trend exhibits an initial decline before gradually increasing. This pattern demonstrates a correlation with the changes in water depth.
Although Faster R-CNN and SSD reach the highest peak confidence values, UTNet demonstrates effective real-time detection for the trash category at a depth of −93 m, as shown in
Figure 8a. Although the detection performance exhibits notable variability under low-light conditions with poor debris–background contrast, UTNet demonstrates a consistent upward trend overall. It outperforms YOLOv12 and YOLOv8 while performing slightly below YOLOv11. In contrast, Faster R-CNN demonstrates large fluctuations with confidence decreasing as the ROV approaches subsurface targets.
At surface and subsurface depths (up to −199 m), UTNet demonstrates a relatively stable, gradually increasing trend in detection confidence for the trash category. Although this trend closely parallels that of SSD, UTNet exhibits a marginally lower overall performance. Notably, detection confidence remains consistently high level within these shallow depth ranges, with a modest upward trend. This is further evidenced in
Figure 8a,b, where UTNet maintains a stable and elevated confidence level across the corresponding depth intervals.
As is shown in
Figure 8c, confidence scores for trash detection are maintained by UTNet within the range of 0.751–0.901 at the depth of −717 m. The confidence was slightly lower than the 0.778–0.923 range achieved by YOLOv12 at the same depth but exhibited minimal fluctuations under chromatic distortion and object deformation. The robust feature extraction capabilities of UTNet in mid-depth waters are demonstrated through these observations. These detection confidence scores of YOLOv11 and YOLOv8 maintain intervals of 0.761–0.862 and 0.727–0.849, respectively, confirming UTNet’s superior stability compared to the YOLO series, as demonstrated in
Figure 8d,e.
In deeper environments, where mid-depth is −1311 m and the abyssal zone is at−2048 m, confidence scores are reduced to 0.5–0.8 due to object deformation, diminished illumination, and degraded clarity. Debris detection can be accomplished by SSD in only three frames at the depth of −1311 m, whereas UTNet is observed to sustain narrower confidence intervals and stable detection trends. Adaptability to extreme imaging conditions was validated by the stabilized confidence. At a depth of −2048 m, where the debris closely resembles the surrounding marine environment, UTNet achieves a peak detection confidence of 0.769 and demonstrates earlier target identification compared to YOLOv12 and YOLOv8.
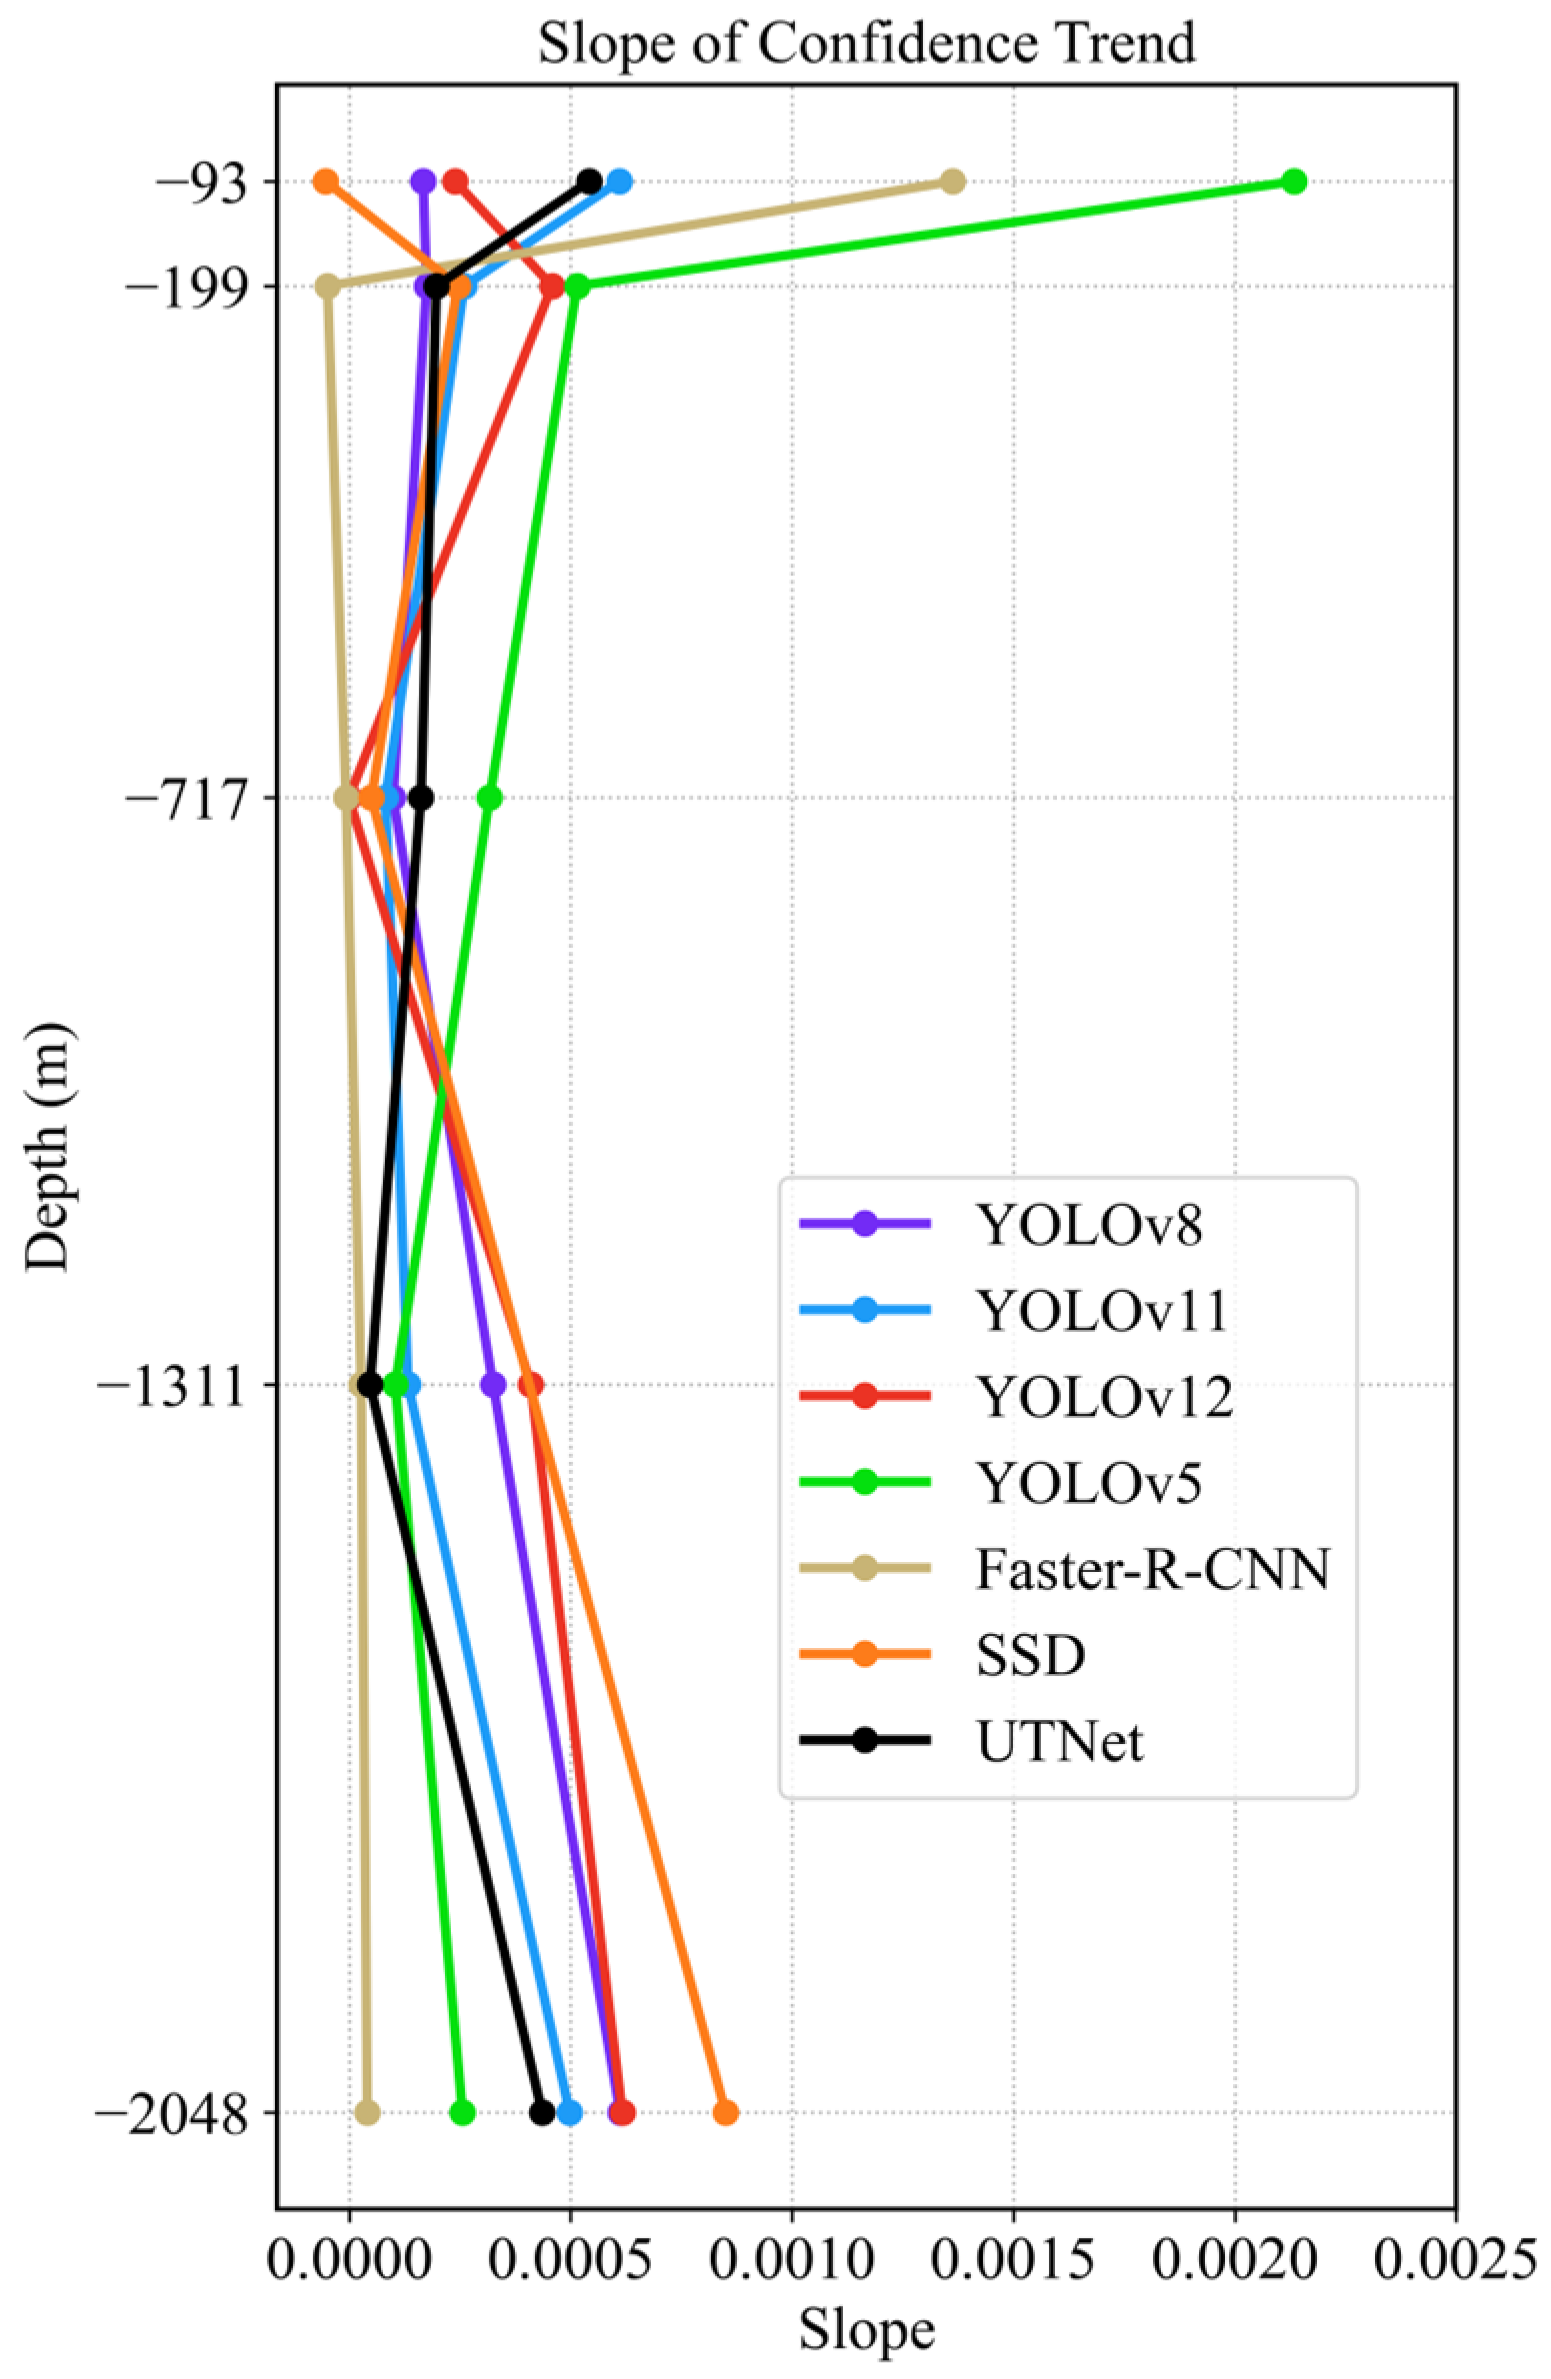
Meanwhile, the slope changes of confidence trend lines across depths for different models are shown in
Figure 9. UTNet demonstrates superior overall performance in cross-depth marine debris detection. Within the depth range of −93 m to −2048 m, the model shows a smooth and continuous slope sequence of 0.000542, 0.000197, 0.000162, 0.000047, and 0.000436, indicating optimal stability in confidence response. At the critical depth of −2048 m, UTNet’s slope of 0.000436 is 10.6 times that of Faster R-CNN’s 0.000041, confirming greater sensitivity under extreme conditions. The negative slope anomaly seen in YOLOv12 at −717 m and the detection failure of SSD at −1311 m are avoided by UTNet. The sharp decline in YOLOv5’s slope from 0.002134 at 93 m to 0.000515 at −199 m is also prevented. This moderate response at shallow depths combined with sustained sensitivity at deeper layers reflects UTNet’s balanced adaptability across depths, providing an effective solution for real-time marine debris detection.
In summary, UTNet’s real-time video detection performance across surface, subsurface, mid-depth, and abyssal zones validates its stability and generalization. With increasing depth, the performance of SSD, YOLOv8, YOLOv11, and YOLOv12 is significantly affected, exhibiting noticeable fluctuations in detection confidence across different water depths. This variability hinders their ability to ensure accurate and real-time detection under varying depth conditions. In contrast, UTNet demonstrates superior confidence levels and stability compared to YOLOv8, YOLOv11, and YOLOv12. It not only achieves high accuracy and reliability in surface marine environments but also maintains strong robustness and adaptability in deep-sea conditions.
Through systematic analysis of different depth confidence metrics and comparative evaluations in real-time video detection, UTNet’s capacity for accuracy and efficiency in marine debris detection is conclusively demonstrated. UTNet demonstrates significant improvements in precision maintenance and environmental adaptability, while Faster-R-CNN, SSD, and YOLOv5/v8/v11/v12 are obviously affected by depth. These experiments indicate that the critical requirements for high-precision lightweight detection can be successfully fulfilled by UTNet across varied marine environments.
5. Conclusions
This study developed a lightweight UTNet model for marine debris detection. It delivers efficient real-time performance across different ocean depths. Based on the YOLOv8 architecture and trained on the publicly available UTD2 Computer Vision Project dataset, UTNet incorporates several key improvements. These include receptive-field coordinate attention convolution (RFCAConv) to better capture irregular underwater objects and spatial features, wise-IoU (WIoU) loss to address small target detection and class imbalance through adaptive weighting, and a group normalization detail-enhanced shared convolutional visual head (GDESCV head) to reduce model size and computational load.
The optimized UTNet achieves an mAP50 of 0.941 and mAP50-95 of 0.723, with only 2.471 M parameters and 7.2 GFlops. It outperforms six other models, including Faster R-CNN, SSD, and YOLOv5/v8/v11/v12, in both accuracy and efficiency. To evaluate its adaptability to varying depths, UTNet was tested on five real underwater videos at depths ranging from −93 m to −2048 m. The results show that UTNet maintains stable and generally increasing confidence scores across these depths. It reaches peaks of 0.901 at the surface and 0.764 in the deep sea. Other models showed larger fluctuations. These models struggled with challenges such as color distortion, object deformation, and poor visibility caused by underwater conditions.
Despite difficulties including limited viewing angles, ROV motion, lighting interference, and suspended particles, UTNet consistently detects debris under difficult visual circumstances. While its confidence scores are not always the highest at every depth, UTNet demonstrates strong adaptability to varying scenes. This supports reliable debris detection and cleanup in diverse marine environments.
This work contributes to sustainable ocean protection by improving underwater robotics’ ability to detect plastic pollution with a lightweight, accurate, and depth-resilient solution.

