Abstract
A time-domain semi-empirical simulation model based on the wake oscillator approach is developed to investigate the coupled in-line (IL) and cross-flow (CF) vortex-induced vibration (VIV) of a flexible riser in uniform oscillatory flow. A novel nondimensionalization method is introduced by utilizing the dimensionless parameter , which effectively replicates the fundamental lift frequency caused by the complex vortex motion around the riser. The structural responses of the riser are described using the Euler–Bernoulli beam theory, and the van der Pol equations are used to calculate the fluid forces acting on the riser, which can replicate the nonlinear vortex dynamics. The coupled equations are discretized in both time and space with a finite difference method (FDM), enabling iterative computations of the VIV responses of the riser. A total of six cases are examined with four different Keulegan–Carpenter () numbers (i.e., , 56, 121, and 178) to investigate the VIV characteristics of small-scale and large-scale risers in uniform oscillatory flow. Key features such as intermittent VIV, amplitude modulation, and hysteresis, as well as the VIV development process, are analyzed in detail. The simulation results show good agreement with the experimental data, indicating that the proposed numerical model is able to reliably reproduce the riser VIV in uniform oscillatory flow. Overall, the VIV characteristics of the large-scale riser resemble those of the small-scale riser but exhibit higher vibration modes, stronger traveling wave features, and more complex energy transfer mechanisms.
1. Introduction
In the field of ocean engineering, slender cylindrical structures such as marine risers and subsea pipelines are exposed to a variety of complex environmental loads, including those caused by wind, waves, and currents. As offshore oil and gas exploration ventures into deeper waters, the length-to-diameter ratio () of these risers increases, making them more susceptible to the vortex-induced vibrations (VIV) in challenging marine environments. These risers serve as the sole connection between the underwater production systems and floating platforms, playing a crucial role in the extraction and transportation of the oil and gas resources. However, the VIV is the primary cause of the fatigue failures of the risers. Therefore, it is imperative to examine the VIV characteristics under complex flow conditions to ensure the safe operation of these structures.
In recent decades, extensive research has been conducted on the VIV of risers in steady flows [1,2,3,4,5,6,7,8]. However, Zhao [9] and Wu et al. [10] have pointed out that in the hydrodynamic analysis of long flexible risers, waves are often simplified to a uniform oscillatory flow for simulation purposes. As a result, there has been a growing focus among researchers on the VIV of cylinders in uniform oscillatory flow. Model tests have emerged as a crucial method for investigating the VIV and have been extensively used to study the riser VIV in uniform oscillatory flow [11,12,13,14,15]. Fu et al. [11] simulated the uniform oscillatory flow by imposing harmonic motions on a flexible cylinder in a towing tank. Unique response features such as amplitude modulation, mode transition, and hysteresis were observed. They proposed that the development of the VIV in oscillatory flow consisted of three distinct stages: building-up, lock-in, and dying-out. The experiments conducted by Ren et al. [13] concentrated on the characteristics of the VIV under higher modes, revealing significant differences in the VIV responses of flexible risers for varying Keulegan–Carpenter () numbers. Notably, under higher , alternate mode dominance and lock-in were particularly prominent. Additionally, Li et al. [15] further explored the VIV characteristics of flexible risers subjected to a combination of uniform flow and uniform oscillatory flow through model tests. The authors examined the effects of the amplitude and period of the oscillatory flow, along with the uniform flow velocity, on the features of the VIV response. They also discussed the relationships between the VIV and fatigue damage under different flow conditions.
Computational fluid dynamics (CFD) provides comprehensive flow field data, which are essential for understanding the mechanisms of fluid–structure interaction (FSI). As a result, it has been widely applied in the relevant research [9,16,17,18,19,20,21,22,23,24,25,26,27]. For example, Zhao et al. [17,18,21] performed both two-dimensional (2D) and three-dimensional (3D) CFD simulations to investigate the VIV response of a cylinder in uniform oscillatory flow. Their studies illuminated the vibration characteristics across various and Reynolds numbers (), contributing significant insights into the dynamic behaviors of the structures in complex flow conditions. Furthermore, Fu et al. [22] and Deng et al. [25] employed CFD simulations to examine the VIV of flexible cylinders in uniform oscillatory flow. They incorporated FSI effects into their research, highlighting the impact of the structural flexibility on the VIV responses. Notably, they found that the flexible cylinder displayed butterfly-shaped trajectories in uniform oscillatory flow. Additionally, Zhu et al. [26] numerically modeled the two-degree-of-freedom (2DOF) VIV of a cylinder in uniform oscillatory flow. Their study revealed that the streamwise dominant frequency was consistently aligned with the oscillatory flow frequency, while the transverse vibration frequency remained close to the natural frequency of the cylinder. The post-shedding vortex motion was categorized into four distinct regimes: split, merging, split and merging, and dissipative.
The semi-empirical models predict the VIV response using mathematical formulations derived from theoretical analyses. The time-domain hydrodynamic load model proposed by Thorsen [28] effectively predicts the cross-flow (CF) VIV response of a rigid cylinder in uniform oscillatory flow by optimizing the model parameters. This made it a valuable tool for practical engineering applications. Following this, Ulveseter [29] enhanced the model to account for both coupled in-line (IL) and CF VIV responses, as well as the isolated IL VIV response associated with free-spanning pipelines. Opinel and Srinil [30] pioneered the use of the wake oscillator model for uniform oscillatory flow. They put forward a nonlinear time-domain model based on the van der Pol wake oscillator to predict the 2DOF VIV of an elastically mounted circular cylinder. This model considered the time-dependent relative velocity and acceleration to derive the coupled fluid forces. Through model calibration, empirical coefficients, and expressions dependent on the number and mass ratio were introduced, creating a novel method for simulating the VIV in uniform oscillatory flow. Subsequently, several researchers continued to modify the wake oscillator models and other existing semi-empirical models to better fit the conditions of uniform oscillatory flow [31,32,33,34,35,36]. Regarding the large-scale risers, Yuan et al. [31] applied the riser properties reported in the experiments of Trim et al. [37] to predict the CF VIV in uniform oscillatory flow using the time-domain force-decomposition method. The findings indicated that under high numbers, large-scale risers were more susceptible to vibration mode jumping compared to small-scale risers, exhibiting more complex VIV characteristics.
Overall, extensive experimental and numerical investigations have been conducted on the VIV of marine risers in uniform oscillatory flow, providing valuable data for theoretical analyses and development of numerical models. However, existing semi-empirical models for predicting the VIV of flexible risers in such flow conditions primarily focused on the CF response, with insufficient attention given to the IL VIV. Research specifically targeting the VIV of large-scale risers in uniform oscillatory flow is still quite limited. Therefore, the present study aims to develop a time-domain semi-empirical model for predicting the VIV of risers in uniform oscillatory flow based on the wake oscillator model and to investigate the response characteristics of small-scale and large-scale risers undergoing the VIV in uniform oscillatory flow. In summary, the main contributions of this paper to the literature are as follows:
- (i)
- The newly developed time-domain semi-empirical model, which is based on the wake oscillator approach, can accurately predict the coupled IL and CF VIV of a flexible riser in uniform oscillatory flow. The model incorporates a nondimensional parameter , which is crucial in characterizing the fundamental lift force frequency as a result of the vortex motion in the uniform oscillatory flow.
- (ii)
- The proposed model is applicable to small-scale as well as large-scale risers, providing high computational accuracy and efficiency, making it suitable for practical engineering applications.
- (iii)
- The simulation results effectively replicate the key features of the VIV in uniform oscillatory flow, as observed in the previous experimental studies. These characteristics include intermittent VIV, the presence of higher harmonic frequency components, hysteresis phenomenon, and the development process of the VIV.
- (iv)
- The analysis shows that compared to the small-scale riser, the large-scale riser exhibits more complex VIV responses, featuring more pronounced traveling wave behaviors and more complicated energy transfer mechanisms.
The remainder of this paper is organized as follows: Section 2 introduces the newly developed time-domain semi-empirical model for the prediction of the riser VIV in uniform oscillatory flow. In Section 3, the reliability of the model is validated via comparisons with the existing experimental data. Section 4 presents simulation results for both small-scale and large-scale risers to further elucidate their VIV characteristics when exposed to uniform oscillatory flow. Finally, Section 5 summarizes the key findings derived from the present research.
2. Description of Time-Domain Semi-Empirical Model
This study examines the coupled IL and CF VIV characteristics of both small-scale and large-scale risers subjected to uniform oscillatory flow. The dynamics of the risers can be described by the Euler–Bernoulli beam theory. The utilization of the Euler–Bernoulli beam theory stems from the following considerations: (i) the risers are slender structures with large values; (ii) shear deformation and rotary inertia effects are negligible for high slenderness; and (iii) the primary dynamic behaviors are governed by bending and tension-dominated modes, consistent with the assumptions of the theory. The physical model of a flexible riser undergoing the VIV in uniform oscillatory flow is illustrated in Figure 1. The riser is defined by its initial length (L), outer diameter (D), and inner diameter (d). It is allowed to vibrate in both the IL and CF directions. Hinged boundary conditions are applied at both ends of the riser. A coordinate system is established with the origin O located at the center of the bottom end, where the X-, Y-, and Z-axes represent the IL, CF, and axial coordinates, respectively.
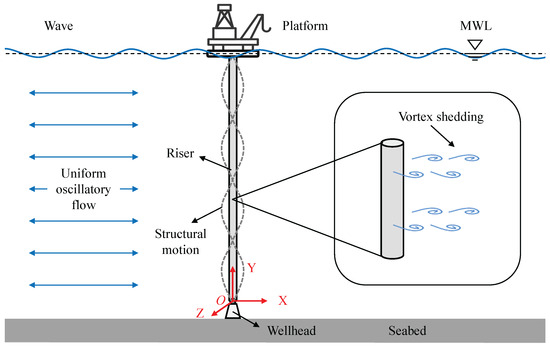
Figure 1.
Sketch of riser undergoing VIV subjected to uniform oscillatory flow.
In this paper, the uniform oscillatory flow is assumed to follow harmonic motion with respect to the time T. According to Fu et al. [11], Li et al. [15], Fu et al. [38] and Yin et al. [39], the velocity U as a function of T for the uniform oscillatory flow is defined as
In this context, the angular frequency of the oscillatory flow is expressed as , where and denote the period and frequency of the uniform oscillatory flow, respectively. The maximum velocity of the uniform oscillatory flow is given by , where stands for the amplitude of the uniform oscillatory flow. Consequently, the number can be derived as follows:
The reduced velocity is one of the most critical parameters in the VIV analysis. For uniform oscillatory flow, it is given by
where represents the natural frequency of the nth mode of the riser.
For uniform oscillatory flow, the vortex dynamics around the riser is highly dependent on the number. An important dimensionless parameter is adopted in the proposed time-domain semi-empirical model in order to accurately quantify the fundamental lift force frequency as a result of the intricate vortex motion in the uniform oscillatory flow, and it is expressed as [30]
In Equation (4), represents the fundamental or dominant frequency of lift force, while indicates the number of oscillations in the lift force per flow cycle [40]. According to Sumer and Fredsøe [40] and Blevins [41], the vortex shedding patterns and the corresponding values of the dimensionless parameter (or ) for various ranges of the numbers are summarized in Table 1. As shown in the table, the vortex shedding patterns and vortex motion characteristics within the different number ranges are obtained from experimental observations. Interested readers may refer to Sumer and Fredsøe [40] for more detailed information about the vortex motions in oscillatory flow. In the meanwhile, in Equation (4) is determined by identifying the dominant frequency of the power spectral density of the lift force, as detailed in [40].

Table 1.
Vortex shedding patterns and corresponding values in different ranges [40,41].
2.1. Governing Equations
In the analysis of an infinitesimally small element with length , as illustrated in Figure 2a, we perform a force analysis for this very element, focusing on the X-direction as an example. The element experiences several forces: the damping force , the inertia force , the external fluid force , the shear force Q, the axial tension , and the bending moment M. Under these conditions, the element must satisfy both force and moment equilibrium. Based on this analysis, the governing equations for the vibrations of the riser in the IL and CF directions can be derived:
Herein, m stands for the total mass per unit length, which consists of the structural mass and the added mass . The term is the bending stiffness, with E being the Young’s Modulus and I being the moment of inertia of the riser. A dot denotes partial differentiation with respect to T, while a prime indicates partial differentiation with respect to Z. The symbols and refer to the fouth-order partial derivatives of X and Y with respect to Z, respectively. The damping coefficient c includes both the structural damping and the fluid damping . The relevant expressions are provided below:
In the equation above, represents the damping ratio of the riser, is the mean drag coefficient (taken as 1.2 [42]), and denotes the density of the fluid.
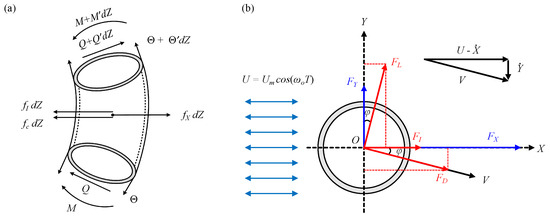
Figure 2.
(a) Force analysis of riser element and (b) two-dimensional projection of fluid forces exerted on riser.
In Equation (5), is the axially variable tension. As reported in Feng et al. [43], it includes the initial pretension , as well as the additional tension caused by the structural bending deformation, expressed as follows:
where is the cross-sectional area of the riser, and S represents its deformed length, which can be calculated by
2.2. Fluid Forces and Wake Oscillator Formulations
Wang et al. [44] proposed that the vibration of the riser causes the direction of the relative velocity V between the structure and the ambient fluid to deviate from the direction of the incoming flow velocity U. As a result, the IL fluid force does not align with the drag force , and the CF fluid force does not coincide with the lift force . As shown in Figure 2b, we consider a cross section of the riser located at the axial position Z. Let denote the angle between V and U; therefore, the fluid forces can be expressed as
In Equation (9), the expressions of , , and the inertia force are
In these expressions, , , , and represent the drag coefficient, lift coefficient, Morison drag coefficient, and inertia coefficient, respectively [30]. The formulas for and are provided in the following equation:
where and stand for the drag and lift coefficients of a stationary riser, which are typically assigned values of 0.2 and 0.3, respectively [45]. The variables p and q denote the nondimensional coefficients corresponding to the drag and lift oscillators, respectively.
Based on the 2D projection of the fluid forces acting on the riser in Figure 2b, the angle between V and U can be described using the trigonometric relationships given by
Substituting Equations (10)–(12) into Equation (9) allows us to determine the total IL and CF fluid forces.
In this paper, the van der Pol equations are adopted to describe the dynamics of the wake, as demonstrated in Equation (13) [46].
Here, and represent the coupling coefficients that quantify the interaction forces between the fluid and the structure, with respective values of 12 and 38 [30,47]. The parameters and denote the empirical factors in the nonlinear terms, both set to 0.3 in steady flow [48]. Unlike the steady flow cases, is a function of the number in uniform oscillatory flow.
2.3. Numerical Schemes
Substituting Equation (13) into Equation (5) results in a set of coupled equations that combines the governing equations with the wake oscillator equations, as shown in Equation (14). To simplify the analysis, we introduce the nondimensional time defined as , along with the nondimensional displacements and and the dimensionless axial position . Bringing t, x, y, z, and Equation (4) into Equation (14), the nondimensional coupled equations for the riser and the wake oscillator model can be obtained.
In the present research, a finite difference method (FDM) is employed to discretize the nondimensional coupled equations in both time and space. In the temporal domain, the dimensionless time t is divided into N intervals with a total simulation time of and a time-step size of [49]. Meanwhile, in the spatial domain, the nondimensional axial length of the riser is discretized into M segments, using a spatial step size of [49]. Finally, the boundary and initial conditions are applied to the discretized system and computations are performed to obtain the VIV responses of the riser at various time instants and axial locations along the riser. More details about the numerical solution of the governing equations can be found in Appendix A.
3. Problem Description and Model Validation
3.1. Problem Description
Ren et al. [12,13] experimentally investigated the VIV characteristics of a flexible cylinder under uniform oscillatory flow in the ocean basin at Shanghai Jiao Tong University. Sketches of the experimental apparatus and the instrumentation of the fiber Bragg grating (FBG) strain sensors along the flexible cylinder model are presented in Figure 3. As shown in Figure 3a, both ends of the flexible cylinder were connected to the supporting frame mounted on two horizontal tracks and the supporting frame underwent periodic motion to simulate the uniform oscillatory flow around the cylinder. In their experiments, as depicted in Figure 3b, four sets of FBG strain sensors were glued to the surface of the flexible cylinder to measure the IL and CF strains with eleven and seven measurement points along the model, respectively.
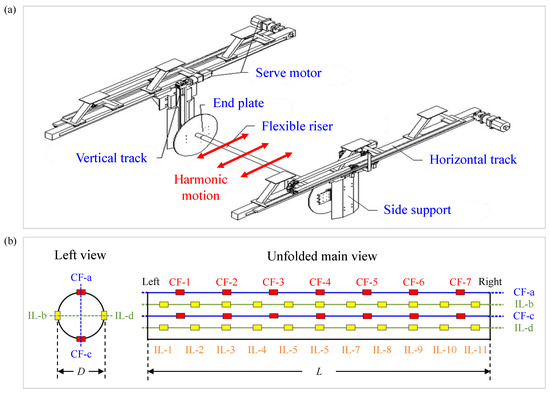
Figure 3.
(a) Sketch of experimental apparatus and (b) instrumentation of fiber Bragg grating (FBG) strain sensors along a flexible cylinder model [12,13].
After confirming that the selected temporal and spatial step sizes meet the convergence criteria, the proposed time-domain semi-empirical model and the adopted numerical schemes are validated via comparison with the experimental data reported in Ren et al. [12], followed by a further analysis of the results. Since the VIV observed in this experimental campaign were predominantly governed by the first mode, an additional dataset from Ren et al. [13] is chosen to investigate the VIV response characteristics under higher vibration mode. One may refer to Table 2 for the physical properties of the small-scale riser.

Table 2.
Properties of riser model in experimental tests [12,13,37].
Small-scale risers are typically used in model tests under laboratory conditions with the aim of revealing some of the important VIV response characteristics through scaled physical models. These models generally possess small length-to-diameter ratios (), typically of the order of several hundred. In contrast, large-scale risers usually have larger values, ranging from 1000 to 4000 [50], which are of the same order of magnitude as those of the actual marine risers. Experimental investigations of the VIV of large-scale risers are used to unveil the unique response features associated with highly flexible structures, verify the engineering designs, and assess the fatigue characteristics due to the VIV. It is clear that small-scale riser models typically possess high natural frequencies due to their relatively short lengths [31]. In the study of Ren et al. [13], a 4 m long riser model was found to have a first mode natural frequency of 1.90 Hz and a second mode natural frequency of 4.08 Hz when immersed in water, resulting in an obvious gap between the natural frequencies of the adjacent modes. The model used in Ren et al. [12] displayed similar characteristics. Consequently, under most uniform oscillatory flow conditions, only the first or the second mode is excited. In contrast, the natural frequencies of actual marine risers are primarily influenced by the tension, which leads to smaller frequency intervals between the adjacent modes and a greater likelihood of exciting higher modes. Therefore, this study employs a large-scale riser model from Trim et al. [37], which more closely resembles the real-world scenarios. The properties of the large-scale model are summarized in Table 2. Lie and Kaasen [51] suggested that a riser could be approximated as a tensioned beam with pinned ends, meaning that it had negligible bending moment. This approximation allows for the analytical estimation of the riser’s natural frequencies. According to Weaver et al. [52] and Wang and Xiao [53], the nth natural frequency of such a tensioned beam might be expressed as a function of the natural frequencies of a tensioned string and a non-tensioned beam.
where n denotes the mode number, and represent the natural frequencies of a tensioned string with zero bending stiffness and a non-tensioned beam, respectively. The natural frequencies of the first ten vibration modes of the large-scale riser are calculated based on Equation (15), and the values are listed in Table 3.

Table 3.
Natural frequencies of first ten vibration modes of large-scale riser model.
Table 4 summarizes the uniform oscillatory flow conditions of the simulated cases in the present study. In the experiment conducted by Trim et al. [37], when the uniform flow velocity was set to 1.5 m/s, the CF VIV exhibited a higher vibration mode, specifically the ninth mode. To further explore the VIV characteristics of the large-scale riser under uniform oscillatory flow, m/s is also selected for the present simulation. In order to maintain consistency in the number and the dominant reduced velocity with the small-scale riser, the corresponding and are calculated with Equations (2) and (3). By this means, Cases E and F tabulated in Table 4 are designed.

Table 4.
Parameters of simulated uniform oscillatory flow cases.
3.2. Validation Tests
Figure 4 presents the comparisons of the IL and CF root mean square (RMS) displacement amplitudes along the riser with the experimental data from Ren et al. [12] for Cases A and B. The results demonstrate that both directions show the first mode responses, which is in accordance with the experimental measurements. The CF RMS amplitudes agree well with the experimental data, whereas some slight discrepancies are observed for the IL RMS amplitudes. Moreover, Figure 5 presents the comparisons of the IL and CF RMS displacement amplitudes along the riser with the experimental data from Ren et al. [13] for Cases C and D. It is clear that the CF VIV exhibits the second mode responses, while the IL VIV consistently shows the first mode response. Again, the predicted vibration mode shapes match those in the experiments, with some subtle differences in the IL RMS amplitudes. Since both ends of the riser (i.e., and 1) are hinged with zero displacements, no deviations from the experimental data are observed for these two points. However, the positions in between the two ends are free to vibrate in the IL and CF directions. Therefore, discrepancies between the numerical and experimental results mainly arise in the region of . These discrepancies can possibly be attributed to the fact that the values used in the present numerical model are obtained from stationary cylinder experiments, and the empirical coefficients in the wake oscillators are not well calibrated due to the limited experimental data available. Nevertheless, the maximum disparity in all the cases considered is less than 15%, which is deemed acceptable for engineering applications.
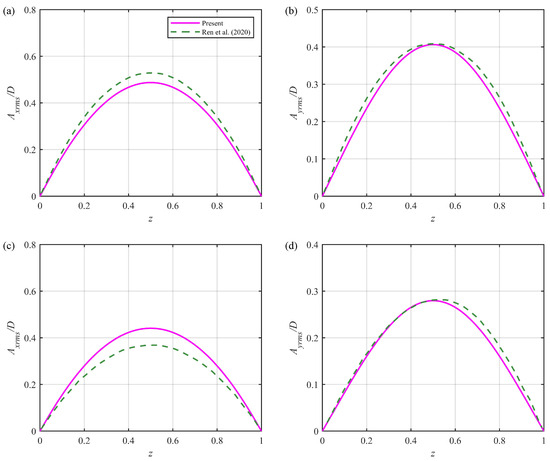
Figure 4.
Comparisons of root mean square displacement amplitudes along riser () with experimental data in Ren et al. [12]: (a) in-line root mean square amplitudes for Case A; (b) cross-flow root mean square amplitudes for Case A; (c) in-line root mean square amplitudes for Case B; and (d) cross-flow root mean square amplitudes for Case B.
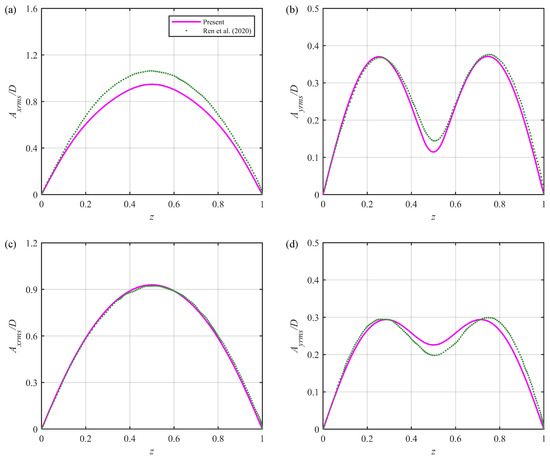
Figure 5.
Comparisons of root mean square displacement amplitudes along riser () with experimental data in Ren et al. [13]: (a) in-line root mean square amplitudes for Case C; (b) cross-flow root mean square amplitudes for Case C; (c) in-line root mean square amplitudes for Case D; and (d) cross-flow root mean square amplitudes for Case D.
Figure 6 and Figure 7 present a comparative analysis of the spatial distributions of the response frequencies with the experimental data reported in Ren et al. [13] for Cases C and D. It is evident that in the two cases, the dominant frequencies of the IL VIV observed in the experiment are 0.38 Hz and 0.18 Hz, respectively, while, the predicted IL dominant frequencies are, respectively, 0.37 Hz and 0.17 Hz, demonstrating quantitative agreement with the experimental measurements. Regarding the CF VIV response, the dominant frequency for Case C is 3.785 Hz, whereas the predicted CF dominant frequency is marginally higher at 4.15 Hz, with the frequency component of 3.78 Hz also identified. Similarly, for Case D, the predicted CF dominant frequency of 4.09 Hz slightly exceeds the experimental value of 3.68 Hz. Furthermore, the multi-frequency characteristics observed in the experiment are effectively reproduced by the present model.
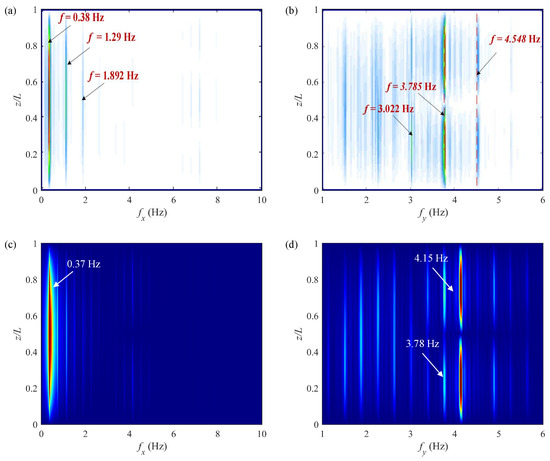
Figure 6.
Comparisons of spatial distributions of response frequencies with experimental data in Ren et al. [13] for Case C (): (a) experimental in-line frequency; (b) experimental cross-flow frequency; (c) present in-line frequency; and (d) present cross-flow frequency.
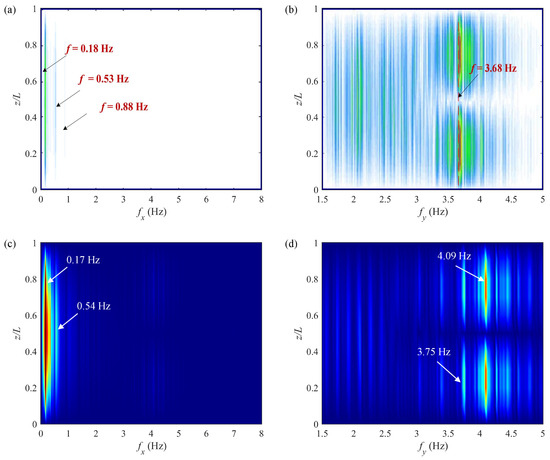
Figure 7.
Comparisons of spatial distributions of response frequencies with experimental data in Ren et al. [13] for Case D (): (a) experimental in-line frequency; (b) experimental cross-flow frequency; (c) present in-line frequency; and (d) present cross-flow frequency.
The prediction results from the time-domain semi-empirical model presented in this paper align well with the experimental findings reported in the literature. The overall results are quite consistent. Therefore, this model can be utilized to calculate the VIV of the riser in uniform oscillatory flow.
In order to examine the applicability of the present model for predicting the VIV of large-scale risers, the uniform flow case with the flow velocity of 0.4 m/s in Trim et al. [37] is considered, as they only studied the VIV in steady flow. The comparisons of the RMS displacement amplitudes along the riser with the experimental data are depicted in Figure 8. It can be seen from the figure that the predicted dominant modes for the IL and CF responses are, respectively, the fifth and the third modes, which exactly match the experimental measurements. Moreover, the maximum differences for the IL and CF RMS displacement amplitudes are 16.7% and 16.2%, respectively. They both fall within the acceptable tolerance for industrial applications. Consequently, the proposed time-domain semi-empirical model can be used for further investigating the VIV characteristics of the large-scale riser in uniform oscillatory flow.
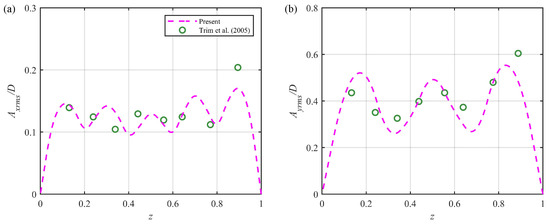
Figure 8.
Comparisons of root mean square displacement amplitudes along riser () with experimental data in Trim et al. [37]: (a) in-line root mean square amplitudes; (b) cross-flow root mean square amplitudes.
4. Results and Discussion
4.1. VIV Characteristics of Small-Scale Riser
4.1.1. Spatial–Temporal Evolutions
Figure 9 and Figure 10 illustrate the spatial–temporal evolutions of the IL and CF VIV displacements for Cases A and B, respectively. In both cases, the displacement responses in the IL and CF directions are predominantly influenced by the first mode over time, exhibiting clear characteristics of standing waves. However, in Case B, a significant modulation phenomenon is observed in the CF response, which is not present in Case A.
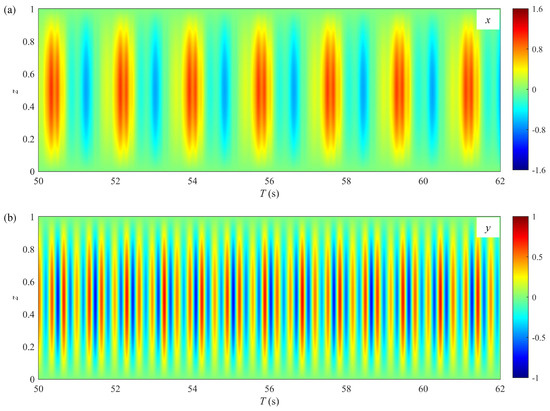
Figure 9.
Spatial–temporal evolutions of displacements for Case A (): (a) in-line displacement; (b) cross-flow displacement.
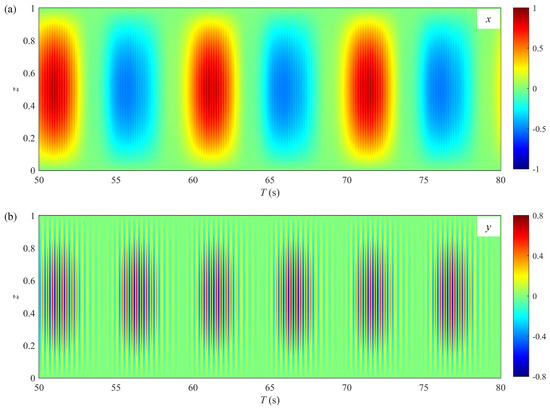
Figure 10.
Spatial–temporal evolutions of displacements for Case B (): (a) in-line displacement; (b) cross-flow displacement.
Figure 11 and Figure 12 show the spatial–temporal evolutions of the IL and CF VIV displacements for Cases C and D, respectively. In both cases, the IL displacement responses are dominated by the first mode and demonstrate standing wave characteristics. However, the CF displacement response in Case D differs from that in Case C; it exhibits mode competition, being influenced by both the first and second modes, with traveling wave features identified in the transition region between these modes. Furthermore, in both cases, the CF displacement is primarily governed by the second mode, while the IL displacement remains solely dominated by the first mode. This observation, where the dominant CF mode is higher than that in the IL direction, contrasts with the typical VIV modal behavior reported for slender risers subjected to uniform flow [54].
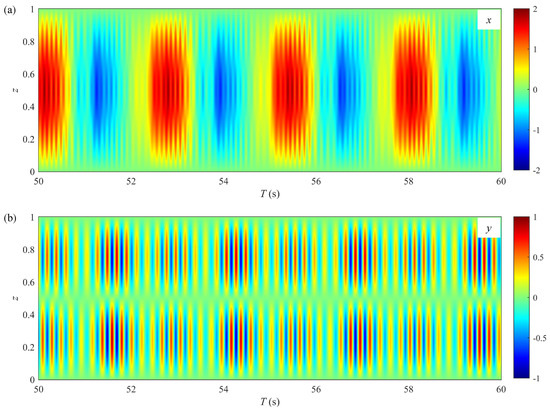
Figure 11.
Spatial–temporal evolutions of displacements for Case C (): (a) in-line displacement; (b) cross-flow displacement.
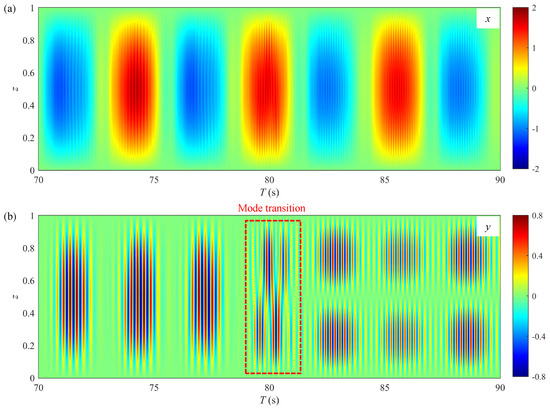
Figure 12.
Spatial–temporal evolutions of displacements for Case D (): (a) in-line displacement; (b) cross-flow displacement.
Furthermore, as shown in panel (b) of Figure 9, Figure 10, Figure 11 and Figure 12, the period of the IL displacement response closely aligns with . Figure 13 displays the spatial–temporal evolutions of the IL fluid force for Case A, which is primarily driven by the uniform oscillatory flow. Consequently, the strong similarity between the displacement period and the flow period results from the two-way coupling between the force and the structural response [22]. In addition, the high-frequency components of the IL displacement responses in Cases A and C are more pronounced than those in Cases B and D. This observation suggests that higher numbers diminish the effects of the VIV on the IL vibration. This phenomenon may be explained by the longer oscillatory flow periods at high numbers, which help stabilize the vortex motion.
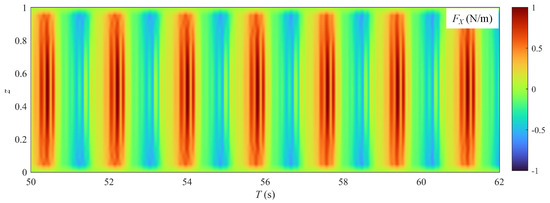
Figure 13.
Spatial–temporal evolutions of in-line fluid force for Case A ().
4.1.2. Time-Sharing Characteristics
Previous studies have indicated that the CF VIV response of a riser in uniform oscillatory flow exhibits temporal variations, which are referred to as time-sharing characteristics [11,55]. This phenomenon is also observed in the present results, with a detailed analysis performed at the nondimensional axial position . It is important to note that the time-sharing behavior is less pronounced in the IL response compared to that in the CF response, as illustrated in Figure 14, Figure 15, Figure 16 and Figure 17. Furthermore, the higher harmonics observed are consistent with the patterns revealed in the spatial–temporal evolution plots.
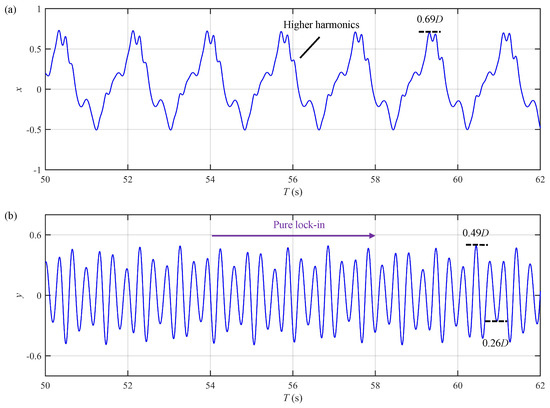
Figure 14.
Displacement time histories at for Case A (): (a) in-line displacement; (b) cross-flow displacement.
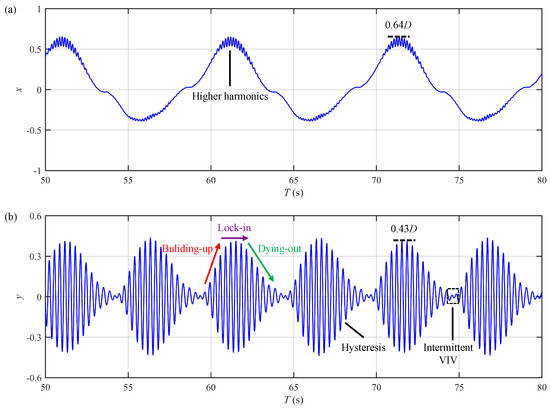
Figure 15.
Displacement time histories at for Case B (): (a) in-line displacement; (b) cross-flow displacement.
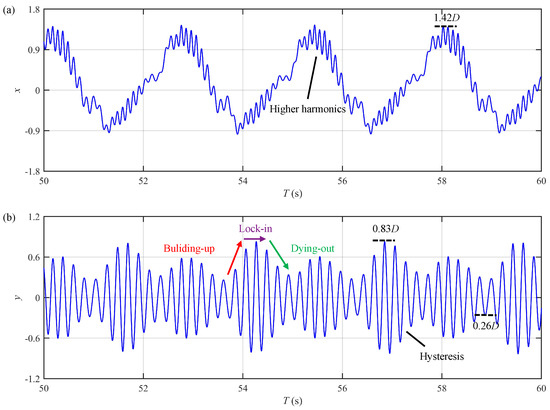
Figure 16.
Displacement time histories at for Case C (): (a) in-line displacement; (b) cross-flow displacement.
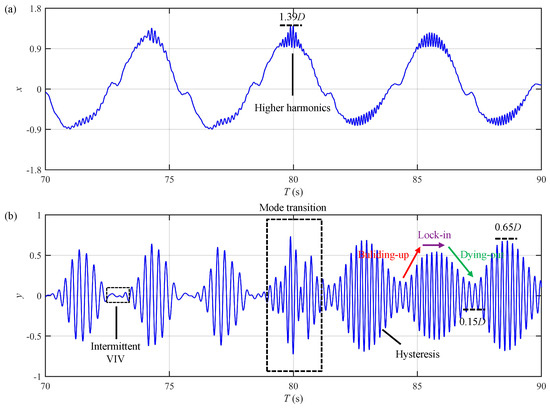
Figure 17.
Displacement time histories at for Case D (): (a) in-line displacement; (b) cross-flow displacement.
Intermittent VIV is a notable distinction between the VIV responses in uniform oscillatory flow and those in steady flow [11]. This important response feature is also successfully reproduced by the present time-domain semi-empirical model. As depicted in Figure 15b and Figure 17b, the CF displacement approaches zero during specific time intervals that occur periodically, as indicated by the black boxes in the figures. Such behavior does not take place in steady flows.
Another prominent characteristic of the VIV in uniform oscillatory flow is amplitude modulation. As shown in panel (b) of Figure 14, Figure 15, Figure 16 and Figure 17, each oscillatory flow cycle consists of two distinct time intervals: one where the flow velocity increases and another where it decreases. Corresponding to these intervals, the riser displacement displays two crest-like fluctuations within each cycle. It is important to clarify that the amplitude fluctuations seen in uniform oscillatory flow are fundamentally different from the beating phenomenon caused by the vibration mode switching in steady flow. The amplitude modulation reported in the present research arises from the dynamic response of fluid–structure interaction, while the beating phenomenon originates from the interference between two adjacent structural vibration modes. Compared with lower number cases (Cases A and C), the amplitude modulation is more evident at higher values. For example, the CF displacement for Case A in Figure 14b exhibits a pure lock-in behavior, with a maximum amplitude of and a minimum amplitude of , indicating a small variation range and weak amplitude modulation. In contrast, Figure 15b demonstrates that the CF displacement for Case B undergoes a process of building up, locking in and finally dying out, with a maximum amplitude of and notable intermittency. This particular response suggests pronounced amplitude modulation. The underlying reason for this difference is that for higher numbers, the shed vortices during the first half of the oscillatory flow cycle dissipate more fully. As the flow direction reverses, these dissipated vortices exert less influence on reinforcing the existing VIV response. Consequently, the amplitude modulation becomes more prominent at higher numbers.
According to Equation (1), the velocity of the uniform oscillatory flow follows a standard cosine profile. This means that the acceleration phase, where U increases from zero to , and the deceleration phase, where U decreases from back to zero, are perfectly symmetrical. However, as shown in panel (b) of Figure 15, Figure 16 and Figure 17, the CF displacement response is not strictly symmetrical. During the acceleration and deceleration phases, there are instants when the U value is the same, yet the corresponding vibration amplitudes differ. This asymmetry is reflected in the uneven rising and falling slopes of the displacement envelope (the red and green arrows in these figures), signifying the occurrence of the well-known hysteresis phenomenon, as previously reported by Fu et al. [11].
4.2. VIV Characteristics of Large-Scale Riser
4.2.1. Spatial–Temporal Evolutions
The spatial–temporal evolutions of the IL and CF VIV displacements for Cases E and F are depicted in Figure 18 and Figure 19, respectively. Analogous to the VIV responses observed for the small-scale risers, the IL displacement of the large-scale riser features a stable first mode. In contrast, the CF displacement responses of the large-scale riser in both cases exhibit higher modes and demonstrate obvious traveling wave characteristics.
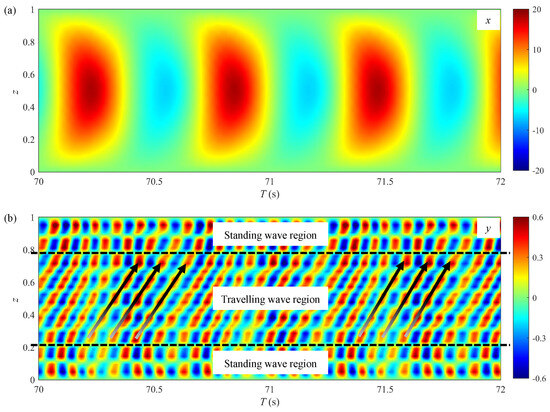
Figure 18.
Spatial–temporal evolutions of displacements for Case E (): (a) in-line displacement; (b) cross-flow displacement.
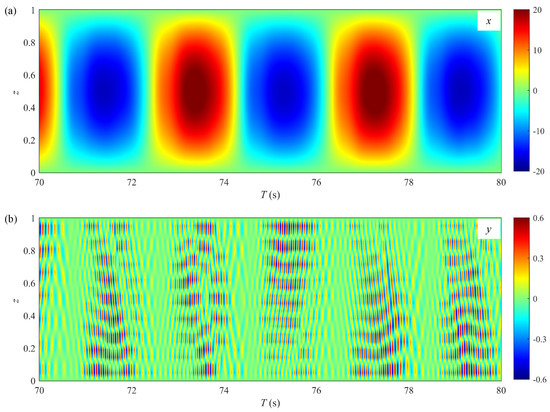
Figure 19.
Spatial–temporal evolutions of displacements for Case F (): (a) in-line displacement; (b) cross-flow displacement.
In Figure 18b, the VIV characteristics at both ends of the riser differ from those at the midspan. The response in the middle section of the riser is characterized by traveling waves, while standing wave behaviors are observed for the top and bottom ends of the riser. Similar phenomenon was also observed in the long riser VIV field tests conducted by MIT and the Deepstar Consortium. Vandiver et al. [56] noted that the standing wave regions were unavoidable since waves would always propagate towards the boundaries. However, under high numbers, the response characteristics change significantly. It can be seen from Figure 19b that the CF displacement response of the large-scale riser shows significant intermittency and reveals two distinct traveling wave patterns. Figure 20 presents the CF displacement time history at and the spatial–temporal distributions of the CF displacement over approximately one oscillatory flow cycle for Case F. The time history reveals two prominent peaks in the response amplitude, each exhibiting a unique pattern and corresponding to the two distinct traveling wave regions. As shown in Figure 20b, in the first half of the cycle, the traveling wave propagates to the upper right, transferring energy from the bottom end of the riser to its top end; in the second half of the cycle, the propagation direction of the traveling wave shifts to the lower right, and the energy is transferred from the top end of the riser back to the bottom end.
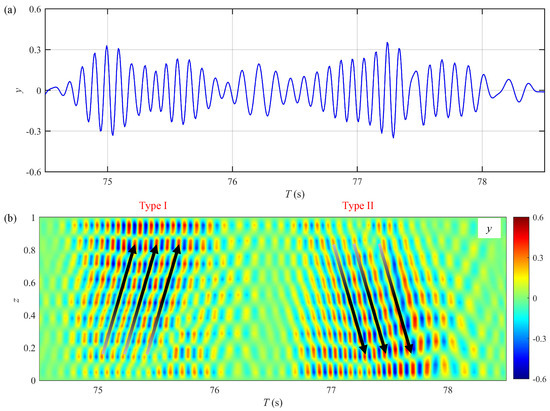
Figure 20.
Vortex-induced vibration response within one period of uniform oscillatory flow for Case F (): (a) cross-flow displacement time history at ; (b) spatial–temporal evolutions of cross-flow displacement.
4.2.2. Time-Sharing Characteristics
Figure 21 and Figure 22 illustrate the displacement time histories at for Cases E and F, respectively. As demonstrated in these figures, the CF VIV of the large-scale riser in uniform oscillatory flow exhibits time-sharing characteristics similar to those of the small-scale riser. The features include intermittent VIV, amplitude modulation, and hysteresis. However, unlike the small-scale riser, the amplitude modulation of the large-scale riser becomes more complex at higher number, as shown in Figure 22b. This complexity might be attributed to the involvement of the multiple vibration modes. For the IL VIV, it can be observed from Figure 21a and Figure 22a that the peak amplitudes in Cases E and F exceed . It is deduced that these extremely large IL amplitudes can be attributed to the relative low and large of the riser. The increase in the IL amplitude with increasing was also reported by Deng et al. [25] for the VIV of a flexible cylinder in uniform oscillatory flow with being varied from 167–667. Moreover, the intricate vortex motion associated with the oscillatory flow and the nonlinear coupling between the IL and CF VIV may also contribute to the large IL amplitudes observed in the present study. As currently the existing data for the VIV of a riser with in uniform oscillatory flow are still quite limited, experimental and high-fidelity CFD studies are urgently required to elucidate this phenomenon. The large peak IL amplitudes in Case E and F are small compared to the total span length of the large-scale riser (less than of L); thus, the geometric nonlinearity due to large rotations has a limited effect on the global dynamic stiffness. Furthermore, the governing equations in the present study include the axial elongation term in Equation (7), which accounts for the additional tension due to bending deformation, thereby capturing the primary geometric nonlinearity relevant for the large deflections in the large-scale riser. These reasons substantiate the applicability of the Euler–Bernoulli beam theory for modeling the riser VIV, even in the presence of large deflections.
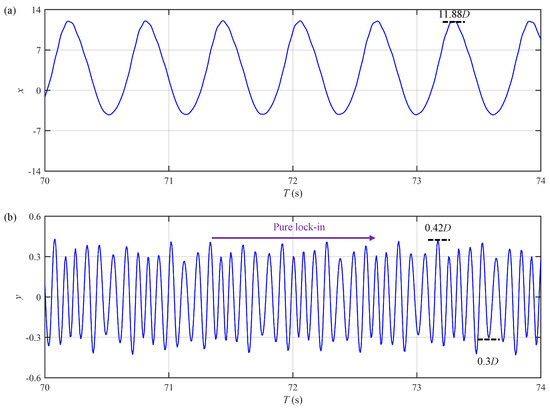
Figure 21.
Displacement time histories at for Case E (): (a) in-line displacement; (b) cross-flow displacement.
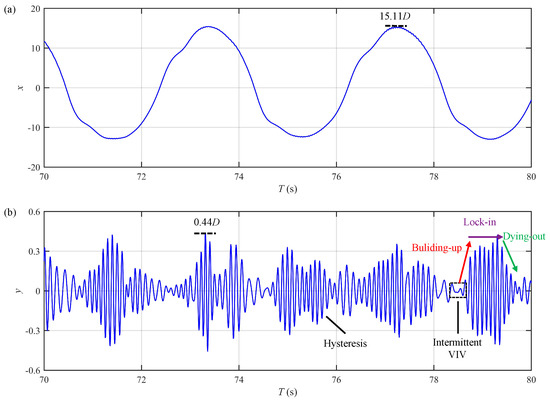
Figure 22.
Displacement time histories at for Case F (): (a) in-line displacement; (b) cross-flow displacement.
Dalton [57] identified the lock-in phenomenon associated with the cylinder oscillation under self-excited condition. The vibration amplitude of the cylinder experienced a sudden increase at a reduced velocity of , which marked the onset of the lock-in. The large-amplitude oscillation persisted until . In the present study, across Cases A–F, the dominant reduced velocities , as detailed in Table 4, are 5.2 and 6.5. These values are within the lock-in regime as defined by Dalton [57]; thus, the vibration responses belong to the lock-in stage. Nevertheless, the VIV development process exhibits distinct patterns. In some cases, it demonstrates the typical stages of building-up, lock-in, and dying-out, while in other cases, it may remain in a pure lock-in state or show only the building-up and dying-out stages as mentioned in Fu et al. [11]. This suggests that the occurrence of the lock-in stage for the VIV in uniform oscillatory flow depends not only on but also on the number.
5. Conclusions
In this study, a time-domain semi-empirical model based on the wake oscillator approach is proposed to predict the in-line (IL) and cross-flow (CF) vortex-induced vibration (VIV) of a flexible riser in uniform oscillatory flow, and the numerical model is utilized to analyze the similarities and differences in the VIV response characteristics of small-scale and large-scale risers. Four Keulegan–Carpenter () numbers are considered for the small-scale riser, i.e., , 56, 121, and 178, while and 178 are examined for the large-scale riser. The main conclusions of this paper can be summarized as follows:
The newly developed time-domain semi-empirical model features the introduction of a nondimensional parameter to characterize the fundamental lift force frequency induced by the complex vortex motion around the riser. Moreover, it can accurately predict the coupled IL and CF VIV responses of both small-scale and large-scale risers in uniform oscillatory flow, while the majority of the existing models are focused on the CF VIV only. The time-sharing features such as intermittent VIV, amplitude modulation, and hysteresis are well reproduced in the present simulation, and the numerical results agree well with the experimental data.
In uniform oscillatory flow, the CF displacements of small-scale and large-scale risers tend to approach zero during certain periods, featuring the intermittent VIV. In addition, the VIV response demonstrates amplitude modulation that varies periodically over time. This modulation becomes more pronounced at higher numbers due to the more adequate vortex dissipation. Furthermore, the vibration response also exhibits asymmetric hysteresis during the acceleration and deceleration phases of the uniform oscillatory flow. Depending on the different numbers, the VIV development process can either follow a building-up, lock-in, and dying-out pattern or a pure lock-in pattern, suggesting that lock-in is not a necessary stage.
The VIV of the large-scale riser in uniform oscillatory flow can be excited into higher modes and display distinct traveling wave characteristics, along with the intricate and diverse energy transfer mechanisms. Moreover, the VIV also presents time-sharing features including intermittent VIV, amplitude modulation and hysteresis.
Author Contributions
Conceptualization, E.W.; methodology, S.G.; software, S.G.; validation, S.G.; formal analysis, S.G. and E.W.; investigation, S.G.; resources, E.W.; data curation, S.G.; writing—original draft preparation, S.G. and E.W.; writing—review and editing, E.W.; visualization, S.G.; supervision, E.W.; project administration, E.W.; funding acquisition, E.W. All authors have read and agreed to the published version of the manuscript.
Funding
This research was funded by the National Key R & D Program of China [grant number 2024YFC2815003], the National Natural Science Foundation of China [grant number 52271282], the Guangdong Basic and Applied Basic Research Foundation [grant number 2024A1515240018], and the Shenzhen Science and Technology Program [grant numbers RCYX20231211090210018 and WDZC20231125203917001].
Data Availability Statement
The data presented in this study are available on request from the corresponding author.
Conflicts of Interest
The authors declare no conflicts of interest. The funders had no role in the design of the study; in the collection, analyses, or interpretation of data; in the writing of the manuscript; or in the decision to publish the results.
Appendix A. Numerical Solution of Governing Equations
Appendix A.1. Central Difference Scheme
The central difference method is a prevalent finite difference technique frequently employed to solve differential equations and compute derivatives. This method determines the derivative of a function by utilizing the function’s values at adjacent points, thereby offering greater accuracy compared to other numerical differentiation methods. Various expressions of the central difference method can be derived depending on the order of the approximation.
To formulate the central difference method for calculating the first derivative, the function is expressed through a Taylor series expansion at the positions and :
where is the step size. Subtracting Equation (A2) from Equation (A1) yields:
After that, dividing Equation (A3) by and the central difference formula for the first derivative can be expressed as
The formula above estimates the value of the derivative by evaluating the function at points on either side of with an error of the order of .
Similarly, the second-order derivative can be obtained:
This formula also accounts for the two neighboring points around with the error of the order of .
The central difference method offers effective approximations for higher-order derivatives. Specifically, the central difference formulas for the third and fourth derivatives are articulated as follows:
Equations (A6) and (A7) employ four and five function values, respectively, to compute the third and fourth derivatives, each with an error of the order of .
The nondimensional coupled structural and wake oscillator equations in Section 2 are discretized in both time and space and solved in the time domain using the aforementioned central difference scheme.
Appendix A.2. Solution Procedures
Figure A1 depicts the solution procedures within the time and space domains. As outlined in Section 2.3, the dimensionless time and axial length of the riser are divided into N and M segments, respectively. Consequently, the temporal nodes are enumerated as , while the spatial nodes are enumerated as . Prior to executing the time-domain solution, it is imperative to establish the initial and boundary conditions.
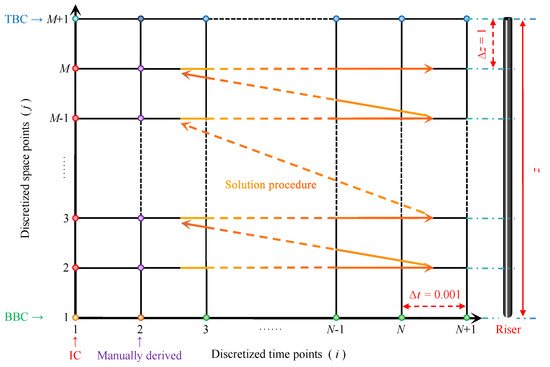
Figure A1.
Schematic diagram of solution procedures in time and space domains.
At the initial time point, the variables are represented by the red dots in Figure A1. Specifically, the displacement variables and , as well as the velocity components and of the riser, are assumed to be zero. Additionally, the wake oscillator variables and are initialized with a single-wavenumber perturbation of the order of , while their time derivatives and are set to zero [49]. Subsequently, by applying the central difference formula for the first derivative from Equation (A4) to the initial conditions , the relationships between the initial variables at the virtual time node and the time node are derived as follows:
The values of , , , and , represented by the purple dots in Figure A1, can be manually determined by substituting , , , , and Equation (A8) into the nondimensional coupled equations.
Until now, the values of x, y, p, and q at time nodes and have been determined. To proceed with the calculation process for these variables at , it is essential to apply the appropriate boundary conditions. Given that the hinged boundary conditions are imposed at both ends of the riser, the displacements , , , and and the bending moments , , , and at the top and bottom boundaries are assumed to be zero, as depicted by the green and blue dots in Figure A1.
For indices and , boundary conditions are not required for the calculation. However, for the boundary nodes where and , it is essential to apply the zero displacement boundary conditions, specifically . Additionally, at the spatial nodes and , it is necessary to impose the zero bending moment boundary conditions, given by . By integrating the zero displacement boundary conditions and the central difference formula for the first derivative from Equation (A4) into the zero bending moment boundary conditions, the following expressions can be derived:
By applying the initial and boundary conditions to the coupled equations, the vibration displacements of the riser at various temporal and spatial nodes can be computed.
References
- Williamson, C.H.K.; Govardhan, R. Vortex-induced vibrations. Annu. Rev. Fluid Mech. 2004, 36, 413–455. [Google Scholar] [CrossRef]
- Hong, K.S.; Shah, U.H. Vortex-induced vibrations and control of marine risers: A review. Ocean Eng. 2018, 152, 300–315. [Google Scholar] [CrossRef]
- Liu, Y.; Liu, F.; Wang, E.; Xiao, Q.; Li, L. The effect of base column on vortex-induced vibration of a circular cylinder. Ocean Eng. 2020, 196, 106822. [Google Scholar] [CrossRef]
- Wang, J.; Fan, D.; Lin, K. A review on flow-induced vibration of offshore circular cylinders. J. Hydrodyn. 2020, 32, 415–440. [Google Scholar] [CrossRef]
- Ma, L.; Lin, K.; Fan, D.; Wang, J.; Triantafyllou, M.S. Flexible cylinder flow-induced vibration. Phys. Fluids 2022, 34, 011302. [Google Scholar] [CrossRef]
- Xu, W.; He, Z.; Zhai, L.; Wang, E. Vortex-induced vibration prediction of an inclined flexible cylinder based on machine learning methods. Ocean Eng. 2023, 282, 114956. [Google Scholar] [CrossRef]
- Yu, Z.; Wang, E.; Bao, Y.; Xiao, Q.; Li, X.; Incecik, A.; Lin, B. VIV of two rigidly coupled side-by-side cylinders at subcritical Re. Int. J. Mech. Sci. 2024, 267, 108961. [Google Scholar] [CrossRef]
- Huera-Huarte, F.J. Vortex-induced vibration of flexible cylinders in cross-flow. Annu. Rev. Fluid Mech. 2025, 57, 285–310. [Google Scholar] [CrossRef]
- Zhao, M. Numerical investigation of two-degree-of-freedom vortex-induced vibration of a circular cylinder in oscillatory flow. J. Fluids Struct. 2013, 39, 41–59. [Google Scholar] [CrossRef]
- Wu, J.; Jin, J.; Yin, D.; Lie, H.; Passano, E.; Sævik, S.; Tognarelli, M.A.; Grytøyr, G.; Andersen, T.; Karunakaran, D. Time domain VIV analysis tool VIVANA-TD: Validations and improvements. In Proceedings of the ASME 2020 39th International Conference on Offshore Mechanics and Arctic Engineering, Virtual, 3–7 August 2020. [Google Scholar]
- Fu, S.X.; Wang, J.G.; Baarholm, R.; Wu, J.; Larsen, C.M. Features of vortex-induced vibration in oscillatory flow. J. Offshore Mech. Arct. Eng. 2014, 136, 011801. [Google Scholar] [CrossRef]
- Ren, H.; Zhang, M.; Wang, Y.; Xu, Y.; Fu, S.; Fu, X.; Zhao, B. Drag and added mass coefficients of a flexible pipe undergoing vortex-induced vibration in an oscillatory flow. Ocean Eng. 2020, 210, 107541. [Google Scholar] [CrossRef]
- Ren, H.; Zhang, M.; Cheng, J.; Cao, P.; Xu, Y.; Fu, S.; Liu, C. Experimental investigation on vortex-induced vibration of a flexible pipe under higher mode in an oscillatory flow. J. Mar. Sci. Eng. 2020, 8, 408. [Google Scholar] [CrossRef]
- Zhang, M.; Fu, S.; Ren, H.; Xu, Y.; Qin, X. Experimental investigation on vortex-induced force of a flexible pipe under oscillatory flow. Appl. Ocean Res. 2022, 126, 103269. [Google Scholar] [CrossRef]
- Li, X.; Yuan, Y.; Duan, Z.; Xue, H.; Tang, W. Experimental investigation on vortex-induced vibration of a flexible pipe in combined uniform and oscillatory flow. Ocean Eng. 2023, 285, 115375. [Google Scholar] [CrossRef]
- An, H.; Cheng, L.; Zhao, M. Direct numerical simulation of oscillatory flow around a circular cylinder at low Keulegan–Carpenter number. J. Fluid Mech. 2010, 666, 77–103. [Google Scholar] [CrossRef]
- Zhao, M.; Cheng, L.; Zhou, T. Three-dimensional numerical simulation of oscillatory flow around a circular cylinder at right and oblique attacks. Ocean Eng. 2011, 38, 2056–2069. [Google Scholar] [CrossRef]
- Zhao, M.; Cheng, L.; An, H. Numerical investigation of vortex-induced vibration of a circular cylinder in transverse direction in oscillatory flow. Ocean Eng. 2012, 41, 39–52. [Google Scholar] [CrossRef]
- An, H.; Cheng, L.; Zhao, M. Two-dimensional and three-dimensional simulations of oscillatory flow around a circular cylinder. Ocean Eng. 2015, 109, 270–286. [Google Scholar] [CrossRef]
- Pearcey, T.; Zhao, M.; Xiang, Y.; Liu, M. Vibration of two elastically mounted cylinders of different diameters in oscillatory flow. Appl. Ocean Res. 2017, 69, 173–190. [Google Scholar] [CrossRef]
- Zhao, M.; Pearcey, T.; Cheng, L.; Xiang, Y. Three-dimensional numerical simulations of vortex-induced vibrations of a circular cylinder in oscillatory flow. J. Waterw. Port Coast. Ocean Eng. 2017, 143, 04017007. [Google Scholar] [CrossRef]
- Fu, B.; Zou, L.; Wan, D. Numerical study of vortex-induced vibrations of a flexible cylinder in an oscillatory flow. J. Fluids Struct. 2018, 77, 170–181. [Google Scholar] [CrossRef]
- Munir, A.; Zhao, M.; Wu, H.; Ning, D.; Lu, L. Numerical investigation of the effect of plane boundary on two-degree-of-freedom of vortex-induced vibration of a circular cylinder in oscillatory flow. Ocean Eng. 2018, 148, 17–32. [Google Scholar] [CrossRef]
- Liu, G.; Li, H.; Qiu, Z.; Leng, D.; Li, Z.; Li, W. A mini review of recent progress on vortex-induced vibrations of marine risers. Ocean Eng. 2020, 195, 106704. [Google Scholar] [CrossRef]
- Deng, D.; Zhao, W.; Wan, D. Numerical study of vortex-induced vibration of a flexible cylinder with large aspect ratios in oscillatory flows. Ocean Eng. 2021, 238, 109730. [Google Scholar] [CrossRef]
- Zhu, H.; Xu, H.; Liu, B.; Zhong, J. Numerical investigation of the vortex-induced vibration of a circular cylinder in oscillatory flow. Ocean Eng. 2024, 310, 118666. [Google Scholar] [CrossRef]
- Yu, Z.; Ping, H.; Wang, E.; Bao, Y.; Xu, H.; Huang, Y.; Xiao, Q. Missing critical mass ratio in VIV of rigidly connected cylinders. Int. J. Mech. Sci. 2025, 295, 110236. [Google Scholar] [CrossRef]
- Thorsen, M.J. Time Domain Analysis of Vortex-Induced Vibrations. Ph.D. Thesis, Norwegian University of Science and Technology, Trondheim, Norway, 2016. [Google Scholar]
- Ulveseter, J.V. Advances in Semi-Empirical Time Domain Modelling of Vortex-Induced Vibrations. Ph.D. Thesis, Norwegian University of Science and Technology, Trondheim, Norway, 2018. [Google Scholar]
- Opinel, P.A.; Srinil, N. Application of wake oscillators to two-dimensional vortex-induced vibrations of circular cylinders in oscillatory flows. J. Fluids Struct. 2020, 96, 103040. [Google Scholar] [CrossRef]
- Yuan, Y.; Xue, H.; Tang, W. Numerical analysis of vortex-induced vibration for flexible risers under steady and oscillatory flows. Ocean Eng. 2018, 148, 548–562. [Google Scholar] [CrossRef]
- Duan, J.; Zhou, J.; Wang, X.; You, Y.; Bai, X. Cross-flow vortex-induced vibration of a flexible fluid-conveying riser undergoing external oscillatory flow. Ocean Eng. 2022, 250, 111030. [Google Scholar] [CrossRef]
- Qu, Y.; Fu, S.; Xu, Y.; Huang, J. Application of a modified wake oscillator model to vortex-induced vibration of a free-hanging riser subjected to vessel motion. Ocean Eng. 2022, 253, 111165. [Google Scholar] [CrossRef]
- Xu, A.; Chai, Y.; Li, F.; Chen, Y. Nonlinear vortex-induced vibrations of slightly curved pipes conveying fluid in steady and oscillatory flows. Ocean Eng. 2023, 270, 113623. [Google Scholar] [CrossRef]
- Li, J.; Chen, N. Vortex-induced vibration (VIV) of flexible riser conveying severe slugging and straight flow in steady and oscillatory flows. J. Sound Vib. 2025, 595, 118728. [Google Scholar] [CrossRef]
- Gao, S.; Wang, E.; Shang, C. Prediction of VIV of a top tensioned riser subject to vessel motion induced oscillatory flow. In Proceedings of the 35th International Ocean and Polar Engineering Conference, Goyang, Republic of Korea, 1–6 June 2025. [Google Scholar]
- Trim, A.D.; Braaten, H.; Lie, H.; Tognarelli, M.A. Experimental investigation of vortex-induced vibration of long marine risers. J. Fluids Struct. 2005, 21, 335–361. [Google Scholar] [CrossRef]
- Fu, X.; Fu, S.; Zhang, M.; Ren, H.; Zhao, B.; Xu, Y. Vortex-induced vibration of a flexible pipe under oscillatory sheared flow. Phys. Rev. Fluids 2024, 9, 014604. [Google Scholar] [CrossRef]
- Yin, D.; Passano, E.; Lie, H.; Grytøyr, G.; Aronsen, K.; Tognarelli, M.; Kebadze, E.B. Experimental and numerical study of a top tensioned riser subjected to vessel motion. Ocean Eng. 2019, 171, 565–574. [Google Scholar] [CrossRef]
- Sumer, B.M.; Fredsøe, J. Hydrodynamics Around Cylindrical Strucures; World Scientific Publishing Co. Pte. Ltd.: Singapore, 2006; Volume 26. [Google Scholar]
- Blevins, R.D. Flow-Induced Vibration; Krieger Publishing Company: Malabar, FL, USA, 1990. [Google Scholar]
- Ge, F.; Long, X.; Wang, L.; Hong, Y. Flow-induced vibrations of long circular cylinders modeled by coupled nonlinear oscillators. Sci. China Ser. G Physics, Mech. Astron. 2009, 52, 1086–1093. [Google Scholar] [CrossRef]
- Feng, Y.; Li, S.; Chen, D.; Xiao, Q. Predictions for combined In-Line and Cross-Flow VIV responses with a novel model for estimation of tension. Ocean Eng. 2019, 191, 106531. [Google Scholar] [CrossRef]
- Wang, X.; So, R.; Chan, K. A non-linear fluid force model for vortex-induced vibration of an elastic cylinder. J. Sound Vib. 2003, 260, 287–305. [Google Scholar] [CrossRef]
- Gao, Y.; Pan, G.; Meng, S.; Liu, L.; Jiang, Z.; Zhang, Z. Time-domain prediction of the coupled cross-flow and in-line vortex-induced vibrations of a flexible cylinder using a wake oscillator model. Ocean Eng. 2021, 237, 109631. [Google Scholar] [CrossRef]
- Facchinetti, M.L.; de Langre, E.; Biolley, F. Coupling of structure and wake oscillators in vortex-induced vibrations. J. Fluids Struct. 2004, 19, 123–140. [Google Scholar] [CrossRef]
- Srinil, N.; Opinel, P.A.; Tagliaferri, F. Empirical sensitivity of two-dimensional nonlinear wake–cylinder oscillators in cross-flow/in-line vortex-induced vibrations. J. Fluids Struct. 2018, 83, 310–338. [Google Scholar] [CrossRef]
- Facchinetti, M.L.; de Langre, E.; Biolley, F. Vortex-induced travelling waves along a cable. Eur. J. Mech.-B/Fluids 2004, 23, 199–208. [Google Scholar] [CrossRef]
- Gao, Y.; Yang, B.; Zou, L.; Zong, Z.; Zhang, Z. Vortex-induced vibrations of a long flexible cylinder in linear and exponential shear flows. China Ocean Eng. 2019, 33, 44–56. [Google Scholar] [CrossRef]
- Xu, W.; Zeng, X.; Wu, Y. High aspect ratio (L/D) riser VIV prediction using wake oscillator model. Ocean Eng. 2008, 35, 1769–1774. [Google Scholar] [CrossRef]
- Lie, H.; Kaasen, K.E. Modal analysis of measurements from a large-scale VIV model test of a riser in linearly sheared flow. J. Fluids Struct. 2006, 22, 557–575. [Google Scholar] [CrossRef]
- Weaver, W.; Timoshenko, S.P.; Young, D.H. Vibration Problems in Engineering; John Wiley & Sons, Inc.: New York, NY, USA, 1974. [Google Scholar]
- Wang, E.; Xiao, Q. Numerical simulation of vortex-induced vibration of a vertical riser in uniform and linearly sheared currents. Ocean Eng. 2016, 121, 492–515. [Google Scholar] [CrossRef]
- Zhang, C.; Kang, Z.; Stoesser, T.; Xie, Z.; Massie, L. Experimental investigation on the VIV of a slender body under the combination of uniform flow and top-end surge. Ocean Eng. 2020, 216, 108094. [Google Scholar] [CrossRef]
- Wang, J.; Fu, S.; Baarholm, R.; Wu, J.; Larsen, C.M. Fatigue damage induced by vortex-induced vibrations in oscillatory flow. Mar. Struct. 2015, 40, 73–91. [Google Scholar] [CrossRef]
- Vandiver, J.K.; Jaiswal, V.; Jhingran, V. Insights on vortex-induced, traveling waves on long risers. J. Fluids Struct. 2009, 25, 641–653. [Google Scholar] [CrossRef]
- Dalton, C. Fundamentals of Vortex Induced Vibration; Technical Report; University of Houston: Houston, TX, USA, 2013. [Google Scholar]
Disclaimer/Publisher’s Note: The statements, opinions and data contained in all publications are solely those of the individual author(s) and contributor(s) and not of MDPI and/or the editor(s). MDPI and/or the editor(s) disclaim responsibility for any injury to people or property resulting from any ideas, methods, instructions or products referred to in the content. |
© 2025 by the authors. Licensee MDPI, Basel, Switzerland. This article is an open access article distributed under the terms and conditions of the Creative Commons Attribution (CC BY) license (https://creativecommons.org/licenses/by/4.0/).