Abstract
Structural safety is of utmost importance for polar icebreakers under both navigation and icebreaking conditions. In this research, the Palmgren–Miner linear cumulative damage theory is employed to evaluate the structural fatigue lifespan of polar icebreakers. A spectral analysis, incorporating the time distribution coefficients for three load conditions, is executed to assess the fatigue damage at typical hot spots during navigation. For icebreaking activities, the ship–ice interaction loads with time history are simulated using the discrete ice element method, taking into account five sub-operating conditions. This simulation is coupled with rainflow counting to evaluate the fatigue damage. The results show that the cumulative fatigue damage during navigation is much less than that during icebreaking. Additionally, shoulder areas suffer more serious fatigue damage during icebreaking as a result of the direct impact of broken ice. Consequently, both navigation and icebreaking conditions should be considered in the design of hull structures and the assessment of fatigue strength for polar icebreakers.
1. Introduction
The accelerated melting of polar sea ice and the resultant improved navigation conditions have ushered in novel opportunities for cargo routes and scientific research in the Arctic. This shift has led to increased demand for polar icebreakers [1]. Polar icebreakers operate in some of the harshest environments on Earth, with the primary function of icebreaking to ensure open waterways. In addition to wave-induced loads, the hull structure of polar icebreakers is also subjected to impact loads during icebreaking operation, which often leads to fatigue damage [2,3]. Thus, studies on the fatigue strength assessment of polar icebreakers are of great significance for structural design optimization and operational safety.
Polar icebreakers encounter random and non-periodic wave loads during navigation. To evaluate their fatigue strength, the environmental load characteristics of waves and ice are considered [4,5], and then the spectral analysis method [6] is employed. Wirsching et al. [7] introduced a fatigue damage model anchored in Power Spectral Density (PSD) that converts the unpredictability of wave loads into frequency domain statistical attributes, enabling precise evaluations of structural fatigue life under intricate alternating stresses. Kim et al. [8] enhanced this approach with a real-time dynamic load spectrum correction technique, improving prediction accuracy in multifaceted sea states. When assessing ice-induced fatigue during icebreaking endeavors, the quantification and analysis of ice loads become paramount [9]. Suyuthi et al. [10] discussed local ice-induced stresses on structural fatigue damage. Numerical procedures for fatigue damage in level ice have been investigated [11]. Contemporary methods encompass field monitoring, scaled model tests [12], and numerical simulations. The latter compensates for the limitations of field measurements by accurately modeling intricate ice scenarios. Yu et al. [13] developed a model for ship–ice collisions and examined the fatigue mechanism of bow structures. A reliability analysis of ice-induced fatigue damage of polar ship structures has also been conducted [14,15] and the fatigue crack propagation analysis has also been discussed [16]. By simulating icebreaking loads via numerical techniques and integrating S-N curves with the rainflow counting method, a precise assessment of the structural fatigue strength under icebreaking conditions can be achieved [17,18,19].
In this paper, the spectral analysis method (SAM) and discrete element method (DEM) are used to assess the fatigue strength of a polar icebreaker under both navigation and icebreaking conditions. The finite element method is used to analyze the structural weak points under the action of design waves based on Bureau Veritas’ hot spot stress approach [20]. The stress amplitudes at the hot spot positions are counted for fatigue assessment based on linear cumulative damage theory. The special influence of navigation and icebreaking conditions on the ship hull structural fatigue damage is analyzed and compared.
2. Damage Theory and Assessment Method
Research on fatigue damage theory and assessment methodologies assists in the evaluation of a ship structure’s resilience to fatigue under fluctuating loads, thereby ensuring its structural safety and reliability. This section explores the spectral analysis approach relevant to navigation conditions, the discrete element method utilized in icebreaking scenarios, and the S-N curve representing material fatigue behavior. Additionally, an examination of the cumulative fatigue damage theory is provided.
2.1. Spectral Analysis Method
The spectral analysis method is used to obtain the dynamic response of a system by decomposing the signals into individual frequency components. In the context of fatigue strength assessments, the method is applied to spectrally decompose the load signals acting on the hull structure, and to extract the amplitude and phase for each frequency component. In this way, the method enables a comprehensive description of the structural response to frequency loads.
During navigation, the ship structure is exposed to unpredictable and aperiodic loads. Three sub-conditions, i.e., design loading, ballast, and full loading, are established in this paper based on the loading conditions of the vessel to assess the weight distribution effects on the wave-induced loads. The North Atlantic wave scatter diagram is used to describe the wave conditions along the route. Long-term irregular waves encountered over the service lifespan of a ship are divided into several short-term sea states. The ship motion and wave load responses for each short-term sea state are then investigated using linear wave theory. For each short-term sea state, the stress ranges are assumed to follow a Rayleigh distribution, and the statistical parameters are obtained through spectral analysis. The lifecycle fatigue damage is obtained from the accumulation of short-term fatigue damage contributions by integrating FEA for stress response computations. The analytical procedure is briefly summarized in Figure 1.
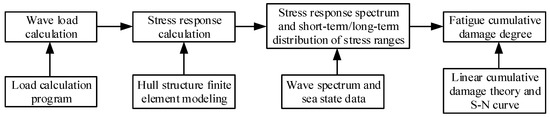
Figure 1.
Flow chart of spectral analysis.
2.2. Discrete Element Method for Sea Ice
In polar icebreaking operations, the thickness of the ice and the velocity of the ship are interdependent variables. Thus, the development of ice-induced fatigue conditions must be based on their joint probability distribution. The DEM effectively simulates the failure process of ice–structure interactions and accurately characterizes the discontinuous distribution features of broken ice, such as their shapes and sizes in fragmented ice fields [21]. This method is widely applicable to ice load studies. Furthermore, compared with field measurements and model tests, the DEM facilitates a more comprehensive analysis of the transition mechanisms governing sea ice failure modes and the factors influencing ice loads.
In this model, the sea ice is represented as spherical particles of different mass and volume, arranged in a hexagonal close packing structure (Figure 2a). A parallel bond model is used to connect neighboring particles, through which the bonding force and moment can be transmitted parallelly through the disks (Figure 2b). When the bond breaks if the applied force is larger than the given interparticle bond strength, the contact forces between neighboring particles are governed by the Hertz contact model.
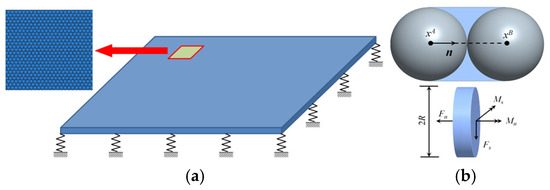
Figure 2.
Discrete element model of sea ice. (a) Particle arrangement. (b) Parallel bond model between particles.
The correct estimation of the normal and tangential bond strengths between particles is crucial for DEM simulations as they define the physical and mechanical properties of sea ice, including its compressive and bending strengths. The failure of bonds between particles indicates the beginning of crack formation while the accumulation of failed particles denotes the propagation of cracks. These two processes describe the macroscopic fracture dynamics of sea ice.
Although the DEM is competent at managing the interactions of discrete sea ices, accurately representing their complex morphology such as irregular edges, thickness variations, and porous structures is a formidable challenge due to the inherent limitations of spherical particles. This discrepancy gives rise to disparities between simulated and actual ice block interactions, such as accumulation, collision, and friction. Furthermore, the DEM traditionally depends on pre-established fractural criteria as stress thresholds, yet the actual fractural processes involve sophisticated physical phenomena like crack propagation, brittle fracture, and interlayer delamination. Consequently, the ensuing distribution of fragment sizes and shapes may not be an accurate reflection of reality.
2.3. S-N Curves
The S-N curve, characterizing the fatigue properties of materials, can be derived through extrapolation from comprehensive fatigue test data. The universal expression of the S-N curve is presented in Equation (1) as follows:
where N denotes the fatigue life, defined as the number of cycles leading to structural fatigue failure, S represents the stress range, and m and A are material parameters determined through fatigue testing.
In ship engineering, classification societies supply standardized S-N curves in their guidelines for evaluating fatigue strength. However, polar icebreakers mainly operate in cold regions where the mechanical and fatigue properties of hull materials undergo significant temperature-dependent alterations. Existing research indicates that as temperatures decrease, the yield strength and ultimate strength of steel generally increase due to a reduction in atomic mobility, which hampers plastic deformation under external loads [22]. However, when temperatures drop below a critical threshold, the ductility and toughness of steel significantly deteriorate, increasing the risk of brittle fracture, particularly under impact loading. Experimental evidence suggests that if a material’s toughness remains relatively stable despite a decrease in temperature, its average fatigue strength may remain comparable to, or even exceed, that under normal temperature conditions. Due to the uncertainty associated with quantifying the effects of low temperatures on fatigue performance, current classification society guidelines still recommend the use of normal temperature S-N curves for the fatigue assessment of polar ships. This study employs the S-N curve specified in the Bureau Veritas (BV) rules for evaluating fatigue strength.
2.4. Fatigue Cumulative Damage Theory
The Palmgren–Miner linear cumulative damage rule posits that the total fatigue damage, denoted as D, resulting from the multilevel alternating stresses applied to a structure is equal to the sum of the damage contributions Di at each individual stress range level. The damage contribution Di at a certain stress range level is described as the ratio of the number of cycles n experienced at that stress range to the number of cycles required to induce failure under the same stress conditions. For K discrete stress range levels, the cumulative damage is articulated as follows:
The linear cumulative damage theory operates on the premise that fatigue failure only transpires when D ≥ 1. If the fatigue load spectrum is not composed of discrete stress range levels, but is instead a continuous probability density function over a specific time period, the cumulative fatigue damage can be expressed as follows:
where S represents the stress range, f(S) is the probability density function associated with the stress range, N(S) denotes the number of cycles required to cause failure under a constant stress range S, and NR is the cumulative number within the predetermined time frame. The term is the number of cycles experienced within the stress range interval [S, S + dS], and represents the integral across the entire duration of the time interval under consideration.
3. Fatigue Strength Evaluation Under Navigation Conditions
The fatigue strength of the polar icebreaker under navigation conditions is evaluated through spectral analysis. A comprehensive finite element analysis of the hull structure is conducted to identify areas of diminished structural integrity under design wave conditions. In these identified areas, stress amplitudes are quantified, and both fatigue life and cumulative damage are estimated utilizing the linear cumulative damage theory.
3.1. Sub-Condition Selection
Variations in hull loading conditions during navigation significantly influence weight distribution and wave load responses. Three distinct sub-conditions, namely design loading, ballast, full loading, have been discerned from loading manuals to represent operational scenarios. The associated displacement, deadweight, and time distribution coefficient are comprehensively outlined in Table 1.

Table 1.
Main loading conditions.
3.2. Wave Parameters
Wave parameters delineate the conditions for seakeeping, encompassing all sub-conditions. For this research, the wave headings are selected from 0° to 180° in 30° intervals with equal probability, including head seas, oblique seas, beam seas, and following seas. The wave frequencies vary between 0.2 and 1.8 rad/s at 0.05 rad/s intervals. The two-parameter P-M spectrum recommended by the ISSC is used as the wave spectrum. Furthermore, the North Atlantic wave scatter diagram [23] proposed by the IACS for extreme sea states is utilized for long-term wave load predictions. The P-M spectrum is expressed as a function of significant wave height, HS, and mean zero-crossing period, TZ, as shown in Equation (4).
3.3. Fatigue Strength Under Navigation Conditions
A shell element is adopted to simulate the structures including the plates and stiffeners. The critical hot spots are selected by selecting the design waves that cause the largest hull motion responses in the hydrodynamic calculation. Critical hot spots include the intersections of longitudinal and transverse stiffeners and the large opening corners suggested by the classification. The stresses at these hot spots are calculated by interpolation, and mesh refinement is performed to ensure the grid sizes are similar to the plate thickness and to ensure a smooth transition between the refined mesh and coarse mesh [24]. The refined region extends more than 10 times the plate thickness from the hot spot. The fatigue hot spots are shown in Table 2, and the mesh re-refinement is shown in Figure 3.
Table 2.
Hot spots under navigation conditions.
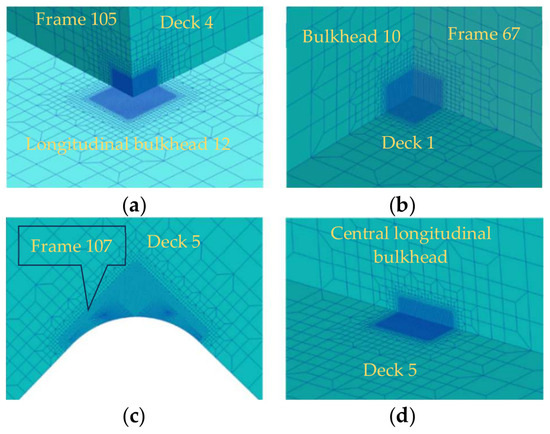
Figure 3.
Hot spot mesh refinement. (a) HX-1. (b) HX-2. (c) HX-3. (d) HX-4.
Fatigue assessment is based on the S-N curves, as stipulated by BV, utilizing curve C1 for welded joints (hot spots HX-1, HX-2, HX-4) and curve C2 for free edges at large openings (hot spot HX-3). The operational rate is taken as 70% and the route allocation factor for navigation is set as 0.5. The cumulative damage and fatigue life are determined for a service lifespan of 40 years for each hot spot. The results are summarized in Table 3.
Table 3.
Fatigue damage degree of typical hot spot.
4. Fatigue Strength Under Icebreaking Conditions
4.1. Sub-Condition Selection
Ice-induced fatigue is determined by the joint probability distribution of ice thickness and ship speed, as these two parameters are operationally dependent. In heavy ice conditions (high ice thickness), ships slow down for safety reasons, whereas in light ice conditions (low ice thickness) they sail faster for efficiency reasons. The life cycle operational data from ice-class ships shows that the encountered ice thickness ranges from 0 to 3 m, while the operational speed varies from 0 to 18 kn. Five sub-conditions are defined in this work by combining ice thickness and speed intervals with the highest joint probabilities. The ice thickness is categorized into 0.4 m intervals from 0.7 to 2.3 m, and the speed is segmented into 4 kn intervals from 3 to 11 kn. PB1 represents the ice cruising condition, detailed in Table 4.
Table 4.
Sub-operating conditions in icebreaker conditions.
4.2. Ice Load Analysis
In the DEM simulations, the level ice is represented as spherical particles arranged in a hexagonal close-packed pattern and connected with parallel bonds. A rectangular ice domain is created with spring boundary conditions to simulate an infinite ice field. The physical parameters of level ice at temperatures ranging from −17 °C to −5 °C are listed in Table 5 [25]. The ship hull is defined as a rigid body in the DEM model (see Figure 4). The surface of the hull is discretized into triangular elements to improve the contact detection and calculate the ice resistance on the spherical ice particles. In order to accurately describe the geometric characteristics of bow and stern profiles and reduce the error caused by shape approximation, local mesh refinement is performed in the primary contact zone between the hull and ice.
Table 5.
Physical parameters of level ice.
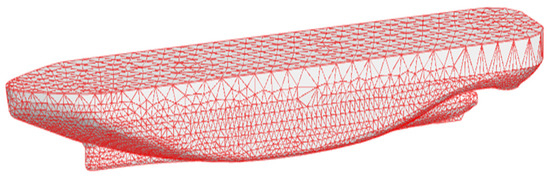
Figure 4.
Discrete element model.
Simulations of icebreaking operations are conducted for each specific sub-condition. Initially, as the hull penetrates the level ice field, a large-scale ice fracture occurs. This process of icebreaking stabilizes as the hull continues to move forward. In the bow region, the ice experiences a continuous bending failure, facilitated by the specialized bow structure of the hull, until it reaches the shoulder region. Concurrently, the ice in the mid-hull and stern regions undergoes a circumferential crack failure due to complex compressive forces. The process of icebreaking for the polar icebreaker, under conditions of 1.5 m ice thickness and a constant speed of 9 kn, is illustrated in Figure 5.
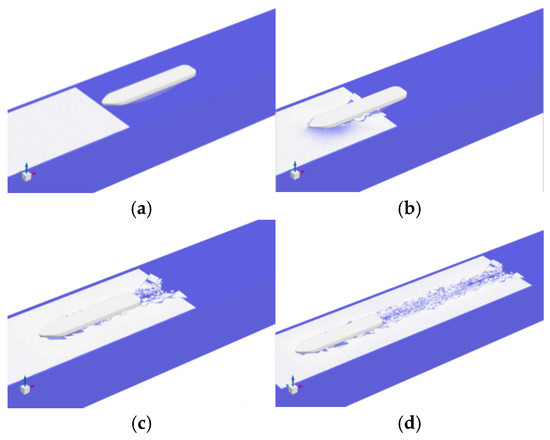
Figure 5.
Icebreaking process at a speed 9 kn and ice thickness 1.5 m. (a) t = 0 s. (b) t = 24 s. (c) t = 48 s. (d) t = 96 s.
A global coordinate system is adopted, namely the x-direction represents the ship length direction, the y-direction the ship width, and the z-direction the ship depth. The time history of ice loads in the x-, y-, and z-directions of an icebreaking scenario with an ice thickness of 1.5 m and a speed of 9 kn is shown in Figure 6. When the bow first makes contact with the level ice, the ice load increases gradually in all three directions until the hull fully penetrates into the ice field, and then the loads start to level off.
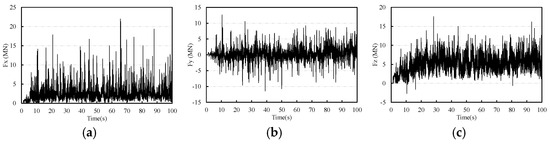
Figure 6.
Load with time history under icebreaking condition at a speed 9 kn and ice thickness 1.5 m. (a) x−direction ice load. (b) y−direction ice load. (c) z−direction ice load.
4.3. Fatigue Strength Under Icebreaking Conditions
The ice load, which was obtained from DEM simulations in the bow region, is transferred to the FEA model using an interpolation technique. This technique effectively addresses the mesh inconsistency issue between the DEM and FEA models. The interpolated nodal loads are subsequently applied to the outer shell of the bow within the FEA model. A structural response analysis revealed significant stress concentrations at the contact zones of the bow shell and the shoulder region affected by the broken ice. Four nodes exhibiting high stress levels were identified as potential fatigue hot spots, as shown in Table 6. Mesh refinement is imperative for hot spot regions. Fundamentally, the grid sizes are designated as the plate thickness and the refined region extends more than 10 times the plate thickness from the hot spot. A smooth transition is maintained between the refined mesh and other coarse mesh. The mesh refinement details are illustrated in Figure 7.
Table 6.
Hot spots under icebreaking conditions.
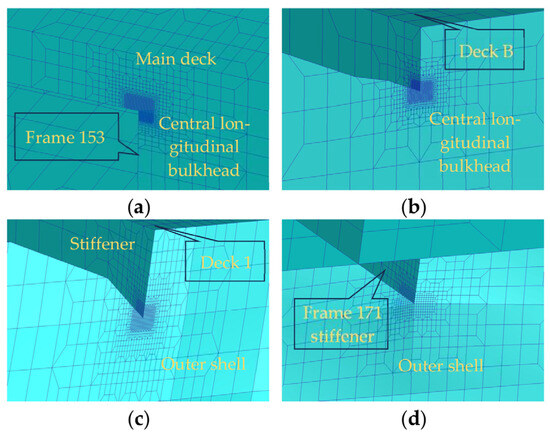
Figure 7.
Hot spot mesh refinement. (a) PB-1. (b) PB-2. (c) PB-3. (d) PB-4.
Utilizing the rainflow counting method and linear cumulative damage theory, the cumulative fatigue damage of each hot spot is calculated under the standard icebreaking conditions. In this calculation, it is assumed that the polar icebreaker is navigated in the Barents Sea, where the ice thickness variation is huge. The annual voyage length is set as 900 nautical miles with a designed lifespan of 40 years (10 voyages per year). The fatigue life of the hot spots is summarized in Table 7. The results show that the fatigue strength criteria of all hot spots are met. However, the shoulder area is more likely to be affected by large local loads caused by broken ice, resulting in greater fatigue damage. Consequently, structural optimization and material enhancement in this area are necessary to ensure its long-term reliability.
Table 7.
Fatigue damage at hot spots under icebreaking conditions.
5. Results and Discussion
The fatigue lifespan of polar icebreakers under both navigation and icebreaking conditions is examined utilizing the Palmgren–Miner linear cumulative damage theory. This analysis took into account the time allocation coefficient and the in-service rate, employing both the spectral analysis and discrete element methods.
In navigation conditions, polar icebreaker structures predominantly encounter wave loads characterized by a low amplitude but high frequency. Such conditions can quickly precipitate high-cycle fatigue issues. In contrast, under icebreaking conditions, the structures suffer collisions with sea ice, generating impact loads that are high in amplitude but low in frequency. These circumstances can easily result in low-cycle fatigue problems.
During navigation conditions, stress concentrations are generated at the intersections of various decks and longitudinal bulkheads due to the discontinuity of the longitudinal bulkhead. This makes it vulnerable to fatigue damage under wave loads, which reduces its fatigue life. During icebreaking conditions, the junction between the stringer in the shoulder region and the outer shell is subjected to fatigue damage due to structural discontinuities and the impact loads caused by collision between the ship’s hull and sea ice, which leads to reduced fatigue life.
The fatigue life of icebreakers is evaluated employing the ambient temperature S-N curves recommended by BV. Future investigations, benefiting from technological advancements and a more profound understanding of the S-N curves characteristics at suboptimal temperatures, are anticipated to yield a greater accuracy. Utilizing the low-temperature S-N curves for evaluating the structural fatigue life of icebreakers, particularly in icebreaking conditions, will likely result in more precise outcomes.
In the present research, the minimum fatigue life of typical nodes exceeds 40 years in icebreaking conditions and surpasses 100 years in navigation conditions. Therefore, the structural design of polar icebreakers should prioritize the impact loads caused by collisions between the hull and sea ice, as well as the subsequent fatigue strength. This is especially important in the bow and stern icebreaking regions, where significant stress concentrations occur due to structural discontinuities or mutations.
6. Conclusions
In this study, the fatigue strength of a polar icebreaker is comprehensively evaluated over its service lifespan, considering both navigation and icebreaking conditions. The findings are derived from spectral analysis and discrete element method analysis, leading to the following conclusions:
- (1)
- The fatigue damage accumulation at common hot spots during icebreaking conditions significantly exceeds that observed in navigation conditions.
- (2)
- In icebreaking scenarios, the shoulder region is subjected to considerable fatigue damage from the impact of fragmented ice. Therefore, it is crucial to carefully select materials and optimize structures to ensure operational safety and reliability.
- (3)
- The normal temperature S-N curves are adopted to assess the structural fatigue life of icebreakers in the present research. With further research on low-temperature S-N curves, it will lead to high-precision results.
Author Contributions
Conceptualization, L.C.; methodology, Z.P.; software, L.C.; validation, L.C.; formal analysis, L.C.; investigation, L.C.; resources, L.C.; data curation, L.C.; writing—original draft preparation, L.C.; writing—review and editing, L.C.; visualization, L.C.; supervision, Z.P.; project administration, L.C.; funding acquisition, L.C. All authors have read and agreed to the published version of the manuscript.
Funding
This research received no external funding.
Data Availability Statement
The data presented in this study are available on request from the corresponding author due to commercial privacy.
Conflicts of Interest
Author Lizhi Chen was employed by the company China National Nuclear Power Co., Ltd. The remaining authors declare that the research was conducted in the absence of any commercial or financial relationships that could be construed as a potential conflict of interest.
Abbreviations
The following abbreviations are used in this manuscript:
| PSD | Power Spectral Density |
| SAM | Spectral Analysis Method |
| DEM | Discrete Element Method |
| FEA | Finite Element Analysis |
References
- Cao, J.; Wang, G. Polar Ship Rule and Its Main Technical Development. Ship Boat 2023, 34, 61–71. [Google Scholar]
- Wang, K.; Wu, L.; Li, Y.-Z.; Qin, C. Experimental study on low temperature fatigue performance of polar icebreaking ship steel. Ocean. Eng. 2020, 216, 107789. [Google Scholar] [CrossRef]
- Wang, H.; Ling, L.; Song, X.; Ding, S.; Wang, G. Assessment of springing and whipping impact on structural strength of ice-breaking LNG ships. J. Ship Mech. 2023, 27, 1685–1696. [Google Scholar] [CrossRef]
- Liu, C.; Hu, S.; Li, P.; Qian, T.; Yuan, Y.; Wen, H.; Zhang, D. Impact mechanism and prediction methods of harsh environmental factors on typical wave-induced icing during polar ship navigation. Ocean. Eng. 2025, 321, 120409. [Google Scholar] [CrossRef]
- Kim, J.; Yoon, D.H.; Choung, J. Numerical study of ship hydrodynamics on ice resistance during ice sheet breaking. Ocean Eng. 2024, 308, 118285. [Google Scholar] [CrossRef]
- Feng, G.Q. Research on Fatigue Strength Assessment Method of Ship Structures. Ph.D. Thesis, Harbin Engineering University, Harbin, China, 2006. [Google Scholar]
- Wirsching, P.H.; Light, M.C. Fatigue under wide band random stresses. J. Struct. Div. 1975, 106, 1593–1607. [Google Scholar] [CrossRef]
- Kim, M.H.; Kim, S.M.; Kim, Y.N.; Kim, S.G.; Lee, K.E.; Kim, G.R. A comparative study for the fatigue assessment of a ship structure by use of hot spot stress and structural stress approaches. Ocean Eng. 2009, 36, 1067–1072. [Google Scholar] [CrossRef]
- Song, M.; Zhou, L. Estimation of Ice Load for the New Chinese Polar Research Vessel. J. Ship Mech. 2021, 25, 1302–1310. [Google Scholar]
- Suyuthi, A.; Leira, B.; Riska, K. Fatigue damage of ship hulls due to local ice-induced stresses. Appl. Ocean Res. 2013, 42, 87–104. [Google Scholar] [CrossRef]
- Han, Y.; Zhu, X.; Zhou, L. A numerical procedure for calculating ice-induced fatigue damage for ship hulls in level ice. Ocean Eng. 2024, 312, 119342. [Google Scholar] [CrossRef]
- Suyuthi, A.; Leira, B.; Riska, K. Statistics of local ice load peaks on ship hulls. Struct. Saf. 2013, 40, 1–10. [Google Scholar] [CrossRef]
- Yu, Y.; Zhao, D.; Li, C.; Liang, Y.; Wang, Z.; Sun, W. Research on ship-ice collision model and ship-bow fatigue failure mechanism based on elastic-plastic ice constitutive relation. Ocean Eng. 2024, 306, 118005. [Google Scholar] [CrossRef]
- Zhao, W.; Leira, B.J.; Kim, E.; Feng, G.; Sinsabvarodom, C. A Probabilistic Framework for the Fatigue Damage Assessment of Ships Navigating through Level Ice Fields. Appl. Ocean Res. 2021, 111, 102624. [Google Scholar] [CrossRef]
- Huang, H.C.; Duan, M.L.; Xu, F.Y.; Shen, Z.H. Reliability analysis of ice-induced fatigue and damage in offshore engineering structures. China Ocean. Eng. 2000, 14, 15–24. [Google Scholar]
- Zhao, W.; Leira, B.J.; Feng, G.; Gao, C.; Cui, T. A reliability approach to fatigue crack propagation analysis of ship structures in polar regions. Mar. Struct. 2021, 80, 103075. [Google Scholar] [CrossRef]
- Jeon, S.; Kim, Y. Fatigue damage estimation of icebreaker ARAON colliding with level ice. Ocean Eng. 2022, 257, 111707. [Google Scholar] [CrossRef]
- Zhang, H.H. Research on Fatigue Strength of the Polar Ship. Master’s Thesis, Harbin Engineering University, Harbin, China, 2018. [Google Scholar]
- Liu, W.C.; Li, Z.; Cui, G.W.; Feng, G. Research on calculation method of ice induced fatigue for icebreaker structures. Ship Sci. Technol. 2021, 43, 25–31. [Google Scholar]
- Veritas, B. Guidelines for fatigue assessment of steel ships and offshore units. Guid. Note NI393 2024. [Google Scholar]
- Zhang, R. Fatigue Analysis of Ship Structure Under Actions of Ice Loads. Master’s Thesis, Dalian University of Technology, Dalian, China, 2020. [Google Scholar]
- Bridges, R.; Zhang, S.; Shaposhnikov, V. Experimental investigation on the effect of low temperatures on the fatigue strength of welded steel joints. Ships Offshore Struct. 2012, 7, 311–319. [Google Scholar] [CrossRef]
- IACS. Unified Requirement (URI) Polar: Polar Class Ships; International Association of Classification Societies: London, UK, 2023. [Google Scholar]
- Bintoro, S.R.; Prabowo, A.R.; Triyono; Muhayat, N. Influence of element discretization types to fatigue behaviors in finite element analysis. Mater. Today Proc. 2022, 57, 531–538. [Google Scholar] [CrossRef]
- Shokr, M.; Sinha, N. Sea Ice: Physics and Remote Sensing; John Wiley & Sons, Inc.: Hoboken, NJ, USA, 2015. [Google Scholar]
Disclaimer/Publisher’s Note: The statements, opinions and data contained in all publications are solely those of the individual author(s) and contributor(s) and not of MDPI and/or the editor(s). MDPI and/or the editor(s) disclaim responsibility for any injury to people or property resulting from any ideas, methods, instructions or products referred to in the content. |
© 2025 by the authors. Licensee MDPI, Basel, Switzerland. This article is an open access article distributed under the terms and conditions of the Creative Commons Attribution (CC BY) license (https://creativecommons.org/licenses/by/4.0/).