Article

A Study on UAV Path Planning for Navigation Mark Inspection Using Two Improved SOM Algorithms

1
College of Navigation, Jimei University, Xiamen 361021, China
2
College of Marine Culture and Law, Jimei University, Xiamen 361021, China
3
Institute of Logistics Science and Engineering, Shanghai Maritime University, Shanghai 201306, China
4
College of Transport & Communications, Shanghai Maritime University, Shanghai 201306, China
*
Author to whom correspondence should be addressed.
J. Mar. Sci. Eng. 2025, 13(8), 1537; https://doi.org/10.3390/jmse13081537
Submission received: 8 July 2025 / Revised: 4 August 2025 / Accepted: 7 August 2025 / Published: 10 August 2025
(This article belongs to the Section Ocean Engineering)

Abstract

With the widespread application of unmanned aerial vehicle technology in navigation mark inspection, path planning algorithm efficiency has become crucial to improve inspection effectiveness. The traditional self-organizing mapping (SOM) algorithm suffers from dual limitations in UAV inspection path optimization, including insufficient global exploration during early training stages and susceptibility to local optima entrapment in later stages, resulting in limited inspection efficiency and increased operational costs. For this reason, this study proposes two improved self-organizing mapping algorithms. First, the ORC_SOM algorithm incorporating a generalized competition mechanism and local infiltration strategy is developed. Second, the ORCTS_SOM hybrid optimization model is constructed by integrating the Tabu Search algorithm. Validation using two different scale navigation mark datasets shows that compared with traditional methods, the proposed improved methods achieve significantly enhanced path planning optimization. This study provides effective path planning methods for unmanned aerial vehicle navigation mark inspection, offering algorithmic support for intelligent maritime supervision system construction.

1. Introduction

1.1. Background

Navigation marks serve as ‘road signs’ for maritime traffic, performing essential functions including positioning, hazard warning, traffic confirmation, and direction. As critical infrastructure for ensuring safe vessel navigation and maintaining maritime traffic order [1], regular inspection and maintenance of navigation marks are essential to ensuring their proper functioning and preventing maritime accidents.
Traditional navigation mark inspection is primarily conducted manually by boats, consuming significant manpower and fuel resources. The poor quality and efficiency of this approach make it difficult to meet the demands of rapid marine economic development [2,3]. With the rapid growth of UAV technology, as a new type of productivity, UAV can take advantage of its mobility, flexibility, wide patrol area, and simple operation [4,5,6,7], which is increasingly being used in a wide range of fields, including military reconnaissance [8,9], disaster relief [10,11,12], environmental monitoring [13,14,15], agricultural mapping [16,17,18], logistics distribution [19,20,21], and so on. Therefore, UAV can expand the means of navigation mark supervision to maximize the efficiency of navigation mark daily management and the emergency response of nautical protection and can be well used for navigation mark inspection. However, how to optimize the inspection path to complete the inspection tasks of all navigation marks with the shortest flight distance has become an urgent problem to be solved.

1.2. Research Motivation

The motivation for this research arises from the growing demands of modern maritime traffic management and the significant technological gaps in current systems for inspecting navigation marks. With the rapid expansion of global maritime trade, traditional boat-based inspection methods are increasingly inadequate for meeting the scale and frequency requirements. While UAV technology has succeeded in terrestrial applications, its maritime deployment faces unique challenges, including complex weather conditions and electromagnetic interference. Furthermore, existing path planning algorithms suffer from computational intensity and local optimization limitations when deployed on resource-constrained UAV platforms, creating a critical need for efficient, real-time algorithmic solutions that can enhance both maritime safety and operational efficiency.

1.3. Related Work

1.3.1. Navigation Mark Inspection Research

Research on UAV navigation mark inspection remains limited and primarily theoretical. However, successful applications in related infrastructure inspection fields provide valuable technical foundations for addressing the unique challenges of maritime navigation mark inspection.
UAV applications in power line inspection have demonstrated effective multi-point inspection capabilities, optimizing flight routes between numerous inspection points while identifying equipment wear and line faults [22]. The application in bridge inspection validates UAV feasibility in structural health monitoring, with multi-sensor systems achieving over 90% detection accuracy for critical issues such as concrete cracking and steel corrosion [23]. Similarly, UAVs in water conservancy infrastructure inspection operate in complex aquatic environments, collecting high-precision images for millimeter-level damage assessment of dams, embankments, and water storage reservoirs [24].
These applications address environmental challenges that closely parallel maritime conditions. Power line inspection involves high-altitude flight, electromagnetic interference, and strong wind conditions similar to the wind, waves, and signal instability encountered in maritime flight. Water conservancy inspection demonstrates UAV precision recognition capabilities in complex aquatic environments with water reflection, variable lighting conditions, and wind disturbances directly applicable to maritime navigation mark inspection.
Few studies have explored UAV-based navigation mark inspection directly. Li et al. [25] developed a navigation mark inspection system integrating active disturbance suppression controllers to cope with sea winds and computer vision algorithms for light buoy recognition. However, existing research primarily focuses on single-point inspection capabilities and detection algorithms without addressing the critical challenge of efficient path planning for multi-mark inspection missions.
The mature experience of UAV inspection technology in power line and water conservancy infrastructure provides essential technical foundations for navigation mark inspection in terms of environmental adaptation, control stability, and recognition accuracy. However, a significant research gap exists in developing efficient path planning methodologies specifically tailored to the unique spatial distribution patterns and operational constraints of maritime navigation mark inspection scenarios.

1.3.2. Navigation Mark Inspection Path Planning Methods

UAV inspection of navigation marks often starts with a preset inspection point, and the UAV inspects all navigation marks once and then returns to the starting point. This process can be viewed as the Traveling Salesman Problem (TSP) [26,27,28].
TSP is a typical NP-hard problem [29,30]. In recent years, many scholars have proposed various algorithms to solve this problem, and TSP path planning algorithms can be divided into two categories: classical optimization methods and intelligent heuristics. The classical optimization algorithms contain steepest descent methods [31], optimal control techniques [32], and derivative connection methods.
Several traditional optimization algorithms have significant limitations, including a lack of adaptability, stability, and a tendency to fall into local optimization, making them unsuitable for UAV path planning. The most common examples of modern intelligent algorithms are Genetic Algorithm, Particle Swarm Optimization, and Ant Colony Optimization.
Genetic Algorithm (GA) is a search heuristic algorithm that mimics natural selection and genetic mechanisms and is widely used in TSP. In recent years, researchers have worked on improving GA to solve TSP. Dong et al. [33] proposed a hybrid genetic algorithm to solve the multi-scale colored balanced traveler problem, and Mahmoudinazlou et al. [34] proposed a hybrid genetic algorithm (HGA) for solving more than one traveler problem using the min–max objective function problem (mTSP). However, the GA lacks optimization accuracy and is susceptible to local optimization, making it less efficient in solving the TSP path planning problem.
Particle Swarm Optimization (PSO) is a population intelligence-based optimization algorithm that simulates the behavior of a population of organisms, such as a flock of birds or a school of fish, to find an optimal solution. Yildiz et al. [35] proposed an improved intelligent path planning algorithm, GDRRT*-PSO, which was successfully used for multi-UAV path planning. Kathen et al. [36] proposed the AquaFeL-PSO algorithm, based on multi-modal particle swarm optimization, which effectively solves the path planning problem of water resources monitoring. Can et al. [37] proposed a collaborative path planning method for sea and air heterogeneous unmanned systems, based on improved particle swarm optimization algorithms, which effectively solves the multi-domain vehicle coordination problem in search and tracking tasks. However, these improvements do not effectively solve the premature convergence problem that PSO is prone to.
Ant colony algorithm (ACO) is an optimization algorithm that simulates the path behavior of ants searching for food in nature; it is mainly used to solve combinatorial optimization problems. Heng et al. [38] proposed a multi-objective ACO variant algorithm based on the improved ACO optimization algorithm that effectively solves the path planning problem of unmanned surface vessel in a complex marine environment. Sui et al. [39] proposed an ACO+PSO+A* combination algorithm, based on a two-layer hybrid optimization algorithm, and effectively solved the multi-task multi-objective path planning problem for autonomous underwater vehicles in a three-dimensional obstacle environment. Cai et al. [40] studied and designed an improved ACO based on the firefly algorithm in a two-dimensional environment, which improved the performance of path planning for moving robots. However, the ACO process requires a large amount of information to determine the most efficient solution, and its inefficient iteration speed leads to a significant increase in simulation time, making it unsuitable for solving UAV path planning problems.
As shown above, several intelligent heuristic algorithms generally face the problems of slow convergence speed, high parameter sensitivity, and drastic increase in computational complexity when solving TSP, making it difficult to adapt to low-power real-time scenarios such as UAV inspection.
The TSP solution had previously relied on traditional optimization algorithms until the intervention of neural network technology drove a paradigm innovation. In recent years, deep learning algorithms have shown significant potential in TSP solving, and Sui et al. [41] classified them into four main categories: end-to-end construction algorithms, end-to-end improvement algorithms, direct hybrid algorithms, and hybrid algorithms for large language models. Reinforcement learning algorithms such as Double Q-learning show superior performance in TSP solving [42]. Deep convolutional neural network-based multi-traveler problem-solving methods achieve direct task-to-solution mapping through image semantic segmentation [43]. Hybrid methods combining Hopfield neural networks, graph neural networks, and reinforcement learning [44,45] can significantly improve the quality of the solution through end-to-end learning capabilities. The reliance of such models on GPU computing power and supervised training makes them difficult to adapt to low-power embedded scenarios, such as UAV inspection. Yang et al. [46] proposed a memory-efficient Transformer architecture to alleviate the computational complexity problem, but it is still difficult to meet the demand for real-time deployment in resource-constrained environments, such as UAV on-board chips.
Therefore, there is an urgent need to develop computationally efficient, memory-friendly and lightweight path planning algorithms suitable for embedded deployment in specific application scenarios such as UAV navigation mark inspection. Traditional self-organizing mapping (SOM) neural network provides a feasible solution to address this challenge by virtue of its simple structure, low computational complexity, and no need for large-scale training data. However, its neuron competition mechanism has long limited it to local optima [47]. Early improvements attempted to alleviate the problem through neighborhood function adjustment [48] or hybrid heuristics strategy [49,50,51], but these methods only ‘patch up’ the competition process of SOM through external mechanisms, without addressing the fundamental rigidity of neuron weight updates. Existing improvement studies primarily alleviate the problem locally through external hybrid strategies [52,53] or parameter tuning [54], at the expense of SOM’s real-time advantage. As shown in Table 1, the computational complexity of each algorithm for solving TSP is presented.

1.4. Knowledge Gap and Contributions

Although extensive research has been conducted in UAV path planning algorithms, there remains a significant research gap specifically addressing the unique requirements of maritime navigation mark inspection. Most existing studies focus on general TSP solutions or terrestrial applications, failing to consider the specific constraints of maritime environments, such as limited onboard computational resources, real-time operation requirements, and the irregular spatial distribution patterns of navigation marks in complex waterways. Furthermore, while deep reinforcement learning algorithms demonstrate theoretical superiority, their computational complexity and memory requirements make them unsuitable for embedded deployment in resource-constrained UAV platforms operating in maritime conditions. This creates a critical need for lightweight, efficient algorithms that can balance optimization quality with practical deployment constraints.
Among the potential solutions, the Self-Organizing Map (SOM) algorithm offers promising characteristics including simple network structure, low computational complexity, and minimal training data requirements. However, the traditional SOM has significant limitations for UAV navigation mark inspection path planning. These include a static topology structure and competition mechanism that easily produces local optimal solutions when processing spatially complex navigation mark data, seriously affecting path optimization quality. The algorithm also fails to account for uneven mark distribution and local density characteristics, lacking responsive neighborhood adjustment mechanisms for dynamic global path optimization. Additionally, random sampling causes uneven training frequency across samples, affecting network learning balance and limiting effectiveness in mark inspection tasks.
In view of the above deficiencies, this paper proposes two improved SOM algorithms, aiming to improve the quality of path planning and algorithm execution efficiency, with the following specific contributions:
(1)
An improved ORC_SOM algorithm is proposed. To avoid the algorithm from falling into local optimal solutions, ORC coefficients are introduced, which are combined with local infiltration and generalized competition mechanisms to dynamically adjust the neighborhood radius;
(2)
An improved ORCTS_SOM algorithm is proposed. The ORCTS_SOM algorithm, in order to further improve the global optimality finding ability of the ORC_SOM algorithm, incorporates the Tabu Search algorithm (TS) to avoid the algorithm from falling into local optimal solutions;
(3)
Validation of the effectiveness of the proposed method based on two different scales of real water coordinates data.
The remainder of the paper is organized as follows: The second part introduces the methodology used in the study, including the introduction of the three algorithmic models of the traditional SOM algorithm, ORC_SOM algorithm, and ORCTS_SOM, as well as the specific points of improvement of the two improved algorithms. The third part describes in detail the source of the case waters navigation mark data, the data processing methodology, the analysis of the data, and the analysis of the specific problems of the UAV inspection navigation mark. The fourth part shows the experimental results, focusing on the performance of each model in terms of path optimization rate and average running time, especially the advantages of the ORCTS_SOM algorithm model in path planning. The fifth part summarizes the main research results and proposes future research directions.

2. Methodology

2.1. Overall Framework

In this study, from data collection, data processing, and data modeling to the comparative analysis of the model operation results, we gradually realized the research on the improved SOM model for the UAV’s navigation mark inspection path planning, and the specific technical route is shown in Figure 1.
Step 1: Data collection. The core task of the data collection phase is to collect information on the names, latitude, and longitude coordinates of the navigation marks from the target waters.
Step 2: Data processing. In the data processing stage, the navigation mark data can be effectively read mainly through coordinate conversion. Firstly, through the coordinate conversion, the original navigation mark latitude and longitude coordinates are converted into decimal degree form. Secondly, the coordinates are converted into plane coordinates, which conform to the distance calculation of the SOM algorithm. Finally, the data is converted into TSP format.
Step 3: Data modeling. Data modeling is the core step in the technical route. First, the genetic algorithm, particle swarm algorithm, and traditional SOM algorithm are selected as the base model. Then, two improved SOM algorithm models are proposed for the traditional SOM algorithm, and two improved SOM algorithm models are proposed to establish a UAV navigation mark inspection path planning model based on the improved SOM.
Step 4: Model performance comparison analysis. Taking the path optimization rate as the main focus and the average running time as the supplement, the performance of the two improved SOM algorithm models is compared with the three base models to analyze the advantages of the improved algorithm models.

2.2. SOM Algorithm

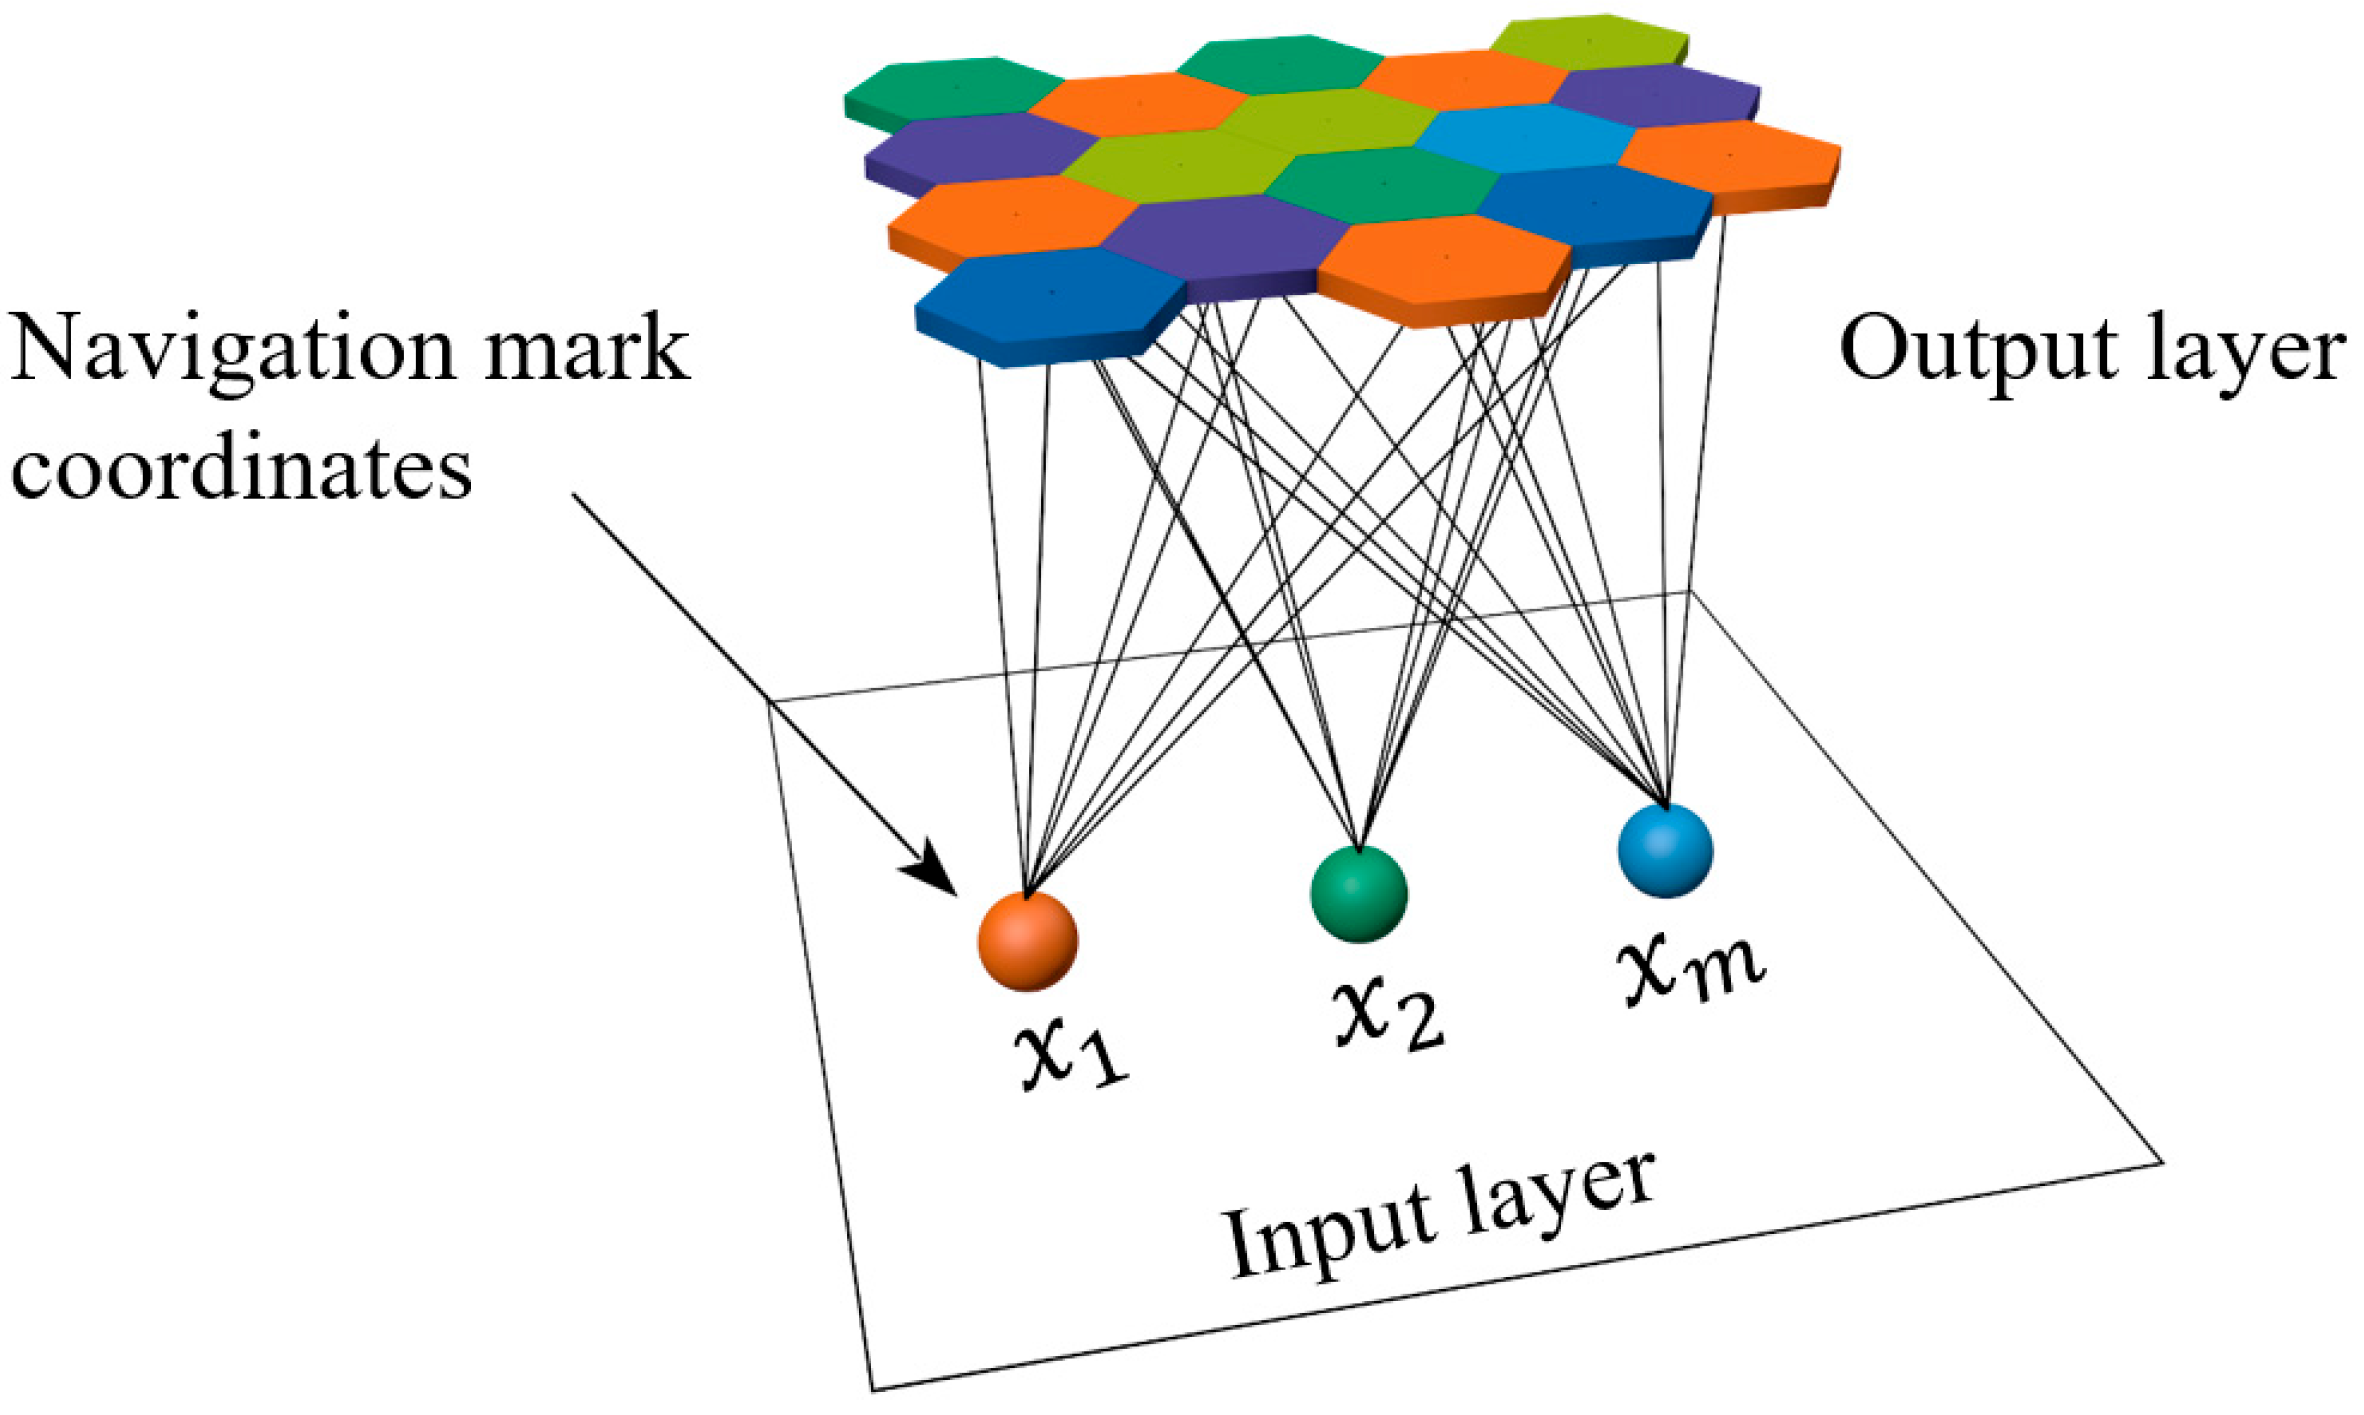
The Self-Organizing Map (SOM) is an unsupervised learning algorithm that maps high-dimensional input data to a low-dimensional topology using a competitive learning mechanism, featuring a network structure that consists solely of an input layer and an output layer, which is referred to as the competitive layer. In a SOM network, neurons are the basic computational units of the network; each neuron has a weight vector for storing and processing information. In the TSP of the UAV inspection navigation mark, the SOM algorithm represents the coordinates of the navigation mark through an input layer whose number of nodes is equal to the feature dimension of the sample. The input layer receives external input patterns, and each input node corresponds to a feature dimension and converges the external information to each neuron in the output layer. The position data of the navigation mark contains two features, longitude and latitude, so the input layer will have nodes equal to the number of these two features. The neurons in the competition layer adjust their weights towards the inputs through competition, and the final adjusted weights represent the paths. The network structure of SOM for navigation mark inspection is shown in Figure 2 below.
SOM is used to solve the path planning problem for UAV inspection navigation mark; the basic steps are as follows:
Step 1: Initialization.
(1)
Data normalization.
Normalization is performed to standardize the coordinates of all navigation mark points x to the same scale, usually the [0,1] interval. Latitude and longitude coordinates are converted to plane coordinates.
n o r m a l i z e d ( x i ) = x i m i n ( x ) m a x ( x ) m i n ( x )
where x i denotes the coordinates of the i-th navigation mark, m a x x denotes the maximum value of the coordinates in the study area, and m i n x denotes the minimum value of the coordinates in the study area.
(2)
Neural network initialization.
A two-dimensional network of neurons is generated, with the position of each neuron initialized to a random value in the interval [0,1].
W = w i   |   w i [ 0,1 ] 2
where W denotes the set of weights for the whole neuron network, and w i is the weight of the i-th neuron.
Step 2: Competitive Learning.
(1)
Competition stage.
For each input (navigation mark coordinates), find the nearest neuron (winning neuron). Use the Euclidean distance calculation as follows:
w c = a r g m i n w i x w i
where w c denotes the weight of the winning neuron and x is the current input vector.
(2)
Neighborhood function.
The weights of the winning neuron and its neighborhood are adjusted according to the Gaussian neighborhood function. The Gaussian neighborhood function is defined as follows:
h c i ( t ) = e x p ( r c r i 2 2 δ ( t ) 2 )
where r c is the location of the winning neuron, r i is the location of the i-th neuron, and δ t is used to represent the effective width between neighboring neurons in the topology, called the neighborhood width, which decays with time and is defined as follows:
δ ( t + 1 ) = δ t × 0.9997
where δ ( t + 1 ) is the neighborhood width at (t + 1)-th iteration.
At the beginning of learning, try to set the value of δ 0 as large as possible. Neurons that are farther away from the winning neuron can also obtain the updated weights. There are more neurons involved in the learning of the navigation mark position space, satisfying the following equation:
f n 2 = e x p n 2 8 δ 0 2 > p
where takes p = 10 5 , δ 0 = n 10 , n is the number of neurons.
As learning proceeds, the neighborhood radius δ t keeps decaying, reaching a certain iteration when only the winning neuron and its surrounding k (neuron magnification) neurons are involved in the learning, while the weights of other neurons are no longer updated, and the neighborhood radius decays to the convergence value δ f . The following equation is satisfied:
f k 2 = e x p k 2 8 δ f 2 > p
where takes p = 10 5 , δ f = k 10 , k = 8 .
(3)
Weighting update.
For all neurons, adjust their weights to make them closer to the input vector. The weighting update formula is as follows:
w i ( t + 1 ) = w i ( t ) + η ( t ) × h c i ( t ) × ( x w i ( t ) )
where w i t is the weight of the i-th neuron at the t-th iteration. η t is the learning rate, which decays with time and satisfies the following equation:
η t + 1 = η t × 0.99997
Step 3: Path Generation.
After a number of training rounds, the SOM network converges and can be terminated by satisfying any of the following conditions:
(1)
When the learning rate decays to satisfy the following equation, it indicates that the update of neuron weights has converged to 0, the network stabilizes, and the algorithm ends.
η t < 0.001
(2)
Neighborhood width decays below a threshold; the threshold is taken as one-tenth of the neuron magnification.
δ t < k 10
(3)
Reach the maximum number of iterations.
T = T m a x
Neurons are connected in their order in space to form a path through all navigation mark points.
By matching navigation mark points with their nearest neurons, a navigation inspection path is generated.
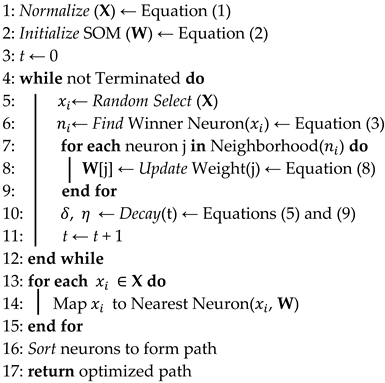
Algorithm 1 shows the pseudo-code of the traditional SOM algorithm for UAV inspection navigation mark path planning, as follows:
Algorithm 1 Traditional SOM framework
Input: coordinates of inputted navigation mark X
Output: weights of output neurons W, optimized TSP path
Jmse 13 01537 i001

2.3. ORC_SOM Algorithm

The traditional SOM algorithm, characterized by unsupervised and competitive learning, lacks emphasis on global optimization during early training and fails to perform targeted local region optimization, resulting in insufficient local search capability in later training stages. To address this limitation, we propose an improved ORC_SOM algorithm that introduces an optimal radius coefficient and incorporates two new learning criteria: generalized competition and local infiltration.

2.3.1. Optimal Radius Coefficient

The traditional SOM algorithm updates the weights of all neurons according to Equation (8) by considering only the learning rate and the Gaussian neighborhood function, but the neighborhood function and the learning rate only follow the decay mechanism present in Equations (5) and (9), which only updates the parameters based on the number of iterations and does not take the specific spatial relationship between the navigation marks and the neurons into consideration, resulting in the use of a fixed weight updating mechanism for the neurons and the lack of a highly responsive dynamic neighborhood adjustment mechanism.
To overcome the above limitations, the optimal radius coefficient ( O R C ) is introduced, which adaptively adjusts the response strength according to the Euclidean distance between the navigation mark and the winner neurons, and can realize the data-driven dynamic adjustment. Specifically, the ORC automatically calculates an adjustment parameter by measuring the spatial distance between the input data point and the winning neuron and can adjust the magnitude of weight updates according to the matching degree between the current input and the network state. The specific improvement process is as follows:
Calculate the distance between the winning neuron w e and the random inputted navigation mark d e , w e , set a (adaptive radius) radius threshold λ t , the definition of the O R C is a function of d e , w e and λ t ; the formula is as follows:
O R C ( d ( e , w e ) , λ t ) = e x p d ( e , w e ) 2 λ t 2 + 1 2
During the learning process, the O R C satisfies the following adaptive properties.
(1)
When d e , w e > λ t , the distance between the inputted navigation mark and the winning neuron is far enough, indicating that the learning is still in the early stage, and needs to emphasize global optimization.
(2)
When d e , w e < λ t , the distance between the inputted navigation mark and the winning neuron is very close, the neural network has reached the late stage of learning the spatial distribution of the area around the inputted navigation mark and needs to emphasize the local search.
The O R C satisfies the following properties:
O R C ( d ( e , w e ) , λ t ) = 1 ,                               d ( e , w e ) > λ t G e n e r a l i z e d c o m p e t i t i o n 1 ,   d ( e , w e ) < λ t L o c a l i n f i l t r a t i o n
where the radius threshold is attenuated according to the following equation:
λ t = λ 0 1 e x p t τ 2 , t > 0
where λ 0 is the initial radius threshold and takes λ 0 = D 4 , D is the diagonal length of the initialized rectangular structure of the neural network, τ 2 is the radius threshold decay time constant and takes τ 2 = 3000 .
The O R C is then used as an additional adjustment factor to improve the weight updating mechanism, and the ORC_SOM algorithm performs neuron weight updating according to the following equation:
w i ( t + 1 ) = w i ( t ) + O R C ( d ( e , w e ) , λ t ) × η ( t ) × h c i ( t ) × ( x w i ( t ) )

2.3.2. Generalized Competition and Local Infiltration

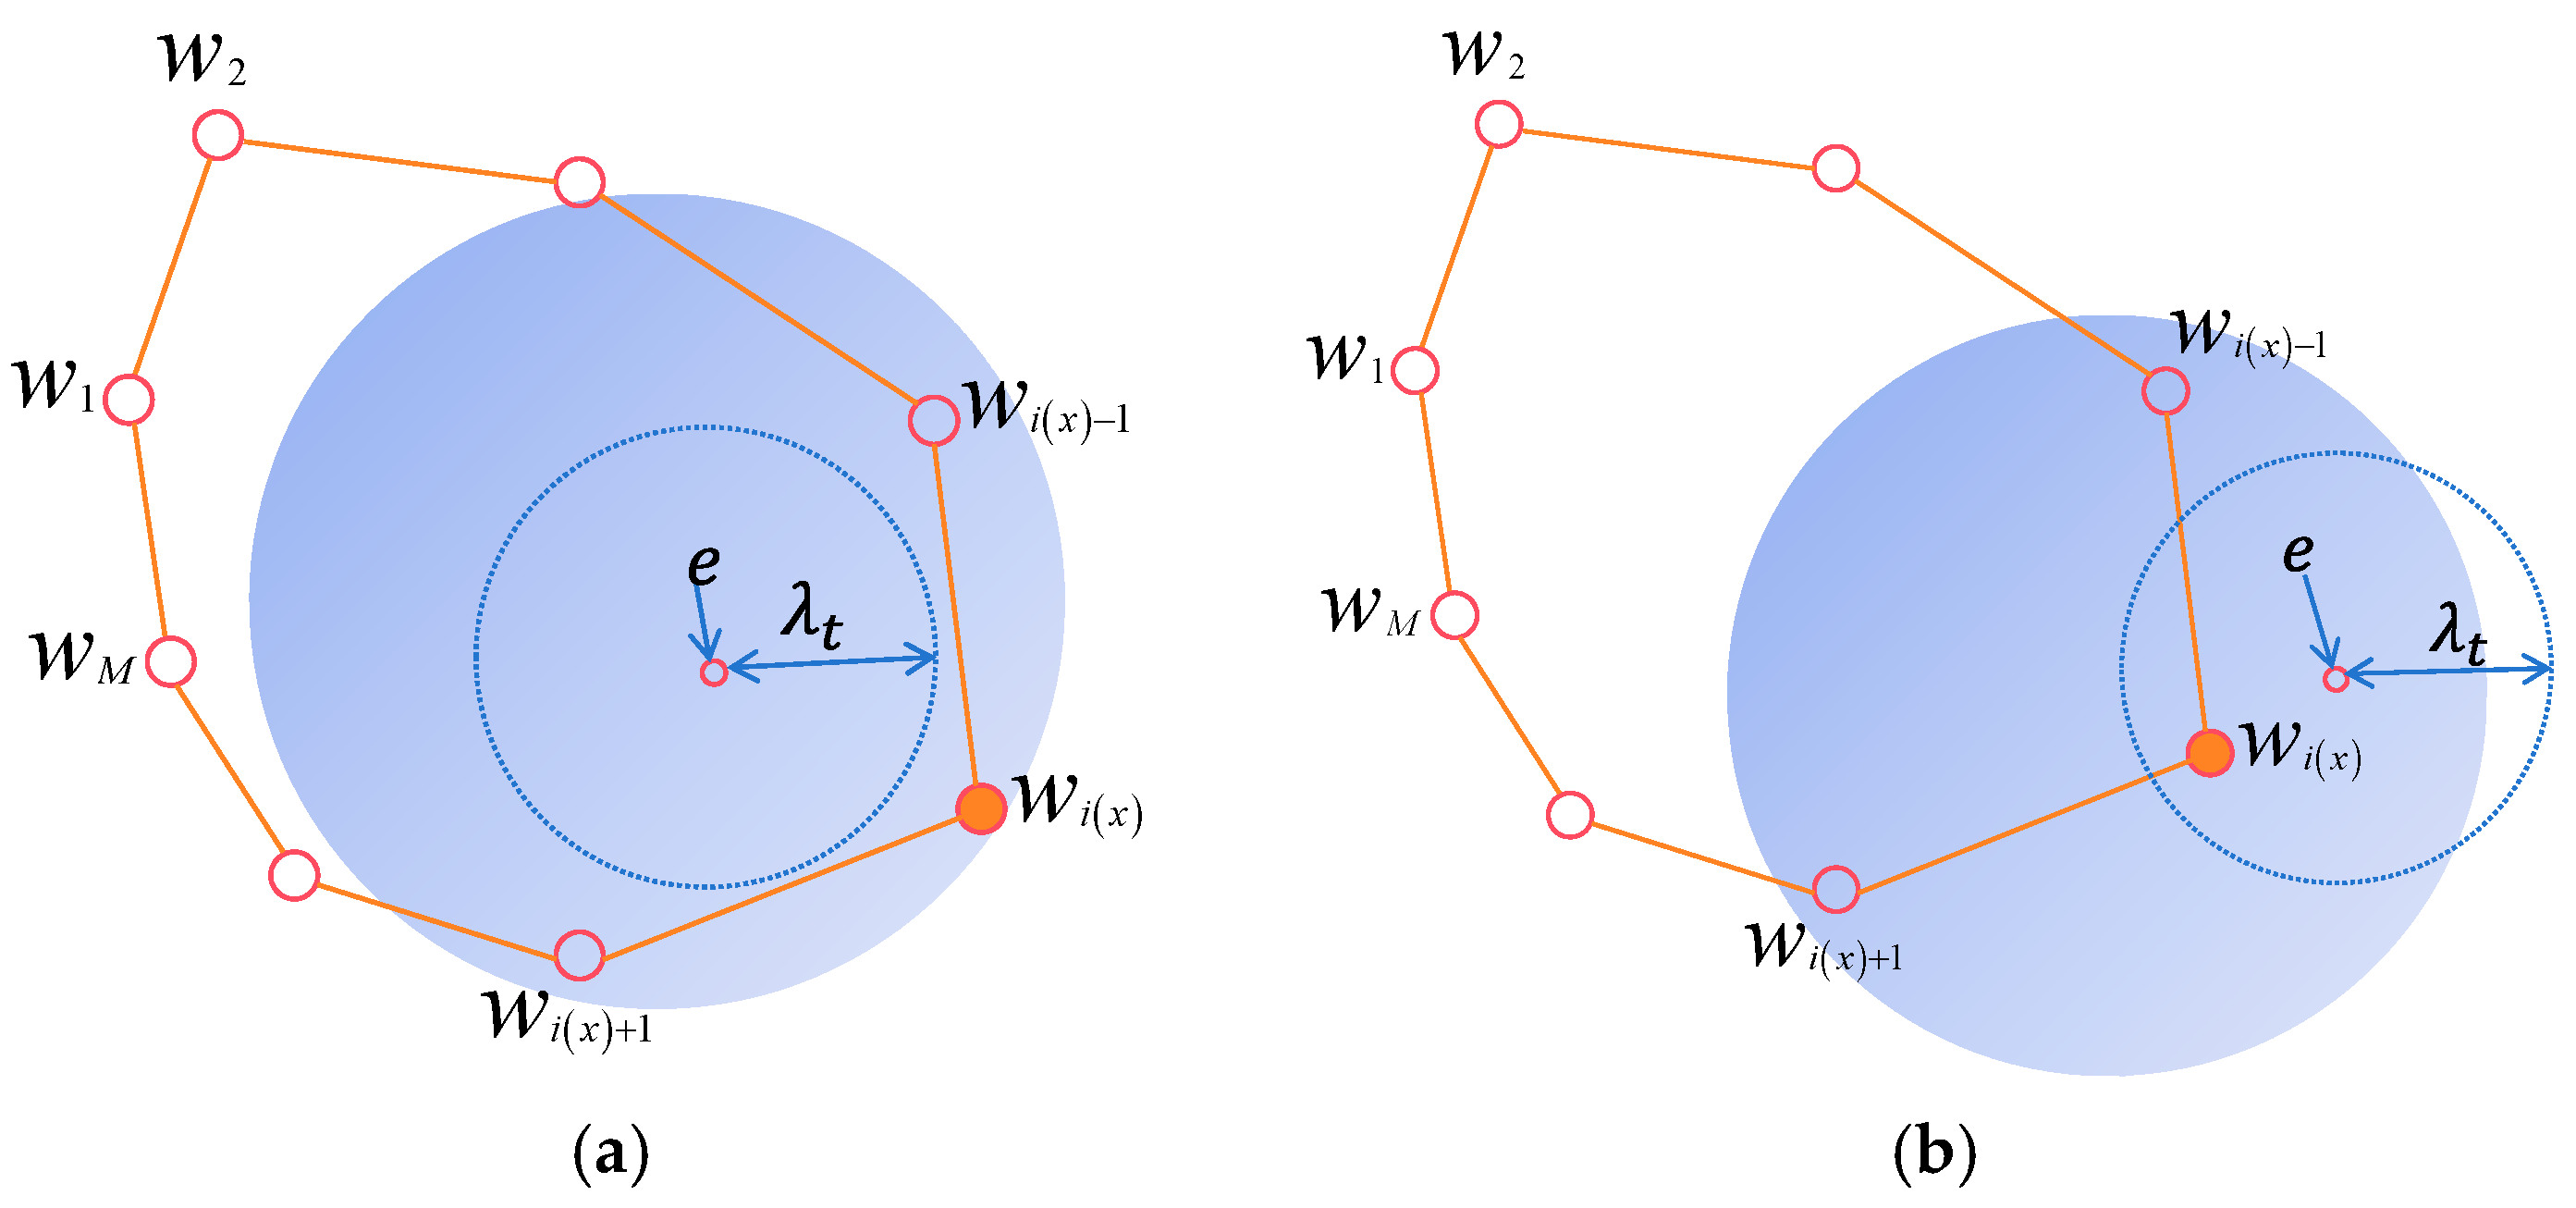
With the introduction of the optimal radius coefficient, the improved weight updating mechanism is mainly reflected in the following two cases: the new inputted navigation mark is farther away from or is closer to the winning neuron. The two cases can be briefly illustrated in Figure 3 below, where e denotes the inputted navigation mark, w i denotes the neuron, the orange circle represents the winning neuron, and the shaded part denotes the range of the winning neighborhood of the current winning neuron.
Generalized Competition Mechanism: As shown in Figure 3a, when the Euclidean distance between the winning neuron and the new inputted navigation mark is greater than the radius threshold set in advance, the network enters what we define as generalized competition. This mechanism represents a network-wide learning strategy that activates when the current network topology inadequately represents the input pattern. Under generalized competition, the learning process extends beyond traditional neighborhood-constrained updates to encompass a broader range of neurons, ensuring that multiple neurons participate more equitably in the competition process. The fundamental principle is the redistribution of competitive influence across the network when the winning neuron’s victory is attributed to relative proximity rather than optimal representation. In this scenario, although a neuron wins the competition, the inputted navigation mark is not necessarily optimally mapped to it. During the weight updating process, no single neuron plays a decisive role; instead, the weights of the entire network are updated so that the weight vectors of the winning neuron and neurons in its neighborhood are drawn closer to the current input vector. This prevents premature convergence to local optima and promotes global exploration of the solution space.
As shown in Figure 4, during the weight updating process under the generalized competition mechanism, the position of the original winning neuron may be replaced by another neuron within its neighborhood, and the current inputted navigation mark is mapped to the new winning neuron, effectively avoiding the local optimum trap.
Local Infiltration Mechanism: Conversely, as illustrated in Figure 3b, when the Euclidean distance between the winning neuron and the new inputted navigation mark is smaller than the radius threshold set in advance, the network employs what we define as local infiltration. This mechanism operates as a proximity-sensitive learning strategy where the weight adjustment intensity is inversely correlated with the distance between the input and the winning neuron. The small distance indicates that the probability of the inputted navigation mark mapping to the current winning neuron is high, suggesting that the current network topology adequately represents the input pattern. Under local infiltration, only neurons closer to the winning neuron will be affected by the larger weight update. The mechanism strengthens the competitive advantage of the winning neuron and its immediate neighbors by applying concentrated learning proportional to their proximity to the input pattern. This approach weakens the competition of distant neurons for the current input navigation mark point while strengthening the competition of the winning neuron and its neighboring neurons, thereby maintaining topological stability while improving the precision of local mappings.
As shown in Figure 5, continuously updating the weights of the winning neuron and its neighborhood neurons makes the winning neuron closer and closer to the inputted navigation mark, which effectively improves the local optimization ability of the algorithm in the later stage.
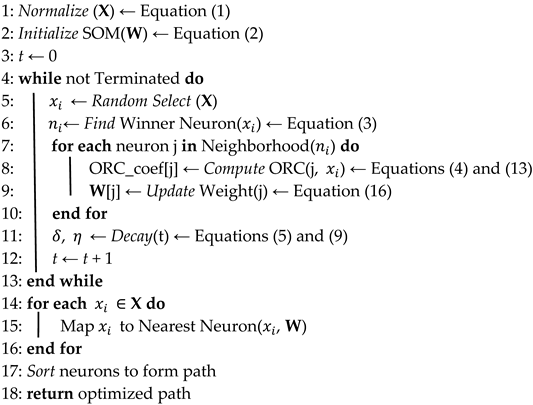
Algorithm 2 shows the pseudo-code of the ORC_SOM algorithm for UAV navigation mark inspection path planning, as follows:
Algorithm 2 ORC_SOM framework
Input: coordinates of inputted navigation mark X
Output: weights of output neurons W, optimized TSP path
Jmse 13 01537 i002

2.4. ORCTS_SOM Algorithm

2.4.1. Randomness of Winning Neurons

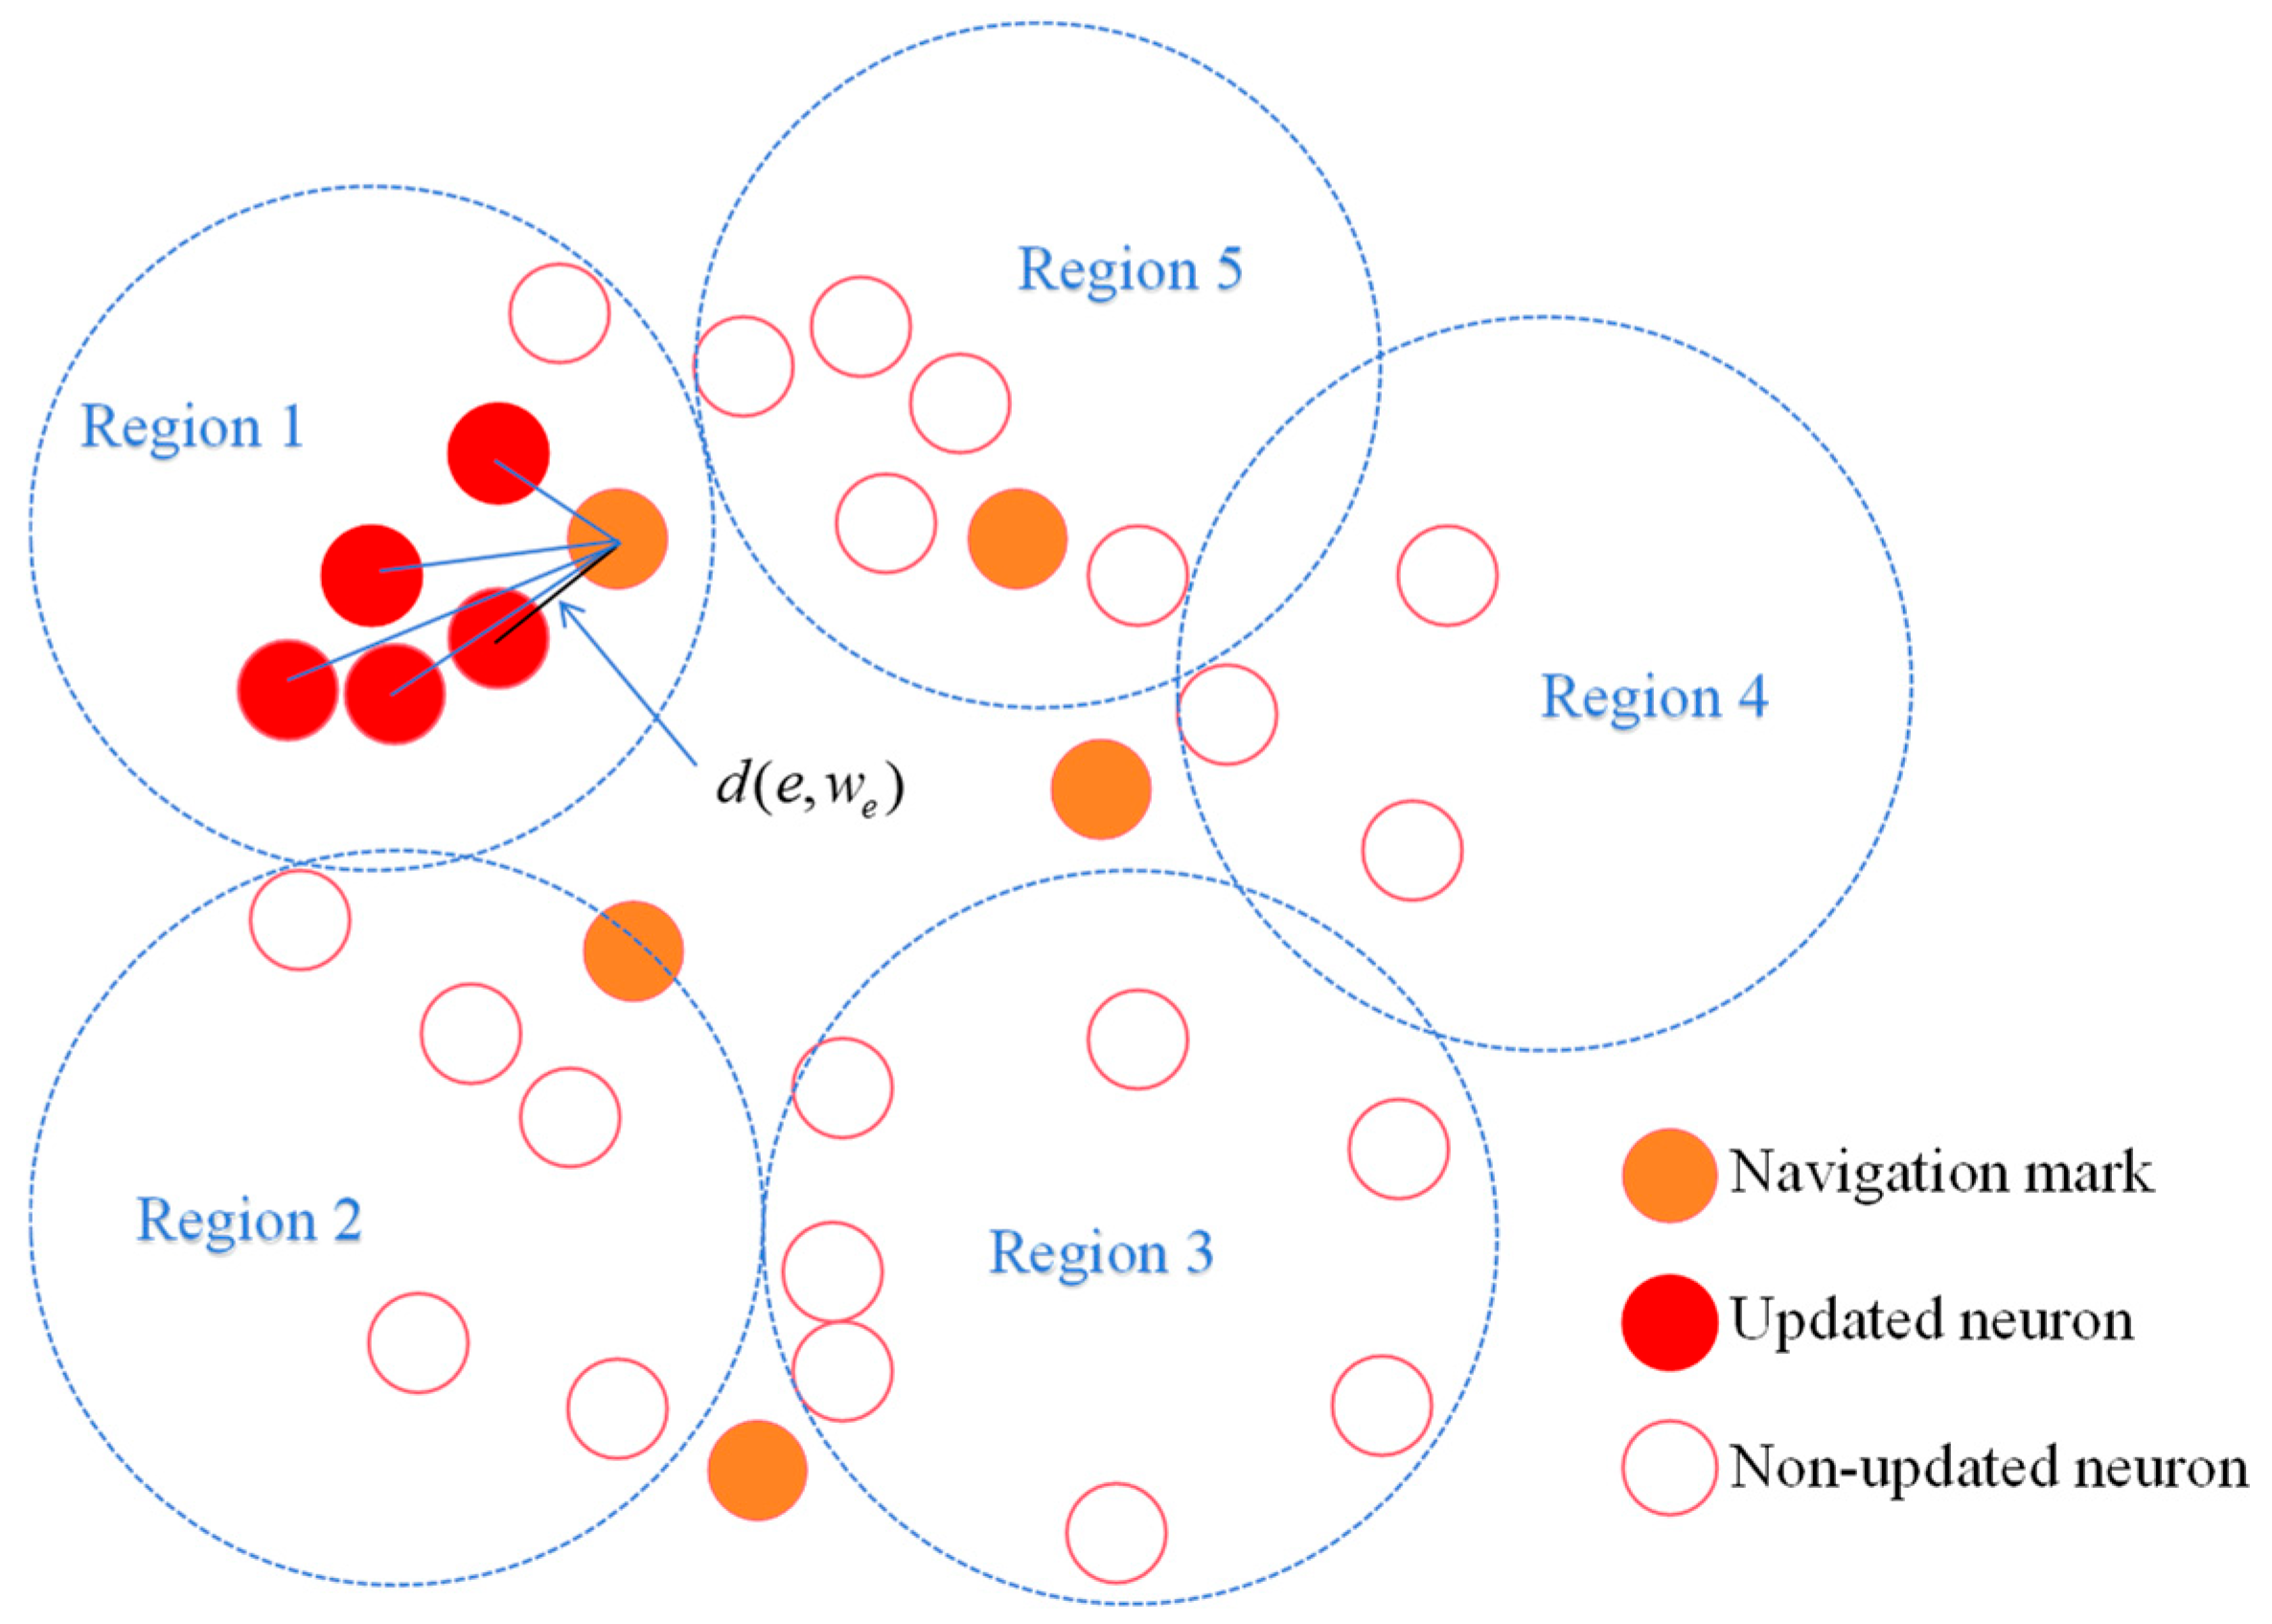
Although the ORC_SOM algorithm, with the introduction of O R C , improves the global optimization search in the early stage of SOM and the local search in the later stage, it is noted that the stimulus applied by the algorithm to the self-organizing mapping neural network is random, i.e., the navigation mark is selected randomly each time. Therefore, the resulting winning neuron is also subjected to stochasticity, which may concentrate on one side of the region several times in a row for continuous stimulation of the neural network that influences the global optimization.
As shown in Figure 6 below, several times in a row, only the weights of neurons in region 1 have been updated, and the other regions have not started learning.
In order to further improve the global optimization seeking ability of the algorithm, this paper proposes an improved ORCTS_SOM algorithm based on the ORC_SOM algorithm by combining it with the Tabu Search algorithm (TS).

2.4.2. Inherent Flaws in Random Sampling Mechanisms

Although the ORC_SOM algorithm improves the traditional SOM by introducing the optimal radius coefficient, it usually adopts a random sampling strategy from the navigation mark set to select training samples when solving TSP, just like the traditional SOM.
Although the mechanism is simple to implement and somewhat exploratory, its inherent randomness raises the following key issues with a limited number of iterations.
(1)
Stochastic Selection Inefficiency.
Let the set of navigation mark be C = { c 1 , c 2 , , c n } in each iteration. The random sampling mechanism in ORC_SOM causes the algorithm to randomly select a navigation mark c i as the current training samples with uniformly distributed probability P c i = 1 n . As the sampling process is uniformly independent and random, the actual frequency of navigation marks c i being selected f i obeys the binomial distribution f i ~ B ( T , 1 n ) , where T denotes the total number of iterations. Due to the volatility of the binomial distribution, the training frequency of different navigation marks varies significantly in actual operation, which will lead to some navigation marks being trained frequently while others are seriously under-trained, affecting the overall learning balance of the network.
(2)
Imbalanced Convergence of Network Topological Structure.
Let the neuron network be N = { n 1 , n 2 , , n m } , the training frequency is too high for the navigation mark, whose surrounding neurons will be repeatedly adjusted, resulting in the local network overfitting the navigation mark; on the contrary, if the training frequency is low for the navigation mark, its corresponding region’s neighboring neurons’ weights are not updated sufficiently, the network in the region of the self-organization of the effect is poor, and ultimately, the topology presents an uneven convergence phenomenon, affecting the overall optimization quality of the path.
(3)
Algorithms easily fall into local optima.
Random sampling methods cannot guarantee that all navigation marks receive sufficient attention during critical learning stages. Frequently trained navigation mark regions will form local convergence regions, and the neural network is over-concentrated in these regions, resulting in an algorithm that is prone to fall into a local optimal solution, making it difficult to explore the globally optimal path.
Define c i as the cumulative number of times the navigation mark, selected during the iteration process:
P c u m c i , t = k = 1 t I c k = c i
where I is the indicator function and the current iteration step is t . In the traditional SOM algorithm, although the cumulative selection probability expectation of each navigation mark C i is the same, its variance is large:
Var [ P cum ( c i , t ) ] = t × 1 n × 1 1 n
This high variance property leads to large fluctuations in the frequency of different navigation marks being sampled during the training process, which triggers instability in the training process and affects the overall convergence quality of the neural network.

2.4.3. Improved SOM Strategy Based on Tabu Search

In order to solve the traditional SOM algorithm’s problems of uneven sample selection and unstable training, an improved algorithm, ORCTS_SOM, is proposed based on the improved ORC_SOM algorithm by further introducing the Tabu Search mechanism. The core idea of the algorithm is to dynamically manage the selection state of the navigation mark through the maintenance of a Tabu List [55], so as to realize the uniformity of sample selection and the stable convergence of the network structure during the training process. The specific steps are as follows:
(1)
System selection control.
Define the Tabu List T = { t 1 , t 2 , , t n } , replace random selection with deterministic rules, where t i indicates the tabu state of the navigation mark c i . When t i > 0 is used, the navigation mark c i is labeled as a tabu state and cannot be selected as a training sample for the time being; when t i = 0 is used, it means that the navigation mark can participate in the training of the current iteration.
(2)
Adaptive exploration.
In order to improve the adaptability and search efficiency of the algorithm, the initial tabu length is set as follows:
L 0 = n 4
where n is the number of navigation marks, . indicates a rounding down function, indicating that the result is rounded down to the nearest integer that is less than or equal to it.
The tabu length decays once after each selection of a navigation mark, decreasing as the algorithm proceeds iteratively, but allowing previously tabued solutions to be reconsidered, thus increasing the diversity of the search. An exponential decay strategy is introduced to dynamically to adjust the tabu length:
L ( t ) = L 0 × α t
where α = 0.97 is the attenuation coefficient and t is the current iteration number.
(3)
Memory-guided convergence.
The tabu length update mechanism (Formula (21)) ensures that each navigation mark receives focused attention when selected, while preventing immediate reselection, eliminating the random variance that plagues ORC_SOM, and achieving deterministic convergence control.
At the beginning of the algorithm, the tabu length of all the navigation marks is set to 0. Each iteration randomly selects a navigation mark in the navigation mark sequence whose current tabu length is 0, and then updates the tabu table, and the tabu length of the navigation mark c i is updated to the initial tabu length of L 0 , and the rest of the navigation marks are kept unchanged if their tabu lengths are 0, or else they are reduced by 1. The following formula is used:
L t + 1 i = L 0 , i = c i L t 1 , L t > 0 a n d i c i 0 , L t = 0
where L t + 1 i indicates the tabu length of the i-th navigation mark at the (t + 1)-th iteration, and i = c i indicates that the current inputted navigation mark is selected.
This mechanism transforms the inherent randomness of ORC_SOM into a controlled, memory-driven process and can realize a smooth transition from the initial extensive contraindication to the later fine control, effectively avoiding the problem of early overfitting and late convergence hysteresis.
Algorithm 3 shows the pseudo-code of the ORCTS_SOM algorithm for UAV navigation mark inspection path planning, as follows:
Algorithm 3 ORCTS_SOM framework
Input: coordinates of inputted navigation mark X
Output: weights of output neurons W, optimized TSP path
Jmse 13 01537 i003

3. Case Study

3.1. Problem Description

When the UAV inspects the navigation mark, it must begin at a designated starting point, examine each navigation mark point in a specified group exactly once, and ultimately return to the starting point, aiming to find a path that minimizes the total flight distance.
Assume a set of n navigation mark points C = { c 1 , c 2 , , c n } , each with coordinates x i , y i . The UAV starts from any starting point c i and returns to the starting point after inspecting all the points. The goal is to determine the shortest path so that the UAV can inspect all the points and return to the starting point.
In this paper, the UAV inspects the navigation mark in the air without considering the obstacles as well as the environmental factors such as wind and waves, and the UAV can move towards the same horizontal plane in any direction during the inspection process, and its path distance is calculated by using the Euclidean distance formula, which is calculated as follows:
D i j = x j x i 2 + y j y i 2
where d i j is the Euclidean distance between the navigation mark points c i and c j .
The objective function is to minimize the total inspection distance and is calculated as follows:
L = m i n i = 0 n j = 0 , j i n d i j × x i j
where x i j is a decision variable indicating whether to inspect from navigation mark point c i to c j . If yes, then x i j = 1 ; otherwise x i j = 0 .
The constraint is that each navigation mark point is inspected once by a UAV:
j = 0 , j i n x i j = 1       i = 1,2 , , n
i = 0 , i j n x i j = 1       j = 1 , 2 , , n
MTZ constraints (Miller–Tucker–Zemlin) are added in order to ensure path connectivity and to prevent the formation of sub-paths [56,57]:
u i u j + n × x i j n 1     i , j = 1 , 2 , , n ,   i j
where u i is an auxiliary variable for eliminating sub-paths and satisfies 2 ≤ u i n2.

3.2. Data Sources

To comprehensively evaluate the proposed algorithm’s performance across different scales and complexities, two representative datasets were selected based on the following criteria:
(1)
Spatial scale diversity—incorporating both regional and large-scale navigation environments;
(2)
Navigation mark density variation—representing different congestion levels typical in coastal navigation;
(3)
Geographical diversity—covering distinct maritime regions with varying navigational challenges.
In this study, two groups of small- and medium-sized, large-scale navigation mark coordinates data are selected for experiments, and the research objects are all kinds of physical navigation marks (light floats, light piles, lighthouses, etc.), excluding virtual navigation marks.
The small- and medium-sized navigation mark position data come from the Fuzhou Navigation Mark Office of the East China Sea Safeguard Center, and the research scope is the sea area of Pingtan, with a total of 274 navigation marks, as shown in Table 2. The large-scale navigation mark position data comes from the Tianjin Navigation Mark Office of the Beihai Safeguard Center, with a total of 742 navigation marks, as shown in Table 3.

3.3. Data Processing

The original coordinate positions of the navigation mark are latitude and longitude coordinates in Degrees, Minutes, Seconds (DMS) format, while the distance calculation method used by SOM is Euclidean distance; therefore, it is necessary to process the collected data for coordinate conversion.
Firstly, the DMS format is converted to the Decimal Degrees (DD) format. The conversion formula is given below:
θ = D + M 60 + S 3600
where θ is the decimal degrees, D is minutes, S is seconds.
Secondly, project the geographic coordinates onto a planar coordinate system, i.e., convert the transformed coordinates into planar coordinates. Since both datasets cover relatively small regional marine areas, using standard projections would produce significant distance distortion at projection boundaries or in areas far from the central meridian. Therefore, a local coordinate transformation based on selected reference points is adopted. This local transformation uses reference points within the region as benchmarks, which can minimize distance distortion within that area. Assuming that the datum coordinates for ( λ 0 , φ 0 ) , need to convert the coordinates for ( λ 1 , φ 1 ) , the conversion of the mathematical formula is as follows:
X = k × ( c o s λ 0 × s i n λ 1 s i n λ 0 × c o s λ 1 × c o s ( φ 1 φ 0 ) ) × R
Y = k × c o s λ 1 × s i n ( φ 1 φ 0 ) ) × R
where λ 0 is the radian value of latitude λ 0 , take λ 0 = λ 0 × π / 180 (other longitude/latitude coordinates are converted to radians in the same way). R is the Earth’s radius, taken as 6371.0 km. k is a scale factor used to correct the calculation of great-circle distance, whose calculation formula is as follows:
k = ( c / s i n c )
c = a r c c o s ( s i n λ 0 × s i n λ 1 + c o s λ 0 × c o s λ 1 × c o s ( φ 1 φ 0 ) )
where c if 0, then k is 1.
According to the collected coordinates position of the navigation mark coordinates, the coordinates (25.29° N, 119.47° E), (38.87° N, 117.97° E) were selected as the datum points for the two sets of data, and the other latitude and longitude coordinates were converted to planar coordinates, and the results of the conversion are shown in Table 4 and Table 5, respectively.

3.4. Data Analysis

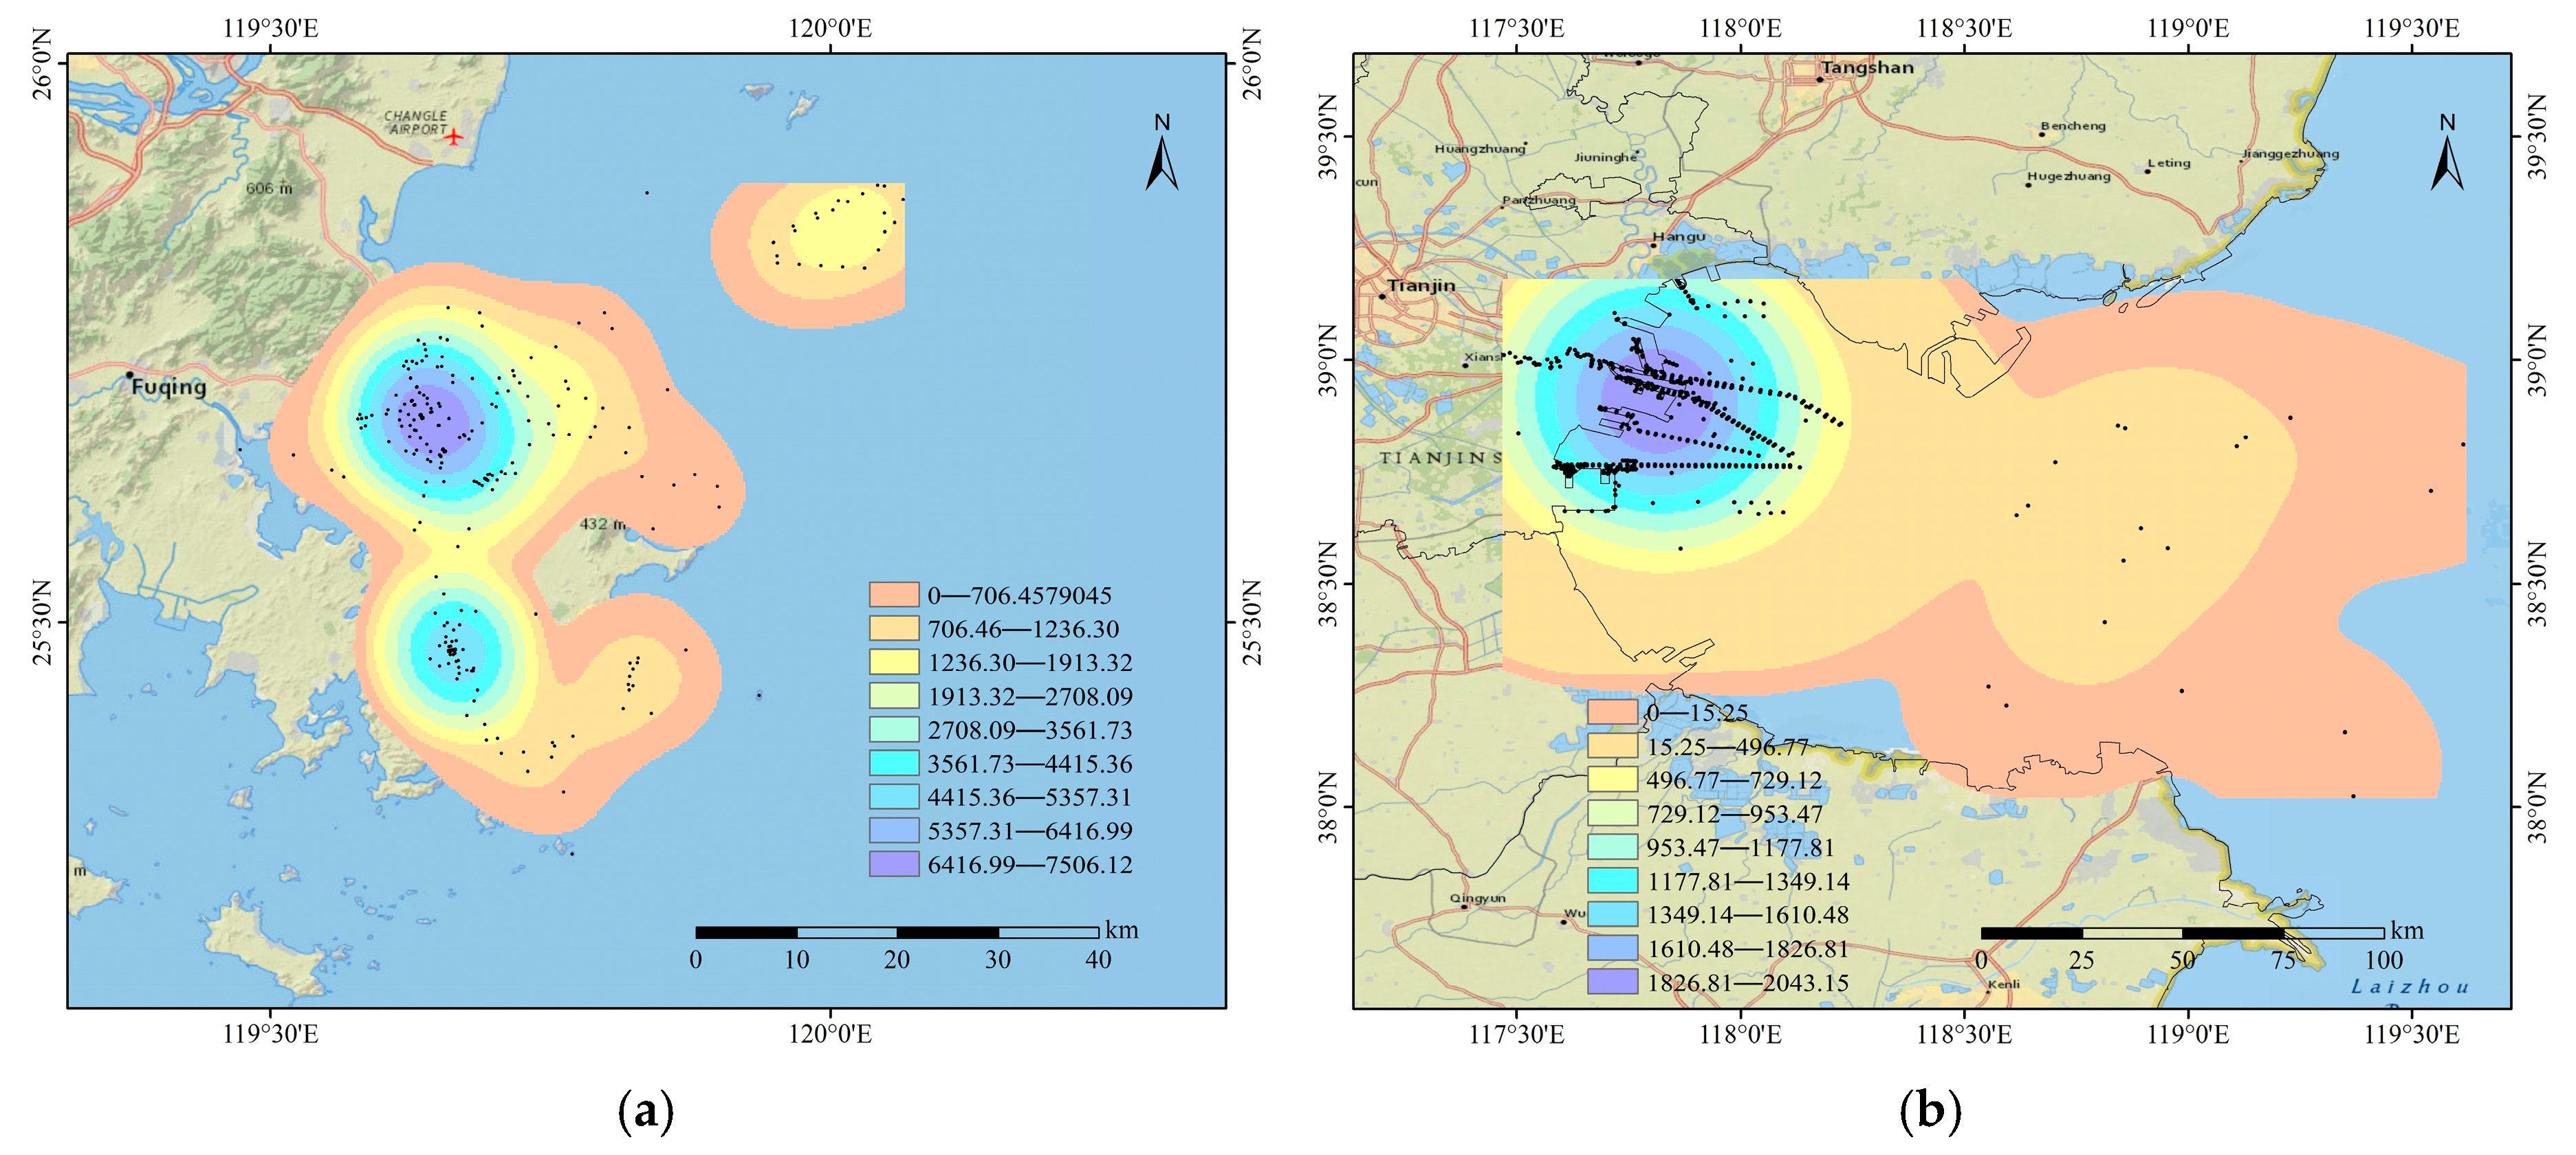
After the data processing process in Section 3.3, the positional distribution characteristics of the two sets of navigation mark data are shown in Figure 7.
From Figure 7a, it can be seen that the spatial distribution of navigation marks in Pingtan waters is relatively uniform, the overall structure is clear, and there is a certain degree of aggregation in the local area, which is suitable as a small- and medium-sized problem for evaluating the improved SOM algorithm’s performance of path planning and preliminary optimization ability.
From Figure 7b, it can be seen that the navigation marks in Tianjin waters are characterized by a large number, wide distribution, and big difference in density. The left side of the region is highly dense, while the right side is scattered, and the overall structure shows obvious non-uniformity and complexity. This feature not only increases the span of path connection but also improves the difficulty of global optimization and local optimization in path planning, which puts forward higher requirements on the stability and convergence performance of the algorithm. Therefore, this dataset has typical large-scale and non-uniform distribution characteristics, which is suitable as a test scenario to further verify the performance of the improved SOM algorithm.

4. Experimental Results and Discussion

In order to verify the advantageousness of the improved SOM model applied to UAV inspection navigation mark path planning, the traditional SOM algorithm, as well as two current mainstream intelligent algorithms (GA and PSO), are selected as base models. Due to a certain degree of randomness in the solving process of the intelligent algorithms, resulting in a certain difference in each solving result, ten experiments are conducted for each intelligent model to alleviate the bias caused by randomness. The experimental software is PyCharm (Python 3.12), the processor is AMD Ryzen 7 2700U with Radeon Vega Mobile Gfx 2.20 GHz, and the RAM is 8.00 GB. The manufacturer of the AMD Ryzen 7 2700U is Advanced Micro Devices, Inc. (AMD), headquartered in Santa Clara, California, United States.

4.1. Path Planning of UAV Navigation Mark Inspection

4.1.1. Path Planning of Navigation Mark UAV Inspection in Pingtan Waters

The processed navigation mark data is trained using three SOM algorithms, with the initial learning rate taken as 0.8 and the maximum number of iterations taken as 100,000. Ten experiments were conducted separately, and the path diagrams were plotted every 1000 iterations. The neural network iteration process for a certain experiment is detailed as follows, respectively.
As shown in Figure 8, Figure 9, Figure 10 and Figure 11, the three algorithms exhibited different iteration characteristics but achieved highly consistent final path directions, efficiently connecting all navigation mark, with ORCTS_SOM achieving the shortest path length planning.
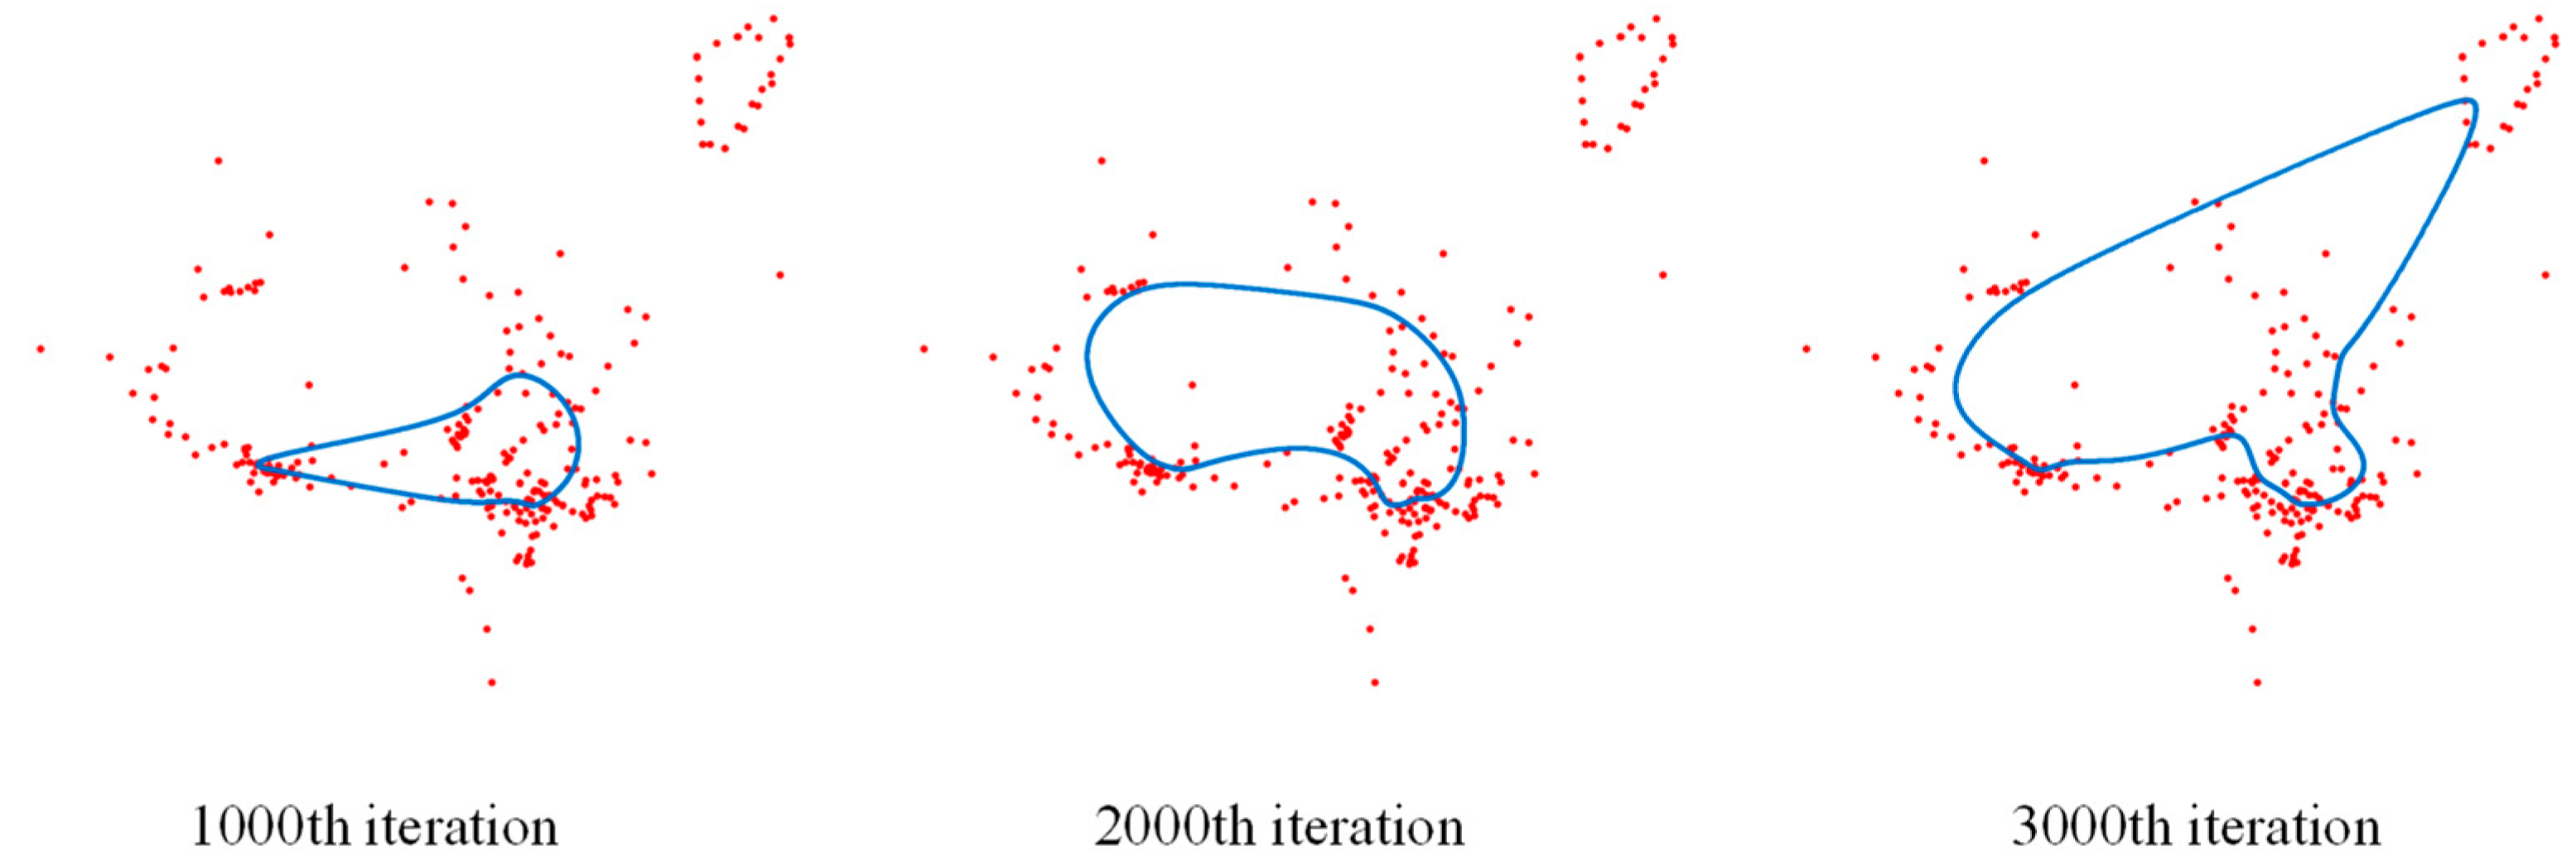
During the early training stage (before 3000 iterations), as shown in Figure 12 below, SOM demonstrated rapid path expansion approaching the final shape due to its emphasis on global optimization, larger neighborhood radius, and higher learning rate. In contrast, as shown in Figure 13 and Figure 14, ORC_SOM and ORCTS_SOM generated paths with smaller initial coverage, with their designs focusing more on path optimization quality rather than expansion speed. ORC_SOM achieved smoother weight updates through its generalized competition and local infiltration mechanism, while ORCTS_SOM incorporated Tabu Search to avoid repeated adjustments and help paths escape local optima.
As shown in Figure 15, all three algorithms achieved complete coverage of all navigation mark points at the 15,000th iteration. The later training stage involved fine-tuning to reduce path bias and redundancy. Figure 16 and Figure 17 demonstrate the further optimization and adjustment process of the ORC_SOM algorithm for paths from the 15,000th iteration to the 18,000th iteration, which enabled the paths to more accurately fit the distribution of navigation mark points.
Take the red circled area in Figure 16 as an example and zoom in to Figure 17 below.
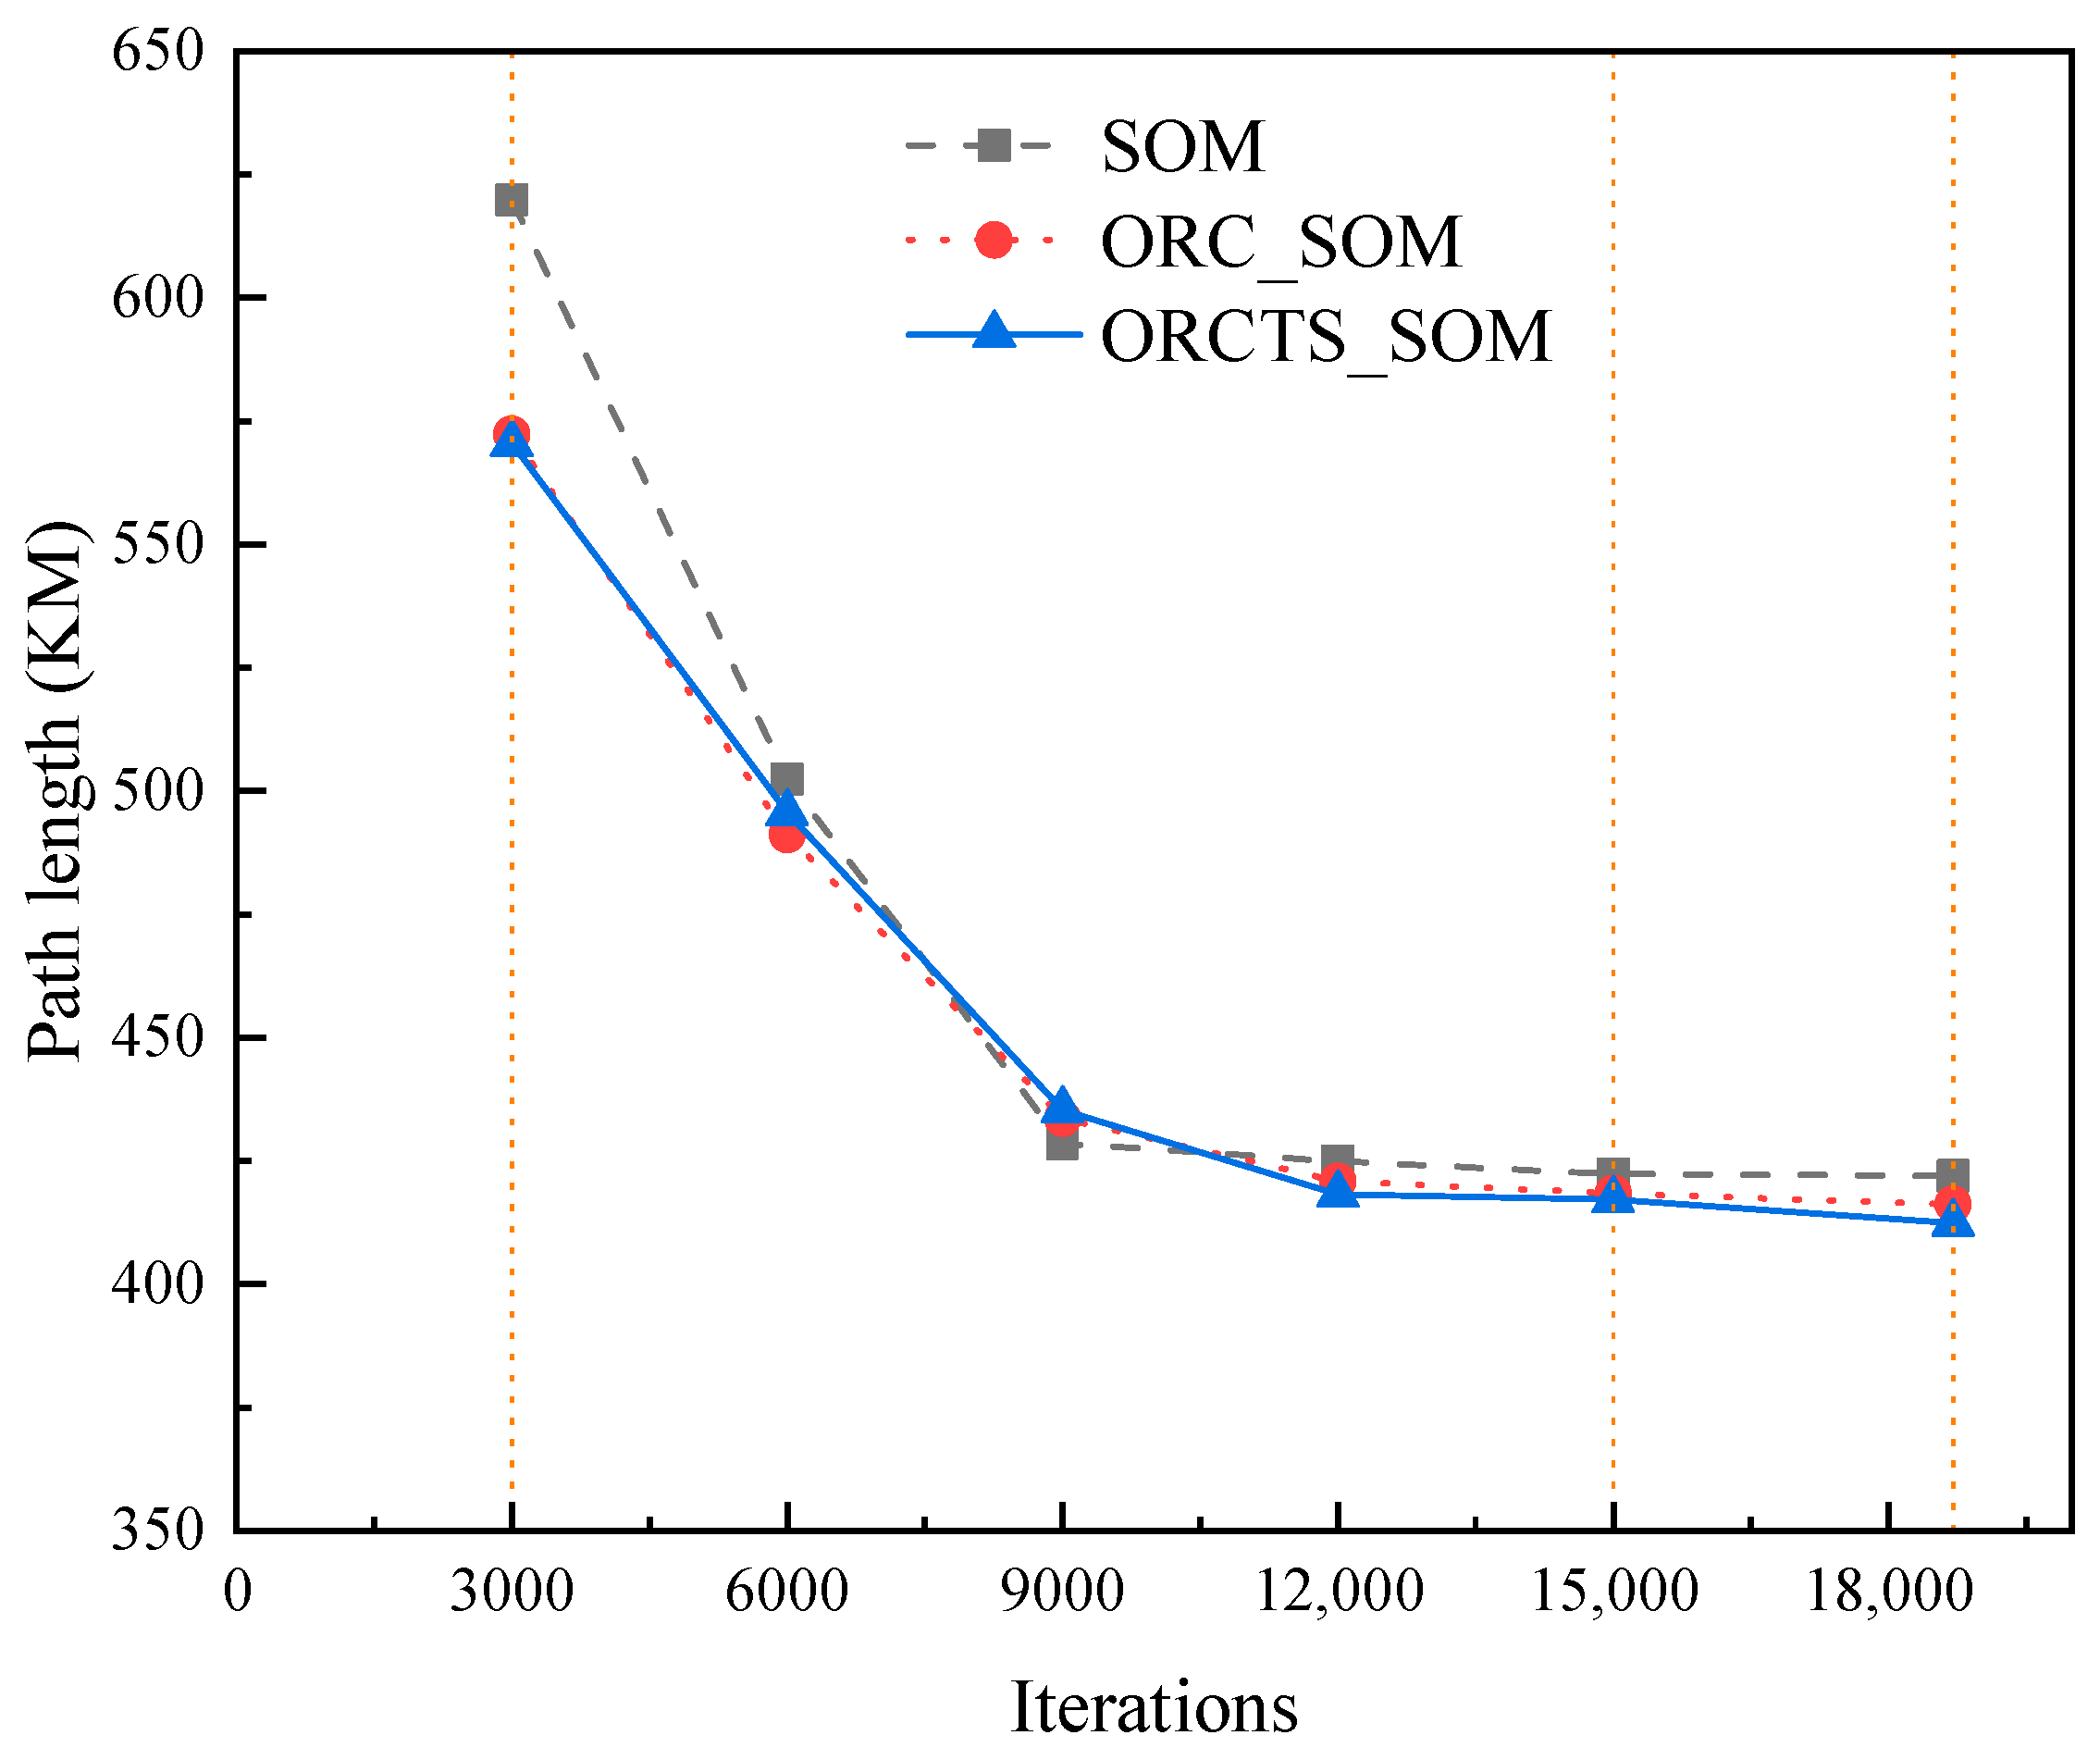
The path lengths of the three algorithms for each of the ten experiments every 3000 iterations are calculated as the mean value and organized into the following Figure 18, which observes the change in the path planning lengths of the three algorithms with the number of iterations, and shows that in the 3000th iteration, the path lengths of SOM are much longer than those of the two improved algorithms, which further verifies that it has a larger path expansion range and lacks an effective convergence control in the first 3000 iterations; while in the 15,000th iteration to the convergence stage, the path changes in the three algorithms tend to be stable, and in terms of further fine optimization of the path lengths, ORCTS_SOM has the highest accuracy, and ORC_SOM is the second one. Overall, two improved algorithms are better than the standard SOM in terms of convergence speed and optimization accuracy.
The GA and PSO algorithms are then used to do comparison experiments, ten groups of experiments are carried out, respectively, in which the parameters Population Size, Number of Iterations, Selection Ratio, and Mutation Ratio of the GA model are set to 50, 5000, 0.2, and 0.2, respectively; and the parameters Maximum Iterations and Number of Particle Swarms of the PSO model are set to 5000 and 150, respectively. The results of the comparison experiments are shown in Figure 19 below.
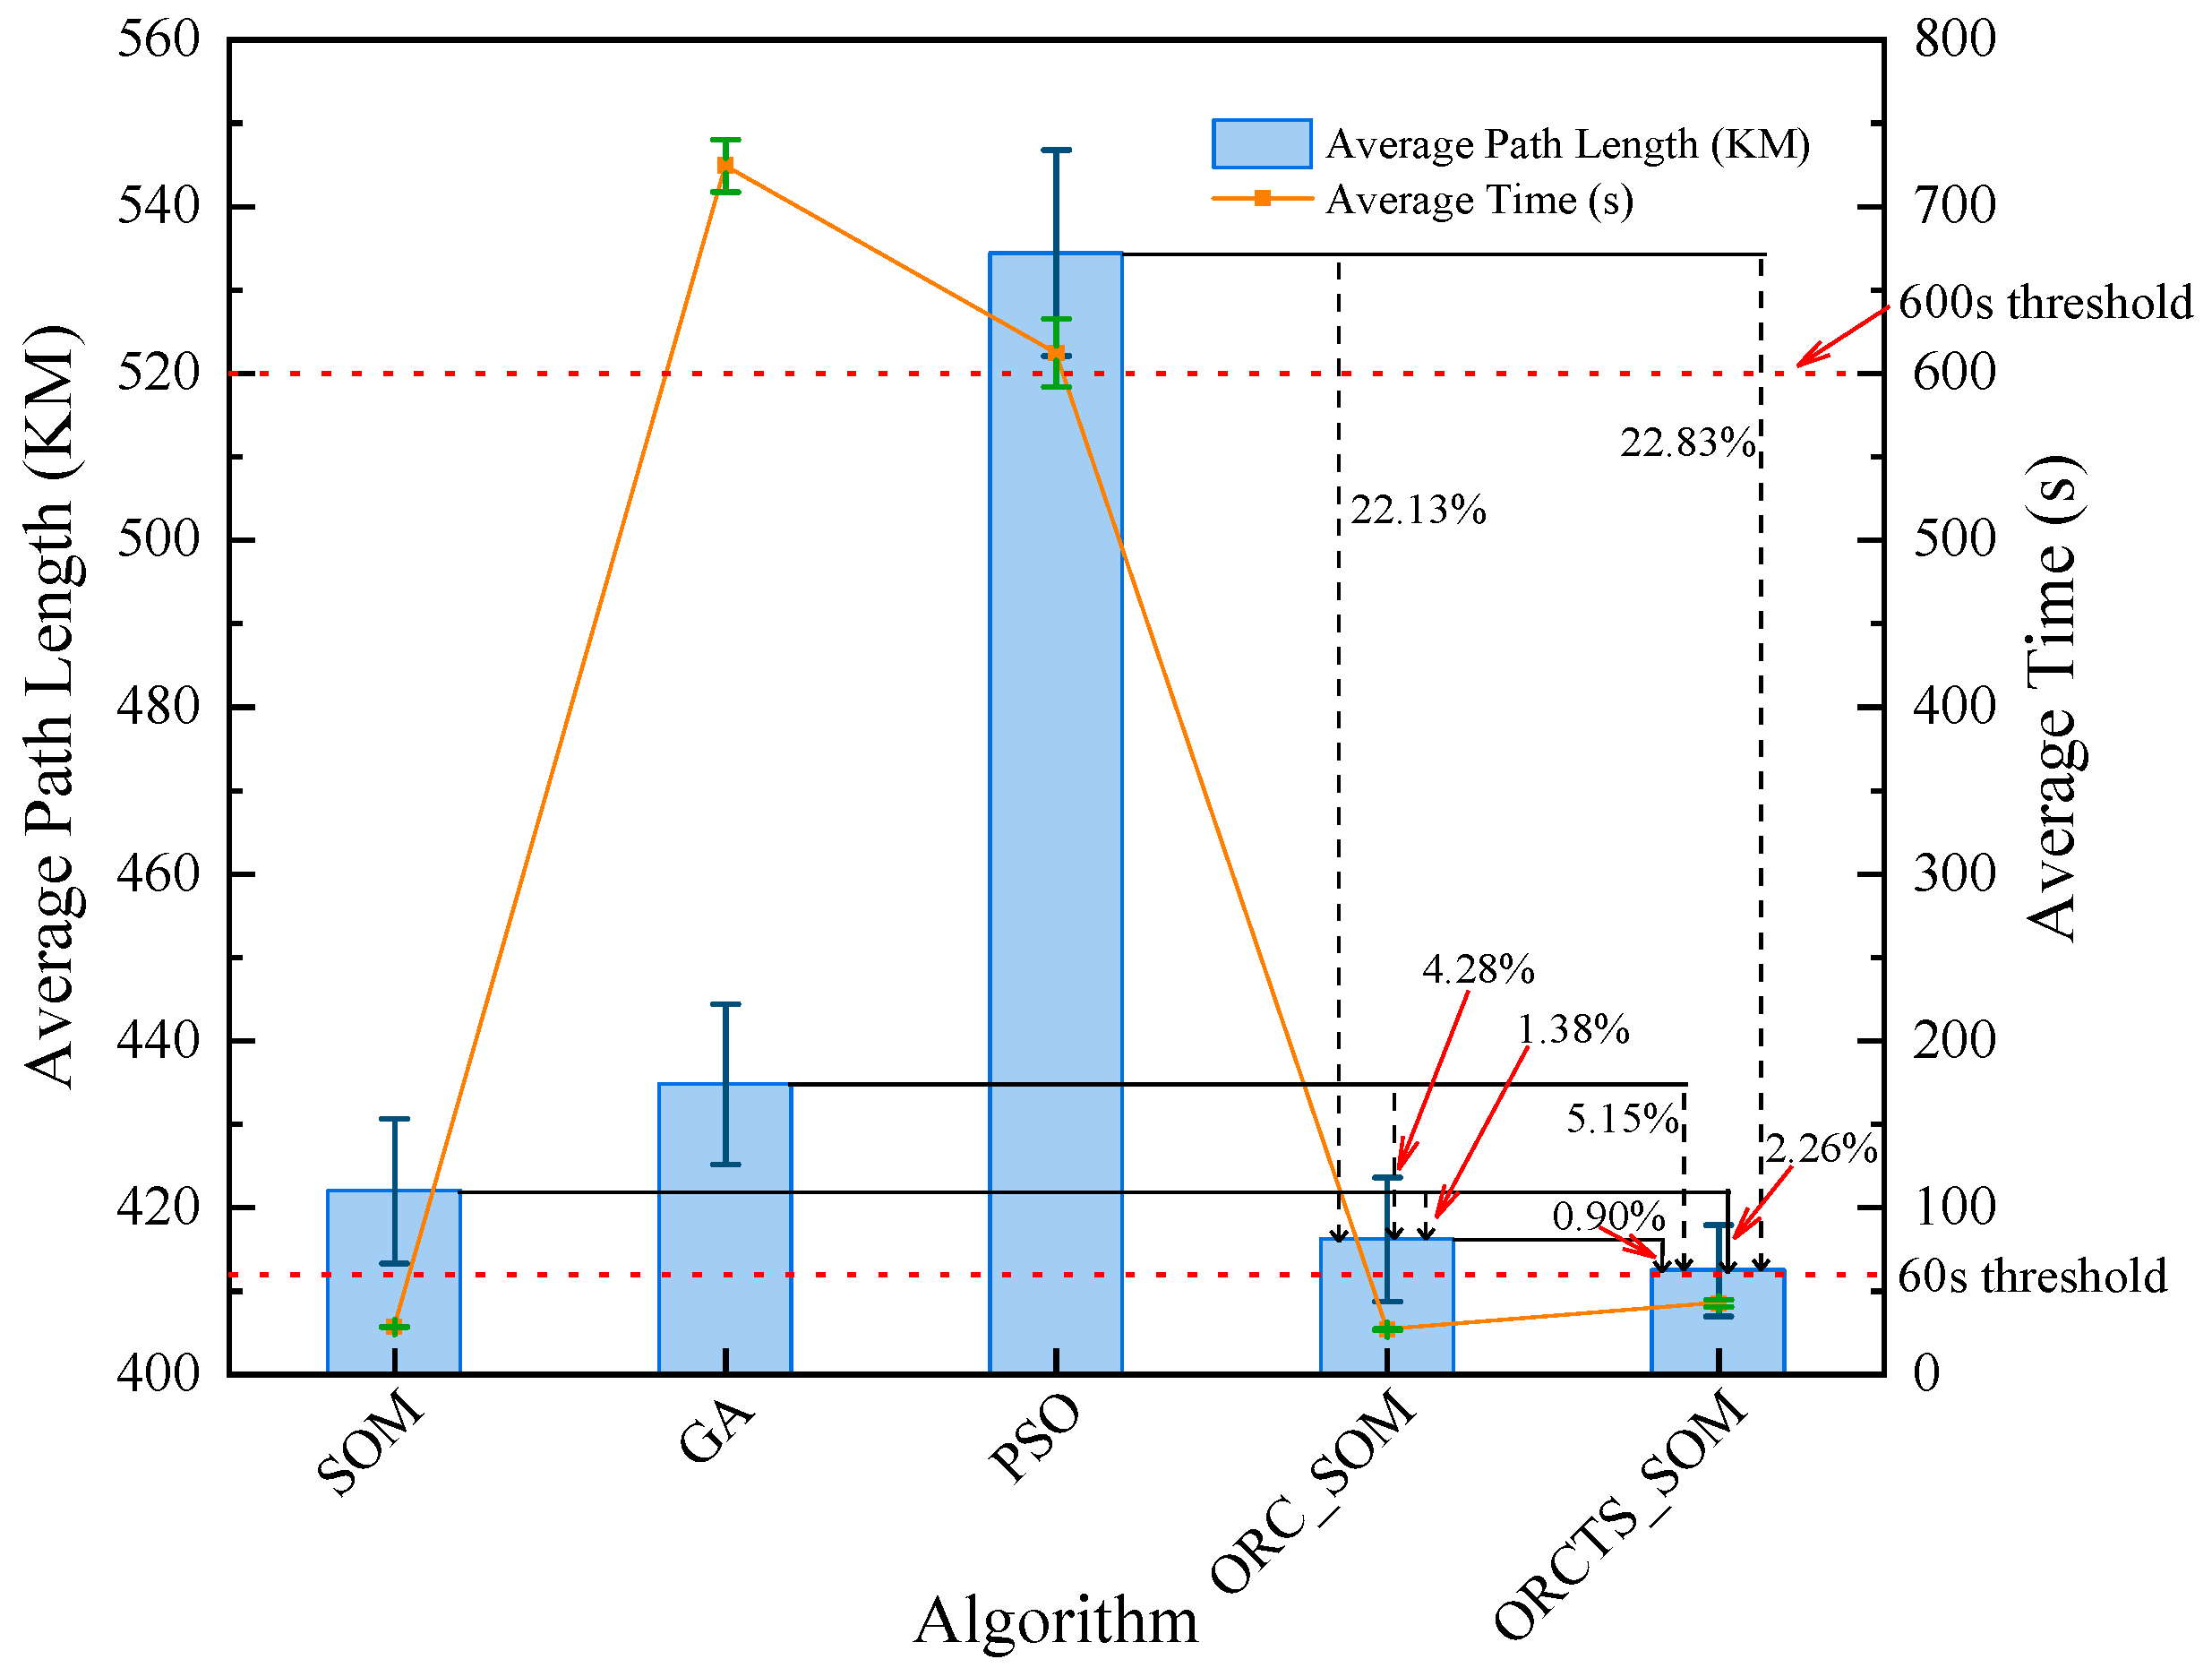
As can be seen in Figure 19, the improved ORCTS_SOM has the shortest average planned path, followed by ORC_SOM, with a decrease of 2.26% and 0.90% compared to the traditional SOM algorithm. Compared with the baseline algorithms GA and PSO, decreased by 5.15%, 22.83%, and 4.28%, 22.13%, respectively; and both the ORCTS_SOM and ORC_SOM algorithms are able to complete the path planning within 1 min, which has a very fast response time. This indicates that the improved algorithms substantially increase the planning speed while ensuring the path quality.
As shown in Table 6, the traditional heuristic algorithms exhibit greater volatility in both path length and runtime compared to SOM-based methods. The improved ORCTS_SOM and ORC_SOM algorithms reduced the standard deviation of path planning length by 37.0% and 14.4%, respectively, compared to the standard SOM, validating the effectiveness of the proposed improvement strategies and significantly enhancing the stability and reliability of the solutions. However, the variability in runtime increased, which reflects the computational characteristics of complex optimization strategies.

4.1.2. Path Planning of Navigation Mark UAV Inspection in Tianjin Waters

The number of navigation marks in Pingtan waters is 274, which can be regarded as a small- and medium-sized TSP. To verify the performance of two improved SOM algorithms for different scales of navigation marks, 742 navigation marks in Tianjin waters are selected for the solution, and the same 100,000 iterations are carried out, and the algorithm’s parameters are the same as those in Section 4.1.1.
The final path diagrams generated by each of the three SOM algorithms for a certain experiment are as follows:
As can be seen from Figure 20 above, the overall path directions generated by the three algorithms are highly consistent too, and the navigation marks can be connected in sequence, meeting the requirements of path planning.
Analogously to Section 4.1.1, the experimental results of the navigation mark inspection in Tianjin waters are shown in Figure 21 and Figure 22 below.
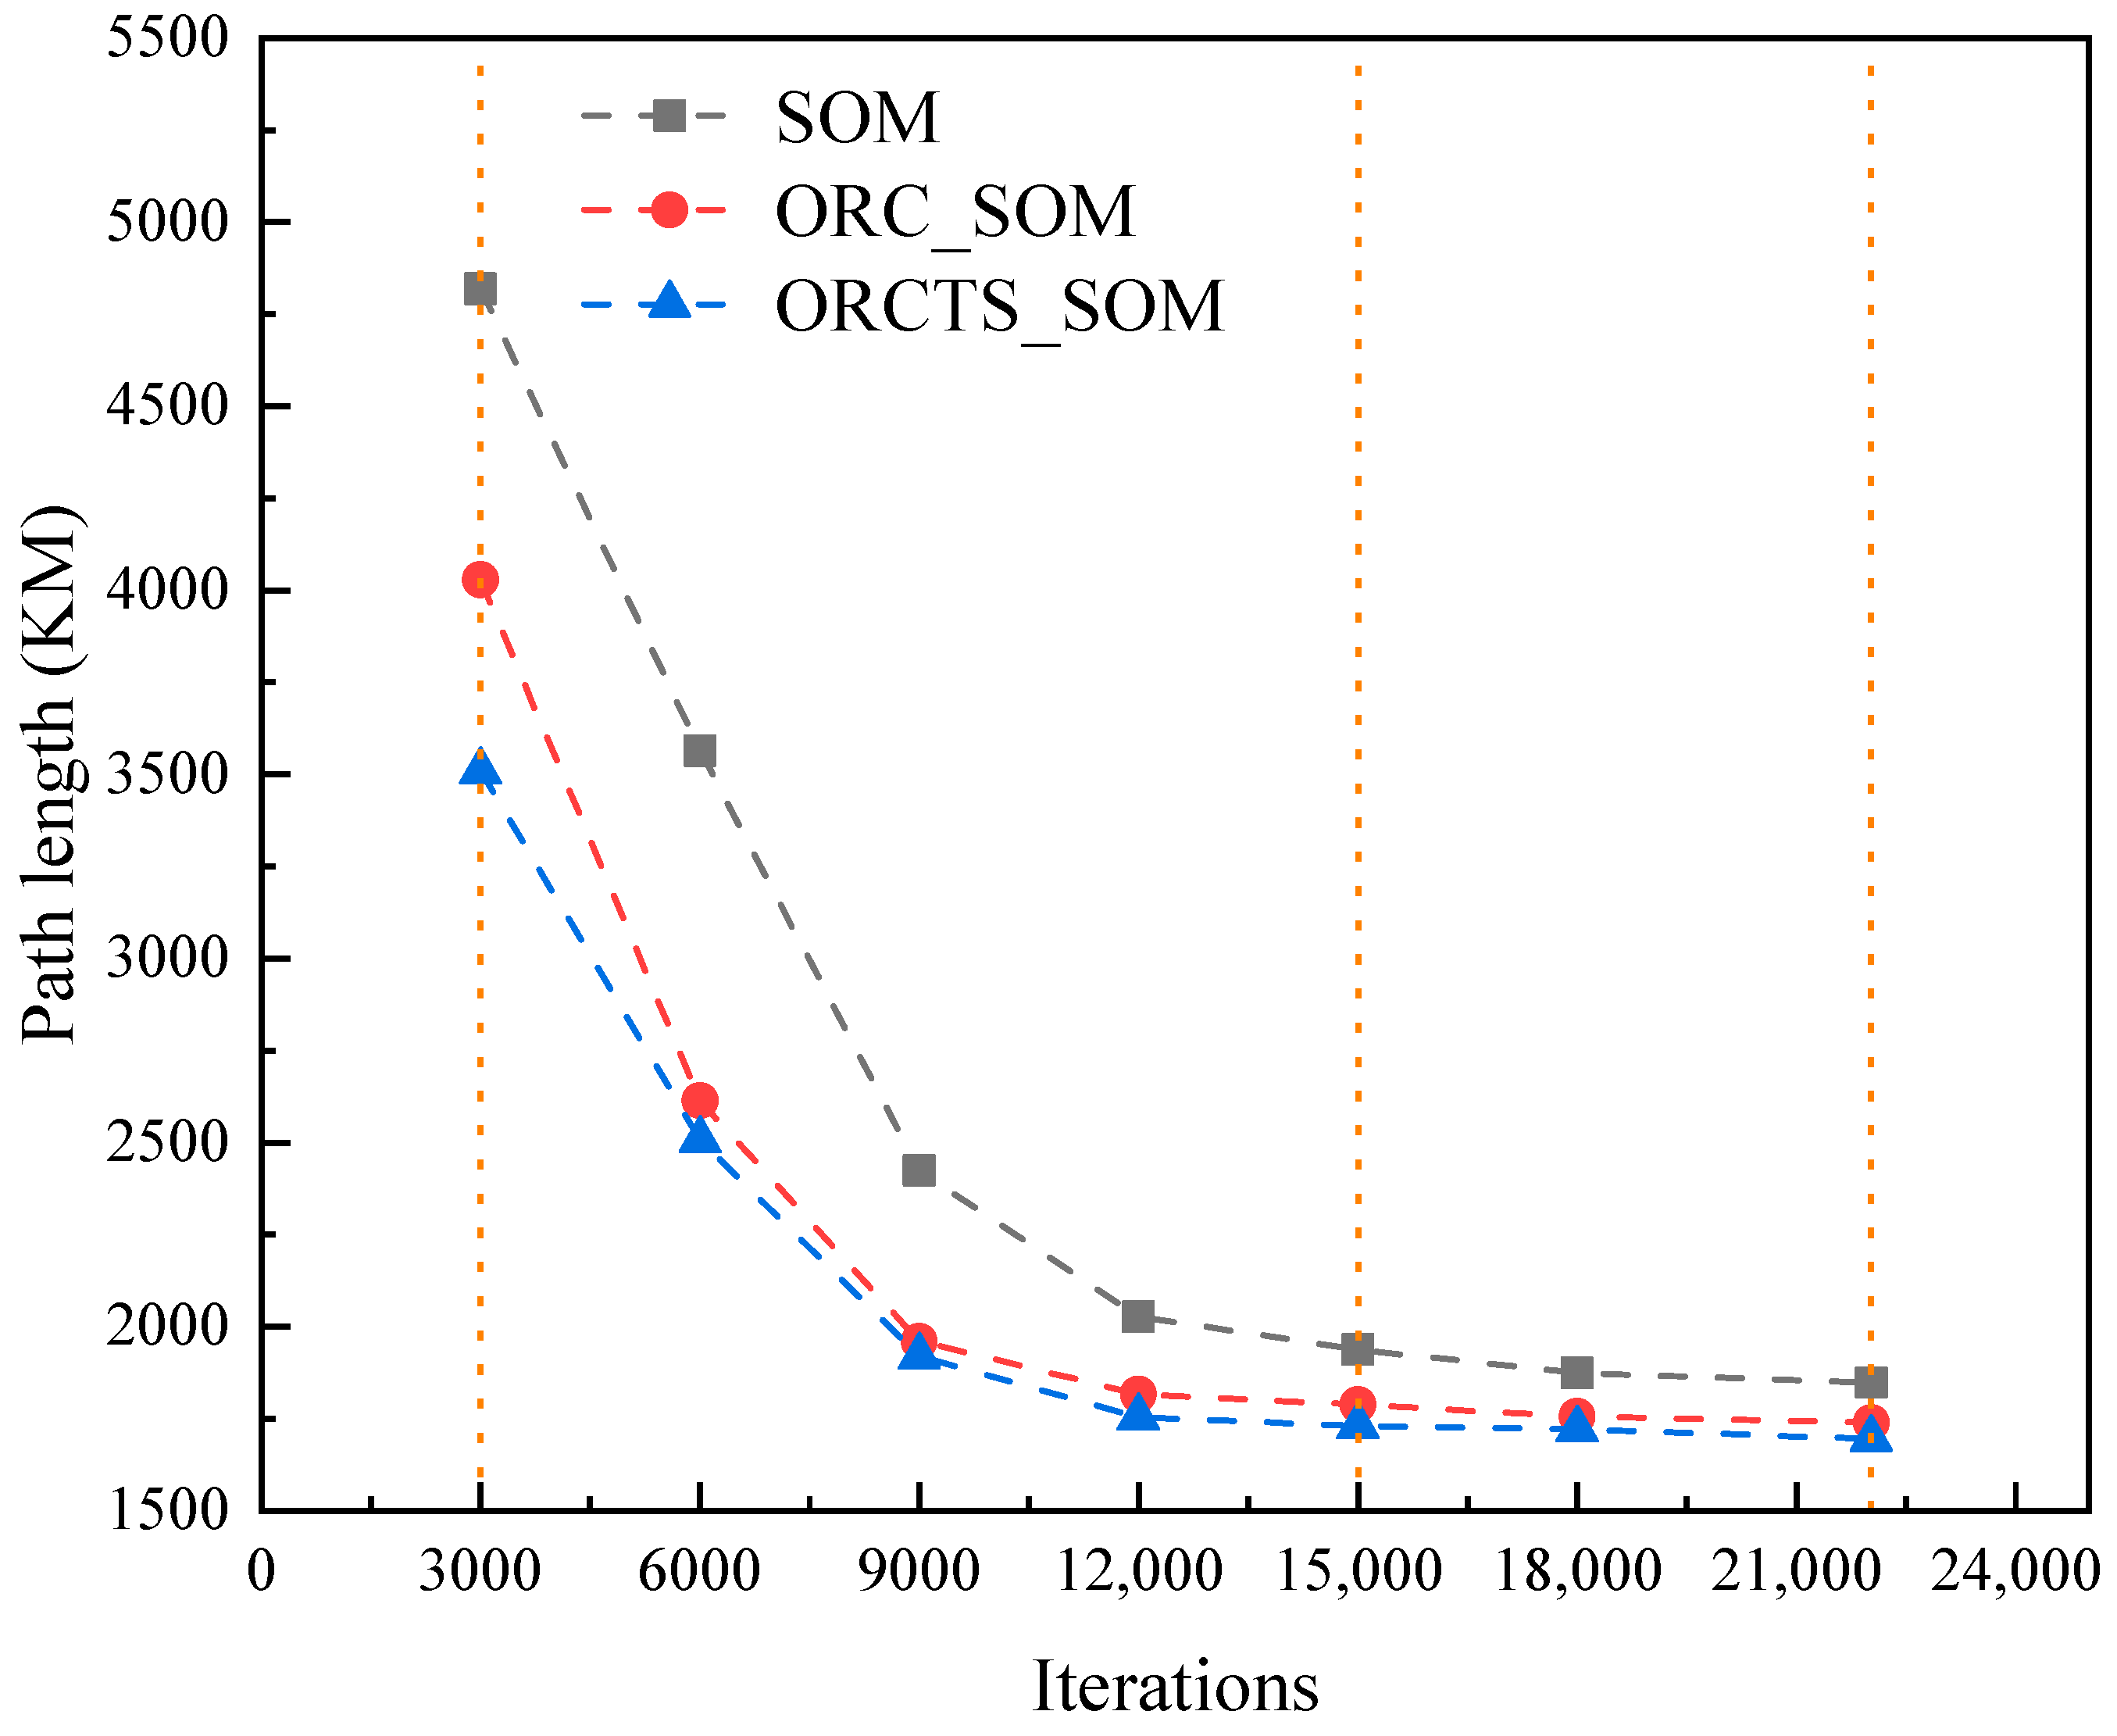
Figure 21 shows the variation in the path planning performance of the three SOM algorithms with the number of iterations on the large-scale navigation mark dataset in Tianjin. The results show that in the first 3000 iterations, the path length of the traditional SOM algorithm is significantly higher than that of two improved algorithms, indicating that its initial search capability is insufficient. As the iteration progresses, the path lengths of the ORC_SOM and ORCTS_SOM algorithms decrease faster, especially in the interval of 6000–12,000 iterations, which shows better convergence speed and optimization. In the final stage (≥15,000 iterations), the ORCTS_SOM algorithm converges to the shortest path and shows the optimal path planning ability, followed by ORC_SOM, both of which are better than the SOM algorithm, which verifies the validity and robustness of the two improved algorithms in large-scale complex scenarios.
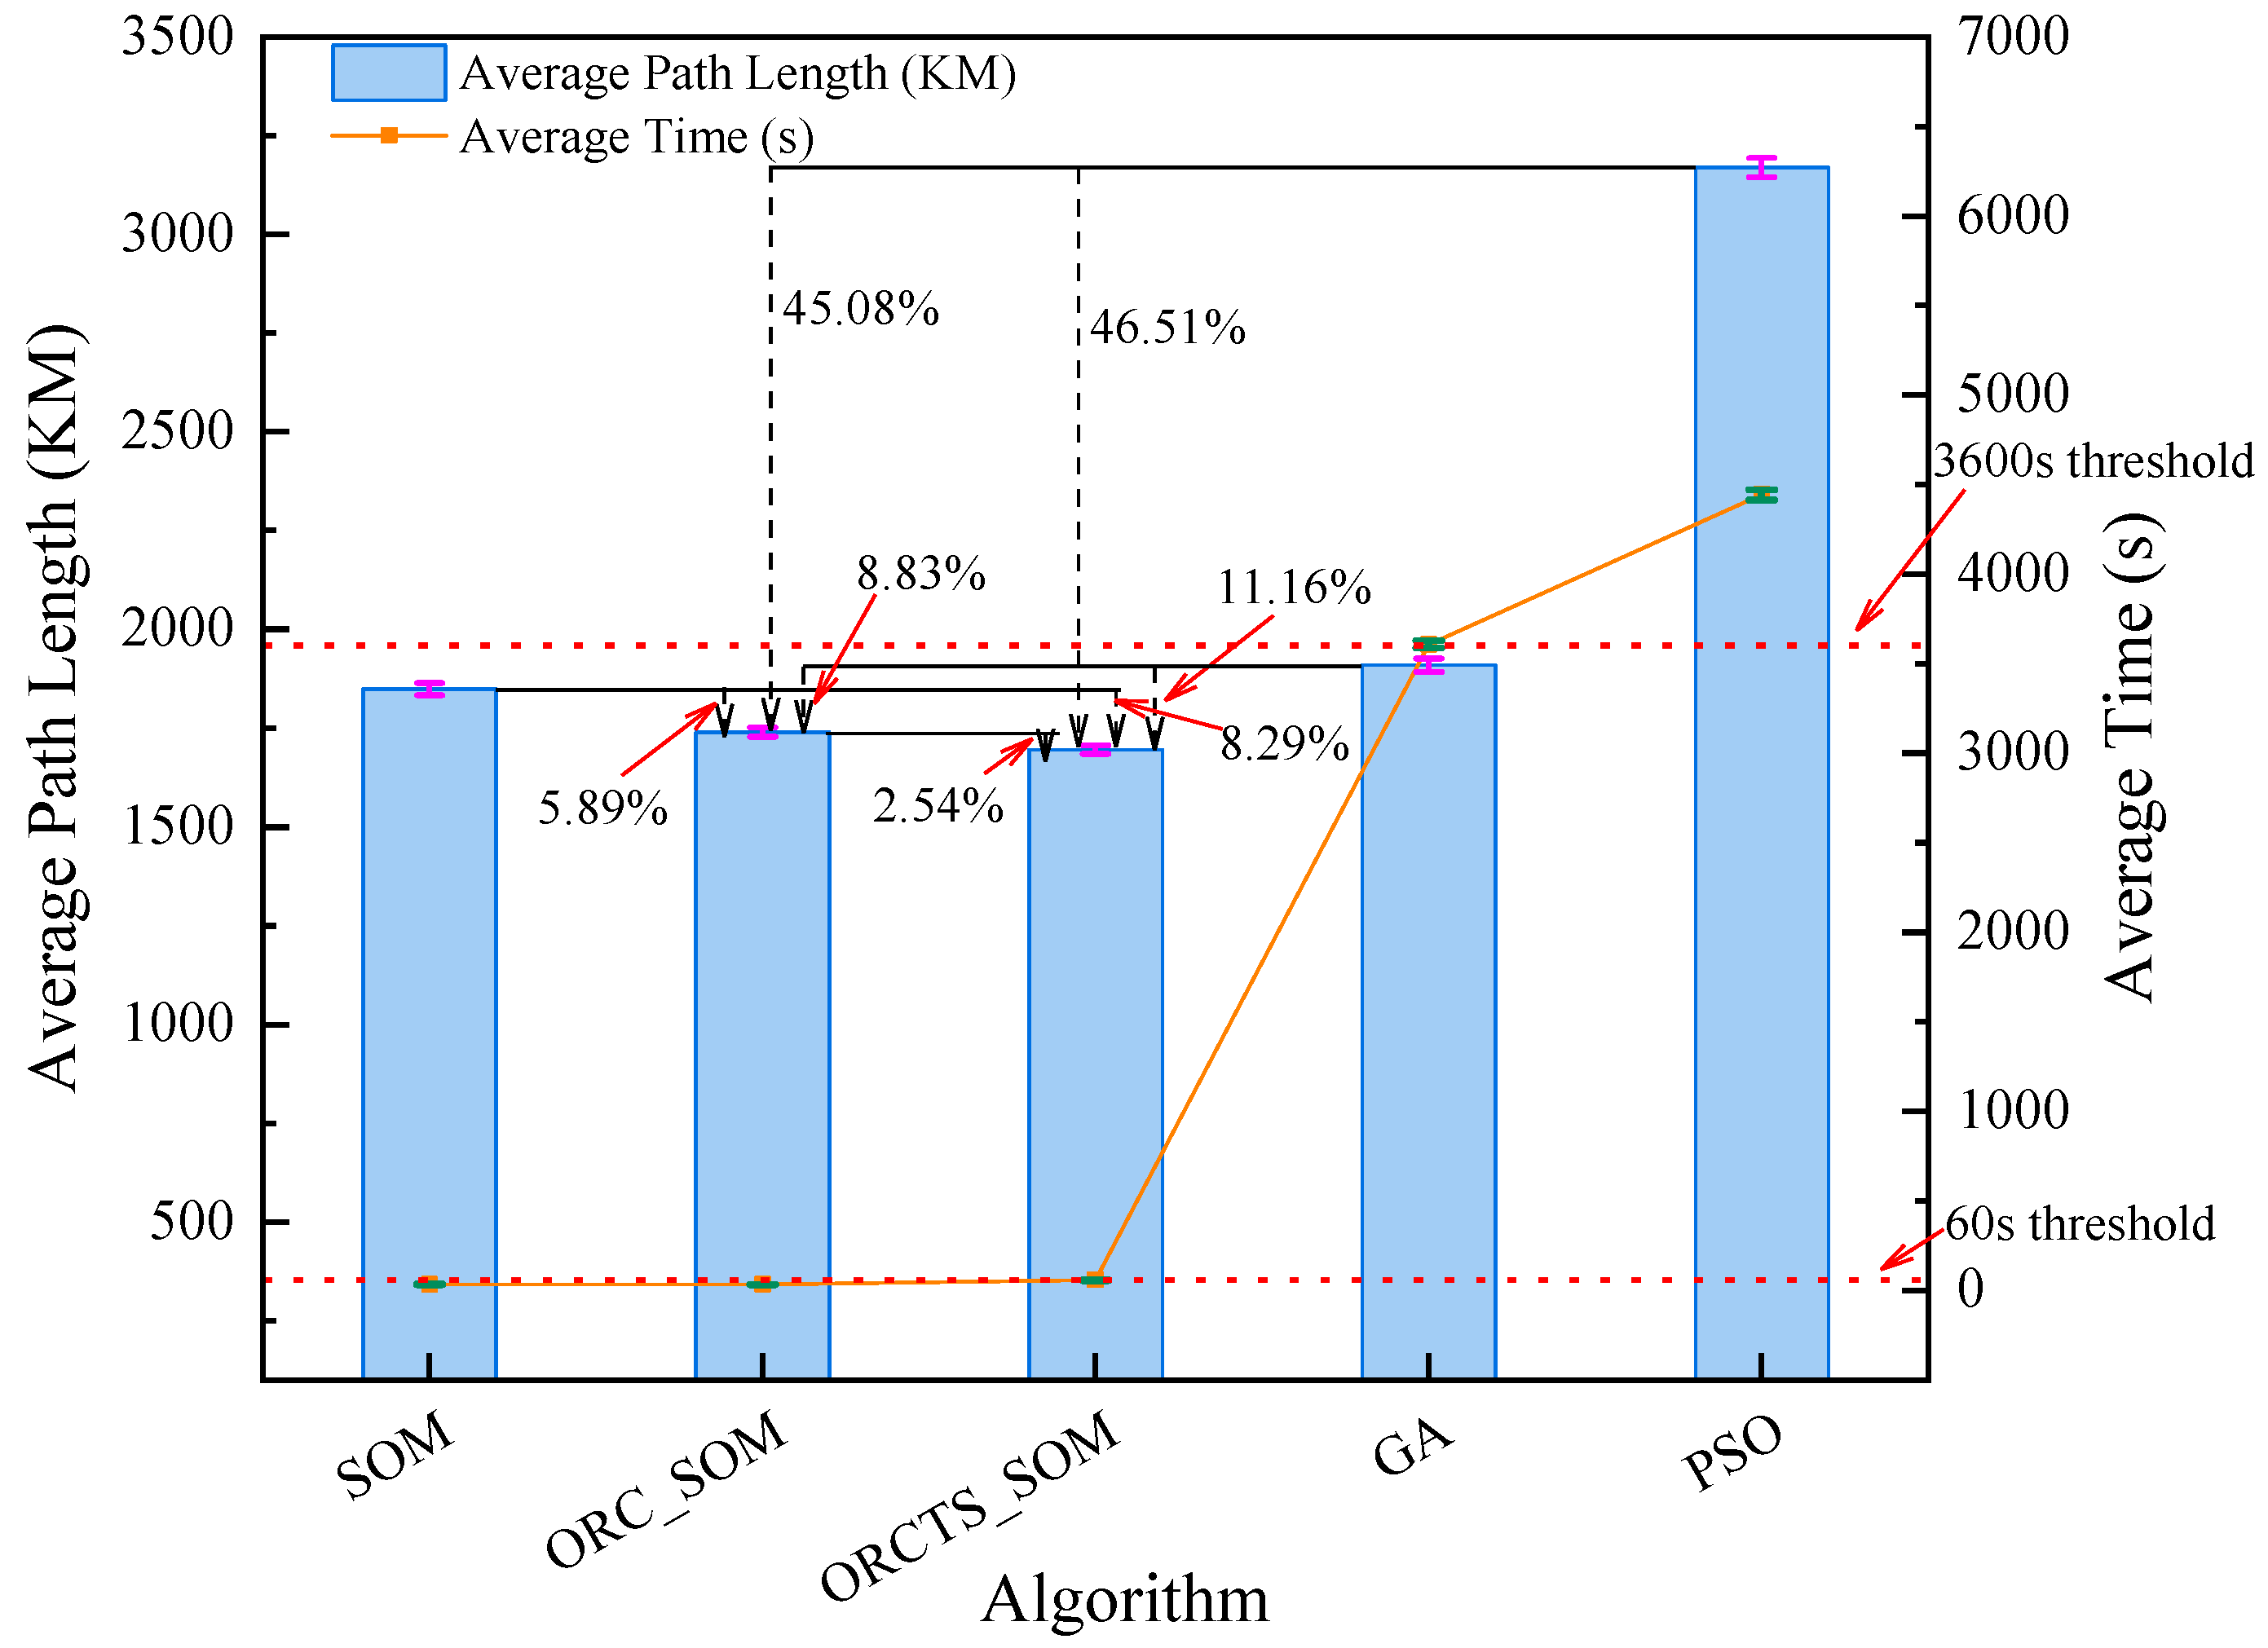
As shown in Figure 22, the improved algorithms ORC_SOM and ORCTS_SOM achieve significant path optimization effects on the large-scale navigation mark dataset in Tianjin waters, and both algorithms can effectively shorten the average path length to a low level despite the significant increase in the number of navigation marks. On this basis, the path planning time of both algorithms is stably controlled within 1 min, which is much lower than that of the traditional algorithms such as GA and PSO (more than 1 h); this demonstrates that the proposed improved algorithms can effectively balance path optimization quality and computational efficiency in large-scale, high-complexity scenarios.
As shown in Table 7, the improved SOM algorithms not only maintain their path planning stability advantages on large-scale datasets, but also more significantly achieve enhanced computational time stability, with ORC-SOM and ORCTS-SOM exhibiting runtime standard deviations (σ = 0.29 s and 1.07 s) that both outperform the standard SOM (σ = 1.24 s). This scale-adaptive characteristic validates that the proposed improvement strategies demonstrate more effective and stable optimization mechanisms in complex problems, confirming their suitability for large-scale maritime navigation mark inspection applications.
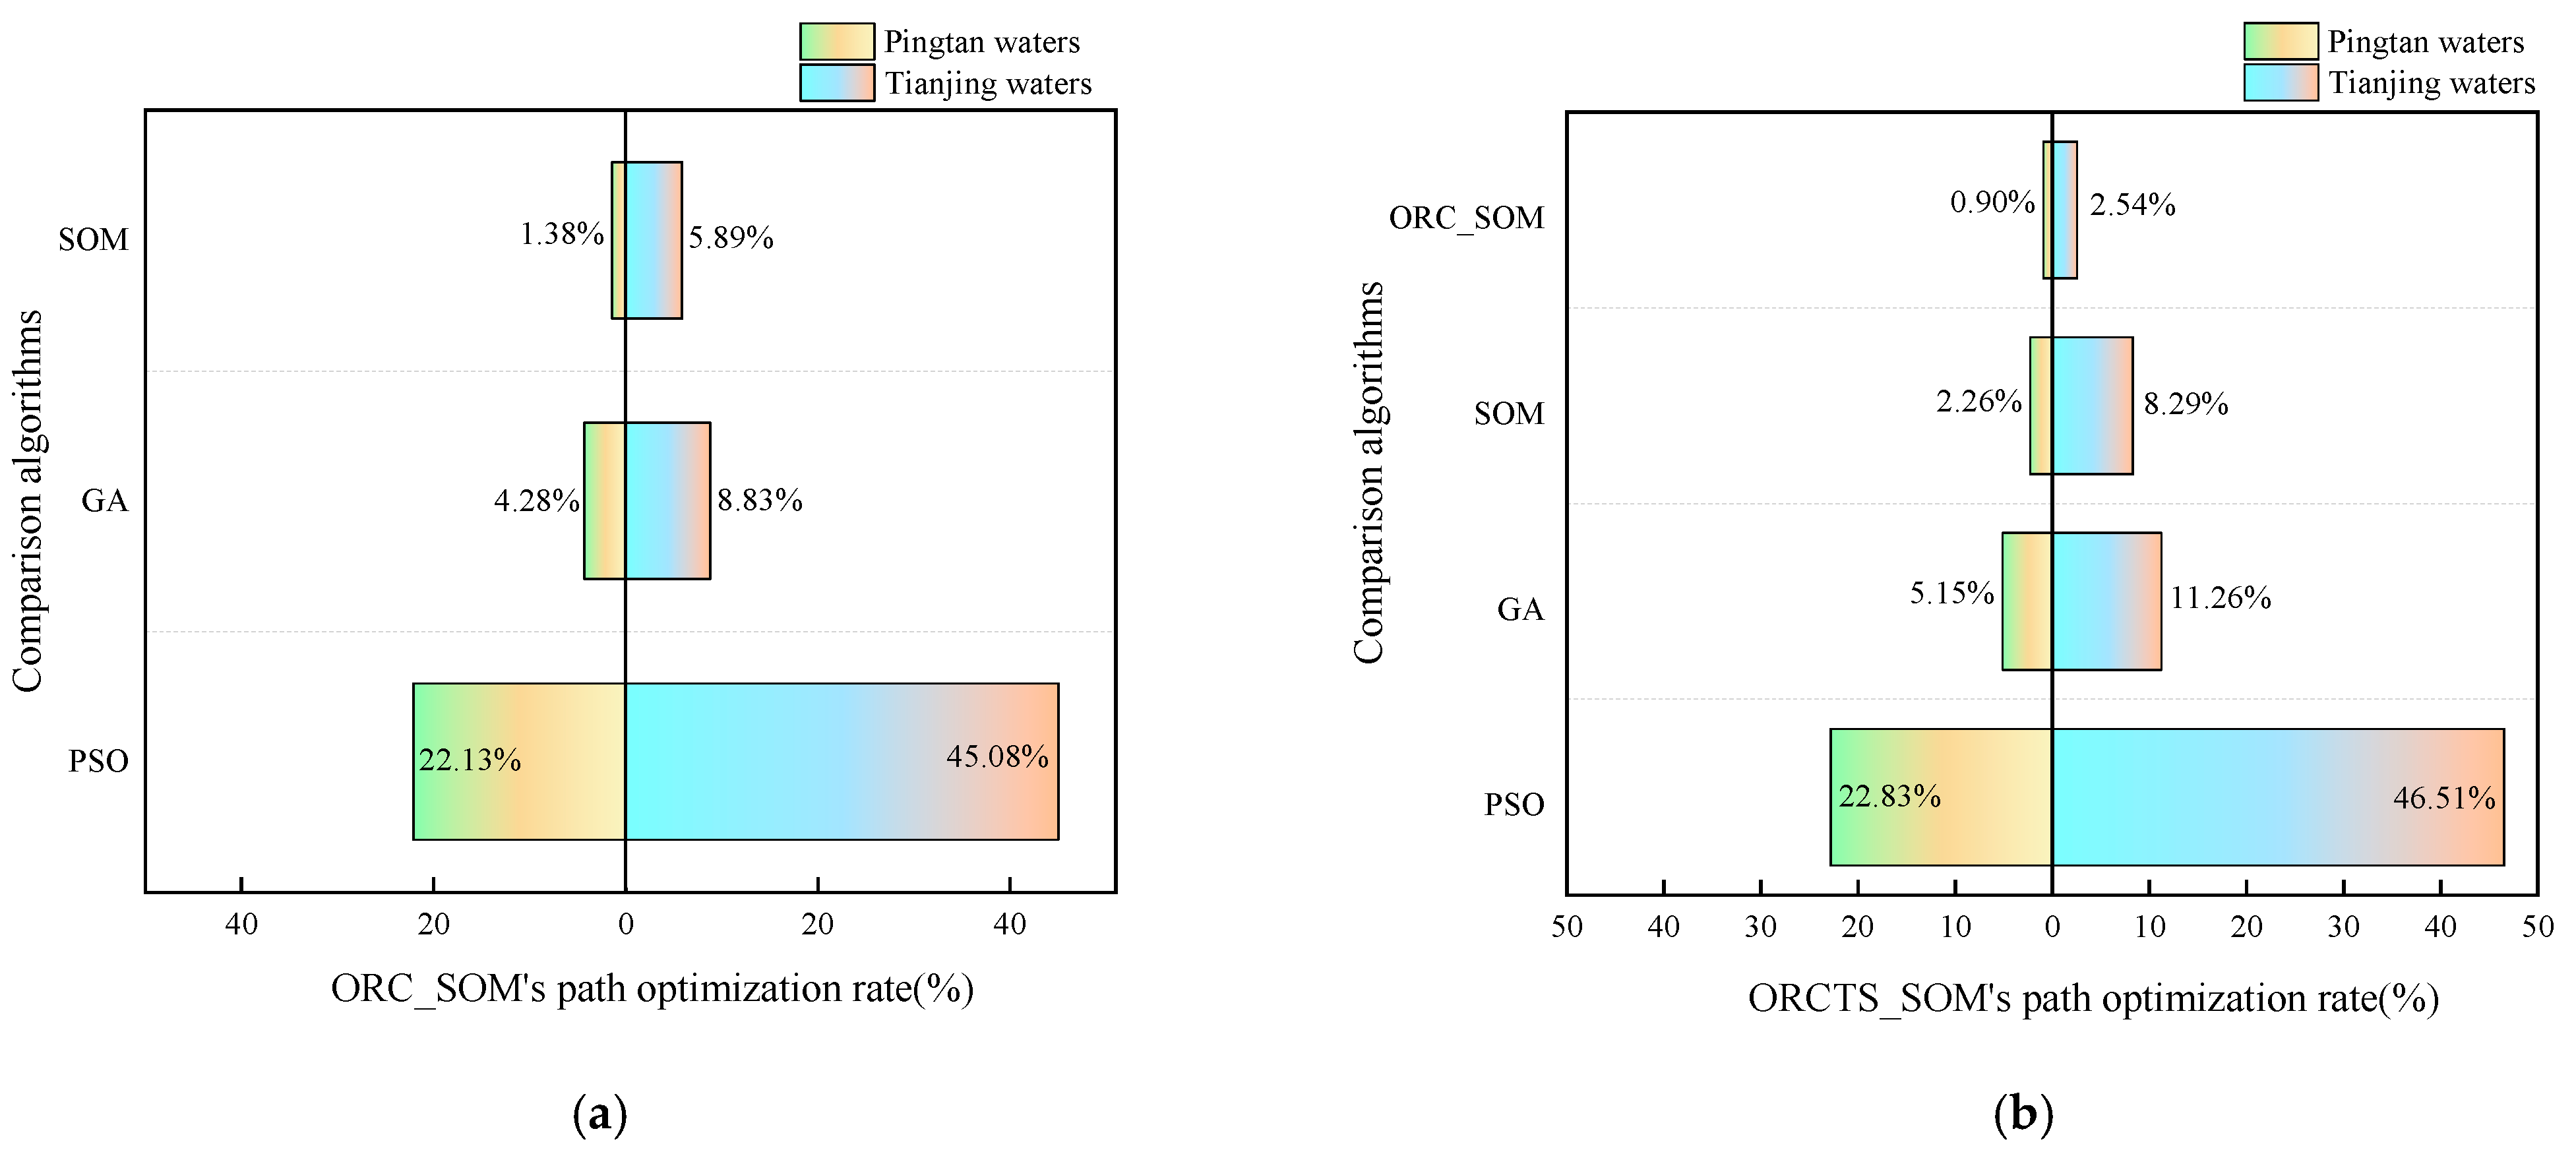
A comparison of the path optimization rates of the two improved algorithms relative to the other algorithms when dealing with navigation mark datasets of different scales is shown in Figure 23 below. It can be seen that in general, the two improved algorithms have better path planning capabilities than the other traditional methods, and the path optimization rates are higher in large-scale navigation mark datasets, in which the path optimization rates of ORCTS_SOM are improved on top of ORC_SOM by 0.90% and 2.54%, respectively.
It shows that the ORCTS_SOM algorithm has better path planning ability than the ORC_SOM algorithm and has stronger global optimization ability when dealing with large-scale complex data.

4.2. Discussion of Experimental Results

In this study, ten sets of experiments are conducted for two sets of small-medium and large-scale navigation mark data using the traditional SOM algorithm and two improved SOM algorithms, respectively, and then comparative experiments are conducted with GA and PSO. The results are discussed as follows:
(1)
For small-medium scale navigation mark data in Pingtan waters.
The UAV navigation mark inspection task puts forward high real-time requirements for the path planning algorithms, which usually need to complete the calculation within several minutes. From the results in Figure 19, the three SOM-based algorithms all perform well in terms of running efficiency, with the average running time controlled within 1 min, which fully satisfies the constraints on the execution time of the algorithms in practical applications. In terms of performance, the improved ORCTS_SOM algorithm has the most outstanding performance in terms of path optimization rate, which improves the path optimization rate by 2.26% compared to the traditional SOM algorithm, and 0.90% compared to the ORC_SOM algorithm; while the ORC_SOM algorithm also improves the optimization rate by 1.38% compared to the traditional SOM algorithm.
Further comparison of the non-SOM optimization methods reveals that the improved SOM family of algorithms has significant advantages in both path quality and computational efficiency. Among them, the ORCTS_SOM algorithm improves the path optimization rate by 5.15% and 22.83% compared to the GA and PSO algorithms, respectively; the corresponding optimization rate of the ORC_SOM algorithm improves by 4.28% and 22.13%. As for the average running time, the GA and PSO algorithms both exceed 10 min, which is much higher than the requirement of algorithm response speed in practical applications, indicating that their applications are limited in real-time UAV inspection tasks.
(2)
For large scale navigation mark data in Tianjin waters.
As can be seen from Figure 22, in terms of average running time, the two improved SOM algorithms are controlled to be around 1 min when processing large-scale navigation mark data, although the running time rises slightly, and the response speed is still fast, which fully meets the real-time requirements of the UAV navigation mark inspection task. In contrast, the average running time of GA and PSO algorithms rises sharply when the number of navigation marks increases, and both exceed 1 h, which seriously exceeds the acceptable time limit of the task and lacks the feasibility of practical application.
In terms of path optimization rate, the ORCTS_SOM algorithm performs the best, with an improvement of 2.54% compared to the ORC_SOM algorithm, 8.29% compared to the traditional SOM algorithm, and 11.26% and 46.51% compared to the GA and PSO algorithms, respectively. The path optimization rate of the ORC_SOM algorithm is also significant, with an improvement of 5.89%, 8.83%, and 45.08% compared to the traditional SOM, GA, and PSO algorithms by 5.89%, 8.83%, and 45.08%, respectively.
It can be seen that the two improved algorithms not only maintain the fast computational ability when facing large-scale data but also achieve a higher level of optimization in terms of path quality, with stronger stability and engineering applicability.
Overall, the two improved SOM algorithms show better path optimization ability than the traditional SOM in different scales of navigation mark inspection tasks, and their performance is especially outstanding in large scale data (Tianjin waters), with significant improvement in path optimization rate up to 5.89% and 8.29%, respectively. The comparison results show that ORCTS_SOM has better optimization ability and stronger adaptability than ORC_SOM in handling large scale path planning tasks.

5. Conclusions

In this study, two improved algorithms, ORC_SOM and ORCTS_SOM, are proposed based on the problems that the traditional SOM algorithm has, that is, incomplete search in the early stage and proneness to fall into local optimal solutions in the later stage. Two sets of navigation mark data examples of different scales are used to experimentally derive the performance of ORC_SOM, ORCTS_SOM, SOM, genetic algorithm (GA), and particle swarm optimization algorithm (PSO) on navigation mark data of different scales, especially their computational efficiencies and path optimization effects in path planning. The experimental results and conclusions obtained are as follows:
(1)
In terms of path optimization rate, ORCTS_SOM optimization is the best, reaching 2.26%~22.83% and 8.29%~46.51%, respectively; ORC_SOM is the second best, reaching 1.38%~22.13% and 5.89%~45.08%, respectively, in which the ORCTS_SOM algorithm improves by 0.90%~2.54% compared to the ORC_SOM algorithm.
(2)
In terms of average running time, when practically applied to navigation mark data of different sizes, the response time of the two improved SOM algorithms can be kept within 1 min, which has high running efficiency and fully meets the real-time requirements of UAV navigation mark inspection.
The experimental results indicate that both the ORC_SOM algorithm and the ORCTS_SOM algorithm are able to complete the path planning computation in a very short time when dealing with different sizes of navigation mark datasets, which meets the real-time requirements in the UAV inspection tasks. More importantly, these two improved algorithms not only have faster computation speed but also generate shorter path lengths and higher path optimization rates, showing better optimization results. This feature makes these two algorithms have significant advantages in practical applications.
In the future, the SOM algorithm can be further optimized by considering the impact of different initialization methods on its performance, as well as the tuning of relevant parameters to further improve the performance of the algorithm; in addition, the research content does not consider the impact of UAV range limitations, and future research can increase the constraints on the range limitations of the UAV to further optimize the results of the UAV navigation mark inspection.

Author Contributions

Conceptualization, L.X. and Z.Z.; methodology, Z.Z. and Z.H.; software, Z.Z. and Z.H.; validation, L.X. and X.C.; formal analysis, Z.Z. and X.W.; investigation, L.C. and X.C.; resources, L.X., L.C. and X.C.; data curation, Z.Z. and Z.H.; writing—original draft preparation, L.X. and Z.Z.; writing—review, Z.Z. and Z.H.; visualization, X.W.; supervision, L.X. and L.C.; project administration, Z.H. and X.C.; funding acquisition, L.X. All authors have read and agreed to the published version of the manuscript.

Funding

This research was funded by the Social Science Fund Project of Fujian Province (FJ2024XZB070).

Data Availability Statement

Data available upon request.

Conflicts of Interest

The authors declare no conflicts of interest.

References

  1. Sim, Y.; Chae, C.-J. Enhancing the Function of the Aids to Navigation by Practical Usage of the Deep Learning Algorithm. J. Navig. 2024, 77, 347–358. [Google Scholar] [CrossRef]
  2. Song, W.; Guo, J.; Wang, Y.; Li, L. An Evaluation of the Development of the Ocean Economy in China Using an Ocean Economic Development Index. Mar. Policy 2021, 132, 104691. [Google Scholar] [CrossRef]
  3. Chen, X.; Liu, S.; Liu, R.W.; Wu, H.; Han, B.; Zhao, J. Quantifying Arctic oil spilling event risk by integrating an analytic network process and a fuzzy comprehensive evaluation model. Ocean Coast. Manage. 2022, 228, 106326. [Google Scholar] [CrossRef]
  4. Maghazei, O.; Netland, T. Drones in manufacturing: Exploring opportunities for research and practice. J. Manuf. Technol. Manag. 2020, 31, 1237–1259. [Google Scholar] [CrossRef]
  5. Wang, J.; Zhou, K.; Xing, W.; Li, H.; Yang, Z. Applications, evolutions, and challenges of drones in maritime transport. J. Mar. Sci. Eng. 2023, 11, 2056. [Google Scholar] [CrossRef]
  6. Guebsi, R.; Mami, S.; Chokmani, K. Drones in precision agriculture: A comprehensive review of applications, technologies, and challenges. Drones 2024, 8, 686. [Google Scholar] [CrossRef]
  7. Mohsan, S.A.H.; Othman, N.Q.H.; Li, Y.; Alsharif, M.H.; Khan, M.A. Unmanned aerial vehicles (UAVs): Practical aspects, applications, open challenges, security issues, and future trends. Intell. Serv. Robot. 2023, 16, 109–137. [Google Scholar] [CrossRef]
  8. Yan, C.; Xiang, X.; Wang, C. Towards real-time path planning through deep reinforcement learning for a UAV in dynamic environments. J. Intell. Robot. Syst. 2020, 98, 297–309. [Google Scholar] [CrossRef]
  9. Koulianos, A.; Litke, A. Blockchain technology for secure communication and formation control in smart drone swarms. Future Internet 2023, 15, 344. [Google Scholar] [CrossRef]
  10. Quero, C.O.; Martinez-Carranza, J. Unmanned aerial systems in search and rescue: A global perspective on current challenges and future applications. Int. J. Disaster Risk Reduct. 2025, 118, 105199. [Google Scholar] [CrossRef]
  11. Kerle, N.; Nex, F.; Gerke, M.; Duarte, D.; Vetrivel, A. UAV-based structural damage mapping: A review. ISPRS Int. J. Geo-Inf. 2019, 9, 14. [Google Scholar] [CrossRef]
  12. Shan, J.; Zhu, H.; Yu, R. Feasibility of Accurate Point Cloud Model Reconstruction for Earthquake-Damaged Structures Using UAV-Based Photogrammetry. Struct. Control Health Monit. 2023, 2023, 7743762. [Google Scholar] [CrossRef]
  13. Villa, T.F.; Gonzalez, F.; Miljievic, B.; Ristovski, Z.D.; Morawska, L. An overview of small unmanned aerial vehicles for air quality measurements: Present applications and future prospectives. Sensors 2016, 16, 1072. [Google Scholar] [CrossRef]
  14. Liu, Y.; Nie, J.; Li, X.; Ahmed, S.H.; Lim, W.Y.B.; Miao, C. Federated learning in the sky: Aerial-ground air quality sensing framework with UAV swarms. IEEE Internet Things J. 2020, 8, 9827–9837. [Google Scholar] [CrossRef]
  15. Bakirci, M. Efficient air pollution mapping in extensive regions with fully autonomous unmanned aerial vehicles: A numerical perspective. Sci. Total Environ. 2024, 909, 168606. [Google Scholar] [CrossRef]
  16. Wang, J.; Zhang, S.; Lizaga, I.; Zhang, Y.; Ge, X.; Zhang, Z.; Zhang, W.; Huang, Q.; Hu, Z. UAS-based remote sensing for agricultural Monitoring: Current status and perspectives. Comput. Electron. Agric. 2024, 227, 109501. [Google Scholar] [CrossRef]
  17. Velusamy, P.; Rajendran, S.; Mahendran, R.K.; Naseer, S.; Shafiq, M.; Choi, J.-G. Unmanned Aerial Vehicles (UAV) in precision agriculture: Applications and challenges. Energies 2021, 15, 217. [Google Scholar] [CrossRef]
  18. Kouadio, L.; El Jarroudi, M.; Belabess, Z.; Laasli, S.-E.; Roni, Z.K.; Amine, I.D.I.; Mokhtari, N.; Mokrini, F.; Junk, J.; Lahlali, R. A review on UAV-based applications for plant disease detection and monitoring. Remote Sens. 2023, 15, 4273. [Google Scholar] [CrossRef]
  19. Najy, W.; Archetti, C.; Diabat, A. Collaborative truck-and-drone delivery for inventory-routing problems. Transp. Res. Part C Emerg. Technol. 2023, 146, 103791. [Google Scholar] [CrossRef]
  20. Garg, V.; Niranjan, S.; Prybutok, V.; Pohlen, T.; Gligor, D. Drones in last-mile delivery: A systematic review on Efficiency, Accessibility, and Sustainability. Transp. Res. Part D Transp. Environ. 2023, 123, 103831. [Google Scholar] [CrossRef]
  21. Li, X.; Tupayachi, J.; Sharmin, A.; Martinez Ferguson, M. Drone-aided delivery methods, challenge, and the future: A methodological review. Drones 2023, 7, 191. [Google Scholar] [CrossRef]
  22. Mendu, B.; Mbuli, N. State-of-the-Art Review on the Application of Unmanned Aerial Vehicles (UAVs) in Power Line Inspections: Current Innovations, Trends, and Future Prospects. Drones 2025, 9, 265. [Google Scholar] [CrossRef]
  23. Panigati, T.; Zini, M.; Striccoli, D.; Giordano, P.F.; Tonelli, D.; Limongelli, M.P.; Zonta, D. Drone-based bridge inspections: Current practices and future directions. Autom. Constr. 2025, 173, 106101. [Google Scholar] [CrossRef]
  24. Khaloo, A.; Lattanzi, D.; Jachimowicz, A.; Devaney, C. Utilizing UAV and 3D computer vision for visual inspection of a large gravity dam. Front. Built Environ. 2018, 4, 386907. [Google Scholar] [CrossRef]
  25. Li, B.; Gao, S.; Li, C.; Wan, H. Maritime buoyage inspection system based on an unmanned aerial vehicle and active disturbance rejection control. IEEE Access 2021, 9, 22883–22893. [Google Scholar] [CrossRef]
  26. Jünger, M.; Reinelt, G.; Rinaldi, G. The traveling salesman problem. Handb. Oper. Res. Manag. Sci. 1995, 7, 225–330. [Google Scholar] [CrossRef]
  27. Jadczak, R. Traveling salesman problem: Approach to optimality. Przeds. Zarz. 2014, 15, 157–169. [Google Scholar] [CrossRef]
  28. Dahiya, C.; Sangwan, S. Literature review on travelling salesman problem. Int. J. Res. 2018, 5, 1152–1155. Available online: https://journals.pen2print.org/index.php/ijr/article/download/15490/15018 (accessed on 20 June 2025).
  29. Karp, R.M. Reducibility among combinatorial problems. In 50 Years of Integer Programming 1958–2008: From the Early Years to the State-of-the-Art; Springer: Heidelberg, Germany, 2009; pp. 219–241. [Google Scholar] [CrossRef]
  30. Pop, P.C.; Cosma, O.; Sabo, C.; Sitar, C.P. A comprehensive survey on the generalized traveling salesman problem. Eur. J. Oper. Res. 2024, 314, 819–835. [Google Scholar] [CrossRef]
  31. Wu, J.; Zhou, L.; Du, Z.; Lv, Y. Mixed steepest descent algorithm for the traveling salesman problem and application in air logistics. Transp. Res. Part E Logist. Transp. Rev. 2019, 126, 87–102. [Google Scholar] [CrossRef]
  32. Glocker, M.; von Stryk, O. Hybrid optimal control of motorized traveling salesmen and beyond. IFAC Proc. Vol. 2002, 35, 439–444. [Google Scholar] [CrossRef]
  33. Dong, X.; Ma, L.; Zhao, X.; Shan, Y.; Wang, J.; Xu, Z. Hybrid genetic algorithm with Wiener process for multi-scale colored balanced traveling salesman problem. Expert Syst. Appl. 2025, 262, 125610. [Google Scholar] [CrossRef]
  34. Mahmoudinazlou, S.; Kwon, C. A hybrid genetic algorithm for the min-max Multiple Traveling Salesman Problem. Comput. Oper. Res. 2024, 162, 106455. [Google Scholar] [CrossRef]
  35. Yildiz, B.; Aslan, M.F.; Durdu, A.; Kayabasi, A. Consensus-based virtual leader tracking swarm algorithm with GDRRT*-PSO for path-planning of multiple-UAVs. Swarm Evol. Comput. 2024, 88, 101612. [Google Scholar] [CrossRef]
  36. Ten Kathen, M.J.; Peralta, F.; Johnson, P.; Flores, I.J.; Reina, D.G. AquaFeL-PSO: An informative path planning for water resources monitoring using autonomous surface vehicles based on multi-modal PSO and federated learning. Ocean Eng. 2024, 311, 118787. [Google Scholar] [CrossRef]
  37. Ke, C.; Chen, H. Cooperative path planning for air-sea heterogeneous unmanned vehicles using search-and-tracking mission. Ocean Eng. 2022, 262, 112020. [Google Scholar] [CrossRef]
  38. Heng, H.; Ghazali, M.H.M.; Rahiman, W. Exploring the application of ant colony optimization in path planning for Unmanned Surface Vehicles. Ocean Eng. 2024, 311, 118738. [Google Scholar] [CrossRef]
  39. Sui, F.; Tang, X.; Dong, Z.; Gan, X.; Luo, P.; Sun, J. ACO+PSO+A*: A bi-layer hybrid algorithm for multi-task path planning of an AUV. Comput. Ind. Eng. 2023, 175, 108905. [Google Scholar] [CrossRef]
  40. Cai, Z.; Liu, J.; Xu, L.; Wang, J. Cooperative path planning study of distributed multi-mobile robots based on optimised ACO algorithm. Robot. Auton. Syst. 2024, 179, 104748. [Google Scholar] [CrossRef]
  41. Sui, J.; Ding, S.; Huang, X.; Yu, Y.; Liu, R.; Xia, B.; Ding, Z.; Xu, L.; Zhang, H.; Yu, C.; et al. A survey on deep learning-based algorithms for the traveling salesman problem. Front. Comput. Sci. 2025, 19, 196322. [Google Scholar] [CrossRef]
  42. Wang, J.; Xiao, C.; Wang, S.; Ruan, Y. Reinforcement learning for the traveling salesman problem: Performance comparison of three algorithms. J. Eng. 2023, 2023, e12303. [Google Scholar] [CrossRef]
  43. Ling, Z.; Zhou, Y.; Zhang, Y. Solving multiple travelling salesman problem through deep convolutional neural network. IET Cyber-Syst. Robot. 2023, 5, e12084. [Google Scholar] [CrossRef]
  44. Stohy, A.; Abdelhakam, H.-T.; Ali, S.; Elhenawy, M.; Hassan, A.A.; Masoud, M.; Glaser, S.; Rakotonirainy, A.; Mirjalili, S. Hybrid pointer networks for traveling salesman problems optimization. PLoS ONE 2021, 16, e0260995. [Google Scholar] [CrossRef]
  45. Liu, X.; Qiu, L.; Fang, Y.; Wang, K.; Li, Y.; Rodríguez, J. Event-Driven Based Reinforcement Learning Predictive Controller Design for Three-Phase NPC Converters Using Online Approximator. IEEE Trans. Power Electron. 2024, 40, 4914–4926. [Google Scholar] [CrossRef]
  46. Yang, H.; Zhao, M.; Yuan, L.; Yu, Y.; Li, Z.; Gu, M. Memory-efficient transformer-based network model for traveling salesman problem. Neural Netw. 2023, 161, 589–597. [Google Scholar] [CrossRef] [PubMed]
  47. He, C.; Li, M.; Zhang, C.; Chen, H.; Zhong, P.; Li, Z.; Li, J. A self-organizing map approach for constrained multi-objective optimization problems. Complex Intell. Syst. 2022, 8, 5355–5375. [Google Scholar] [CrossRef]
  48. Kohonen, T. Essentials of the self-organizing map. Neural Netw. 2013, 37, 52–65. [Google Scholar] [CrossRef] [PubMed]
  49. Kuo, R.; Chang, K.; Chien, S. Integration of self-organizing feature maps and genetic-algorithm-based clustering method for market segmentation. J. Organ. Comput. Electron. Commer. 2004, 14, 43–60. [Google Scholar] [CrossRef]
  50. Begum, M.; Das, B.C.; Hossain, M.Z.; Saha, A.; Papry, K.A. An improved Kohonen self-organizing map clustering algorithm for high-dimensional data sets. Indones. J. Electr. Eng. Comput. Sci. 2021, 24, 600–610. [Google Scholar] [CrossRef]
  51. Wang, H.; Zhang, N.; Créput, J.-C. A massively parallel neural network approach to large-scale Euclidean traveling salesman problems. Neurocomputing 2017, 240, 137–151. [Google Scholar] [CrossRef]
  52. Ma, X.; Chen, Y.; Bai, G.; Sha, Y.; Zhu, X. Path planning and task assignment of the multi-AUVs system based on the hybrid bio-inspired SOM algorithm with neural wave structure. J. Braz. Soc. Mech. Sci. Eng. 2021, 43, 28. [Google Scholar] [CrossRef]
  53. Guan, Q.; Hong, X.; Ke, W.; Zhang, L.; Sun, G.; Gong, Y. Kohonen self-organizing map based route planning: A revisit. In Proceedings of the 2021 IEEE/RSJ International Conference on Intelligent Robots and Systems (IROS), Prague, Czech Republic, 27 September–1 October 2021. [Google Scholar] [CrossRef]
  54. Zhu, J.; Ye, H.; Yao, L.; Cai, Y. Algorithm for solving traveling salesman problem based on self-organizing mapping network. J. Shanghai Jiaotong Univ. (Sci.) 2024, 29, 463–470. [Google Scholar] [CrossRef]
  55. Khalid, A.N.; Baki, N.M.R.; Varma, T.S.P.; Khan, A.; Singh, N. Tabu Search Algorithm: Optimizing the Search Runtime. In Proceedings of the 2024 5th International Conference for Emerging Technology (INCET), Belgaum, India, 24–26 May 2024. [Google Scholar] [CrossRef]
  56. Gouveia, L. Using the Miller-Tucker-Zemlin constraints to formulate a minimal spanning tree problem with hop constraints. Comput. Oper. Res. 1995, 22, 959–970. [Google Scholar] [CrossRef]
  57. Bektaş, T.; Gouveia, L. Requiem for the Miller-Tucker-Zemlin subtour elimination constraints? Eur. J. Oper. Res. 2014, 236, 820–832. [Google Scholar] [CrossRef]
Figure 1. Technology roadmap.
Jmse 13 01537 g001
Figure 2. SOM neural network structure.
Jmse 13 01537 g002
Figure 3. Generalized competition and local infiltration analysis. (a) Generalized competition analysis. (b) Local infiltration analysis.
Jmse 13 01537 g003
Figure 4. Generalized competition.
Jmse 13 01537 g004
Figure 5. Localized infiltration.
Jmse 13 01537 g005
Figure 6. Randomness of winning neuron.
Jmse 13 01537 g006
Figure 7. Navigation marks distribution analysis. (a) Pingtan waters. (b) Tianjin waters.
Jmse 13 01537 g007
Figure 8. SOM iterative process.
Jmse 13 01537 g008
Figure 9. ORC_SOM iterative process.
Jmse 13 01537 g009
Figure 10. ORCTS_SOM iterative process.
Jmse 13 01537 g010
Figure 11. Final path diagram for Pingtan waters. The path lengths of the three algorithms from left to right are 421.987 km, 416.176 km, and 412.433 km, respectively.
Jmse 13 01537 g011
Figure 12. Early iterations of SOM.
Jmse 13 01537 g012
Figure 13. Early iterations of ORC_SOM.
Jmse 13 01537 g013
Figure 14. Early iterations of ORCTS_SOM.
Jmse 13 01537 g014
Figure 15. 15,000th iteration. The path lengths of the three algorithms from left to right are 422.330 km, 418.405 km, and 417.115 km, respectively.
Jmse 13 01537 g015
Figure 16. ORC_SOM later iterations. The path lengths from left to right are 418.405 km, 417.863 km, 417.251 km, and 416.176 km, respectively.
Jmse 13 01537 g016
Figure 17. ORC_SOM later iterates local magnification. It is clear that the paths fit the distribution of the navigation mark points more and more accurately, with a reduction in bias or redundancy.
Jmse 13 01537 g017
Figure 18. Comparison of iterative processes in Pingtan waters.
Jmse 13 01537 g018
Figure 19. Comparison of path planning results for Pingtan waters.
Jmse 13 01537 g019
Figure 20. Tianjin waters path planning results. The path lengths from left to right are 1854.75 km, 1739.25 km, and 1724.16 km, respectively.
Jmse 13 01537 g020
Figure 21. Comparison of iterative processes in Tianjin waters.
Jmse 13 01537 g021
Figure 22. Path planning results for Tianjin waters.
Jmse 13 01537 g022
Figure 23. Relative path optimization rate of improved SOM. (a) Relative path optimization rate of ORC_SOM. (b) Relative path optimization rate of ORCTS_SOM.
Jmse 13 01537 g023
Table 1. Computational complexity comparison of algorithm for solving TSP.
Algorithm CategoryAlgorithmTime ComplexitySpace ComplexityEmbedded Adaptability
Traditional HeuristicsGAO (G × P × n2)O (P × n)Poor
PSOO (G × S × n2)O (S × n)Poor
ACOO (T × m × n2)O (m × n2)Poor
Deep LearningDouble Q-LearningO (n2 × d × E)O (n2 × d)Very Poor
Deep CNN-based MethodsO (L × F × H × W)O (L × F × H × W)Very Poor
TransformerO (n2 × d)O (n2 × d)Very Poor
Neural NetworksTraditional SOMO (n2)O (m × n)Excellent
Hopfield Neural NetworkO (n3)O (n2)Poor
Graph Neural Network (GNN)O (n2 × d)O (n2 × d)Very Poor
Pointer NetworkO (n2 × d)O (n × d)Very Poor
Parameter Definitions: n: number of navigation marks, G: number of iterations, P: population size (GA), S: swarm size (PSO), T: iteration rounds (ACO), m: number of ants, d: embedding dimension, E: training episodes, L: CNN layer depth, F: number of filters, H × W: feature map dimensions.
Table 2. Original coordinates of navigation marks in Pingtan waters.
No.NameLatitudeLongitude
1Dongxiang Island Lighthouse25°36′10.9″ N119°54′04.0″ E
2Niushan Lighthouse25°26′04.0″ N119°56′12.9″ E
273Lantau lamp post25°37′47.1″ N119°33′57.1″ E
274Su’ao lamp post25°37′05.6″ N119°41′54.3″ E
Table 3. Original coordinates of navigation marks in Tianjin waters.
No.NameLatitudeLongitude
1Beating RBN-DGPS station38°50′11.6″ N117°30′17.5″ E
2Shanggulin navigation station39°6′24″ N117°43′12″ E
741Haihe L7 light buoy38°59′34.6″ N117°40′6.8″ E
742Haihe L8 light buoy38°59′34.5″ N117°40′9.7″ E
Table 4. Conversion of coordinates in Pingtan waters.
No.Latitude (°)Longitude (°)X-Axis (Km)Y-Axis (Km)
125.6030119.901134.876943.2305
225.4344119.936916.143246.8866
27325.6298119.565937.78199.6105
27425.6182119.698436.516222.9021
Table 5. Conversion of coordinates in Tianjin waters.
No.Latitude (°)Longitude (°)X-Axis (Km)Y-Axis (Km)
138.83656117.5049−18.351144.35134
239.10667117.7210.8838491.49462
74438.99294117.66863.8931371.64635
74538.99292117.66944.00259571.6415
Table 6. Algorithm performance stability comparison for Pingtan waters.
AlgorithmPath Length σ (KM)Computation Time σ (s)
SOM8.680.26
ORC-SOM7.430.36
ORCTS-SOM5.472.08
PSO12.3520.46
GA9.6215.69
Table 7. Algorithm performance stability comparison for Tianjin waters.
AlgorithmPath Length σ (KM)Computation Time σ (s)
SOM15.961.24
ORC-SOM12.180.29
ORCTS-SOM10.331.07
PSO24.7228.35
GA16.4519.83
Disclaimer/Publisher’s Note: The statements, opinions and data contained in all publications are solely those of the individual author(s) and contributor(s) and not of MDPI and/or the editor(s). MDPI and/or the editor(s) disclaim responsibility for any injury to people or property resulting from any ideas, methods, instructions or products referred to in the content.