Article

Numerical Study of the Negative Skin Friction (NSF) of Large-Diameter Rock-Socketed Monopiles for Offshore Wind Turbines Incorporating Lateral Loading Effects

1
School of Highway and Railway Engineering, Shaanxi College of Communications Technology, Xi’an 710018, China
2
School of Human Settlements and Civil Engineering, Xi’an Jiaotong University, Xi’an 710049, China
3
School of Civil Engineering, Southeast University, Nanjing 211189, China
4
Advanced Ocean Institute, Southeast University, Nantong 226010, China
*
Authors to whom correspondence should be addressed.
J. Mar. Sci. Eng. 2025, 13(8), 1530; https://doi.org/10.3390/jmse13081530
Submission received: 4 July 2025 / Revised: 28 July 2025 / Accepted: 8 August 2025 / Published: 9 August 2025
(This article belongs to the Section Ocean Engineering)

Abstract

Large-diameter rock-socketed monopiles supporting offshore wind turbines in soft clay strata face significant geotechnical risks from negative skin friction (NFS) induced by construction surcharges. While the effects of NFS on axial drag loads are documented, the critical interaction between horizontal pile loading and NFS development remains poorly understood. This research bridges this gap using a rigorously validated 3D finite element model that simulates the complex coupling of vertical substructure loads (5 MN), horizontal loading, and surcharge-induced consolidation. The model’s accuracy was confirmed through comprehensive verification against field data for both NFS evolution under surcharge and horizontal load–displacement behavior. The initial analysis under representative conditions (10 MN horizontal load, 100 kPa surcharge, 3600 days consolidation) revealed that horizontal loading fundamentally distorts NFS distribution in the upper pile segment (0 to −24 m), transforming smooth profiles into distinct dual-peak morphologies while increasing the maximum NFS magnitude by 57% (from −45.4 kPa to −71.5 kPa) and relocating its position 21 m upward. This redistribution was mechanistically linked to horizontal soil displacement patterns. Crucially, the NFS neutral plane remained invariant at the clay–rock interface (−39 m), demonstrating complete independence from horizontal loading effects. A systematic parametric study evaluated key operational factors: (1) consolidation time progressively increased NFS magnitude throughout the clay layer, evolving from near-linear to dual-peaked distributions in the upper clay (0 to −18 m); NFS stabilized in the upper clay after 720 days while continuing to increase in the lower clay (−18 to −39 m) due to downward surcharge transfer, accompanied by neutral plane deepening (from −36.5 m to −39.5 m) and 84% maximum axial force escalation (12.5 MN to 23 MN); (2) horizontal load magnitude amplified upper clay NFS peaks at −3.2 m and −9.3 m, with the shallow peak magnitude increasing linearly with load intensity, though it neither altered lower clay NFS nor neutral plane position; (3) surcharge magnitude increased overall NFS, but upper clay NFS (0 to −18 m) stabilized beyond 100 kPa, while lower clay NFS continued rising with higher surcharges, and the neutral plane descended progressively (from −38 m to −39.5 m). These findings demonstrate that horizontal loading critically exacerbates peak NFS values and redistributes friction in upper pile segments without influencing the neutral plane, whereas surcharge magnitude and consolidation time govern neutral plane depth, total NFS magnitude, and maximum drag load. This research delivers essential theoretical insights and practical guidelines for predicting NFS-induced drag loads and ensuring the long-term safety of offshore wind foundations in soft clays under complex multi-directional loading scenarios.

1. Introduction

To harness wind energy resources and achieve sustainable development goals, numerous offshore wind turbines have been constructed in coastal areas in recent years [1]. In some coastal regions, soft soil strata are prevalent, with bedrock layers buried beneath these weak soils [2]. Consequently, large-diameter rock-socketed piles are commonly employed as foundations for offshore wind turbines to support structural loads and enhance operational safety [3,4].
However, activities such as land reclamation, artificial island construction and seawall construction often generate overloads around these large-diameter monopile foundations [5,6,7,8]. Such overloads induce soil consolidation settlement, triggering negative skin friction (NSF) [9,10,11]. The NSF increases axial forces within the pile. This may compromise the pile foundation, posing severe threats to the structural integrity and safety of offshore wind turbines [12,13,14].
Since the discovery of negative skin friction (NSF) phenomena, extensive research has focused on pile NSF issues, though primarily concerning onshore foundations [15,16,17]. Several scholars have investigated NSF in large-diameter monopile foundations for offshore wind turbines using experimental, theoretical, and numerical approaches. Ren et al. [10] proposed a theoretical model to analyze NSF-induced bending moments in rock-socketed piles caused by soil settlement, validating its accuracy through model tests. Their study examined the influence of the pile inclination angle, diameter, and surrounding soil consolidation settlement on pile bending moments and NSF development. Jiang et al. [13] established a comprehensive pile–soil interaction model using the one-dimensional consolidation theory and an ideal elastic–plastic load-transfer model. This framework was used to investigate NSF evolution in artificial island pile foundations under self-weight consolidation and surcharge loading. Their parametric study evaluated the effects of pile installation timing, additional loads, and vertical pile-top loads on NSF development. Ma et al. [14] introduced an analytical solution for monopile NSF using a modified bilinear model. Their computational method accurately characterizes the skin friction distribution range and neutral plane location, enabling NSF calculation for offshore wind turbine pile foundations. Leung et al. [18] conducted centrifuge model tests to investigate NSF effects on piles in soft clay, inducing NSF through sand surcharging. Their experiments examined load-transfer mechanisms under combined NSF and vertical loading. Yan et al. [8] performed model tests on single piles and 3 × 3 pile groups in sand to determine neutral plane positions and group efficiency factors for NSF in offshore wind turbine foundations on artificial islands. Results demonstrated that pile groups mitigate adverse NSF effects, though NSF behavior varies with pile location within the group, necessitating differentiated design considerations. Jeong et al. [2] combined full-scale field tests with 3D numerical analysis to study NSF in single piles within marine soft clay. Their findings confirmed that numerical methods can reliably predict NSF under consolidation conditions, with consolidation duration significantly influencing NSF magnitude. Shen et al. [19] employed numerical analysis to investigate pile NSF in coastal tidal flats resulting from soft soil compression, focusing on the effects of surcharge load on axial load-bearing behavior and the impact of consolidation time on NSF development.
The aforementioned research has addressed the influence of negative skin friction (NSF) on large-diameter monopiles for offshore wind turbines, also considering the impact of factors such as consolidation time, vertical pile head load, and surcharge magnitude on NSF. However, existing research shows limited focus on the negative skin friction of large-diameter rock-socketed piles used for offshore wind turbines. Furthermore, beyond sustaining vertical (axial) loads, these large-diameter rock-socketed piles for offshore wind turbines are often subjected to significant horizontal loads. The horizontal load-bearing capacity is also a crucial design parameter for offshore wind turbine foundations [20,21,22,23]. Therefore, the role of horizontal loads cannot be neglected in research concerning the negative skin friction of offshore wind turbine pile foundations.
To address the current limitations in research on the negative skin friction of large-diameter rock-socketed piles for offshore wind turbines, this study establishes a three-dimensional finite element model. This model accounts for the combined effects of vertical pile head load, horizontal pile head load, and soil surcharge around the pile, analyzing the characteristics of negative skin friction under horizontal loading. A series of numerical studies were conducted focusing on the main influencing factors. The primary objective of this study is to assess the characteristics of negative skin friction in large-diameter rock-socketed piles for offshore wind turbines under the coupled action of these three loads: vertical pile head load, horizontal pile head load, and surrounding soil surcharge. This work provides design references for future offshore pile foundations. It also contributes to understanding the long-term performance, preservation, and potential reuse of offshore wind turbine foundations—an area of growing research interest [24,25].

2. Finite Element Model Development and Verification

2.1. Modelling Methodology

2.1.1. Soil and Monopile

The Mohr–Coulomb constitutive model is widely adopted in both research and engineering practice for soil simulation due to its straightforward parameter requirements and satisfactory accuracy. Numerous studies investigating negative skin friction (NSF) and soil surcharge loading have successfully employed this constitutive model [7,26,27]. In Plaxis 3D (V2023), the Embedded Beam element provides an efficient numerical technique for pile modeling [28]. This approach maintains computational accuracy while significantly reducing element counts compared to full 3D continuum modeling [6]. For steel pipe piles, an equivalent “solid pile” representation can be achieved by converting the Young’s modulus according to Equation (1):
E pequ = 1 d 2 D 2 E p
where Epequ is the equivalent Young’s modulus of the solid pile, Ep is the Young’s modulus of the steel pipe pile, d is the inner diameter of the steel pipe pile, and D is the outer diameter of the steel pipe pile.

2.1.2. Pile–Soil Interaction

The frictional behavior at the pile–soil interface was simulated using Coulomb’s friction theory. In the Plaxis software, the interface reduction factor (Rinter), along with the soil’s cohesion (csoil) and internal friction angle (φsoil), is used to model the soil-structure interaction mechanism at the pile–soil interface, as expressed by Equations (2) and (3). In this study, the interface reduction factor (Rinter) was uniformly assigned a value of 0.8 for both the pile–rock and pile–clay interfaces [29,30,31].
c inter = R inter c soil
tan φ inter = R inter tan φ soil tan φ soil
where cinter and φinter represent the cohesion and internal friction angle at the pile–soil interface, respectively.

2.1.3. Surcharge Load

Two primary approaches exist for modeling surcharge loading. The first involves creating volumetric elements that precisely match the surcharge geometry, assigning the actual density [6,7,32]. The second method converts the surcharge into an equivalent surface pressure based on its total volume and density. This latter approach offers simpler modeling implementation while maintaining high accuracy [33,34,35]. Consequently, the second method is adopted in this study.

2.1.4. Model Domain and Mesh

The pile is positioned at the model’s center, resulting in a fully axisymmetric configuration. The horizontal domain extent extends to 25 times the pile diameter [26]. The vertical boundaries exceed 0.7 times the embedded pile length [36]. A mesh sensitivity study was conducted to ensure solution independence from discretization. For all analyses, the global coarseness level was set to “Fine,” with a local refinement zone established within a 3D region surrounding the pile. This refinement strategy generates a finer mesh in proximity to the pile [37], striking a balance between computational efficiency and solution accuracy.

2.2. Model Validation

Given the absence of case studies addressing combined horizontal loading and surcharge effects on large-diameter monopiles for offshore wind turbines, validation was conducted in two stages: (1) verification of negative skin friction (NSF) under surcharge loading, and (2) validation of the load–displacement response under horizontal loading.

2.2.1. Negative Skin Friction

The NSF validation adopts field test data from Indraratna et al. [15] conducted in Bangkok soft clay. The site stratigraphy comprises a 16 m thick layer of highly compressible soft clay overlying medium-stiff to stiff clay and deep sand layers. The experiment utilized two 25 m long hollow prestressed concrete pipe piles (outer diameter = 0.4 m; inner diameter = 0.25 m). One pile featured a bituminous coating while the other remained uncoated. A 2 m high embankment surcharge (base dimensions 24 m × 14 m, 2:1 side slopes) with a fill material density of 17 kN/m3 was applied. In the finite element model, this surcharge was simulated as an equivalent surface pressure. The uncoated pile was modeled with a surcharge duration of 265 days. Figure 1 demonstrates excellent agreement between the finite element analysis results and the experimental measurements reported by Indraratna et al. [15]. This close correspondence validates the modeling methodology established in the preceding section.

2.2.2. Horizontally Loaded Monopile

Validation for horizontal loading adopts field test data from Li et al. [38] on large-diameter steel pipe monopiles for offshore wind turbines in Jiangsu, China. The site stratigraphy consists of silty clay with muddy consistency from the mudline to 16 m depth, underlain by sand strata. Horizontal load testing was performed on two steel pipe monopiles with a 2.8 m diameter. Each pile featured an embedded length of 72.5 m below mudline and a free-standing length of 20.3 m above mudline, with horizontal load applied at the pile head. Test pile S2, which was subjected to the higher load magnitude (500 kN), was selected for the comparative analysis. Figure 2 demonstrates close agreement between the finite element results and field measurements for pile S2. The load–displacement curves exhibit consistent behavioral trends, with a maximum numerical deviation of merely 7%—well within acceptable engineering tolerances.
This validation, combined with the NSF verification in Section 2.2.1, confirms the high accuracy of the adopted finite element modeling methodology. The model effectively captures both: (1) the horizontal load response of monopiles and (2) the development of negative skin friction under surcharge loading. Consequently, this validated framework is suitable for subsequent parametric investigations.

3. Numerical Model for Coupled Analysis of Horizontally Loaded Piles and NSF

The parametric analysis examines a large-diameter circular steel pipe pile (D = 4 m), representative of offshore wind foundation practice. The pile configuration features an 8 m free-standing length above mudline (2D) and a 46 m embedded length below mudline (11.5D), with the lower 6 m (1.5D) rock-socketed into bedrock. A horizontal load is applied 8 m above the mudline, consistent with transition piece elevation. The 0.046 m wall thickness complies with API (2014) [39] design specifications (Equation (4)).
t = 0.00635 + D 100
The steel pipe pile was modeled using the embedded beam element described in Section 2.1.1. A point load was applied at the pile head for horizontal loading. The pile–soil interface adopted the Coulomb friction theory outlined in Section 2.1.2, with an interface reduction coefficient (Rinter) value of 0.8.
In engineering practice, the substructure loads for 3 MW–7.5 MW offshore wind turbines range between 2 MN and 10 MN [40]. Therefore, a substructure load of 5 MN was applied at the pile head of the monopile in this study [41].
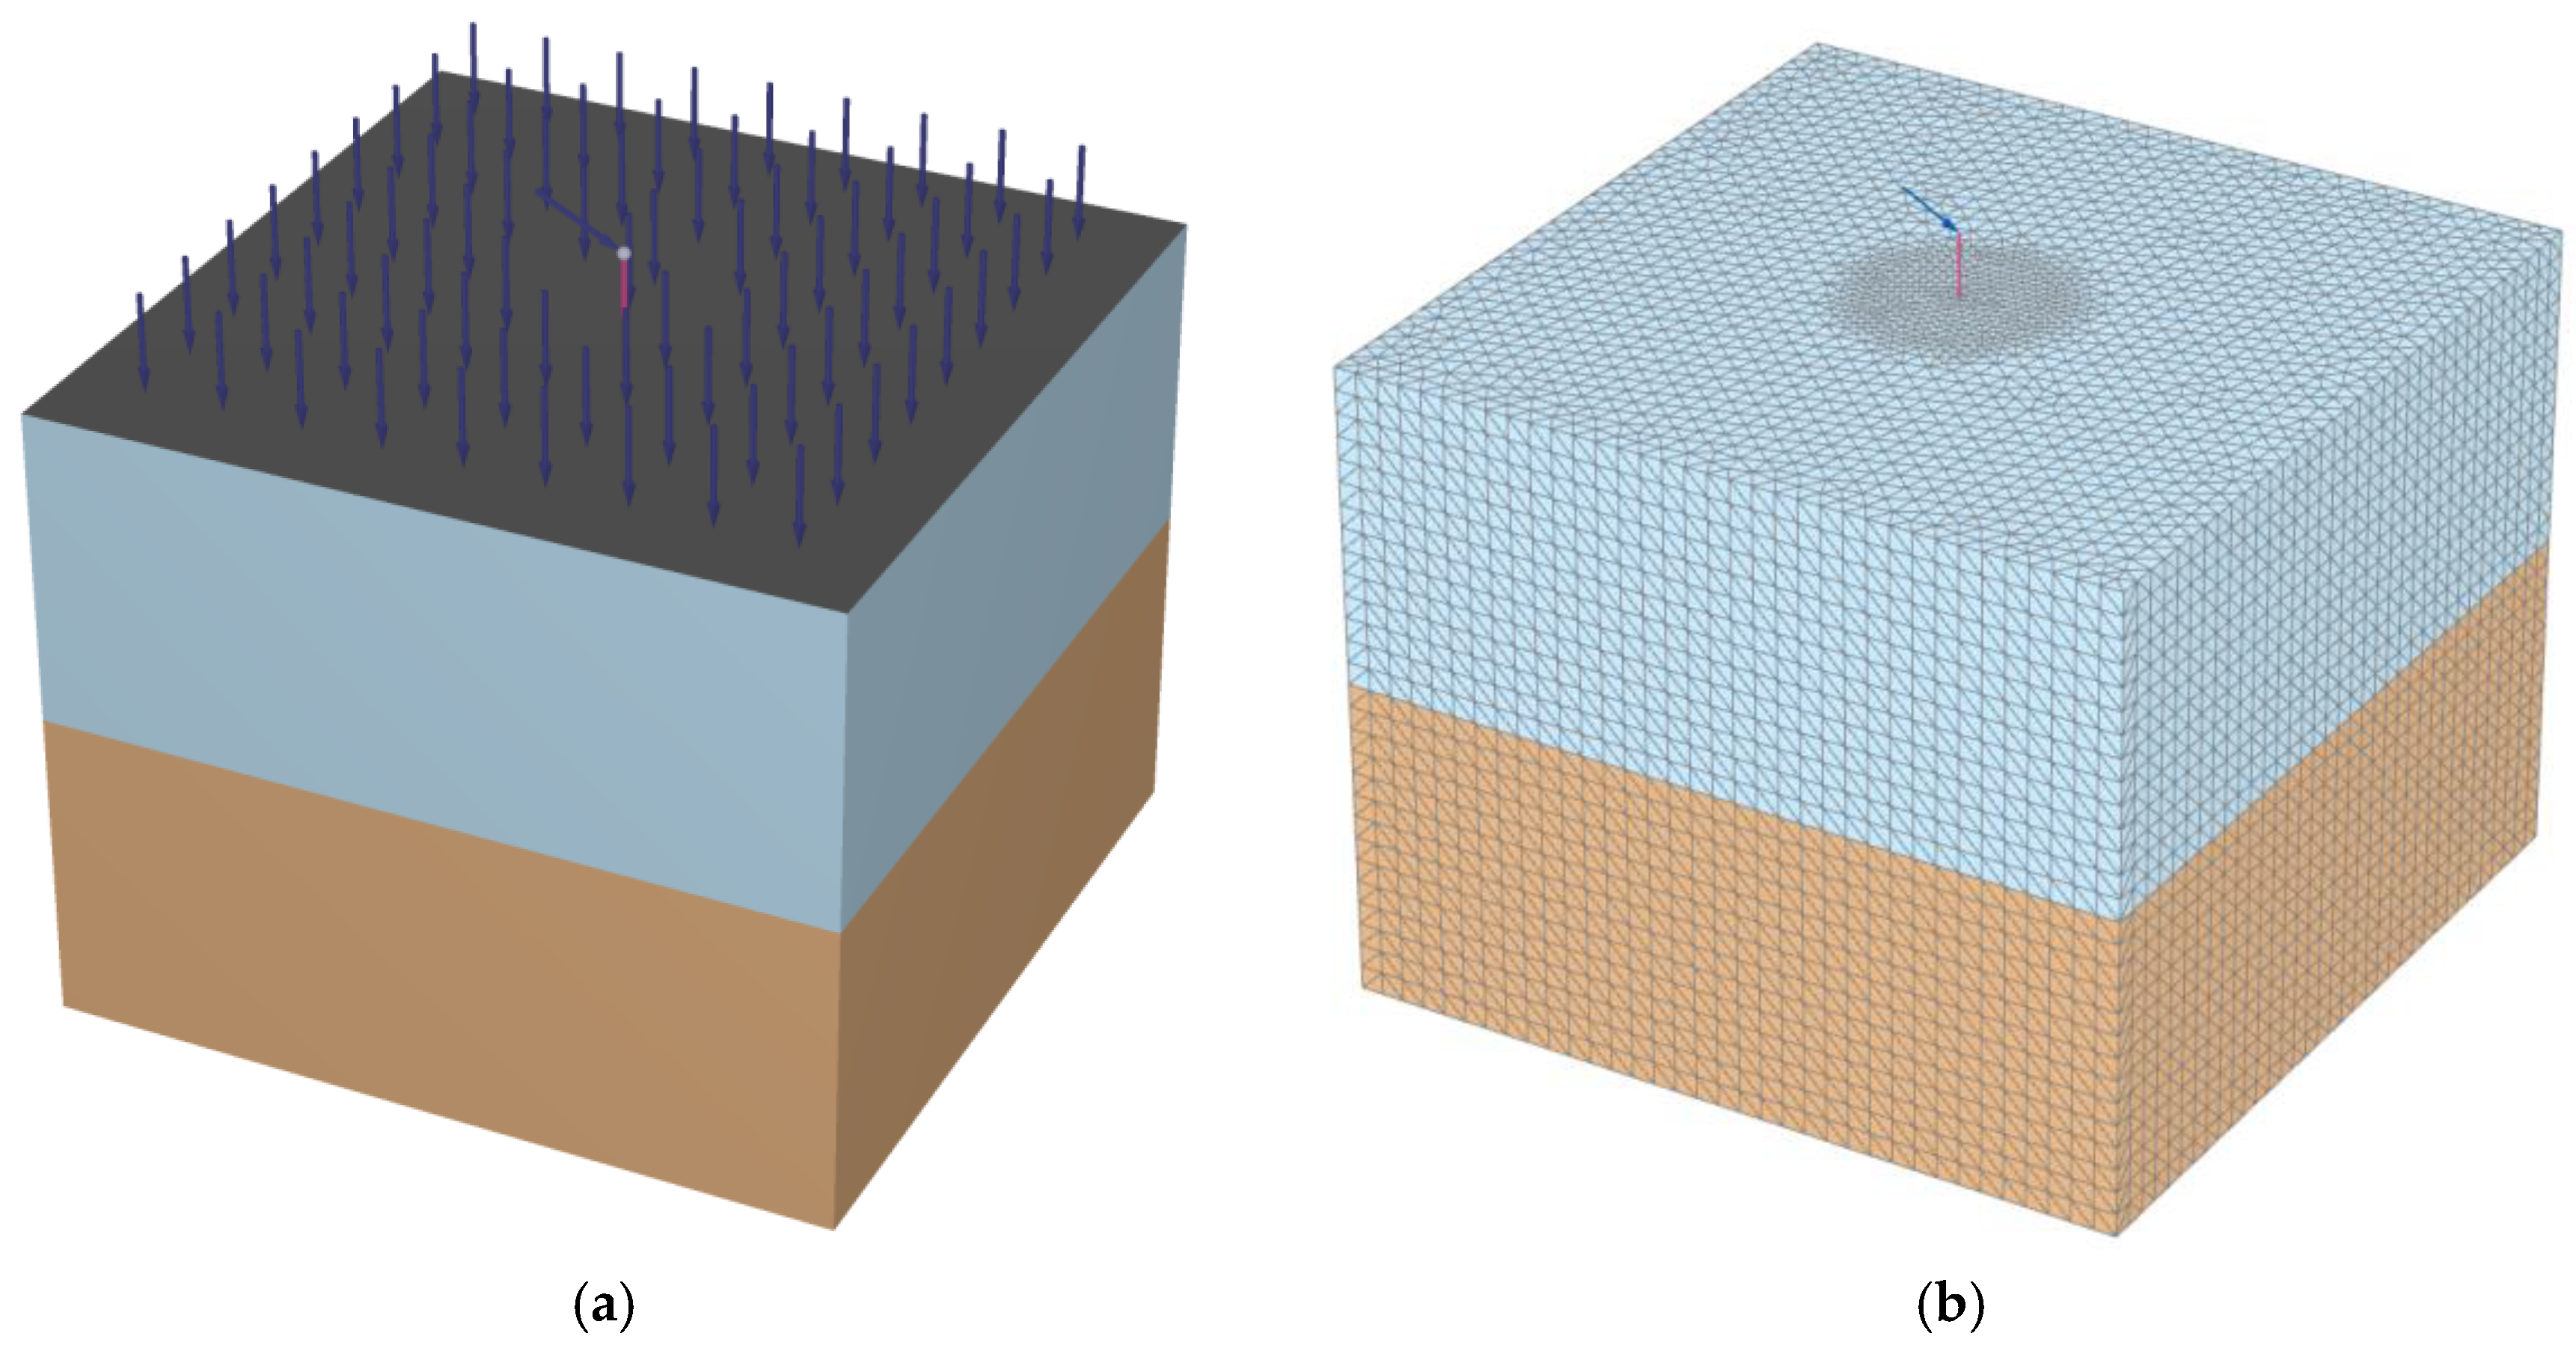
Since soil profiles at different offshore wind farms can vary significantly from project to project, the parametric analysis considered only a typical offshore wind farm site profile consisting of soft clay overlying a rock stratum [42]. According to the boundary condition requirements outlined in Section 2, the model’s horizontal dimensions are 100 m × 100 m (25D), and the vertical boundary extends to 80 m. This vertical dimension complies with the requirement that the distance from the vertical boundary to the pile tip exceeds 0.7 times the monopile’s embedded length below the mudline. Both the clay and rock layers have a thickness of 40 m, and the Mohr–Coulomb constitutive model was adopted for all soil materials. The soil layer parameters are presented in Table 1. The phreatic surface in the model was set at the mudline. Open pore water pressure boundaries (allowing groundwater flow) were assigned to the horizontal and top boundaries of the model, whereas a closed pore water pressure boundary (impermeable, no-flow condition) was applied to the bottom boundary.
The established finite element model is shown in Figure 3.
The surcharge load was applied as a surface load at a rate of 10 kPa per day. In the consolidation period, each month was set as 30 days, corresponding to a year of 360 days. Due to the exclusion of seepage effects, this study was limited to a three-dimensional consolidation analysis, primarily focusing on the dissipation of excess pore water pressure.
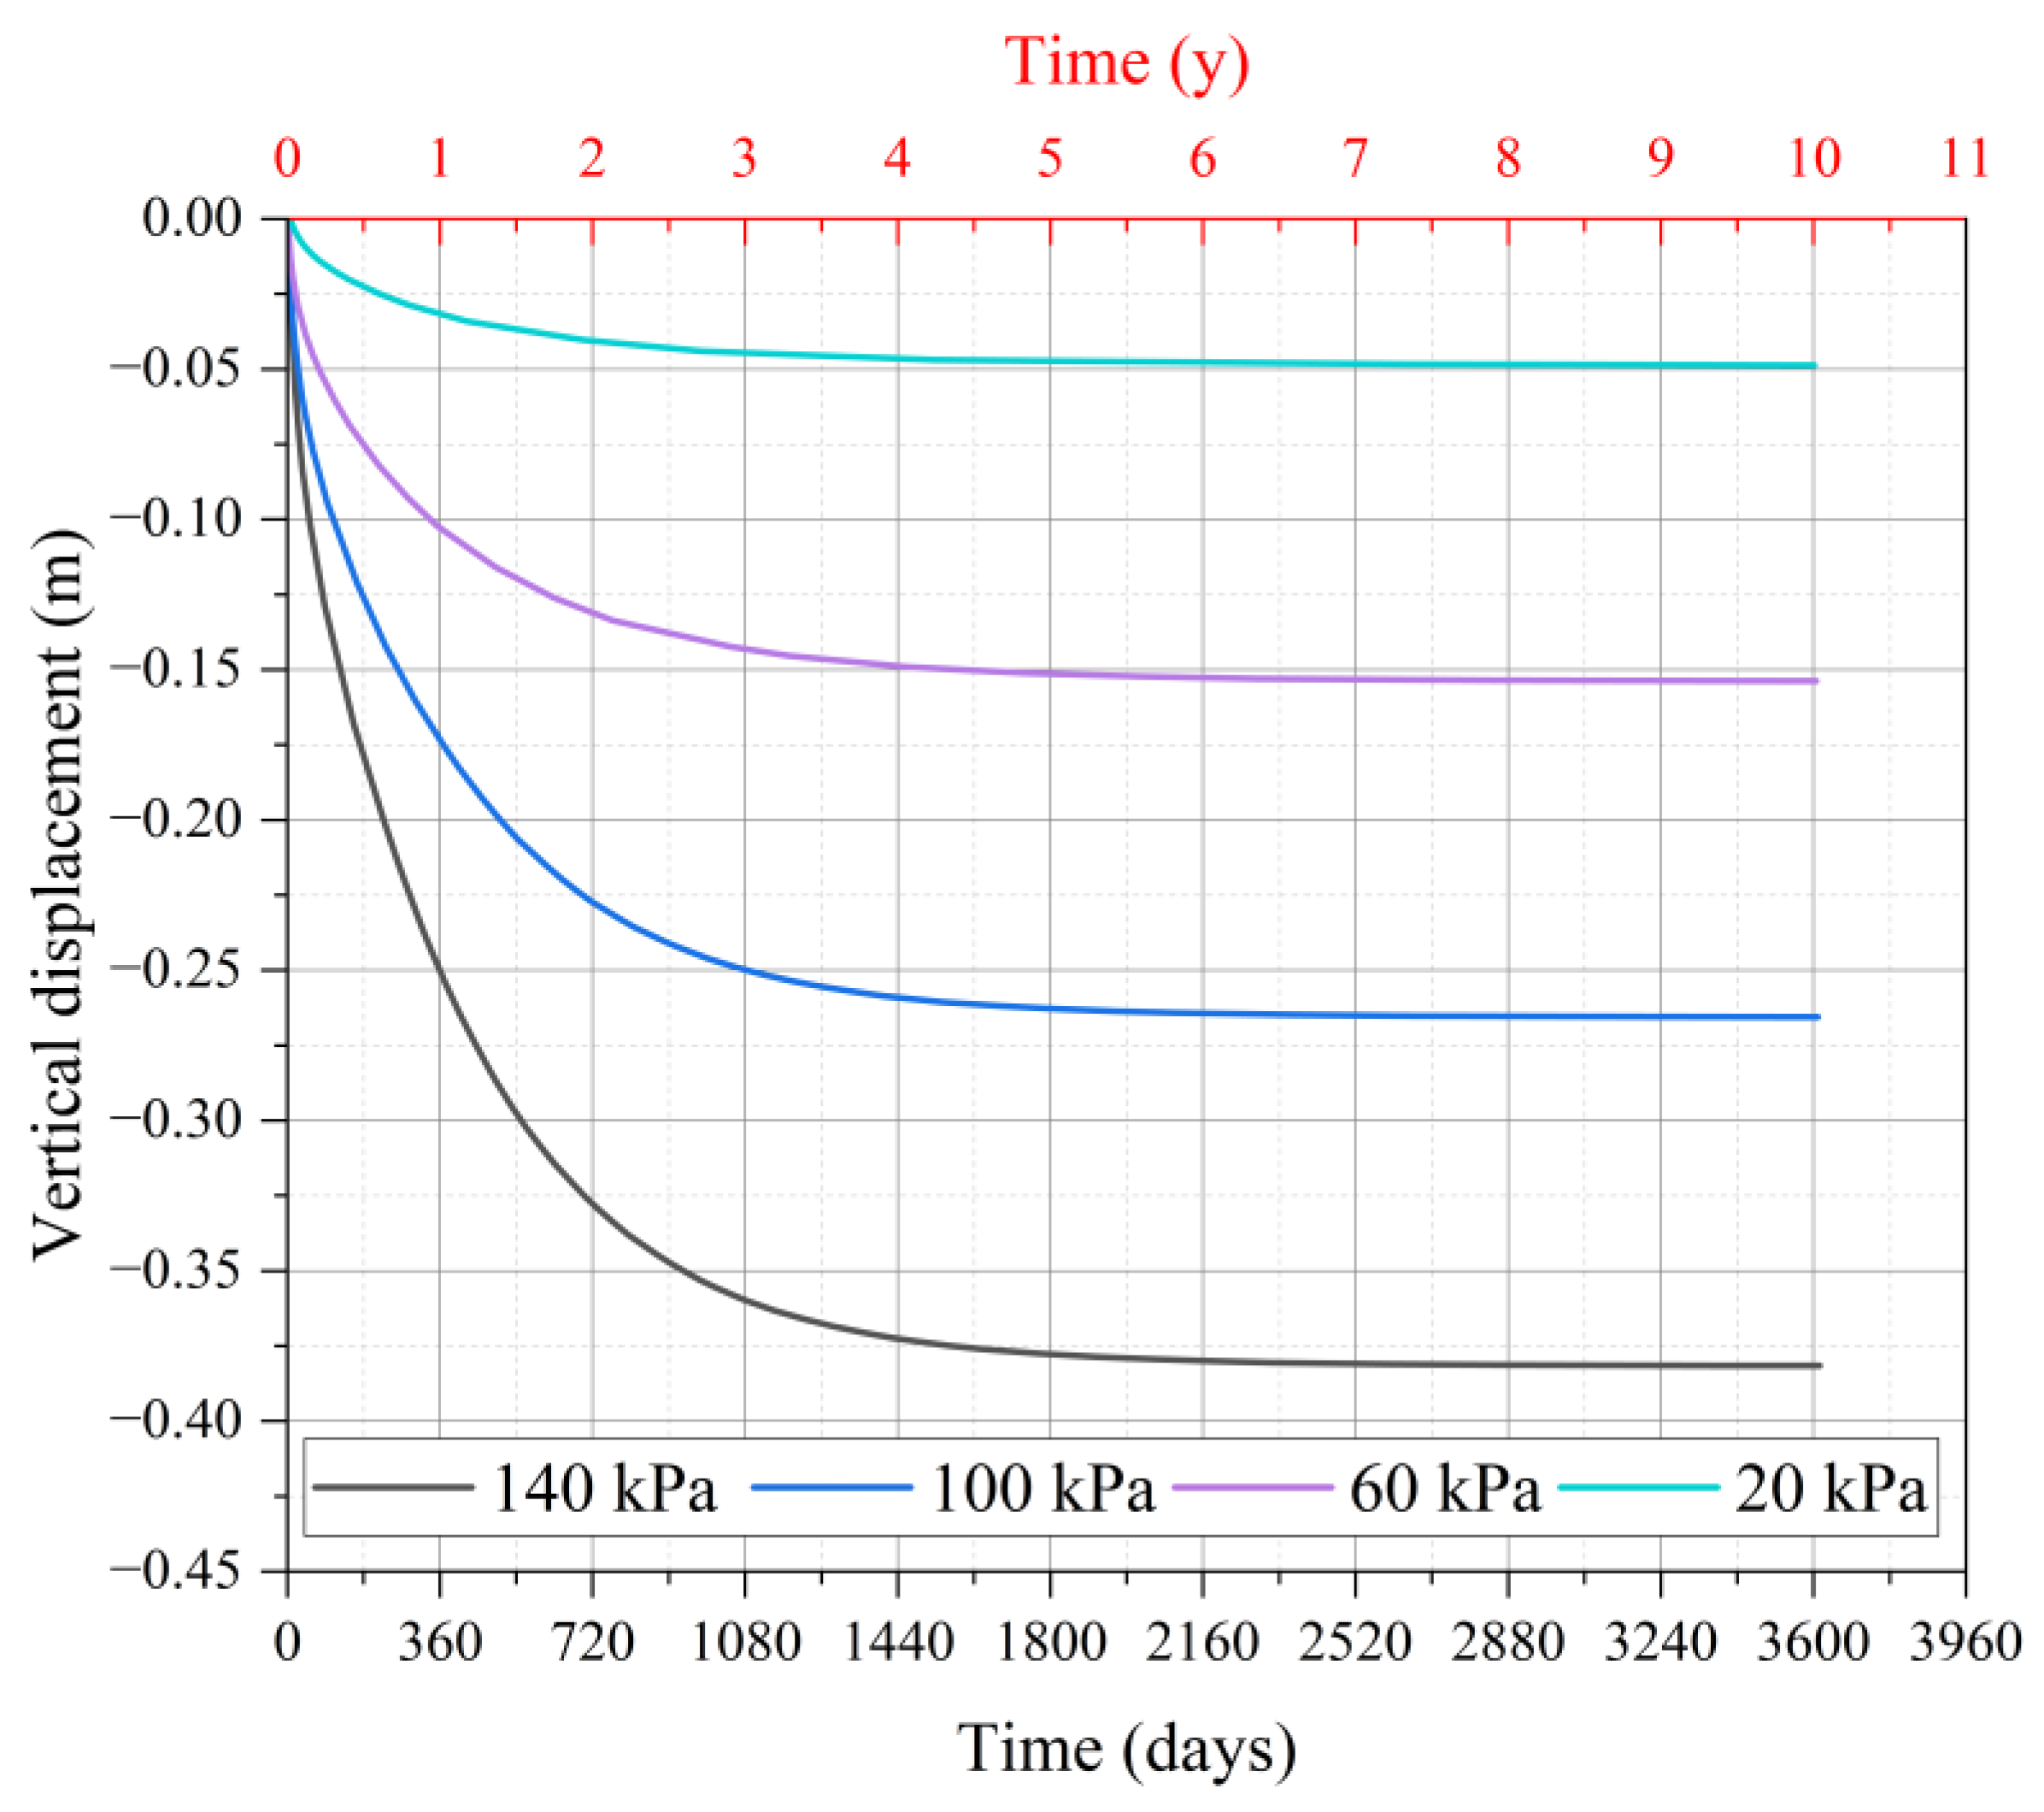
Because negative skin friction is related to the relative displacement between the pile and the surrounding soil, and, under surcharge loading, the soil undergoes vertical displacement due to consolidation settlement, determining the relationship between soil vertical displacement and the consolidation time is crucial for analyzing negative skin friction. Figure 4 presents the curves of soil vertical displacement versus time under four different overload loads. For different load levels, the vertical displacement–time curves of the soil exhibit a “J-shaped” profile. The vertical displacement progressively increases with the consolidation time but ultimately approaches a stable displacement value. This occurs because, as the consolidation time elapses, the excess pore water pressure within the soil gradually dissipates, and, concurrently, the settlement rate progressively declines until consolidation is complete. It can be observed from Figure 4 that, for the different overload loads, when the consolidation time exceeds seven years, the soil vertical displacement remains essentially unchanged, indicating that the soil consolidation is complete. Consequently, after the consolidation period exceeds seven years, the vertical displacement of the soil ceases to change. At this stage, the pile–soil relative displacement also reaches a stable value, and thus the negative skin friction no longer varies.

4. NSF in Large-Diameter Rock-Socketed Monopiles Under Horizontal Loading

To investigate the influence of horizontal loading on the negative skin friction (NSF) of large-diameter rock-socketed monopiles for offshore wind turbines, an analysis was conducted considering a surcharge of 100 kPa and a horizontal pile head load of 10 MN. A constant vertical pile head load of 5 MN, representing the equivalent load from the superstructure of the offshore wind turbine, was applied. The consolidation time was set at 10 years (3600 days), at which point the soil consolidation was complete, resulting in minimal further change in relative displacement between the pile and soil.
Figure 5 presents the distribution of side friction along the pile depth for horizontal pile head loads of 0 MN and 10 MN. Under zero horizontal load, the maximum negative skin friction of approximately −45.4 kPa occurred at a depth of −24 m. However, when a 10 MN horizontal load was applied at the pile head, the maximum negative skin friction increased significantly (to approximately −71.5 kPa) and its location shifted upwards to a depth of −3 m. Overall, for the large-diameter rock-socketed monopile, the application of horizontal pile head loading induced significant changes in the NSF distribution within the upper pile segment (0 m to −24 m depth), while the NSF in the lower segment (−24 m to −46 m depth) remained relatively unaffected. Within the upper segment (0 m to −24 m), the NSF profile under horizontal loading exhibited distinct “peaks” and “troughs” with two extrema; the larger peak occurred at a shallower depth. In contrast, the NSF profile under zero horizontal load was smooth. This phenomenon is attributed to the horizontal displacement induced in the upper pile section by the horizontal load, which alters the relative pile–soil displacement relationship under the surcharge loading. The horizontal load induces bending deformation in the pile shaft, resulting in one side of the pile being subjected to tension and the opposite side to compression. On the tension side, the pile exhibits a tendency to separate from the surrounding soil, leading to a reduction in pile–soil contact stress and a consequent decrease in negative skin friction. Conversely, on the compression side, the pile compresses the adjacent soil, increasing the pile–soil contact stress. This may result in negative skin friction slightly exceeding that observed under the no-horizontal-load condition (HL = 0 MN). However, Figure 5 does not differentiate between the compression and tension sides, presenting instead the resultant skin friction along the pile circumference. Consequently, the overall behavior manifests as a fluctuating curve.
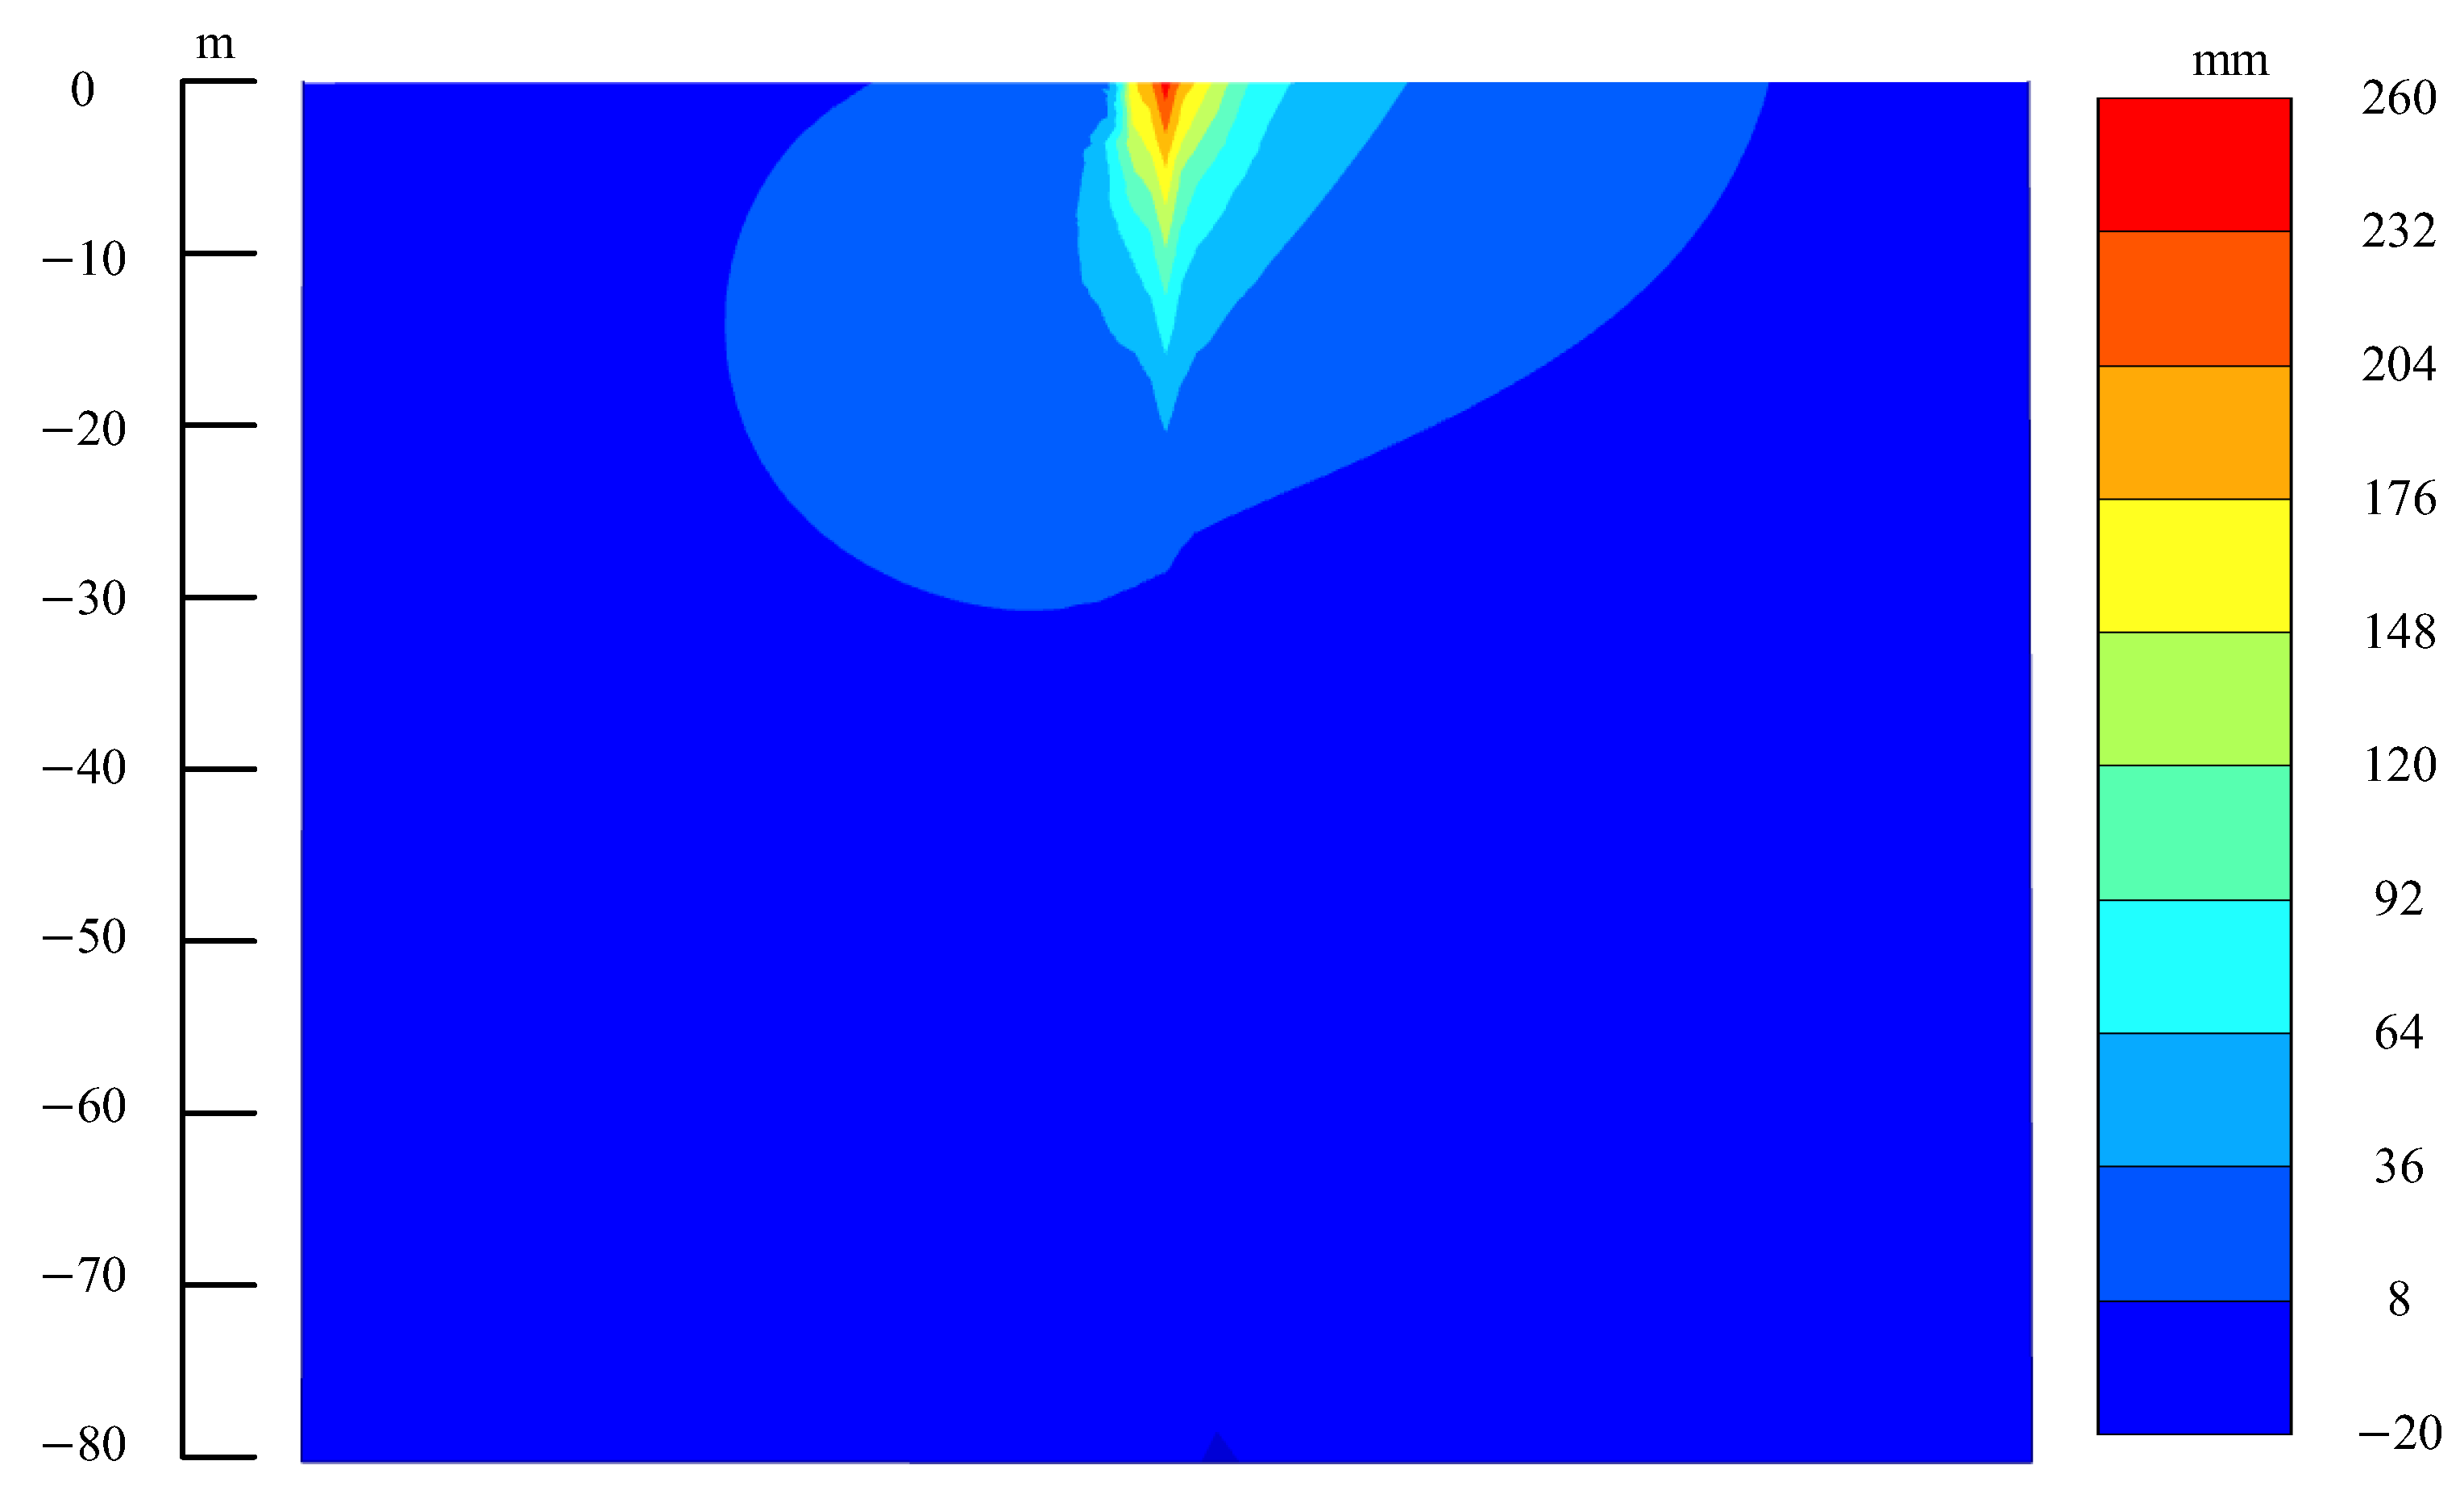
This mechanism is further illustrated in Figure 6, which shows the contour plot of horizontal soil displacement under the 10 MN horizontal pile head load. Significant horizontal displacements were primarily concentrated within the depth range of 0 m to −24 m, corresponding directly to the depth range where NSF was notably affected. Therefore, the influence of horizontal loading on negative skin friction is primarily a consequence of the soil displacements induced by the horizontal load.
Figure 7 presents the axial force distribution along the pile depth for horizontal pile head loads of 0 MN and 10 MN. Both distributions exhibit a similar pattern, with the axial force near the mudline being approximately 5 MN. Below the mudline, the axial force increases with depth, reaching its maximum value at approximately −39 m. However, under the 10 MN horizontal load, the maximum axial force was approximately 23 MN, which is about 1 MN higher than the maximum value observed under zero horizontal load (approximately 22 MN). For a rock-socketed pile not subjected to negative skin friction (NSF), the axial force would remain essentially constant with depth at 5 MN. However, NSF induces a drag load that increases the axial force in the pile. For the cases with horizontal pile head loads of 0 MN and 10 MN, the drag load generated by NSF was approximately 17 MN and 18 MN, respectively. This represents an increase of 240% and 260% compared to the case without NSF (where the axial force would be 5 MN).
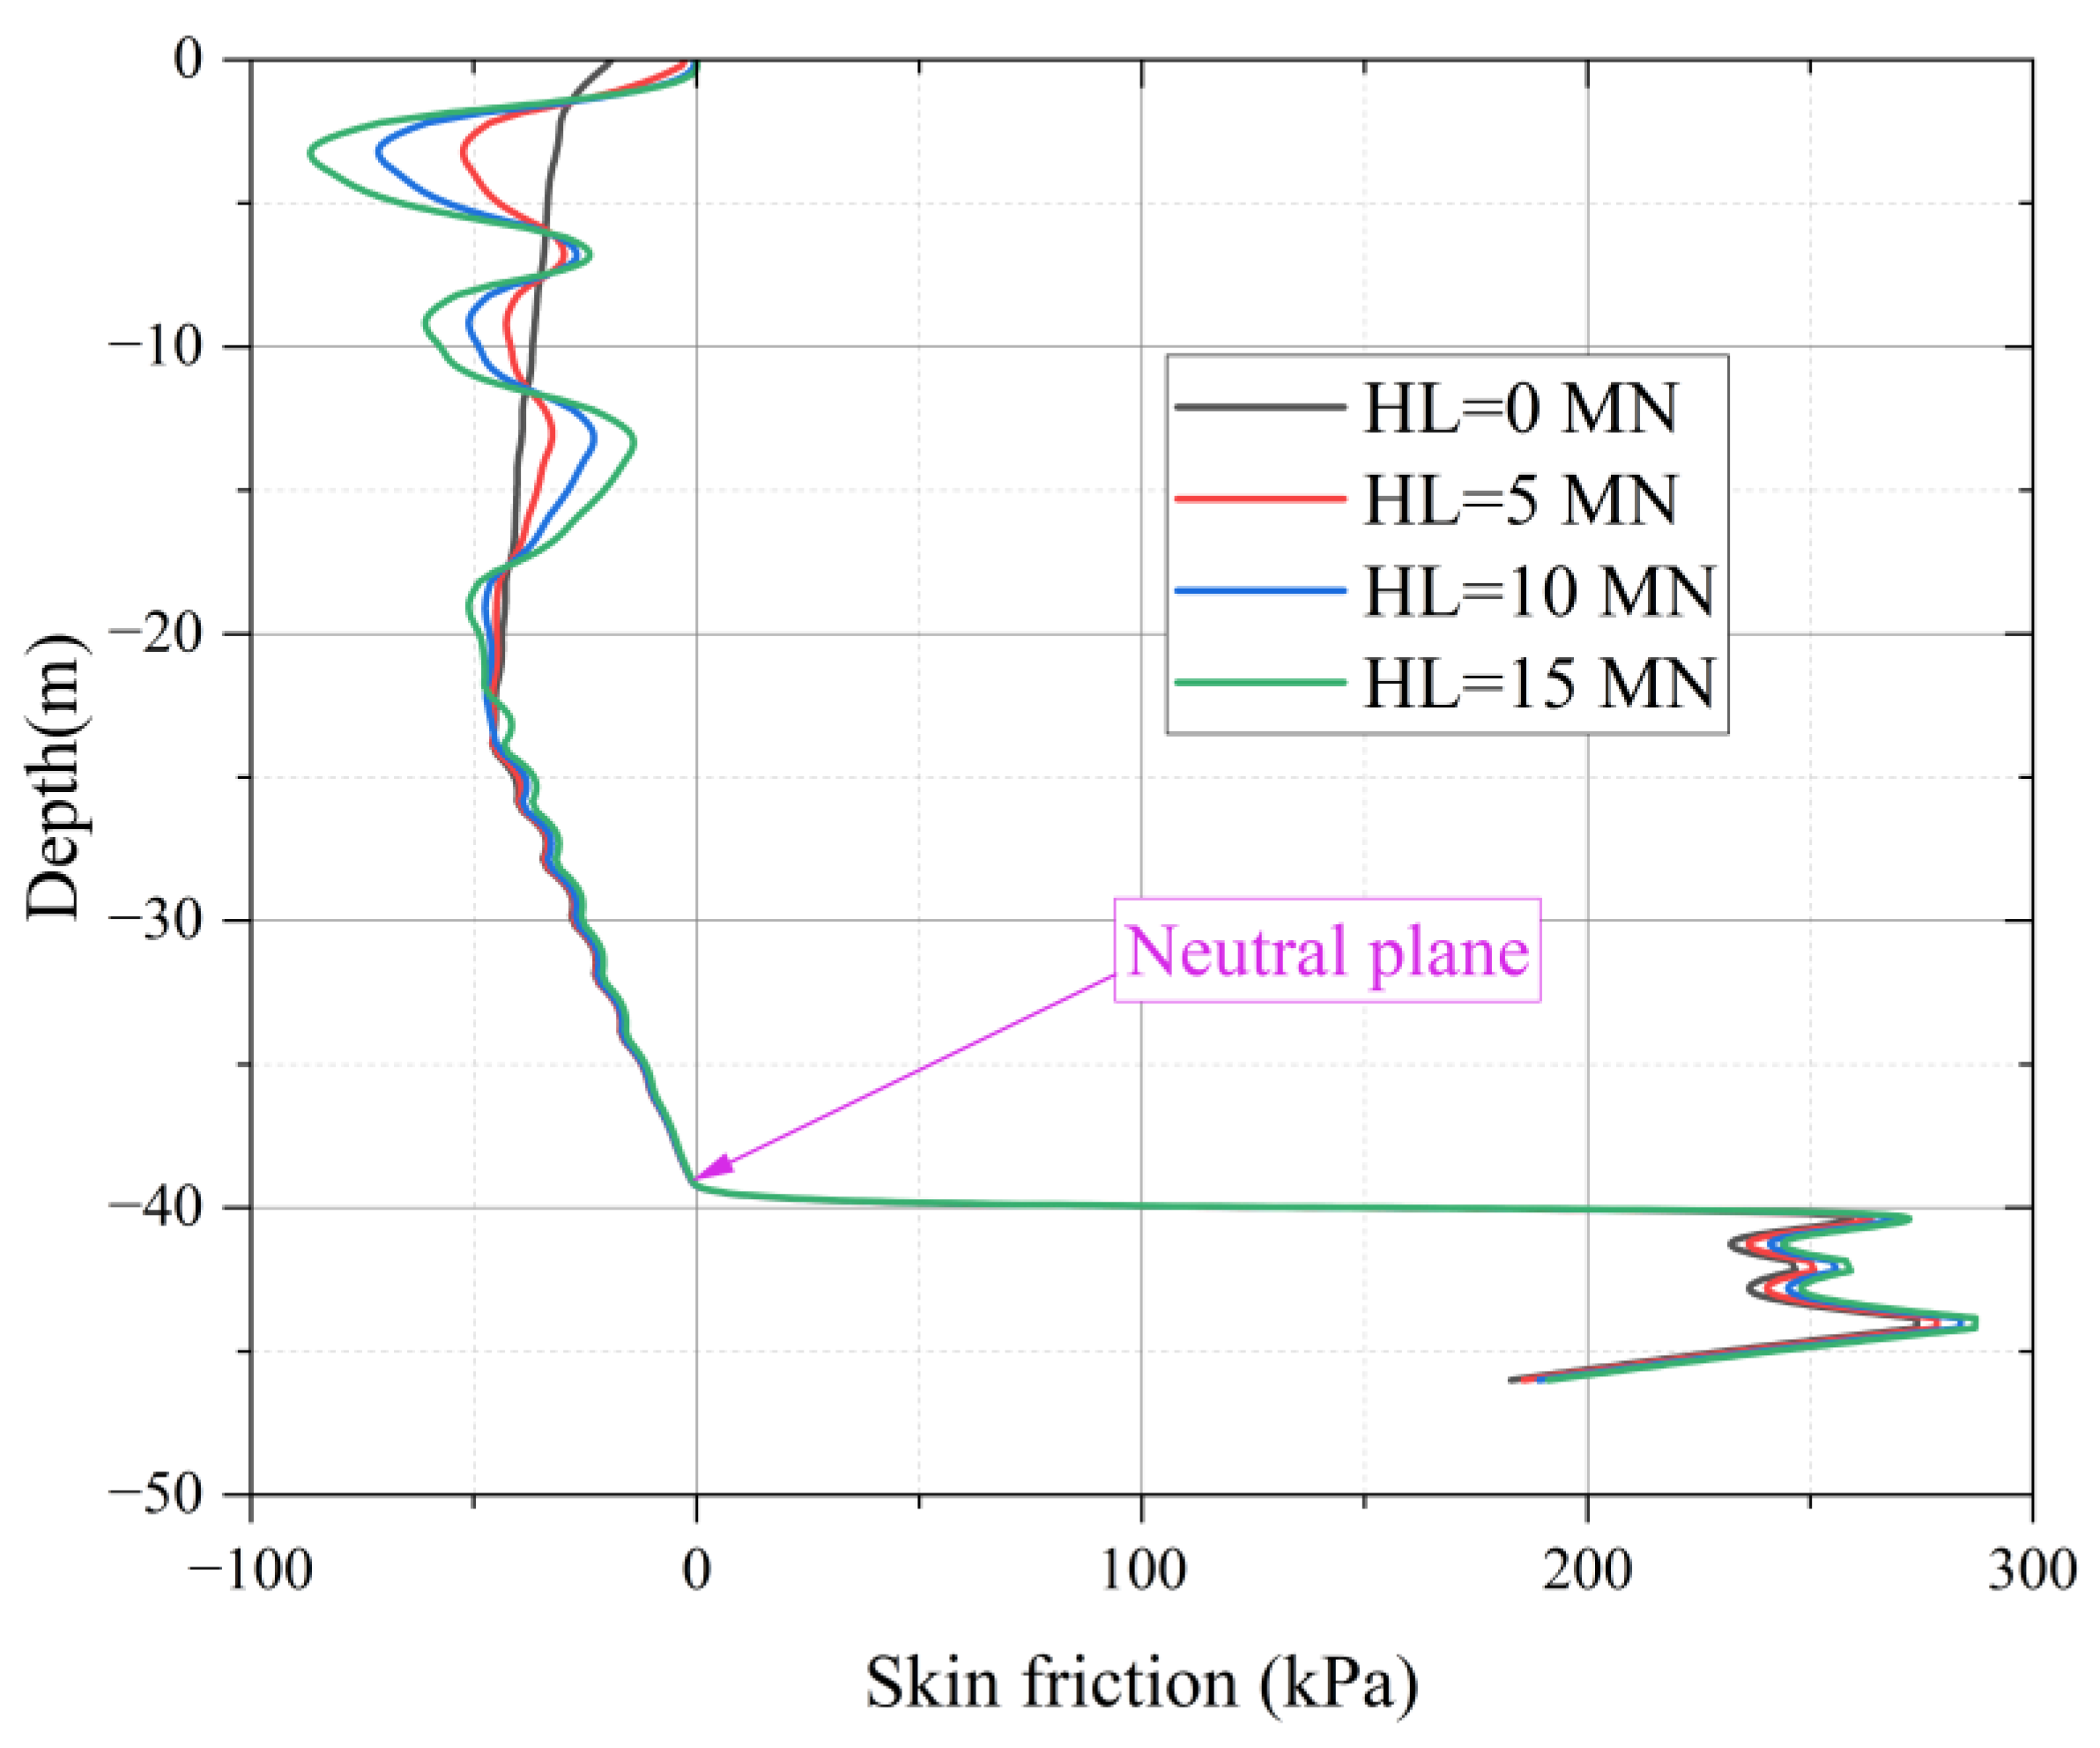
Another key issue in NFS research is the location of the neutral plane. It is defined as the position where the skin friction becomes zero or the axial force reaches its maximum. Therefore, as is discernible from Figure 5 and Figure 7, for large-diameter rock-socketed piles under surcharge loading, the location of the NFS neutral plane is situated at approximately −39 m, irrespective of whether a horizontal load acts at the pile head. This depth corresponds to the interface between the overlying clay layer and the underlying rock stratum. Thus, the pile head horizontal load does not influence the position of the neutral plane. The location of the neutral plane is instead related to the magnitude and duration of the surcharge load.

5. Parametric Analysis

The research presented in Section 4 of this study provides preliminary insights into the development of skin friction along the pile shaft under a 10 MN horizontal load applied at the pile head. To gain a deeper understanding of the variation in negative skin friction (NFS) induced by combined pile head horizontal loading and surcharge loading on the surrounding soil, and to identify key controlling parameters, this section provides a systematic parametric analysis. The analysis specifically focuses on the influence of three factors on pile NFS: consolidation time (180 days, 360 days, 720 days, 3600 days), magnitude of pile head horizontal load (0 MN, 5 MN, 10 MN, 15 MN), and surcharge magnitude (20 kPa, 60 kPa, 100 kPa, 140 kPa). The aim is to assess the impact degree and underlying mechanisms of these key factors on the NFS of large-diameter rock-socketed monopiles for offshore wind turbines, thereby providing enhanced theoretical foundations for relevant engineering design.

5.1. Effect of Consolidation Time on NSF

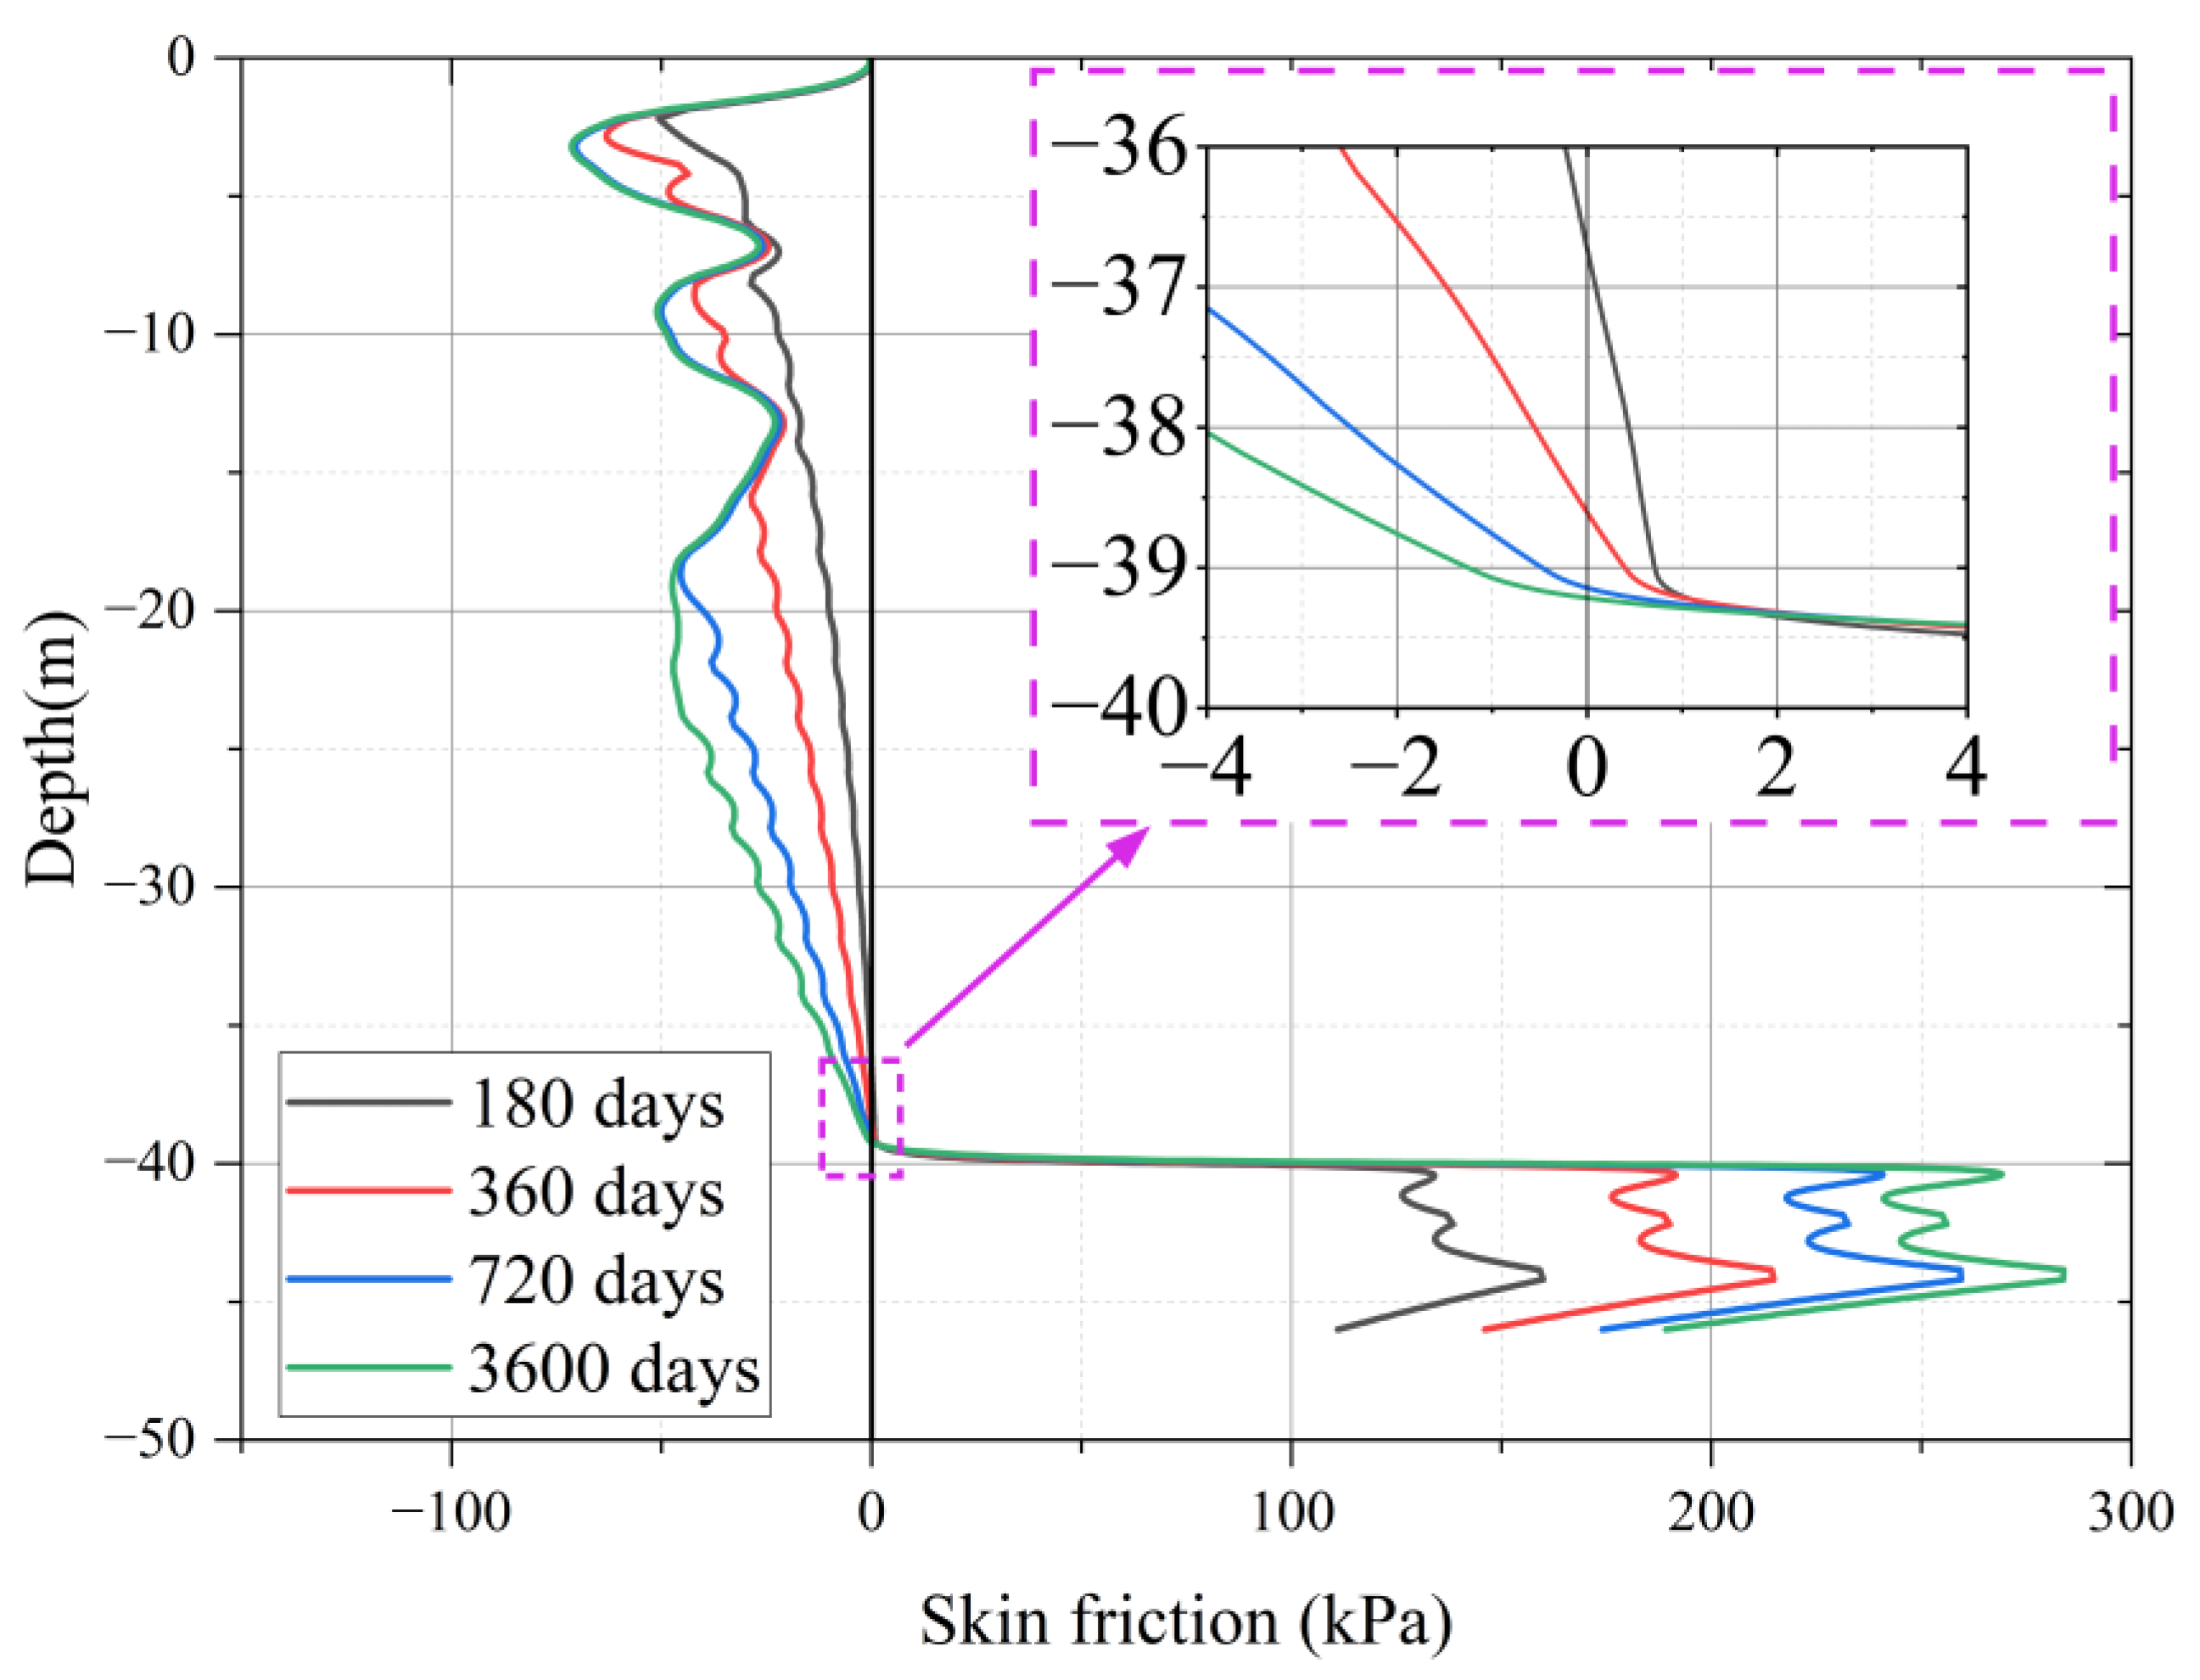
As shown in Figure 4, under a surcharge of 100 kPa, when the consolidation time exceeds seven years, the vertical displacement of the soil tends to stabilize, and the pile–soil relative displacement remains essentially constant, consequently leading to a stabilization of the negative skin friction (NFS). Therefore, the parametric analysis primarily focuses on the period where significant changes in soil vertical displacement occur. Based on the curve depicting vertical displacement versus time under a 100 kPa surcharge in Figure 4, consolidation times of 180 days, 360 days, 720 days, and 3600 days were selected for the parametric analysis to investigate the influence of consolidation time on the NFS of large-diameter monopiles subjected to horizontal loading at the pile head.
Figure 8 presents the distribution of skin friction along the pile shaft for consolidation times of 180 days, 360 days, 720 days, and 3600 days. The figure shows that NFS develops within the clay layer (0 to −40 m) for all consolidation times, and its magnitude generally increases progressively with longer consolidation periods. At 180 days, the NFS exhibits an approximately linear distribution. However, as time increases, two distinct peaks emerge in the NFS profile within the upper 0 to −18 m depth range, with the peak closer to the surface being larger. For both 720 days and 3600 days, the NFS curves are nearly identical in the 0 to −18 m zone. In contrast, within the deeper −18 m to −39 m interval, the NFS magnitude increases with longer consolidation times. This indicates that consolidation within the upper clay layer is essentially complete by 720 days; hence, the pile–soil relative displacement stabilizes, and the associated NFS in this upper section remains largely unchanged, even with further consolidation time. However, as consolidation progresses beyond 720 days, the surcharge load propagates to deeper sublayers of the clay stratum. Consequently, for the 3600 days case, the NFS within the −18 m to −39 m depth range is significantly greater than that observed at 720 days.
Figure 9 presents the distribution of axial force along the pile at different consolidation times. As shown, at all consolidation times, the axial force in the pile within the clay layer increases with depth. This increase is attributed to the drag load induced by negative skin friction (NSF). The maximum axial force consistently occurs at the bottom of the clay layer. Crucially, the magnitude of this maximum axial force is dependent on the consolidation time: the longer the consolidation time, the greater the maximum axial force. At 3600 days, the maximum axial force reached 23 MN, representing an increase of 84% compared to the maximum value at 180 days (12.5 MN). This demonstrates that increased consolidation time has a significantly adverse effect on the pile. Furthermore, as can be observed from the detail view in Figure 8 and the distributions in Figure 9, the neutral plane for negative skin friction is located within the depth range of −36.5 m to −39.5 m. Moreover, the position of this neutral plane gradually deepens (shifts downward) as the consolidation time increases.

5.2. Effect of Horizontal Load on NSF

Based on the analysis in Section 4, the application of a horizontal load at the pile head significantly alters the distribution pattern of negative skin friction along the pile shaft and leads to an increase in the negative skin friction. Consequently, a parametric analysis was conducted to investigate the influence of horizontal load magnitude on negative skin friction. According to the calculated horizontal displacement results of the pile, the maximum horizontal load for the parametric analysis was set at 15 MN, ensuring that the horizontal displacement at the mudline does not exceed 0.1D (where D is the pile diameter) [43,44]. Therefore, the horizontal loads (HL) selected for the parametric analysis were 0 MN, 5 MN, 10 MN, and 15 MN. The vertical load at the pile head and the consolidation time were 5 MN and 3600 days, respectively.
Figure 10 presents the distribution of shaft friction along the pile under different horizontal loads applied at the pile head. The figure shows that the presence of a horizontal load significantly modifies the distribution of negative skin friction in the upper section of the pile, within the depth range of 0 to −20 m. Compared to the case without horizontal load at the pile head, applying a horizontal load results in two distinct peaks in the negative skin friction, occurring at depths of approximately −3.2 m and −9.3 m. Furthermore, the magnitudes of these two peaks increase progressively with increasing horizontal load. The maximum negative skin friction occurs at the upper peak. For horizontal loads of 5 MN, 10 MN, and 15 MN at the pile head, the maximum negative skin friction values are−51.8 kPa, −70.9 kPa, and −86.1 kPa, respectively. It is evident that the peak negative skin friction increases approximately linearly with increasing horizontal load at the pile head. For the lower section of the pile within the clay layer, the negative skin friction remains nearly identical regardless of the presence of a horizontal load. This is because the horizontal load primarily influences the pile–soil relative movement only in the upper clay layer and does not affect the lower clay layer. The negative skin friction in the lower clay layer is mainly influenced by factors such as the magnitude of the surcharge and its duration.
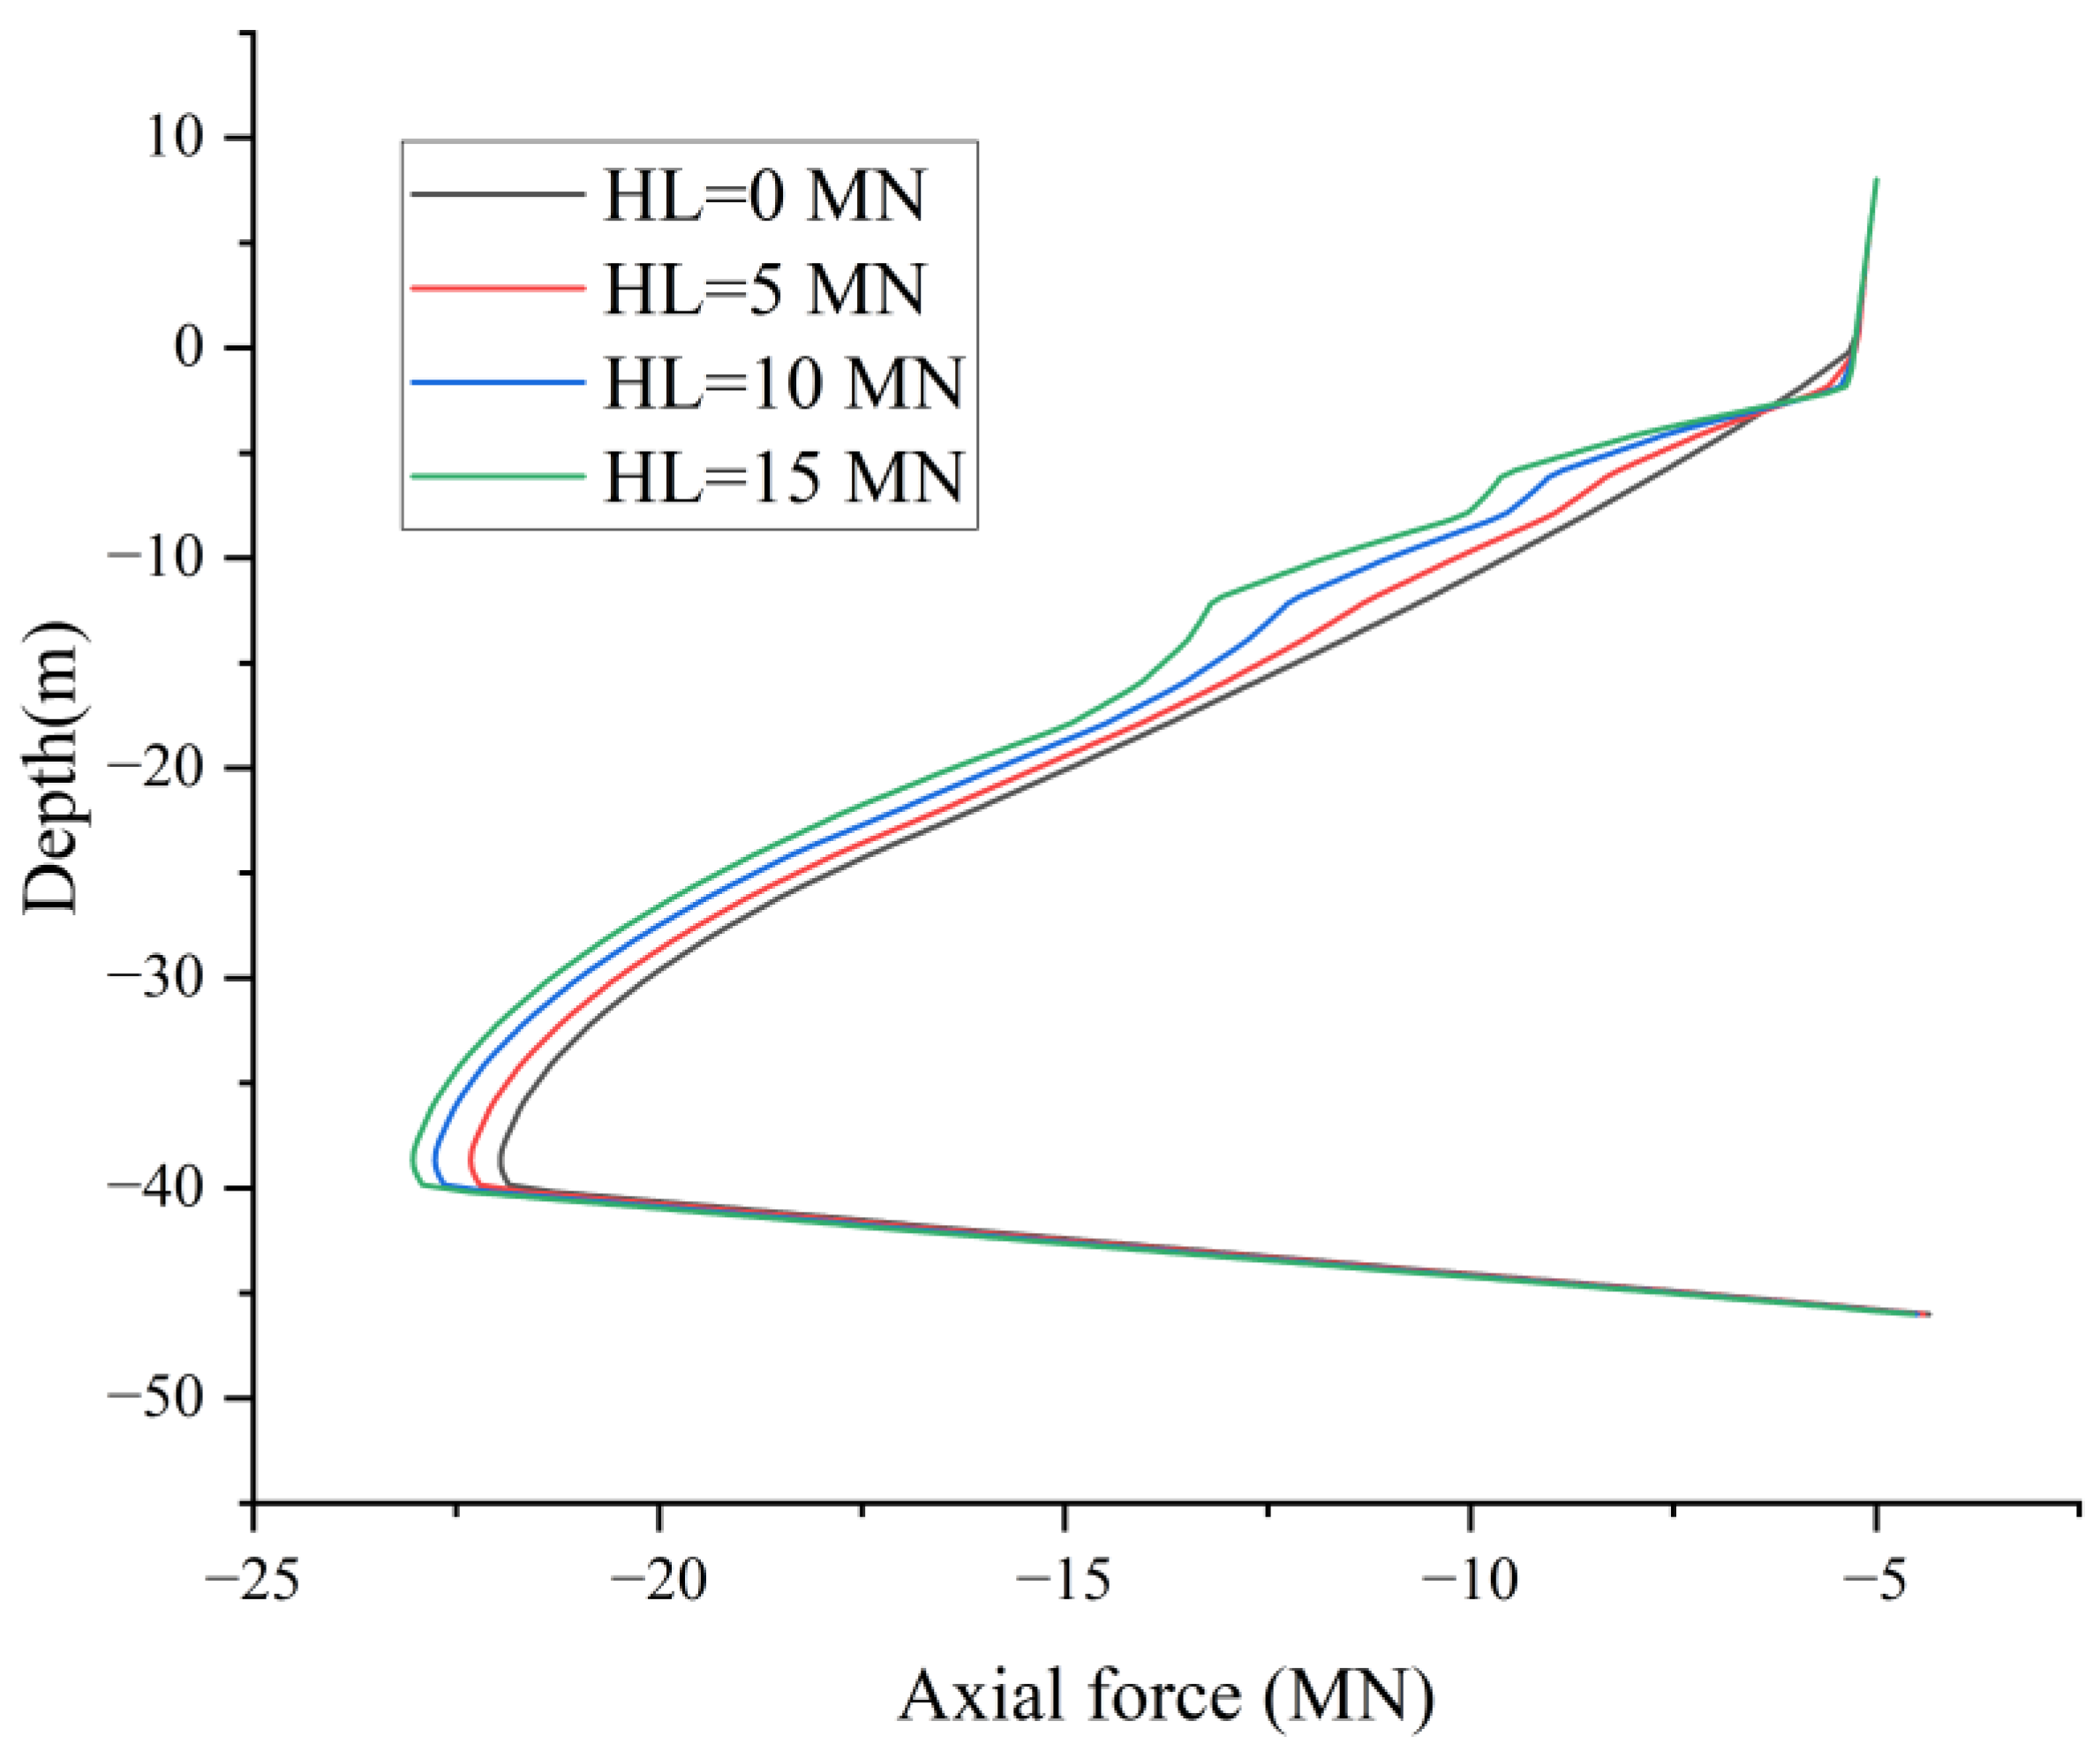
Figure 11 presents the distribution curves of axial force along the pile shaft under different pile head horizontal loads. The figure reveals that, for all magnitudes of pile head horizontal load, the axial force within the clay layer increases with depth. Furthermore, the axial force magnitude increases progressively with larger horizontal loads. The maximum axial force consistently occurs at the bottom of the clay layer. Within the upper section of the clay layer (0 to −20 m below the mudline), the increase in axial force becomes more pronounced with larger pile head horizontal loads. In contrast, within the deeper section (−20 m to −39 m below the mudline), the axial force increases uniformly with increasing pile head horizontal load. Consequently, the pile head horizontal load primarily exerts a greater influence on the axial force in the upper portion of the clay layer. As is shown in Figure 10 and Figure 11, the NFS neutral plane is located at approximately −39 m depth. Critically, its position remains unchanged irrespective of increases in the pile head horizontal load, indicating that the pile head horizontal load has a negligible influence on the location of the NFS neutral plane.

5.3. Effect of Overload on NSF

The analysis in Section 4 focused solely on the variation in negative skin friction (NSF) under a surcharge of 100 kPa (equivalent to approximately 5 m of embankment height). However, embankments of varying heights may occur in practical engineering projects. Furthermore, as indicated by Figure 4, the magnitude of the surcharge significantly influences the vertical displacement of the soil surrounding the pile, thereby altering the relative pile–soil displacement relationship. This alteration inevitably leads to changes in the NSF. Therefore, a parametric study was conducted considering four surcharge magnitudes: 20 kPa, 60 kPa, 100 kPa, and 140 kPa. The vertical and horizontal pile head loads were maintained at 5 MN and 10 MN, respectively, with a consolidation time of 3600 days.
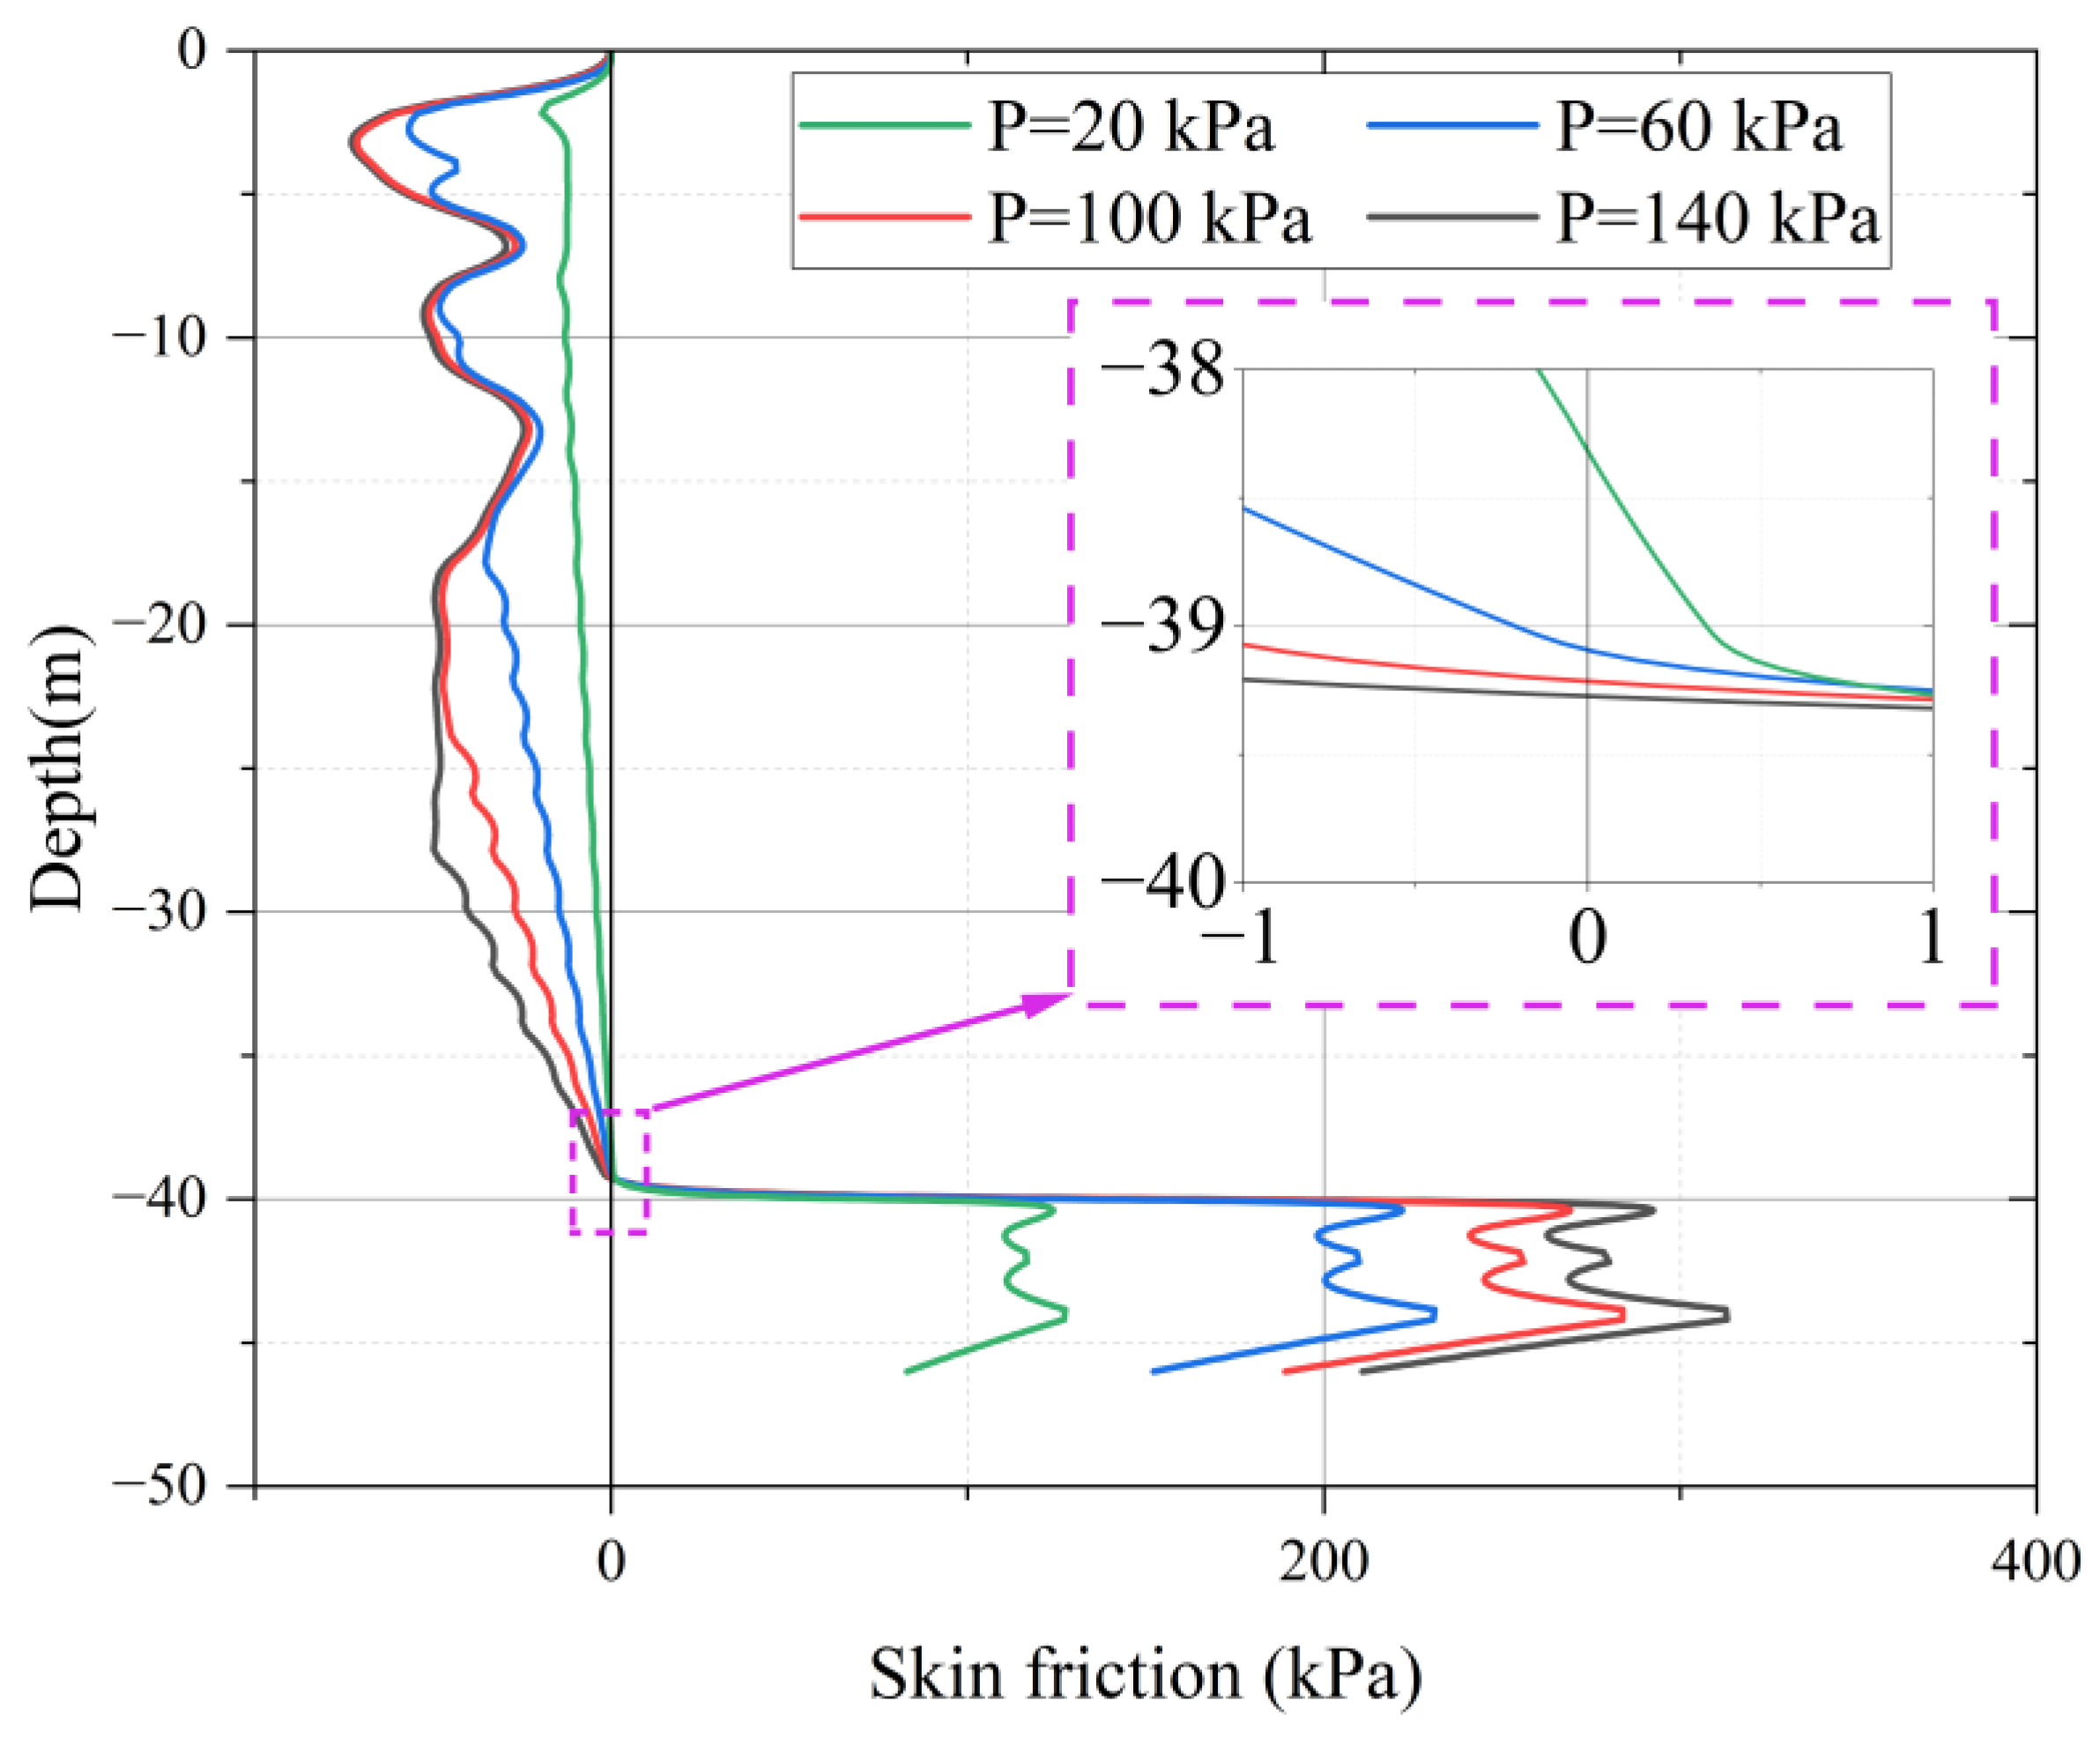
Figure 12 presents the distribution of side friction along the pile for the different surcharge magnitudes. As shown, NSF developed within the clay layer (0 m to −40 m depth) for all surcharge levels. Crucially, the magnitude of the NSF increased with increasing surcharge. At the lowest surcharge (20 kPa), the NSF profile exhibited an approximately linear distribution with depth. However, as the surcharge increased, the NSF profile within the upper clay layer developed two distinct peaks. The larger peak occurred at a shallower depth of approximately −3 m. Notably, within the depth range of 0 m to −18 m, the NSF curves for surcharges of 100 kPa and 140 kPa were essentially coincident, reaching a maximum NSF value of approximately 72.8 kPa. This indicates that increasing the surcharge beyond 100 kPa has negligible influence on the NSF within the upper clay layer. Conversely, within the deeper range of −18 m to −39 m, the NSF continued to increase with increasing surcharge magnitude. This behavior is attributed to the fact that, under higher surcharges, consolidation in the upper clay layer is complete. Consequently, the load is progressively transferred to deeper clay strata. As a result, further increases in surcharge no longer augment the NSF in the upper clay, while the NSF in the lower clay continues to increase.
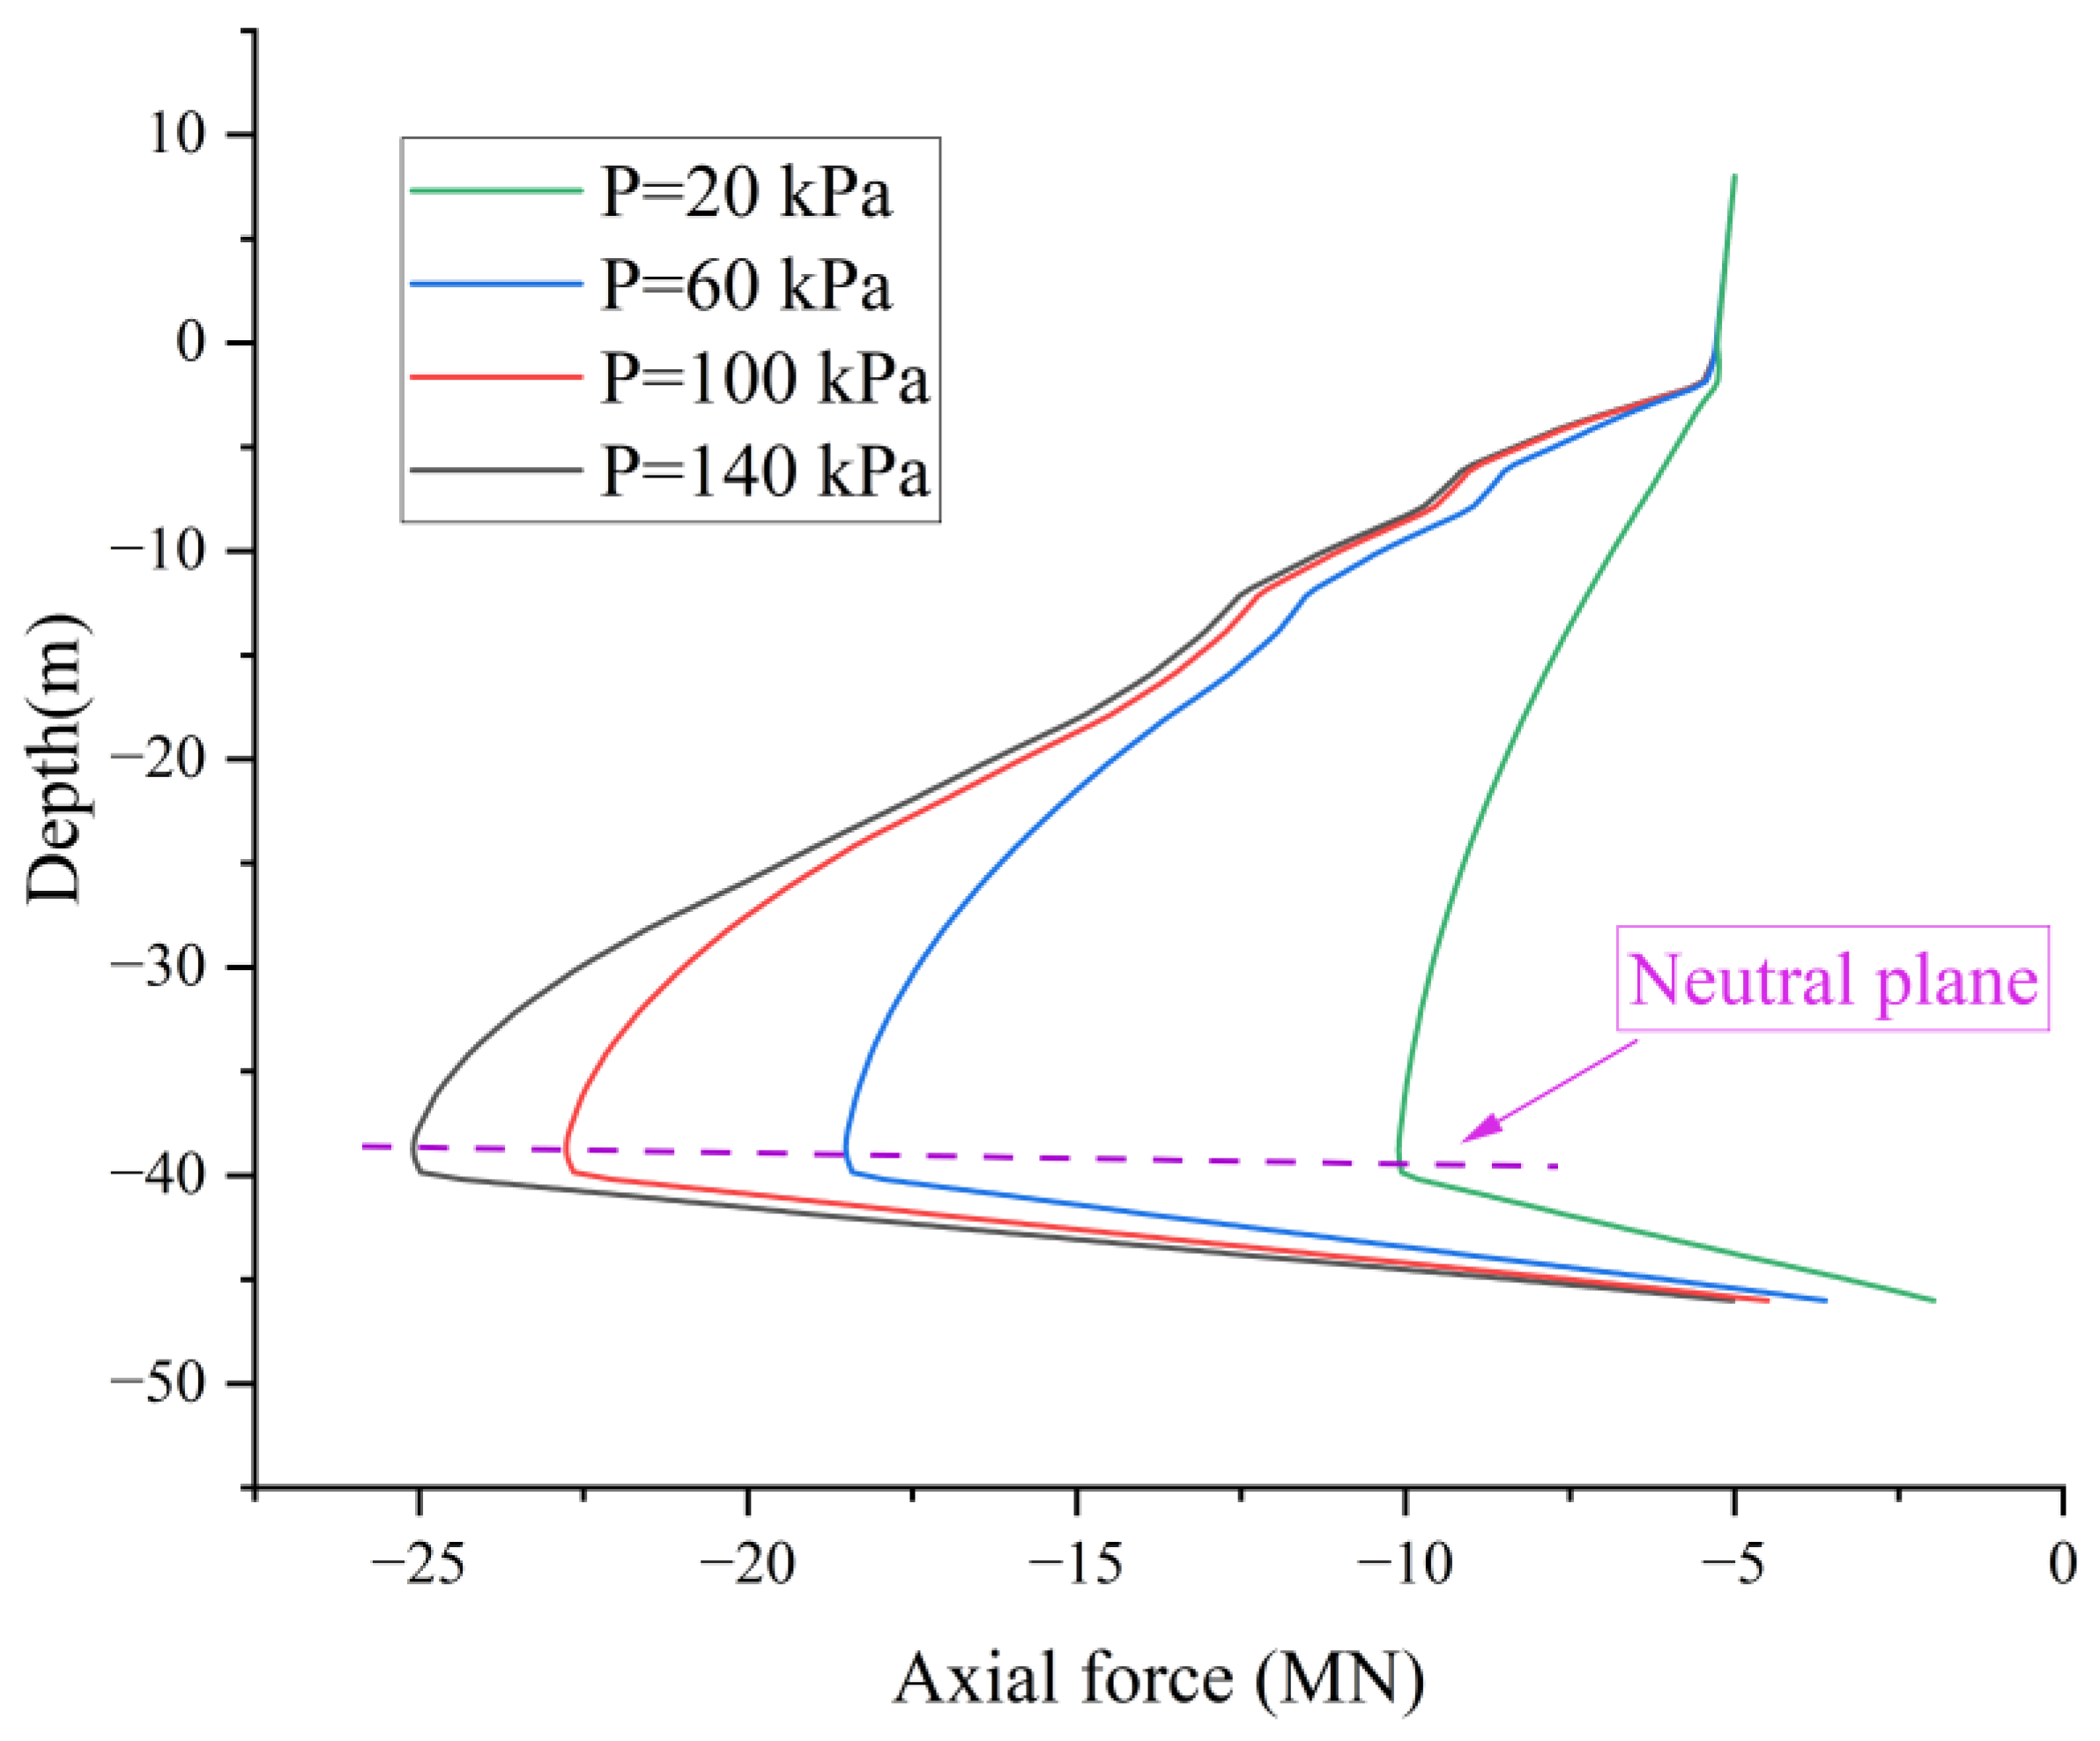
Figure 13 presents the distribution curves of axial force along the pile shaft under different surcharge magnitudes. The figure reveals that, for all magnitudes of surcharge loading, the axial force within the clay layer increases with depth. Furthermore, the magnitude of the axial force increases progressively with larger surcharge loads. The maximum axial force consistently occurs at the bottom of the clay layer. Within the upper section (0 to −18 m below the mudline), the axial forces for surcharge loads of 100 kPa and 140 kPa are virtually identical. However, considering the full clay layer depth (0 to −40 m below the mudline), the axial force magnitude increases with increasing surcharge. Consequently, the surcharge load primarily exerts a greater influence on the axial force in the lower portion of the clay layer. As observed in the inset of Figure 12 and Figure 13, the NFS neutral plane is located within the depth range of −38 m to −39.5 m. Critically, the position of the NFS neutral plane becomes progressively deeper with increasing surcharge magnitude.

6. Conclusions

This study presents a systematic numerical investigation into the behavior of negative skin friction (NSF) in large-diameter rock-socketed monopiles for offshore wind turbines under the coupled action of pile head transverse directional loading and soil surcharge loading. A comprehensive parametric analysis was conducted. The key conclusions derived from the validated three-dimensional finite element model are summarized as follows:
(1)
Dual validation against independent case studies—comprising NSF development under surcharge loading and horizontal response of piles—established a finite element model capable of accurately capturing pile–soil interaction mechanisms. This model provides an effective predictive tool for pile foundation NSF under complex loading conditions.
(2)
Horizontal load reshapes the distribution morphology of negative skin friction within the upper segment of the pile shaft. Horizontal pile head loads transform the NSF profile from a smooth curve (under pure vertical loading) into a bimodal distribution with distinct peaks and troughs in the upper clay layer (0 to −24 m). The maximum NSF magnitude increases by ~57% (from −45.4 kPa to −71.5 kPa).
(3)
Prolonged consolidation significantly amplifies negative skin friction (NSF) and drag load, increasing the maximum axial force by 84% (12.5 MN to 23 MN) from 180 to 3600 days. The neutral plane deepens from −36.5 m to −39.5 m due to progressive stress transfer to lower clay strata, while NSF stabilizes in upper clay (>720 days) but continues growing in deeper zones.
(4)
Horizontal loading transforms upper-segment NSF (0 to −20 m) into a bimodal distribution with linearly increasing peak values. Crucially, it leaves lower-layer NSF and the neutral plane depth (−39 m) unaffected, confirming horizontal loads primarily reshape shallow NSF patterns.
(5)
The magnitude of surcharge loading governs both the development and spatial distribution of NSF. While NSF increases throughout the clay layer (0 to −40 m) with higher surcharges (20–140 kPa), its response exhibits distinct depth-dependent saturation: in the upper clay stratum (0 to −18 m), NSF peaks saturate beyond 100 kPa, stabilizing near 72.8 kPa; conversely, in the deeper clay (−18 m to −39 m), NSF continues to rise with surcharge magnitude as stresses propagate downward.
However, this study focused exclusively on rock-socketed monopiles for offshore wind turbines. Future research could extend the scope to include friction piles and investigate the evolution patterns of NSF under coupled multi-parameter effects.

Author Contributions

Conceptualization, Y.R., Z.C. and W.Z.; methodology, Y.R., Z.C. and W.Z.; software, Z.C.; validation, Y.R. and Z.C.; formal analysis, Y.R. and Z.C.; investigation, Y.R. and Z.C.; resources, W.Z.; data curation, Y.R. and Z.C.; writing—original draft preparation, Y.R. and Z.C.; writing—review and editing, Y.R., Z.C. and W.Z.; visualization, Y.R. and Z.C.; supervision, W.Z.; project administration, Z.C. and W.Z.; funding acquisition, W.Z. All authors have read and agreed to the published version of the manuscript.

Funding

This research was funded by the National Natural Science Foundation of China, 52208333 and the Research Fund for Advanced Ocean Institute of Southeast University, General Program GP202403.

Data Availability Statement

The original contributions presented in this study are included in the article. Further inquiries can be directed to the corresponding authors.

Acknowledgments

The authors gratefully acknowledge the support provided by the Innovative Research Team on Mechanisms of Road Subsidence and Intelligent Detection of Pavement Stability in the Loess Plateau Region (CX24003), Shaanxi College of Communications Technology. We extend our sincere appreciation to all members of the editorial team for their diligent efforts. Special thanks are accorded to the reviewers for their insightful feedback and dedicated time invested in the thorough evaluation of this manuscript.

Conflicts of Interest

The authors declare no conflicts of interest.

References

  1. Díaz, H.; Soares, C.G. Review of the current status, technology and future trends of offshore wind farms. Ocean Eng. 2020, 209, 107381. [Google Scholar] [CrossRef]
  2. Jeong, S.; Ko, J.; Lee, C.; Kim, J. Response of single piles in marine deposits to negative skin friction from long-term field monitoring. Mar. Georesources Geotechnol. 2014, 32, 239–263. [Google Scholar] [CrossRef]
  3. He, R.; Ji, J.; Zhang, J.; Peng, W.; Sun, Z.; Guo, Z. Dynamic Impedances of Offshore Rock-Socketed Monopiles. J. Mar. Sci. Eng. 2019, 7, 134. [Google Scholar] [CrossRef]
  4. He, R.; Zhu, T.; Ma, B.; Guo, Z. Lateral static stiffness of offshore monopile socketed in soft rock. Mar. Struct. 2022, 86, 103302. [Google Scholar] [CrossRef]
  5. Gan, M.; Huang, L.; You, S.; Hua, Y.; Pan, Y.; Deng, J.; Wang, K. Monitoring coastal land reclamation and land use change around Hangzhou Bay using Landsat dataset (1970s–2014). In Proceedings of the Land Surface Remote Sensing II, Beijing, China, 13–16 October 2014; pp. 734–743. [Google Scholar]
  6. Huang, F.; Chen, Z.; Deng, H.; Zhu, W. Lateral Deformation Mechanisms of Piles in Coastal Regions Under Seawall Surcharge Loading and Mitigation Using Deep Cement Mixing (DCM) Piles. Buildings 2025, 15, 1936. [Google Scholar] [CrossRef]
  7. Chen, Z.; Deng, H.; Dai, G.; Zhu, M.; Gong, W.; Azadi, M.R. Study on the influence of unsymmetrical surcharge on adjacent pile foundations in a coastal soft soil area. Soil Dyn. Earthq. Eng. 2025, 194, 109365. [Google Scholar] [CrossRef]
  8. Yan, Y.; Dai, G.; Chen, Z.; Hu, T.; Gong, W.; Shi, C. Experimental Study of Negative Skin Friction of Pile Group Foundations for Offshore Wind Turbines on Artificial Islands. J. Mar. Sci. Eng. 2024, 12, 1386. [Google Scholar] [CrossRef]
  9. Carrubba, P. Skin friction on large-diameter piles socketed into rock. Can. Geotech. J. 1997, 34, 230–240. [Google Scholar] [CrossRef]
  10. Ren, Y.-x.; Li, Y.; Cui, W.; Guo, W.; Zhuang, D.; Cui, S.; Zhang, L. Analysis of negative skin friction and bending moment on batter rock-socketed pile. Mar. Georesources Geotechnol. 2024, 42, 927–944. [Google Scholar] [CrossRef]
  11. Wu, W.; Wang, Z.; Zhang, Y.; El Naggar, M.H.; Wu, T.; Wen, M. Semi-analytical solution for negative skin friction development on deep foundations in coastal reclamation areas. Int. J. Mech. Sci. 2023, 241, 107981. [Google Scholar] [CrossRef]
  12. Poulos, H. Piles subjected to negative friction: A procedure for design. Geotech. Eng. 1997, 28, 23–44. [Google Scholar]
  13. Jiang, C.; Shi, Z.; Pang, L. Analytical Solution for Negative Skin Friction in Offshore Wind Power Pile Foundations on Artificial Islands under the Influence of Soil Consolidation. J. Mar. Sci. Eng. 2023, 11, 1071. [Google Scholar] [CrossRef]
  14. Ma, L.; Wang, Y.-K. Calculation and analysis of negative skin of monopile applied for offshore wind turbine. Mar. Georesources Geotechnol. 2017, 35, 275–280. [Google Scholar] [CrossRef]
  15. Indraratna, B.; Balasubramaniam, A.; Phamvan, P.; Wong, Y. Development of negative skin friction on driven piles in soft Bangkok clay. Can. Geotech. J. 1992, 29, 393–404. [Google Scholar] [CrossRef]
  16. El-Mossallamy, Y.M.; Hefny, A.M.; Demerdash, M.A.; Morsy, M.S. Numerical analysis of negative skin friction on piles in soft clay. HBRC J. 2013, 9, 68–76. [Google Scholar] [CrossRef]
  17. Alielahi, H.; Rad, M.A.; Derakhshan, A. 3D Numerical Modeling of Negative Skin Friction Effects on Tapered Piles in Soft Soils. Indian Geotech. J. 2025, 55, 1031–1043. [Google Scholar] [CrossRef]
  18. Leung, C.F.; Liao, B.K.; Chow, Y.K.; Shen, R.F.; Kog, Y.C. Behavior of Pile Subject to Negative Skin Friction and Axial Load. Soils Found. 2004, 44, 17–26. [Google Scholar] [CrossRef]
  19. Shen, K.; Wang, K.; Yao, J.; Yu, J. Numerical Investigation on Behavior of Compressive Piles in Coastal Tidal Flat with Fill. J. Mar. Sci. Eng. 2022, 10, 1742. [Google Scholar] [CrossRef]
  20. Cheng, X.; Wang, T.; Zhang, J.; Liu, Z.; Cheng, W. Finite element analysis of cyclic lateral responses for large diameter monopiles in clays under different loading patterns. Comput. Geotech. 2021, 134, 104104. [Google Scholar] [CrossRef]
  21. Liu, R.; Shi, J.; Chen, G.; Yang, X. Lateral bearing capacity and calculation method of pile-bucket foundation in clay for offshore wind turbines. Ocean Eng. 2023, 283, 115039. [Google Scholar] [CrossRef]
  22. Li, Q.; Prendergast, L.J.; Askarinejad, A.; Gavin, K. Influence of Vertical Loading on Behavior of Laterally Loaded Foundation Piles: A Review. J. Mar. Sci. Eng. 2020, 8, 1029. [Google Scholar] [CrossRef]
  23. Lin, L.; Wang, F.-c. Investigation of analytical behavior of concrete filled steel tubular (CFST) offshore rock-socketed pile under lateral load. Ocean Eng. 2023, 277, 114279. [Google Scholar] [CrossRef]
  24. Wang, Y.; Liang, F.; Zhang, H.; Zheng, H. Numerical evaluation of the dynamic performance of recommissioned offshore wind turbines under service life extension and repowering strategies. Comput. Geotech. 2025, 186, 107370. [Google Scholar] [CrossRef]
  25. Hou, Z.; Lehane, B.M.; Watson, P.G. An experimental investigation of the time dependence of shaft friction for displacement piles in lightly over-consolidated clay. Géotechnique 2025, 1–14. [Google Scholar] [CrossRef]
  26. Hanna, A.M.; Sharif, A. Drag Force on Single Piles in Clay Subjected to Surcharge Loading. Int. J. Geomech. 2006, 6, 89–96. [Google Scholar] [CrossRef]
  27. Liu, J.; Gao, H.; Liu, H. Finite element analyses of negative skin friction on a single pile. Acta Geotech. 2012, 7, 239–252. [Google Scholar] [CrossRef]
  28. Alsharedah, Y.; Newson, T.; El Naggar, M.H. A 3-D modelling of monopile behaviour under laterally applied loading. Geomech. Geophys. Geo-Energy Geo-Resour. 2024, 10, 173. [Google Scholar] [CrossRef]
  29. Brinkgreve, R.B.J.; Kumarswamy, S.; Swolfs, W.M.; Waterman, D.; Chesaru, A.; Bonnier, P.G. PLAXIS 2016; Plaxis B.V.: Delft, The Netherlands, 2016. [Google Scholar]
  30. Hamdan, N.; Bahar, E.; Powell, T. Numerical modelling of rock protected pipelines subjected to multi-directional pull-out forces. In Proceedings of the SUT Offshore Site Investigation and Geotechnics, London, UK, 12–14 September 2023; pp. 682–689. [Google Scholar]
  31. Jerman, J. Evaluation of a Rigid Element for Offshore Applications. Ph.D. Thesis, Charles University, Prague, Czech Republic, 2014. [Google Scholar]
  32. Gu, M.; Cai, X.; Fu, Q.; Li, H.; Wang, X.; Mao, B. Numerical Analysis of Passive Piles under Surcharge Load in Extensively Deep Soft Soil. Buildings 2022, 12, 1988. [Google Scholar] [CrossRef]
  33. Yang, S.; Jia, M. Lateral response of a pile group embedded in the transversely isotropic saturated soil due to surcharge loads. Eng. Anal. Bound. Elem. 2023, 155, 1082–1095. [Google Scholar] [CrossRef]
  34. Fakharian, K.; Meskar, M.; Mohammadlou, A.S. Effect of Surcharge Pressure on Pile Static Axial Load Test Results. Int. J. Geomech. 2014, 14, 04014024. [Google Scholar] [CrossRef]
  35. Li, S.; Deng, Z.; Wei, L.; Chen, Q.; Zhang, Y.; He, F. Lateral behavior of high-speed railway bridge pile foundation in soft soils under adjacent surcharge loads considering time-dependent characteristics. Alex. Eng. J. 2025, 110, 451–467. [Google Scholar] [CrossRef]
  36. Shawky, O.; Altahrany, A.I.; Elmeligy, M. Improved Pile Geometry to Reduce Negative Skin Friction on Single Driven Pile and Pile Groups Subjected to Lateral Loads. Geotech. Geol. Eng. 2022, 40, 4487–4516. [Google Scholar] [CrossRef]
  37. Alsharedah, Y.A.; Newson, T.; El Naggar, M.H.; Black, J.A. Lateral Ultimate Capacity of Monopile Foundations for Offshore Wind Turbines: Effects of Monopile Geometry and Soil Stiffness Properties. Appl. Sci. 2023, 13, 12269. [Google Scholar] [CrossRef]
  38. Li, T.; Yu, X.; He, B.; Dai, S. The Lateral Behavior of Large-Diameter Monopiles for Offshore Wind Turbines Based on the p-y Curve and Solid FEM Methods. J. Mar. Sci. Eng. 2023, 11, 2354. [Google Scholar] [CrossRef]
  39. API. API 2A-WSD: Recommended Practice for Planning, Designing and Constructing Fixed Offshore Platforms-Working Stress Design; American Petroleum Institute: Washington, DC, USA, 2000. [Google Scholar]
  40. Malhotra, S. Selection, design and construction of offshore wind turbine foundations. In Wind Turbines; IntechOpen: Rijeka, Croatia, 2011. [Google Scholar]
  41. Wang, Y.; Zou, X.; Zhou, M.; Zhang, X. Capacity and failure mechanism of monopile-wheel hybrid foundation in clay-overlaying-sand deposits under combined V–H-M loadings. Mar. Struct. 2023, 90, 103443. [Google Scholar] [CrossRef]
  42. Dai, S.; Bo, H.; Guoxiang, H.; Xiaoqiang, G.; Liu, J.; Liu, S. Failure mode of monopile foundation for offshore wind turbine in soft clay under complex loads. Mar. Georesources Geotechnol. 2022, 40, 14–25. [Google Scholar] [CrossRef]
  43. He, R.; Zhu, T. Model Tests on the Frequency Responses of Offshore Monopiles. J. Mar. Sci. Eng. 2019, 7, 430. [Google Scholar] [CrossRef]
  44. Khezri, A.; Park, H.; Lee, D. Numerical Study on the Lateral Load Response of Offshore Monopile Foundations in Clay: Effect of Slenderness Ratio. Appl. Sci. 2024, 14, 8366. [Google Scholar] [CrossRef]
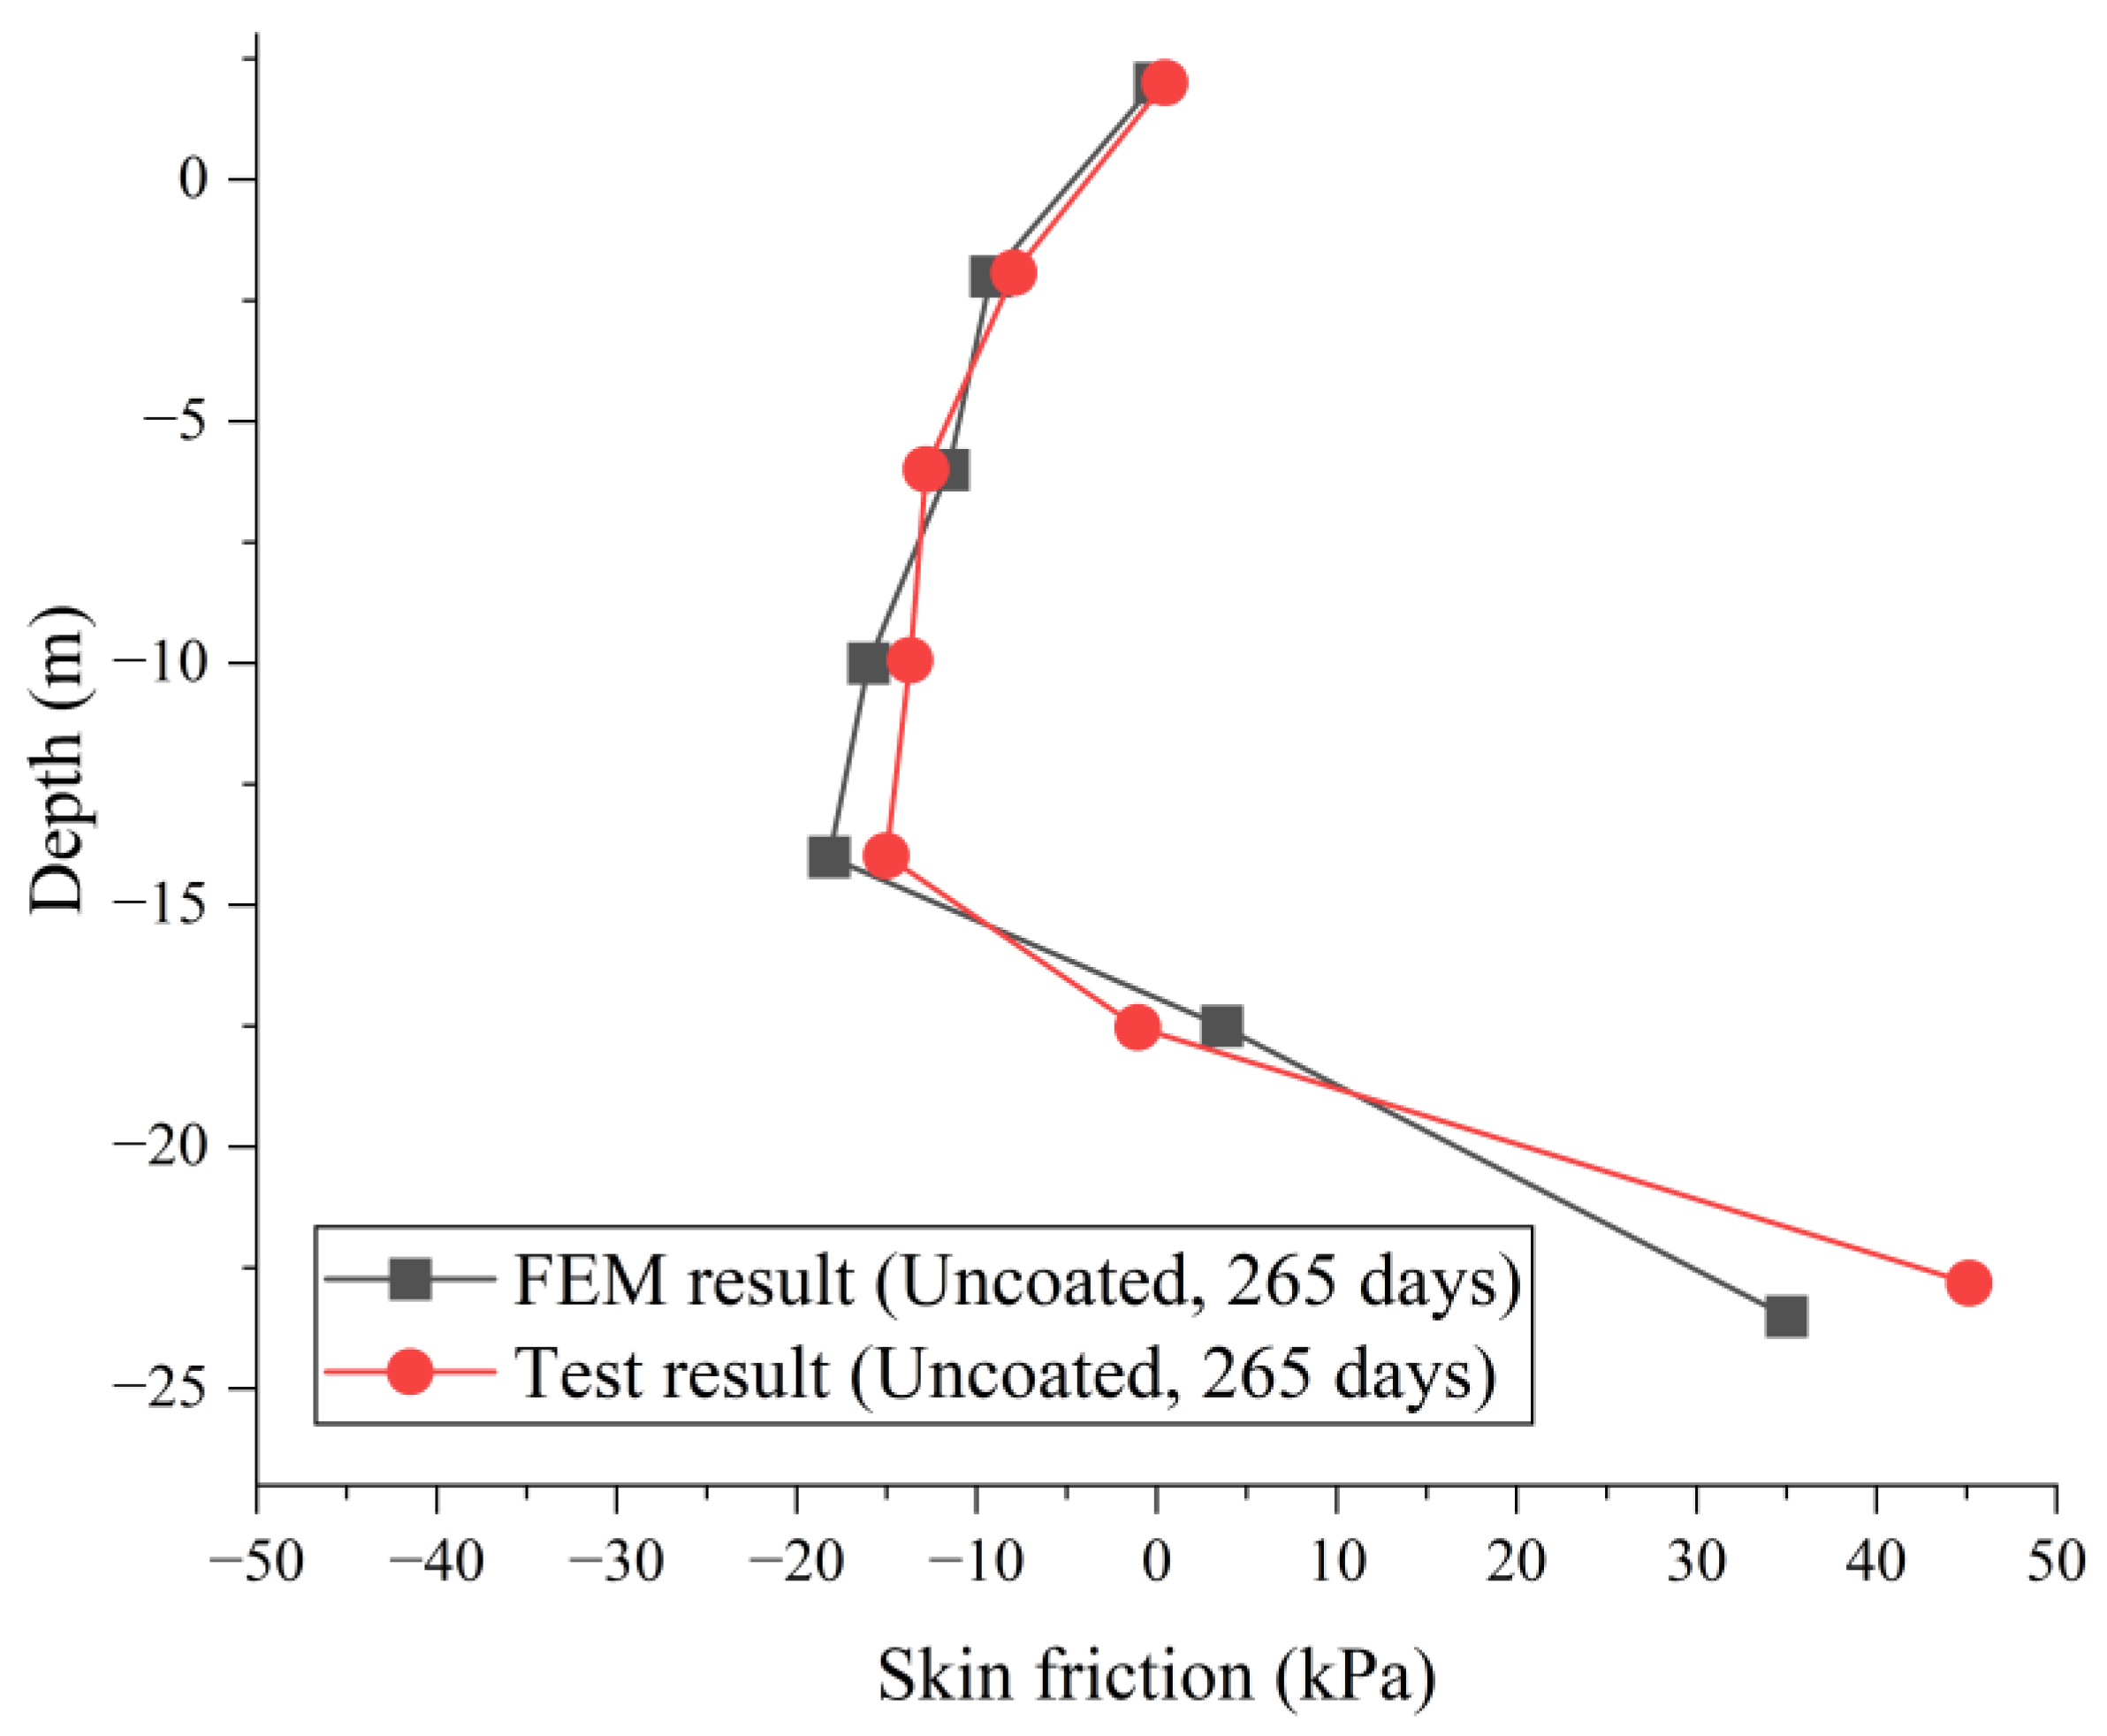
Figure 1. Verification results of negative skin friction.
Jmse 13 01530 g001
Figure 2. Verification results of horizontal load–displacement curves.
Jmse 13 01530 g002
Figure 3. Schematic diagram of the finite element model and mesh: (a) the finite element model; (b) the mesh.
Jmse 13 01530 g003
Figure 4. Time-dependent curves of soil vertical displacement under different surcharge loads.
Jmse 13 01530 g004
Figure 5. Distribution curve of pile skin friction.
Jmse 13 01530 g005
Figure 6. Contour of soil horizontal displacement.
Jmse 13 01530 g006
Figure 7. Distribution curve of axial force of pile shaft.
Jmse 13 01530 g007
Figure 8. Distribution of pile skin friction under different consolidation times.
Jmse 13 01530 g008
Figure 9. Distribution of axial force of pile shaft under different consolidation times.
Jmse 13 01530 g009
Figure 10. Distribution of pile skin friction under different pile head horizontal loads.
Jmse 13 01530 g010
Figure 11. Distribution of axial force of pile shaft under different pile head horizontal loads.
Jmse 13 01530 g011
Figure 12. Distribution of pile skin friction under different surcharge loads.
Jmse 13 01530 g012
Figure 13. Distribution of axial force of pile shaft under different surcharge loads.
Jmse 13 01530 g013
Table 1. The physical parameters of the soil and pile.
TypeThickness
(m)
Unit
(kN/m3)
E
(MPa)
Cohesion
(kPa)
Friction Angle
(°)
Permeability
Coefficient k (m/days)
Clay4016.410.410.232.55.5 × 10−4
Rock40241 × 10630040-
Pile-78.5210 × 10⁶---
Disclaimer/Publisher’s Note: The statements, opinions and data contained in all publications are solely those of the individual author(s) and contributor(s) and not of MDPI and/or the editor(s). MDPI and/or the editor(s) disclaim responsibility for any injury to people or property resulting from any ideas, methods, instructions or products referred to in the content.