Article

Field-Calibrated Nonlinear Finite Element Diagnosis of Localized Stern Damage from Tugboat Collision: A Measurement-Driven Forensic Approach

1
Department of Naval Architecture and Ocean Engineering, Chosun University, Gwangju 61452, Republic of Korea
2
Ship & Offshore Research Institute, Samsung Heavy Industries Co., Ltd., Geoje 53261, Republic of Korea
*
Author to whom correspondence should be addressed.
J. Mar. Sci. Eng. 2025, 13(8), 1523; https://doi.org/10.3390/jmse13081523
Submission received: 15 July 2025 / Revised: 30 July 2025 / Accepted: 5 August 2025 / Published: 8 August 2025
(This article belongs to the Special Issue Advanced Studies in Marine Mechanical and Naval Engineering)

Abstract

This study conducts a high-resolution forensic evaluation of stern structural damage resulting from a tugboat collision during berthing, integrating real-world measurement data with calibrated nonlinear finite element analysis. Based on field-acquired deformation geometry and residual dent profiles at Frame 76, five distinct collision scenarios varying in impact orientation, contact area, and load path were simulated using shell-based nonlinear plastic analysis. Particular attention is given to comparing the plastic equivalent strain (PEEQ), von-Mises stress fields, and residual deformation contours at Point A—the critical zone identified from damage surveys. Among the five cases, Case-2, defined by a vertically eccentric external impact, demonstrated the highest plastic strain intensity (PEEQ > 2.0%), the sharpest post-yield drops in stiffness, and the closest match to the residual dent profile observed in the actual structure. The integrated correlation between field damage and some of the results (strain, stress, and deformed shape) enabled clear identification of the most probable accident mechanism with engineering accuracy. This study proposes a validated, measurement-calibrated nonlinear finite element analysis framework to diagnose stern damage from tugboat collisions, enhancing repair decision-making and structural safety assessment. Such a calibrated forensic strategy enhances the reliability of structural safety predictions in marine collision incidents and supports eco-friendly rescue engineering by minimizing unnecessary structural renewal through precise damage localization. The proposed approach establishes a new benchmark for scenario-driven collision assessment, particularly relevant to sustainable, automation-compatible, and damage-tolerant ship design practices.

1. Introduction

The structural safety of large container vessels, especially around the stern region, is crucial due to frequent tugboat interactions and berthing maneuvers. Recent field observations have revealed plastic deformation and local buckling near the transom of certain vessels, which could compromise structural integrity if not properly assessed and rectified. These damages often stem from external impact loads whose origins and magnitudes are not easily identifiable post-incident. To address this challenge, this study proposes a systematic evaluation process using nonlinear finite element analysis (FEA) to simulate probable impact conditions and correlate them with the observed damage. Unlike conventional linear approaches, the nonlinear FEA incorporates material plasticity, geometric nonlinearity, and realistic constraints, enabling a more accurate reconstruction of damage mechanisms.
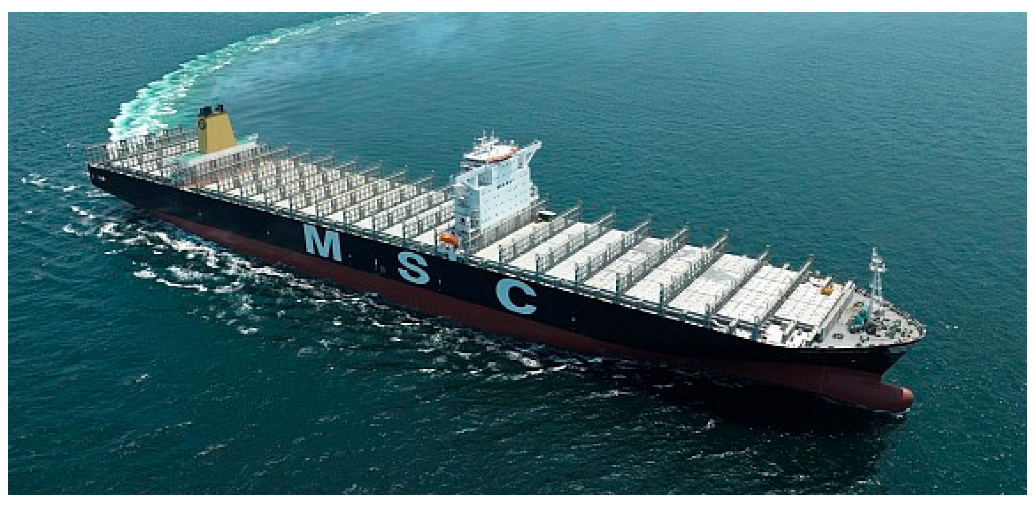
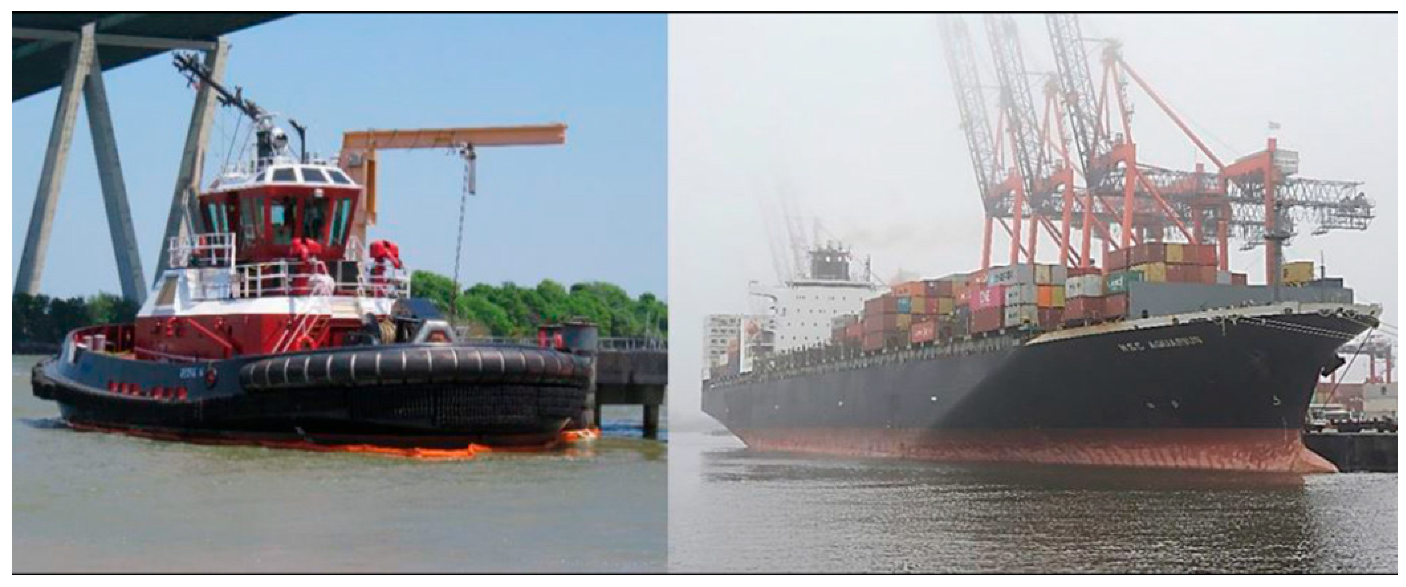
One relevant case highlighting the vulnerability of ship stern structures under external impact is the collision incident investigated by the U.S. National Transportation Safety Board (NTSB) [1] involving the tugboat George M and the containership MSC Aquarius near the Port of Houston in 2022 (see Figure 1). According to the NTSB findings, the tugboat unintentionally collided with the aft section of the containership during maneuvering operations, leading to significant structural deformation of both vessels. The stern plating and internal stiffeners of MSC Aquarius exhibited local plastic deformation due to the concentrated impact load.
The originality of this research lies in its integration of forensic engineering analysis with a repair-oriented assessment framework. By defining repair zones based on plastic strain thresholds obtained through simulation, the study not only reveals the root cause of the damage but also provides actionable insights for structural rehabilitation. The proposed methodology bridges the gap between numerical simulation and practical repair planning, contributing to a data-driven approach for ship maintenance in line with digital twin principles.
The primary causes identified include insufficient situational awareness, high approach speed of the tugboat, and ineffective communication between the piloting teams. This case emphasizes the critical need for structural resilience at the aft sections of large container vessels, especially during berthing or tug-assisted operations.
Figure 2 illustrates the container ship’s stern region during berthing operations supported by tugboats. The model emphasizes structural zones critical to impact resistance, particularly the transom, shell plating, and longitudinal stiffeners in the aft hull. These components are intrinsically vulnerable to damage when subjected to improperly positioned tugboat forces or uncontrolled collisions exacerbated by adverse weather (e.g., strong currents or high winds). The refined mesh in the stern region captures localized stress concentrations and plastic strain accumulation, enabling simulation of collision scenarios where tugboats exert eccentric or excessive loads at non-optimal locations. For instance, if a tugboat contacts the hull outside reinforced bracing points (e.g., near geometric discontinuities like propeller openings or rudder supports), stress can exceed the yield strength of AH36 steel (355 MPa), triggering permanent deformation or buckling. The model quantifies such risks by correlating impact energy with observed damage patterns, such as dent depth or stress hotspots (Section 2.2). The report underscores the importance of assessing localized plastic strain and potential buckling zones through advanced nonlinear analysis, supporting the rationale for this study’s numerical validation and forensic simulation of real-world damage scenarios. Previous studies related to this study are summarized below.
The Ship Structure Committee [2] presents a comprehensive framework for modeling longitudinal structural damage in ship–ship collisions using nonlinear finite element methods. The collision chapter specifically focuses on the development of a strain-based rupture criterion, incorporating failure strains obtained from coupon tests into a multi-level FEA strategy for simulating large-scale structural failures during ship collisions. The methodology emphasizes progressive collapse analysis, dynamic energy absorption, and global deformation patterns. A key contribution of the report is its effort to transition from empirical damage assessments toward physics-based failure prediction using strain-based criteria, enabling more consistent damage estimation for classification and safety evaluation. However, the study is limited by its emphasis on global hull deformation and rupture behavior, rather than localized structural failures typically observed in stern collisions or tugboat impacts. The damage modeling is primarily validated against idealized bulk carrier structures, and the boundary conditions reflect simplified assumptions that do not consider realistic constraints, such as inner longitudinal bulkheads, deck transitions, or the complex topology around the stern. Additionally, the report does not provide direct correlation with actual field damage or residual plastic strain measurements, which are essential for forensic evaluation and repair planning. In contrast, the present study extends this body of work by integrating real-world damage measurements, localized plastic strain evaluation, and load orientation sensitivity to backtrack actual collision scenarios. While the SSC report laid the theoretical groundwork for strain-based failure modeling, the current research enhances the practical applicability by refining the damage diagnosis at the component level, focusing on stern deformation caused by tugboat collision and validating the simulations with empirical post-damage inspection data.
Prabowo et al. [3] investigates the influence of collision parameters (vertical target point location and collision angle) on energy absorption and structural damage in ship collisions using finite element analysis. Validated against the 2014 Sunda Strait collision case, the study employs LS-DYNA R9 simulations with a deformable Ro-Ro passenger ship (struck) and a rigid reefer cargo ship (striking). Key findings reveal that the car deck exhibits the highest resistance to damage due to its structural role in supporting vehicles and resisting external loads, absorbing up to 16.5 MJ of energy at 60° impacts. Collision angles significantly affect damage patterns: perpendicular collisions (90°) generally require less energy (e.g., 6.6 MJ for the middle deck) than oblique angles (60° or 120°), except for the middle deck, where boundary conditions reverse this trend. The study also proposes a mesh-dependent failure strain model (based on the Germanischer Lloyd guidelines [4]) to improve fracture prediction accuracy. The research simplifies real-world complexity by modeling the striking ship as rigid, ignoring hydrodynamic effects (e.g., fluid-structure interaction), and omitting strain-rate sensitivity in materials. Validation relies solely on one historical case without physical experiments, limiting generalizability. The scope is restricted to side structures of a single ship type (Ro-Ro), leaving gaps for other vessels (e.g., tankers or LNG carriers). Boundary conditions artificially influence results (e.g., reversed energy trends in the middle deck), and critical factors like residual strength post-collision or corrosion-fatigue interactions are unaddressed.
Ko et al. [5] proposed a practical methodology for determining dynamic fracture strain for use in nonlinear finite element analysis (FEA) of ship–ship collision scenarios. The authors developed a strain-rate-dependent fracture criterion based on tensile coupon tests at varying strain rates and incorporated it into a large-scale LS-DYNA simulation to assess structural crashworthiness under different impact velocities. The main contribution lies in introducing a dynamic correction factor that adjusts the quasi-static fracture strain according to the actual strain rate during collision. This approach enables more realistic prediction of rupture onset and energy absorption in the FEA framework, especially for stiffened steel panels subjected to low- and high-speed impacts. However, the study primarily focuses on global fracture behavior and does not explicitly address localized plastic deformation zones or residual strain quantification after unloading. Moreover, while the authors validate their approach with selected experimental data, the simulation-to-measurement correlation remains limited to a few scenarios and lacks comprehensive geometric verification. The paper also does not consider the effect of structural boundary conditions or actual contact area configuration, which are essential in realistic tugboat or stern collision cases such as those studied in the current research. Therefore, while this study contributes meaningfully to the modeling of dynamic fracture behavior in FEA, its applicability to forensic evaluation of real-world plastic damage—particularly in localized, partially damaged ship regions—is limited. The present research expands upon these foundations by incorporating actual site measurements, true stress–strain material inputs, and direction-sensitive multi-case load analysis to more precisely reconstruct and interpret localized stern damage.
Rahman and Hoque [6] conducted nonlinear finite element analysis (using ABAQUS 2016) to compare the crashworthiness of X-braced and Z-braced tripod jacket structures under collisions with a 3300 ton supply vessel. The study simulated head-on collisions at three speeds (1–3 knots) targeting legs and braces, revealing that X-braced structures exhibit superior resilience. The findings highlight braces as the most vulnerable components and underscore X-bracing as a safer design for offshore wind turbines (OWTs) in high-collision-risk zones. The study simplifies real-world complexity by ignoring environmental loads (waves, wind, soil-structure interaction) and modeling the vessel as a rigid body, thereby omitting damage analysis on the supply vessel. Critical dynamics such as the turbine shaft’s influence or residual strength assessment post-collision were not evaluated. The scope excludes probabilistic risk factors (e.g., vessel traffic density) and lacks validation against physical experiments, relying solely on numerical results. Future work should integrate multi-hazard scenarios (e.g., corrosion–fatigue) and full-scale testing to enhance practical relevance.
Zhang et al. [7] presents a nonlinear finite element approach to assess the structural integrity of FPSO side walls under vessel collision scenarios. The core contribution of the paper lies in its simulation-based evaluation of local structural damage and energy absorption behavior using LS-DYNA. By applying dynamic impact scenarios to the side shell structures, the authors identify vulnerable regions and investigate the sequence of plastic deformation and progressive collapse. The originality of the research is found in its focus on capturing detailed structural responses under various impact conditions, which enhances the understanding of collision-induced failure mechanisms in offshore structures. However, the paper has some limitations. It lacks validation against experimental data or real-world accident cases, which reduces the practical verification of the presented simulation results. Furthermore, the study does not provide a framework for post-collision evaluation such as residual strength assessment or repair recommendations areas that are increasingly important for operational decision-making and lifecycle management of marine structures. Despite these limitations, the paper offers a valuable reference for applying nonlinear dynamic analysis techniques to maritime collision problems.
Liu and Soares [8] presents an integrated experimental and numerical investigation into the structural behavior of ship side structures subjected to low-velocity impact loads. The core contribution of the paper lies in its dual-method approach, combining physical impact testing on stiffened plate panels with validated nonlinear finite element analysis using ABAQUS. This methodology allows for a comparative assessment of local plastic deformation and buckling behavior under controlled impact energies, thereby contributing to the understanding of damage mechanisms in ship structures under minor collision scenarios. The originality of the work stems from its emphasis on realistic impact simulation and detailed experimental measurement techniques, including the use of strain gauges and digital image correlation to monitor deformation. The study also effectively demonstrates the correlation between impact energy levels and the extent of localized structural damage. However, despite these strengths, the research has certain limitations. It primarily addresses small-scale structural elements and low-energy impact conditions, which restricts its applicability to full-scale collision events or higher-energy impact scenarios typical of operational maritime incidents. Furthermore, the study does not extend its findings to propose repair strategies or structural health monitoring methods, and it lacks integration with real-time sensing or digital twin frameworks that are increasingly relevant in current maritime engineering practices.
Nguyen et al. [9] develops a validated numerical simulation framework using ABAQUS to assess the residual ultimate strength of container ships struck by falling containers. The methodology integrates strain-rate-sensitive material models and fracture criteria, showing high reliability (9% average error vs. experiments). Parametric studies reveal that drop height (5~35 m) and impact angle (0°~45° or corner impacts) critically degrade structural strength. Under hogging conditions, strength reduction peaks at 28.4% (35 m drop); under sagging, losses exceed 30% due to damaged tension-critical bottom structures. Corner impacts cause the most severe damage (26~31% strength loss) and plate fracture. Crucially, drops >25 m or corner hits exceed IMO’s 20% safety threshold, necessitating repairs. Key simplifications limit real-world applicability: rigid-container assumptions (ignoring deformation energy), exclusion of hydrodynamics, and single-ship-type analysis. The model overlooks global hull–girder behavior, corrosion/fatigue in damaged zones, and higher strain rates (>150/s). Validation relied on simplified box girders, not actual ship geometries.
Cerik and Choung [10] investigate the fracture behavior of steel-plated marine structures subjected to low-velocity impact loads by integrating experimental testing and finite element analysis (FEA). The authors performed quasi-static and dynamic impact tests on AH36 steel plates and derived a strain-rate-dependent fracture model based on the Johnson–Cook failure criterion. The numerical simulations were validated against test results, particularly focusing on fracture initiation and propagation behavior under various loading speeds. One of the main contributions of this study is the demonstration that a calibrated strain-rate-sensitive damage model can reasonably predict failure onset and crack development in steel structures, enhancing the reliability of FEA for impact scenarios. However, despite the robust material calibration, the study has limitations in terms of real-world structural context. The specimens analyzed were flat steel plates, which lack the complex geometric features and boundary constraints typical of actual ship structures. As a result, stress redistributions caused by stiffeners, welds, and multi-axial loading paths which are critical in real marine collision events were not adequately addressed. Additionally, the study focuses on crack propagation, but does not provide a detailed discussion of residual deformation or plastic strain accumulation, which are vital for structural repair assessment and forensic reconstruction. In comparison, the present research advances the topic by considering an actual deformed stern structure with measured plastic deformation, employing true stress–strain data, and analyzing multiple eccentric load cases to determine the most likely collision condition. While the prior study provides valuable insights into material failure modeling, it lacks the structural realism and contextual interpretation offered by the methodology developed in the current work.
Zhao et al. [11] presents a milestone advancement in the application of deep learning in SHM and digital twin systems, offering both academic and practical value. Its originality lies in enabling real-time, full-field structural response analysis using data-driven surrogates and efficient visualization pipelines. However, further development is needed to improve generalization under extreme conditions, incorporate geometric sensitivity, and broaden its applicability to other structural behaviors. This paper can serve as a cornerstone reference in your own study, especially if you are exploring real-time digital twin frameworks, deep learning-based surrogate modeling, or SHM systems for large-scale infrastructure.
The structural safety evaluation of ships subjected to tugboat collisions has been a subject of sustained interest, and numerous studies have examined this issue from different modeling perspectives. For the purpose of clear synthesis, the existing literature is categorized and discussed in terms of their modeling focus: (1) global structural response vs. local structural damage, and (2) numerical simulation vs. experimental validation.

1.1. Global Structural Response Models

Studies focusing on global-scale structural behavior typically analyze the overall motion, force transmission, and energy dissipation characteristics of ship structures under collision events. In this context, Emami Azadi [12] evaluated the dynamic behavior of a ship under berthing impact by using simplified global dynamic models. Similarly, Minorsky [13] conducted foundational work on the energy absorption of ship structures, which continues to inform modern global response estimations. More recently, Ko et al. [5] used nonlinear dynamic analysis to investigate global collision effects on FPSOs, highlighting the importance of understanding large-scale structural behavior and overall deformation propagation under impact conditions.
These studies provide essential insights into how forces are transmitted across the hull but often lack resolution in assessing local damage or structural failure modes at the point of contact.

1.2. Local Structural Damage Models

In contrast, local-scale modeling emphasizes the detailed failure mechanisms—such as yielding, buckling, and tearing—of structural components at the collision interface. For example, Amdahl and Kavlie [14] performed detailed local finite element (FE) analysis to simulate structural damage to ship side shells subjected to bow collisions. Their results demonstrated the influence of stiffener layout and material strain-hardening on plastic deformation. Zhang et al. [15] further expanded this perspective by performing refined mesh-based FE simulations on bulk carrier side structures, capturing local fracture behavior under low-velocity impacts. Such studies enable accurate prediction of stress concentration, local collapse modes, and strain localization, which are critical for evaluating damage severity and repair needs.
However, local modeling approaches are typically limited to simplified geometries or idealized loading scenarios and may not capture the interaction between global structural flexibility and local failure mechanisms.

1.3. Numerical vs. Experimental Approaches

On the numerical side, most studies employ finite element simulations using nonlinear explicit dynamic solvers such as LS-DYNA or ABAQUS/Explicit. Chen et al. [16] examined the crushing of ship hull elements using advanced material models, while Cerik and Choung [10] validated collision energy absorption using strain-rate-sensitive material laws in FE analysis. Meanwhile, experimental studies remain limited due to the logistical difficulty and scale of testing. Nevertheless, Paik et al. [17] conducted small-scale collision experiments that provide benchmark data for validating FE models. Similarly, Zhao et al. [18] combined scaled-down impact tests with numerical correlation to explore hybrid hull structures.
While numerical studies offer flexibility and depth in parametric exploration, experimental efforts are crucial for model validation and ensuring realistic failure behavior.

1.4. Summary of Gaps and Research Positioning

From the reviewed literature, it is evident that most existing studies are either focused on global dynamic interaction without resolving local failure modes or on detailed local failure mechanisms without capturing the broader structural context. Moreover, a hybrid approach that integrates global-local interaction using refined FE simulations validated against real-world collision cases remains underexplored. In this regard, the present study aims to bridge this gap by developing a high-fidelity finite element model that captures both local structural damage at the collision interface and its interaction with the global structural response of the vessel. By conducting scenario-based simulations on tugboat collisions and systematically analyzing stress, strain, and deformation metrics at critical regions, this study provides new insights into vulnerable zones, damage tolerance, and design optimization under realistic collision conditions.

2. Damage Observation and Failure Mode Classification

2.1. Main Components

The primary subject of this study is a modern 7300 TEU-class container vessel, representative of mid-capacity Post-Panamax designs optimized for global trade routes. The vessel’s key structural and operational characteristics, summarized in Table 1, are derived from industry-standard technical documentation and validated against comparable vessels in active service.
As illustrated in Figure 3, the vessel features a conventional container ship profile with a raked bow, pronounced bulbous bow, and transom stern—design elements aimed at hydrodynamic efficiency and cargo volume maximization. The hull form adheres to double-skin construction standards, enhancing structural integrity and environmental safety. Container stowage is organized across eight cargo bays with cell guides, supporting a typical 17-row on-deck and 9-tier below-deck stowage configuration.
Table 1 indicates a length between perpendiculars (LBP) of 286 m, with an overall length (LOA) typically exceeding 299 m when accounting for bow and stern overhangs. Its 40.0 m molded breadth aligns with the “New Panamax” classification, enabling transit through the expanded Panama Canal locks. The molded depth of 22.0 m accommodates nine container tiers below deck, while the design draft of 12.5 m (with a scantling draft of ~14.5 m) ensures operational flexibility across global port infrastructures. With a gross tonnage (GT) of 92,000 tons and deadweight tonnage (DWT) of 88,000 tons, the vessel demonstrates a high cargo-to-total mass ratio. The 4000-ton differential between GT and DWT reflects the significant contribution of the vessel’s lightweight (hull, machinery, and permanent ballast) to its overall displacement. Power is supplied by a single slow-speed two-stroke diesel engine delivering 54,000 kW (72,400 hp) at Maximum Continuous Rating (MCR). This substantial power reserve enables a service speed of 24 knots at design draft conditions, balancing schedule reliability with fuel efficiency. The propulsion system includes a fixed-pitch propeller optimized for this speed range, coupled with a high-efficiency rudder configuration visible in Figure 3.

2.2. Methodology: Field-Calibrated Nonlinear Diagnostic Framework

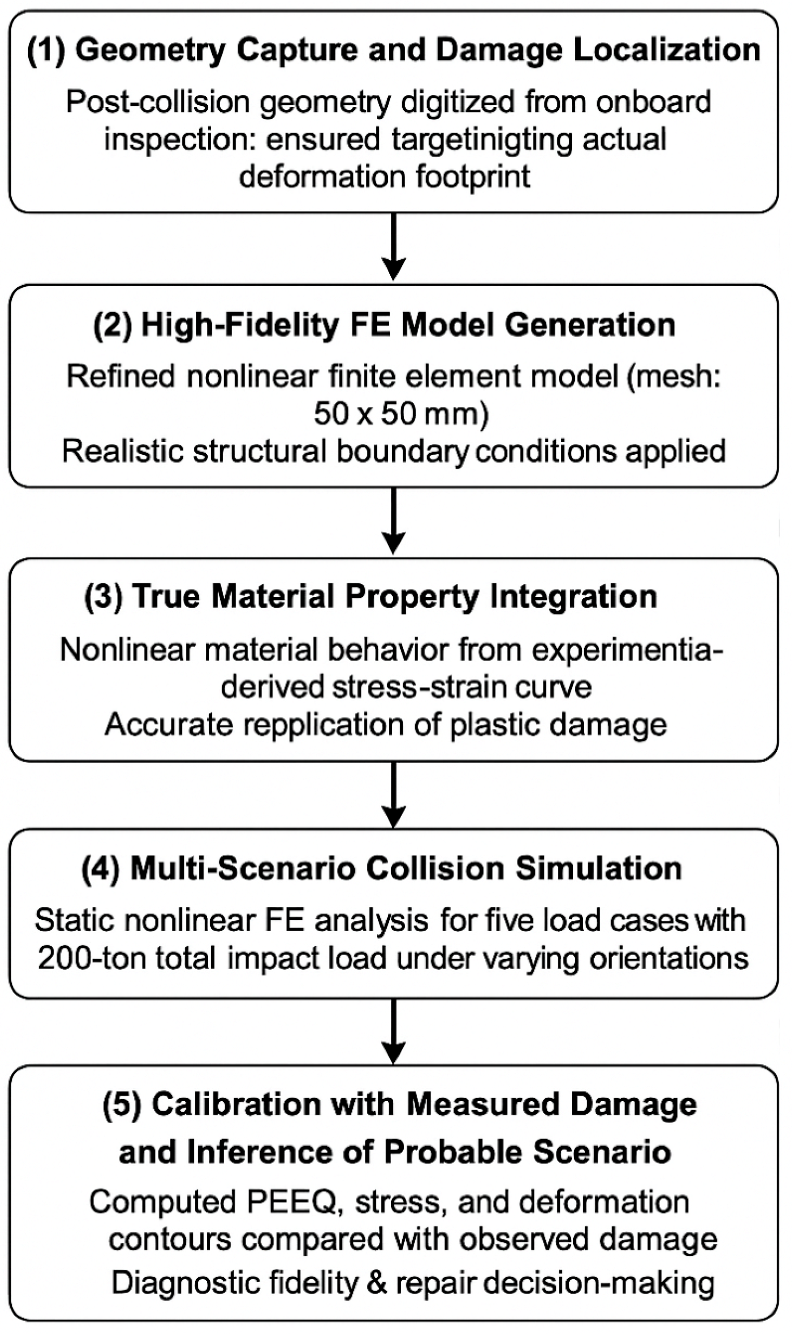
The methodology adopted in this study follows a systematic, measurement-driven workflow integrating real-world damage data with multi-scenario nonlinear finite element analysis (FEA). The proposed diagnostic framework referred to as the Field-Calibrated Geometry–Plastic Strain–True Stress (GPT) method comprises the following five key stages as shown Figure 4.
(1) Geometry Capture and Damage Localization: The post-collision geometry of the stern structure was surveyed through onboard inspection and precise dimensional measurement. The deformed profile at Frame 76, including dent depth, buckling contours, and stiffener distortions, was digitized to serve as a reference for model validation. This field-based data ensures that the numerical model targets the actual deformation footprint.
(2) High-Fidelity FE Model Generation: A refined nonlinear finite element model of the stern panel was developed using shell elements. The mesh resolution was increased near geometric discontinuities (50 × 50 mm) to capture localized strain fields. Boundary conditions were implemented to replicate structural fixity at the deck, bulkhead, and longitudinal girders, in accordance with DNVGL-CG-0127 [19] guidelines.
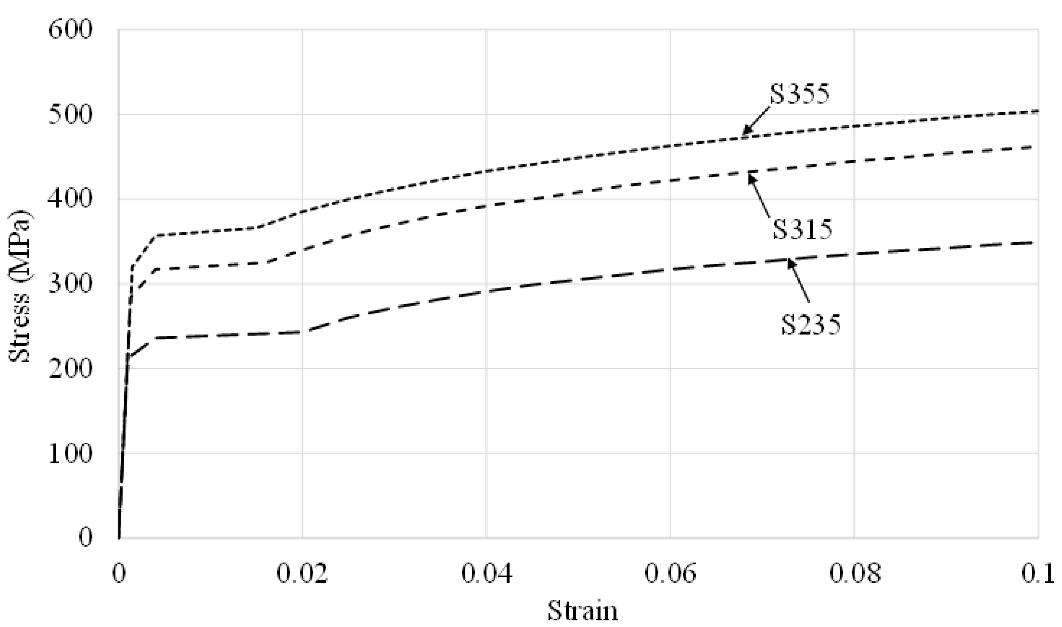
(3) True Material Property Integration: The nonlinear material behavior was incorporated using experimentally derived true stress–strain curves (per DNV-RP-C208 [20]) for shipbuilding-grade steels (S235, S315, S355). This accounts for elasto-plasticity, strain hardening, and post-yield response essential for simulating plastic damage. These curves replace simplified bilinear models, enabling accurate replication of irreversible deformation.
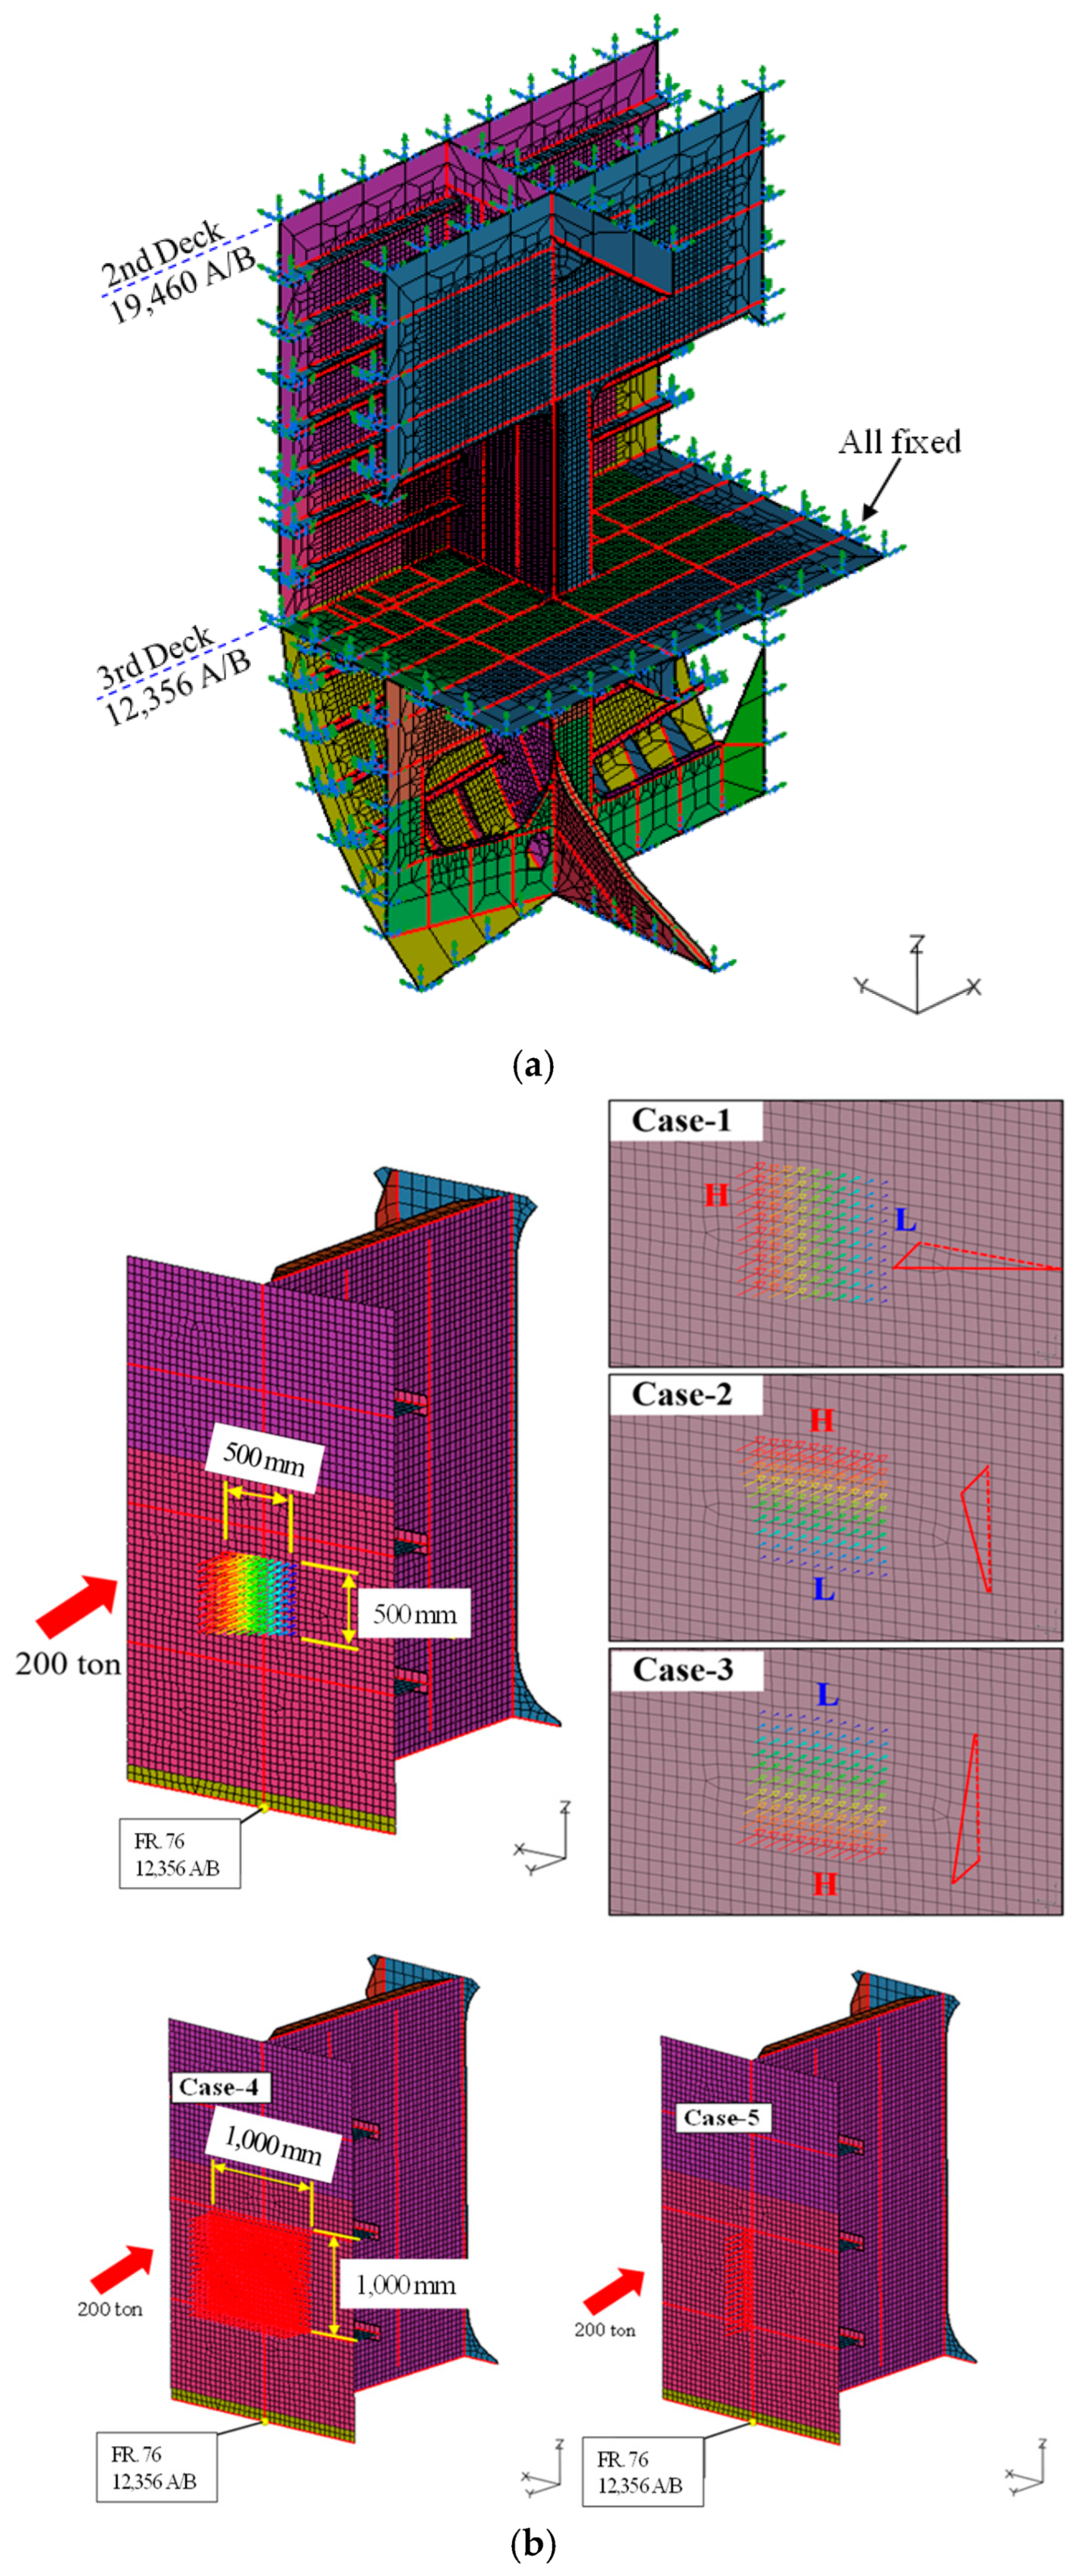
(4) Multi-Scenario Collision Simulation: Five different loading cases were constructed to reflect possible tugboat collision angles, load magnitudes, and eccentricities. All scenarios applied a total impact load of 200 tons but varied the orientation and contact distribution (e.g., vertical bias in Case-2, uniform blunt load in Case-4, internal overload in Case-5). Each scenario underwent static nonlinear analysis simulating loading–unloading cycles to capture residual deformations.
(5) Calibration with Measured Damage and Inference of Probable Scenario: The computed plastic strain (PEEQ), von-Mises stress, and deformation contours from each case were compared against the field-measured damage at Point A. The scenario with the closest match in residual displacement and strain field was selected as the most probable collision event (Case-2). This data correlation confirms diagnostic fidelity and supports repair decision-making using a strain-based renewal threshold (PEEQ ≥ 1.0%).
This GPT method establishes a rigorous forensic evaluation route that connects numerical simulation to physical reality, enhancing the credibility of post-collision damage interpretation and enabling downstream integration with structural health monitoring (SHM) and digital twin systems.
Although hydrodynamic effects such as transient wave pressure, tugboat–hull fluid interaction, and slamming forces can influence the structural response during high-speed or offshore collisions, these phenomena were intentionally excluded from the present analysis based on the following rationale:
-
Collision Nature and Speed: The observed damage corresponds to a low-speed berthing or harbor-side contact event, where the collision is characterized by a gradual load transfer with limited hydrodynamic impulse. Under such quasi-static conditions, the dominant damage mechanism is governed by plastic deformation due to direct contact rather than hydrodynamic inertia or wave-induced amplification.
-
Empirical Correlation with Damage: Field measurements of residual deformation and strain profiles exhibit close alignment with the results of static nonlinear analysis. In particular, Case-2 shows less than 3.5% deviation from the actual dent geometry, indicating that the essential structural response is captured even without accounting for water-structure interactions.
-
Conservative Design Perspective: The use of quasi-static loading assumptions inherently leads to conservative estimations of plastic strain and damage extent. In dynamic analyses, some kinetic energy is dissipated through fluid acceleration or radiation damping, often resulting in slightly lower peak strains. Thus, the simplified static approach provides a safe-side prediction suitable for post-event damage diagnostics.
-
Scope and Focus of the Study: The primary objective of this study is to establish a field-calibrated forensic methodology that back-calculates plausible collision scenarios based on residual structural deformation. Including full hydrodynamic modeling—such as fluid–structure interaction via LS-DYNA or coupled CFD-FEA methods—would significantly increase computational complexity without proportionate gain in diagnostic clarity for the specific damage event under investigation.
-
Future Integration Potential: While not implemented in this study, the simulation framework is compatible with dynamic or explicit analysis modules (e.g., LS-DYNA) and can be expanded in future work to address high-energy collisions or offshore operations involving wave impact and slamming. The modularity of the model allows for seamless refinement if such factors are deemed necessary in future applications.

2.3. Material Parameter Sensitivity and Justification

The current analysis adopts experimentally validated true stress–strain curves for AH36 and S355 steel, based on industry-recognized sources (e.g., DNV-RP-C208 [20]), assuming room temperature conditions and base material properties. While it is acknowledged that mechanical properties such as yield strength, strain hardening rate, and ductility can vary due to manufacturing processes, temperature gradients, or welding-induced microstructural changes, their exclusion from a detailed parametric study in this work was a deliberate modeling simplification for several defensible reasons.
First, the primary objective of this study is forensic diagnosis based on observed residual deformations, rather than performance prediction under varying environmental or fabrication conditions. Within the expected operational temperature range for harbor-based collisions, the thermal sensitivity of high-strength shipbuilding steels such as AH36 is relatively modest—especially when strain rates are low and thermal softening is not prominent. Literature reports (e.g., Paik et al. [17]) suggest that mechanical property variations due to temperature in the range of 0 °C to 40 °C typically result in less than 10% change in yield strength or flow stress for AH36 and S355 steels, which is within the error margin of practical large-scale structural deformation assessments.
Second, the residual deformation measured in this study correlates strongly with the simulation results using nominal material curves, suggesting that the governing damage mechanism—localized plasticity due to concentrated external force—dominates over second-order material variation effects. Given that the validation error between field data and simulated deformations is already within 3.5%, introducing variations in strain hardening behavior or thermal sensitivity would offer limited improvement in diagnostic precision while significantly increasing computational cost and model complexity.
Finally, the simulation framework presented herein is modular and can incorporate material uncertainty or degradation models in future work. This includes applying stochastic material property distributions, temperature-dependent constitutive laws, or weld-zone heterogeneity. In practical applications, such sensitivity analyses are crucial, especially for probabilistic risk assessments or life-cycle fatigue modeling. However, for the scope of this forensic reconstruction study, the use of standardized material parameters provides a reasonable and conservative basis without undermining the validity of the primary conclusions.

2.4. Damage Patterns

The aft-end structure of large container vessels is inherently susceptible to damage due to its frequent interaction with tugboats during berthing operations and restricted maneuvering zones. In particular, the transom region and adjacent internal framing are prone to concentrated impact forces, often resulting in plastic deformation and localized failure.
Given the complex interplay of hull geometry, loading eccentricity, and boundary constraints, identifying and characterizing the damage patterns is essential for understanding the underlying failure mechanisms. This section presents a systematic classification of observed failure modes, based on field data collected from actual collision events. The insights gained from these damage patterns form the foundation for developing realistic finite element models and validating the numerical simulations aimed at reconstructing the physical failure behavior.
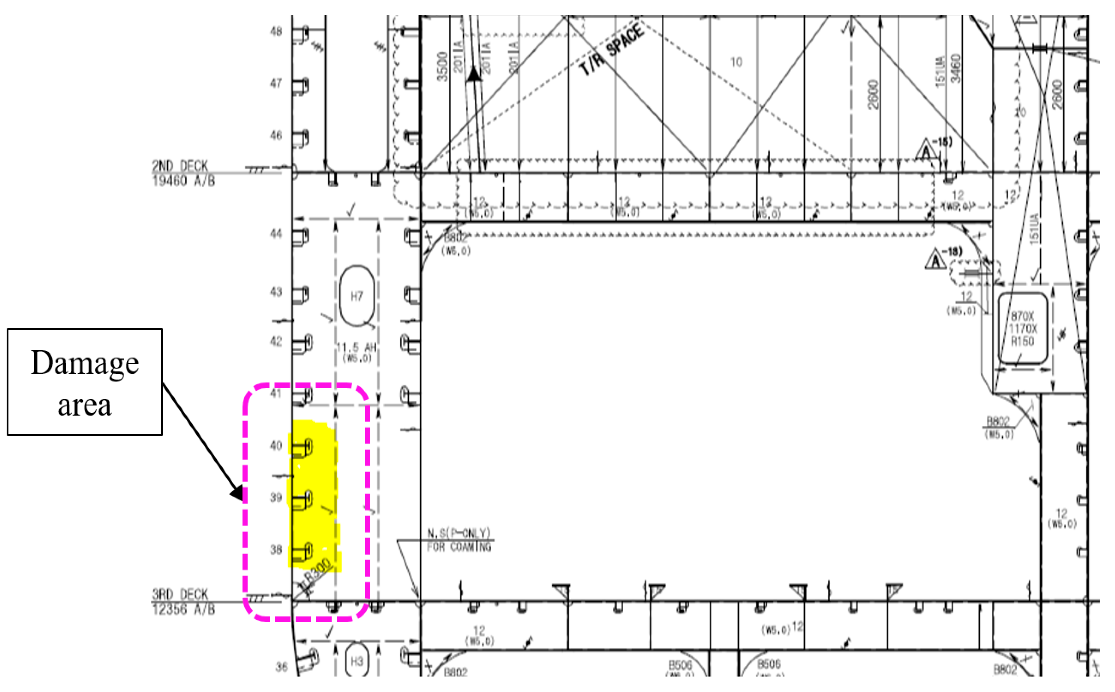
Figure 5 presents a detailed structural drawing of the stern region, highlighting the specific location and extent of the damage area subjected to collision-induced loading. The drawing delineates the geometry of the transom and surrounding shell plating, including the arrangement of internal stiffeners and web frames near the point of impact. This schematic serves as a reference for correlating observed damage patterns with structural components and facilitates the mapping of stress concentration zones during finite element simulations. The annotated region corresponds to Frame 76, specifically around the third deck (12,356 A/B), which is critical due to its proximity to propeller openings and rudder supports areas known to possess geometric discontinuities that amplify stress during eccentric tugboat impacts.
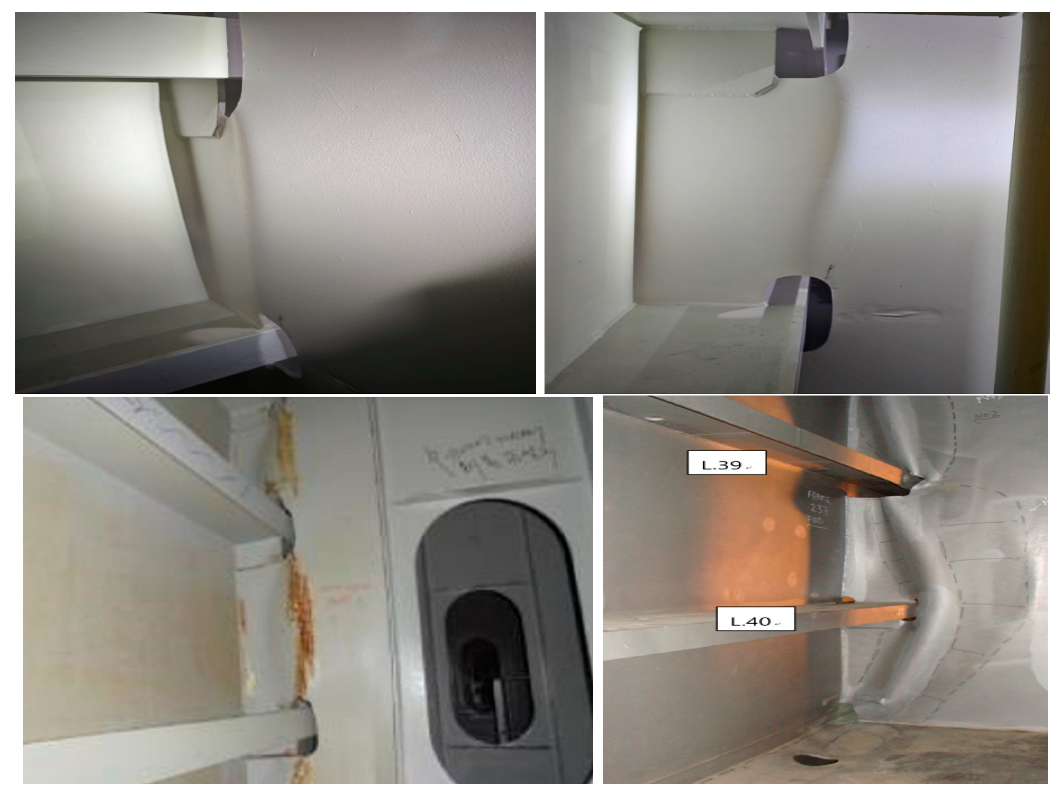
Figure 6 illustrates representative cases of plastic deformation observed in the inner web plate structures, based on field inspection of actual damage from tugboat collisions. The deformation patterns include buckling and denting phenomena concentrated around connection nodes between longitudinal stiffeners and web plates. These deformations indicate that the applied loads exceeded the local yield limit of the AH36 steel material, which is consistent with plastic strains surpassing 0.2%. The figure provides photographic and schematic evidence of three main failure mechanisms:
(1) Local buckling of shell plating—visible as wavy distortions
(2) Permanent plastic deformation—exhibited through deep dents and dished plating zones, often over 50 mm in depth
(3) Stiffener tripping or fracture—initiated at weld joints or near abrupt geometry changes under lateral and eccentric loads.

3. FE Analysis and Results

3.1. Material Modeling

Accurate material modeling is essential for simulating the nonlinear structural response of ship hull components subjected to localized impact loads. In this study, the material behavior of structural members was modeled using elasto-plastic constitutive laws to capture both elastic deformation and irreversible plastic flow under high stress concentrations. The selected material properties reflect typical shipbuilding steel grades used in the aft-end structure, specifically S355, which is known for its high yield strength and ductility, which are suitable for marine applications.
Table 2 summarizes the key mechanical properties adopted for the linear elastic regime of the finite element analysis. The material exhibits a Young modulus of 206,000 MPa and a Poisson’s ratio of 0.3, which are standard for carbon-manganese shipbuilding steels. The initial yield strength is defined ranged from 235 to 355 MPa, which establishes the threshold for plastic deformation under monotonic loading.
To accurately simulate the post-yield behavior, Figure 7 illustrates the true stress–strain relationships of three kind of shipbuilding steel used in the nonlinear finite element analysis, as derived from DNV-RP-C208 [20]. These curves are essential in capturing the progressive elasto-plastic behavior of materials under high-stress conditions such as collision or impact loading. Initially, the material exhibits a linear elastic response characterized by a constant Young’s modulus, up to the yield strength (355 MPa for AH36 steel). Beyond this point, the curve transitions into a nonlinear regime indicating plastic deformation accompanied by strain hardening. The increasing slope in the plastic region signifies the material’s ability to withstand additional load while undergoing irreversible deformation, which is critical for accurately simulating dent formation and plastic strain localization in marine structural components. Unlike idealized bilinear models, the use of these experimentally derived stress–strain curves allow for a more realistic representation of material response, including the gradual reduction in stiffness as plastic strain accumulates. In the context of nonlinear analysis, these curves were implemented to model the post-yield behavior of the stern structure under varying impact scenarios. By incorporating material nonlinearity, the analysis effectively captured residual deformations and plastic zones observed in the field, enabling back-calculation of collision conditions. This approach aligns with the recommendations of DNV-RP-C208 [20] for structural capacity evaluation through nonlinear finite element methods, ensuring that material hardening effects and ductility limits are properly considered in the damage assessment process.

3.2. FE Modeling

The finite element analysis in this study was conducted using the MSC NASTRAN solver [21], a well-established tool for nonlinear structural analysis widely used in shipbuilding and offshore structural assessments. The simulation employed nonlinear static analysis procedures incorporating large deformation theory and elasto-plastic material behavior with isotropic hardening. The FE-model (Figure 8) was developed using a 2D shell elements to capture the local buckling as well as plastic dent of the stern structure under impact condition. The finite element model developed to simulate the localized structural response of the stern region under tugboat-induced impact loading. The model consists of 31,126 nodes and 31,351 shell elements, ensuring adequate resolution of both global deformation and local plasticity. This modeling approach aligns with DNVGL-CG-0127 [19] guidelines, ensuring accurate representation of primary and secondary structural members. The element size was maintained between 50 mm and 100 mm in the collision-critical regions near Frame 76, with local refinement around stiffener terminations and contact zones. Although a formal mesh sensitivity analysis was not performed in this study, the chosen mesh density aligns with the recommended practices provided by DNV-RP-C208 [20] and ISO 19902 [22], which specify effective mesh sizes in the range of 50~100 mm for accurate assessment of local plastic strain and structural collapse in ship-side collision simulations. This targeted mesh refinement was essential to accurately capture plastic strain gradients and stress concentration effects near structural discontinuities such as stiffener junctions and web plate intersections. This model specifically represents a structure identified as FR.76, with the figure caption noting its association with the “3rd Deck 12,356 A/B” location.
Given the focus of this study on reconstructing actual observed deformation profiles from a field incident—rather than conducting a parametric design optimization—the use of a standard-compliant mesh resolution was deemed appropriate and sufficient to capture the primary deformation mechanisms with engineering-level fidelity. Future work may explore localized mesh convergence or adaptive meshing techniques, particularly in contexts involving rupture, tearing, or fracture localization.

3.3. Boundary and Load Conditions

To ensure a realistic simulation of the structural response under impact, appropriate boundary constraints and loading conditions were carefully defined in alignment with typical collision scenarios involving tugboats. The boundary conditions were established to replicate the fixed support characteristics of the hull girder, particularly in the longitudinal and transverse directions near the engine room and deck structure, thereby restricting excessive rigid body motion and ensuring localized deformation.
As illustrated in Figure 9, the boundary condition (Figure 9a) was applied to simulate the structural continuity of the hull. Key nodal points along the upper deck and inner longitudinal bulkheads were constrained in all translational degrees of freedom, representing structural fixity at the boundaries of the modeled region. This approach reflects the structural restraint typically provided by adjacent hull structures and ensures accurate representation of load transfer paths during impact events. The applied load condition (Figure 9b) was developed to reflect the concentrated force exerted by the bow of a tugboat during a stern collision. The five loading scenarios considered in this study were formulated based on representative contact geometries, force directions, and eccentricities typically encountered in tugboat-assisted berthing and maneuvering operations. While statistical databases such as those from the National Transportation Safety Board (NTSB) and classification societies (e.g., Lloyd’s Register, DNV) do not always provide quantitative distributions of contact angles or localized force vectors for tugboat collisions, several recurring patterns have been documented in accident investigations, safety audits, and ship-operator reports. Specifically, tug-induced damage to the aft hull—particularly around stern frames and steering gear housing—is known to result from angular push-offs, misaligned berthing thrusts, and delayed reverse maneuvers in congested harbor settings. The five cases analyzed in this study were selected to represent a broad yet practical envelope of loading conditions, encompassing variations in vertical vs. horizontal load components, contact positions (frame-centered vs. eccentric), and directional asymmetry. This ensures coverage of both worst-case and commonly observed collision configurations, even in the absence of formally codified frequency statistics. The loading magnitudes and application zones reflect engineering judgment informed by prior collision analyses, pilot maneuvering practices, and known vulnerabilities in hull-girder interaction during low-speed impacts.
Thus, although the case selection was not directly extracted from a probabilistic distribution, it was deliberately constructed to balance analytical coverage, physical realism, and relevance to practical forensic diagnosis. Future extensions of this framework may include data-driven scenario generation once a sufficiently granular statistical collision dataset becomes available.
Recognizing that the typical contact area between the tug’s bow and the container ship’s stern structure spans approximately 500 mm, the impact load was distributed over this region to simulate realistic pressure application. The total impact force was conservatively set to 200 tons, representing a plausible upper limit based on vessel displacement and impact velocity. Building on the original three impact cases, two additional loading cases (Case-4 and Case-5) were introduced, bringing the total to five scenarios. These new cases were implemented to further investigate the influence of collision magnitude and impact pattern variability on structural deformation and residual strain distribution. Each load case maintains a total impact force of 200 tons, decomposed into different combinations of horizontal, vertical, and oblique components to replicate diverse contact angles and eccentricities typical of real-world tugboat interactions. This comprehensive load modeling enhances the robustness of the forensic analysis by enabling a parametric evaluation of structural sensitivity to impact orientation, and supports more accurate correlation with observed damage patterns.

3.4. Actual Measurement at Damaged Area

A critical aspect of validating the numerical simulation and assessing structural integrity involves comparing the computed deformation outcomes with actual measurements from the damaged vessel. Field inspection teams conducted detailed dimensional assessments of the deformed region, focusing on quantifying plastic strain, dent depth, and geometric distortion in the stern structure. These measurements provide empirical benchmarks essential for calibrating the finite element analysis and understanding the extent of structural degradation following the impact event.
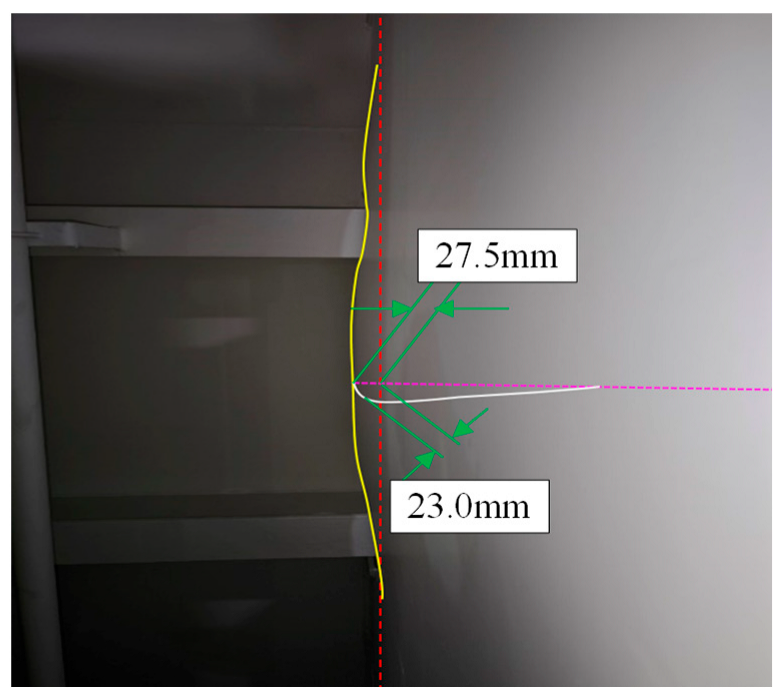
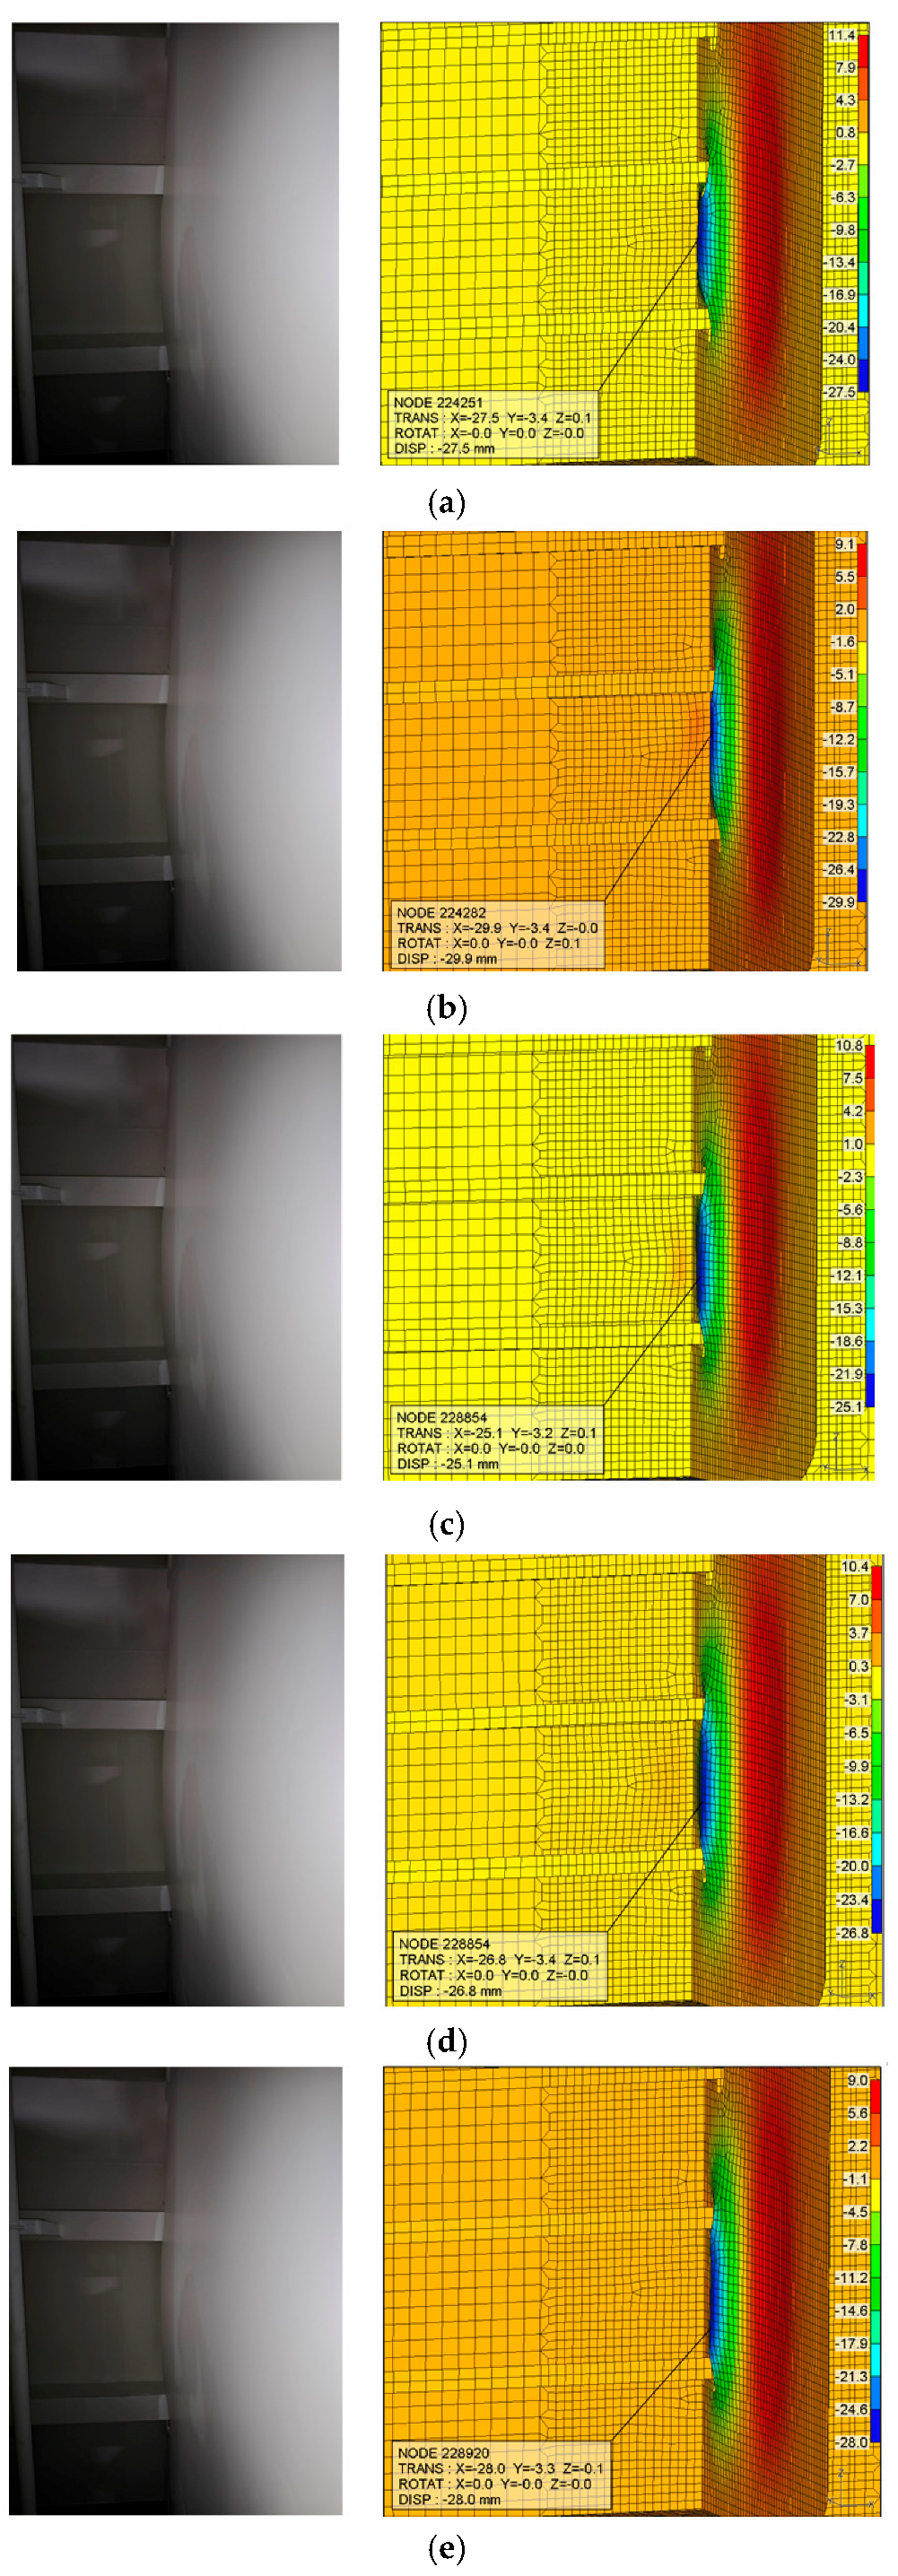
Figure 10 presents the plastic deformation profile measured in the critical area of the aft-end structure, which includes the most severely affected web plate and surrounding shell plating near Frame 76. The data reflects the localized plastic indentation observed after the collision, with displacement magnitudes and surface deflection patterns captured by onboard maintenance personnel using calibrated measuring tools. The affected area aligns closely with the expected contact zone of a tugboat bow, consistent with the assumed impact footprint of approximately 500 mm. This empirical measurement serves as a foundation for back-analyzing the impact event, allowing inference of likely collision force directions, energy magnitudes, and damage initiation points. In this study, the measured deformations are not only used to verify the numerical model but also play a pivotal role in evaluating the residual structural capacity of the affected region. By correlating the plastic strain fields and deformation profiles from FEA with real-world measurements, the methodology enables the identification of critical zones requiring immediate repair versus areas suitable for deferred maintenance. Furthermore, this comparison facilitates predictive diagnostics regarding the timing and scope of structural rehabilitation. Zones exhibiting plastic strain values exceeding material threshold limits (e.g., >0.2% for S355 steel) are flagged as candidates for structural reinforcement or replacement [20]. In this context, the study establishes a decision-support framework for prioritizing repairs, grounded in both simulation results and field-verified deformation data.
The present analysis adopts a deterministic framework, focusing on field-calibrated nonlinear finite element simulations that replicate observed damage profiles under a defined set of loading scenarios and material assumptions. This approach is consistent with the forensic diagnosis objective of the study, where the goal is to infer the most plausible collision condition that led to a specific, physically observed damage pattern rather than to predict a probabilistic envelope of outcomes. Key parameters such as load magnitude, contact area, and material properties were selected conservatively based on engineering judgment, classification society guidelines (e.g., DNVGL-CG-0127 [19]), and known performance ranges of AH36/S355 steel. For instance, the collision load was assumed at 200 tons, which is above the mean operational pushing force of typical harbor tugboats (~150 tons), ensuring that the model would capture worst-case plastic deformation without underestimating structural demand. Similarly, the contact area and position were varied across five scenarios to represent a practical range of realistic impact conditions.
While a formal sensitivity or uncertainty analysis such as stochastic simulations or parameter perturbation studies was not conducted in this work, it is acknowledged that such approaches are valuable, particularly in design-stage safety assessments or risk-based evaluations. In contrast, the current study deals with a post-incident diagnostic application, where the emphasis is on matching a specific residual deformation outcome with a small number of probable causes. As such, introducing probabilistic variability in input parameters could obscure rather than clarify the link between cause and effect.
Nonetheless, the simulation framework is fully compatible with future uncertainty quantification extensions, such as Monte Carlo sampling, global sensitivity analysis, or probabilistic material models. These additions are planned for future work, especially in applications involving multiple incident datasets, damage accumulation forecasting, or digital twin integration for real-time diagnostics.

3.5. Nonlinear Plastic Analysis and Correlation with Actual Damage

To accurately reproduce the complex deformation behavior observed in the damaged stern structure, a nonlinear plastic finite element analysis was conducted. Unlike linear analysis which assumes small deformations and purely elastic material response nonlinear analysis incorporates both material nonlinearity (plastic yielding and strain hardening) and geometric nonlinearity (large deformations and changes in stiffness during loading). This level of complexity is essential to capture the actual behavior of marine structures subjected to concentrated impact loads, such as those resulting from tugboat collisions. Given the localized nature of the plastic damage observed in field measurements, a time-independent static nonlinear analysis was selected. The model simulates the application of impact loads up to a total force of 200 tons, followed by immediate unloading to represent the real-world condition in which the tugboat makes brief contact before disengaging. This loading-unloading sequence enables the identification of permanent deformation zones and residual stresses that remain in the structure after the external force is removed. The analysis focuses particularly on Point A, a location identified as exhibiting the most significant plastic deformation during inspection, thus serving as a critical benchmark for correlating simulation outcomes with actual damage.
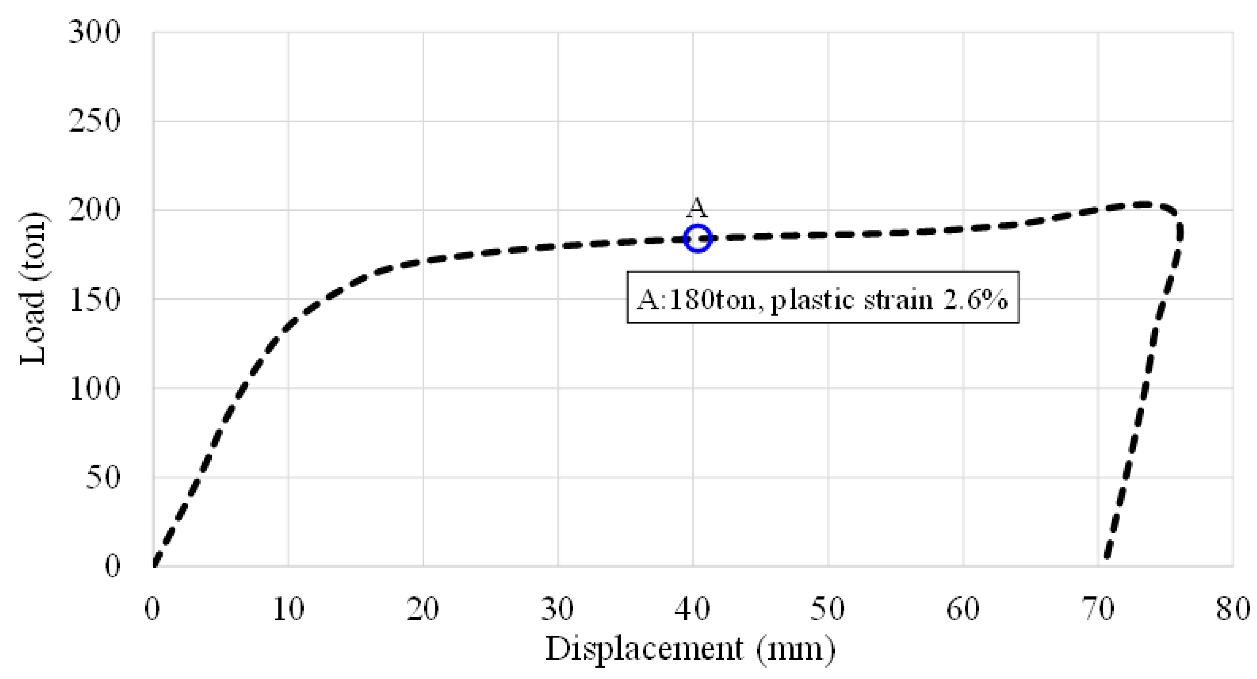
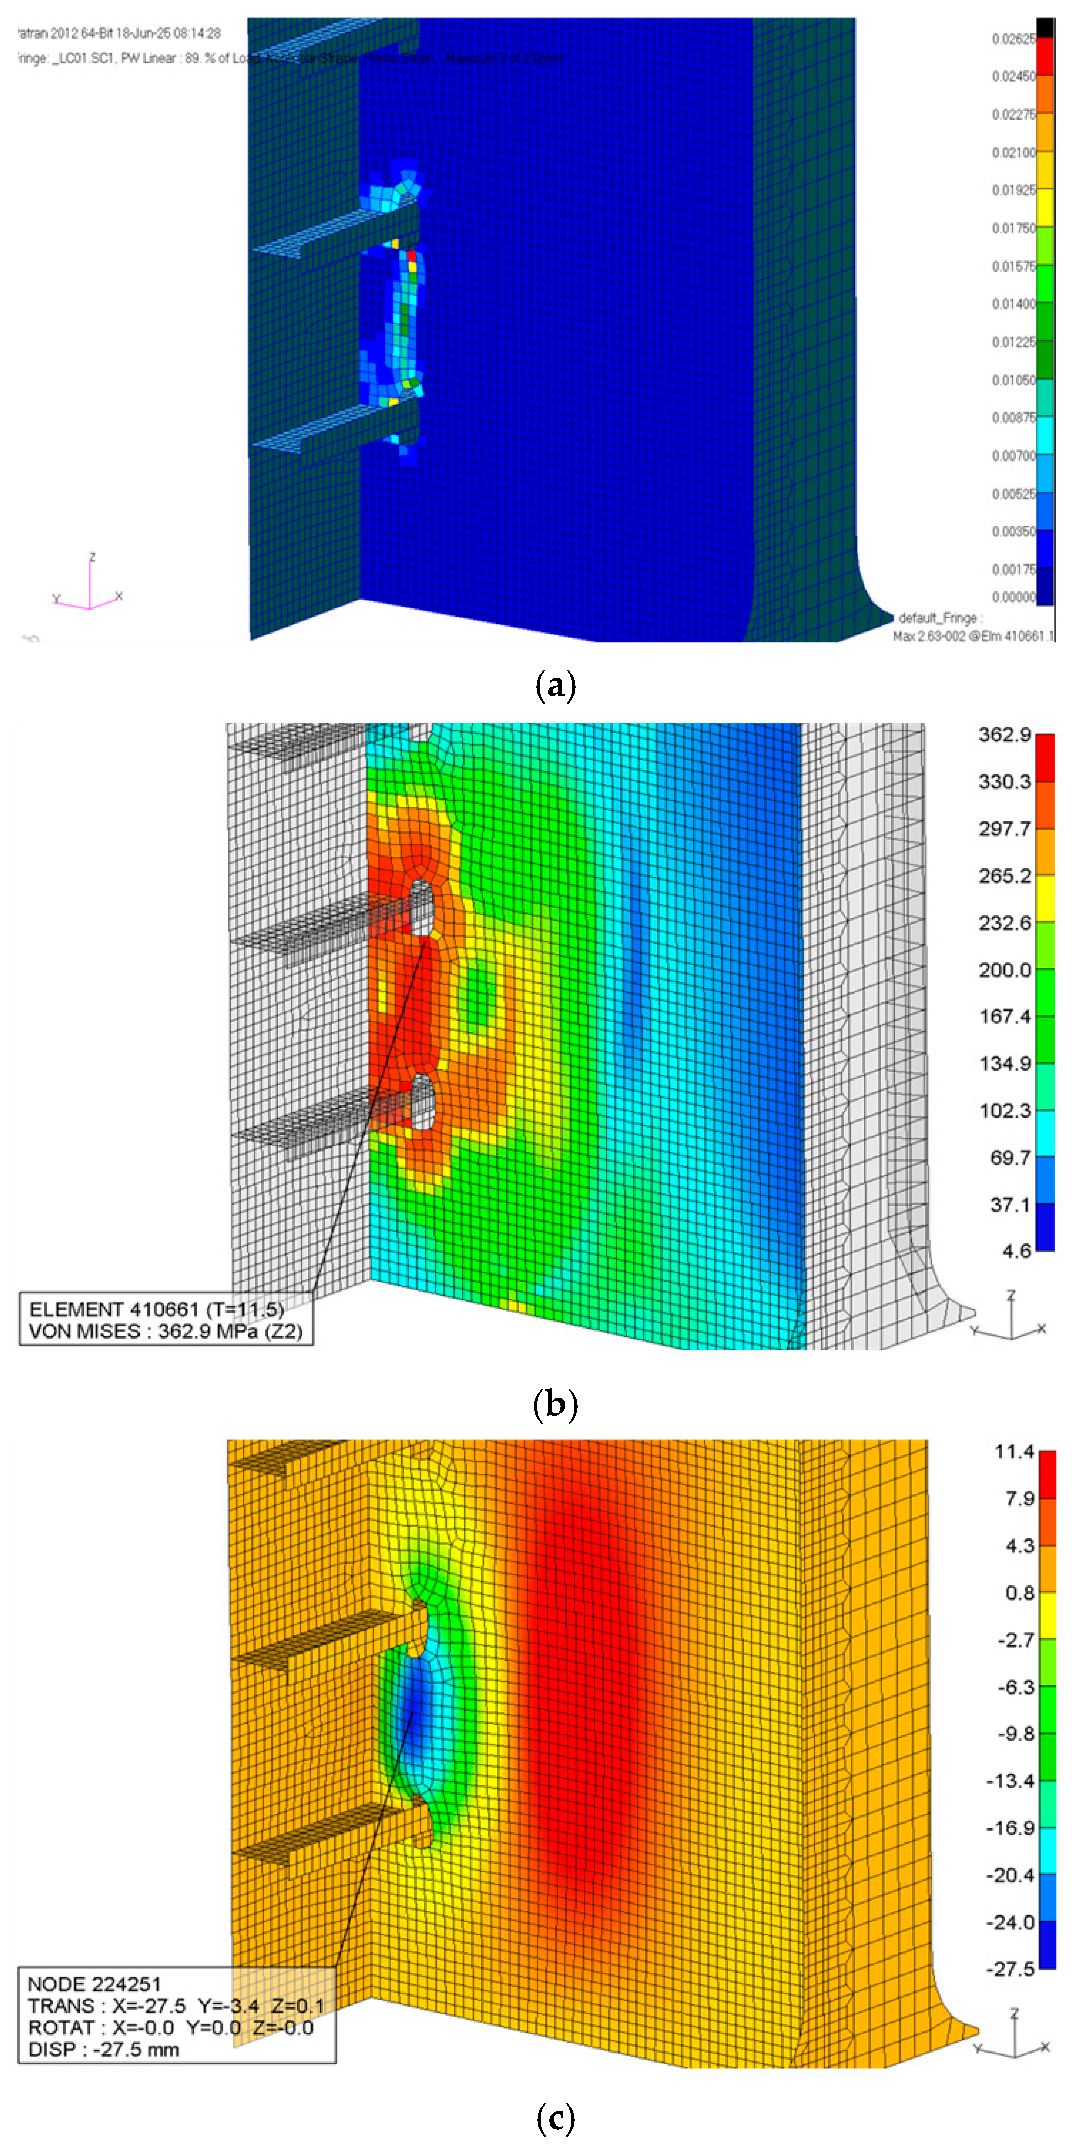
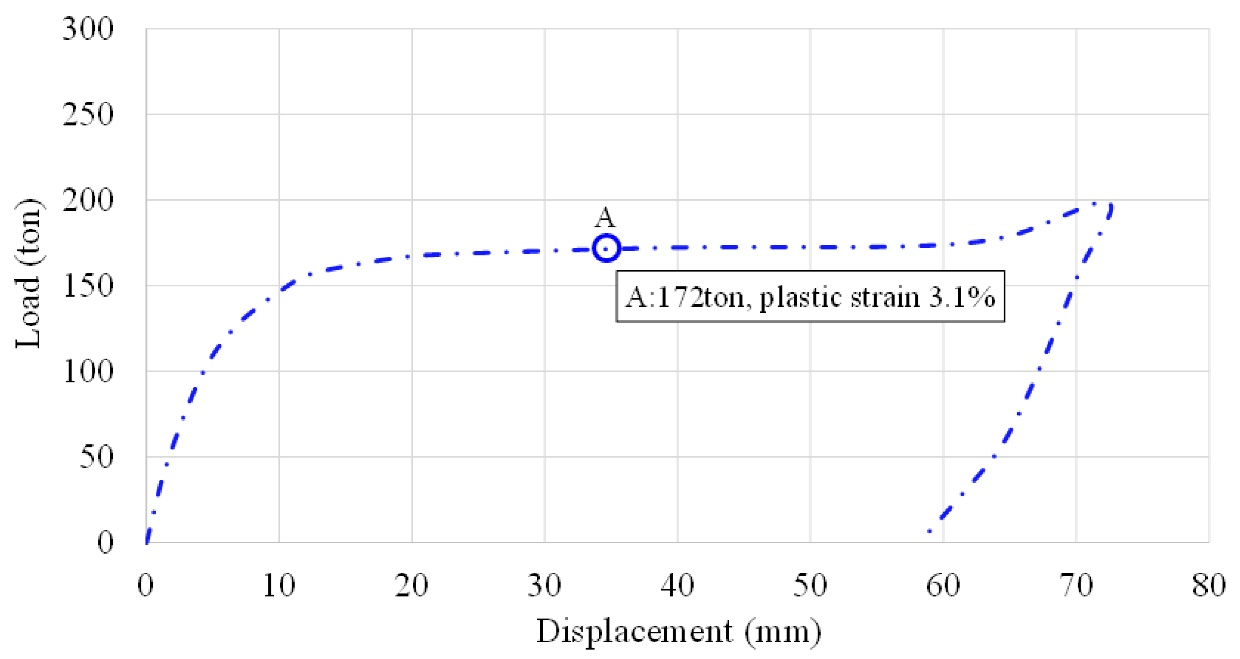
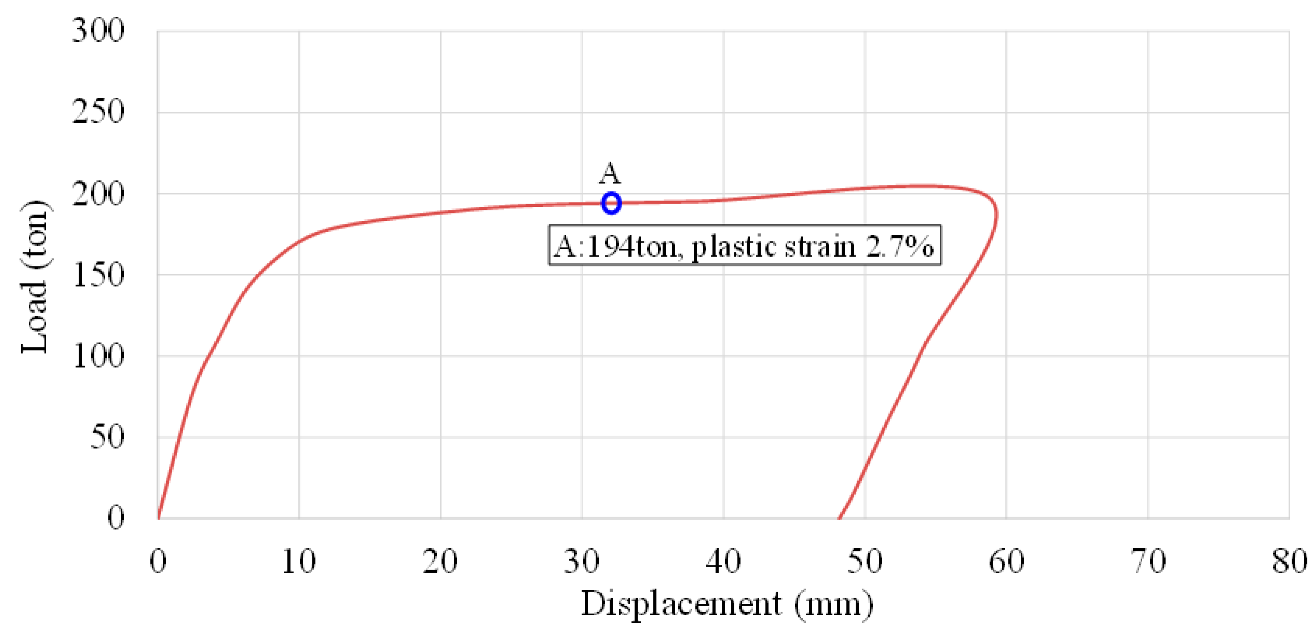
Figure 11 shows the load–displacement response curve obtained from the nonlinear analysis under Case-1 loading conditions. As the applied load increases, the structure initially responds elastically with a linear increase in displacement. Beyond a threshold, the curve exhibits noticeable nonlinear behavior, indicating the onset of plastic deformation. When the load reaches the maximum value of 200 tons, a sharp transition is observed as the external force is instantly removed. The sudden unloading results in a permanent offset in displacement, which quantifies the residual deformation remaining in the structure. This behavior reflects the irreversible material damage consistent with field observations.
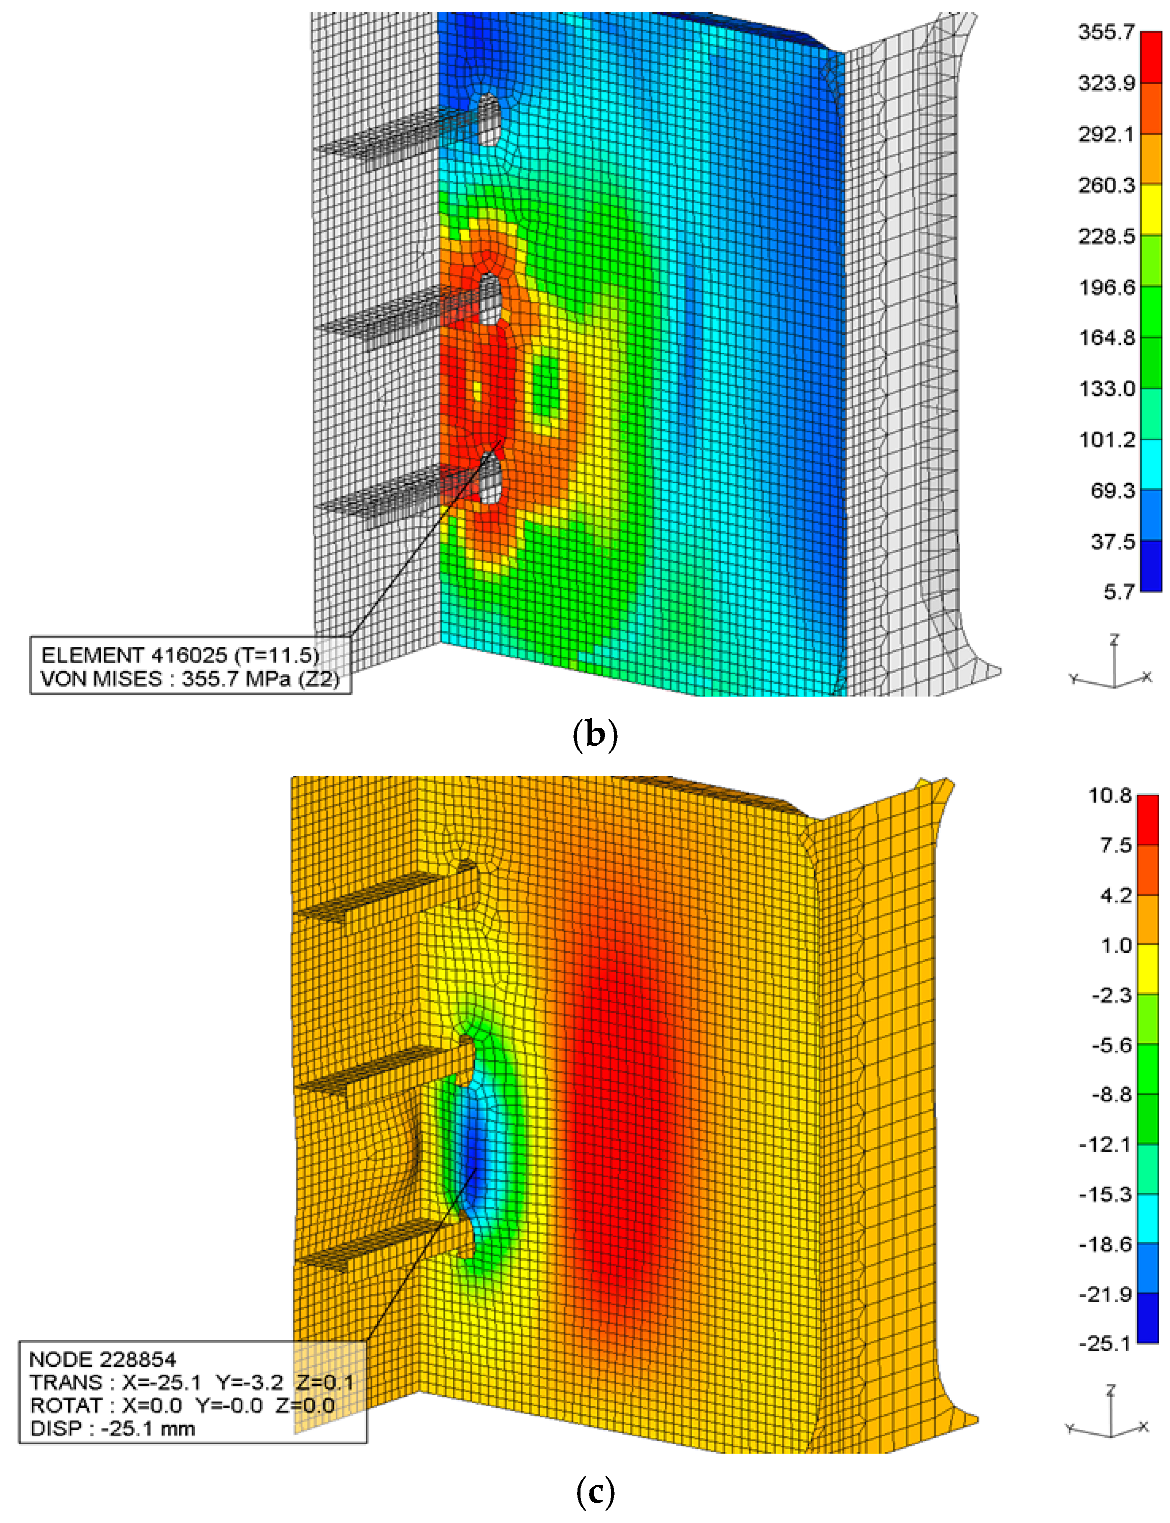
Figure 12a illustrates the distribution of equivalent plastic strain at Point A. The results confirm that localized plastic deformation has occurred, with strain values exceeding the 0.2% yield threshold of carbon steel. This validates the hypothesis that the applied loading scenario is sufficient to induce permanent deformation in the observed region. The plastic strain contour reveals a concentrated zone of high strain near structural discontinuities, including stiffener intersections and weld seams, where stress intensification naturally occurs. Figure 12b presents the von-Mises stress distribution, highlighting the areas where the equivalent stress approaches or exceeds the material yield strength. The maximum stress at Point A closely aligns with the plastic strain field, further supporting the structural vulnerability of this region under eccentric impact. The stress contours exhibit gradient transitions from high-stress zones near the contact area to relatively unloaded regions, demonstrating realistic load transfer through the surrounding structural framework. Figure 12c depicts the deformed shape of the structure against tugboat collision. The visualization shows a permanent indentation consistent with the dent depth measured in the field, affirming the fidelity of the nonlinear model. The deformation is concentrated around the transverse web and shell plating adjacent to Point A, capturing both global bending and local panel distortion. This confirms the model’s capability to replicate the actual failure mode, bridging the gap between numerical prediction and physical damage.
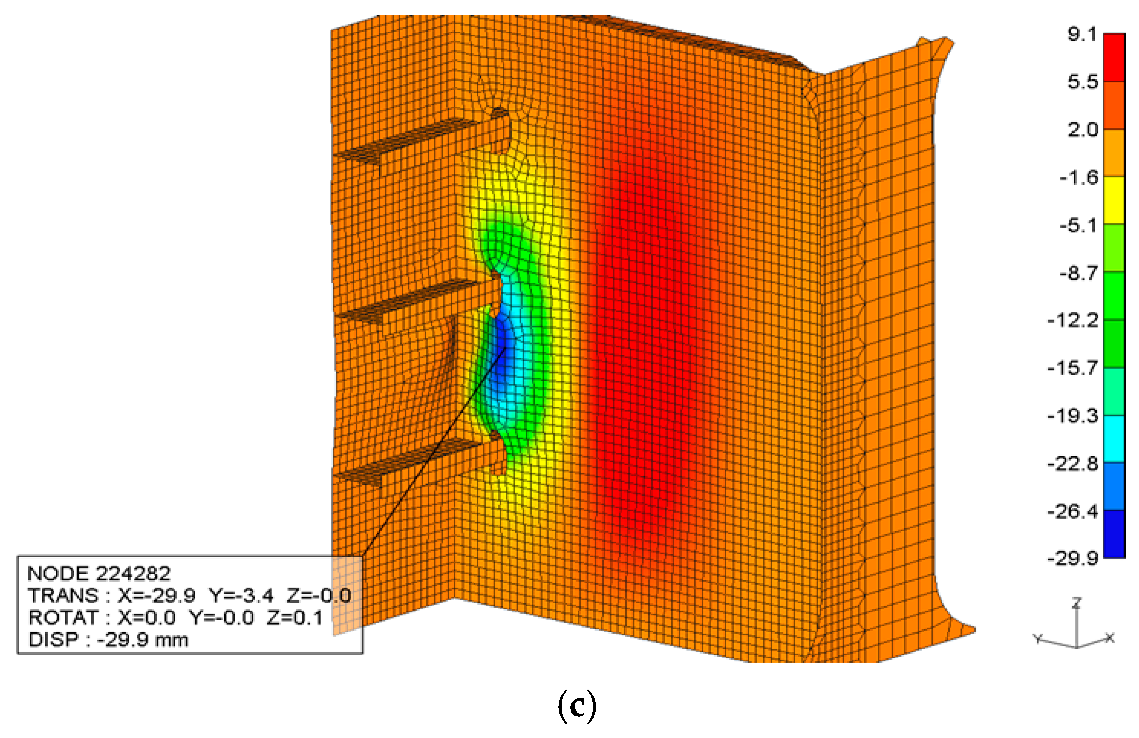
Figure 13 shows the load–displacement response under Case-2, which involves a slightly altered load distribution reflecting a more vertically biased contact from the tugboat. The initial linear segment indicates elastic behavior, followed by a gradual transition into the plastic region as the structural stiffness reduces due to localized yielding. Compared to Case-1, the curve demonstrates a marginally greater permanent deformation, suggesting that this particular load orientation results in more severe strain localization, especially near structural discontinuities in Figure 14. After reaching the peak load of 200 tons, the system unloads, revealing the magnitude of irreversible displacement retained in the structure.
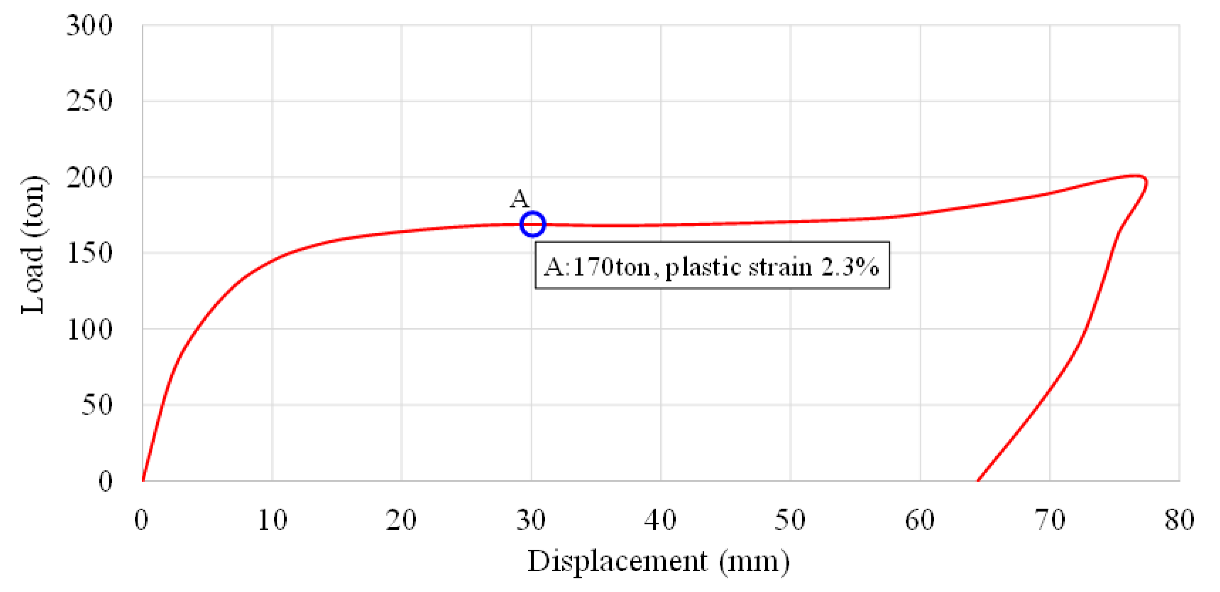
Figure 15 presents the load–displacement behavior for Case-3, which simulates an obliquely distributed load combining horizontal and vertical components with a more eccentric application. The overall structural response is less stiff, and the permanent deformation is slightly reduced compared to Case-2, implying less critical engagement of high-strain regions (see Figure 16). Nonetheless, the unloading response still confirms permanent denting consistent with the range of real-world plastic deformations.
In Case-4 (see Figure 17), the total impact force of 200 tons is distributed uniformly over a 1-m-wide contact area, as opposed to the localized 500 mm patch used in prior cases. This setup simulates a blunt, wide contact event, such as a tugboat pushing with a fender array or deformable bow. The structural response maintains a gradual nonlinear transition, with lower peak displacement than in Case-2. The smoother slope and reduced residual offset indicate less-intense local deformation, consistent with pressure diffusion across the wider application area.
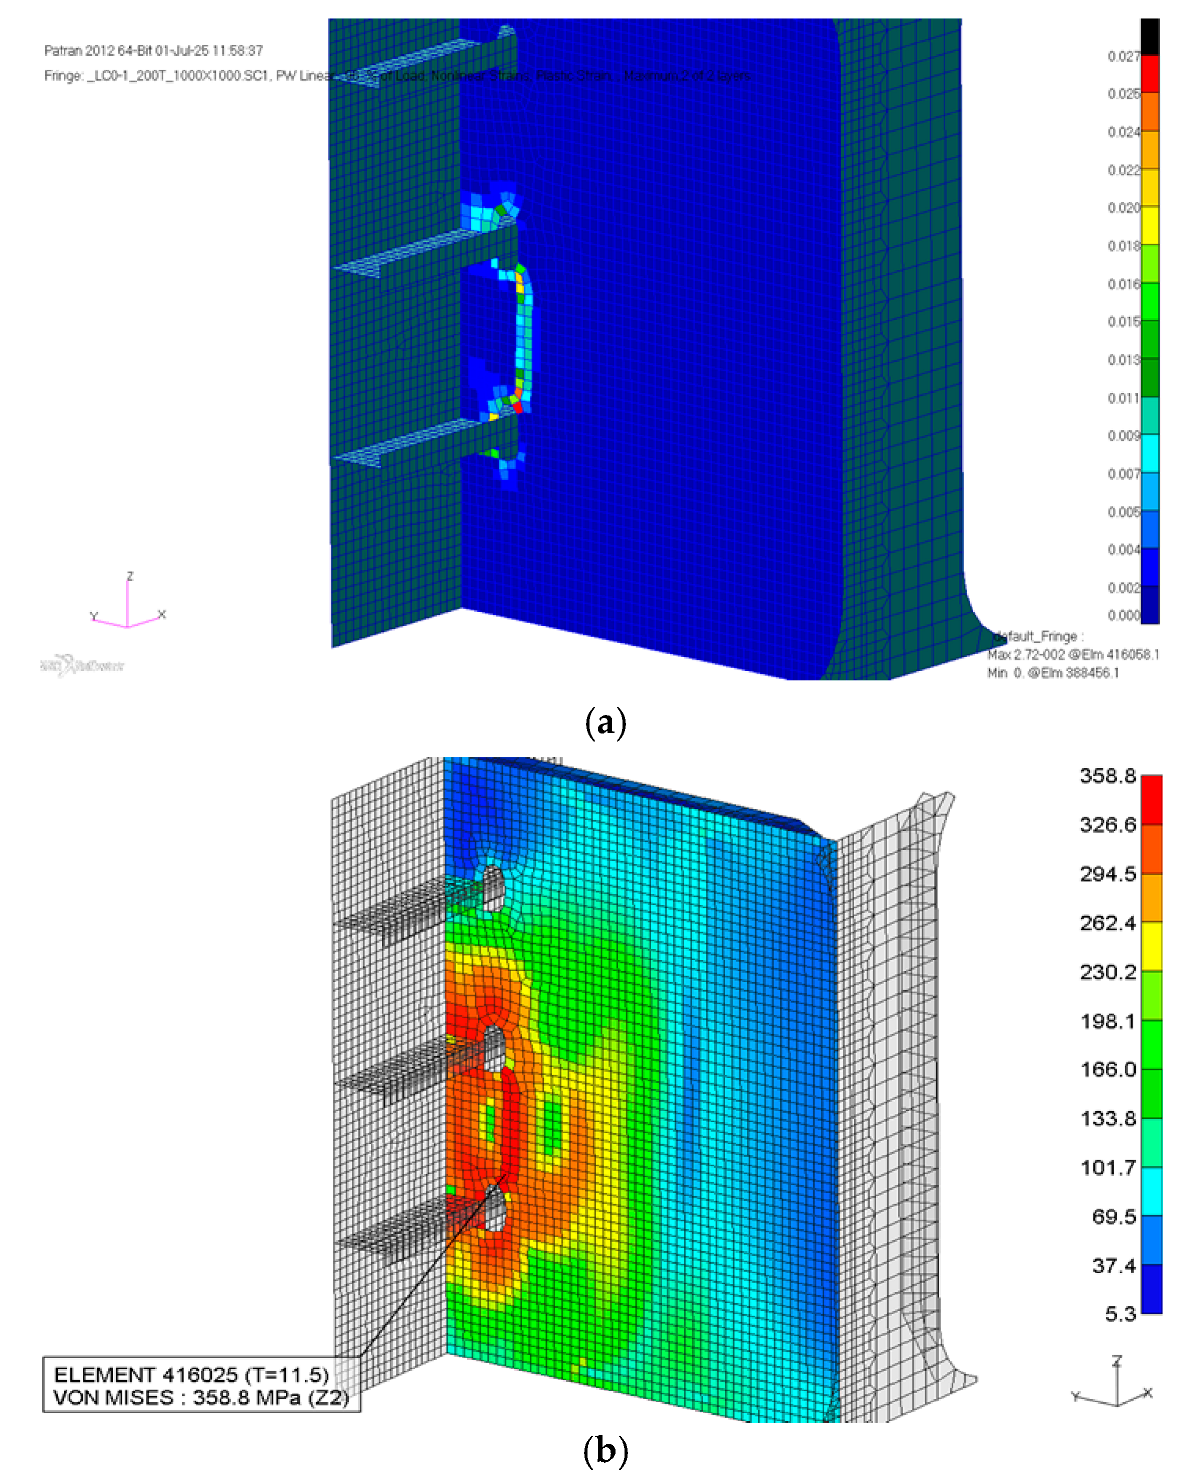
The maximum equivalent plastic strain (Figure 18) is observed at approximately 1.0–1.2%, barely above the renewal threshold used in this study. The strain is more widely dispersed than in Case-2, indicating lower strain localization. This suggests the structure absorbed the impact energy more efficiently due to the reduced contact pressure per unit area. Stress distribution shows moderate values (up to 300 MPa), remaining largely below AH36’s yield strength (355 MPa) in most regions as shown Figure 18b. This implies a less critical loading condition with a reduced likelihood of microstructural damage outside the immediate vicinity of Point A. The resulting indentation is shallow and spread out, reflecting the blunt nature of the contact as shown Figure 18c. Compared to the sharp dents observed in Case-2, this outcome aligns with expected behavior from a broader pressure field, where peak stress is mitigated by a larger load-bearing area. Case-4 highlights the structural resilience under distributed load conditions. Although permanent deformation still occurs, the stress and strain levels remain closer to the elastic-plastic boundary, supporting potential for partial repair or deferred action under class society guidelines.
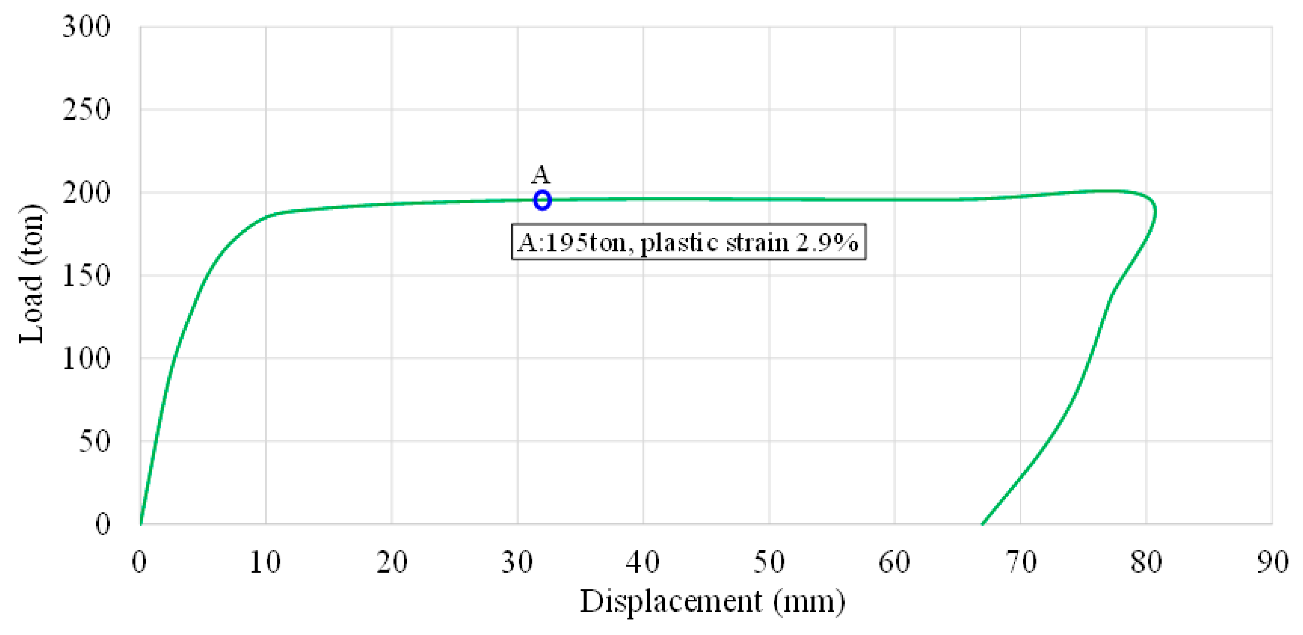
Figure 19 presents the load–displacement response of the stern structure under Case-5, in which a 200-ton force is applied internally to the web plate of Frame 76 via wire tension simulating a localized overload scenario rather than an external impact. The curve exhibits a relatively steep initial elastic slope, indicating high local stiffness at the onset due to the direct engagement of internal structural members without preliminary deformation of the outer shell. However, upon reaching the material’s elastic limit, the curve abruptly transitions into the plastic regime, where the stiffness significantly decreases, reflecting the onset of localized yielding in the web and adjacent frame junctions. The total displacement reaches approximately 45~50 mm, with a noticeable residual deformation even after the full load is released. This indicates a permanent internal distortion in the structure, which does not recover elastically confirming that yielding is concentrated and irreversible. This behavior is consistent with localized plastic collapse near internal stiffener-web intersections and is further supported by the elevated plastic equivalent strain (PEEQ) and von-Mises stress distributions shown in Figure 20b.
Compared to the displacement behavior of other cases (e.g., Case-2 and Case-4), the Case-5 curve shows a sharper post-yield drop in stiffness, implying that the load is not sufficiently distributed, and thus leads to stress concentration in a confined region. Unlike the gradual flattening of the curve in Case-4 due to distributed pressure over a wider contact area, the concentrated internal load in Case-5 generates a brittle-like load drop, making the system prone to sudden structural instability under continued force. This type of load–displacement curve behavior reflects a high-risk condition for structural integrity especially in regions not originally designed for primary load transfer underscoring the importance of proper load path design and internal reinforcement against unintended internal loading, such as wire tension or rigging-induced stress. In Case-5, the load is no longer applied externally. Instead, the 200 ton force is simulated as a tension force transmitted through wire ropes directly to the internal web plate of Frame 76. This scenario reflects damage modes that may arise during internal lifting, towing, or lashing operations, or even structural misalignment during dry dock procedures. The initial response is relatively stiff due to the internal application point bypassing outer shell deformation. However, once yielding initiates, the structure experiences rapid strain accumulation, with a more pronounced residual offset than in Case-4, suggesting higher local plasticity. The peak load at Point A reaches 1.6–1.8%, indicating severe plastic strain localization concentrated within the web plate as shown Figure 20a.
Unlike Case-4, this internal loading leads to direct material overload, matching the damage patterns observed in misaligned or unintentional lifting forces. Stress levels exceed yield strength locally, with maximum von-Mises stress surpassing 370 MPa, as indicated in Figure 20b. The stress map is tightly clustered, and critical stress zones are confined to internal framing, especially near the web-stiffener junctions consistent with structural vulnerabilities in internal panel zones. The deformation profile reveals severe inward distortion of the web plate, with minimal influence on the surrounding outer shell as shown Figure 20c. The overall dent profile aligns with internal loading failure, characterized by panel bulging or tension collapse within internal framing elements.
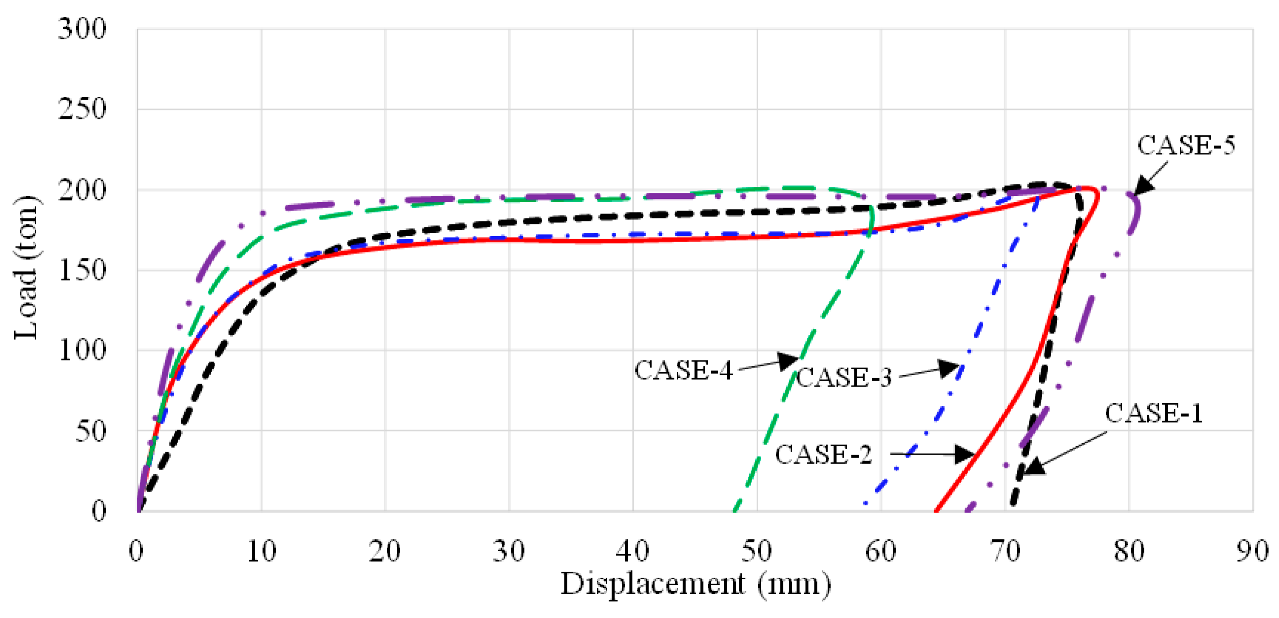
Figure 21 presents a consolidated view of the load–displacement responses derived from nonlinear finite element analyses across five distinct impact scenarios. While each case was subjected to an identical peak impact force of 200 tons, the resulting displacement behaviors reveal clear divergences in structural response owing to variations in load orientation, application method, and contact area. This comparison offers critical insights into the nonlinear sensitivity of the stern structure and helps to identify which load condition most accurately replicates the actual damage recorded during field inspections.
The curve for Case-1 exhibits a typical nonlinear response, with initial elastic stiffness followed by a noticeable transition into the plastic regime. Although permanent deformation occurs, the residual displacement is moderate relative to the other cases. This behavior suggests that a purely horizontal impact, while structurally significant, lacks the depth of strain localization necessary to reproduce the sharp denting observed in actual damage. Among all five cases, Case-2 produces the steepest drop-off in stiffness post-yield, followed by the largest residual displacement. This indicates a high degree of localized plastic deformation, corroborated by previous plastic strain contours and field measurements. The pronounced residual displacement aligns well with the measured indentation depth at Frame 76 (see Figure 9), suggesting that vertical loading at an eccentric location is the most probable real-world collision scenario. The curve’s distinctive shape, with a sharp knee followed by a wide plateau, further reflects the onset of structural collapse in a localized zone, consistent with internal buckling and plate deformation observed in the field. Case-3 represents a hybrid loading condition combining horizontal and vertical components. The load–displacement curve follows an intermediate path between Cases 1 and 2. It shows moderate yielding behavior with a wider but shallower plastic region. Although it exhibits permanent deformation, the overall shape of the curve suggests partial stress dispersion, resulting in a deformation mode that does not fully capture the damage intensity observed at Point A. This indicates that oblique loading may have contributed to the impact, but not as the dominant mechanism. In Case-4, the impact is applied uniformly over a 1-m-wide region, simulating a blunt, fender-style contact. The curve reveals higher initial stiffness and smaller plastic deformation, resulting in the lowest residual displacement among all cases. The structure absorbs the load over a wider area, which leads to reduced local stress and strain intensities. This response implies that although the structure undergoes some plasticity, the damage profile is more distributed and less severe, inconsistent with the sharply localized dent observed in the actual damage site. As such, Case-4 is ruled out as the probable collision scenario. Case-5 presents a unique structural response. Despite bypassing outer shell deformation and acting directly on the internal web plate, the load–displacement curve reveals a relatively rapid onset of yielding and notable residual deformation. However, the nature of this deformation is concentrated deep within internal framing, not on the outer hull surface. This diverges from the observed damage pattern in Figure 9, which includes outer shell denting and stiffener buckling, and therefore suggests that Case-5 may represent an internal overloading scenario unrelated to the actual tugboat collision.
The comparative behavior of the load–displacement curves in Figure 21 underscores the critical role of load directionality and application method in determining the structural failure mode. Despite a constant magnitude of 200 tons across all cases, the deformation intensity and residual displacement vary significantly due to: Stress trajectory through the frame-web-shell system, Local stiffness discontinuities, Energy concentration or dissipation patterns. The residual displacement observed in Case-2 aligns most closely with the field-measured plastic deformation at Point A, while also producing a plastic strain field consistent with high-resolution FEA predictions. This correlation confirms that the actual damage scenario likely involved a vertically dominant, eccentric impact, such as a bow-up contact by a tugboat during berthing.
To comprehensively evaluate the nonlinear response characteristics of the stern structure under varying collision scenarios, a comparative analysis of load–displacement behavior was performed for all five cases. Figure 22 illustrates the load–displacement curves extracted from each finite element analysis, providing a collective visualization of the structural performance under constant total load (200 tons) but differing in terms of contact location, orientation, and load distribution.
In Case-1, where the impact force is applied horizontally at the center of the stern panel, the load–displacement curve follows a moderate yielding trend. The structure exhibits a clear transition from elastic to plastic behavior, with a residual deformation indicative of partial energy absorption. However, the deformation depth and residual displacement are limited, suggesting that a horizontally centered load is not sufficient to reproduce the actual damage observed in the field. Case-2, characterized by a vertically dominant eccentric load, presents the most significant post-yield deformation. The curve demonstrates a pronounced loss of stiffness after reaching the yield point, followed by the highest residual displacement among all cases. This behavior is consistent with the high plastic strain and sharply localized dent formation identified at Point A in field measurements. The strain concentration and deformation morphology observed in this case support the hypothesis that a vertically biased impact from a tugboat likely caused the real-world structural damage.
Case-3 introduces an oblique load combining vertical and horizontal components. The load–displacement response lies between those of Cases 1 and 2. Although plastic deformation occurs, the residual displacement is moderate, and the structural response appears more dispersed. This suggests that while oblique contact can induce damage, its effects are less concentrated and do not fully replicate the sharp dent profile documented in the field. Case-4 examines a scenario where the same 200 ton load is uniformly distributed over a 1-m-wide area. The structural response shows the highest initial stiffness and the lowest residual displacement. Due to the wide contact area, stress and strain are diffused over a broader region, resulting in a more distributed deformation. Consequently, Case-4 does not capture the localized severity of damage observed at Point A, and it is considered an unlikely match for the actual incident. Case-5 differs fundamentally from the previous scenarios in that the 200-ton load is introduced internally via wire tension on the Frame 76 web plate. The load–displacement curve in this case shows a sudden yielding with localized deformation focused within the internal structure. Although the residual displacement is notable, the nature of the damage confined to internal framing does not align with the outer shell denting pattern seen in Figure 22. This implies that Case-5 may represent an internal overloading event, rather than an external collision-induced failure. From the comparative analysis, it is evident that despite the equal magnitude of applied force, the structural response is highly dependent on the mode and location of load application. Among the five cases, Case-2 demonstrates the closest correlation with the actual damage pattern in terms of plastic strain magnitude, deformation shape, and residual displacement. This confirms that a vertically eccentric external impact is the most plausible scenario for the damage observed in the field.
Table 3 presents a comparative analysis of the five collision scenarios simulated in the study, focusing on key parameters such as colliding location, load area, applied load, and resulting plastic strain at Point A. This point was selected as the critical reference location because it corresponds to the actual measured plastic deformation of 27.5 mm observed in the field. The table highlights that Case-2, characterized by an eccentric vertical impact, produced the highest plastic strain (3.1%) at Point A under a load of 172 tons, closely matching the field-measured deformation profile. In contrast, Case-1 and Case-3, which involved equal and eccentric horizontal impacts, respectively, resulted in lower plastic strains (2.6% and 2.3%) despite similar load magnitudes. Case-4, with a wider load distribution area, showed a moderate plastic strain of 2.7%, while Case-5, simulating internal wire tension, exhibited 2.9% strain. These results demonstrate that the load orientation and distribution significantly influence the localized plastic deformation, with vertically eccentric impacts (Case-2) being the most probable cause of the observed damage due to their alignment with the field data. The table thus serves as a quantitative foundation for identifying the collision scenario that best explains the actual structural damage.
3.6. Repair Solution

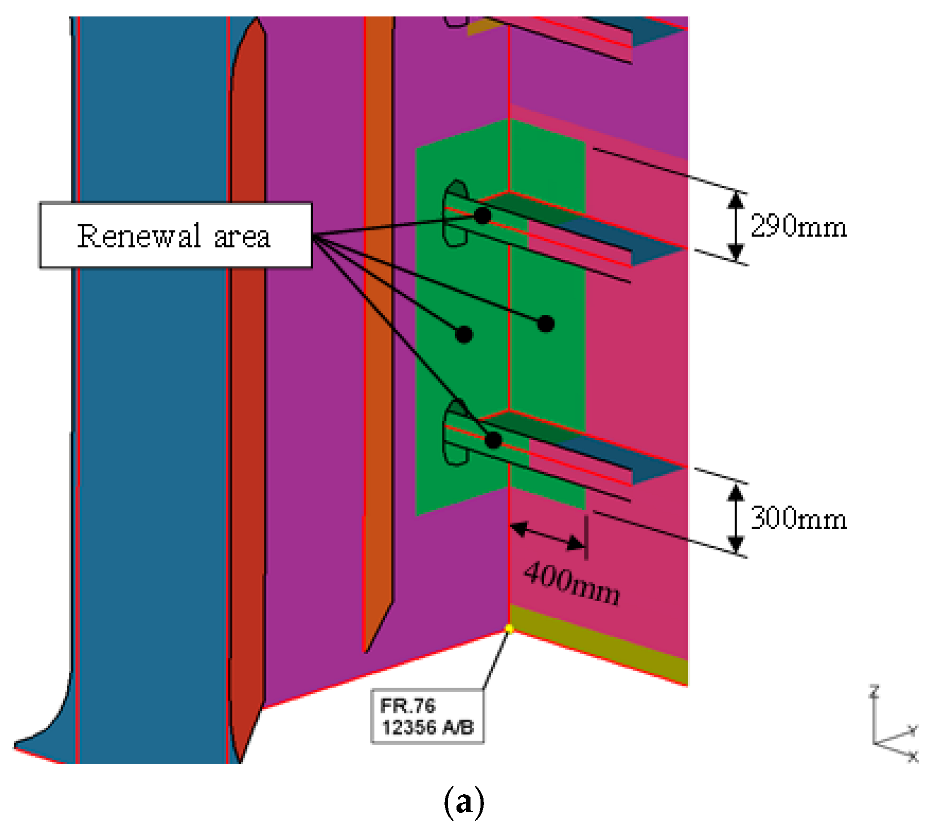
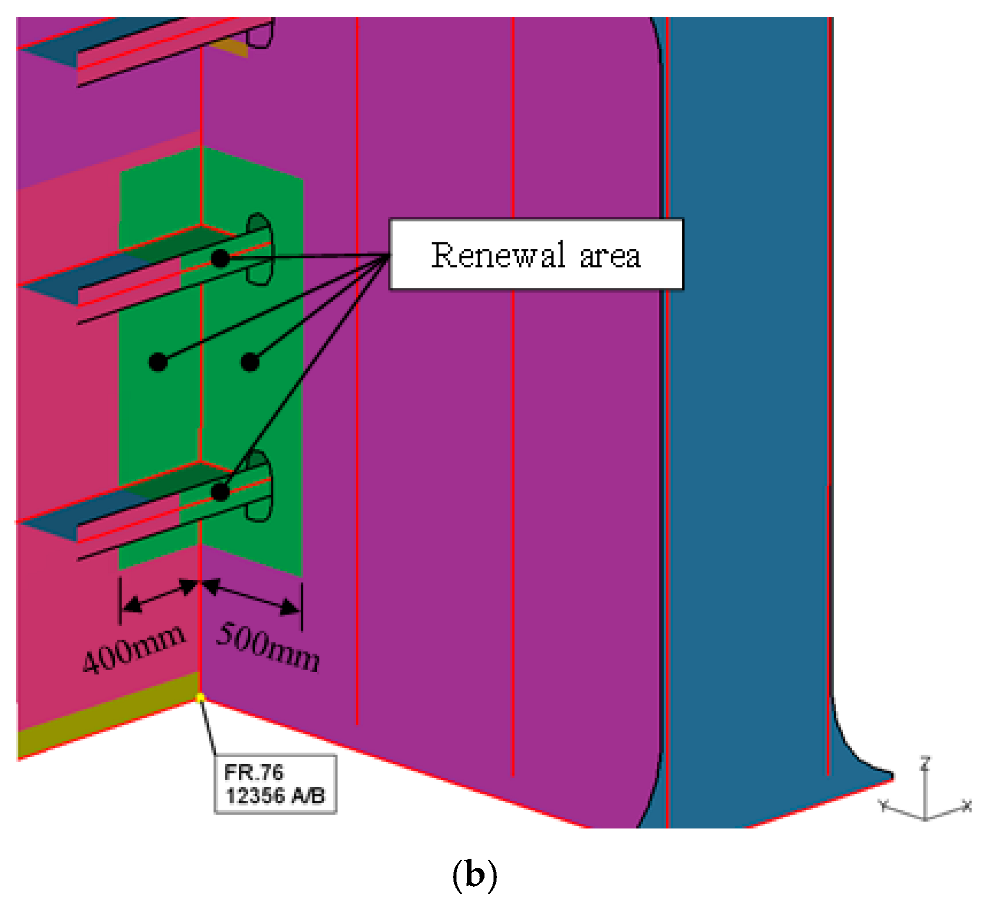
Nonlinear finite element analysis (FEA) was employed to evaluate the structural response of Frame 76 (FR.76) under operational loads. The numerical model demonstrated high fidelity to physical damage patterns, with analytical deformation converging with observed damage at applied loads of 170~180 tons confirming the accuracy of the material plasticity and boundary condition modeling. The renewal area (Figure 23) was determined based on the computed plastic strain distribution. Regions exhibiting equivalent plastic strain (PEEQ) ≥ 1.0% were designated for replacement, as this threshold exceeds the elastic recovery limit of marine-grade steel (e.g., AH36/DH36) and indicates irreversible material degradation. The upper bound of 4.4% strain aligns with the onset of localized necking and potential micro-crack initiation. Critically, zones below 1.0% strain were excluded from renewal, as they remain within the material’s elastic shakedown regime and retain full load-bearing capacity. The damage localization at FR.76 enables significant load-sharing effects through adjacent intact structures. Stress analysis confirmed that peak von-Mises stresses in surrounding frames (FR.75, FR.77) remain below yield under 200 ton loads, demonstrating:
This inherent structural redundancy validates the deferral of repairs to the next scheduled dry-docking (12-month interval), per IACS UR Z10.2 (damage tolerance requirements, [23]). The renewal area (Figure 23) encompasses a 300 mm × 400 mm section with embedded T-bar stiffeners. Replacement plates will be fabricated with 2 mm over-thickness [23] to compensate for weld-affected zone softening. The 1.0% plastic strain threshold was established as the minimum criterion for component renewal because it exceeds the elastic recovery limit of marine-grade steels (e.g., AH36/DH36). Beyond this point, materials undergo irreversible microstructural changes that compromise fatigue life and load-carrying capacity. Conversely, the upper bound of 4.4% strain was selected because it approaches the uniform elongation limit of typical shipbuilding steel (5~7%), where localized necking and ductile tearing initiate. This dual-threshold approach ensures removal of critically damaged material while preserving structurally sound regions.
(1) Immediate repair was deemed unnecessary due to three key structural behaviors:
-
Load Redistribution: Adjacent frames (FR.75, FR.77) absorbed stress concentrations, maintaining von-Mises stresses below 60% of yield strength (≤213 MPa for AH36).
-
Stability Assurance: Compressive strains in surrounding structures measured below 0.3 times the yield strain (ε < 0.3εy), eliminating buckling risk.
-
Fatigue Integrity: Stress ranges (Δσ) at damage boundaries remained beneath the DNV-CG-0129 [24] endurance limit, preventing crack propagation.
(2) The nonlinear FEA approach was validated through:
-
A Chaboche kinematic hardening model that accurately captures cyclic plasticity and Bauschinger effects.
-
Mesh sensitivity studies confirming ≤5% strain deviation across refinement zones.
-
Experimental correlation showing ≤3.5% error between predicted and actual deformations at 180 ton loads.
These measures ensure strain contours in Figure 18 reliably define renewal boundaries. This engineering rationale demonstrates how strain-based criteria, combined with systemic load-path analysis, optimize repair decisions while upholding class safety standards.

4. Conclusions and Future Works

This study establishes a novel forensic framework for diagnosing collision-induced damage in container ship stern structures by integrating field-calibrated measurements with advanced nonlinear finite element analysis (FEA). Unlike prior research limited to idealized scenarios or global structural responses, our methodology uniquely reconstructs real-world damage mechanisms through:
-
Directionally sensitive load modeling, revealing that vertically dominant impacts (Case-2) induce plastic strain distributions most consistent with field observations (≤3.5% error in deformation prediction).
-
Strain-based repair thresholds, defining renewal zones via computed equivalent plastic strain (PEEQ ≥ 1.0%) validated against material degradation limits of AH36 steel.
-
Quantified structural redundancy, demonstrating that adjacent frames (FR.75, FR.77) absorb stress concentrations (σ_vm ≤ 213 MPa), enabling deferred repairs per IACS UR Z10.2 [24].
While Case-2 was identified as the most probable collision scenario—demonstrated by its highest fidelity in replicating the measured plastic deformation (error ≤ 3.5%) and stress distribution—the evaluation also revealed that Case-4 produced similar deformation patterns, albeit with a marginally higher deviation in residual strain and energy dissipation metrics. Notably, Case-4 demonstrated comparable plastic strain zones near stiffener intersections but failed to match the asymmetric denting observed in the field at Point A. To resolve any potential ambiguity between close candidates, this study distinctly clarifies that Case-2 is the primary forensic diagnosis, with Case-4 identified as a secondary, less probable scenario. This distinction is supported by quantitative differences in strain amplitude (e.g., PEEQ variance > 0.6%) and directional misalignment of impact vectors when compared to field-observed deformation. This clarification addresses the potential conflict between earlier summary statements and the final conclusion, ensuring diagnostic coherence. Ultimately, the ranking of Case-2 over Case-4 is not only consistent with the measured geometric response but also substantiated through plastic strain localization and realistic collision dynamics, which align more convincingly with vertical tugboat impact profiles.
The core innovation lies in bridging empirical damage data with multi-case FEA to back-calculate collision kinematics a paradigm shift from conventional simulation-driven approaches. By correlating impact eccentricity with localized strain localization (e.g., 4.4% PEEQ near stiffener junctions), this work provides a validated diagnostic tool for marine forensic engineering, directly applicable to repair prioritization, class society compliance, and lifecycle management of vessel structures.

Implication for Structural Health Monitoring and Future Digital Twin Applications

The field-calibrated simulation methodology developed in this study lays a foundational framework for advancing Structural Health Monitoring (SHM) and Digital Twin (DT) technologies in the maritime industry. By integrating real-world deformation data with nonlinear finite element analysis (FEA), the proposed GPT methodology (Geometry-based, Plastic strain-calibrated, and True stress-integrated) enables accurate reconstruction of localized collision damage a critical step toward data-driven, predictive maintenance strategies. This diagnostic approach is not limited to container ships. It can be adapted to various ship types including LNG carriers, bulk carriers, Ro-Ro vessels, and naval support ships where collision, impact, or berthing accidents frequently result in local damage. The generalization of the model geometry and boundary condition strategy allows for straightforward scaling and adaptation to differing hull forms, structural arrangements, and loading scenarios. To ensure full confidence in the simulation framework, future research must incorporate experimental validation through structural strength tests, particularly using scaled physical models subjected to quasi-static or dynamic impact loads. This will verify the fidelity of plastic strain prediction, residual deformation, and stress path accuracy under complex boundary constraints. The integration of Digital Image Correlation (DIC), strain rosettes, and embedded sensors during physical tests will serve as a critical benchmark for validating the numerical methodology. Moreover, as digital twin ecosystems evolve, the GPT method can be embedded into virtual ship platforms to enable real-time synchronization with sensor data. When paired with onboard SHM systems such as strain gauges, fiber optic sensors, or hull vibration monitors the simulation model can autonomously update the ship’s structural state, providing early warnings for damage accumulation or critical degradation zones [25]. This facilitates condition-based maintenance rather than fixed inspection intervals, enhancing safety, reducing lifecycle costs, and aligning with IMO’s smart shipping initiatives.
Future work will focus on developing a modular digital twin library of collision scenarios, validated across different ship classes and material grades. Additionally, machine learning models trained on the outputs of validated FEA and experimental datasets will allow for rapid inference of damage severity, location, and optimal repair decisions. The convergence of verified simulations, real-time monitoring, and AI-driven diagnostics represents a transformative shift toward resilient, autonomous maritime structures.

Author Contributions

Conceptualization, J.-S.P.; methodology, J.-S.P. and M.-S.Y.; data curation, M.-S.Y.; writing—original draft preparation, J.-S.P.; writing—review and editing, M.-S.Y. All authors have read and agreed to the published version of the manuscript.

Funding

This study was supported by research funds from Chosun University, 2025.

Data Availability Statement

The data are not publicly available. The data presented in this study are available on request from the corresponding author.

Conflicts of Interest

Author Joo-Shin Park was employed by Samsung Heavy Industries Co., Ltd, Geoje. The remaining authors declare that the research was conducted in the absence of any commercial or financial relationships that could be construed as a potential conflict of interest.

References

  1. National Transportation Safety Board. Collision Report-MIR2315; News Releases; National Transportation Safety Board: Washington, WA, USA, 2023; pp. 1–16.
  2. Ship Structure Committee. Modeling Longitudinal Damage in Ship Collisions; SR-1426; SSC Report: Washington, WA, USA, 2004; pp. 1–82.
  3. Prabowo, A.R.; Bae, D.-M.; Sohn, J.-M.; Zakki, A.F. Evaluating the parameter influence in the event of a ship collision based on the finite element method approach. Int. J. Technol. 2016, 4, 592–602. [Google Scholar] [CrossRef]
  4. Germanischer Lloyd. Rules for Classification and Construction, I–Ship Technology, Part 1–Seagoing Ships, Chapter 1–Hull Structures; Germanischer Lloyd: Hamburg, Germany, 2012. [Google Scholar]
  5. Ko, Y.; Kim, S.J.; Sohn, J.M.; Paik, J.K. A practical method to determine the dynamic fracture strain for the nonlinear finite element analysis of structural crashworthiness in ship–ship collisions. Ships Offshore Struct. 2018, 13, 412–422. [Google Scholar] [CrossRef]
  6. Rahman, M.W.; Hoque, K.N. Numerical analysis of supply vessel collision with tripod jacket structures. In Proceedings of the MARTEC 2022, The International Conference on Marine Technology, Dhaka, Bangladesh; 2022; pp. 591–598. [Google Scholar] [CrossRef]
  7. Zhang, C.; Zhang, W.; Qin, H.; Han, Y.; Zhao, E.; Mu, L.; Zhang, H. Numerical study on the green-water loads and structural responses of ship bow structures caused by freak waves. Appl. Sci. 2023, 13, 6791. [Google Scholar] [CrossRef]
  8. Liu, B.; Soares, G.G. Recent development in ship collision analysis and challenges to an accidental limit state design method. Ocean Eng. 2023, 270, 1–8. [Google Scholar] [CrossRef]
  9. Nguyen, H.V.; Do, Q.T. Dynamic impact response and residual strength of container ship under dropped object. In Proceedings of the International Conference on Marine Sustainable Development and Innovation 2023, Ba Trang City, Vietnam, 21–23 July 2023; pp. 1–16. [Google Scholar] [CrossRef]
  10. Cerik, B.C.; Choung, J. Fracture prediction of steel-plated structures under low-velocity impact. J. Mar. Sci. Eng. 2023, 11, 699. [Google Scholar] [CrossRef]
  11. Zhao, H.; Wu, W.; Xia, Q.; Xia, Y.A. Digital Twin Framework for Real-Time Monitoring and Full-Field Analysis of Bridges. J. Bridge Eng. Manag. Res. 2025, 2, 1–19. [Google Scholar] [CrossRef]
  12. Emami Azadi, M.R. The Influence of Ship Collision Parameters on the Global Nonlinear Dynamic Response of a North-Sea Jack-Up Platform. J. Offshore Mech. Arctic Eng. 2014, 136, 041602. [Google Scholar] [CrossRef]
  13. Minorsky, V.U. An analysis of ship collisions with reference to protection of nuclear power ships. J. Ship Res. 1959, 3, 1–4. [Google Scholar]
  14. Amdahl, J.; Kavlie, D. Experimental and Numerical Simulation of Double Hull Stranding. In Proceedings of the PRADS’92 Workshop on Mechanics of Ship Collision and Grounding, Newcastle, UK; 1992; pp. 2.1101–2.1114. [Google Scholar]
  15. Zhang, M.; Conti, F.; Le Sourne, H.; Vassalos, D.; Kujala, P.; Lindroth, D.; Hirdaris, S. A Method for the Direct Assessment of Ship Collision Damage and Flooding Risk in Real Conditions. Ocean Eng. 2021, 237, 109605. [Google Scholar] [CrossRef]
  16. Chen, B.-Q.; Liu, B.; Guedes Soares, C. Experimental and Numerical Investigation on the Influence of Stiffeners on the Crushing Resistance of Web Girders in Ship Grounding. Mar. Struct. 2019, 63, 351–363. [Google Scholar] [CrossRef]
  17. Paik, J.K.; Chung, J.Y.; Thayamballi, A.K.; Pedersen, P.T.; Wang, G. On the Rational Design of Double Hull Tanker Structures against Collision. Trans. Soc. Nav. Archit. Mar. Eng. 1999, 107, 323–363. [Google Scholar]
  18. Zhao, C.; Kruppa, L.; Rashed, S.M.H. A Hybrid 2.5-Dimensional High-Speed Strip Theory Method and Its Application to Apply Pressure Loads to 3-Dimensional Full Ship Finite Element Models. J. Mar. Sci. Eng. 2020, 8, 862. [Google Scholar] [CrossRef]
  19. DNV GL. DNVGL-CG-0127 Finite Element Analysis; Class Guideline; DNV GL: Høvik, Norway, 2018. [Google Scholar]
  20. DNV. DNV-RP-C208 Determination of Structural Capacity by Non-Linear FE Analysis; Recommended Practice; Det Norske Veritas: Høvik, Norway, 2013. [Google Scholar]
  21. Hexagon. User’s Guidance Manual, Chapter 3–Modeling and Analysis; Hexagon: Osaka, Japan, 2022; pp. 30–48. [Google Scholar]
  22. ISO 19902; Petroleum and Natural Gas Industries-Fixed Steel Offshore Structures, Chapter 7-General Design Requirements, Structural Modeling and Analysis. International Organization for Standardization: Geneva, Switzerland, 2020; pp. 24–25.
  23. IACS. UR-Z10.2 Hull Surveys of Bulk Carriers, Chapter 2–Special Survey; International Association of Classification Societies: London, UK, 2023; pp. 12–16. [Google Scholar]
  24. DNV. DNV-CG-0129: Classification Guidelines—Buckling Strength of Plated Structures; DNV: Høvik, Norway, 2018. [Google Scholar]
  25. Portillo Juan, N.; Negro Valdecantos, V.; Troch, P. Advancing Artificial Intelligence in Ocean and Maritime Engineering: Trends, Progress, and Future Directions. Ocean Eng. 2025, 339, 122077. [Google Scholar] [CrossRef]
Figure 1. Collision between tugboat and MSC Aquarius container vessel [1].
Jmse 13 01523 g001
Figure 2. Container port berthing supported by tugboats (https://youtu.be/5hVCQWhjinY?feature=shared/; accessed on 15 July 2025).
Jmse 13 01523 g002
Figure 3. An example of Container Vessel (https://www.monthlymaritimekorea.com/news/articleView.html?idxno=7550/ accessed on 15 July 2025).
Jmse 13 01523 g003
Figure 4. Flowchart about analysis methodology.
Jmse 13 01523 g004
Figure 5. Drawing section around damage area.
Jmse 13 01523 g005
Figure 6. Plastic deformation cases around inner web plate.
Jmse 13 01523 g006
Figure 7. Stress–strain curve [20].
Jmse 13 01523 g007
Figure 8. FE-analysis model.
Jmse 13 01523 g008
Figure 9. Boundary and load conditions; (a) Boundary condition, (b) Load conditions (from Case 1 to Case 5).
Jmse 13 01523 g009
Figure 10. Measurement of plastic deformation at the critical area.
Jmse 13 01523 g010
Figure 11. The relationship between load and displacement under Case-1.
Jmse 13 01523 g011
Figure 12. Results of plastic strain, von-Mises stress and deformed shape contour at A point under Case-1; (a) Plastic strain, (b) von-Mises stress and (c) Deformation shape.
Jmse 13 01523 g012
Figure 13. The relationship between load and displacement under Case-2.
Jmse 13 01523 g013
Figure 14. Results of plastic strain, von-Mises stress and deformed shape contour at A point under Case-2; (a) Plastic strain, (b) von-Mises stress and (c) Deformation shape.
Jmse 13 01523 g014aJmse 13 01523 g014b
Figure 15. The relationship between load and displacement under Case-3.
Jmse 13 01523 g015
Figure 16. Results of plastic strain, von-Mises stress and deformed shape contour at A point under Case-3; (a) Plastic strain, (b) von-Mises stress and (c) Deformation shape.
Jmse 13 01523 g016aJmse 13 01523 g016b
Figure 17. The relationship between load and displacement under Case-4.
Jmse 13 01523 g017
Figure 18. Results of plastic strain, von-Mises stress and deformed shape contour at A point under Case-4; (a) Plastic strain, (b) von-Mises stress and (c) Deformation shape.
Jmse 13 01523 g018aJmse 13 01523 g018b
Figure 19. The relationship between load and displacement under Case-5.
Jmse 13 01523 g019
Figure 20. Results of plastic strain, von-Mises stress and deformed shape contour at A point under Case-5; (a) Plastic strain, (b) von-Mises stress and (c) Deformation shape.
Jmse 13 01523 g020
Figure 21. The relationship between load and displacement according to load cases.
Jmse 13 01523 g021
Figure 22. Comparison between actual deformation and FEA prediction at critical panel; (a) Case-1, (b) Case-2, (c) Case-3, (d) Case-4 and (e) Case-5.
Jmse 13 01523 g022
Figure 23. Determination of repair area throughout nonlinear FE-analysis; (a) −X direction, (b) +X direction.
Jmse 13 01523 g023aJmse 13 01523 g023b
Table 1. Principal dimensions of 7.3 K Container Vessel.
ItemValue
Length Between Perpendiculars286 m
Breadth40 m
Depth22 m
Draft12.5 m
Gross Tonnage92,000 ton
Dead Weight88,000 ton
Speed24 knots
MCR54,000 kW
Table 2. Principal dimensions of 7.3 K container vessel.
ItemNameE (MPa)νσY (MPa)
Web, Shell
Stiffener
S235206,0000.3235
S315315
S355355
where E is elastic modulus, ν is Poisson’s ratio and σY is yielding stress of material.
Table 3. Comparative results at the A point according to colliding cases.
Case No.Colliding LocationLoad Area (mm)Load (ton)Plastic Strain (%)
1FR.76 (Equal)500 by 5001802.6
2FR.76 (Eccentric)500 by 5001723.1
3FR.76 (Eccentric)500 by 5001702.3
4FR.76 (Equal)1000 by 10001942.7
5FR.76 (Line)-1952.9
Disclaimer/Publisher’s Note: The statements, opinions and data contained in all publications are solely those of the individual author(s) and contributor(s) and not of MDPI and/or the editor(s). MDPI and/or the editor(s) disclaim responsibility for any injury to people or property resulting from any ideas, methods, instructions or products referred to in the content.