Article

Nonlinear Effects on the Formation of Large Random Wave Events

by
George Spiliotopoulos
and
Vanessa Katsardi
*,†
Department of Civil Engineering, University of Thessaly, Pedion Areos, 383 33 Volos, Greece
*
Author to whom correspondence should be addressed.
These authors contributed equally to this work.
J. Mar. Sci. Eng. 2025, 13(8), 1516; https://doi.org/10.3390/jmse13081516
Submission received: 22 June 2025 / Revised: 2 August 2025 / Accepted: 3 August 2025 / Published: 6 August 2025
(This article belongs to the Section Ocean Engineering)

Abstract

This work aims to highlight the effects of nonlinearity on the crest shape of large directional water wave events. To simulate such events, we chose to focus frequencies on a pre-determined time step over a wavefield with randomised phases, running the simulations with HOS-ocean, a fully nonlinear potential flow solver. By also applying a phase separation scheme, we were able to identify the contributions of the various orders of nonlinearity to the formation of these large wave events. The findings show a significant change in the shape of these large water waves compared to linear theory, particularly in shallower water depth. In addition, the phase separation reveals the increased significance of high-order harmonics in finite water depths compared to deep water.

1. Introduction and Background

The area impacted by an extreme wave event is associated with both its crest height and width [1], which influence the stability and resilience of a marine structure or ship [2,3]. To accurately measure and anticipate the effects of extreme waves on these structures, a thorough understanding of the underlying physical principles is essential [4].
Extreme waves, commonly referred to as “freak” or “rogue” waves, have been a major focus of extensive research. There has been a lot of discussion about the mechanisms that lead to the formation of these extreme waves, with most researchers agreeing that they appear due to the focusing of the energy of the wavefield in some location and at some point in time. Indeed, the analysis of a large series of field data has proven that their occurrence is mostly due to dispersive focusing, e.g., [5]. Therefore, it is difficult to encounter them without considering both space and time [6,7]. Ref. [8] provided two definitions for rogue waves by identifying thresholds for their wave height, H / H s 2 , and crest height, η c / H s 1.25 , where H s is the significant wave height. In this study, the waves that will be simulated will comfortably exceed these thresholds.
“Walls of water”, or wave groups that become significantly long-crested, have been investigated thoroughly in deep water [9,10]. Indeed, refs. [9,10] simulated nonlinear deep-water directional waves using the modified nonlinear Schrödinger equation (MNSE). They simulated extreme waves both by focusing the underlying frequency components at a certain point in time and space (hereafter referred to as “focused” wave groups) and by detecting extreme wave events within wavefields that involve randomised phasing of the underlying components (hereafter referred to as extreme “random” wave events). Extreme waves that form “walls of water” have been also previously numerically identified by [11,12,13], with the latter characterising them as a “V-shaped” crest. In our recent work [14], we verified the above findings, but only for “focused” wave events, considering the HOS-ocean model [15], a fully nonlinear model that is able to simulate the propagation and evolution of wavefields in space and time, involving a directional broad-banded energy distribution in the various frequencies, without the limitations of a narrow-banded model, such as the MNSE. The results of our directional simulations, involving real ocean simulations in both infinite and finite water depths, indicate that an increase in steepness is associated with a widening of the width of the nonlinear crest. Therefore, it was shown that “walls of water” can also occur in finite water depths when considering “focused” waves.
This paper will first examine whether the findings of [9,10] for extreme “random” wave events in deep water are verified with the use of the HOS-ocean model and whether they also apply to finite water depths. Although previous simulations [14] have identified changes in the shape of the extreme crest for a “focused” wave (their simulations were conducted with nonlinear “focused” NewWave wave events [16] or alternatively quasi-determinism theory [17]), questions remain regarding extreme waves that occur within a random wavefield. This paper aims to fill this gap.
Furthermore, “walls of water” were observed more prominently for extreme “focused” events in intermediate water depths ( k p d < 1.2 , wherein k p denotes the wave number corresponding to the spectral peak and d is the water depth) compared to deep waters [14]. Also, as the effective water depth reduces, dispersive focusing is gradually attenuated, leading to a degradation in the focal quality of substantial wave events. This effect becomes increasingly pronounced with the increase in wave steepness, engendering consequential alterations in the phase angles of the frequencies involved. The increased surface elevations, as compared to linear theory, identified in some cases in deep water, are not consistently present in intermediate water [14,18,19]. In these papers, the authors analysed unidirectional or long-crested wavefields (characterised by a relatively narrow directional spread), with an effective water depth defined as k p d = 0.86; a value well beyond the intermediate water depth limit. The present paper shows that nonlinear crest elevations of rogue waves do not always appear to be increased compared to linear theory when they are detected within a random wavefield in both deep and intermediate water due to the phase alterations that take place during the wavefield evolution.
This research also investigates the physics of extreme wave formation. Previous research has demonstrated that in deep water, proximate to the genesis of a significant focused event, rapid changes occur, accompanied by pronounced energy transfers as discernible in the associated wave spectrum [20,21,22]. Such changes cannot be accounted for by weakly nonlinear models; however, third-order nonlinearity proves adequate for their characterization. This becomes increasingly apparent in wavefields exhibiting a relatively large directional spread, where wave–wave interactions are attenuated due to the dispersion of energy across multiple propagation directions, resulting in the non-alignment of various frequency components attributable to the directional spread [21]. However, it has been shown in [14,18,19] that during the formation of a large nonlinear “focused” event at finite water depths, whether for unidirectional or directional wavefields, third-order nonlinearity is inadequate to depict the evolution or the shape of these wave events and their underlying energy spectra. By separating the nonlinear harmonics of highly nonlinear extreme waves, the underlying physics of their formation and evolution can be revealed. This study focuses on the processes that contribute to the formation of extreme “random” sea waves in both deep and intermediate water, emphasising the importance of incorporating physics beyond linear theory. In fact, this study will use the harmonic separation presented in [14] where the methodologies outlined in [23,24] are combined, with expansion extending up to the sixth harmonic order, which proved to be particularly necessary in finite water depths [14]. An evaluation of the applicability of up to sixth-order effects on the development of extreme waves within randomised wavefields both in deep and intermediate waters is also conducted here for the first time.

2. Methodology and Setup

2.1. Wave Modelling

HOS-ocean [15] is an open-source fully nonlinear potential flow model that simulates the evolution of a fully nonlinear random wavefield, incorporating the wave energy spread in both the various frequencies and the various directions, without any narrow-banded assumptions. It is based on the High-Order Spectral method presented in the original work of [25,26].

2.2. Initial Conditions and Setup

The sea state is represented at the input through a JONSWAP spectrum [27] characterised by a peak period of T p = 10 s and a peak enhancement factor of γ = 2.5 . Subsequently, all frequency components are directionally distributed using a ( θ ) = λ cos 2 s ( θ / 2 ) , wherein a denotes the proportion of the total amplitude that propagates at an angle θ relative to the mean direction, with λ serving as a normalising coefficient and s being the spreading parameter as per [28]. A characteristic spreading parameter for deep water is s = 10 [29] and for intermediate water (herein k p f d = 0.864 ) is s = 45 , corresponding to a more long-crested wavefield propagating in shallower water due to refraction [30,31]. k p f is defined as the input peak wavenumber, obtained through the application of the linear dispersion relation to the peak period of the input frequency spectrum. This serves to distinguish it from k p , defined as the peak wavenumber of the discretised input spectrum, which may exhibit slight discrepancies from k p f as a result of the discretisation process within the HOS-ocean model. This setup was obtained by focusing part of the energy at a pre-determined point in space and time, but not the whole energy of the domain, as in the case of a perfectly focused wave.
The simulation starts from setting it up using linear theory. In particular, HOS-ocean utilizes a “relaxation” period, in the end of which the simulation is fully nonlinear. This means that the model effectively introduces the nonlinearity gradually into the simulation scheme, thus avoiding the need for second-order initial conditions. The relaxation period chosen was 10 T p . Regarding the time that the simulation needs to start, we need to ensure that the wavefield is sufficiently dispersed. The wavefield is run backward linearly and then nonlinearly forward again. Since the simulations, in the present paper, are random, the wavefield is dispersed much more rapidly than in a “focused” wave simulation. Indeed, similar research has shown that 10 T p backwards is a sufficient compromise intended to capture all the nonlinear changes while maintaining the identity of particular wave groups [9]. In this study, each run in this paper was linearly propagated backward for 20 T p = 200 s before being propagated forward nonlinearly, and hence it includes the 10 T p relaxation period and the 10 T p necessary for a dispersed random wavefield.
In this work, the simulation of random wavefields involves only random input phases and not random input amplitudes. To create a pre-determined extreme event, we chose to narrow the range of random numbers [ 0 , 2 π ] for the initial phases of the input spectrum that is used for the creation of a random irregular wave train [13]. Therefore, the more this interval is narrowed, i.e., to [ 0 , 1.9 π ] , the larger the extreme event becomes. This facilitates the occurrence of a large wave crest because of the (non-perfect) focusing of some underlying frequency components at a point in space and time which we can pre-determine. However, if this interval narrows excessively, i.e., to less than [ 0 , 1.8 π ] , the randomness of the wavefield is practically lost and the large event will resemble a forced focused wave event. Hence, a compromise should be made in order to keep a random wavefield within which a pre-determined wave crest occurs. We define the upper limit of this range as θ r and choose the appropriate upper limit to create the desired linear crest height η l m a x . This methodology eliminates the need for extended random simulations in the search for an extreme wave event without losing the randomness of the wavefield. As will be shown in this work, very large wave crests other than the pre-determined one may occur at unexpected points in space and time within the chosen random simulation.
In this study, we tried to create large events, within a random wavefield, that correspond to the same linear maximum crest height, η l m a x , with the linear, perfectly focused, cases examined previously in [14] for comparison purposes. To also examine the behaviour between these steepness levels, the intermediary steepness of η l m a x = 6.75 was also simulated for both deep water and k p f d = 0.864 . Our main commentary will be provided on the edge cases, but the intermediate case offers additional validation of the nonlinear effects as steepness increases. Six random wavefields were examined, three for infinite waters and three for finite water depths, which evolved toward the creation of the linear maximum crest height, η l m a x . The input parameters for each simulation are shown in Table 1, where θ r 1.924 π is chosen for the input phasing of the underlying components, which is a very small divergence from the fully random wavefield which corresponds to θ r = 2 π . It is important to note that the same seed (the same sequence of “random” numbers) was kept for the phases in each simulation to facilitate comparisons. The random wavefields are characterised by a steepness ranging between H s k p f / 2 0.05 and H s k p / 2 0.12 , evolving to an η l m a x = 4 m to η l m a x = 9.5 m, respectively (Table 1). In effect, they involve a nonlinear and a highly nonlinear wavefield and the exact intermediary between them in both infinite and finite water depths. However, since the largest crest occurs because of the overlapping of some wave components at a point in space and time, it is expected to be, locally, highly nonlinear, with local crest steepnesses ranging between η l m a x k p f = 0.16 and 0.55 . Indeed, the corresponding η l m a x to significant wave heights ratio is well over the 1.25 threshold for a rogue wave [8].
The frequency amplitude spectrum was used as an input for HOS-ocean and then converted to a wavenumber spectrum. Note that all amplitude spectrum plots presented in this paper were normalised to the input amplitude corresponding to the peak wavenumber, k p . Due to the phase separation used, each simulation was rerun with 11 different phase shifts.
The discretization of the periodic domain was taken as N x = 1024 and N y = 256 for the x and y directions, respectively, with x being the propagation axis, corresponding to a wave frequency of 512 and directional frequency of 256, respectively. The reasons for the above choices are twofold: first, a fine discretization of the domain is essential to ensure energy conservation throughout the evolution of the wavefield (energy error less than 0.1%), and second, this ensures the adequate dispersion of wave energy in the wavefield without filtering or cutting any real energy transferred toward high-order frequencies in both infinite and finite water simulations. However, there has to be a limit of ∼ 8 k p in the frequency range to avoid spurious high-frequency interactions in random simulations [32]. The corresponding domain lengths that simultaneously fulfill the above limitations are L x = 10,000 m and L y = 5000 m (∼ 64 l p and ∼ 32 l p , where l p is the wavelength corresponding to k p ) for deep water and L x = 7000 m and L y = 7000 m (∼ 64 l p and ∼ 64 l p ) for k p f d = 0.864 .
Furthermore, in HOS-ocean, the one-dimensional potential is expressed as a Taylor series expansion about z = 0 , where z = η ( x , y , t ) ; M defines the number of terms included in this series expansion. To underscore the significance of nonlinearity, both linear and nonlinear simulations were executed. Specifically, linear simulations were conducted by compiling and executing a binary of HOS-ocean with an HOS order of M = 1 , corresponding to a Linear Random Wave Theory (LRWT) simulation. In contrast, an HOS order of M = 5 , which is indicative of a higher degree of nonlinearity, was considered appropriate for the nonlinear simulations. It should be noted that M = 5 has previously been proven to be appropriate and adequate for the simulation of highly nonlinear wavefields of similar, if not larger, steepness to our simulations [13,15].

2.3. Nonlinear Harmonic Separation

The distinct separation of nonlinear harmonics facilitates a comprehensive understanding of wavefield evolution, underscores the imperative of employing highly nonlinear wave models for describing extreme events, and delineates the structural distinctions between findings related to extreme wave propagation in infinite versus finite water depths.
According to Fenton [33], up to the 6th order, the Stokes expansion for monochromatic waves gives
η ( θ ) = f 11 A c o s ( θ ) + f 20 A 2 + f 22 A 2 c o s ( 2 θ ) + f 31 A 3 c o s ( θ ) + f 33 A 3 c o s ( 3 θ ) + f 40 A 4 + f 42 A 4 c o s ( 2 θ ) + f 44 A 4 c o s ( 4 θ ) + f 51 A 5 c o s ( θ ) + f 53 A 5 c o s ( 3 θ ) + f 55 A 5 c o s ( 5 θ ) + f 60 A 6 + f 62 A 6 c o s ( 2 θ ) + f 64 A 6 c o s ( 4 θ ) + f 66 A 6 c o s ( 6 θ ) + O ( A 7 )
with A , θ being the amplitude and phase of the wave group and f i j the coefficients in the expansion.
The nonlinear wave harmonics of Fenton, as observed in the unsteady wavefields under consideration, can be extracted through the combination of the methodologies outlined in [23,24], with expansion extending up to the sixth harmonic order, as described in [14]. The ability to separate nonlinear harmonics to a higher degree allows the better understanding of nonlinear wave dynamics, particularly in intermediate water where the effects of higher-order harmonics are more pronounced [14,19]. It has been proven [14] that in finite water depths, even the sixth harmonic is important, and this is the reason why the above scheme is used in this paper. The extraction of coefficients associated with differing harmonics involves the development of combinations derived from 12 phase-shifted simulations, ranging from 0° to 330° at intervals of 30°. The full set of simulations for each case (all 12 nonlinear phase-shifts and the linear solution) takes almost 20 h when run on a regular modern PC. The method is explained in detail in Appendix A.

3. Results

The simulations reveal the impact of nonlinearity on wave propagation and how it induces changes in the shape of large waves. In our previous work [14,34], the simulation of the evolution of perfectly focused wave groups allowed a better evaluation of the changes induced in a single wave group, and therefore it was easier to quantify the alterations that were caused by nonlinearity through measurements of crest width and crest area. In this paper, due to random wavefields, it is almost impossible to assess the edges of each crest, and consequently, the alterations are presented in a primarily visual manner through the use of pseudo-color plots.

3.1. Changes in the Crest Width

Figure 1 and Figure 2 are pseudo-color plots of the surface elevations of each of the cases described in Table 1 at the time when the maximum surface elevation occurs for each simulation. The surface elevation in these plots is normalised with respect to the linear maximum surface elevation η l m a x (Table 1). Plot (a) corresponds to the linear simulation and plots (b), (c), and (d) to the gradually nonlinear cases (4 m < η l m a x < 9.5 m), allowing the gradual visualisation of the effects of nonlinearity at the formation of the large event within a random wavefield. The plots are centered only on the largest event. In fact, only 4 l p in both x , y axes is presented while the random simulation involved a domain of 64 l p and 32 l p in x , y for deep water and 64 l p and 64 l p in x , y for intermediate water.
The comparisons shown in Figure 1 and Figure 2 show the increase in crest width around the peak of the crest that is more significant as the steepness increases and/or the water depth reduces. It is worth mentioning here that for each water depth, the appropriate directional spread has been chosen which is associated with a short-crested and more long-crested random wavefield in infinite and finite water depth, respectively. This difference is evident in these plots. In any case, the main observation that arises from all simulations is that nonlinear crests are always wider than the corresponding linear ones and they become wider and “thinner“ as nonlinearity increases. Thus, it is not surprising that the largest increase in crest width, compared to linear calculations (in effect a “wall of water”), occurs for the steeper sea states and lower directional spreads (Figure 2c,d). This was also observed in [34], where the effect of directional spread in the formation of large focused events was investigated, and also in the extensive study of [10] which involved random simulations using the MNSE. For finite water depth cases in particular, it is interesting to note the progressive change in the neighbouring troughs of the large event that become progressively shallower as steepness increases.
However, there is a consistent reduction in the maximum crest height of the largest wave that becomes more significant as nonlinearity increases and/or water depth reduces. Nevertheless, this does not represent all the large waves that occur within the random simulation. Although crest heights will be investigated in Section 3.3, it is worth noting the increase in crest height, compared to the linear simulation, that is observed for the wave next to the largest event in Figure 1 (at ( 0 , 1 l p ) ). The visualisation of the changes in the crest shape is assisted by Figure 3 and Figure 4 where the upper peak wave envelopes which correspond to Figure 1 and Figure 2 are shown as pseudo-color plots normalised with respect to η l m a x .

3.2. Time and Frequency Domain Analysis

Due to the random nature of the simulations, the rest of the analysis was conducted in the time domain to assess the evolution of the wave group that leads to the highest crest. Therefore, we specified the ( x , y ) = ( x l m a x , y l m a x ) and ( x , y ) = ( x n l m a x , y n l m a x ) coordinates where the linear and the nonlinear maximum crest height, η l m a x and η n l m a x , occur, respectively. The exact coordinates of these events are shown in Table 2. Then, we extracted the time history of the free surface elevation at these points for both linear and nonlinear simulations. Figure 5 shows the nonlinear time series at ( x n l m a x , y n l m a x ) and the linear time series at both ( x l m a x , y l m a x ) and ( x n l m a x , y n l m a x ) . For further analysis, only a range of 10 T p before and after the linear η l m a x is used. This way, the first 10 T p of the simulation (which starts at 20 T p , as explained in Section 2.2) used as a relaxation period that gradually introduces nonlinearity is excluded from the frequency domain analysis.
In all plots shown in Figure 5, the surface elevation of both the linear and nonlinear simulations (black and red lines), corresponding to ( x n l m a x , y n l m a x ) , at 10 < t / T p < 7 is identical. The wavefield is still dispersed enough within this time period, and hence the wave–wave interactions are still linear. After that, nonlinearity gradually causes alterations in the phase and amplitude of the frequency components. As expected, these alterations are smaller for the nonlinear cases shown in Figure 5a,c, and the time window where the two time series are identical last longer ( 10 < t / T p < 3 ). Also, in these cases, the linear simulation (cyan line), corresponding to ( x l m a x , y l m a x ) , is very similar to the nonlinear simulation, with the larger discrepancies shown for finite water depths (Figure 5c). On the other hand, once nonlinearity kicks in at t / T p > 7, for the highly nonlinear cases (Figure 5b,d), the nonlinear time series displayed is very different from the linear one. This is caused by the significant transfer of energy to higher frequencies due to wave–wave interactions, the latter leading to wave energy propagating with increased phase velocity compared to the linear simulations, where no energy transfers take place. Indeed, these phasing alterations, caused by nonlinearity, are significant enough to create waves much different than the linear ones, especially in the finite water case (Figure 5d).
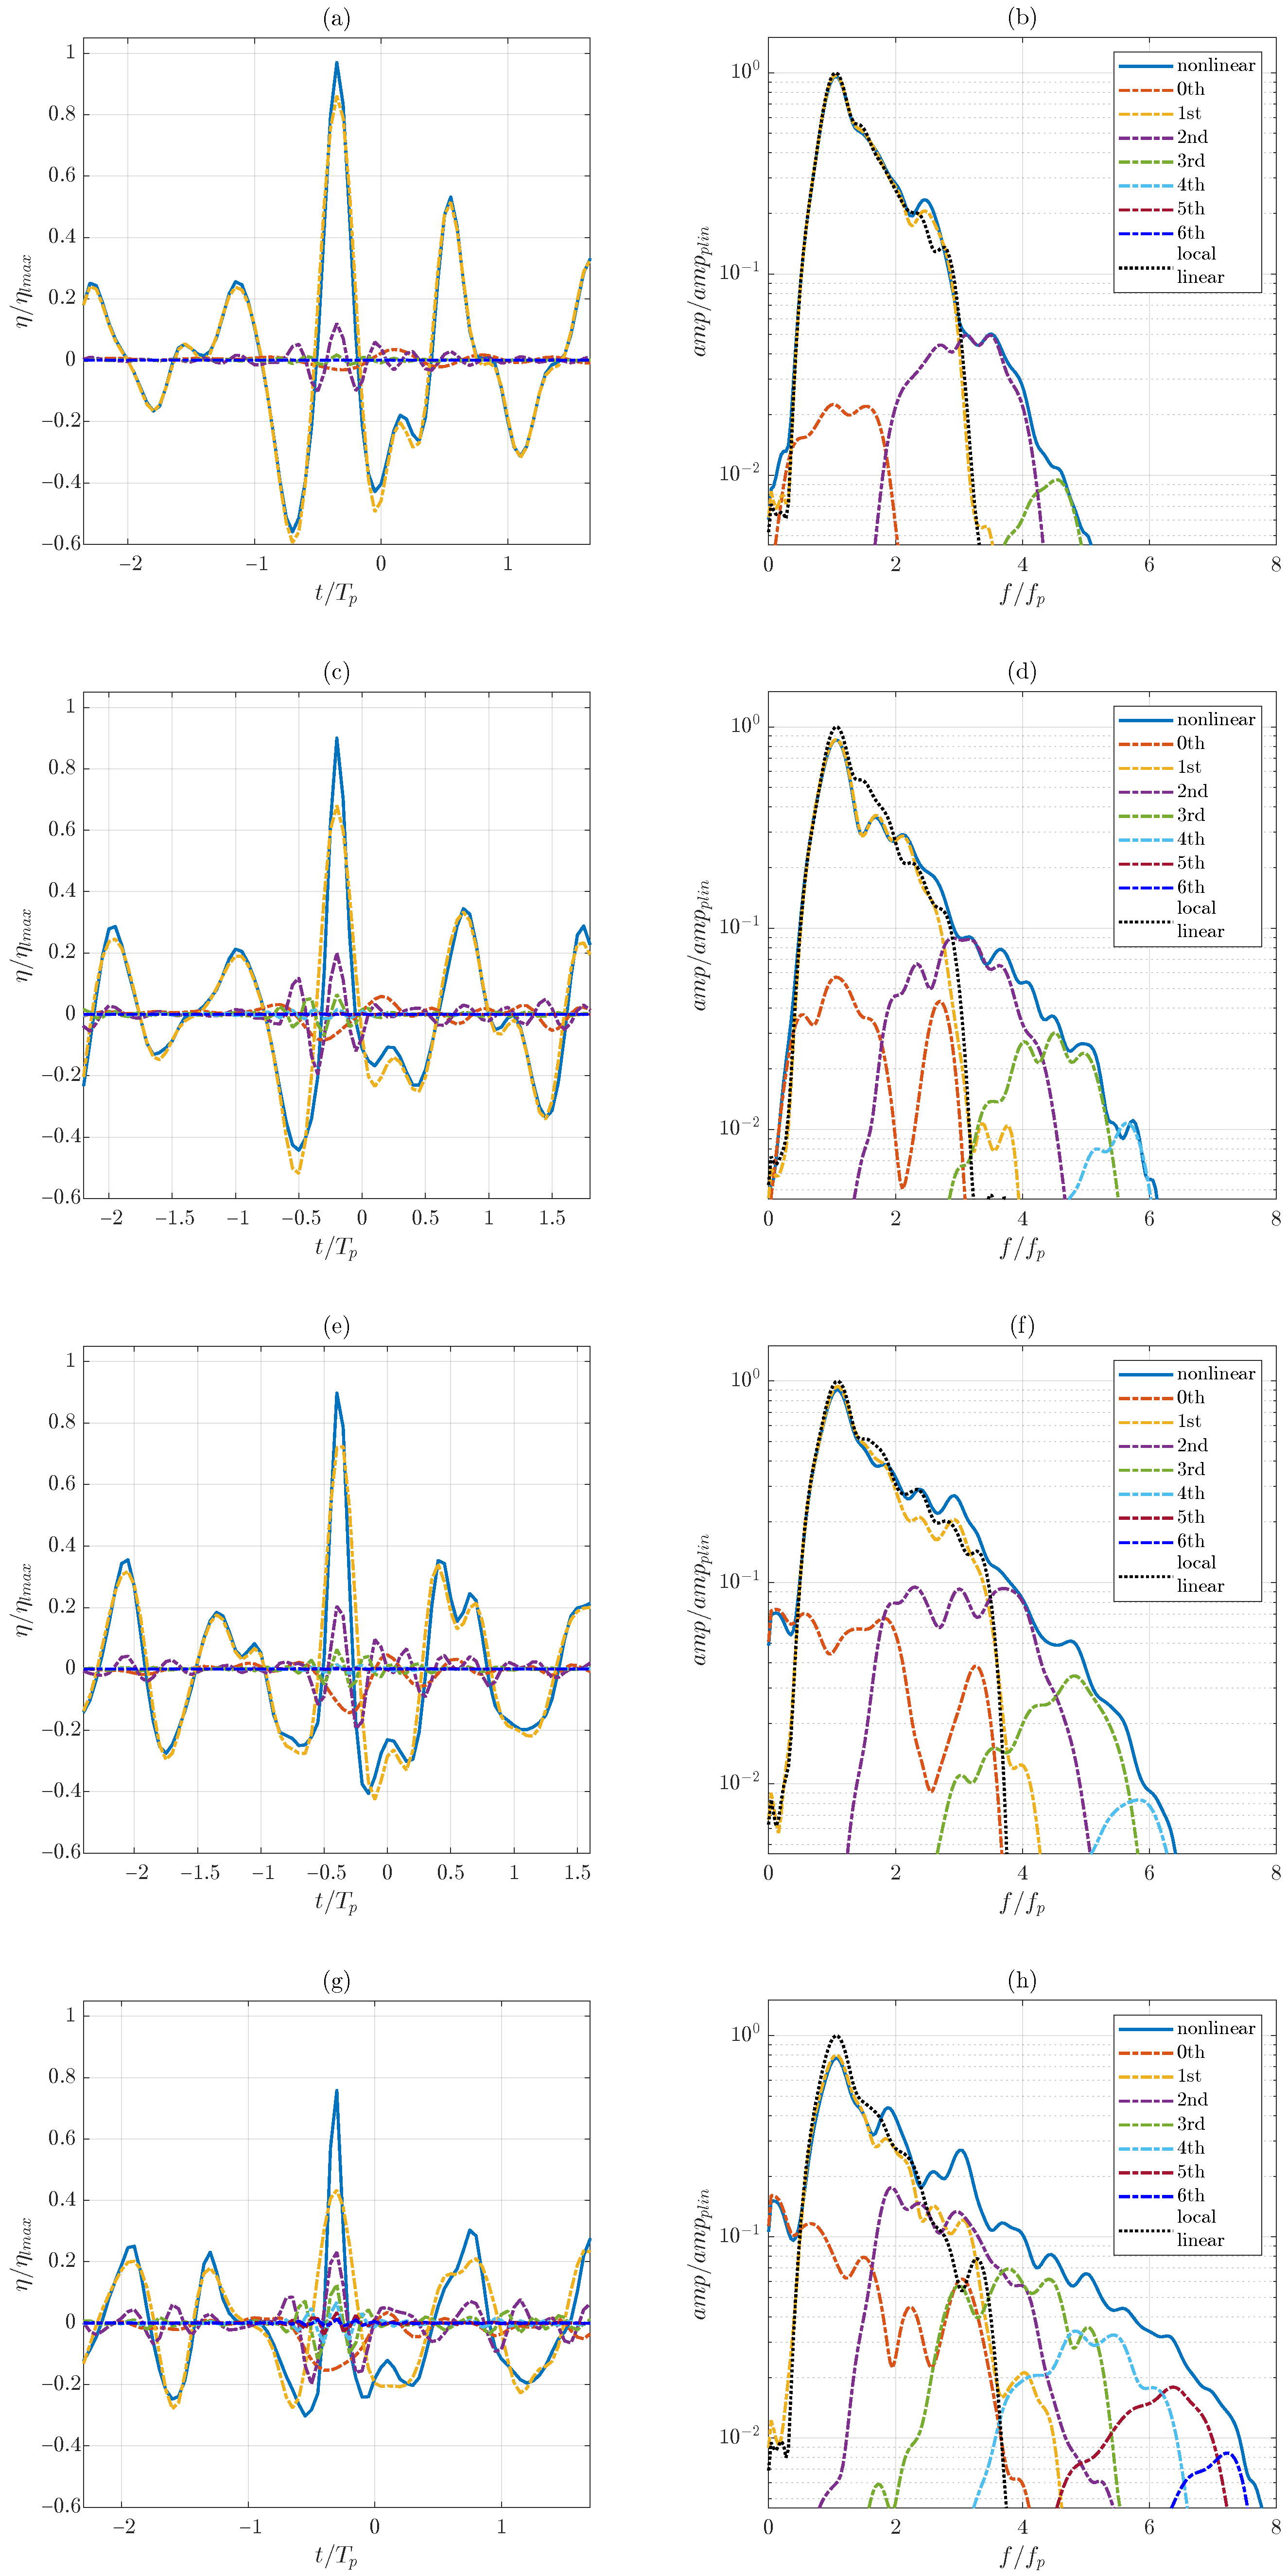
To further delve into the different orders of nonlinearity and their influence on the formation of the large event, we use the harmonic separation scheme of [14] and we derive the harmonics separated up to the sixth order. The scheme is applied in a 10 < t / T p < 10 window of time series as explained earlier in this section. What is noted in Figure 6 is the gradual increase in importance of higher-order harmonics as nonlinearity increases, either via steepness or via the reduction in water depth. Indeed, nonlinearity up to the second order is more or less enough to describe the large wave corresponding to the least nonlinear wavefield ( η l m a x = 4.0 m, Figure 6a,b) as the third-order components are of the order of O ( 10 2 ) . As the zeroth-order terms (in effect the difference terms) are out of phase, and the second-order terms (in effect the sum terms) are in phase, it is not surprising that the η l m a x and η n l m a x are very similar (Table 2, Figure 5a). With the increase in steepness ( η l m a x = 9.5 m), the deep water large wave requires at least up to the third order of harmonics to be fully described (Figure 5c,d). This is consistent with the findings of [14], where the third order of nonlinearity was found to be important for a deep water “focused” event with the same η l m a x = 9.5 m, albeit involving a wavefield characterised by a smaller directional spread. The phasing of the components involved at the formation of this deep water large wave is such that leads to smaller η n l m a x compared to η l m a x . Generally, as the overall steepness of the wavefield is increased, the ratio of η n l m a x / η l m a x decreases (Table 2), with the intermediate case η l m a x = 6.75 m being closer to the steepest case η l m a x = 9.5 m. The effect is even more pronounced in finite water depths.
In particular, in Figure 6e–h, the finite water cases are presented. The η l m a x = 4.0 m finite water case (Figure 6e,f) needs the same order of nonlinearity to be described as the η l m a x = 9.5 m deep water case (Figure 6c,d) with fourth-order harmonics being almost of the order of O ( 10 2 ) . This is despite the fact that the overall steepness of the wavefield and the local linear crest steepness ( H s k p f , η l m a x k p f , Table 1) are smaller. This enhances the notion that the decrease in water depth is somewhat equivalent with an increase in nonlinearity, and hence wave steepness alone cannot express this effect. Last, in Figure 6g,h, the amplitude of the sixth-order harmonic is almost as significant as the fourth order of the middle cases (Figure 6c–f) and as significant as the third-order amplitude of the least nonlinear case (Figure 6a,b), meaning that nonlinearity of at least up to the fifth order is required to describe a very steep wave in finite water depths. The same conclusion was derived through the focused simulations in [14], and confirms the usefulness of using focused waves to analyse the effects of nonlinearity. Looking at those relevant focused simulations, within a wavefield of the same directional spread ( s = 45 ), the importance of the various harmonic orders are of the same order of magnitude, with the orders 4 of the present random simulations being slightly larger than the corresponding focused simulations.
Furthermore, when compared to the corresponding linear spectrum at the same location, a gradual change in the evolution characteristics can be observed with the increase in wave steepness and/or the decrease in the effective water depth. For the least nonlinear case (Figure 5b), the first-order harmonic hardly differs from the linear spectrum and the nonlinear spectrum becomes broader, reflecting the largest η m a x / η l m a x ratios shown in Table 2. However, in Figure 6d–h, the spectrum becomes narrower around the peak of the spectrum, but broader overall with the contributions of the various harmonics becoming gradually more significant. It should be noted that the linear spectrum presented in this figure corresponds to each specific location of the extreme event.
Finally, we would like to draw attention to 0th-order harmonics. Apart from the least nonlinear case (Figure 5b), in all other cases, a second bump appears at the 0th harmonic between 2 < f / f p < 3 in deep water and between 3 < f / f p < 4 in the two finite water cases, always within the first order harmonic limits. These bumps are not related with the corresponding local linear spectra, and therefore they are free-wave components associated with at least fourth-order harmonics (this is why it does not appear at the first case). This can be also found in the very long unidirectional random simulations performed by [22,35] in infinite and finite waters, and at very similar frequency locations. This finding indicates that these free waves within the 0th harmonic are also relevant in random simulations involving a directional spread.

3.3. Changes in Crest Height

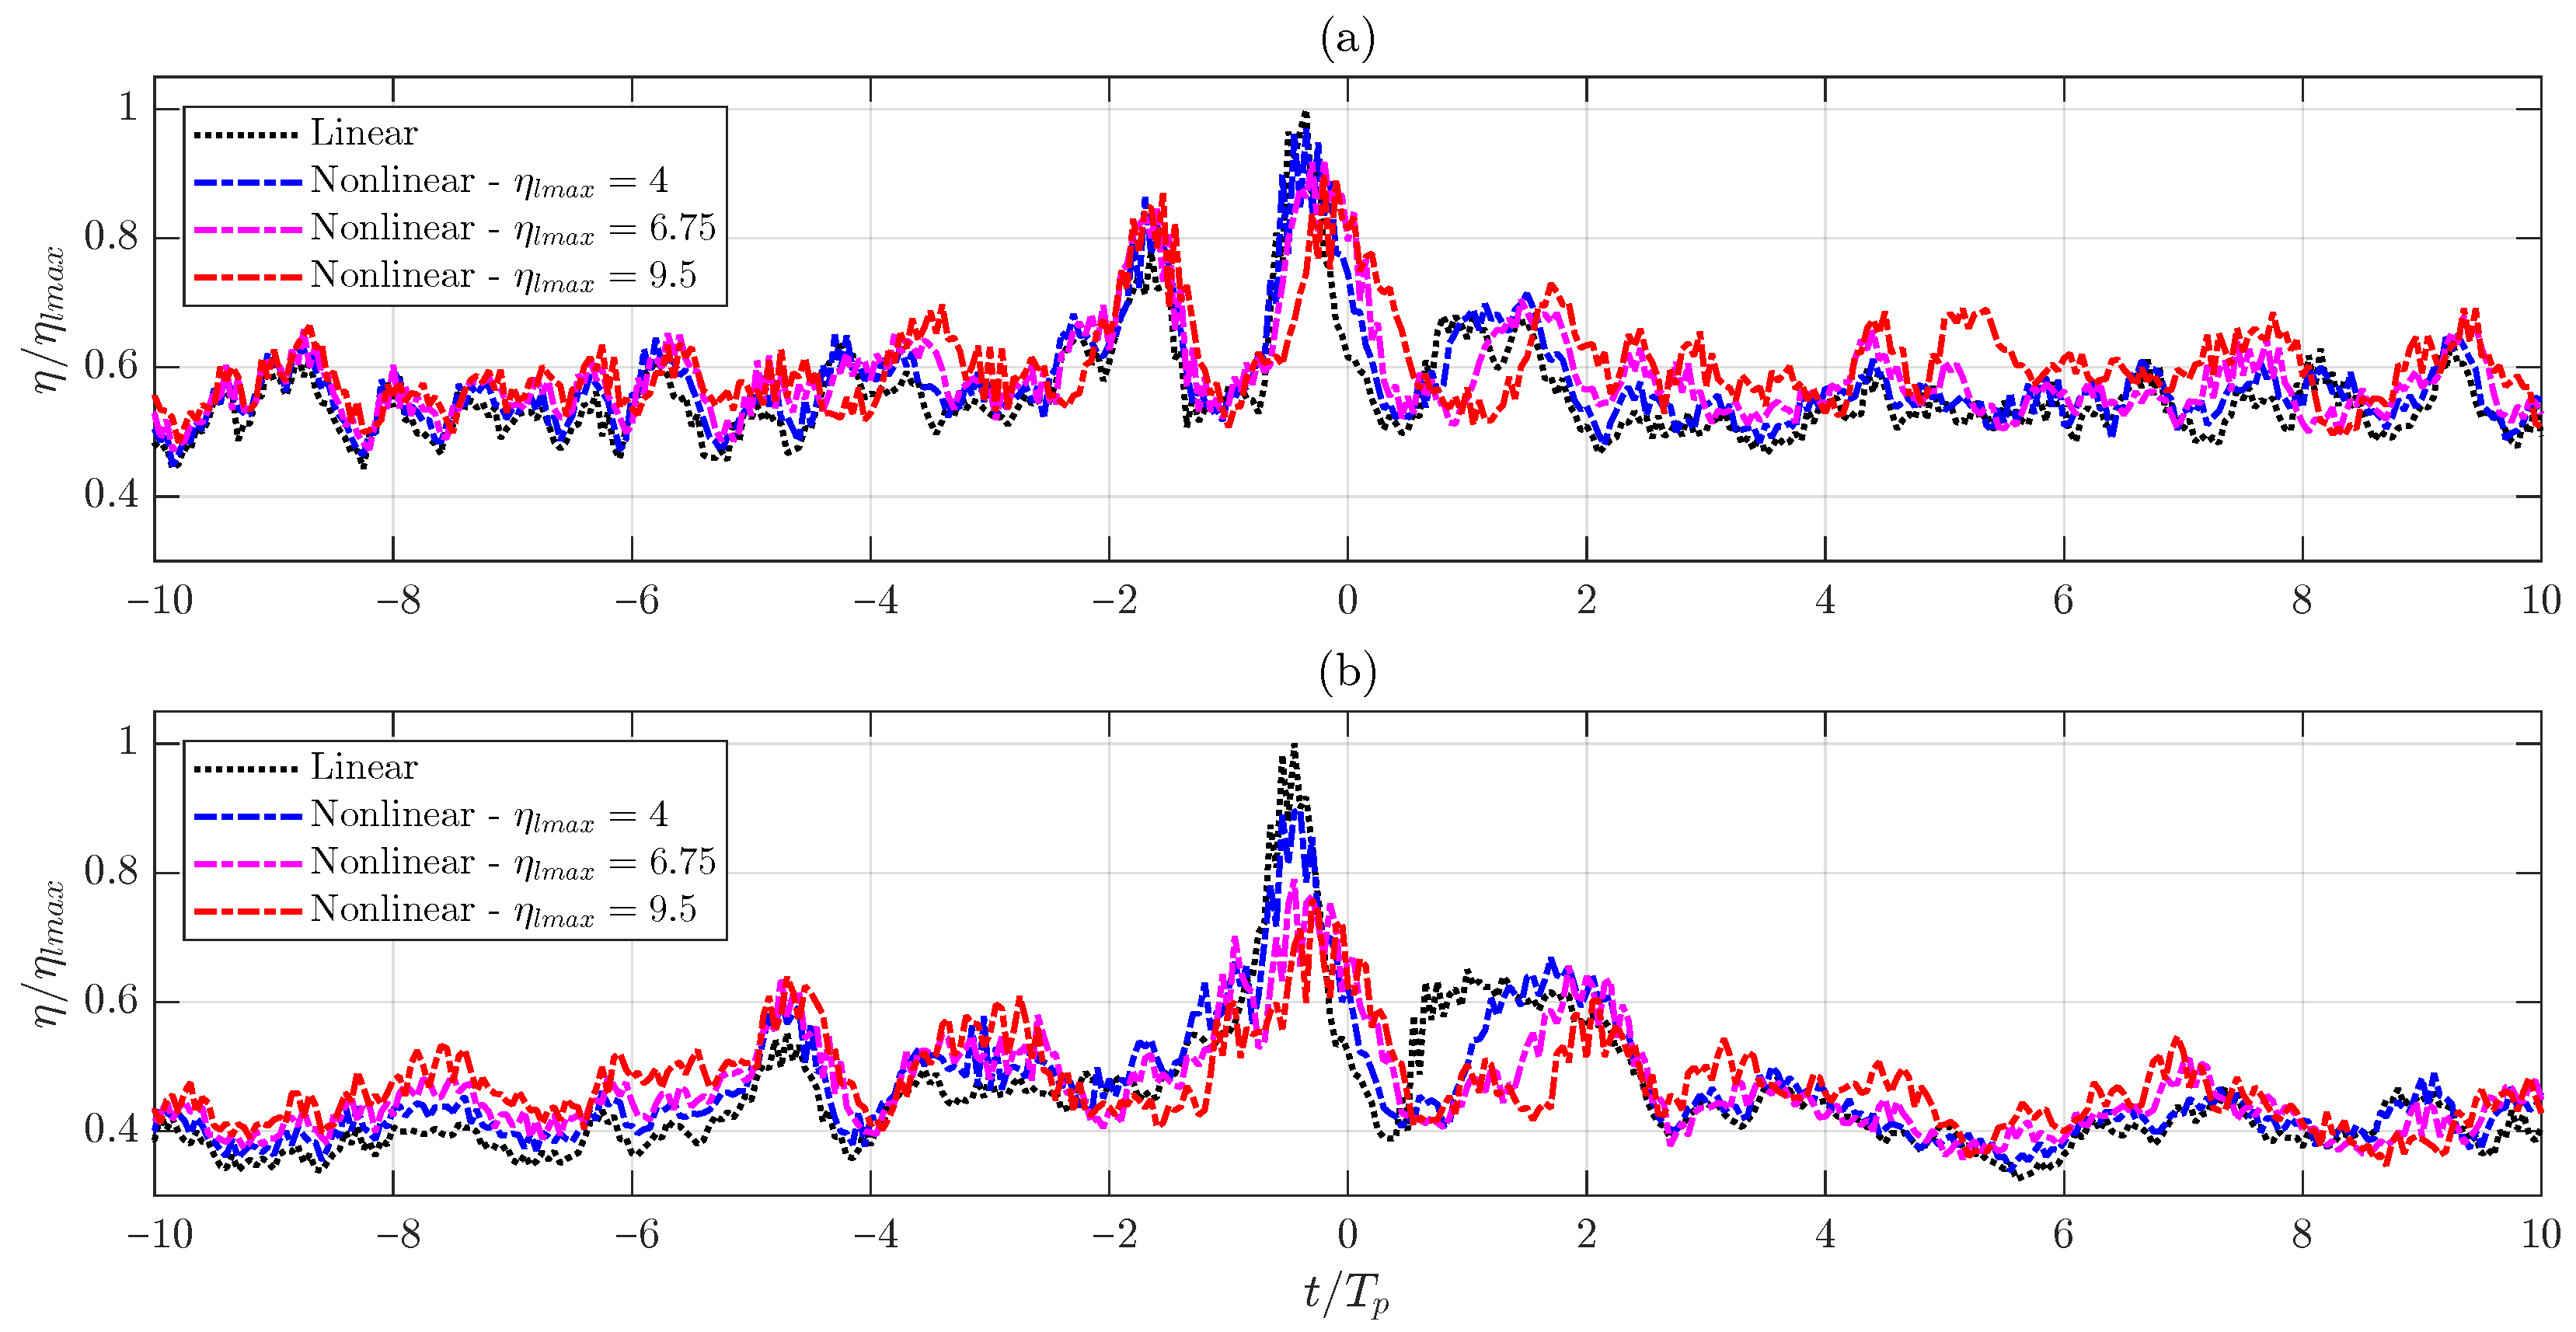
The consensus is that the inclusion of nonlinearity should increase the wave’s crest height. However, all nonlinear maximum surface elevations η n l m a x in the vicinity of the linearly expected maximum crest were smaller than η l m a x . The phasing alterations as shown previously were the main factor for this change, as energy transfers to higher-order harmonics cause such changes that the identity of the wave group is no longer the same. These alterations in the wave spectrum affect the whole domain and time simulations and not only the pre-determined extreme wave. This means that other waves appear larger when calculated nonlinearly and others appear smaller. For example, in Figure 7, we show the time series of the maximum crest height η l m a x ( t ) and η n l m a x ( t ) at ( x , y n l m a x ) with x taking any value within the L x . This means that these plots include the η n l m a x ( t ) at ( x n l m a x , y n l m a x ) . The plots include the linear and all three nonlinear simulations in deep (a) and intermediate water (b), respectively. Through this view, we see that in the nonlinear simulations (blue, magenta, and red lines), at the vast majority of the time steps, the maximum crest height is larger than the linear equivalent at the same time. So, the wavefield, at least for the ( x , y n l m a x ) section, experiences the consequences of the increase in nonlinearity with larger crest heights compared to linear theory. The behaviour is consistent in both deep and intermediate waters and it is also apparent in the least nonlinear case ( η l m a x = 4.0 , deep water, Figure 7a, blue line). As expected, the larger variations from linear predictions are shown for the most nonlinear case ( η l m a x = 9.5 , k p f d = 0.864 , Figure 7b, red line). In addition, the increases are gradual and relevant to the increases in the overall wavefield steepness.
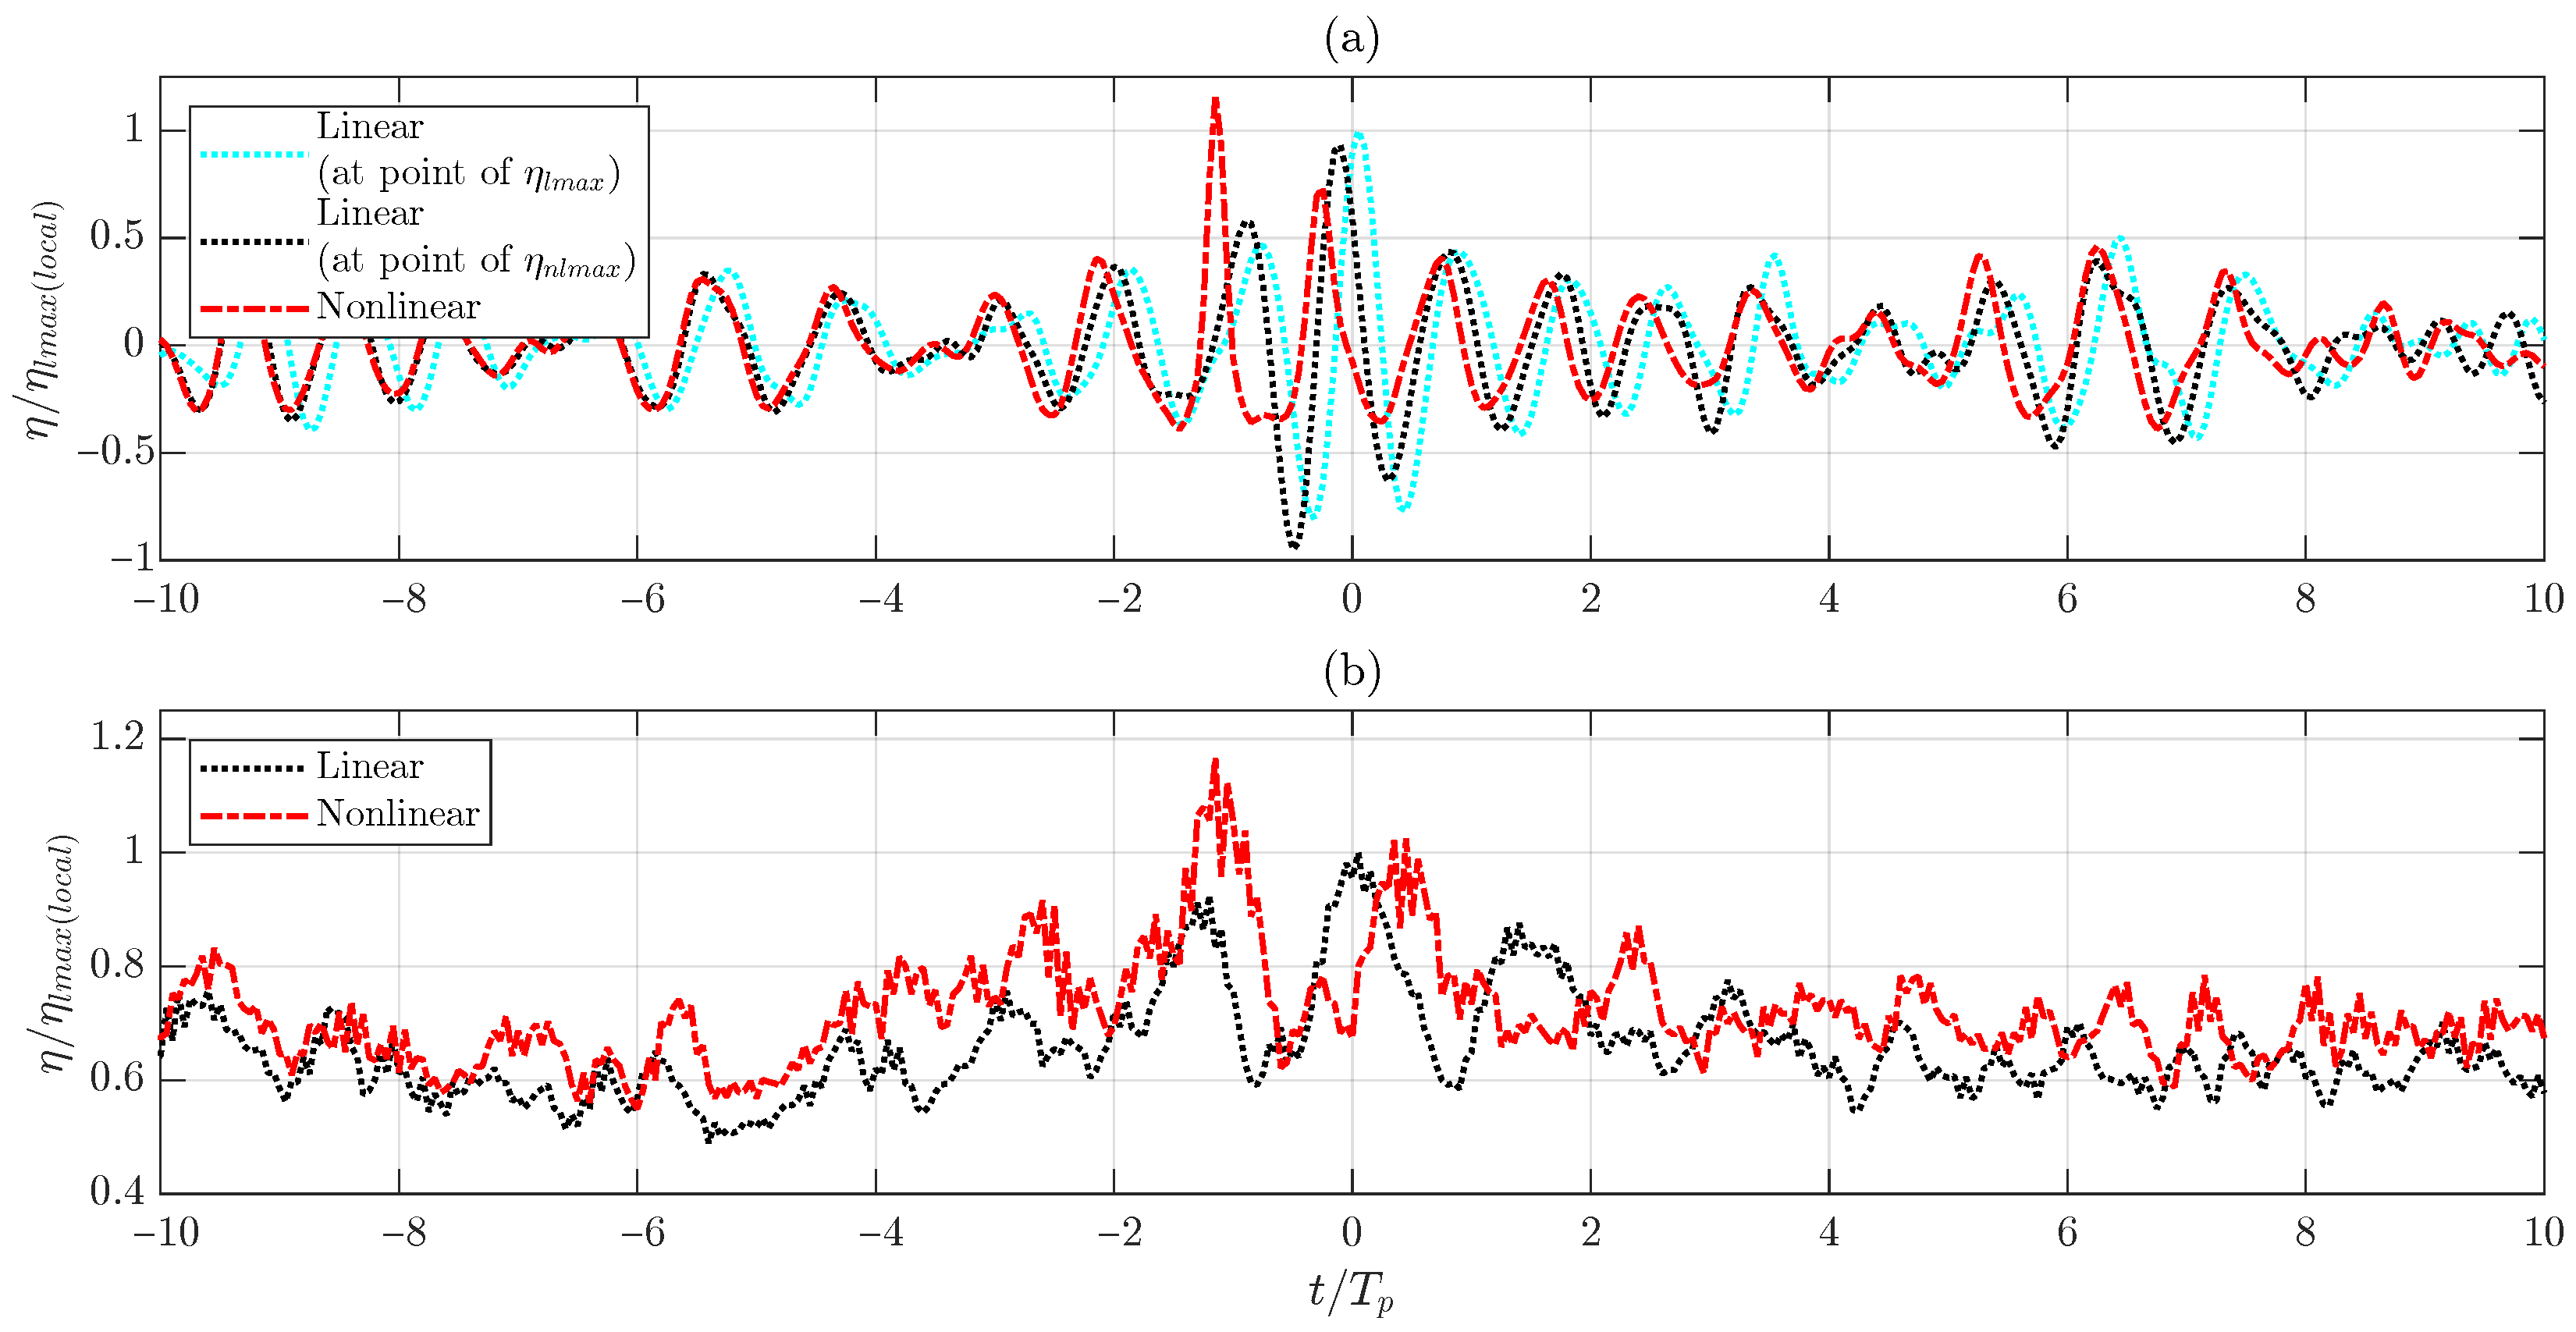
To further demonstrate this, Figure 8a shows the difference (%) between the nonlinear and the linear simulation for the steepest case in finite water depth. The nonlinear crest elevation is larger (up to ∼40%) than the linear one for the first 8 T p of the simulation (after the relaxation period). This difference becomes negative for 2 T p < t < 0 with the minimum value appearing at the time of the occurrence of the large event, only to become the maximum positive value almost immediately afterwords. The latter sudden changes reinforce our arguments that the nonlinear large events appear smaller than the linear ones due to the large energy transfers in the spectrum and the phase changes; both of which become larger as the wave becomes more nonlinear. Following the large event, the behaviour of the difference for 0 < t < 10 T p is somewhat symmetric to 10 T p < t < 0 , which is expected due to the defocusing of the large event.
What is particularly interesting is that the nonlinear preceding large wave before the maximum is always larger than the linear equivalent (at t / T p 1.8 for deep water and at t / T p 3.0 for k p f d = 0.864 , Figure 7 and Figure 8). This behaviour is also seen in focused waves, where the nonlinear maximum actually occurs at the time of the preceding large wave and not at the linearly expected time [14].
To illustrate the nonlinearity of the wavefield, Figure 8b shows the time series of the ratio of the global maximum crest elevation in the whole domain, η g m a x (and not just the ( x , y n l m a x ) section), to the significant wave height, H s , again for the steepest finite water case ( η l m a x = 9.5 ) for both linear and nonlinear simulations. It is seen that both wavefields are somewhat symmetrical about the large event, with the linear maximum global crest elevation being 34% larger than the global nonlinear one. This is expected, as the global larger values are the ones identified at ( x n l m a x , y n l m a x ) and shown previously in Figure 7b. However, the largest nonlinear crest elevation is otherwise almost consistently larger than the linear one, reflecting the nonlinear effects of the wavefield. In fact, the global maximum crest elevation η g m a x is almost constantly larger than 1.25 H s which means that there is strong evidence that in a domain as large and as nonlinear as this one, there is at least one wave, at some location, that exceeds the limit of the rogue wave definition in [8].
Some examples of such large waves anywhere in the domain for the deep water case also follow. We have already pointed out a larger nonlinear crest height, compared to the linear simulation, that is observed for the wave next to the largest event in Figure 1 at ( 0 , 1 l p ) that appear at t 0 (meaning that this wave group evolved for the same time as the linear expected one). Many such characteristic waves can be spotted in this large random domain simulation. We present here another large wave that also occurs in the steep deep water simulation ( η l m a x = 9.5 m), also close to t = 0 . We have chosen this wave because it has a nonlinear crest height slightly larger than the forced linear crest height ( η l m a x = 9.5 m) expected at ( x l m a x , y l m a x ) in the whole domain. In other words, a wave larger than the linear and globally expected wave appeared in a completely different location. The exact location, the time, and the comparisons to the η l m a x of this wave event are shown in Table 3. This wave is also proof that the randomness of the simulation is satisfactory.
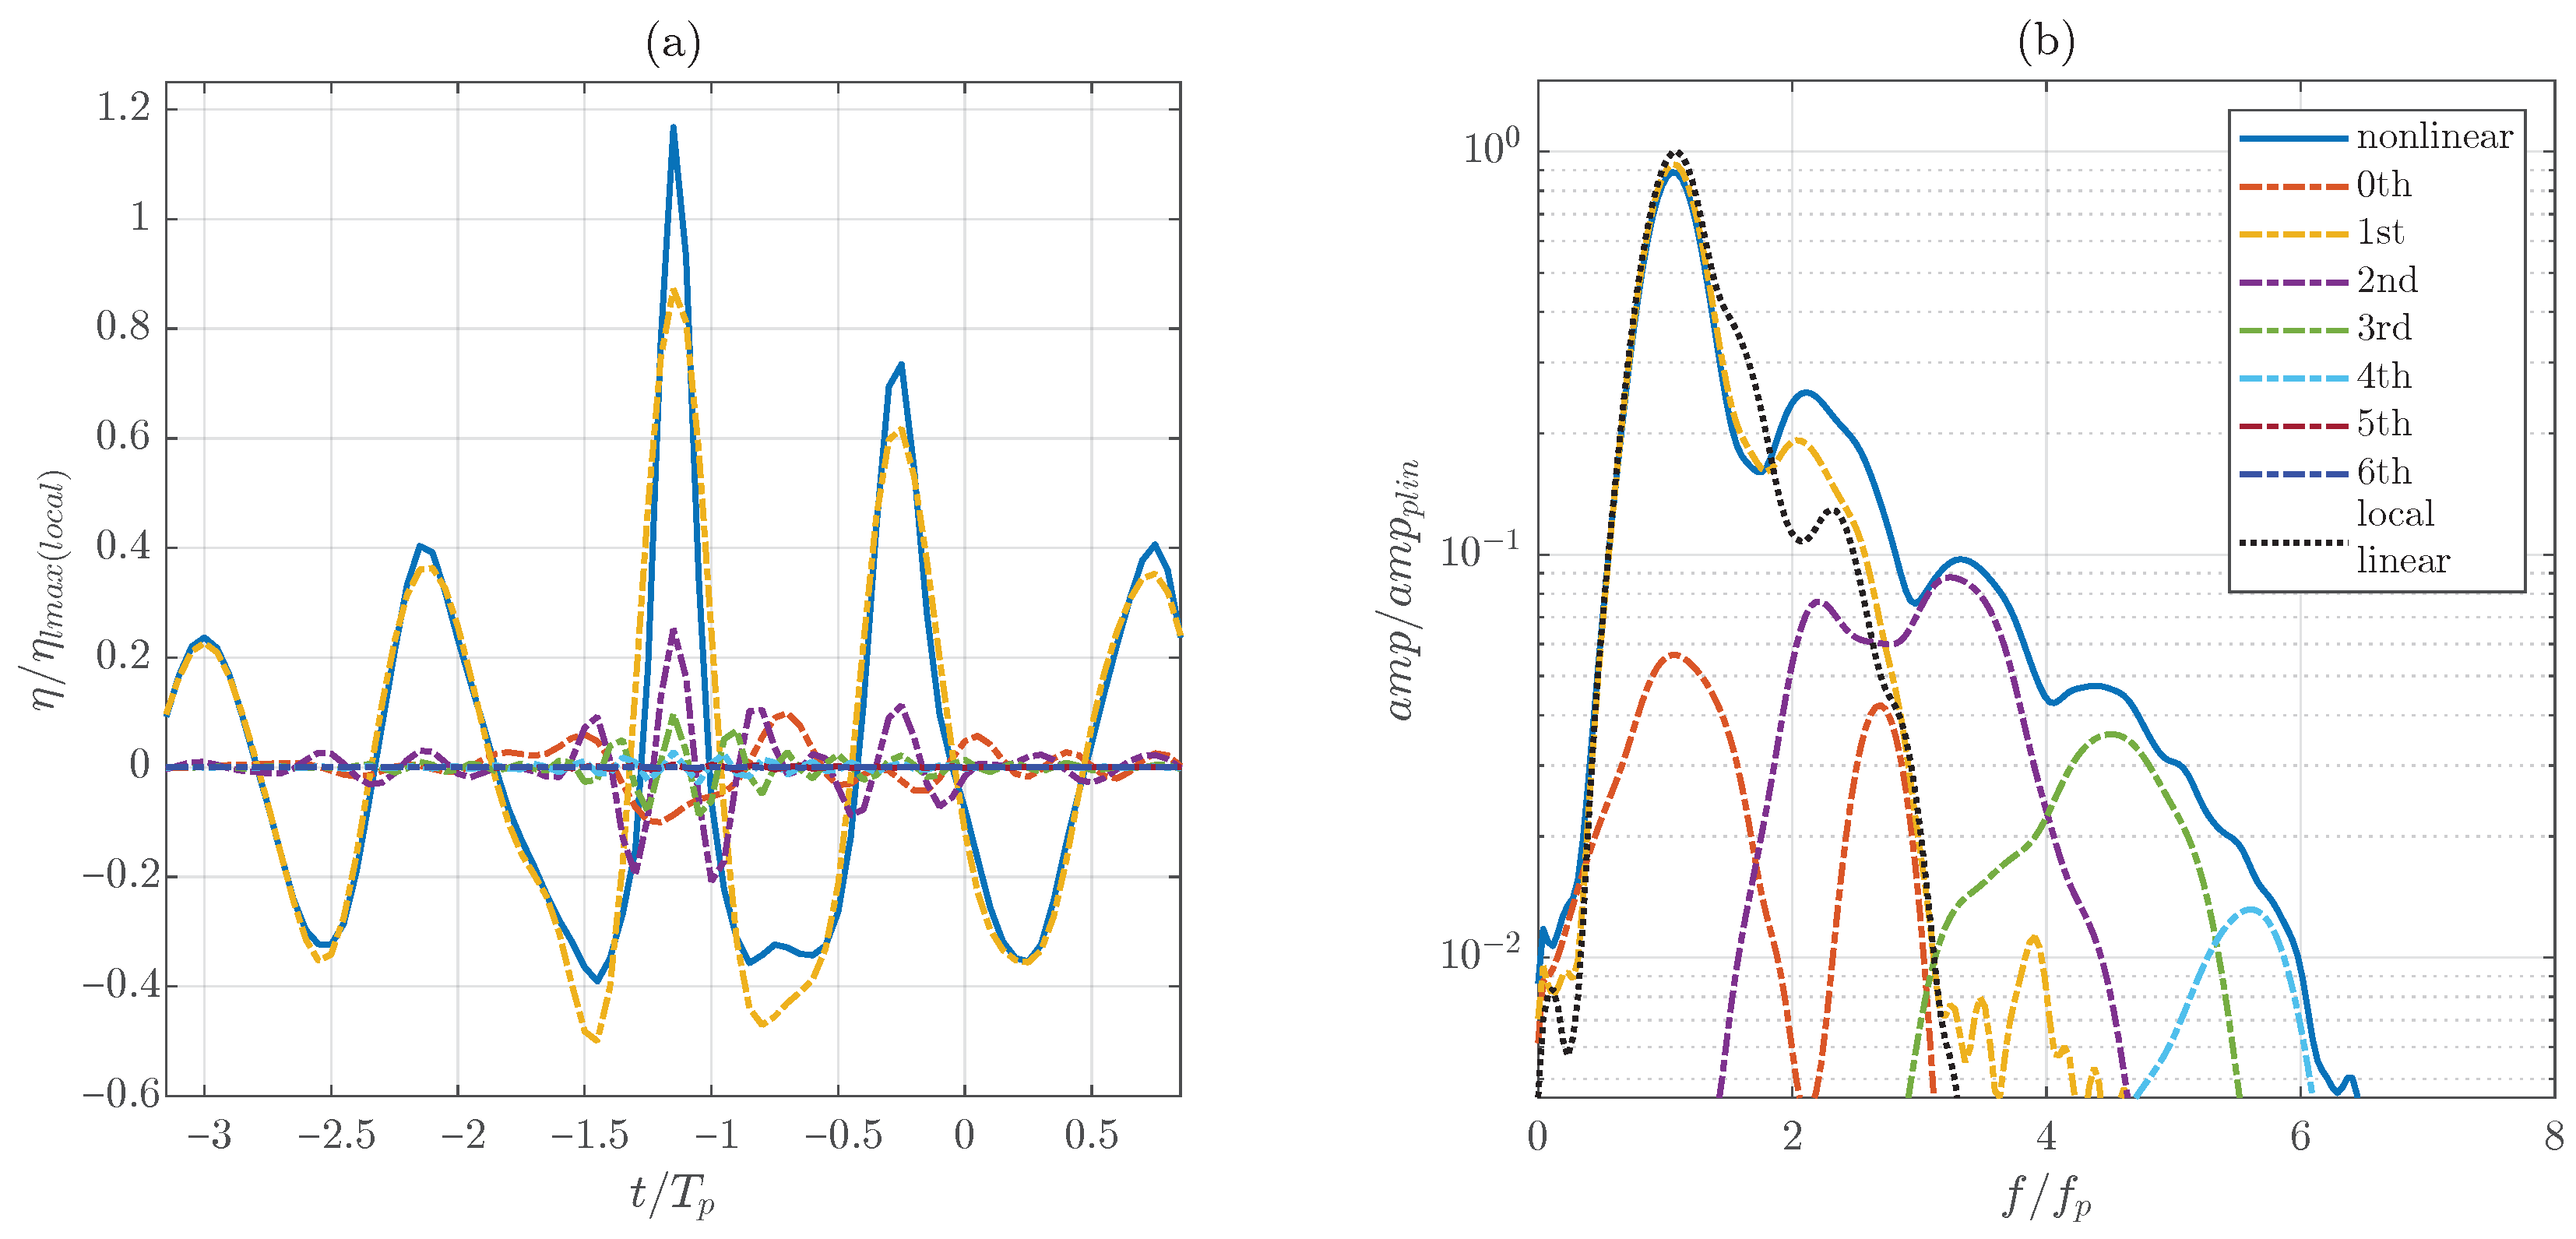
Examining this wave locally, it is shown, as expected, that its nonlinear crest height exceeds the linearly expected maximum crest elevation locally η l m a x ( l o c a l ) . Figure 9a shows the linear and nonlinear time series at ( x m a x , y m a x ) as previously in Figure 5, albeit in a different location. The nonlinear crest height appears earlier (at t 1 T p ) and it is 17% larger than the η l m a x l o c a l that appears at t 0 . Indeed, Figure 9b shows an enhanced nonlinear wave preceding the expected linear one, as is the case in all the other cases shown in this work. This preceding wave, depending on the relevant phasing, may or may not be larger than the linear expected one at t 0 .
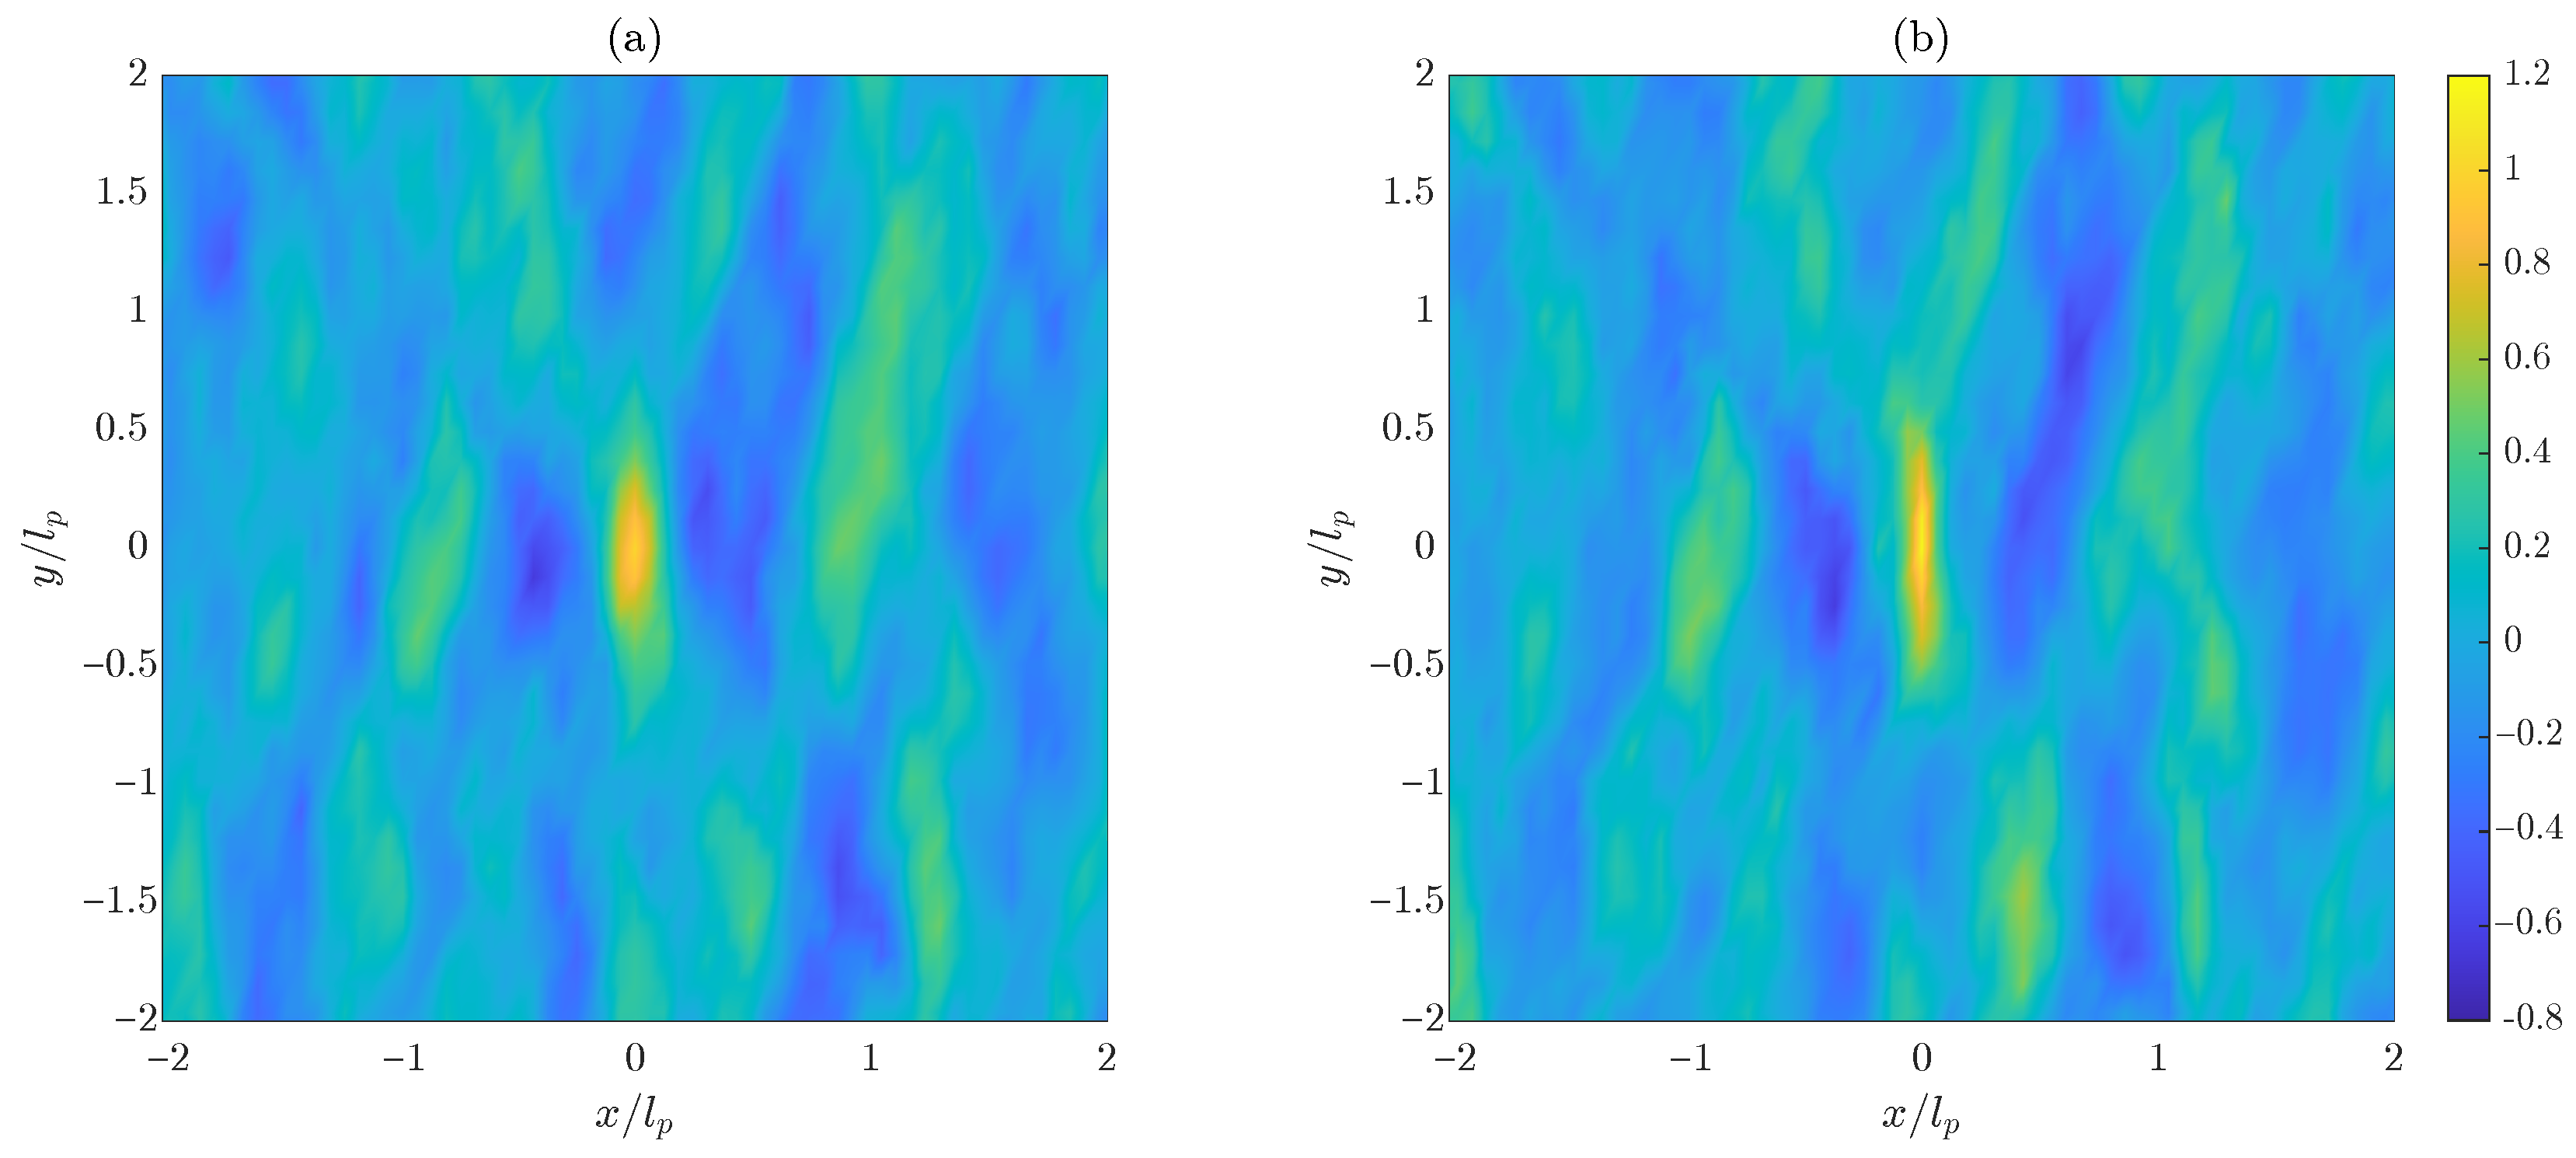
During the formation of this large wave, as shown in Figure 10, the crest becomes wider exactly like the cases examined in Section 3.1. This indicates that this behaviour is consistent in any large wave of significant steepness in a random wavefield.
The harmonic separation (Figure 11) shows significance up to the fourth order of nonlinearity, somewhat larger than in Figure 6c,d. This is probably due to the increased crest elevations (∼12%) of this wave compared to the η n l m a x . The zeroth- and third-order harmonics are of the same order of magnitude, with the zeroth being, as expected, out of phase. The second bump of the 0th harmonic is also apparent here, consistently within the limit of the first harmonic, indicating the generation of free waves as in the previous cases.
All the above show that the expected increase in crest heights with the introduction of nonlinearity also occurs in our simulations, and in the majority of the large wave groups in the domain, although the phasing of frequencies that causes the large linear waves is not retained when the wavefield is simulated nonlinearly. Therefore, the largest expected linear waves cannot be replicated exactly through nonlinear simulation.

4. Discussion and Concluding Remarks

From the results of this work, it is evident that the mechanism behind the formation of “walls of water”, meaning an increase in crest width when large linear waves are simulated fully nonlinearly, is also present on randomly phased wavefields that resemble real sea states more than the focused waves used in the analysis of [14].
However, referring to the pre-determined expected large wave, the nonlinear maximum crest heights do not exceed the linearly expected ones, mainly because of the changes of the phasing of the underlying frequency components. This is far more evident in finite compared to infinite water depth due to the increase in nonlinearity which leads to larger energy transfers within the underlying wave spectrum. This is consistent with the findings of [14] and focused wave simulations. A way to overcome this would be to introduce nonlinearity very close to the maximum wave in order to preserve its identity. However, this will introduce unrealistic wave–wave interactions and hence wave events that are unlikely to occur. Moreover, instability is an expected consequence and a fully nonlinear wave created this way either breaks or appears with spurious interactions due to its faulty initial conditions.
On the other hand, the vast majority of maximum crest heights throughout the simulation period are higher for nonlinear simulations. The fact that nonlinear crests may or not be larger than the corresponding linear crests is consistent with the calculations of [10], albeit using a narrow-banded approximation. The large bandwidth of the present simulations leads to large waves that are more sensitive to phase alterations as the wave energy moves to higher frequencies during the evolution of the wavefield. In any case, the finding of a very large nonlinear wave in deep water confirms that phasing alterations are the ones responsible for reduced η m a x , primarily caused by the enhancement of the preceding from the maximum linear large crest. In fact, the presented methodology proved that highly nonlinear waves can be simulated with a pre-determined large event within a random wavefield without losing its randomness, steepness, or higher-order harmonics.
In all, despite the limitation of a steep linear wave group not being able to preserve its full identity when simulated nonlinearly, the changes in the crest width (the formation of “walls of water”) and the redistribution of wave energy towards higher frequencies are relevant to the investigation of wave–structure interactions either offshore or nearshore. Indeed, increased crest widths, compared to linear theory, mean that a larger area of a structure or ship is hit during the interaction with a big wave event. The transfer of energy to higher frequencies can also have implications on wave–structure interactions, as higher order components can resonate with the natural frequency of a structure [36,37]. Ringing type motions of structures could be attributed to the nonlinear drag forces which can also be in resonance with their natural frequency [38].

Author Contributions

Conceptualization, G.S. and V.K.; methodology, G.S. and V.K.; software, G.S.; validation, G.S. and V.K.; formal analysis, G.S.; investigation, G.S.; resources, V.K.; data curation, G.S.; writing—original draft preparation, G.S. and V.K.; writing—review and editing, G.S. and V.K.; visualization, G.S.; supervision, V.K.; project administration, V.K.; funding acquisition, N/A. All authors have read and agreed to the published version of the manuscript.

Funding

This research received no external funding.

Data Availability Statement

The data that support the findings of this study are available from the corresponding author upon reasonable request.

Conflicts of Interest

The authors declare no conflicts of interest.

Appendix A. Nonlinear Harmonic Separation Scheme

The harmonic separation scheme is displayed in detail in this appendix. In this paper, the Stokes expansion is derived from the methods of [23,24] up to the sixth order (the Hilbert transform is indicated by the subscript H L ). The nth Order with an F subscript corresponds to Fitzgerald et al. [23] and the H subscript to Hann et al. [24]:
0 th   Order H   f 20 A 2 + f 40 A 4 + f 60 A 6 = [ η ( 0 ) + η ( 30 ) + η ( 60 ) + η ( 90 ) + η ( 120 ) + η ( 150 ) + η ( 180 ) + η ( 210 ) + η ( 240 ) + η ( 270 ) + η ( 300 ) + η ( 330 ) ] / 12
1 st   Order F   f 11 A c o s ( θ ) + f 31 A 3 c o s ( θ ) + f 51 A 5 c o s ( θ ) + f 55 A 5 c o s ( 5 θ ) = [ η ( 0 ) η H L ( 90 ) η ( 180 ) + η H L ( 270 ) ] / 4
1 st   Order H   f 11 A c o s ( θ ) + f 31 A 3 c o s ( θ ) + f 51 A 5 c o s ( θ ) f 55 A 5 c o s ( 5 θ ) O ( A 7 ) = [ η ( 30 ) + η ( 330 ) η ( 150 ) + η ( 210 ) ] / ( 2 3 )
2 nd   Order F   f 22 A 2 c o s ( 2 θ ) + f 42 A 4 c o s ( 2 θ ) + f 62 A 6 c o s ( 2 θ ) + f 66 A 6 c o s ( 6 θ ) = [ η ( 0 ) η ( 90 ) + η ( 180 ) η ( 270 ) ] / 4
2 nd   Order H   f 22 A 2 c o s ( 2 θ ) + f 42 A 4 c o s ( 2 θ ) + f 62 A 6 c o s ( 2 θ ) 2 f 66 A 6 c o s ( 6 θ ) = [ η ( 30 ) + η ( 330 ) + η ( 150 ) + η ( 210 ) η ( 60 ) η ( 300 ) η ( 120 ) η ( 240 ) ] / 4
3 rd   Order F   f 33 A 3 c o s ( 3 θ ) + f 53 A 5 c o s ( 3 θ ) + O ( A 7 ) = [ η ( 0 ) + η H L ( 90 ) η ( 180 ) η H L ( 270 ) ] / 4
3 rd   Order H   f 33 A 3 c o s ( 3 θ ) + f 53 A 5 c o s ( 3 θ ) f 55 A 5 c o s ( 5 θ ) O ( A 7 ) = ( η ( 120 ) + η ( 240 ) η ( 60 ) η ( 300 ) + [ η ( 30 ) + η ( 330 ) η ( 150 ) η ( 210 ) ] / 3 ) / 4
4 th   Order H   f 44 A 4 c o s ( 4 θ ) = [ η ( 0 ) + η ( 90 ) + η ( 180 ) + η ( 270 ) ] / 4 R H S ( E q u a t i o n ( A 1 ) )
Note that in [23], the zeroth and fourth order are not separated, while in Hann et al. the separation is possible (Equations (A1) and (A8)). Furthermore, as shown in Equations (A2)–(A7), the previous phase separation methods [23,24] are contaminated with higher-order components with a Stokes expansion up to the sixth order. To separate these higher-order components, the equations from both methods are combined. By combining the first-, second-, and third-order components, the following is produced:
2 f 55 A 5 c o s ( 5 θ ) + O ( A 7 ) = R H S ( E q u a t i o n ( A 2 ) ) R H S ( E q u a t i o n ( A 3 ) )
3 f 66 A 6 c o s ( 6 θ ) = R H S ( E q u a t i o n ( A 4 ) ) R H S ( E q u a t i o n ( A 5 ) )
f 55 A 5 c o s ( 5 θ ) + 2 O ( A 7 ) = R H S ( E q u a t i o n ( A 6 ) ) R H S ( E q u a t i o n ( A 7 ) )
By combining Equations (A9)–(A11), the higher-order components are separated as follows:
5 th   Order   f 55 A 5 c o s ( 5 θ ) = [ 2 R H S ( E q u a t i o n ( A 9 ) ) R H S ( E q u a t i o n ( A 11 ) ) ] / 3
6 th   Order   f 66 A 6 c o s ( 6 θ ) = R H S ( E q u a t i o n ( A 10 ) ) / 3
7 th   Order   O ( A 7 ) = [ 2 R H S ( E q u a t i o n ( A 11 ) ) R H S ( E q u a t i o n ( A 9 ) ) ] / 3
Using the above, the first three harmonics are derived free of higher-order contamination:
1 st   Order   f 11 A c o s ( θ ) + f 31 A 3 c o s ( θ ) + f 51 A 5 c o s ( θ ) = R H S ( E q u a t i o n ( A 2 ) ) R H S ( E q u a t i o n ( A 12 ) )
2 nd   Order   f 22 A 2 c o s ( 2 θ ) + f 42 A 4 c o s ( 2 θ ) + f 62 A 6 c o s ( 2 θ ) = R H S ( E q u a t i o n ( A 4 ) ) R H S ( E q u a t i o n ( A 13 ) )
3 rd   Order   f 33 A 3 c o s ( 3 θ ) + f 53 A 5 c o s ( 3 θ ) = R H S ( E q u a t i o n ( A 6 ) ) R H S ( E q u a t i o n ( A 14 ) )
while the zeroth, and fourth–sixth are taken as shown in Equations (A1), (A8), (A12), and (A13). The “seventh”-order harmonic calculated with Equation (A14) consists of the true seventh-order harmonic and other higher-order odd harmonics that are not separated further.

References

  1. Boccotti, P. Wave Mechanics for Ocean Engineering, 1st ed.; Number 64 in Elsevier Oceanography Series; Elsevier: Amsterdam, The Netherlands, 2000. [Google Scholar]
  2. Faltinsen, O. Hydrodynamics of marine and offshore structures. J. Hydrodyn. Ser. B 2015, 26, 835–847. [Google Scholar] [CrossRef]
  3. DNV. RP-C205 Environmental Conditions and Environmental Loads. Technical Report, DNV, 2025. Available online: https://www.dnv.com/energy/standards-guidelines/dnv-rp-c205-environmental-conditions-and-environmental-loads/ (accessed on 2 August 2025).
  4. Kharif, C.; Pelinovsky, E.; Slunyaev, A. Rogue Waves in the Ocean; Springer: Berlin/Heidelberg, Germany, 2009. [Google Scholar] [CrossRef]
  5. Christou, M.; Ewans, K. Field Measurements of Rogue Water Waves. J. Phys. Oceanogr. 2014, 44, 2317–2335. [Google Scholar] [CrossRef]
  6. Cavaleri, L.; Barbariol, F.; Benetazzo, A.; Bertotti, L.; Bidlot, J.R.; Janssen, P.; Wedi, N. The Draupner Wave: A Fresh Look and the Emerging View. J. Geophys. Res. Ocean 2016, 121, 6061–6075. [Google Scholar] [CrossRef]
  7. Fedele, F.; Lugni, C.; Chawla, A. The Sinking of the El Faro: Predicting Real World Rogue Waves during Hurricane Joaquin. Sci. Rep. 2017, 7, 11188. [Google Scholar] [CrossRef] [PubMed]
  8. Dysthe, K.; Krogstad, H.E.; Müller, P. Oceanic Rogue Waves. Annu. Rev. Fluid Mech. 2008, 40, 287–310. [Google Scholar] [CrossRef]
  9. Adcock, T.A.A.; Taylor, P.H.; Draper, S. Nonlinear Dynamics of Wave-Groups in Random Seas: Unexpected Walls of Water in the Open Ocean. Proc. R. Soc. Math. Phys. Eng. Sci. 2015, 471, 20150660. [Google Scholar] [CrossRef]
  10. Adcock, T.A.A.; Taylor, P.H.; Draper, S. On the Shape of Large Wave-Groups on Deep Water—The Influence of Bandwidth and Spreading. Phys. Fluids 2016, 28, 106601. [Google Scholar] [CrossRef]
  11. Gibbs, R.H.; Taylor, P.H. Formation of Walls of Water in `Fully’ Nonlinear Simulations. Appl. Ocean Res. 2005, 27, 142–157. [Google Scholar] [CrossRef]
  12. Chalikov, D. Freak Waves: Their Occurrence and Probability. Phys. Fluids 2009, 21, 076602. [Google Scholar] [CrossRef]
  13. Ducrozet, G.; Bonnefoy, F.; Le Touzé, D.; Ferrant, P. 3-D HOS Simulations of Extreme Waves in Open Seas. Nat. Hazards Earth Syst. Sci. 2007, 7, 109–122. [Google Scholar] [CrossRef]
  14. Spiliotopoulos, G.; Katsardi, V. Effects of Nonlinearity on the Crest Shape of Extreme Irregular Sea Waves: Nonlinear Harmonic Separation and Analysis. Phys. Fluids 2024, 36, 106604. [Google Scholar] [CrossRef]
  15. Ducrozet, G.; Bonnefoy, F.; Le Touzé, D.; Ferrant, P. HOS-ocean: Open-source Solver for Nonlinear Waves in Open Ocean Based on High-Order Spectral Method. Comput. Phys. Commun. 2016, 203, 245–254. [Google Scholar] [CrossRef]
  16. Tromans, P.S.; Anaturk, A.R.; Hagemeijer, P. A New Model For The Kinematics Of Large Ocean Waves-Application As a Design Wave. In Proceedings of the First International Offshore and Polar Engineering Conference, Edinburgh, UK, 11 August 1991. [Google Scholar]
  17. Boccotti, P. Some New Results on Statistical Properties of Wind Waves. Appl. Ocean Res. 1983, 5, 134–140. [Google Scholar] [CrossRef]
  18. Katsardi, V.; Swan, C. The Importance of Directionality in the Evolution of Large Waves in Intermediate and Shallow Water. In Proceedings of the 29th International Conference of Coastal Engineering 2006, San Diego, CA, USA, 3–8 September 2007; pp. 157–169. [Google Scholar] [CrossRef]
  19. Katsardi, V.; Swan, C. The Evolution of Large Non-Breaking Waves in Intermediate and Shallow Water. I. Numerical Calculations of Uni-Directional Seas. Proc. R. Soc. Math. Phys. Eng. Sci. 2011, 467, 778–805. [Google Scholar] [CrossRef]
  20. Johannessen, T.B.; Swan, C. On the Nonlinear Dynamics of Wave Groups Produced by the Focusing of Surface–Water Waves. Proc. R. Soc. Lond. Ser. Math. Phys. Eng. Sci. 2003, 459, 1021–1052. [Google Scholar] [CrossRef]
  21. Walker, D.A.G.; Taylor, P.H.; Eatock Taylor, R. The Shape of Large Surface Waves on the Open Sea and the Draupner New Year Wave. Appl. Ocean. Res. 2004, 26, 73–83. [Google Scholar] [CrossRef]
  22. Gibson, R.; Swan, C. The Evolution of Large Ocean Waves: The Role of Local and Rapid Spectral Changes. Proc. R. Soc. Math. Phys. Eng. Sci. 2007, 463, 21–48. [Google Scholar] [CrossRef]
  23. Fitzgerald, C.J.; Taylor, P.H.; Taylor, R.E.; Grice, J.; Zang, J. Phase Manipulation and the Harmonic Components of Ringing Forces on a Surface-Piercing Column. Proc. R. Soc. Math. Phys. Eng. Sci. 2014, 470, 20130847. [Google Scholar] [CrossRef]
  24. Hann, M.; Greaves, D.; Raby, A. A New Set of Focused Wave Linear Combinations to Extract Non-Linear Wave Harmonics. In Proceedings of the 29th International Workshop on Water Waves and Floating Bodies, Osaka, Japan, 30 March–2 April 2014. [Google Scholar]
  25. West, B.J.; Brueckner, K.A.; Janda, R.S.; Milder, D.M.; Milton, R.L. A New Numerical Method for Surface Hydrodynamics. J. Geophys. Res. Oceans 1987, 92, 11803–11824. [Google Scholar] [CrossRef]
  26. Dommermuth, D.G.; Yue, D.K.P. A High-Order Spectral Method for the Study of Nonlinear Gravity Waves. J. Fluid Mech. 1987, 184, 267–288. [Google Scholar] [CrossRef]
  27. Hasselman, K.; Barnett, T.P.; Bouws, E.; Carlson, H.; Cartwright, D.E.; Enke, K.; Ewing, J.A.; Gienapp, H.; Hasselmann, D.E.; Kruseman, P.; et al. Measurements of Wind-Wave Growth and Swell Decay During the Joint North Sea Wave Project (JONSWAP); Deutschen Hydrographischen Zeitschrift, Reihe A8. Nr. 12; Deutsches Hydrographisches Institut: Hamburg, Germany, 1973. [Google Scholar]
  28. Mitsuyasu, H.; Tasai, F.; Suhara, T.; Mizuno, S.; Ohkusu, M.; Honda, T.; Rikiishi, K. Observations of the Directional Spectrum of Ocean Waves Using a Cloverleaf Buoy. J. Phys. Oceanogr. 1975, 5, 750–760. [Google Scholar] [CrossRef]
  29. Forristall, G.Z.; Ewans, K.C. Worldwide Measurements of Directional Wave Spreading. J. Atmos. Ocean. Technol. 1998, 15, 440–469. [Google Scholar] [CrossRef]
  30. Kumar, V.; Deo, M.; Anand, N.; Chandramohan, P. Estimation of Wave Directional Spreading in Shallow Water. Ocean Eng. 1998, 26, 83–98. [Google Scholar] [CrossRef]
  31. Boccotti, P.; Arena, F.; Fiamma, V.; Romolo, A.; Barbaro, G. Estimation of Mean Spectral Directions in Random Seas. Ocean Eng. 2011, 38, 509–518. [Google Scholar] [CrossRef]
  32. Ducrozet, G.; Bonnefoy, F.; Perignon, Y. Applicability and limitations of highly non-linear potential flow solvers in the context of water waves. Ocean Eng. 2017, 142, 233–244. [Google Scholar] [CrossRef]
  33. Fenton, J.D. Nonlinear Wave Theories. In The Sea–Ocean Engineering Science, Part A; Le Méhauté, B., Hanes, D.M., Eds.; Wiley: New York, NY, USA, 1990; Volume 9, pp. 3–25. [Google Scholar]
  34. Spiliotopoulos, G.; Katsardi, V. Effects of Nonlinearity on the Crest Shape of Extreme Irregular Sea Waves: Effects of Steepness, Water Depth and Directionality. In Proceedings of the The 34th International Ocean and Polar Engineering Conference, Rhodes, Greece, 16–21 June 2024. [Google Scholar]
  35. Zve, E.; Swan, C.; Hughes, G. Crest-Height Statistics in Finite Water Depth. Part 1: The Role of the Nonlinear Interactions in Uni-Directional Seas. Ocean Eng. 2023, 289, 116369. [Google Scholar] [CrossRef]
  36. Harleman, D.R.; Nolan, W.C.; Honsinger, V.C. Dynamic Analysis of Offshore Structures. In Proceedings of the Coastal Engineering Proceedings, Mexico City, Mexico, November 1962; Volume 8, pp. 482–499. [Google Scholar] [CrossRef]
  37. Chatziioannou, K.; Katsardi, V.; Koukouselis, A.; Mistakidis, E. On the Consideration of Wave and Structural Nonlinearities in the Design of Compliant Towers through Dynamic Analysis. J. Ocean. Eng. Mar. Energy 2018, 4, 323–342. [Google Scholar] [CrossRef]
  38. Gudmestad, O.T. Resonant Motions of Dynamic Offshore Structures in Large Waves. Fluids 2021, 6, 352. [Google Scholar] [CrossRef]
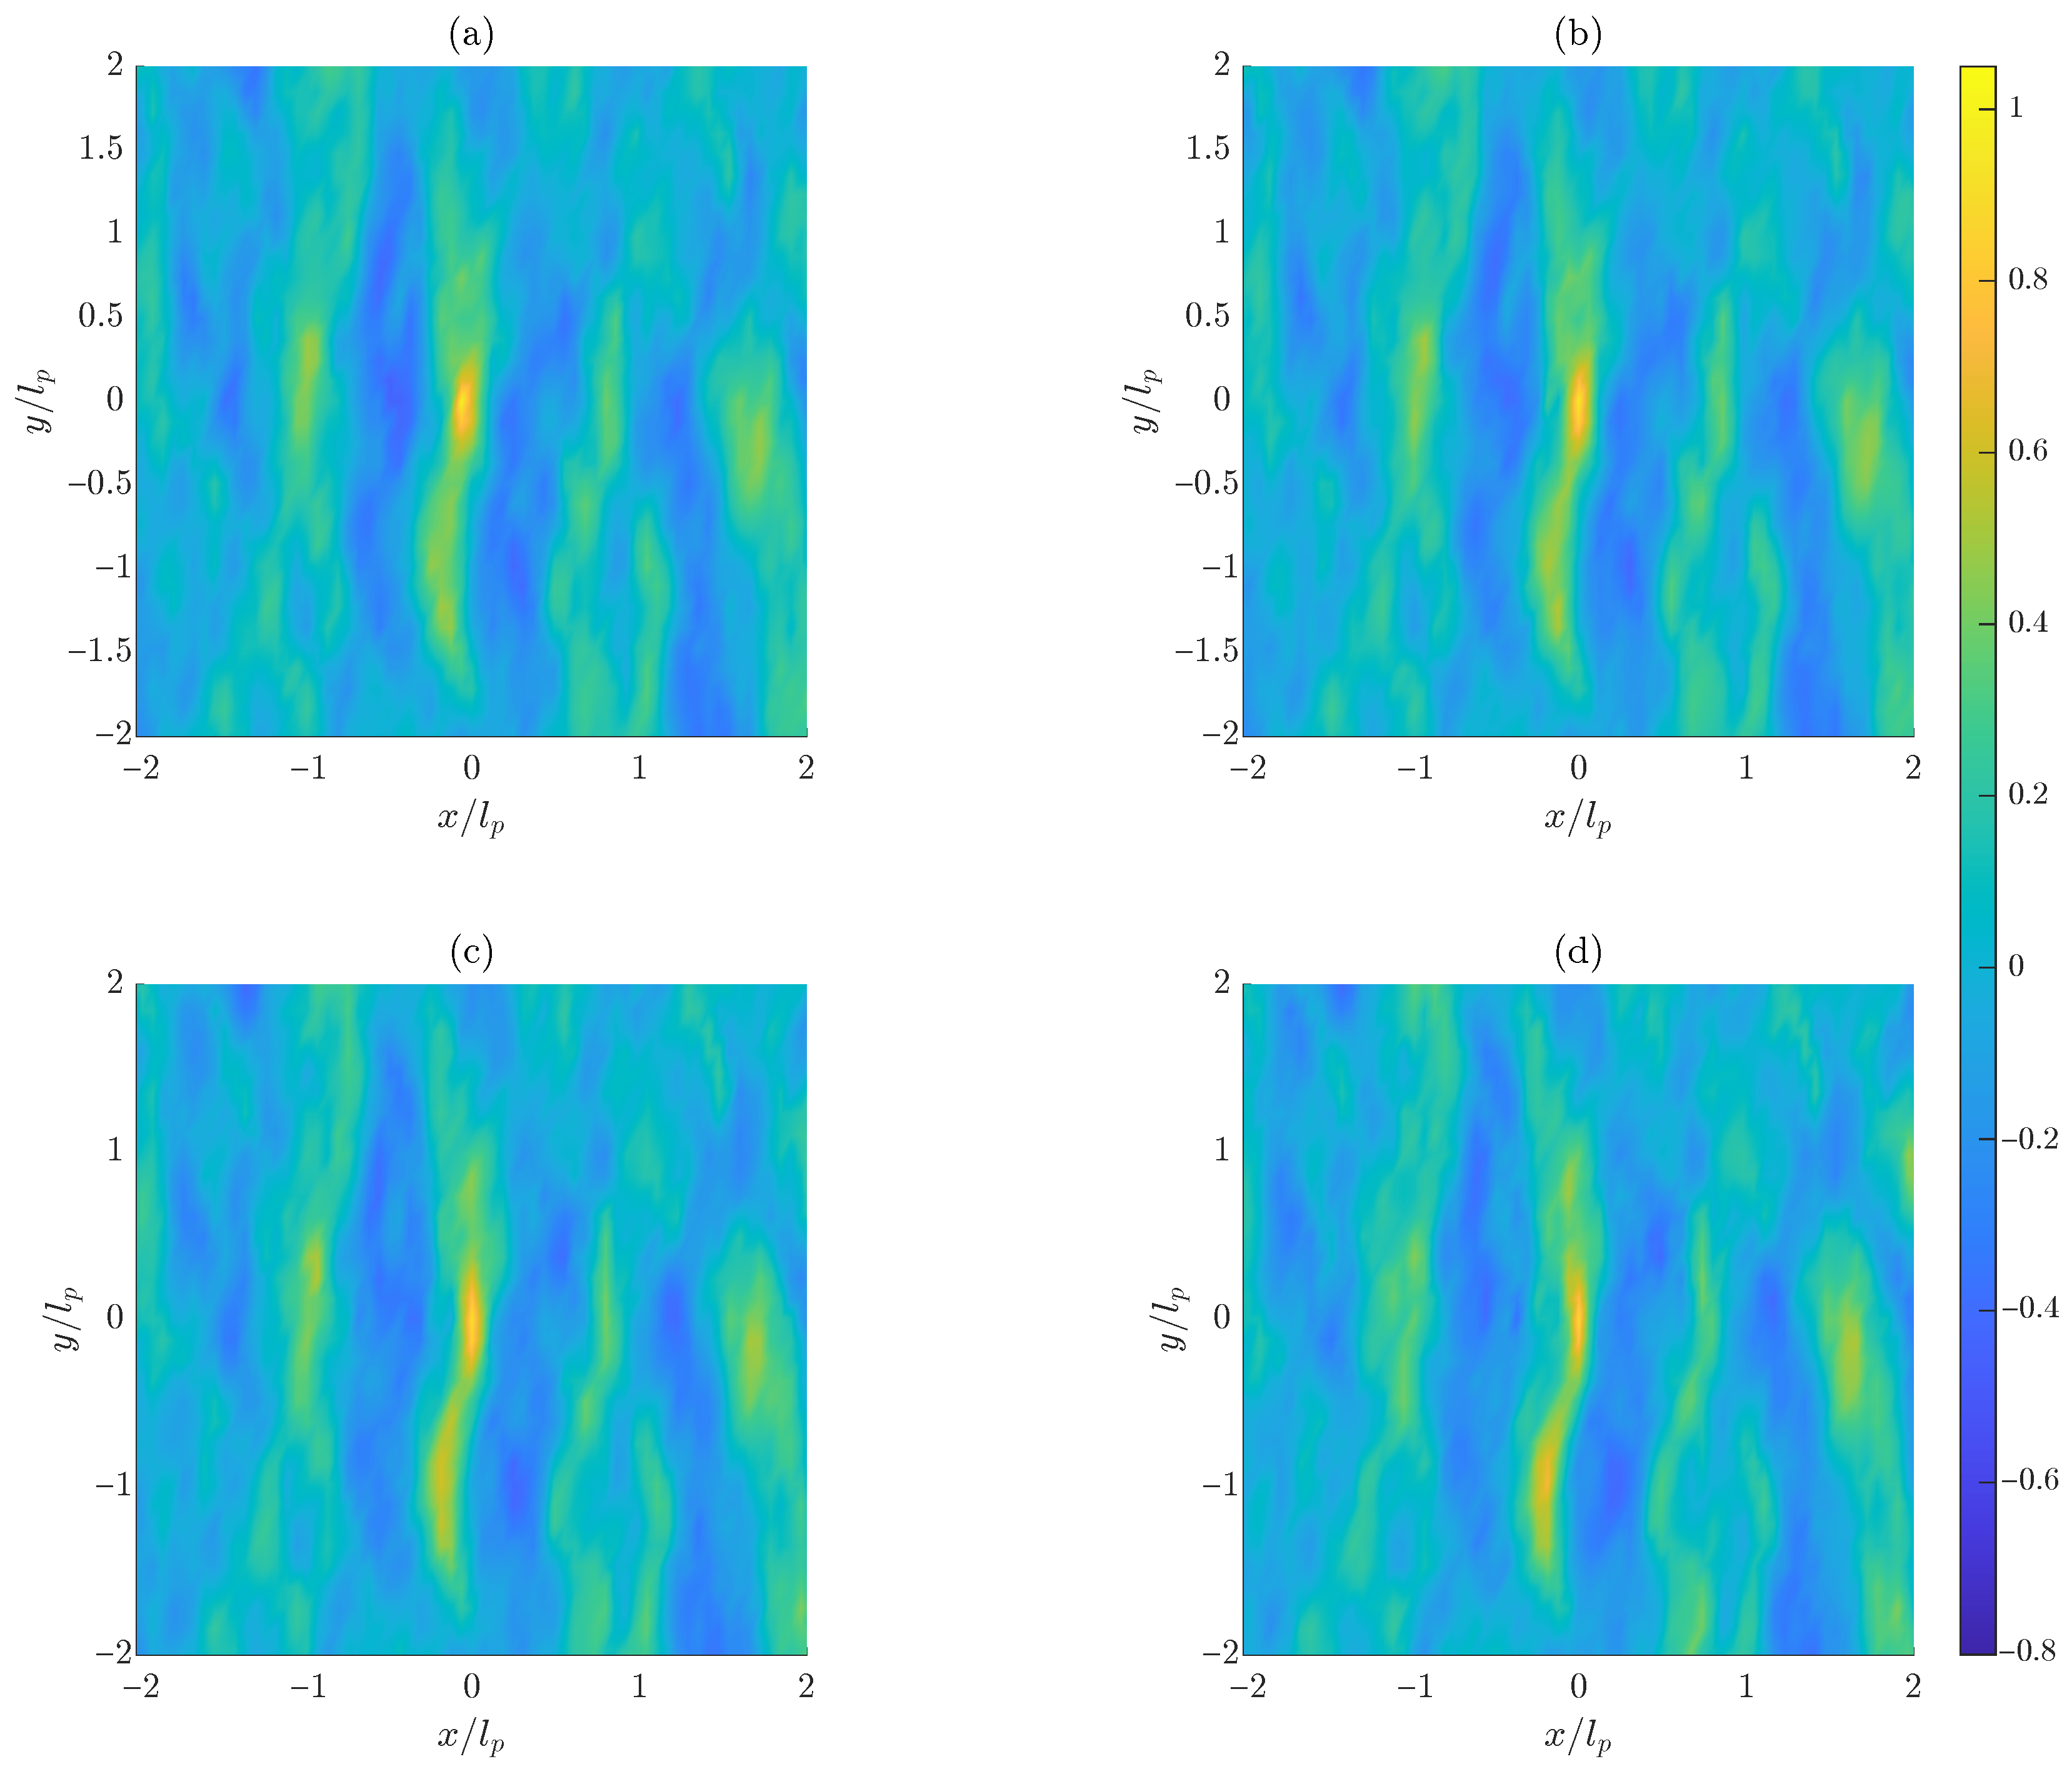
Figure 1. Surface elevation for deep water cases (normalised with the expected linear maximum η l m a x ) for (a) linear, (b) η l m a x = 4 m, (c) η l m a x = 6.75 m, and (d) η l m a x = 9.5 m at the corresponding t m a x . The waves propagate from left to right. The maximum crest is centred in a square view of 4 × 4 l p .
Jmse 13 01516 g001
Figure 2. Surface elevation for k p f d = 0.864 (normalised with the expected linear maximum η l m a x ) for (a) linear, (b) η l m a x = 4 m, (c) η l m a x = 6.75 m, and (d) η l m a x = 9.5 m at the corresponding t m a x . The waves propagate from left to right. The maximum crest is centred in a square view of 4 × 4 l p .
Jmse 13 01516 g002
Figure 3. Upper peak envelopes of the surface elevation for deep water cases (normalised with the expected linear maximum η l m a x ) for (a) linear, (b) η l m a x = 4 m, (c) η l m a x = 9.5 m at the corresponding t m a x . The waves propagate from left to right. The maximum crest is centred in a square view of ( 4 × 4 ) l p .
Jmse 13 01516 g003
Figure 4. Upper peak envelopes of the surface elevation for k p f d = 0.864 (normalised with the expected linear maximum η l m a x ) for (a) linear, (b) η l m a x = 4 m, (c) η l m a x = 9.5 m at the corresponding t m a x . The waves propagate from left to right. The maximum crest is centred in a square view of ( 4 × 4 ) l p .
Jmse 13 01516 g004
Figure 5. Time histories of the free surface at the ( x l m a x , y l m a x ) and ( x n l m a x , y n l m a x ) where the linear and the nonlinear maximum crest height, η l m a x and η n l m a x , occur, respectively. (a) η l m a x = 4 m deep water, (b) η l m a x = 9.5 m deep water, (c) η l m a x = 4 m − k p f d = 0.864 , (d) η l m a x = 9.5 m − k p f d = 0.864 .
Jmse 13 01516 g005
Figure 6. Up to 6th-order harmonic phase separation of the nonlinear records shown in Figure 5; (a,b) η l m a x = 4 m deep water, (c,d) η l m a x = 9.5 m deep water, (e,f) η l m a x = 4 m − k p f d = 0.864 , (g,h) η l m a x = 9.5 m − k p f d = 0.864 . The amplitude is normalised with the value of the amplitude at the peak of the local linear spectrum ( a m p / a m p p l i n ).
Jmse 13 01516 g006
Figure 7. Evolution of the maximum elevation of the slice of the domain corresponding to the main direction of propagation of the largest linear wave: (a) deep water; (b) k p f d = 0.864 .
Jmse 13 01516 g007
Figure 8. Effects of nonlinearity for η l m a x = 9.5 and k p f d = 0.864 : (a) shows the difference between the steepest case and linear from Figure 7b; (b) plots the ratio of the maximum elevation in the whole domain to the significant wave height H s .
Jmse 13 01516 g008
Figure 9. The largest nonlinear wave of the case where η l m a x = 9.5 m deep water, located at x m a x / l p = 26.7 and y m a x / l p = 11.44 ; (a) time history of the free surface at the ( x , y ) coordinates where the maximum crest occurs nonlinearly for both linear and nonlinear simulations; (b) evolution of the maximum elevation of the slice of the domain corresponding to the main direction of propagation of the large nonlinear wave.
Jmse 13 01516 g009
Figure 10. Surface elevation of the largest nonlinear wave of the case where η l m a x = 9.5 m deep water, located at x m a x / l p = 26.7 and y m a x / l p = 11.44 , normalised with the local linear maximum η l m a x ( l o c a l ) = 8.17 m, for (a) the corresponding linear wave and (b) maximum nonlinear wave. The waves propagate from left to right. The maximum crest is centred in a square view of 4 x 4 l p .
Jmse 13 01516 g010
Figure 11. Phase separation of up to 6th-order harmonics for the largest nonlinear wave of η l m a x = 9.5 m deep water of the nonlinear record shown in Figure 9a; (a) free surface elevation normalised with η l m a x ( l o c a l ) ; (b) normalised amplitude spectra in log scale.
Jmse 13 01516 g011
Table 1. Input parameters for each case.
η lmax d k pf k pf d H s H s k pf / 2 η lmax k pf s L x L y θ r
(m)(m)(rad/m) (m) (m)(m)
40.04022.540.0510.1611010,0005000 1.968 π
6.750.04024.280.0860.2711010,0005000 1.968 π
9.50.04026.030.1210.3821010,0005000 1.968 π
4150.05760.8641.770.0510.2304570007000 1.924 π
6.75150.05760.8642.990.0860.3894570007000 1.924 π
9.5150.05760.8644.210.1210.5474570007000 1.924 π
Table 2. Maximum surface elevations, time of their occurrence, and their ( x , y ) coordinates.
k pf d = k pf d = 0.864
Linear η lmax = 4 m η lmax = 6 . 75 m η lmax = 9 . 5 mLinear η lmax = 4 m η lmax = 6 . 75 m η lmax = 9 . 5 m
η m a x / η l m a x 10.970.920.9010.900.790.76
t m a x / T p −0.35−0.35−0.20−0.20−0.45−0.40−0.45−0.30
x m a x / l p −0.060+0.18+0.31−0.120+0.06+0.31
y m a x / l p 000000+0.25+0.25
Table 3. Maximum surface elevations, time of their occurrence, and their ( x , y ) coordinates for the largest nonlinear wave that occurs in the η l m a x = 9.5 m deep water simulation.
LinearNonlinear
η m a x / η l m a x 0.861.01
η m a x / η l m a x ( l o c a l ) 11.17
t m a x / T p +0.05−1.15
x m a x / l p +26.82+26.70
y m a x / l p −11.44−11.44
Disclaimer/Publisher’s Note: The statements, opinions and data contained in all publications are solely those of the individual author(s) and contributor(s) and not of MDPI and/or the editor(s). MDPI and/or the editor(s) disclaim responsibility for any injury to people or property resulting from any ideas, methods, instructions or products referred to in the content.