Article

Identifying Sustainable Offshore Wind Farm Sites in Greece Under Climate Change

by
Vasiliki I. Chalastani
1,*,
Elissavet Feloni
2,
Carlos M. Duarte
3 and
Vasiliki K. Tsoukala
1,*
1
Laboratory of Harbour Works, Department of Water Resources and Environmental Engineering, School of Civil Engineering, National Technical University of Athens (NTUA), 15780 Zografou, Greece
2
Department of Surveying and Geoinformatics Engineering, University of West Attica, 28 Ag. Spiridonos, Egaleo, 12243 Attica, Greece
3
Bioscience and Environmental Science and Engineering Division, King Abdullah University of Science and Technology (KAUST), Thuwal 23955-6900, Saudi Arabia
*
Authors to whom correspondence should be addressed.
J. Mar. Sci. Eng. 2025, 13(8), 1508; https://doi.org/10.3390/jmse13081508
Submission received: 14 July 2025 / Revised: 1 August 2025 / Accepted: 4 August 2025 / Published: 5 August 2025
(This article belongs to the Section Marine Energy)

Abstract

Wind power has gained attention as a vital renewable energy source capable of reducing emissions and serving as an effective alternative to fossil fuels. Floating wind farms could significantly enhance the energy capacities of Mediterranean countries. However, location selection for offshore wind farms (OWFs) is a challenge for renewable energy policy and marine spatial planning (MSP). To address these issues, this study considers the marine space of Greece to propose a GIS-based multi-criteria decision-making (MCDM) framework employing the Analytic Hierarchy Process (AHP) to identify suitable sites for OWFs. The approach assesses 19 exclusion criteria encompassing legislative, environmental, safety, and technical constraints to determine the eligible areas. Subsequently, 10 evaluation criteria are weighted to determine the selected areas’ level of suitability. The study considers baseline conditions (1981–2010) and future climate scenarios based on RCP 4.5 and RCP 8.5 for two horizons (2011–2040 and 2041–2070), integrating projected wind velocities and sea level rise to evaluate potential shifts in suitable areas. Results indicate the central and southeastern Aegean Sea as the most suitable areas for OWF deployment. Climate projections indicate a modest increase in suitable areas. The findings serve as input for climate-resilient MSP seeking to promote sustainable energy development.

1. Introduction

As Europe intensifies its efforts to transition to a decarbonized energy system and already committed to renewable energy (RE) targets for 2030 up to 32% [1], offshore wind energy (OWE) has emerged as an attractive prospect for new wind energy installations [2]. Projections estimate that offshore wind farms (OWFs) will grow sevenfold, increasing from 56 gigawatts (GW) globally in 2021 to an impressive 371 GW by 2031 [3,4], representing an estimated USD 945 billion investment to build around 25,000 turbines [3]. In 2024, Europe added 2.6 GW to its offshore capacity to reach approximately 37 GW [5]. The European Union (EU) aims to install at least 60 GW of offshore wind capacity by 2030 and 300 GW by 2050, largely supported by the strategic deployment of OWFs across its maritime territories [6]. Achieving these targets requires not only technological innovation but also spatial optimization and robust planning frameworks.
Traditionally, offshore wind development in Europe has been concentrated in shallow continental shelves, such as those in the North Sea and the Baltic Sea [7], where fixed-bottom turbines are economically viable. However, the development of floating wind technology, which allows turbines to be installed in deeper waters beyond 60 m, is opening up new frontiers, particularly in regions with a narrow continental shelf, e.g., Southern Europe and the Mediterranean Sea [2,8]. This advancement is especially significant for countries such as Greece, where steep bathymetric profiles limit the potential of bottom-fixed foundations nearshore.
Although the Mediterranean region has potential for floating OWE development, the industry remains in its infancy [9], with only pilot projects currently underway (e.g., three floating turbines in the French part of the Gulf of Lion [10]. The current state of OWF deployment in Greece follows the same pattern, with no commercial-scale installations to date. However, there is a growing research effort regarding the identification of suitable areas for OWF deployment based on technical, environmental, and socio-economic criteria applying methodologies such as Geographic Information System (GIS)-based multi-criteria decision analysis (MCDA). Indeed, the combination of GIS and MCDA has been a widely used tool for the identification and the selection of suitable sites for the installation (e.g., [11,12,13]). Among the MCDA methods, the Analytic Hierarchy Process (AHP) is the most widely employed for OWF planning, indicating its popularity and reliability due to its simplicity and ease of application [14].
Several studies have explored OWF deployment in Greece, mostly focusing on specific regions, rather than the national marine area [15]. For instance, Tsarknias et al. [16] and Gkeka and Tsoutsos [17] examine potential OWF sites around Crete, while Gazos and Vagiona [18] evaluate the suitability of the marine area in Thrace. Additionally, Stefanakou et al. [19] broaden the scope to include the Aegean Sea in their search for suitable OWF locations. Furthermore, Spyridonidou et al. [15] and Vagiona and Karanikolas [20] have attempted to evaluate OWF deployment across the entire Greek marine area. Most of the relevant studies have examined the optimal locations for bottom-fixed turbines (e.g., [17,20,21]) or both bottom-fixed and floating (e.g., [19,22]). On the other hand, Spyridonidou et al. [15] and Tsarknias et al. [16] focus on evaluating Greek marine areas for optimal floating OWF deployment. Overall, these studies highlight an increasing advancement in the spatial and methodological approaches used for OWF site selection in Greece. However, they also reveal a common gap: the lack of climate change scenario integration in identifying locations that will remain resilient in the long term. Climate change is anticipated to influence wind resources in terms of spatial distribution and temporal variability [23,24], as well as sea levels, affecting the suitability, safety, and economic viability of OWFs. By considering future climate scenarios, planners can assess future conditions, identify areas that will remain viable, optimize the lifespan of the wind farms, and reduce potential damages, ultimately supporting more reliable and sustainable renewable energy development.
The process of selecting sites for OWFs is a complex, MCDM challenge [15], requiring comprehensive Marine Spatial Planning (MSP) approaches. Indeed, MSP constitutes a policy framework to optimize marine space allocation to various activities to avoid negative interactions and improve synergies [25]. As such, it provides an ideal foundation for identifying the most suitable locations for OWFs [26], taking into account various technical, environmental, and safety constraints.
Here, we contribute to the OWF planning in Greece by developing a GIS-based MCDM approach employing the AHP to identify suitable sites for floating OWFs in Greek waters. The approach incorporates various regulatory, physical, technical, environmental and safety criteria, evaluated by relevant stakeholders, aligning with MSP principles that emphasize stakeholder engagement [27]. Furthermore, future climate change projections, namely wind velocity and sea level alterations, are incorporated to monitor how optimal OWF locations may shift over time. The analysis relies exclusively on publicly available spatial data to ensure reproducibility. The results are anticipated to facilitate relevant funding allocation while providing input for climate-smart marine spatial plans.

2. Materials and Methods

2.1. OWF Site Selection Framework

The methodological framework follows a structured MCDM approach for the identification of optimal OWF locations. The framework consists of six (6) consecutive steps, as shown in Figure 1. Step 1 involves selecting the case study and defining its boundaries, in this case, the entire marine area of Greece. Step 2 refers to the collection of publicly available spatial and environmental data. The data are analyzed using GIS tools (ArcGIS version 10.8). This step establishes a baseline of current conditions, including technical, environmental, and legal constraints relevant to OWF deployment, as well as future conditions under climate change scenarios for certain datasets (i.e., wind velocity and water depth). During Step 3, exclusion zones are identified based on absolute constraints (i.e., Exclusion criteria ExC) that prohibit wind farm installation. These areas are mapped and excluded from further analysis. Step 4 involves the definition of a set of techno-economic, environmental, and safety criteria (i.e., Evaluation criteria EvC) relevant to the site selection of OWFs. These criteria represent the factors that influence the relative suitability of each location within the remaining available area. In Step 5, the relative importance of each EvC is determined through the AHP, based on pairwise comparisons conducted by selected experts. The process ensures that expert judgment is systematically integrated into the process. In Step 6, a Weighted Linear Combination (WLC) method is applied to combine the standardized scores of the EvC with their corresponding weights. This leads to the calculation of the Final score (FS) for each spatial unit. The result is the final map indicating the most suitable areas for OWF installation under historical reference and future climate conditions. The method enables a transparent and reproducible framework for similar MSP applications with a focus in the offshore wind sector.

2.2. Study Area (Step 1)

Greece is situated in southeastern Europe located at the crossroads of Europe, Asia, and Africa. It shares land borders with Albania, North Macedonia, Bulgaria (north), and Turkey (east), and is surrounded by the Aegean Sea (east), the Ionian Sea (west), the Sea of Crete and the Mediterranean Sea (south). Its coastline, among the longest in the Mediterranean, spans approximately 16,000 km. The country comprises more than 3000 islands, the majority of which are located in the Aegean Sea [22]. According to the 2021 national population census, the country had a permanent population of approximately 11 million inhabitants. The study area exhibits high annual average wind speeds, reaching up to 8 m/s at 10 m above mean sea level, particularly in parts of the Aegean Sea and offshore regions near Crete [28,29]. Based on average wind speed data, the unconstrained technical potential for offshore wind energy production in Greece by 2030 is estimated to be just under 1000 terawatt-hours (TWh) [30].
The marine boundaries of the Greek Exclusive Economic Zone (EEZ) used in this study (Figure S1) are the ones announced via the Council of Ministers Act (CM Act 6/25, Government Gazette GG. 227/17.04.2025/Δ’), which formalizes the adoption of the National Spatial Strategy for the Marine Space (NSSMS). While the NSSMS does not yet assign spatially defined uses within Greek territorial waters, it establishes the country’s first comprehensive regulatory framework for the spatial organization and governance of its marine space [31]. The adopted map delineates internationally recognized boundaries, including bilaterally agreed maritime zones with Italy and Egypt (EEZ). In regions where bilateral agreements have not yet been concluded—most notably with Turkey and Libya—median lines are provisionally applied, in accordance with Greek legislation and international norms. OWF development is currently legally feasible only within Greek territorial waters However, the significant economic and environmental advantages of OWF projects may support the pursuit of future bilateral agreements or international negotiations [32]. As with all EU Member States with a marine EEZ, Greece has incorporated the EU Directive 2014/89 on MSP [33] into national law (Law 4546/2018, GG. 101/A’), thereby obligating the country to develop and submit national maritime spatial plans.

2.3. Data Collection (Step 2)

To identify and analyze the legal, technical, environmental, and social characteristics of the Greek EEZ that influence the planning and operation of OWFs, publicly available cartographic data were compiled and analyzed using ArcGIS. The European Marine Observation and Data Network (EMODnet) database [34], where all EU member states are required to submit their official spatial datasets—served as the primary source for data on: (i) bathymetry, (ii) shipping routes, (iii) fishing activity zones, and (iv) military exercise areas. Additional geospatial datasets were retrieved from the THAL-CHOR 2 platform [35], a digital repository developed under the EU-funded Interreg Greece–Cyprus program. These included information on: (v) underwater antiquities, (vi) cultural monuments, (vii) archeological sites, (viii) traditional settlements, and (ix) underwater telecommunications infrastructure. The platform provides access to raw spatial layers and accompanying metadata suitable for integration and geospatial analysis. Underwater electricity cable maps (x) were digitized from an image file available on the official website of the Independent Power Transmission Operator (IPTO) [36]. Spatial layers related to (xi) Natura 2000 sites, (xii) coastal bathing waters, (xiii) airports, and (xiv) human settlements were sourced from GEODATA [37], the official Greek national geospatial information portal. Data on (xv) Important Bird Areas (IBAs) were obtained from the Hellenic Ornithological Society (HOS) [38], and (xvi) Areas of Outstanding Natural Beauty (AONBs) were accessed via the Filotis biodiversity database [39]. Distribution maps of (xvii) seagrass meadows were extracted from [40], and (xviii) Greek port locations were acquired from the European Atlas of the Sea database [41]. Hindcast and projected wind velocity data (xix) were obtained from the Copernicus Climate Data Store [42], and specifically the “CORDEX regional climate model data on single levels” dataset. Wind velocity data timeseries were extracted for the Mediterranean Sea region at a 0.11° × 0.11° spatial resolution and a temporal step of 6 h. They were then processed for three 30-year periods: (a) 1981–2010, (b) 2011–2040, and (c) 2041–2070. These intervals were selected to reflect the typical 30-year design lifetime of OWFs, during which turbines are expected to operate reliably and safely. Moreover, 30-year periods are commonly adopted in climate studies to ensure consistency, statistical robustness, and comparability across datasets. Projections for (xx) sea level rise were also collected from the NASA Sea Level Projection Tool [43] based on the Sixth Assessment Report (ASR6) the Intergovernmental Panel on Climate Change (IPCC) [44]. Sea level rise (SLR) data were then reported as a distinct value, considered as the average of the median values for the whole Greek pelagic region, for the two future periods: 2011–2040 and 2041–2070 which was then added to the water depth of the historical period. To assess the impact of climate change on OWF site selection, values for annual average wind velocity and water depth were adjusted according to two Representative Concentration Pathway (RCP) scenarios: (i) RCP 4.5, representing a moderate emissions pathway where CO2 emissions peak around 2040 and subsequently decline, and (ii) RCP 8.5, a high-emissions scenario assuming continued growth in greenhouse gas emissions throughout the 21st century. The combination of the two time periods with the two RCPs yielded four (4) distinct future OWF site selection scenarios, enabling an assessment of climate change effects under both medium- and high-emission trajectories. Examples of raw data used in the analysis are presented in Figure S2a–d.

2.4. Exclusion of Unsuitable Areas for OWF Site Selection (Step 3)

The first stage of data processing involved the Exclusion Stage, conducted using ArcGIS. This phase aimed to identify and eliminate areas where the installation of OWFs is not feasible. A total of 19 constraints, referred to as Exclusion Criteria (ExC; see Table 1), were applied, based on techno-economic, environmental, social, and safety considerations. These criteria were established in alignment with the national legislative framework and are discussed in detail below. As part of this study, an exhaustive review of the relevant literature was conducted to identify all potential constraints that may influence the planning and deployment of OWFs, with the aim of delineating the most suitable areas for development.

Exclusion Criteria

ExC1: Water Depth
Floating wind turbines are particularly suited for water depths ranging from 50 m to over 1000 m. In particular, Refs. [45,46] note that once water depths exceed 60 m, floating wind solutions become more favorable, primarily because fixed-bottom structures become increasingly costly and technically challenging. In line with this, Ref. [47] report that floating wind turbines are effectively deployable in depths between 50 m and 500 m. The maximum installation depth depends on the specific type of floating platform. Spar Buoy, Semi-submersible, and Barge platforms can be deployed at depths of up to 1000 m, whereas Tension Leg Platforms (TLPs) are generally limited to a maximum depth of around 350 m [16]. Therefore, all areas with water depth below 50 m or over 1000 m are deemed to be unsuitable and thus excluded from further evaluation. For the criterion of water depth both the present-day bathymetry and projected changes due to future SLRare considered, based on future scenarios (RCP 4.5 and RCP 8.5) for the timeframes 2011–2040 and 2041–2070.
ExC2: Annual Average Wind Velocity
Wind velocity is a critical parameter in the selection of suitable OWF sites as it directly influences both energy production potential and the economic viability of a project. Typically, the minimum wind speed at which a wind turbine begins to generate electricity (i.e., cut-in speed) is approximately 4 m/s at turbine hub height [48]. However, a minimum threshold of 6 m/s in average annual wind speed is generally required to ensure cost-effective operation [21,22,49]. Furthermore, advanced reanalysis data are necessary for accurately evaluating offshore wind energy potential across global EEZs, underscoring their importance in supporting reliable wind resource assessments [50]. In this study, areas with average wind velocity lower than 6 m/s at 100 m above sea level are considered unsuitable and excluded from the evaluation [20,22,51]. While it is recognized that wind turbines have an upper operational limit, commonly referred to as the cut-out wind speed, typically around 25 m/s depending on the turbine model, this factor was not explicitly included in the exclusion framework, as our dataset did not provide maximum or extreme wind values. The annual average wind speeds observed across the study area remain well below critical cut-out thresholds. Future research could benefit from the integration of extreme wind event projections to assess potential risks to operational reliability in high-wind regions. To investigate the influence of climate change on wind patterns, both historical (hindcast) and future (forecast) data were incorporated, covering the periods 1981–2010, 2011–2040 and 2041–2070 under the RCP 4.5 and RCP 8.5 emission scenarios. Since the Copernicus Climate Data Store [42] provides wind speed data at a standard height of 10 m, wind speeds were extrapolated to 100 m, reflecting typical hub heights for modern offshore turbines (approximately 80–120 m). This vertical adjustment was performed using the logarithmic wind profile (Equation (1)), under the assumption of neutral atmospheric stability.
U z = U ( z r e f ) ln z z 0 ln z r e f z 0
where z is the height of 100 m, zref is the height of 10 m, and z0 is the sea surface roughness length of 0.0002 m.
ExC3: Environmentally Protected Areas (EPAs)-Natura 2000
EPAs-Natura 2000 include the sites of Natura 2000 network, which are designated due to the presence of vulnerable species and habitats of high ecological value. These areas support priority habitats, breeding seabirds, migratory corridors, and marine mammals, which are essential for maintaining ecological balance and supporting wildlife [52,53].
While EU legislation, specifically Article 6(4) of the Habitats Directive (92/43/EEC) [54], permits development within Natura 2000 sites under exceptional circumstances, such cases must be rare, rigorously justified, and subject to strict conditions. Treating these sites as routinely available for infrastructure projects would undermine the integrity of the EU’s conservation framework [55] and establish a harmful precedent for the future management of protected areas.
Although offshore wind farms constitute a low-emission source of energy, their development imposes considerable ecological pressures. These include the disturbance and displacement of seabirds [56], underwater noise pollution during construction, which impacts fish and marine mammals [57] and habitat loss or degradation from underwater cable installations.
Given these risks, Natura 2000 areas are considered incompatible with OWFs and are therefore excluded from further assessment. Moreover, a buffer zone extending up to 1 km [16,21] from the boundaries of Natura 2000 sites is also excluded, as a precautionary measure to mitigate potential adverse impacts on adjacent protected environments.
ExC4: EPAs—Areas of Outstanding Natural Beauty (AONBs)
EPAs–AONBs encompass a wide range of protected areas beyond the Natura 2000 network. These areas include National Parks, established under Greek national legislation; wildlife refuges; UNESCO World Heritage Sites and Biosphere Reserves; Ramsar Wetlands of International Importance; and Marine Protected Areas (MPAs) that are not designated under the Natura 2000 framework. Many of these marine areas fall under additional protective mechanisms, such as the EU Marine Strategy Framework Directive or regional conventions, including the Barcelona Convention. An example of such MPAs is the new marine national park in the Ionian Sea, established in 2024, which lies outside the Natura 2000 network. This park is considered a flagship AONB, with enhanced protection measures, including a nationwide ban on bottom trawling by 2026 and full Marine Protected Area status by 2030 [58,59].
In line with the exclusion of EPAs within the Natura 2000 network, all EPAs identified as AONBs are excluded from further consideration for OWF site selection. Furthermore, a buffer zone of 1 km surrounding these areas is also excluded, as a precautionary measure to mitigate potential environmental impacts.
ExC5: EPAs—Important Areas for Birds (IBAs)
Greece hosts more than 190 IBAs [60], sites recognized as crucial breeding, wintering, and stopover habitats for vulnerable, migratory, or regionally important bird species. These areas often extend beyond or overlap with Natura 2000 spatial protections [61], reflecting EPAs designated specifically for bird conservation. The HOS [38] has identified and listed these areas. In line with the exclusion of EPAs within the Natura 2000 network, all EPAs identified as IBAs are excluded from further consideration for the site selection of OWFs. In addition, a buffer zone of 3 km [15,21,62,63] around these areas is also excluded, as a precautionary measure to minimize potential adverse impacts on bird populations and associated habitats, as offshore wind turbines have been reported to cause significant bird mortality when deployed in transit zones for bird migrations. Although full migratory routes are not publicly available in geospatial format, IBAs serve as a reliable proxy for key points along migration flyways. A recent study [32] digitized such routes, but the primary data are not openly accessible and were therefore not used in this study.
ExC6: EPAs—Seagrass Meadows
Seagrass meadows are among the most valuable coastal ecosystems globally, providing a wide array of ecological goods and services [64]. In the Mediterranean, the endemic species Posidonia oceanica plays a particularly important role, with an estimated coverage in Greece ranging between 2300 and 2600 km2 within the infralittoral zone. Of this total, approximately 700 km2 fall within the boundaries of the Natura 2000 network [65]. However, the extent of mapped P. oceanica meadows in Greece remains limited, with only about 450 km2 documented to date, corresponding to roughly 8% of the national coastline [66,67].
Given these limitations, remote sensing approaches, such as those based on Landsat-8 satellite imagery [40], have been employed in this study to support spatial analysis and enhance mapping accuracy. Despite that recent research suggests that floating OWFs may offer potential benefits for marine habitat enhancement, when they are carefully planned and managed [68], precaution remains necessary. Both natural disturbances and human-induced pressures can have severe impacts on seagrass ecosystems [69], highlighting the importance of continuous environmental monitoring during the planning, construction, and operational phases of offshore wind energy projects.
In the context of this study, and in the absence of comprehensive national mapping, all identified seagrass meadows, along with a 1 km buffer zone surrounding them, have been excluded from consideration as potential locations for OWF deployment. As P. oceanica typically extends down to 40 m depth in clear Mediterranean waters, such as those surrounding Greece, OWFs constitute a better solution than bottom-fixed wind farms, as they will be deployed beyond the depth range supporting seagrass meadows.
ExC7: Areas of Cultural Heritage (CHAs)-Underwater Antiquities
According to the Greek Law (L. 3028/2002, GG. 153/A’ Art. 15), the opinion of the Ephorate of Underwater Antiquities is needed when planning an OWF, as its core responsibilities include the regulation of marine and underwater activities that may cause direct or indirect damage to antiquities [26]. All these areas, as well as a 1 km zone surrounding them are excluded from further consideration.
ExC8: CHAs—Monuments
All areas of cultural heritage listed as World Heritage List monuments, archeological sites and heritage sites of major importance (para. 5. Section ββ of Article 50, Law 3028/02) are excluded from further assessment, along with a buffer zone of 3 km around them [26].
ExC9: CHAs—Archeological and Historical Sites
All areas of archeological and historical importance (e.g., monasteries), which are not listed as monuments, as well as a buffer zone of 500 m around them, are excluded from further consideration (Ministerial Decree 49828/2008, GG. 2464/Β’).
ExC10: CHAs—Traditional Settlements
In accordance with Greek legislation, OWF developments must maintain a minimum distance of 1500 m from traditional settlements (Ministerial Decree 49828/2008, GG. 2464/Β’). Consequently, these areas, along with a 1.5 km buffer surrounding them, were excluded from the analysis.
ExC11: Human Settlements
The installation of wind turbines in nearshore areas can lead to a range of environmental and socio-economic impacts, including visual and noise disturbances, as well as aesthetic degradation [70]. To mitigate these effects, Greek legislation (Ministerial Decree 49828/2008, GG 2464/Β’) mandates a minimum setback distance of 1000 m from human settlements for wind turbine installations. Accordingly, in this study, these areas—along with a 1 km buffer zone—were excluded from the spatial analysis.
ExC12: Bathing Coasts
To minimize visual and noise disturbances, all designated bathing coasts were excluded from consideration as candidate sites for OWF deployment, along with an additional 1.5 km buffer seaward, in accordance with the criteria proposed by Melissas and Asprogerakas [26].
ExC13: Areas of Military Exercise
Military exercise zones are used by the National Army for live-fire drills, naval training, submarine maneuvers, and aerial exercises. Due to the inherent safety risks associated with these operations, the installation of OWFs within these zones is not feasible. Consequently, such areas have been excluded from consideration as potential sites for OWF deployment [15,16,22].
ExC14: Marine Routes
OWFs situated in close proximity to established marine routes present considerable risks, including vessel collisions, navigational interference, and obstruction of emergency operations, thereby compromising maritime safety and operational efficiency. Consequently, these areas were excluded from further assessment, along with an additional 500 m buffer zone surrounding them [16,71].
ExC15: Fisheries Areas
Current expansion in OWF development has resulted in increased conflict with fishermen, who fear being excluded from OWF areas, as well as MPAs, and the exploration of the possibility of co-location between fisheries and offshore wind farms (e.g., [72,73]). However, the feasibility of such coexistence is highly dependent on legal regulations [74], site-specific conditions, effective MSP, and stakeholder collaboration [75]. The risks of co-existence include alterations in fish and shellfish populations [76,77], disruption of essential habitats and migratory routes [10], gear loss or damage [78] and increased user conflict in already congested marine spaces [79]. Therefore, in the context of this study, all designated fishing areas in Greece, as identified by the Hellenic Statistical Authority [80] have been excluded from further analysis, along with an additional zone of 500 m surrounding them.
ExC16: Areas of Aquaculture
Although the co-location of OWFs and aquaculture sites is an emerging field of research [81,82,83], particularly in EEZs where marine space is limited [84], several significant challenges remain. These include engineering constraints associated with high-energy offshore environments, ecological concerns such as altered hydrodynamic regimes [81] and regulatory complexity stemming from overlapping administrative jurisdictions [85]. Whereas aquaculture is likely to be compatible with OWFs, this will involve setting OWF parks first. The latter is an impactful activity requiring large vessel movement in the area, and then deploying design-for purpose aquaculture areas within the OWF space. Therefore, OWFs cannot be deployed in existing aquaculture areas. In light of these factors, this study excludes all Areas of Organized Development of Aquaculture Activities, as designated by the Greek Ministry of Environment and Energy, from consideration as potential OWF deployment zones, along with an additional 500 m buffer around each.
ExC17: Airports
Similar to the risks associated with developing OWFs near marine routes, floating wind farms should be located at a safe distance from airports, as their presence may interfere with radar systems, navigational aids, and aircraft operations during take-off and landing [86]. All airports, as well as an area of 3 km around them were excluded from further evaluation [17,87].
ExC18: Underwater Cables (UC)—Telecommunication
This exclusion criterion refers to existing underwater telecommunication cables (e.g., [15,17]. It is crucial to account for the precise routing of these cables to avoid any potential damage during the installation of OWF infrastructure. To ensure the protection of existing installations, an additional buffer zone of 500 m has been established around identified telecommunication cable route [88,89].
ExC19: UC–Energy
Similar to the exclusion criterion refers to existing underwater telecommunication cables, a proper distance should be kept from existing underwater cables serve for electricity transmission (e.g., [15,17]). To ensure the protection of existing installations, an additional buffer zone of 500 m has been established around identified energy cable routes.
The initial phase of the spatial analysis employs Boolean logic, following the methodology outlined by Malczewski [90,91] and Stefanakou et al. [19]. Nineteen (19) exclusion layers are generated based on the ExC. Each layer is converted into a binary raster grid, where cell values are assigned either 1 or 0, indicating the absence or presence of a restriction, respectively. In particular, a value of 0 is assigned to cells where a particular constraint is present, while a value of 1 indicates that the cell is not affected by that specific constraint. The binary reclassification of each exclusion layer is conducted using the Spatial Analyst ArcGIS extension. The outcome of this process is 19 individual binary constraint maps, each identifying areas that either comply with or violate one exclusion condition. Subsequently, these binary layers are combined through a cell-by-cell multiplication using the Map Algebra (i.e., Raster Calculator), also part of the same toolset. This process yields the final exclusion map, where only those cells assigned a value of 1 in all input layers are preserved, representing locations unaffected by any exclusion criteria and therefore considered suitable for subsequent analysis.

2.5. Determination of Evaluation Criteria (Step 4)

Following the exclusion process, the remaining areas were further evaluated using 10 Evaluation Criteria (EvC; Table 2), encompassing techno-economic, environmental, and safety-related factors that influence the feasibility of OWF deployment. The EvC are described in detail below. Although socio-economic constraints were considered during the exclusion stage, the evaluation focused mainly on technical and environmental factors. The spatial analysis applied at this stage follows a deterministic logic framework, which assumes that site suitability varies continuously based on multiple influencing parameters [19]. Accordingly, 10 individual evaluation layers were created in GIS. To enable their integration, all criteria were standardized to a common measurement scale ranging from 0 (i.e., unsuitable/restricted) to 1 (i.e., highly suitable). This standardization was achieved through linear transformation within the defined range [0, 1], with higher values indicating greater suitability according to each criterion. For EvC3–EvC10, the Euclidean distance from the boundaries of these areas was considered. The distance is calculated with the Euclidean distance tool of ArcToolbox.

Evaluation Criteria

EvC1: Water Depth
Water depth has significant techno-economic implications in the choice of the OWFs’ location [22]. The greater the water depth, the higher the costs of construction, design, maintenance, and energy transmission [92]. After excluding areas unsuitable for floating wind technology, the remaining candidate sites were assessed more favorably when located in shallower waters.
EvC2: Annual Average Wind Velocity
Wind velocity is a key factor influencing the energy output of OWFs and the overall financial viability of such investments, making it one of the most critical criteria in site selection [93]. In this study, a minimum average wind speed threshold of 6 m/s was established, and candidate areas exhibiting higher average wind velocities were assigned higher suitability scores.
EvC3: Environmentally Protected Areas (EPAs)–Natura 2000
The installation of wind turbines in close proximity to ecologically sensitive areas may pose risks to biodiversity and ecosystem integrity, as outlined in Step 2. Consequently, candidate areas for OWF deployment located at greater distances from the boundaries of Natura 2000 sites were assigned higher suitability values.
EvC4: EPAs—Areas of Outstanding Natural Beauty (AONBs)
Similar to EvC3, areas situated farther from the boundaries of AONBs were considered more suitable for OWF deployment and were assigned higher suitability scores.
EvC5: EPAs—Important Areas for Birds (IBAs)
To minimize the risk of bird collisions and potential disruption to migratory pathways, areas located farther from IBAs were considered more suitable for OWF deployment and were accordingly assigned higher suitability scores.
EvC6: EPAs—Seagrass Meadows
To mitigate potential risks associated with the installation and operation of OWFs to seagrass meadows, candidate sites located farther from the boundaries of areas containing these habitats were evaluated with higher suitability scores.
EvC7: Marine Routes
To ensure the safety of the maritime traffic and prevent conflicts with existing marine uses, OWFs should be located at a safe distance from established shipping routes [51,94]. Accordingly, candidate OWF sites situated in close proximity to major shipping lanes are assigned lower suitability scores in the analysis.
EvC8: Airports
To mitigate operational and safety risks associated with the proximity of wind turbines to airport zones, candidate OWF sites situated closer to airports are assigned lower suitability values.
EvC9: Ports
Proximity to port facilities indicates lower installation, maintenance and decommissioning costs [19]. Therefore, candidate OFW sites located nearer to ports are assigned higher suitability values.
EvC10: UC–Energy
Although potential interactions of OWFs with the electrical network may have significant adverse effects [19], proximity to the high-voltage transmission grid (e.g., 150 kilovolts) is crucial for ensuring efficient electricity transfer from OWFs to consumers, minimizing energy losses [16]. In this study, following the exclusion of all areas containing underwater cables and their associated buffer zones, as described in Step 2, candidate sites located closer to the high-voltage grid were assigned higher suitability values.

2.6. Weighting the Evaluation Criteria (Step 5)

2.6.1. The Analytic Hierarchy Process (AHP)

The AHP, introduced by Saaty in 1980 [95], is a widely used MCDM method designed to analyze complex problems by decomposing them into a hierarchical structure. The process is extensively applied in studies focused on identifying by studies optimal locations for OWFs (e.g., [11,12,17,19]) and is particularly suitable when quantitative data is available [12] and expert judgment is needed to evaluate multiple conflicting criteria. The standard application of AHP involves three main stages [96]: (i) Problem definition and structuring: The goal is defined at the top level of the hierarchy, followed by the selection of relevant criteria and sub-criteria, and decision alternatives at the bottom level; (ii) Pairwise comparison of criteria (i.e., EvC in this study): Experts compare criteria two at a time using a structured scale of relative importance; (iii) Derivation of priority weights: The relative importance (i.e., weights) of criteria are calculated and consistency of judgments is assessed.
Pairwise comparisons are conducted based on Saaty’s [97] fundamental scale of judgements (Table 3). As part of the AHP, each pairwise comparison is recorded in a square matrix A according to Equation (2), of order n × n where n is the number of criteria under consideration. Each element aij of the matrix represents the relative importance of criterion i over criterion j, assuming that the importance of criterion i over criterion j is k, then, based on the reciprocal judgment, the relative importance of criterion j over criterion i is 1/k [96]. Consequently, in matrix A, aji = 1/aij and aij = 1 for i = j = 1, …, n.
A = 1 a 12 a 1 n 1 a 12 1 a 2 n 1 a 1 n 1 a 2 n 1
To calculate the priority vector w, which represents the relative weight (importance) of each criterion, matrix A (Equation (2)) is normalized by dividing each element aij by the sum of its respective column. The weights are obtained by computing the average of each row of the normalized matrix (Equation (3)):
w   =   1 n j = 1 n a ij k = 1 n a kj ,   for   i   =   1 , , n
The presence of bias in human thinking implies the need for inconsistency checks [98]. Consistency is assessed using Equations (4) and (5) to calculate the Consistency Index (CI) and Consistency Ratio (CR), respectively:
CI   =   λ max     n n     1
CR = CI RI
where λmax is the principal eigenvalue of matrix A, n is the matrix size (i.e., number of criteria), and RI is the random consistency index ([97]; Table 4).
A CR value below 0.10 indicates acceptable consistency. If the CR exceeds this threshold, the judgments must be revisited. In this study, the matrix size was 10 × 10, corresponding to the 10 EvC, and the RI is equal to 1.49 (Table 4). The RI represents the average CI of a large number of randomly generated pairwise comparison matrices of the same order (n = 10 in this case). It serves as a benchmark for evaluating the consistency of expert judgments through the CR, helping ensure that the pairwise comparisons are not arbitrarily assigned.

2.6.2. Expert Judgment

While many international studies employ purely mathematical methods to determine criterion weights, relying on literature and theoretical models, such approaches often overlook the insights of relevant stakeholders [22,99]. This omission may result in inaccurate or misleading outcomes [17]. Therefore, the relative weights in this study were derived from 15 individuals involved in the energy sector and the planning of OWFs.
The selection of 15 experts aligns with established practices in MCDM and AHP-based spatial planning studies. Comparable OWF siting applications have employed expert panels of varying sizes, such as 11 experts [12], 21 stakeholders [100], and 33 experts [17]. Similarly, expert-based frameworks in related fields, as flood risk management, have employed similar panel sizes, with [101] engaging 6 experts and [102] involving 12 experts in AHP-MCDA evaluations. These examples suggest that small-to-moderate expert panels are a common and appropriate practice in similar methodological applications.
The panel included professionals from a range of relevant domains, including coastal engineering, MSP, environmental science, marine ecology, port operations, and energy policy. To minimize bias associated with any single disciplinary background, experts were purposefully selected to reflect a broad range of professional experience across the offshore wind sector. This interdisciplinary composition ensured a balanced perspective that reflects the technical, environmental, and regulatory dimensions of OWF planning. A structured questionnaire was developed and administered online. Participants were required to complete 45 pairwise comparisons, after reviewing a supplementary document that outlined the AHP, as well as detailed descriptions and objectives for each of the 10 EvC (Table 2). In cases where the calculated CR exceeded 0.10—indicating inconsistent judgments—participants were asked to reassess and revise their comparisons. For each criterion, the final weight was determined by calculating the arithmetic mean of the 15 individual priority values assigned by the experts. This approach ensures that each expert contributes equally and that the aggregated weights comply with the Pareto principle [103].
The aggregated priority for each criterion Cj is given by Equation (6):
w agg   =   1 n i = 1 n P i ( C J )
where wagg is the final aggregated weight for criterion j, Pi (Cj) is the weight assigned to criterion j by expert i, and n = 15 is the total number of experts.

2.7. Final Suitability Map for OWF Site Selection (Step 5)

Final Scores (FS) of Each Spatial Unit

The Weighted Linear Combination (WLC) method was employed to integrate EvC in the site selection process. This approach involves assigning a specific weight to each criterion based on its relative importance and subsequently aggregating the weighted values to compute an overall suitability score for each spatial unit. Each evaluation layer was first standardized according to Equation (3), then multiplied by its corresponding weight, as determined through the expert judgment process described in Section 2.6.2. These weighted layers were subsequently aggregated using Map Algebra to generate a composite suitability map. The resulting map expresses the final suitability index for offshore wind energy development, with higher values indicating more favorable locations [104]. The suitability index—hereafter referred to as the Final Suitability (FS) score—for each grid cell iii was calculated using the following equation, adapted from Malczewski [105]:
FS i = j = 1 n w aggj × s ij
where FSi is the final suitability score for spatial unit i, waggj is the aggregated weight of criterion j, sij is the standardized score of unit i for criterion j, and n = 10 is the total number of EvC.
The final suitability values of the selected areas were classified according to the Jenks classification method, also known as Jenks natural breaks [106]. The method involves a data clustering technique, commonly used in mapping and spatial analysis, that groups values into classes by minimizing variance within classes and maximizing variance between classes. Five (5) classes were created, namely the ‘very high suitability’, ‘high suitability’, ‘moderate suitability’, ‘low suitability’ and ‘very low suitability’ classes.

3. Results and Discussion

3.1. Exclusion of Unsuitable Marine Areas

To identify marine areas suitable for the development of OWFs in Greece, a comprehensive exclusion-based spatial analysis was conducted. A total of 19 ExC (i.e., ExC1–ExC19 in Table 1), were applied. Previous studies report fewer spatial constraints ranging from four (4) in [19] to 17 in [17]. Typically, the number of ExC used in similar studies is around 10. (e.g., 8 in [22]; 9 in [16] and [51]; 13 in [15]). The inclusion of 19 ExC in this study aimed to integrate all relevant constraints arising from legal, environmental, technical, and safety considerations, thereby ensuring a thorough assessment of spatial feasibility for OWF deployment in Greek waters.
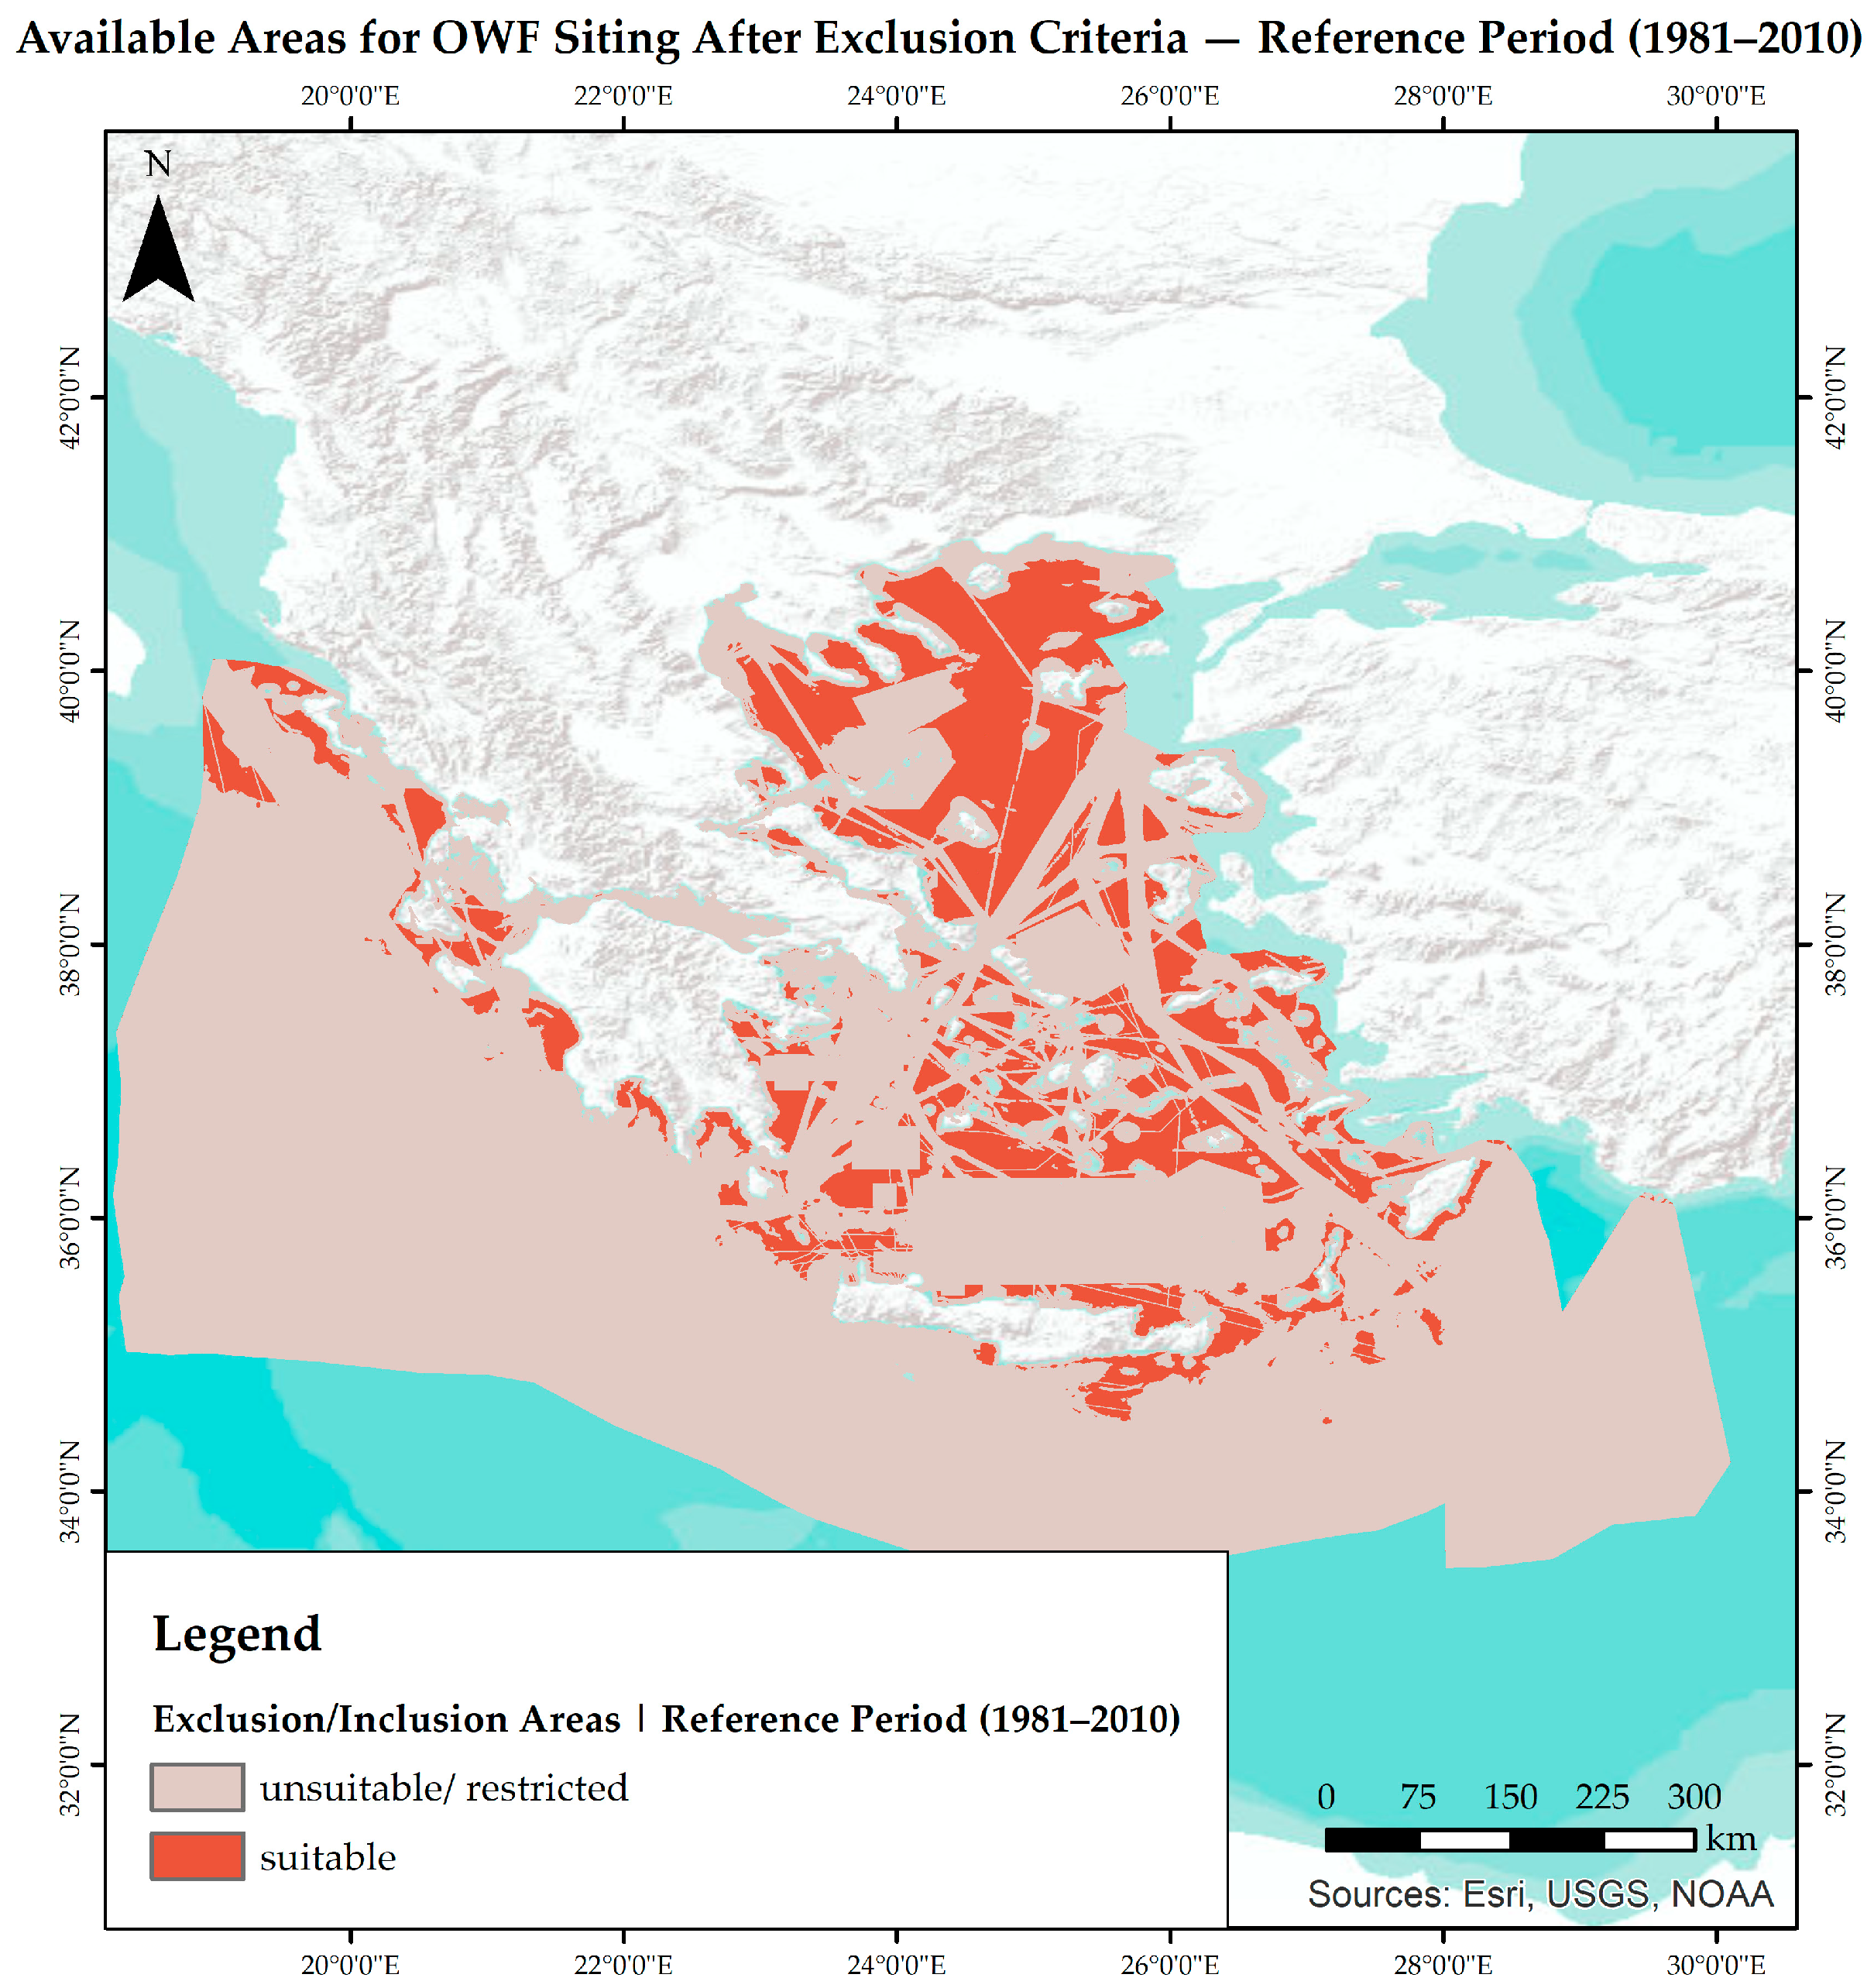
The available marine areas for OWF deployment in Greece are presented in Figure 2 and Figure 3a–d, for five different scenarios: (i) for the reference period 1981–2010, based on hindcast data (Figure 2), for the near-future (2011–2040) under (ii) RCP 4.5 (Figure 3a) and (iii) RCP 8.5 (Figure 3c) and when incorporating mid-century projections (2041–2070) under (iv) RCP 4.5 (Figure 3b) and RCP 8.5 (Figure 3d).
For the reference period (1981–2010), the total marine area deemed suitable for OWF deployment in Greece is estimated at 46,123.40 km2. Under future climate scenarios, this area expands modestly. Specifically, under RCP 4.5, the available area increases by 3.15% for the near-future period (2011–2040) and by an additional 0.52% for the mid-century period (2041–2070). Under RCP 8.5, the corresponding increases are smaller, with 2.76% and 1.95% observed for the same periods, respectively. The selected areas are located within Greek territorial waters, with the exception of approximately 6% that fall within EEZ boundaries in all scenarios. No eligible areas were identified beyond Greek territorial waters or Greece’s EEZ.
The primary driver of this expansion is the projected increase in annual average wind velocity, which results in more spatial units (i.e., grid cells) meeting the minimum threshold of 6 m/s. The proportion of grid cells surpassing this threshold rises by 4.60% and 4.61% under RCP 4.5 (for 2011–2040 and 2041–2070, respectively), and by 4.31% and 4.05% under RCP 8.5. However, an important aspect of future research involves quantifying the uncertainty in wind speed projections, which would provide valuable insights into the robustness of spatial planning decisions for OWFs. While this was not feasible within the scope of the present study, due to data limitations and the aim to use the highest spatial resolution available, future efforts could address this by incorporating different ensemble members or Regional Climate Models (RCMs) to better capture the variability of wind resources under changing climate conditions. In contrast, the area excluded due to water depth remains largely stable across all scenarios, with variations below 0.1% between the hindcast and future conditions. This minor fluctuation confirms that SLR associated with climate change does not substantially alter the availability of suitable depths for floating OWF deployment over the examined periods. An overall increase of approximately 3% in available OWF area when considering future climate conditions translates into the potential installation of approximately 1400 additional turbines, assuming a spacing of approximately 1 km. This estimate is based on the assumption that the newly available area is contiguous and fully usable, with individual turbine capacities ranging from 10 to 15 megawatts (MW).
However, these findings should not be interpreted as evidence that climate change inherently favors OWF deployment. Only projections of water depth (ExC1 in Table 1) and wind velocity (ExC2 in Table 1) were included in this analysis due to data availability. For instance, accessibility for maintenance and repair operations may be adversely affected by more frequent storm events and rising wave heights. A key limitation in the analysis stems from the publicly available wave datasets (e.g., Pan-European wave dataset available at [42]), which provide sea-state data only along the 20 m depth contour. This restricts their applicability for assessing conditions at typical OWF installation depths, which often exceed 60 m. As more detailed global and regional wave projections become available through ongoing research efforts, the proposed methodology could be expanded to incorporate indicators of extreme wave height. This would enable a more comprehensive assessment of OWF resilience and operational accessibility, particularly in the context of climate-related increases in marine weather extremes.
Climate change impacts on other exclusion factors—particularly those related to biodiversity and environmental protection (ExC3-ExC6 in Table 1)—were not assessed. For instance, in a “business-as-usual” scenario, where seagrass meadows, Natura 2000 sites, AONBs and IBAs decline due to environmental degradation and species loss, the available space for OWFs may expand. However, competing human activities, such as shipping, fisheries, aquaculture (ExC14-ExC16 in Table 1), are also likely to increase their spatial claims, potentially offsetting any gains in OWF site selection potential. Recent literature on coexistence strategies between OWFs and marine sectors including fisheries [72] and aquaculture [81] suggests that spatial overlaps may be feasible, reducing the severity of some exclusion constraints. Nonetheless, a systematic, long-term assessment of climate-driven changes in marine habitats is essential. Future efforts should include ecological modeling, updated mapping of sensitive habitats (e.g., seagrass meadows), and improved understanding of environmental thresholds, which may ultimately justify larger buffer zones for these ExC and new spatial planning approaches for OWFs entailing further restrictions, under a changing climate.

3.2. Evaluation of Suitable Marine Areas

3.2.1. Evaluation Criteria

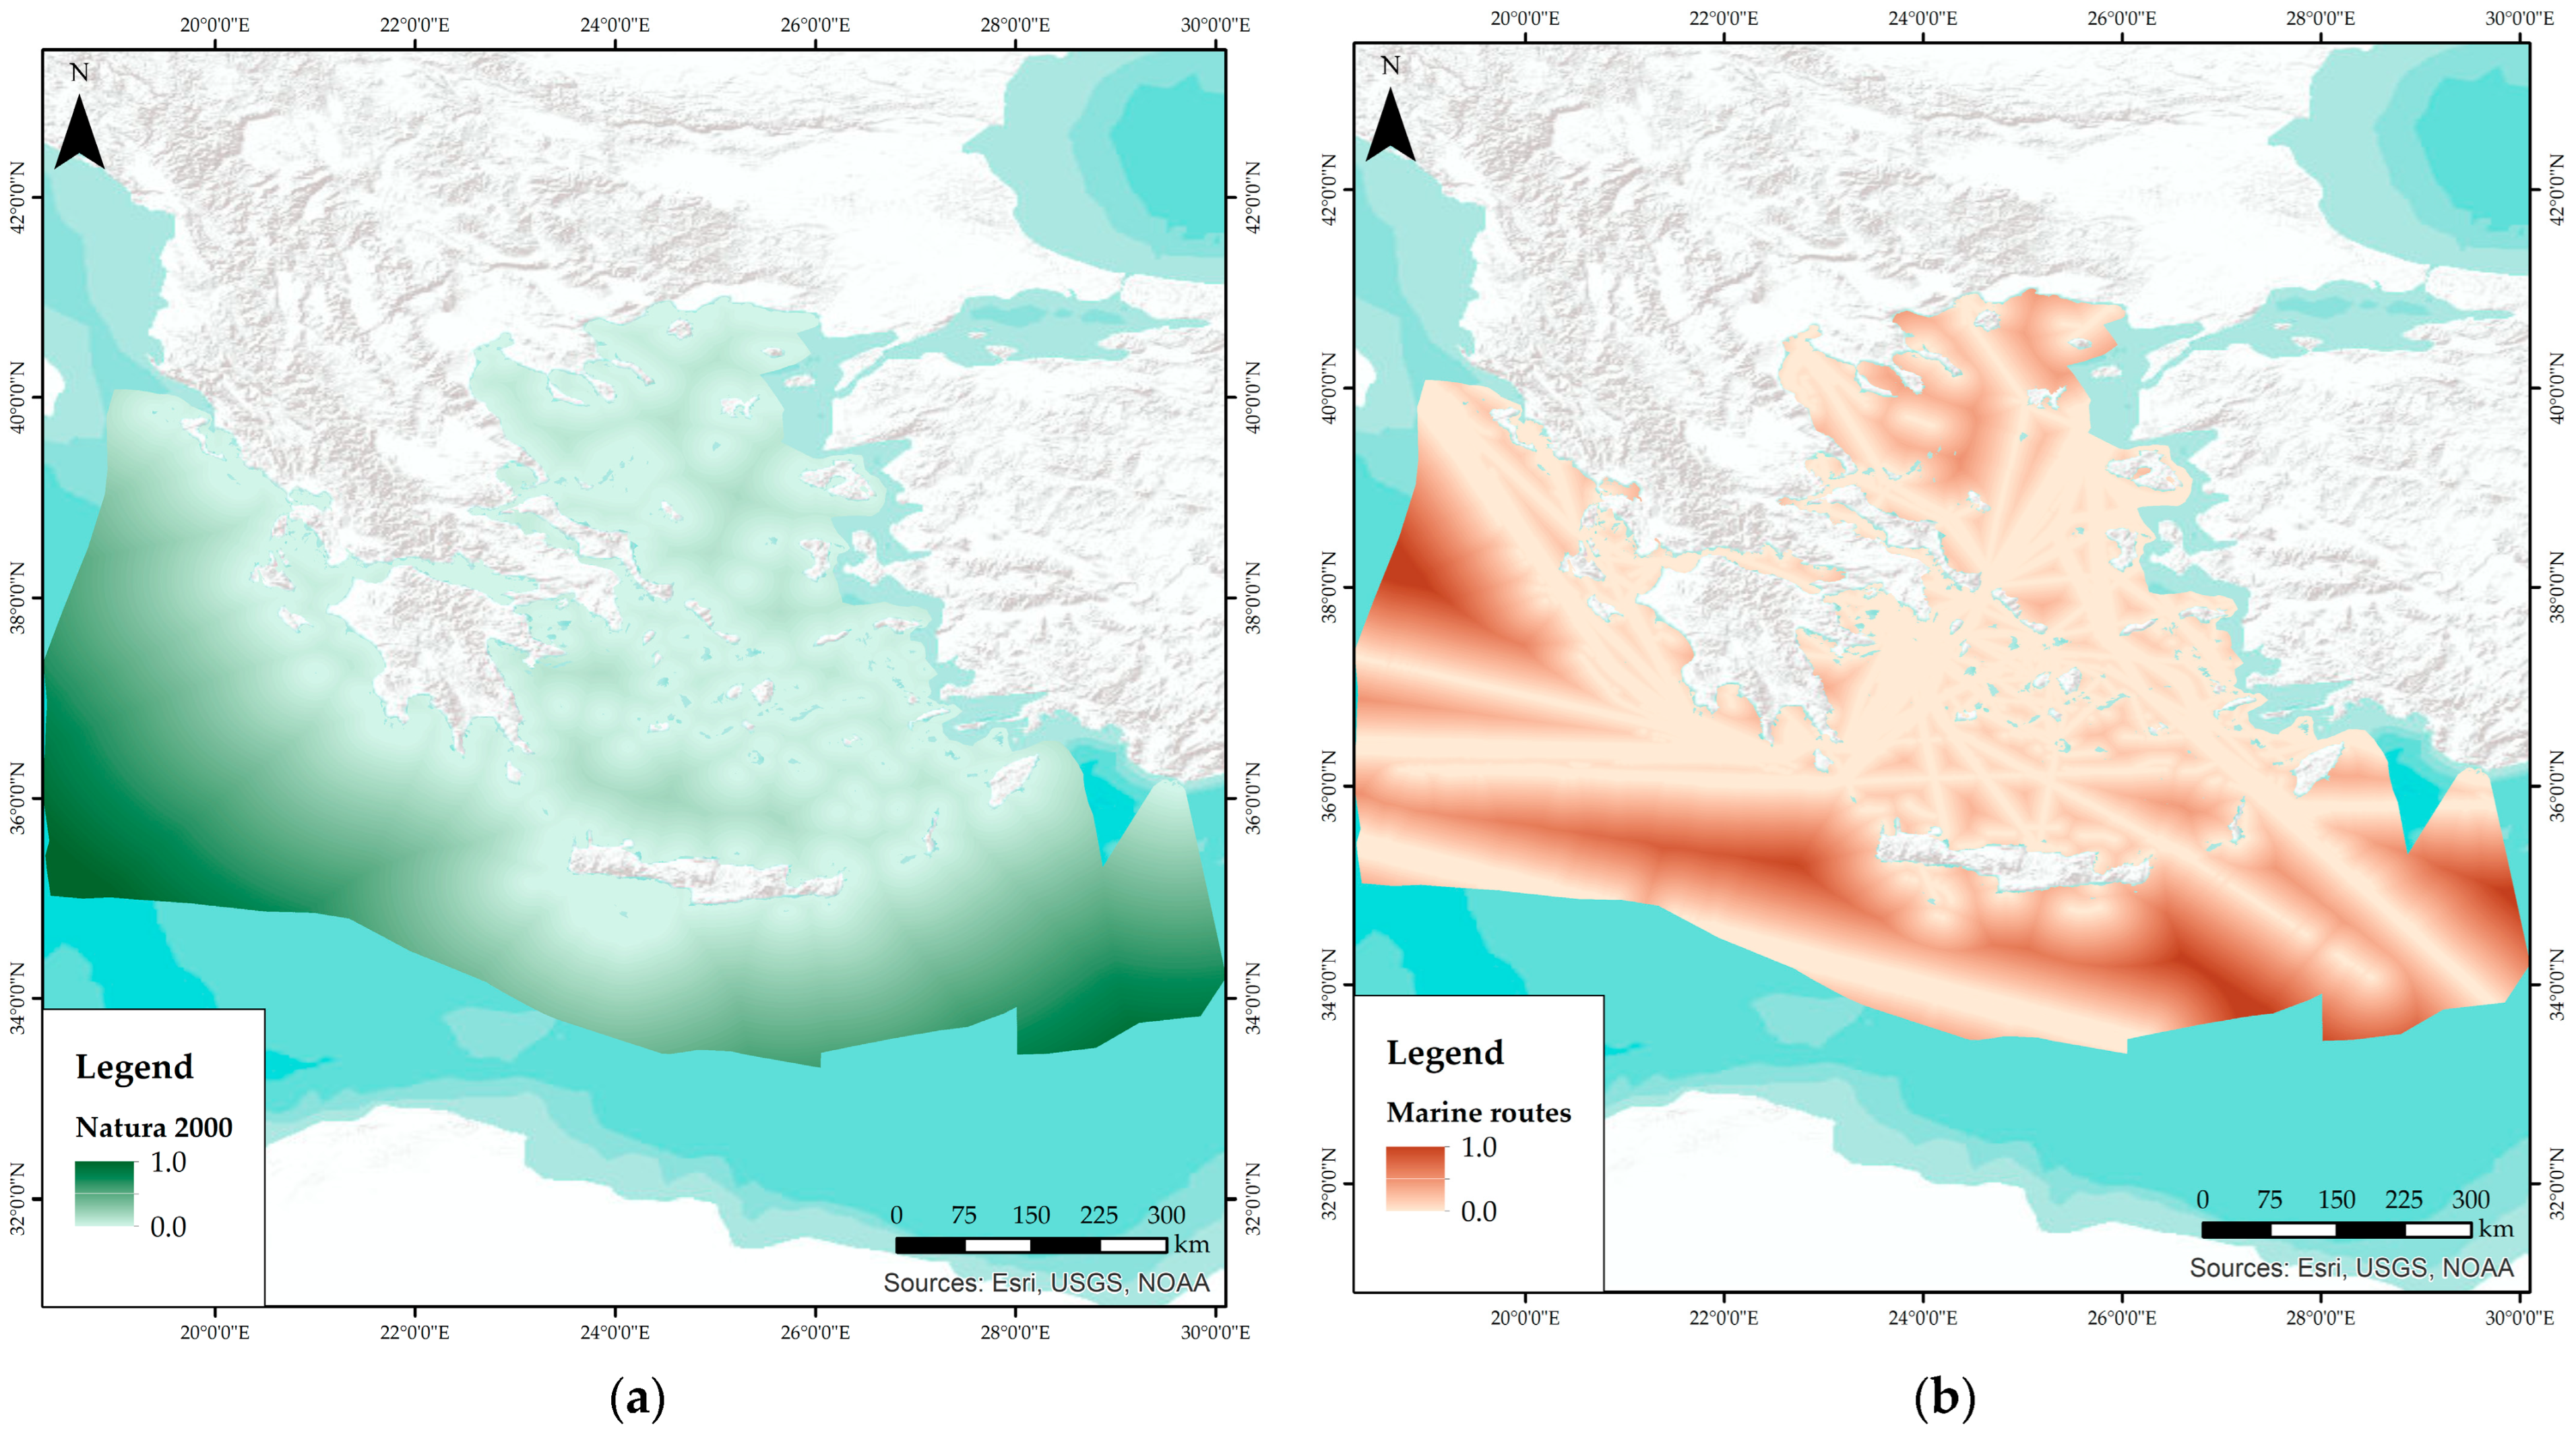
Following the application of the ExC and the identification of marine areas suitable for OWF deployment in Greece, 10 EvC (Table 2) were selected to assess the relative suitability of each available area. For this purpose, GIS layers were generated, containing standardized values corresponding to each EvC (e.g., Figure 4a,b). Future studies could consider incorporating additional socio-economic aspects including proximity to economically developed areas, into the evaluation stage, using criteria such as distance to major cities, or existing energy grid capacity, as this may better reflect spatial planning and energy distribution priorities.

3.2.2. AHP Weights

Table 5 presents the relative importance of 10 evaluation criteria (EvC), as determined using the AHP, based on responses from 15 experts with experience in OWF development.
Among all criteria, average wind velocity receives the highest weight (23.20%), underscoring its crucial role in determining energy yield and economic viability of OWF projects. Water depth follows with a weight of 15.02%, highlighting the importance of bathymetric constraints for the deployment of floating foundation.
Criteria referring to environmental conditions are given considerable attention by the experts. In particular, Natura 2000 sites (11.71%), AONBs (9.19%), IBAs (9.04%), and seagrass meadows (8.24%) collectively represent a significant share of the total weighting. These values showcase the experts’ emphasis on minimizing ecological impacts and aligning development with conservation priorities.
Infrastructure-related factors are also valued by the experts. Underwater energy cables are assigned a weight of 8.62%, reflecting the need for proximity to transmission infrastructure to reduce energy losses and associated costs. Ports account for 6.90%, indicating their relevance for efficient installation and ongoing maintenance. Furthermore, distance from marine traffic routes (4.77%) and airports (3.32%) are considered by the experts, pointing to potential safety concerns.
Future changes in energy demand patterns, economic growth trajectories, or shifts in MSP priorities could significantly alter the relative importance of certain criteria over time, suggesting that expert input may need to be periodically revisited or supplemented by foresight scenarios.

3.3. Final Suitability Map

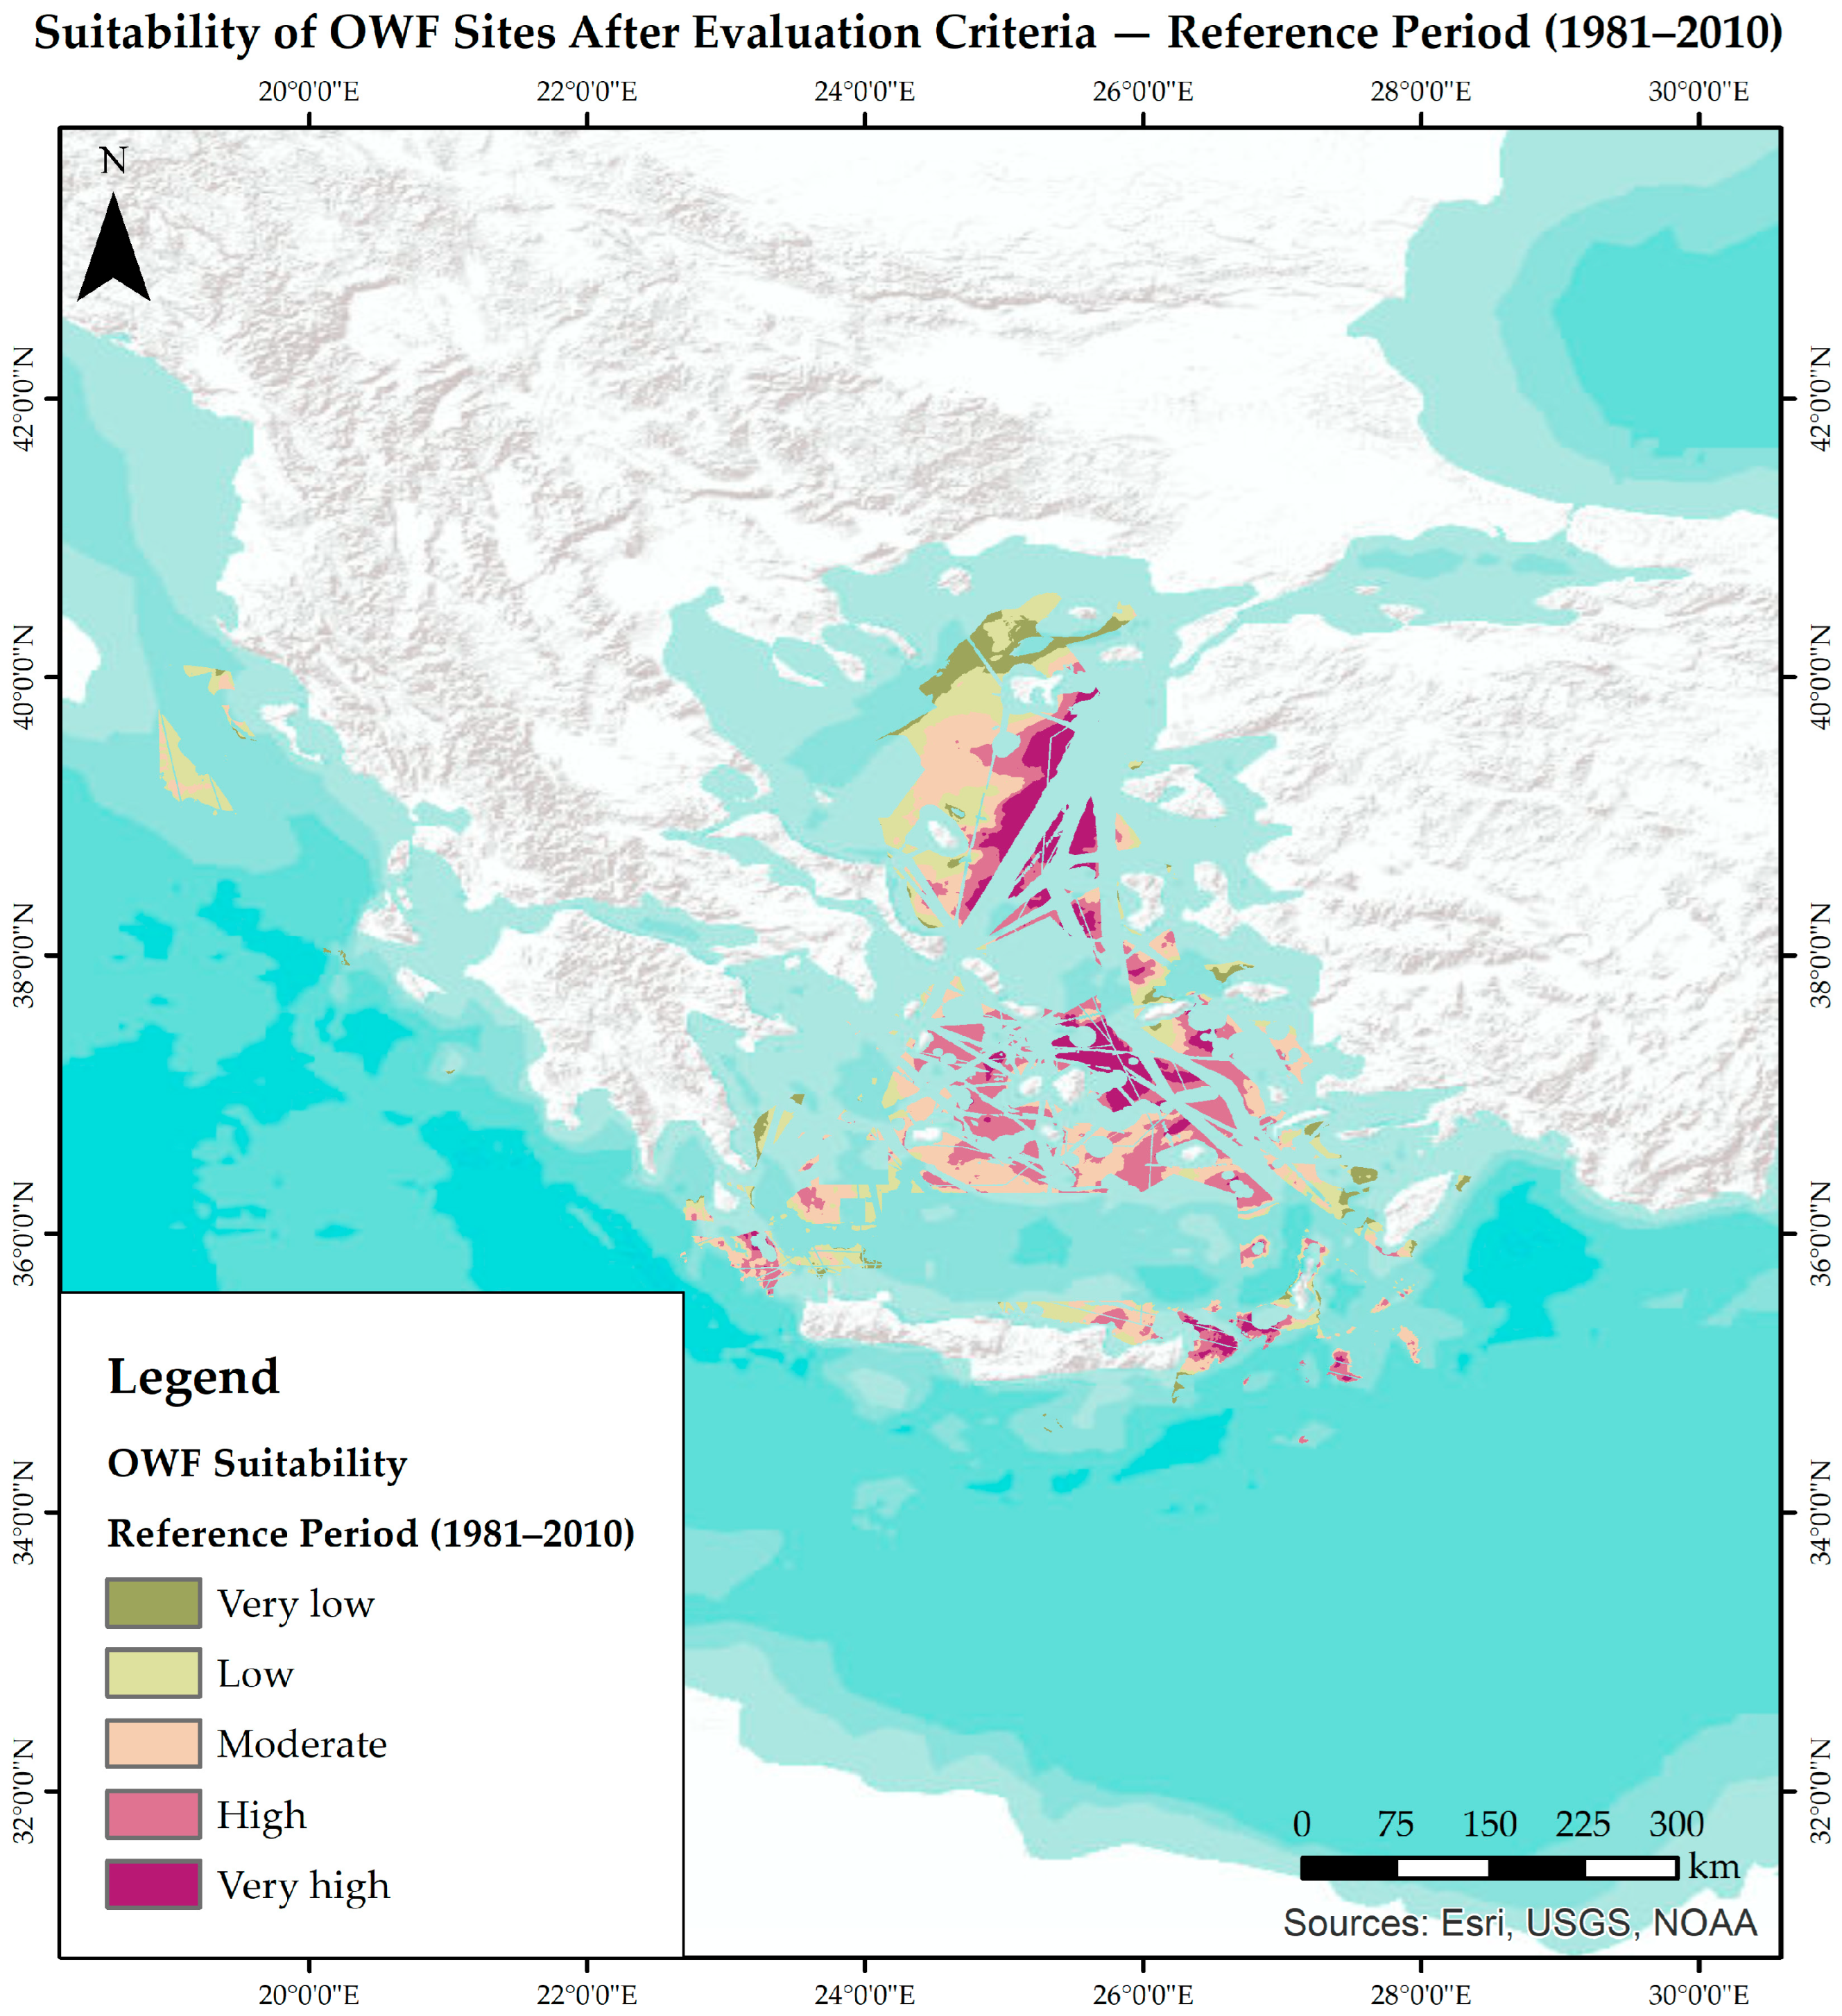
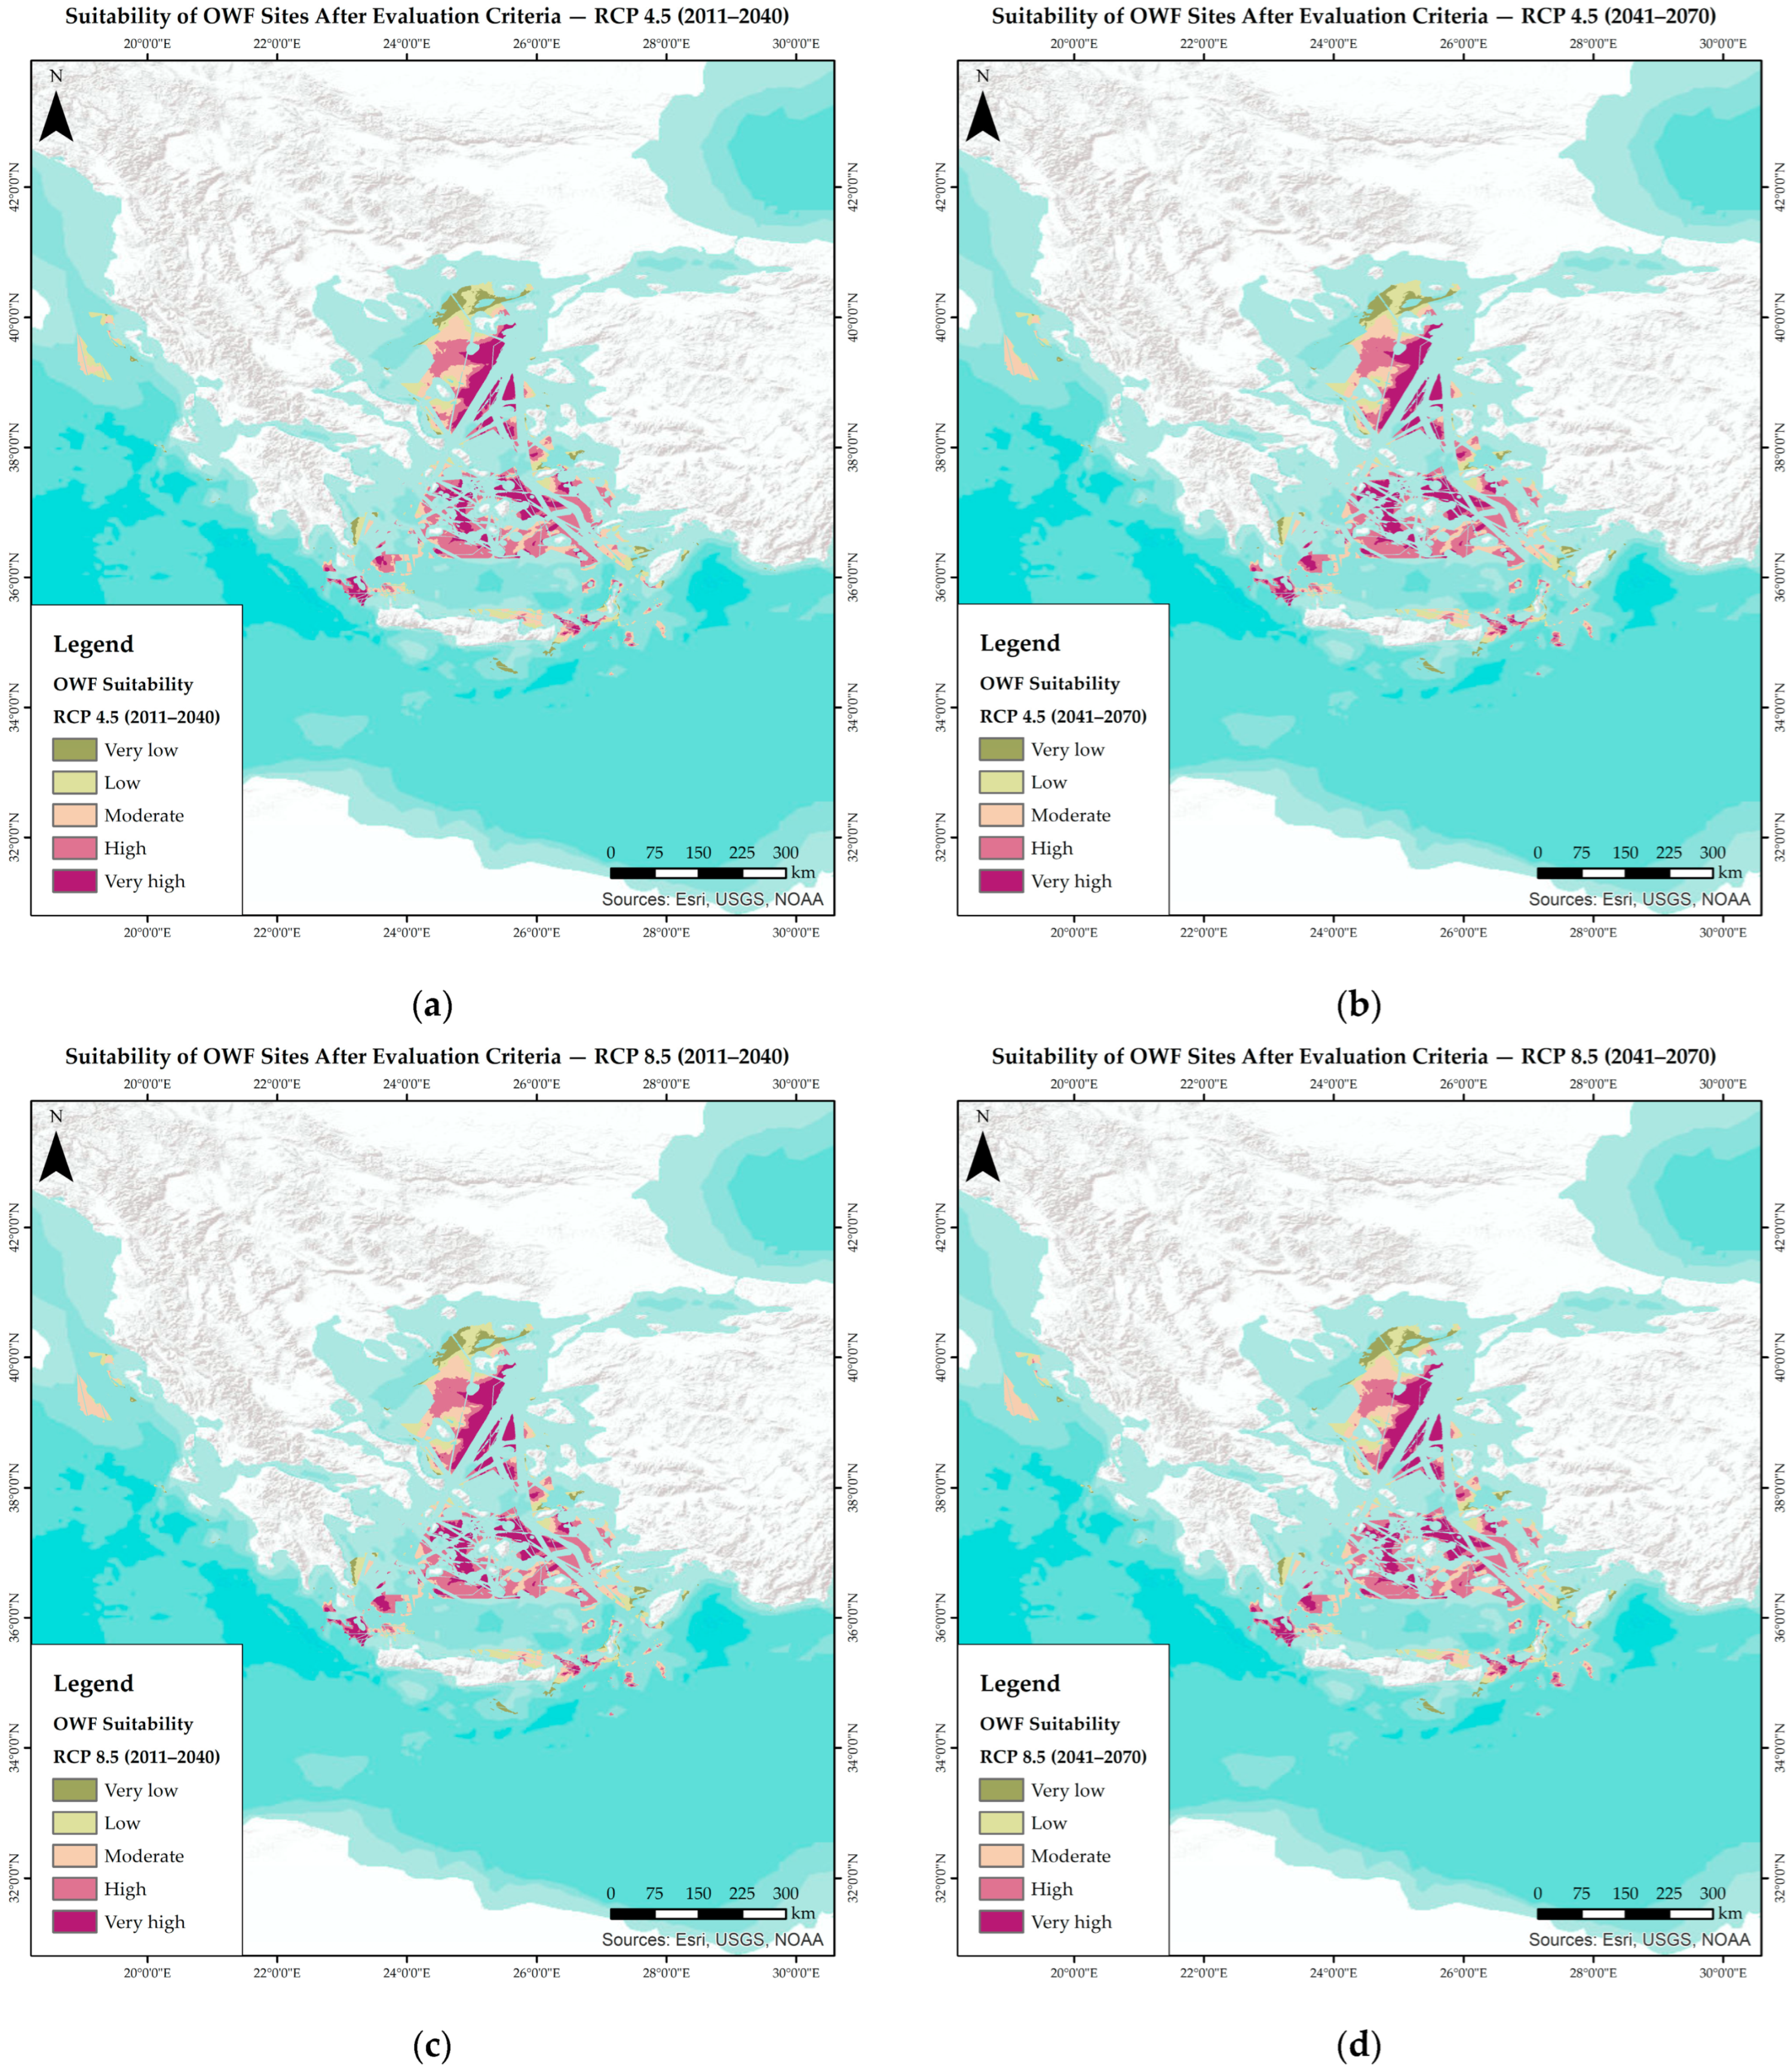
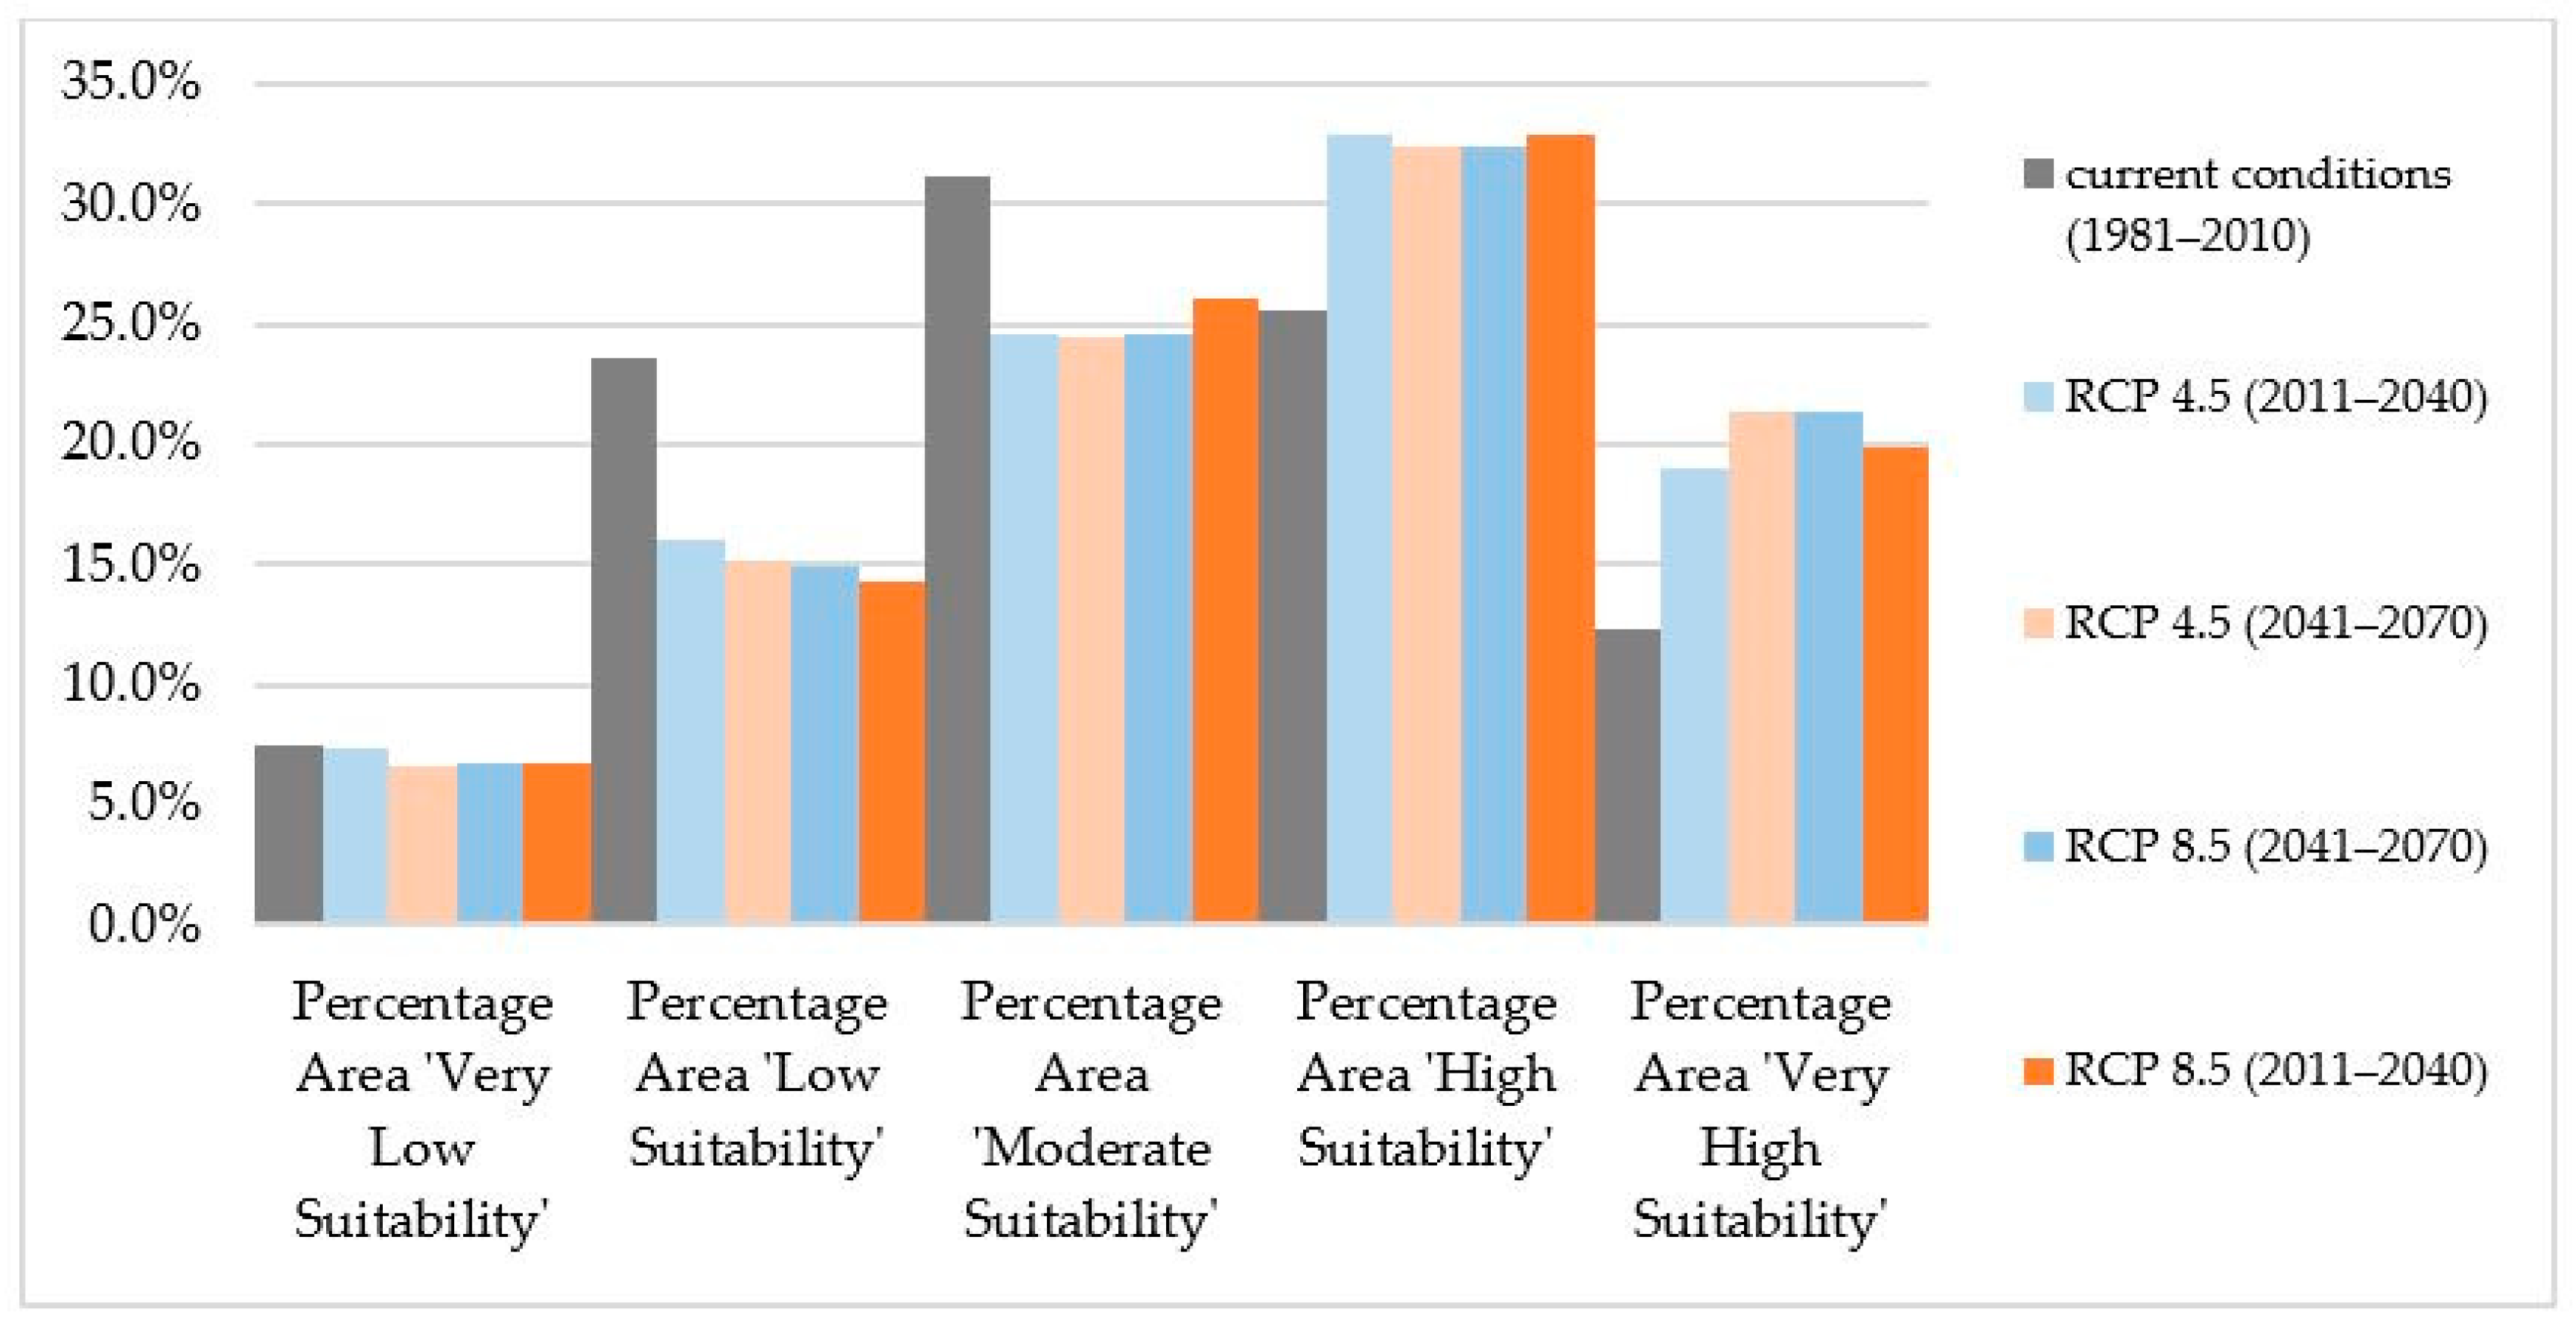
The suitability map was based on the EvC (Table 2), which were applied only within the remaining eligible marine space, following the exclusion phase. The final suitability map for the reference period (1981–2010) is presented in Figure 5, while changes in this map under RCP scenarios are shown in Figure 6a–d. In Figure 5, a distinct spatial pattern in OWF potential across Greek waters is revealed. High to very high suitability zones (shown in dark pink and magenta in Figure 5, respectively) account for approximately 38% of the area available for OWF deployment (Figure 7) and are mainly concentrated in the central and southeastern Aegean Sea, particularly around the Cyclades and extending toward the Dodecanese. The results are consistent with previous studies [15,20,21,32]. These regions benefit from consistently strong wind velocities (EvC2 in Table 2), moderate to deep bathymetric profiles (EvC1 in Table 2) favorable for floating OWF technologies, and relative proximity to ports (EvC9 in Table 2) and grid infrastructure (EvC10 in Table 2). High to very high suitability is also observed in eastern Crete, consistent with [16,17]. The area between Crete and the Peloponnese also emerges as highly suitable, mainly due to its remoteness from major marine traffic corridors further enhances their viability.
Moderate suitability zones, shown light orange in Figure 5, comprise approximately 31% of the area available for OWF deployment (Figure 7) are more dispersed and appear along the eastern and southern coastlines of mainland Greece, as well as portions of the Ionian Sea. While still viable, these zones are more constrained either by reduced wind resources, greater distances to ports or electricity transmission cables, or proximity to previously excluded environmentally protected areas (EvC3-EvC6 in Table 2). In contrast, areas of low and very low suitability, covering 23.57% and 7.47% of the eligible area, respectively (Figure 7) are depicted with light green and green in Figure 5. These findings diverge from national planning reports that designate a pilot zone near Samothrace [18,107]. These zones, typically located closer to the mainland and in the northern Aegean Sea are characterized by their proximity to environmentally important areas, including Natura 2000 sites, IBAs, or seagrass meadows as well as limited technical potential due to shallow depths, weaker wind velocities and distance from supporting infrastructure, including ports and energy cables.
Overall, the Aegean Sea emerges as the most promising marine region for OWF deployment in Greece based on the evaluation criteria applied. However, the central and northern Aegean Sea exhibit a more fragmented pattern of suitable areas, primarily due to the spatial overlap of multiple constraints, particularly dense maritime routes, environmentally protected zones, and proximity to sensitive ecological habitats, that intersect with otherwise technically favorable locations. On the other hand, the regions south of the Peloponnese and east of Crete, broader, more contiguous zones are found, providing potential opportunities for larger-scale OWF applications.
The predominance of the Aegean Sea in the identification of suitable areas for OWF development is consistent with findings from other national and regional assessments conducted in Greece (e.g., [19,22]). It is also important to highlight the presence of suitable areas in the Ionian Sea, which are often overlooked in official assessments [107], potentially due to competing interests such as hydrocarbon exploration and other extractive activities.
When future climate projections for annual average wind speed and SLR are considered, a gradual yet consistent shift toward higher suitability classes is observed, under both RCP 4.5 (Figure 6a,b) and RCP 8.5 scenarios (Figure 6c,d). In particular, the percentage of areas classified as very highly suitable increases significantly in all future projections. For instance, under RCP 4.5, the share of very high suitability areas rises from 12.29% in the reference period to 18.98% for 2011–2040, and further to 21.36% for 2041–2070 (Figure 7). A similar upward trend is evident under RCP 8.5, though the increase is slightly less pronounced, with the very high suitability class reaching 21.34% in the near future and 19.85% by mid-century (Figure 7). While areas available for OWF deployment under RCP 4.5 show a maximum increase of 3.67% in the available OWF area (mid-century), slightly higher than the start of the century (3.15%), available areas under RCP 8.5 exhibit a smaller gain of 2.76% initially, diminishing to 1.95% mid-century. The latter is consistent with studies showcasing higher average wind velocities under RCP 4.5 than RCP 8.5 in the Mediterranean basin [108] and studies highlighting a small but significant reduction in wind resource due to climate change by the end of the 21st century under the high-emission RCP8.5 scenario [109].
On the other hand, the percentages of low and very low suitability areas steadily decrease under all future projections. From a combined 31% in the reference period, these two categories fall to between 21% and 23% across all future scenarios (Figure 7). A similarly decreasing pattern is observed for the moderate suitability class, which consistently shrinks across scenarios. In particular, a decrease from 31.12% in the baseline to around 24–26% in future periods, is observed (Figure 7). These shifts, driven by higher wind velocities, indicate an overall improvement in site conditions, across broader regions of the Greek marine areas.
The spatial analysis of future conditions reveals that under both RCP 4.5 (Figure 6a,b) and 8.5 (Figure 6c,d), areas of very high suitability become more consolidated in the central and southern Aegean Sea, particularly around the Cyclades, eastern Crete, and south of the Peloponnese. The expansion of highly suitable areas is also visible in the southern Ionian Sea and parts of the Dodecanese. These trends suggest that future climate conditions are likely to reinforce and extend the energy potential of regions already favorable under historical reference conditions. However, if extreme wind speeds occur more frequently, they may exceed turbine cut-out thresholds, leading to operational shutdowns. Moreover, increased storminess could hinder installation and maintenance activities, particularly in remote or exposed offshore locations.
Overall, these projections indicate a positive outlook for OWF development in Greece under future climate conditions, particularly in regions that already exhibit favorable wind and bathymetric characteristics. However, environmental and spatial constraints remain critical considerations, as increased technical suitability does not automatically translate to planning viability.

4. Conclusions

The GIS-MCDM approach for identifying suitable OWF locations identified the marine area around the Cyclades, eastern Crete and south of the Peloponnese as the most promising regions in terms of suitable OWF locations in Greece. The approach was based on publicly available data and involved the determination of 19 ExC and 10 EvC to assess the selected areas’ suitability. The inclusion of a high number of exclusion criteria aimed to ensure the selection of only the most favorable areas for OWF deployment by comprehensively accounting for legislative, environmental, techno-economic, and safety constraints. The relative importance of these criteria was determined through the AHP, with weights assigned based on the opinions of 15 experts, ensuring a systematic, and participatory weighting process.
The analysis incorporated data from the period 1981–2010 for historical reference conditions and evaluated future scenarios based on two (2) RCP scenarios, namely RCP 4.5 and RCP 8.5 were considered, in respect of two (2) time horizons, 2011–2040 and 2041–2070, resulting in four future spatial maps that enable comparisons between baseline and projected conditions. The results indicate that most offshore wind energy potential is concentrated in the central and southeastern Aegean Sea, where favorable wind speeds, suitable bathymetry for floating turbines, and proximity to ports and infrastructure create favorable OWF deployment conditions. The marine area between Crete and the Peloponnese also stands out as particularly suitable, further supported by its relative distance from major shipping routes.
Climate change projections suggest an increase of up to 3% in suitable area by mid-century under both RCP scenarios. The most promising regions in terms of suitable OWF locations are expected to sustain or slightly expand their suitability in the future, reinforcing their strategic importance for Greece’s offshore wind portfolio. However, this observed expansion of suitable areas can be solely attributed to more favorable wind conditions, since environmental factors including Natura 2000 sites, IBAs, and seagrass meadows were not subjected to climate change projections due to data limitations. Therefore, there is a critical need for further research into habitat mapping, ecological assessments, and environmental modeling to better incorporate changes in environmentally important areas into future OWF planning. The importance of environmental factors during the planning process is showcased by the relatively high weights attributed to these criteria by the relevant experts, indicating that future offshore wind projects must prioritize ecosystem resilience.
Overall, the actual deployment of OWFs will depend on resolving socio-environmental conflicts, optimizing infrastructure, and fostering cross-sectoral coexistence with fisheries, tourism, and marine conservation efforts. To capitalize on Greece’s offshore wind potential, policymakers should integrate these spatial insights into a dynamic, climate-resilient marine spatial planning framework that emphasizes ecological conservation, stakeholder participation, and infrastructure wind development aligned with national renewable energy targets.

Supplementary Materials

The following supporting information can be downloaded at: https://www.mdpi.com/article/10.3390/jmse13081508/s1.

Author Contributions

Conceptualization, V.I.C. and V.K.T.; methodology, V.I.C., E.F., V.K.T. and C.M.D.; formal analysis, V.I.C. and E.F.; investigation, V.I.C.; data curation, V.I.C. and E.F.; writing—original draft preparation, V.I.C.; writing—review and editing, E.F., V.K.T. and C.M.D.; visualization, V.I.C. and E.F.; supervision, V.K.T.; project administration, V.K.T.; funding acquisition, V.K.T. All authors have read and agreed to the published version of the manuscript.

Funding

This research received no external funding.

Data Availability Statement

The original contributions presented in this study are included in the article. Further inquiries can be directed to the corresponding author.

Acknowledgments

The authors would like to thank Christina Tsaimou and Andreas Papadimitriou for their valuable assistance in reviewing and improving the early drafts of this manuscript.

Conflicts of Interest

The authors declare no conflicts of interest.

References

  1. European Commission. Communication on the 2030 Climate Target Plan: Stepping Up Europe’s 2030 Climate Ambition. In Investing in a Climate-Neutral Future for the Benefit of Our People COM/2020/562 Final; European Commission: Brussels, Belgium, 2020. [Google Scholar]
  2. Martinez, A.; Iglesias, G. Evaluation of offshore wind energy zones within marine spatial planning: A case study in the Spanish Mediterranean Sea. Energy Rep. 2024, 11, 3461–3473. [Google Scholar] [CrossRef]
  3. van Sluis, C.J.; van Onselen, E.; Airoldi, L.; Duarte, C.M.; van Rijswick, H.F.M.W.; van der Heide, T.; Olie, R.A.; Kelder, M.; Bouma, T.J. Financing marine restoration through offshore wind investments. BioScience 2025, biaf092. [Google Scholar] [CrossRef]
  4. Duarte, C.M.; Agusti, S.; Barbier, E.; Britten, G.L.; Castilla, J.C.; Gattuso, J.-P.; Fulweiler, R.W.; Hughes, T.P.; Knowlton, N.; Lovelock, C.E.; et al. Rebuilding marine life. Nature 2020, 580, 39–51. [Google Scholar] [CrossRef]
  5. Wind Europe. Wind Energy in Europe: 2024 Statistics and the Outlook for 2025–2030; Wind Europe: Brussels, Belgium, 2024. [Google Scholar]
  6. European Commission. An EU Strategy to Harness the Potential of Offshore Renewable Energy for a Climate Neutral Future COM(2020) 741 Final; European Commission: Brussels, Belgium, 2020. [Google Scholar]
  7. Durakovic, G.; del Granado, P.C.; Tomasgard, A. Powering Europe with North Sea offshore wind: The impact of hydrogen investments on grid infrastructure and power prices. Energy 2023, 263, 125654. [Google Scholar] [CrossRef]
  8. Martinez, A.; Iglesias, G. Climate-change impacts on offshore wind resources in the Mediterranean Sea. Energy Convers. Manag. 2023, 291, 117231. [Google Scholar] [CrossRef]
  9. Wawrzynkowski, P.; Molins, C.; Lloret, J. Assessing the potential impacts of floating Offshore Wind Farms on policy-relevant species: A case study in the Gulf of Roses, NW Mediterranean. Mar. Policy 2025, 172, 106518. [Google Scholar] [CrossRef]
  10. Lloret, J.; Turiel, A.; Solé, J.; Berdalet, E.; Sabatés, A.; Olivares, A.; Gili, J.-M.; Vila-Subirós, J.; Sardá, R. Unravelling the ecological impacts of large-scale offshore wind farms in the Mediterranean Sea. Sci. Total Environ. 2022, 824, 153803. [Google Scholar] [CrossRef] [PubMed]
  11. Umoh, K.; Hasan, A.; Kenjegaliev, A. Combined AHP-GIS methodology for floating offshore wind site selection in South Africa. Ocean. Eng. 2025, 317, 120037. [Google Scholar] [CrossRef]
  12. Caceoğlu, E.; Yildiz, H.K.; Oğuz, E.; Huvaj, N.; Guerrero, J.M. Offshore wind power plant site selection using Analytical Hierarchy Process for Northwest Turkey. Ocean. Eng. 2022, 252, 111178. [Google Scholar] [CrossRef]
  13. Vinhoza, A.; Schaeffer, R. Brazil’s offshore wind energy potential assessment based on a Spatial Multi-Criteria Decision Analysis. Renew. Sustain. Energy Rev. 2021, 146, 111185. [Google Scholar] [CrossRef]
  14. Gkeka-Serpetsidaki, P.; Skiniti, G.; Tournaki, S.; Tsoutsos, T. A Review of the Sustainable Siting of Offshore Wind Farms. Sustainability 2024, 16, 6036. [Google Scholar] [CrossRef]
  15. Spyridonidou, S.; Vagiona, D.G.; Loukogeorgaki, E. Strategic Planning of Offshore Wind Farms in Greece. Sustainability 2020, 12, 905. [Google Scholar] [CrossRef]
  16. Tsarknias, N.; Gkeka-Serpetsidaki, P.; Tsoutsos, T. Exploring the sustainable siting of floating wind farms in the Cretan coastline. Sustain. Energy Technol. Assess. 2022, 54, 102841. [Google Scholar] [CrossRef]
  17. Gkeka-Serpetsidaki, P.; Tsoutsos, T. A methodological framework for optimal siting of offshore wind farms: A case study on the island of Crete. Energy 2022, 239, 122296. [Google Scholar] [CrossRef]
  18. Gazos, K.; Vagiona, D.G. Marine Suitability Assessment for Offshore Wind Farms’ Deployment in Thrace, Greece. Sustainability 2024, 16, 4204. [Google Scholar] [CrossRef]
  19. Stefanakou, A.A.; Nikitakos, N.; Lilas, T.; Pavlogeorgatos, G. A GIS-based decision support model for offshore floating wind turbine installation. Int. J. Sustain. Energy 2019, 38, 673–691. [Google Scholar] [CrossRef]
  20. Vagiona, D.; Karanikolas, N. A multicriteria approach to evaluate offshore wind farms siting in Greece. Glob. Nest J. 2012, 14, 235–243. [Google Scholar]
  21. Vagiona, D.G.; Kamilakis, M. Sustainable Site Selection for Offshore Wind Farms in the South Aegean—Greece. Sustainability 2018, 10, 749. [Google Scholar] [CrossRef]
  22. Vasileiou, M.; Loukogeorgaki, E.; Vagiona, D.G. GIS-based multi-criteria decision analysis for site selection of hybrid offshore wind and wave energy systems in Greece. Renew. Sustain. Energy Rev. 2017, 73, 745–757. [Google Scholar] [CrossRef]
  23. Susini, S.; Menéndez, M.; Eguía, P.; Blanco, J. Climate Change Impact on the Offshore Wind Energy Over the North Sea and the Irish Sea. Front. Energy Res. 2022, 10, 881146. [Google Scholar] [CrossRef]
  24. Pryor, S.; Barthelmie, R.; Kjellström, E. Analyses of the potential climate change impact on wind energy resources in northern Europe using output from a Regional Climate Model. Clim. Dyn. 2005, 25, 815–835. [Google Scholar] [CrossRef]
  25. Chalastani, V.I.; Tsoukala, V.K.; Coccossis, H.; Duarte, C.M. A bibliometric assessment of progress in marine spatial planning. Mar. Policy 2021, 127, 104329. [Google Scholar] [CrossRef]
  26. Melissas, D.; Asprogerakas, E. Spatial parameters for the development of floating wind farms in Greece. Eur. J. Geogr. 2022, 13, 001–017. [Google Scholar] [CrossRef]
  27. Olsen, E.; Fluharty, D.; Hoel, A.H.; Hostens, K.; Maes, F.; Pecceu, E. Integration at the Round Table: Marine Spatial Planning in Multi-Stakeholder Settings. PLoS ONE 2014, 9, e109964. [Google Scholar] [CrossRef] [PubMed]
  28. Soukissian, T.; Hatzinaki, M.; Gerasimos, K.; Papadopoulos, A.; Kallos, G.; Anadranistakis, M. Wind and Wave Atlas of the Hellenic Seas; Hcmr publication: Anavyssos, Greece, 2007. [Google Scholar]
  29. Soukissian, T.; Prospathopoulos, A.; Hatzinaki, M.; Kabouridou, M. Assessment of the Wind and Wave Climate of the Hellenic Seas Using 10Year Hindcast Results. Open Ocean Eng. J. 2008, 1, 1–12. [Google Scholar] [CrossRef][Green Version]
  30. BVG Associates. Unleashing Europe’s Offshore Wind Potential: A New Resource Assessment; BVG Associates: Brussels, Belgium, 2017. [Google Scholar]
  31. Greek Ministry of Environment and Energy. Available online: https://ypen.gov.gr/gia-proti-fora-sti-chora-thalassios-chorotaxikos-schediasmos/ (accessed on 20 June 2025).
  32. Tsiara, C.; Katsardi, V.; Spiliotopoulos, G.; Vasiliades, L. Optimal and Sustainable Siting of Offshore Wind Farms in Greece: Environmental Considerations, Cost Analysis, and Comparative Evaluation of State-Proposed Development Areas. Available online: https://papers.ssrn.com/sol3/papers.cfm?abstract_id=5355173 (accessed on 30 July 2025).
  33. European Commission. 89/EU Directive of the European Parliament and of the Council of 23 July 2014 Establishing a Framework for Maritime Spatial Planning; European Commission: Brussels, Belgium, 2014. [Google Scholar]
  34. EMODnet. Yourgateway to Marine Data in Europe. Available online: https://emodnet.ec.europa.eu/en (accessed on 15 March 2025).
  35. THAL-CHOR 2 Geoportal. Available online: https://thalchor-2.ypen.gov.gr (accessed on 15 March 2025).
  36. Independent Power Transmission Operator (IPTO). Available online: https://www.admie.gr/systima/perigrafi/hartis-grammon (accessed on 15 March 2025).
  37. GEODATA: Digital data. Available online: http://geodata.gov.gr/ (accessed on 15 March 2025).
  38. Hellenic Ornithological Society. Available online: https://ornithologiki.gr/en/ (accessed on 15 March 2025).
  39. Filotis Database. Available online: https://filotis.itia.ntua.gr/info_usage/ (accessed on 15 March 2025).
  40. Topouzelis, K. Supplementary Files of Paper Titled “Seagrass Mapping in Greek Territorial Waters Using Landat-8 Satellite Images”. 2017. Available online: https://zenodo.org/records/1120338 (accessed on 3 August 2025).
  41. European Atlas of the Sea. Available online: https://ec.europa.eu/maritimeaffairs/atlas/maritime_atlas/#lang=EN;p=w;bkgd=5;theme=78:1;c=950564.0893519891,6935472.822042013;z=6 (accessed on 15 March 2025).
  42. Copernicus Climate Change Service (C3S). Copernicus Climate Data Store. Available online: https://cds.climate.copernicus.eu (accessed on 10 February 2025).
  43. National Aeronautics and Space Administration (NASA). IPCC AR6 Sea Level Projection Tool; NASA Sea Level Change Portal; National Aeronautics and Space Administration (NASA): Washington, DC, USA, 2021.
  44. Intergovernmental Panel on Climate Change. Climate Change 2023: Synthesis Report. Contribution of Working Groups I, II and III to the Sixth Assessment Report of the Intergovernmental Panel on Climate Change; Intergovernmental Panel on Climate Change: Geneva, Switzerland, 2023; pp. 35–115. [Google Scholar]
  45. Shi, J.; Hu, M.; Zhang, Y.; Chen, X.; Yang, S.; Hallak, T.S.; Chen, M. Dynamic Analysis of Crane Vessel and Floating Wind Turbine during Temporary Berthing for Offshore On-Site Maintenance Operations. J. Mar. Sci. Eng. 2024, 12, 1393. [Google Scholar] [CrossRef]
  46. Roh, C.; Ha, Y.-J.; Ahn, H.-J.; Kim, K.-H. A Comparative Analysis of the Characteristics of Platform Motion of a Floating Offshore Wind Turbine Based on Pitch Controllers. Energies 2022, 15, 716. [Google Scholar] [CrossRef]
  47. Pulselli, R.M.; Maccanti, M.; Bruno, M.; Sabbetta, A.; Neri, E.; Patrizi, N.; Bastianoni, S. Benchmarking Marine Energy Technologies Through LCA: Offshore Floating Wind Farms in the Mediterranean. Front. Energy Res. 2022, 10, 902021. [Google Scholar] [CrossRef]
  48. IEC 61400-1:2019; Wind Energy Generation Systems—Part 1: Design Requirements. International Electrotechnical Commission: Geneva, Switzerland, 2019.
  49. Schallenberg-Rodríguez, J.; García Montesdeoca, N. Spatial planning to estimate the offshore wind energy potential in coastal regions and islands. Practical case: The Canary Islands. Energy 2018, 143, 91–103. [Google Scholar] [CrossRef]
  50. Soares, P.M.M.; Lima, D.C.A.; Nogueira, M. Global offshore wind energy resources using the new ERA-5 reanalysis. Environ. Res. Lett. 2020, 15, 1040a2. [Google Scholar] [CrossRef]
  51. Tercan, E.; Tapkın, S.; Latinopoulos, D.; Dereli, M.A.; Tsiropoulos, A.; Ak, M.F. A GIS-based multi-criteria model for offshore wind energy power plants site selection in both sides of the Aegean Sea. Environ. Monit. Assess. 2020, 192, 652. [Google Scholar] [CrossRef] [PubMed]
  52. Marchowski, D.; Ławicki, Ł.; Kaliciuk, J. Management of Marine Natura 2000 Sites as Exemplified by Seabirds Wintering in the Baltic Sea: The Case of Poland. Diversity 2022, 14, 1081. [Google Scholar] [CrossRef]
  53. Martín, B.; Onrubia, A.; González-Arias, J.; Vicente-Vírseda, J.A. Citizen science for predicting spatio-temporal patterns in seabird abundance during migration. PLoS ONE 2020, 15, e0236631. [Google Scholar] [CrossRef]
  54. European Commission. Council Directive 92/43/EEC of 21 May 1992 on the Conservation of Natural Habitats and of Wild Fauna and Flora; Official Journal L 206; European Commission: Brussels, Belgium, 1992; pp. 7–50. [Google Scholar]
  55. Schoukens, H.; Cliquet, A. Biodiversity offsetting and restoration under the European Union Habitats Directive: Balancing between no net loss and deathbed conservation? Ecol. Soc. 2016, 21, 10. [Google Scholar] [CrossRef]
  56. Goodale, M.W.; Milman, A. Assessing Cumulative Exposure of Northern Gannets to Offshore Wind Farms. Wildl. Soc. Bull. 2020, 44, 252–259. [Google Scholar] [CrossRef]
  57. Stenhouse, I.J.; Berlin, A.M.; Gilbert, A.T.; Goodale, M.W.; Gray, C.E.; Montevecchi, W.A.; Savoy, L.; Spiegel, C.S. Assessing the exposure of three diving bird species to offshore wind areas on the U.S. Atlantic Outer Continental Shelf using satellite telemetry. Divers. Distrib. 2020, 26, 1703–1714. [Google Scholar] [CrossRef]
  58. United Nations. Enlargement of the Marine Protected Areas’ Network of Greece to Meet 30 % Target; UN SDG Partnerships Platform: New York, NY, USA, 2023. [Google Scholar]
  59. Smith, H. Greece Becomes First European Country to Ban Bottom Trawling in Marine Parks. Available online: https://www.theguardian.com/environment/2024/apr/16/greece-becomes-first-european-country-to-ban-bottom-trawling-in-marine-parks (accessed on 5 June 2025).
  60. Birdlife International. Available online: https://datazone.birdlife.org/country/factsheet/greece (accessed on 20 March 2025).
  61. Spiliopoulou, K.; Dimitrakopoulos, P.G.; Brooks, T.M.; Kelaidi, G.; Paragamian, K.; Kati, V.; Oikonomou, A.; Vavylis, D.; Trigas, P.; Lymberakis, P.; et al. The Natura 2000 network and the ranges of threatened species in Greece. Biodivers. Conserv. 2021, 30, 945–961. [Google Scholar] [CrossRef]
  62. Vanermen, N.; Onkelinx, T.; Verschelde, P.; Courtens, W.; Van de Walle, M.; Verstraete, H.; Stienen, E.W.M. Assessing seabird displacement at offshore wind farms: Power ranges of a monitoring and data handling protocol. Hydrobiologia 2015, 756, 155–167. [Google Scholar] [CrossRef]
  63. Hong, L.; Möller, B. Offshore wind energy potential in China: Under technical, spatial and economic constraints. Energy 2011, 36, 4482–4491. [Google Scholar] [CrossRef]
  64. Hemminga, M.A.; Duarte, C.M. Seagrass Ecology; Cambridge University Press: Cambridge, UK, 2000. [Google Scholar]
  65. The UNEP/MAP-SPA/RAC. Greece: Conservation of Mediterranean Marine and Coastal Biodiversity by 2030 and Beyond; The UNEP/MAP-SPA/RAC: Tunis, Tunisia, 2021; p. 105. [Google Scholar]
  66. Telesca, L.; Belluscio, A.; Criscoli, A.; Ardizzone, G.; Apostolaki, E.T.; Fraschetti, S.; Gristina, M.; Knittweis, L.; Martin, C.S.; Pergent, G.; et al. Seagrass meadows (Posidonia oceanica) distribution and trajectories of change. Sci. Rep. 2015, 5, 12505. [Google Scholar] [CrossRef]
  67. Marbà, N.; Díaz-Almela, E.; Duarte, C.M. Mediterranean seagrass (Posidonia oceanica) loss between 1842 and 2009. Biol. Conserv. 2014, 176, 183–190. [Google Scholar] [CrossRef]
  68. Castro-Santos, L.; deCastro, M.; Costoya, X.; Filgueira-Vizoso, A.; Lamas-Galdo, I.; Ribeiro, A.; Dias, J.M.; Gómez-Gesteira, M. Economic Feasibility of Floating Offshore Wind Farms Considering Near Future Wind Resources: Case Study of Iberian Coast and Bay of Biscay. Int. J. Environ. Res. Public Health 2021, 18, 2553. [Google Scholar] [CrossRef] [PubMed]
  69. Min, X.; Yi, Z.; Xiao-Jing, S.; Yun-Ling, Z.; Hai-Peng, Z. The distribution of large floating seagrass (Zostera marina) aggregations in northern temperate zones of Bohai Bay in the Bohai Sea, China. PLoS ONE 2019, 14, e0201574. [Google Scholar] [CrossRef] [PubMed]
  70. Díaz, H.; Fonseca, R.; Guedes Soares, C. Site selection process for floating offshore wind farms in Madeira Islands. In Advances in Renewable Energies Offshore; CRC Press: London, UK, 2018; pp. 729–737. [Google Scholar]
  71. Díaz, H.; Guedes Soares, C. An integrated GIS approach for site selection of floating offshore wind farms in the Atlantic continental European coastline. Renew. Sustain. Energy Rev. 2020, 134, 110328. [Google Scholar] [CrossRef]
  72. Liao, V.T.C. Marine spatial planning identifies solutions for offshore wind farms at fishery and environment in Taiwan territorial waters. Energy Environ. 2023, 36, 1247–1270. [Google Scholar] [CrossRef]
  73. Schupp, M.F.; Kafas, A.; Buck, B.H.; Krause, G.; Onyango, V.; Stelzenmüller, V.; Davies, I.; Scott, B.E. Fishing within offshore wind farms in the North Sea: Stakeholder perspectives for multi-use from Scotland and Germany. J. Environ. Manag. 2021, 279, 111762. [Google Scholar] [CrossRef]
  74. Bonsu, P.O.; Letschert, J.; Yates, K.L.; Svendsen, J.C.; Berkenhagen, J.; Rozemeijer, M.J.C.; Kerkhove, T.R.H.; Rehren, J.; Stelzenmüller, V. Co-location of fisheries and offshore wind farms: Current practices and enabling conditions in the North Sea. Mar. Policy 2024, 159, 105941. [Google Scholar] [CrossRef]
  75. Stelzenmüller, V.; Letschert, J.; Gimpel, A.; Kraan, C.; Probst, W.N.; Degraer, S.; Döring, R. From plate to plug: The impact of offshore renewables on European fisheries and the role of marine spatial planning. Renew. Sustain. Energy Rev. 2022, 158, 112108. [Google Scholar] [CrossRef]
  76. Bergström, L.; Kautsky, L.; Malm, T.; Rosenberg, R.; Wahlberg, M.; Åstrand Capetillo, N.; Wilhelmsson, D. Effects of offshore wind farms on marine wildlife—A generalized impact assessment. Environ. Res. Lett. 2014, 9, 034012. [Google Scholar] [CrossRef]
  77. Hutchison, Z.L.; Gill, A.B.; Sigray, P.; He, H.; King, J.W. Anthropogenic electromagnetic fields (EMF) influence the behaviour of bottom-dwelling marine species. Sci. Rep. 2020, 10, 4219. [Google Scholar] [CrossRef]
  78. Szostek, C.L.; Watson, S.C.L.; Trifonova, N.; Beaumont, N.J.; Scott, B.E. Spatial conflict in offshore wind farms: Challenges and solutions for the commercial fishing industry. Energy Policy 2025, 200, 114555. [Google Scholar] [CrossRef]
  79. Halpern, B.S.; Frazier, M.; Afflerbach, J.; Lowndes, J.S.; Micheli, F.; O’Hara, C.; Scarborough, C.; Selkoe, K.A. Recent pace of change in human impact on the world’s ocean. Sci. Rep. 2019, 9, 11609. [Google Scholar] [CrossRef]
  80. Kavadas, S.; Maina, I. Fishing Areas of Greece (ELSTAT Areas). 2021. Available online: https://zenodo.org/records/5146272 (accessed on 20 March 2025).
  81. Miranda, F.; Rosa-Santos, P.; Taveira-Pinto, F.; Guan, D.; Fazeres-Ferradosa, T. Aquaculture and offshore wind: A review of co-location design challenges. Ocean Eng. 2025, 318, 120161. [Google Scholar] [CrossRef]
  82. Lojek, O.; Goseberg, N.; Føre, H.M.; Dewhurst, T.; Bölker, T.; Haesman, K.G.; Buck, B.H.; Fredriksson, D.W.; Rickerich, S. Hydrodynamic Exposure—On the Quest to Deriving Quantitative Metrics for Mariculture Sites. Front. Aquac. 2024, 3, 1388280. [Google Scholar] [CrossRef]
  83. Gimpel, A.; Stelzenmüller, V.; Grote, B.; Buck, B.H.; Floeter, J.; Núñez-Riboni, I.; Pogoda, B.; Temming, A. A GIS modelling framework to evaluate marine spatial planning scenarios: Co-location of offshore wind farms and aquaculture in the German EEZ. Mar. Policy 2015, 55, 102–115. [Google Scholar] [CrossRef]
  84. Buck, B.H.; Langan, R. Aquaculture Perspective of Multi-Use Sites in the Open Ocean; Springer Nature: London, UK, 2017. [Google Scholar]
  85. Wever, L.; Krause, G.; Buck, B.H. Lessons from stakeholder dialogues on marine aquaculture in offshore wind farms: Perceived potentials, constraints and research gaps. Mar. Policy 2015, 51, 251–259. [Google Scholar] [CrossRef]
  86. European Union Aviation Safety Agency. Safety Impact of Wind Turbines in the Vicinity of Aerodromes and Air Routes; EASA: Cologne, Germany, 2023. [Google Scholar]
  87. Latinopoulos, D.; Kechagia, K. A GIS-based multi-criteria evaluation for wind farm site selection. A regional scale application in Greece. Renew. Energy 2015, 78, 550–560. [Google Scholar] [CrossRef]
  88. International Cable Protection Committee. Recommendation No.13: The Proximity of Offshore Renewable Wind Energy Installations and Submarine Cable Infrastructure in National Waters; ICPC: Portsmouth, UK, 2013. [Google Scholar]
  89. United Nations. United Nations Convention on the Law of the Sea; United Nations: New York, NY, USA, 1982. [Google Scholar]
  90. Malczewski, J. GIS-based land-use suitability analysis: A critical overview. Prog. Plan. 2004, 62, 3–65. [Google Scholar] [CrossRef]
  91. Malczewski, J. Multiple Criteria Decision Analysis and Geographic Information Systems. In Trends in Multiple Criteria Decision Analysis; Ehrgott, M., Figueira, J.R., Greco, S., Eds.; Springer: Boston, MA, USA, 2010; pp. 369–395. [Google Scholar]
  92. Chaouachi, A.; Covrig, C.F.; Ardelean, M. Multi-criteria selection of offshore wind farms: Case study for the Baltic States. Energy Policy 2017, 103, 179–192. [Google Scholar] [CrossRef]
  93. Cradden, L.; Kalogeri, C.; Barrios, I.M.; Galanis, G.; Ingram, D.; Kallos, G. Multi-criteria site selection for offshore renewable energy platforms. Renew. Energy 2016, 87, 791–806. [Google Scholar] [CrossRef]
  94. Schillings, C.; Wanderer, T.; Cameron, L.; van der Wal, J.T.; Jacquemin, J.; Veum, K. A decision support system for assessing offshore wind energy potential in the North Sea. Energy Policy 2012, 49, 541–551. [Google Scholar] [CrossRef]
  95. Saaty, T.L. The Analytic Hierarchy Process: Planning, Priority Setting, Resource Allocation. Decision Making Series; McGraw-Hill: New York, NY, USA, 1980. [Google Scholar]
  96. Höfer, T.; Sunak, Y.; Siddique, H.; Madlener, R. Wind farm siting using a spatial Analytic Hierarchy Process approach: A case study of the Städteregion Aachen. Appl. Energy 2016, 163, 222–243. [Google Scholar] [CrossRef]
  97. Saaty, R.W. The analytic hierarchy process—What it is and how it is used. Math. Model. 1987, 9, 161–176. [Google Scholar] [CrossRef]
  98. Saaty, T.L. How to make a decision: The analytic hierarchy process. Eur. J. Oper. Res. 1990, 48, 9–26. [Google Scholar] [CrossRef]
  99. Mahdy, M.; Bahaj, A.S. Multi criteria decision analysis for offshore wind energy potential in Egypt. Renew. Energy 2018, 118, 278–289. [Google Scholar] [CrossRef]
  100. Dimitriou, I.C.; Sarmas, E.; Trachanas, G.P.; Marinakis, V.; Doukas, H. Multi-Criteria GIS-based offshore wind farm site selection: Case study in Greece. Renew. Sustain. Energy Rev. 2025, 207, 114962. [Google Scholar] [CrossRef]
  101. Nguyen, H.N.; Fukuda, H.; Nguyen, M.N. Assessment of the Susceptibility of Urban Flooding Using GIS with an Analytical Hierarchy Process in Hanoi, Vietnam. Sustainability 2024, 16, 3934. [Google Scholar] [CrossRef]
  102. Panagiotou, C.F.; Feloni, E.; Aristidou, K.; Eliades, M. Probabilistic Assessment of Flood Susceptibility via a Coparticipative Multicriteria Decision Analysis. Environ. Process. 2025, 12, 22. [Google Scholar] [CrossRef]
  103. Forman, E.; Peniwati, K. Aggregating individual judgments and priorities with the analytic hierarchy process. Eur. J. Oper. Res. 1998, 108, 165–169. [Google Scholar] [CrossRef]
  104. Tercan, E.; Saracoglu, B.O.; Bilgilioğlu, S.S.; Eymen, A.; Tapkın, S. Geographic information system-based investment system for photovoltaic power plants location analysis in Turkey. Environ. Monit Assess 2020, 192, 297. [Google Scholar] [CrossRef]
  105. Malczewski, J. On the Use of Weighted Linear Combination Method in GIS: Common and Best Practice Approaches. Trans. GIS 2000, 4, 5–22. [Google Scholar] [CrossRef]
  106. Jenks, G.F. The Data Model Concept in Statistical Mapping. Int. Yearb. Cartogr. 1967, 7, 186–190. [Google Scholar]
  107. HEREMA. Strategic Environmental Impact Assessment (SEIA). National Programme for the Development of Offshore Wind Farms (In Greek); HEREMA: Athens, Greece, 2023. [Google Scholar]
  108. Obermann-Hellhund, A.; Conte, D.; Somot, S.; Torma, C.Z.; Ahrens, B. Mistral and Tramontane wind systems in climate simulations from 1950 to 2100. Clim. Dyn. 2018, 50, 693–703. [Google Scholar] [CrossRef]
  109. Warder, S.C.; Piggott, M.D. The future of offshore wind power production: Wake and climate impacts. Appl. Energy 2025, 380, 124956. [Google Scholar] [CrossRef]
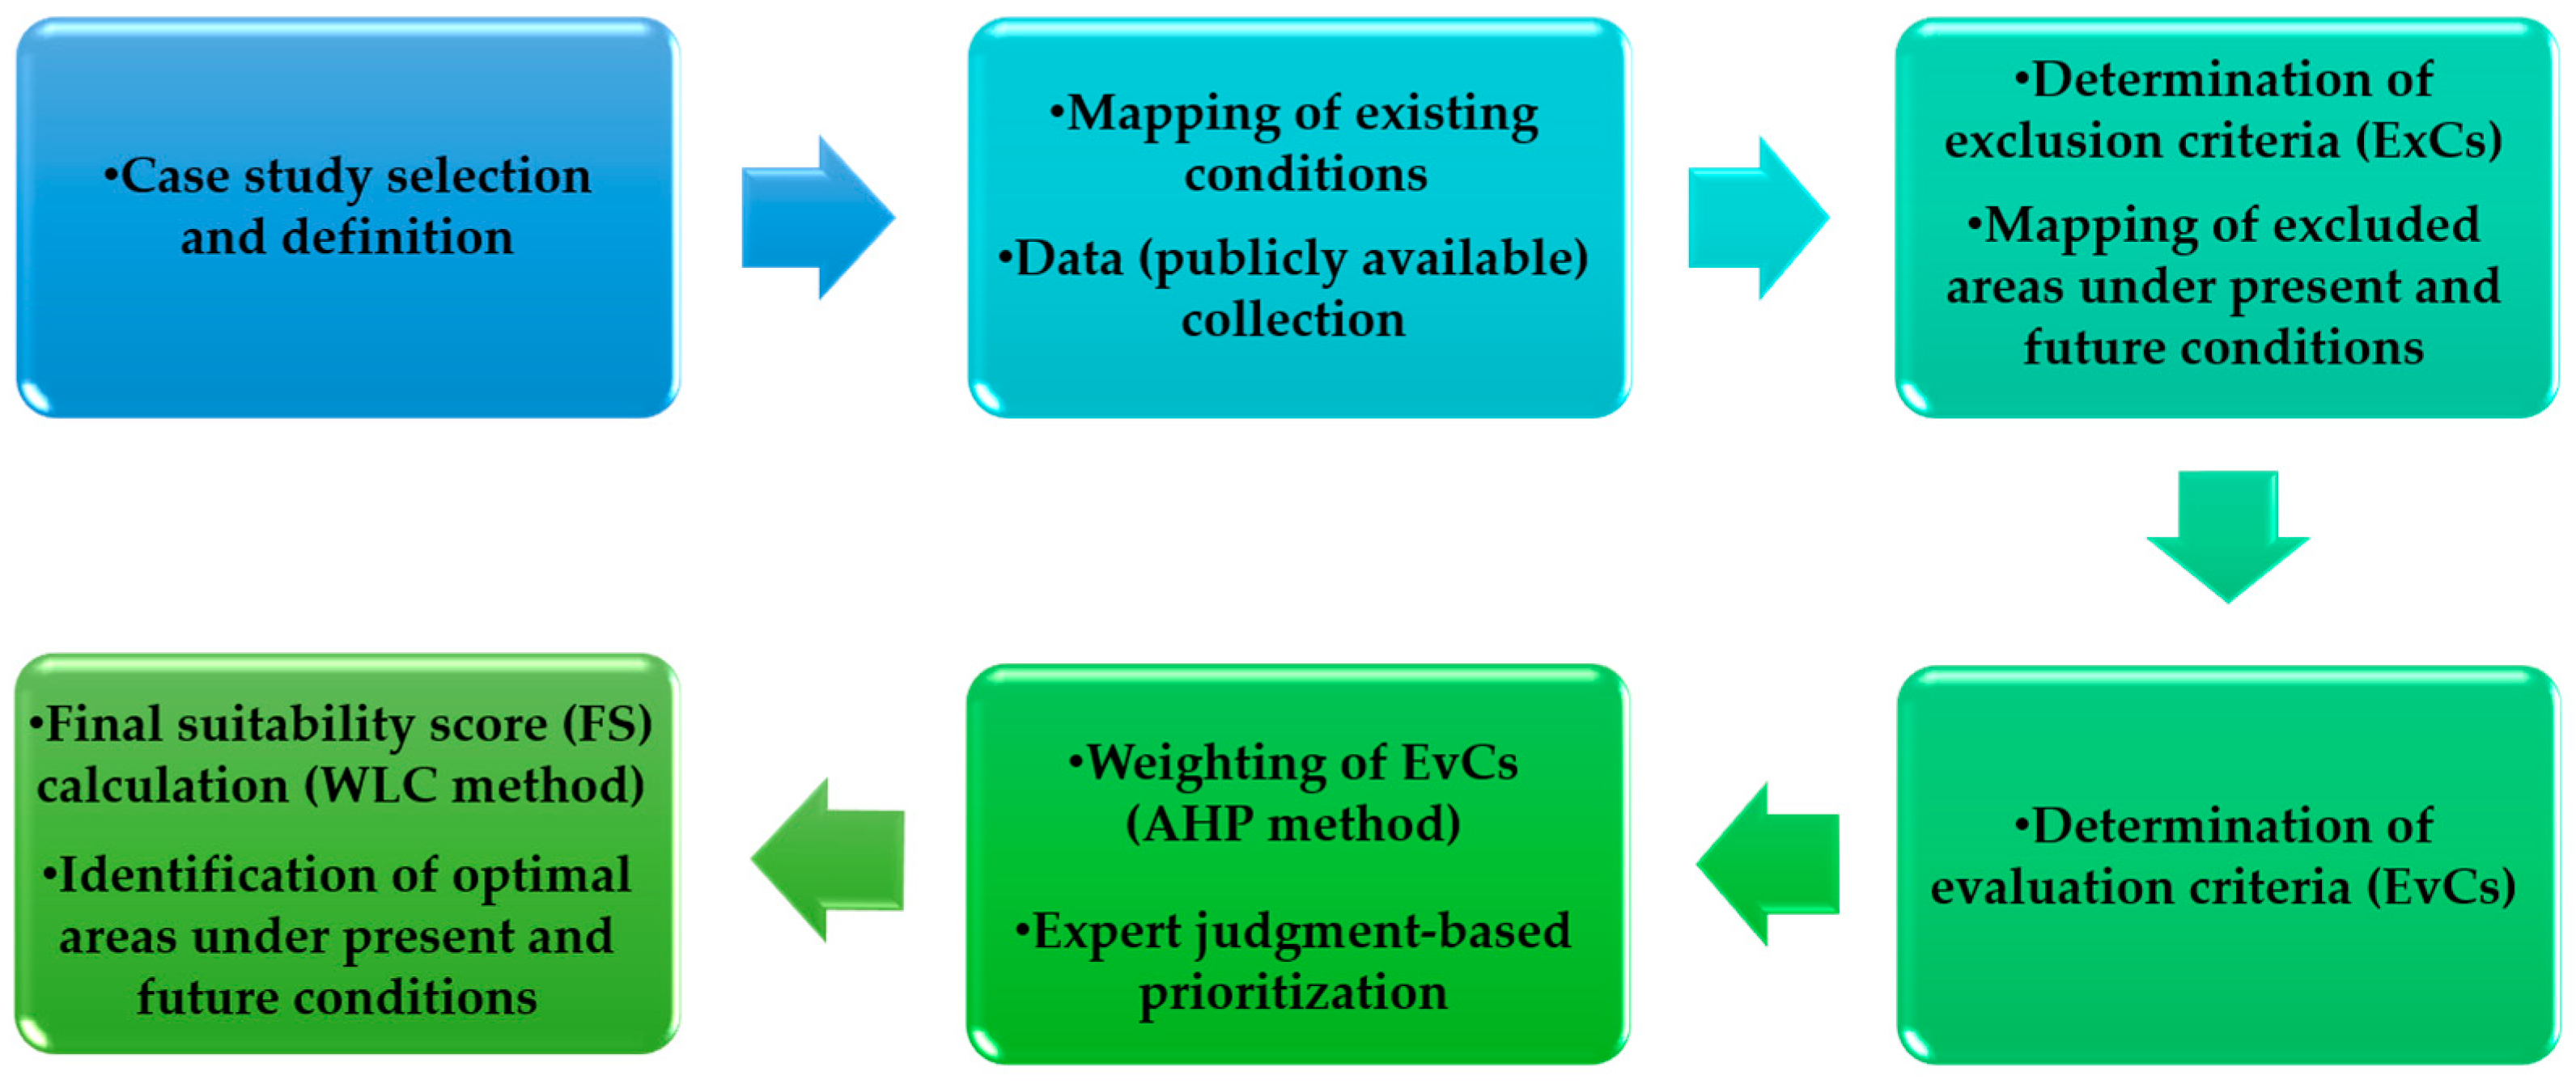
Figure 1. Flow diagram describing the methodology followed for identifying the optimal locations for Offshore Wind Farms deployment under historical reference and future climate conditions.
Jmse 13 01508 g001
Figure 2. Spatial distribution of areas unsuitable for offshore wind farm (OWF) deployment for the baseline period 1981–2010.
Jmse 13 01508 g002
Figure 3. Spatial distribution of areas unsuitable for offshore wind farm (OWF) deployment under future climate conditions: (a) near-future period 2011–2040 under RCP 4.5; (b) mid-century period 2041–2070 under RCP 4.5; (c) near-future period 2011–2040 under RCP 8.5; and (d) mid-century period 2041–2070 under RCP 8.5.
Jmse 13 01508 g003
Figure 4. Standardized values of the evaluation criteria (EvC): (a) Distance from Natura 2000 sites and (b) Distance from shipping routes.
Jmse 13 01508 g004
Figure 5. Suitability of areas available for offshore wind farm (OWF) deployment in Greece for the baseline period 1981–2010. The magenta grid cells constitute areas ‘very high suitability’, the light pink grid cells denote areas of ‘high suitability’, the light orange grid cells are areas of ‘moderate suitability’ and the light green and green are grid cells representing areas of ‘low suitability’ and ‘very low suitability’, respectively.
Jmse 13 01508 g005
Figure 6. Suitability of areas available for offshore wind farm (OWF) deployment in Greece under future climate conditions: (a) near-future period 2011–2040 under RCP 4.5; (b) mid-century period 2041–2070 under RCP 4.5; (c) near-future period 2011–2040 under RCP 8.5; and (d) mid-century period 2041–2070 under RCP 8.5. The magenta grid cells constitute areas ‘very high suitability’, the light pink grid cells denote areas of ‘high suitability’, the light orange grid cells are areas of ‘moderate suitability’ and the light green and green are grid cells representing areas of ‘low suitability’ and ‘very low suitability’, respectively.
Jmse 13 01508 g006
Figure 7. Bar graph showing the percentage area under different suitability classes (‘Very Low Suitability’, ‘Low Suitability’, ‘Moderate Suitability’, ‘High Suitability’, andVery High Suitability’) for different climate conditions: (a) the baseline period 1981–2010, representing present-day conditions (hind); (b) near-future period 2011–2040 under RCP 4.5 (4.5–2); (c) mid-century period 2041–2070 under RCP 4.5 (4.5–2); (d) near-future period 2011–2040 under RCP 8.5 (8.5–1); and (e) mid-century period 2041–2070 under RCP 8.5 (8.5–2).
Jmse 13 01508 g007
Table 1. The Exclusion criteria (ExC), their exclusion and buffer zones and data source for their mapping.
No.CriterionExclusion ZoneBuffer ZoneSource
EC1Water depth<50 m and >1000 m-https://emodnet.ec.europa.eu/en (accessed on 15 March 2025)
https://climate.copernicus.eu/ (accessed on 10 February 2025)
EC2Average wind velocity <6 m/s-https://climate.copernicus.eu/ (accessed on 10 February 2025)
EC3Environmentally protected areas (EPAs)-Natura 2000All1000 mhttp://geodata.gov.gr (accessed on 15 March 2025)
EC4EPAs-areas of outstanding natural beauty (AONB)All1000 mhttps://filotis.itia.ntua.gr (accessed on 15 March 2025)
EC5EPAs-important areas for birdsAll3000 mhttps://ornithologiki.gr/en/ (accessed on 15 March 2025)
EC6EPAs–seagrass meadowsAll1000 mTopouzelis et al., 2017 [40]
EC7Areas of cultural heritage (CHAs)-underwater antiquitiesAll1000 mhttps://thalchor-2.ypen.gov.gr (accessed on 15 March 2025)
EC8CHAs–monumentsAll3000 mhttps://thalchor-2.ypen.gov.gr (accessed on 15 March 2025)
EC9CHAs-archeological and historical sitesAll500 mhttps://thalchor-2.ypen.gov.gr (accessed on 15 March 2025)
EC10CHAs–traditional settlementsAll1500 mhttps://thalchor-2.ypen.gov.gr (accessed on 15 March 2025)
EC11Human settlementsAll1000 mhttp://geodata.gov.gr (accessed on 15 March 2025)
EC12Bathing coastsAll1500 mhttp://geodata.gov.gr (accessed on 15 March 2025)
EC13Areas of military exerciseAll-https://emodnet.ec.europa.eu/en(accessed on 15 March 2025)
EC14Marine routesAll500 mhttps://emodnet.ec.europa.eu/en (accessed on 15 March 2025)
EC15Fisheries areasAll500 mhttps://emodnet.ec.europa.eu/en(accessed on 20 March 2025)
EC16Areas of aquacultureAll500 mhttps://ypen.gov.gr (accessed on 20 March 2025)
EC17AirportsAll3000 mhttp://geodata.gov.gr (accessed on 20 March 2025)
EC18Underwater cables (UC)–telecommunicationAll500 mhttps://thalchor-2.ypen.gov.gr (accessed on 20 March 2025)
https://www.submarinecablemap.com (accessed on 22 March 2025)
EC19UC-energyAll500 mhttps://www.admie.gr (accessed on 22 March 2025)
Table 2. The Evaluation criteria (EvC), their category and target.
No.CategoryCriterionTarget
EvC1Technoeconomic criteriaWater depthMin
EvC2Technoeconomic criteriaAverage wind velocity Max
EvC3Environmental criteriaEnvironmentally protected areas (EPAs)–Natura 2000Max
EvC4Environmental criteriaEPAs–areas of outstanding natural beauty (AONB)Max
EvC5Environmental criteriaEPAs–important areas for birdsMax
EvC6Environmental criteriaEPAs–seagrass meadowsMax
EvC7Safety criteriaMarine routesMax
EvC8Safety criteriaAirportsMax
EvC9Technoeconomic criteriaPortsMin
EvC10Technoeconomic criteriaUC–energyMin
Table 3. AHP fundamental scale [97].
IntensityDefinitionExplanation
1Equal importanceTwo criteria contribute equally to the objective
3Moderate importance of one over anotherJudgment slightly favors one criterion over another
5Essential or strong importanceJudgment strongly favors one criterion over another
7Very strong importanceJudgment very strongly favors one criterion over another and its dominance is demonstrated in practice
9Extreme importanceThe highest level of justified dominance of one criterion over another
2,4,6,8Intermediate valuesCompromises between the adjacent intensities
Table 4. Random consistency values [97].
n12345678910
Random consistency index000.580.901.121.241.321.411.451.49
Table 5. Final weights of evaluation criteria (EvC).
CriterionRelative Importance
Water depth15.02%
Average wind velocity 23.20%
Environmentally protected areas (EPAs)-Natura 200011.71%
EPAs-areas of outstanding natural beauty (AONB)9.19%
EPAs-important areas for birds9.04%
EPAs–seagrass meadows8.24%
Marine routes4.77%
Airports3.32%
Ports6.90%
UC-energy8.62%
Disclaimer/Publisher’s Note: The statements, opinions and data contained in all publications are solely those of the individual author(s) and contributor(s) and not of MDPI and/or the editor(s). MDPI and/or the editor(s) disclaim responsibility for any injury to people or property resulting from any ideas, methods, instructions or products referred to in the content.