Article

Bathymetric Profile and Sediment Composition of a Dynamic Subtidal Bedform Habitat for Pacific Sand Lance

1
Friday Harbor Laboratories, University of Washington, 620 University Rd, San Juan Island, WA 98250, USA
2
School of Aquatic and Fishery Sciences, University of Washington, 1122 NE Boat St, Seattle, WA 98195, USA
3
Moss Landing Marine Labs, Center for Habitat Studies, San Jose State University, San Jose, CA 95112, USA
4
Tombolo Institute, Eastsound, WA 98245, USA
5
Applied Physics Laboratory, University of Washington, 1013 NE 40th St, Seattle, WA 98195, USA
*
Author to whom correspondence should be addressed.
J. Mar. Sci. Eng. 2025, 13(8), 1469; https://doi.org/10.3390/jmse13081469
Submission received: 26 June 2025 / Revised: 26 July 2025 / Accepted: 28 July 2025 / Published: 31 July 2025
(This article belongs to the Special Issue Dynamics of Marine Sedimentary Basin)

Abstract

The eastern North Pacific Ocean coastline (from the Salish Sea to the western Aleutian Islands) is highly glaciated with relic sediment deposits scattered throughout a highly contoured and variable bathymetry. Oceanographic conditions feature strong currents and tidal exchange. Sand wave fields are prominent features within these glaciated shorelines and provide critical habitat to sand lance (Ammodytes spp.). Despite an awareness of the importance of these benthic habitats, attributes related to their structure and characteristics remain undocumented. We explored the micro-bathymetric morphology of a subtidal sand wave field known to be a consistent habitat for sand lance. We calculated geomorphic attributes of the bedform habitat, analyzed sediment composition, and measured oceanographic properties of the associated water column. This feature has a streamlined teardrop form, tapered in the direction of the predominant tidal current. Consistent flow paths along the long axis contribute to well-defined and maintained bedform morphology and margin. Distinct patterns in amplitude and period of sand waves were documented. Strong tidal exchange has resulted in well-sorted medium-to-coarse-grained sediments with coarser sediments, including gravel and cobble, within wave troughs. Extensive mixing related to tidal currents results in a highly oxygenated water column, even to depths of 80 m. Our analysis provides unique insights into the physical characteristics that define high-quality habitat for these fish. Further work is needed to identify, enumerate, and map the presence and relative quality of these benthic habitats and to characterize the oceanographic properties that maintain these benthic habitats over time.

1. Introduction

Complex oceanographic and physical forcing mechanisms shape marine environments and define distinct habitats, both within the water column and on the seafloor. These processes are particularly evident in coastal and estuarine systems where distinct bathymetric features such as dynamic bedforms coincide with powerful currents and tides. These processes may create distinct environmental conditions on small spatial scales and may form and maintain habitats critical to marine species.
Sedimentary bedforms are geomorphic features formed via interaction between water flow and seabed materials and may be composed of loose sand, mud, and depositional rock or gravel [1]. Sedimentary bedforms have many different morphologies and dimensions and are classified according to the associated origin and formation processes, oceanographic conditions, and the grain size of the constituent sediments [2]. Geologic processes, including glaciation, erosion, and deposition, interact with oceanographic processes to drive patterns in material movement. Grain size, flow velocity, and flow regime patterns produce unique, identifiable physical characteristics. Sediment wave fields constitute sediment bedforms with a series of wave and ripple formations comprising sand or other unconsolidated material. These wave fields are formed by the action of tides, currents, or other hydrodynamic forcing [3] and are commonly associated with deep water where currents and sediment shape the seafloor. Sediment waves are a secondary depositional feature formed by the interaction of water currents, with the seabed characterized by slightly oblique or parallel wave morphologies, typically <250 m wide, 3–7.5 km long, and 15–55 m high [4]. Sediment waves form along the depositional flanks of subtidal features and may be found on continental shelves and slopes, abyssal plains, and channel systems such as fjords. Sediment wave morphology can be affected by various factors, including current velocity, sediment grain size, and slope gradient. The study of sediment wave fields can provide insights into the dynamics of marine currents and sediment transport and may represent important habitats for marine organisms, particularly where maintained over time.
Identifying and characterizing essential fish habitat is recognized as an important part of defining species distributions and managing marine species of interest [5,6]. Many species are data-poor [7], especially small pelagic fishes in the North Pacific Ocean [8]. Further information is critical to advance ecological understanding and sustainable management of these fishes [9]. In particular, significant knowledge gaps exist in the spatial distribution of small pelagic fish [10]. Efforts to define critical habitat and understand its conditions, extent, and maintenance may inform management and conservation, reduce uncertainties in stock dynamics, and help to direct future research priorities [11].
Pacific sand lance (Ammodytes personatus, hereafter sand lance) are an ecologically important forage fish in the North Pacific Ocean [12,13] associated with sediment bedforms. Sand lance are usually found in areas with strong bottom currents that oxygenate the areas of sediment in which the fish are buried [14,15]. These fish prefer to burrow in well-flushed sediment [16,17,18], likely because of the additional interstitial oxygen provided in these environments. Characterization of ideal habitat for A. personatus is important for management of this critical species. Previous studies have noted that A. personatus has shown a preference for coarse sands, with silt being a strongly limiting factor. Understanding what constitutes ideal and unsuitable habitat is critical for predicting sand lance distribution and estimating stock abundance. Many dynamic sediment bedforms exist within marginal seas such as the Salish Sea [19,20]. Here banks of till and glacial advance/outwash deposits form and contribute to the relief and substrate dynamics within the region [21]. Tidal actions shape these relic glacial marine sediments into dynamic bedforms and wave fields within interisland channels and sort sediments, remove fine-grained silt and mud, and ensure regular circulation of interstitial oxygen. These sand wave fields support large populations of Pacific sand lance as well as other species [17,22].
Subtidal sedimentary bedforms have been studied for the purpose of characterizing bedforms [23,24]. Studies have also described associations where sediment waves were considered habitat for fish [25,26,27,28]. Improvements in remote sensing and spatial analysis have enabled increasingly sophisticated analyses of the benthic terrain and oceanographic variables that define and characterize bathymetric relief and benthic habitat. These data and GIS approaches have been applied to evaluate bottom trawl survey efforts [29], model essential fish habitat [30], and inform marine spatial management [31,32]. We used multibeam echo sounder (MBES) bathymetry and in situ physical oceanographic data to define attributes of a subtidal sand wave field known to be an important habitat for Pacific sand lance. Our analyses focused on the morphological structure of this bedform and wave formations within this feature, as well as the oceanographic features associated with the waters above this feature and the physical forcing that defines and maintains this important bedform habitat. These efforts are intended to further inform the expanding literature on the ecological role, function, and services of sandbank and gravel-bank ecosystems [33].

2. Methods

2.1. Sample Site—San Juan Channel Sand Wave Field

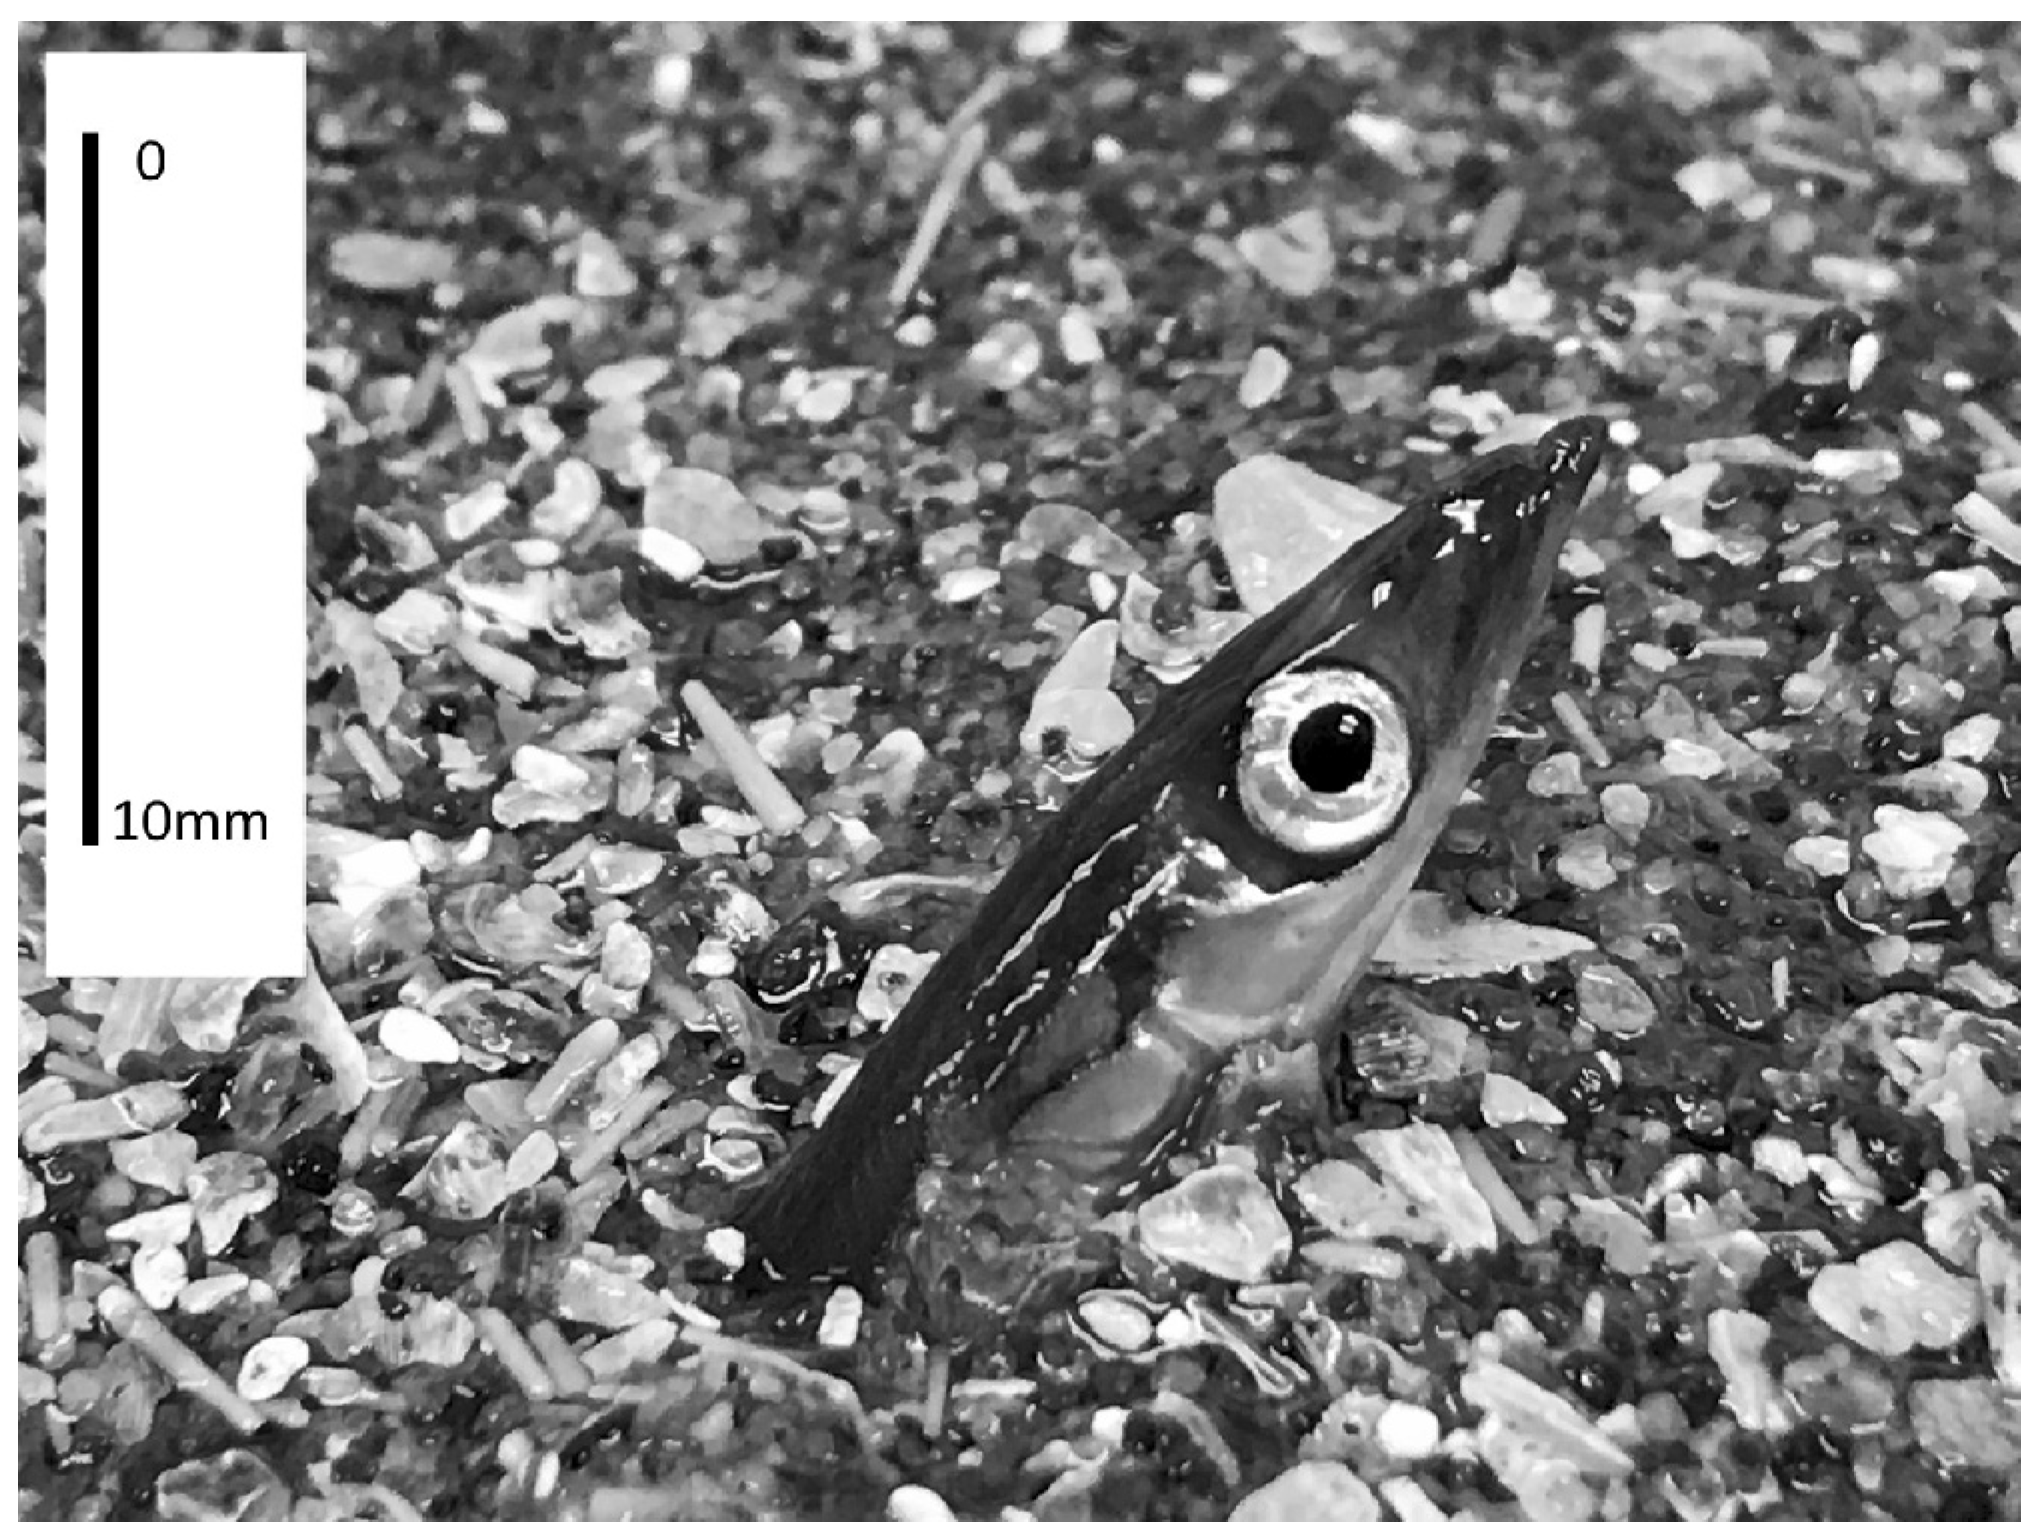
Our study site is in the Salish Sea on the northwest coast of North America (Figure 1). This marginal inland sea adjoining the eastern Pacific Ocean includes the Georgia Strait and the Gulf Islands of British Columbia, Canada, as well as the San Juan Archipelago, Strait of Juan de Fuca, and Puget Sound in the United States. The San Juan Channel (SJC) sand wave field is a prominent subtidal sand wave field in the central San Juan Archipelago (48°31′ N, 122°57′ W; Figure 1). Van Veen sediment grabs (N = 793) were collected throughout the sand wave field every year from 2010 to 2025 through the University of Washington Pelagic Ecosystem Function Research Apprenticeship. The sand wavefield is a known habitat for adult sand lance [22,34,35,36,37,38]. Sand lance are consistently present in most grabs in all years [37,38] (Figure 2), and annual sand lance abundance in this sand wave field is estimated to reach or exceed 100 million fish [37].

2.2. Multibeam Bathymetric Echosounder Survey Data and Imaging

Multibeam echosounder (MBES) bathymetry surveys were conducted in 2001–2008 in collaboration with the Geological Survey of Canada, Canadian Hydrographic Service, and the San Jose State University Center for Habitat Studies, Moss Landing Marine Labs. These geophysical surveys acquired wide swath MBES bathymetry and backscatter data throughout the Northwest Straits of the Salish Sea, including the Southern Gulf Islands and the San Juan Archipelago. Simrad (Horten, Norway) EM 1002 (95 kHz frequency) and EM 3000–3002 (300 kHz frequency) systems were used for deep (>80 m) and shallow (<80 m) waters with resolutions of 5 and 2 m. In most of the areas, the tracks were positioned with 100% overlap, providing 200% coverage. Positioning was accomplished using a broadcast Differential Global Position System (DGPS), and MBES data were corrected for sound speed variations in the stratified water column using frequent sound speed casts. Interpretations of these data were subsequently published in a marine benthic habitat map series [19,20,35]. The SJC sand wave field was originally imaged in 2004 with repeat surveys in 2006 and 2007 with the Canadian Coast Guard launch at Otter Bay using a Simrad EM 3000–3002™ (300 kHz) system. These data, along with side-scan sonar mosaics and 3.5 kHz sub-bottom seismic-reflection profiles, were used to produce the seafloor images of the sediment wave field. MBES bathymetric maps were analyzed and used to identify unique subsections of the wave field based on depth, wave height and length, and bedform slope.

2.3. Submersible Surveys and Sonar Images

Piloted submersible surveys using the OceanGate (Everett, WA, USA) Cyclops I were conducted in a set of transects running north–south and in an east–west bisect of the sand wave field [22,36]. The dimensions of the submersible were 6.64 m × 2.83 m × 2.17 m at a weight of 9525 kg and a payload of 522 kg. Photographs of the sand wave field were taken through a 1.45 m acrylic front-facing dome. Submersible lighting was provided through two Teledyne Bowtech (Aberdeen, UK) LEDs (40,000 lumens total output). Sonar imaging of wave formations within the bedform was secured using Teledyne BlueView 2D and 3D sonar.

2.4. Sediment Collection

A Van Veen grab sampler [39] was deployed on the R/V Centennial and R/V Auklet to sample in the SJC sand wave field between 15 September and 10 December (2010–2024). The Van Veen grab covered a surface area of 0.12 m2, with a maximum sediment collection volume of 0.026 m3. Standard research and sampling cruises were conducted on a weekly basis, with data from these cruises combined with data from other directed sampling events undertaken throughout each fall. On each sampling occasion 5–10 successful grabs were collected. Van Veen sediment grabs were classified as either successful or unsuccessful. A successful grab was a fully closed grab, with no sediment leakage. Unsuccessful grabs included grabs where the trap failed to secure a sample or failed to fully close and therefore lost sediment during recovery. Fish and sediment were retained from each successful grab. Relative abundance (catch per unit effort, CPUE) was recorded at the SJC wave field throughout the fall. Efforts were made to comprehensively sample the SJC sand wave field. However, due to the presence of two cable crossings where sampling was prohibited, most samples were conducted in the southern portion of this benthic feature (Figure 1).

2.5. Sediment Processing

Sediment processing and analysis were conducted on in situ sediment samples collected via Van Veen sediment grabs deployed from surface vessels in the years 2012–2017. Sediment was retained from all successful grabs in these years. After integrating sediments within each sample, approximately 2 L of sediment was set aside as a subsample and washed to remove salt. Water was drained from the top of the sediment to minimize loss of silt. Approximately 4 kg of sediment was dried in a Precision Scientific (Winchester, VA, USA) Thelco Model 17 drying oven for a minimum of 10 h at 95–110 °C. Once dried and cooled, the sediment was placed in a WS Tyler (Sparks, NV, USA) Ro-Tap RX-29-E Test Sieve Shaker for a minimum of 10 min using the “fine” setting to separate by grain size into a phi ( φ ) scale according to the standardized Wentworth scale [40]. The Ro-Tap sieve shaker uses two-dimensional motion, including horizontal agitation and shaking and vertical tapping action, to move particles through a stack of sieves oriented in a series of declining mesh sizes (top-tobottom). The former process separates particles, and the latter promotes movement through the mesh screens. Particles are separated according to grain size and retained on the appropriate sieve. Phi ( φ ) size is equal to log 2 (diameter in mm). Sieves ranged from −3 φ to 4 φ with a receptacle under the bottom sieve to collect any sediment finer than 4 φ . Each sieve size (8 mm, 4 mm, 2 mm, 1 mm, 500 μm, 250 μm, 125 μm, and 63 μm) was weighed on a high-precision scale and classified to an explicit phi size and qualitative descriptive category using the Wentworth scale [40,41]. The percent of recovery was calculated to ensure that no more than 1% of the sample was lost during the process.

2.6. Sediment Analytics—Grain Size Analysis and Statistics

For each grab, the percentage of sediment in each sediment category % φ   v was determined from the relative weight of each sediment type to the total weight of all sediment run through the screens representing the sample from that Van Veen grab (Equation (1)).
% φ v = S φ , v T v · 100
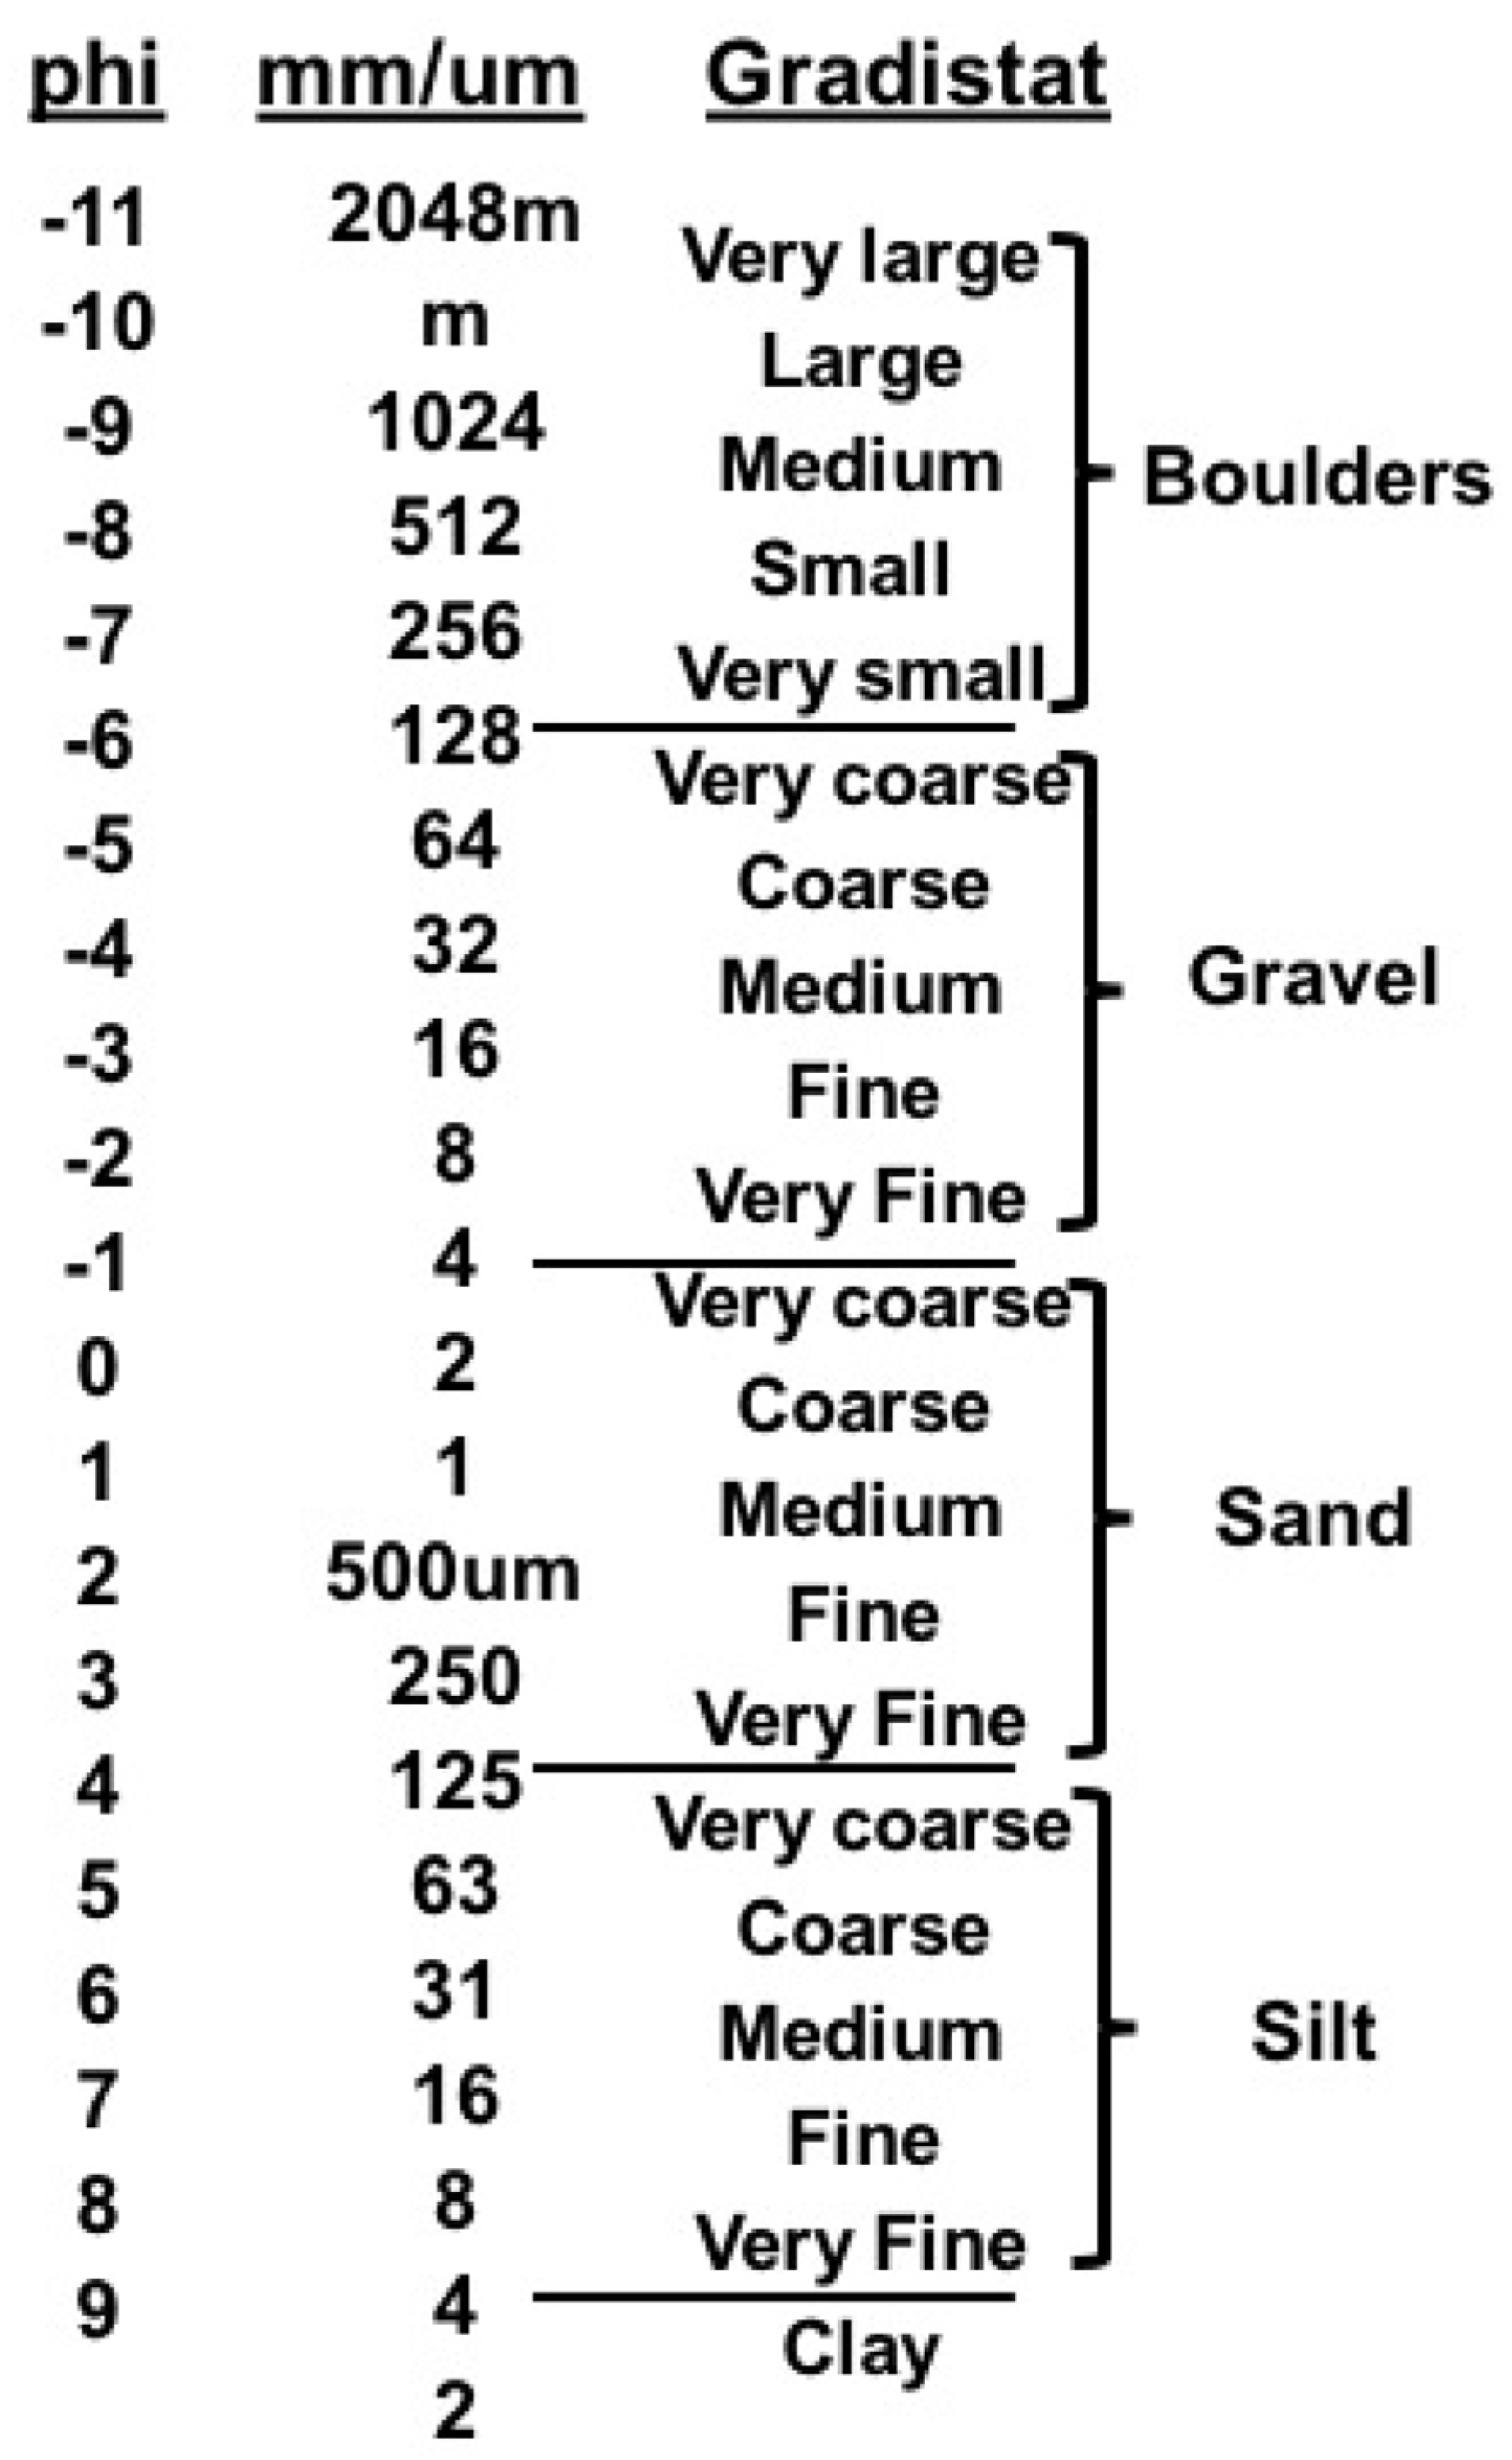
Percent gravel ( φ =   −3 to −1), sand ( φ = 0 to 3), and silt ( φ 4 to ≥5) were calculated for each sample, as per the classifications used by the GRADISTAT program (version 8.0) [42]. The phi scale and GRADISTAT descriptions of sediment are summarized in Appendix A (Appendix A, Figure A1), and sediments are shown (Appendix A, Figure A2). Percent weights for each class of sediment grain size were entered into the GRADISTAT program, which provided descriptions for each sample based on the Folk and Ward Method, and distribution statistics (mean phi size, sorting, skewness, and kurtosis) based on the logarithmic method of moments approach [42]. Mean phi size for each Van Veen grab ( φ v ¯ ) was determined as a function of the sum across all sediment phi sizes (i to n) of the product of φ and the relative weight of sediment at that φ , divided by the overall weight of all sediment in the grab (Equation (2)):
φ v ¯ = i n φ i · S φ , v T v
where φ v ¯ is the mean phi size for Van Veen grab v, φ is the phi size for the sediment category in Van Veen v, S is the weight of the particular sediment category φ in grab v and T is the total sediment weight within the grab v.
Analyses of sediment composition (mean phi size, sorting) [43] used the arithmetic method of moments in GRADISTAT [42].

2.7. Physical Oceanography–Oxygen Profiles

Vertical profiles of oxygen concentration (mg L−1) were obtained through casts with a CTD (Sea Bird Electronics SBE 25 outfitted with an SBE 43 oxygen sensor) performed in the San Juan Channel at the northern end of the sand wave field (map, Figure 1). The oxygen data were binned every half meter and plotted versus depth (with the y-axis reversed so depth = 0, the surface, is at the top). Data for assessing oxygen incorporated 52 CTD casts on dates between 2010 and 2015, including 8488 individual observations. Over 100 points make up each cast. Data for these casts are available through the Northwest Association of Networked Ocean Observing Systems (https://www.nanoos.org/products/san_juan_pef/home.php accessed on 1 November 2024). Quality assurance and quality control were maintained through direct comparisons of oxygen readings to lab titrations of water samples collected in Niskin bottles on the CTD rosette during these same casts, analyzed using standard Winkler titrations [44]. The CTD profiles were divided into “Spring” (March–April), “Summer” (August–September), and “Fall” (October–November).

2.8. Geographic Information Systems and Data Visualization

Maps were developed using ArcGIS (version 10.1, ESRI), and spatial analyses were conducted in R (R Core Development Team, version 4.5.1). Digital elevation models (DEM Surface Tools) [45] and benthic terrain models (BTM) [46,47] were used to determine the Bathymetric Position Indices (BPIs) at coarse-scale and fine-scale resolution. These indices were then used to derive layers for slope, aspect, rugosity, and curvature (planar, profile, general, and total).

3. Results

3.1. San Juan Channel Sand Wave Field Attributes

The SJC sand wavefield (Figure 1) covers an area of approximately 600,000 m2 and is oriented north–south. The sand wavefield is approximately 0.74 km wide at the widest point (east–west) and 1.88 km long (north–south). It is located at a depth of 50 m in the north and 80 m in the south. This wavefield contains sand waves with wavelengths up to 100 m and heights of approximately 1–4 m within its central area. The sand wave field is delimited by distinct boundaries where the sand waves contrast with a relatively featureless surrounding sea floor. It is sharply bounded with definitive edges of the field and maintained by strong tidal currents.

3.2. Sand Wave Field Morphology and Geometry

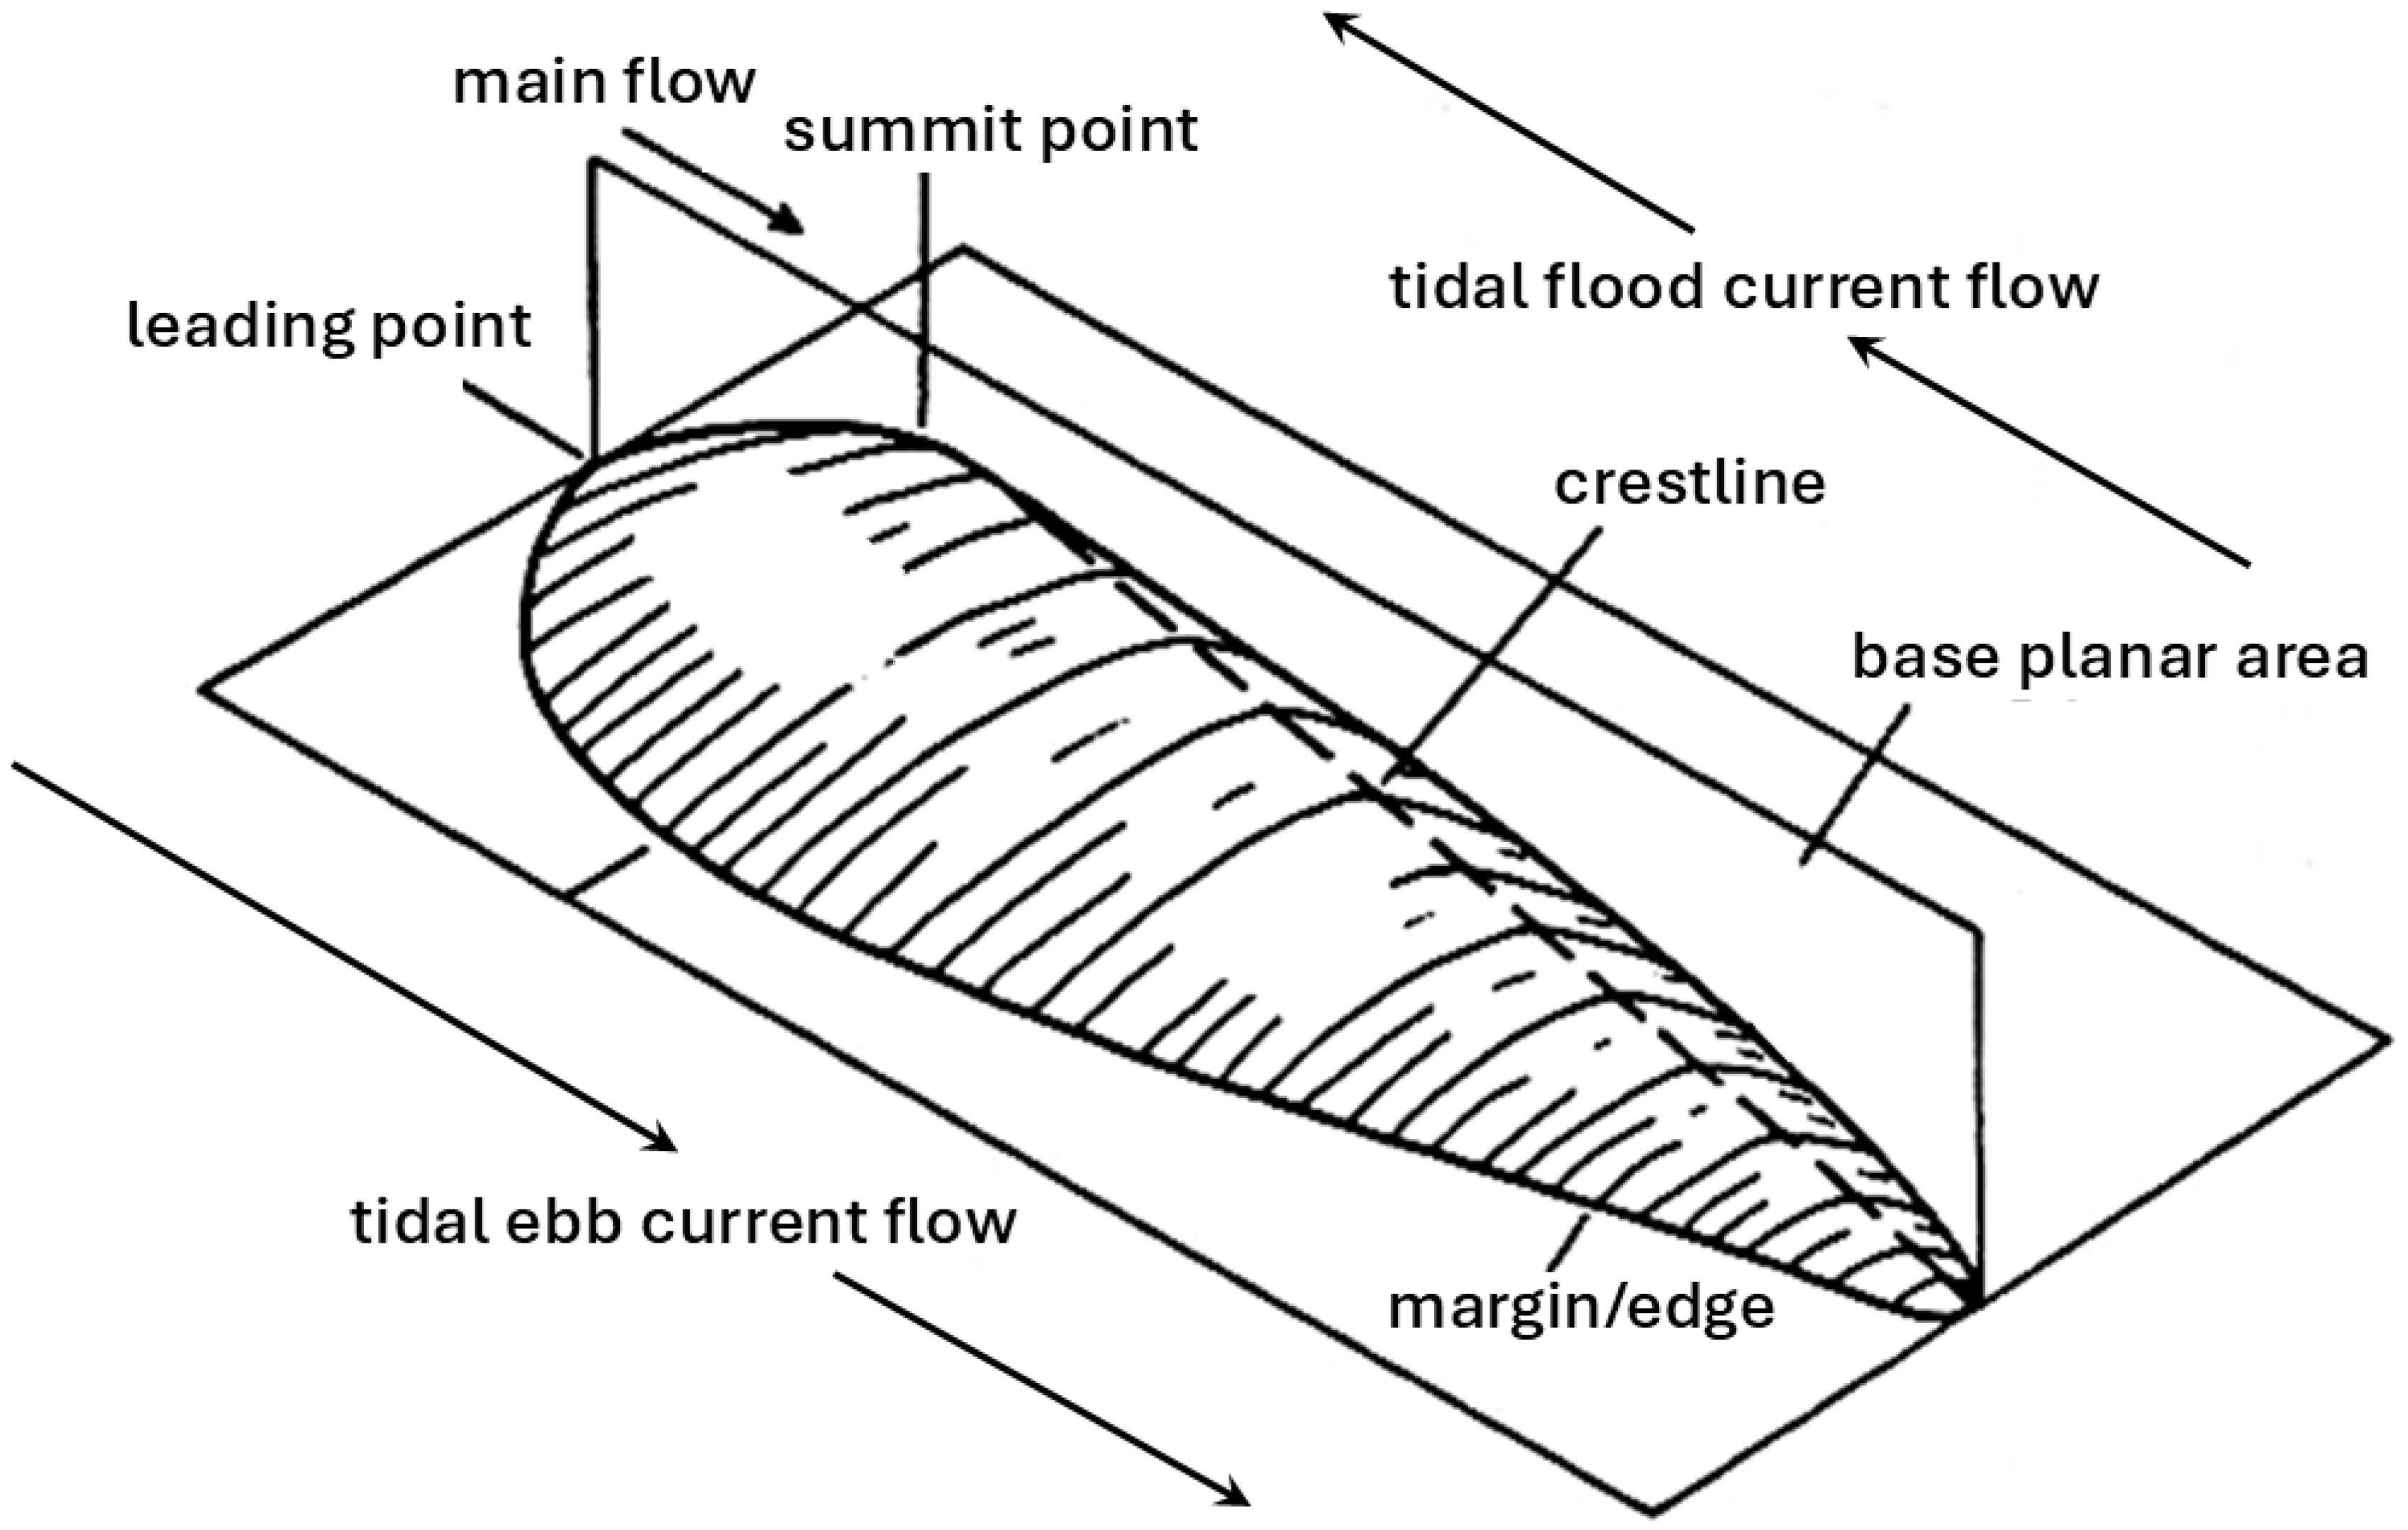
The SJC sand wave field represents a streamlined form (Figure 3). Relic glacial sediments reside on a relatively flat base plane of hard substrate and gravel deposits. The feature is sculpted into a teardrop shape tapering in the direction of the predominant tidal flow (tidal ebb current to the south). The feature has a common marine sand wave field morphology that rises rapidly from the leading (northern) point to the summit point, with a blunt stoss side and tapered lee side (Figure 3).

3.3. Bathymetric Profile and Sonar Imagery

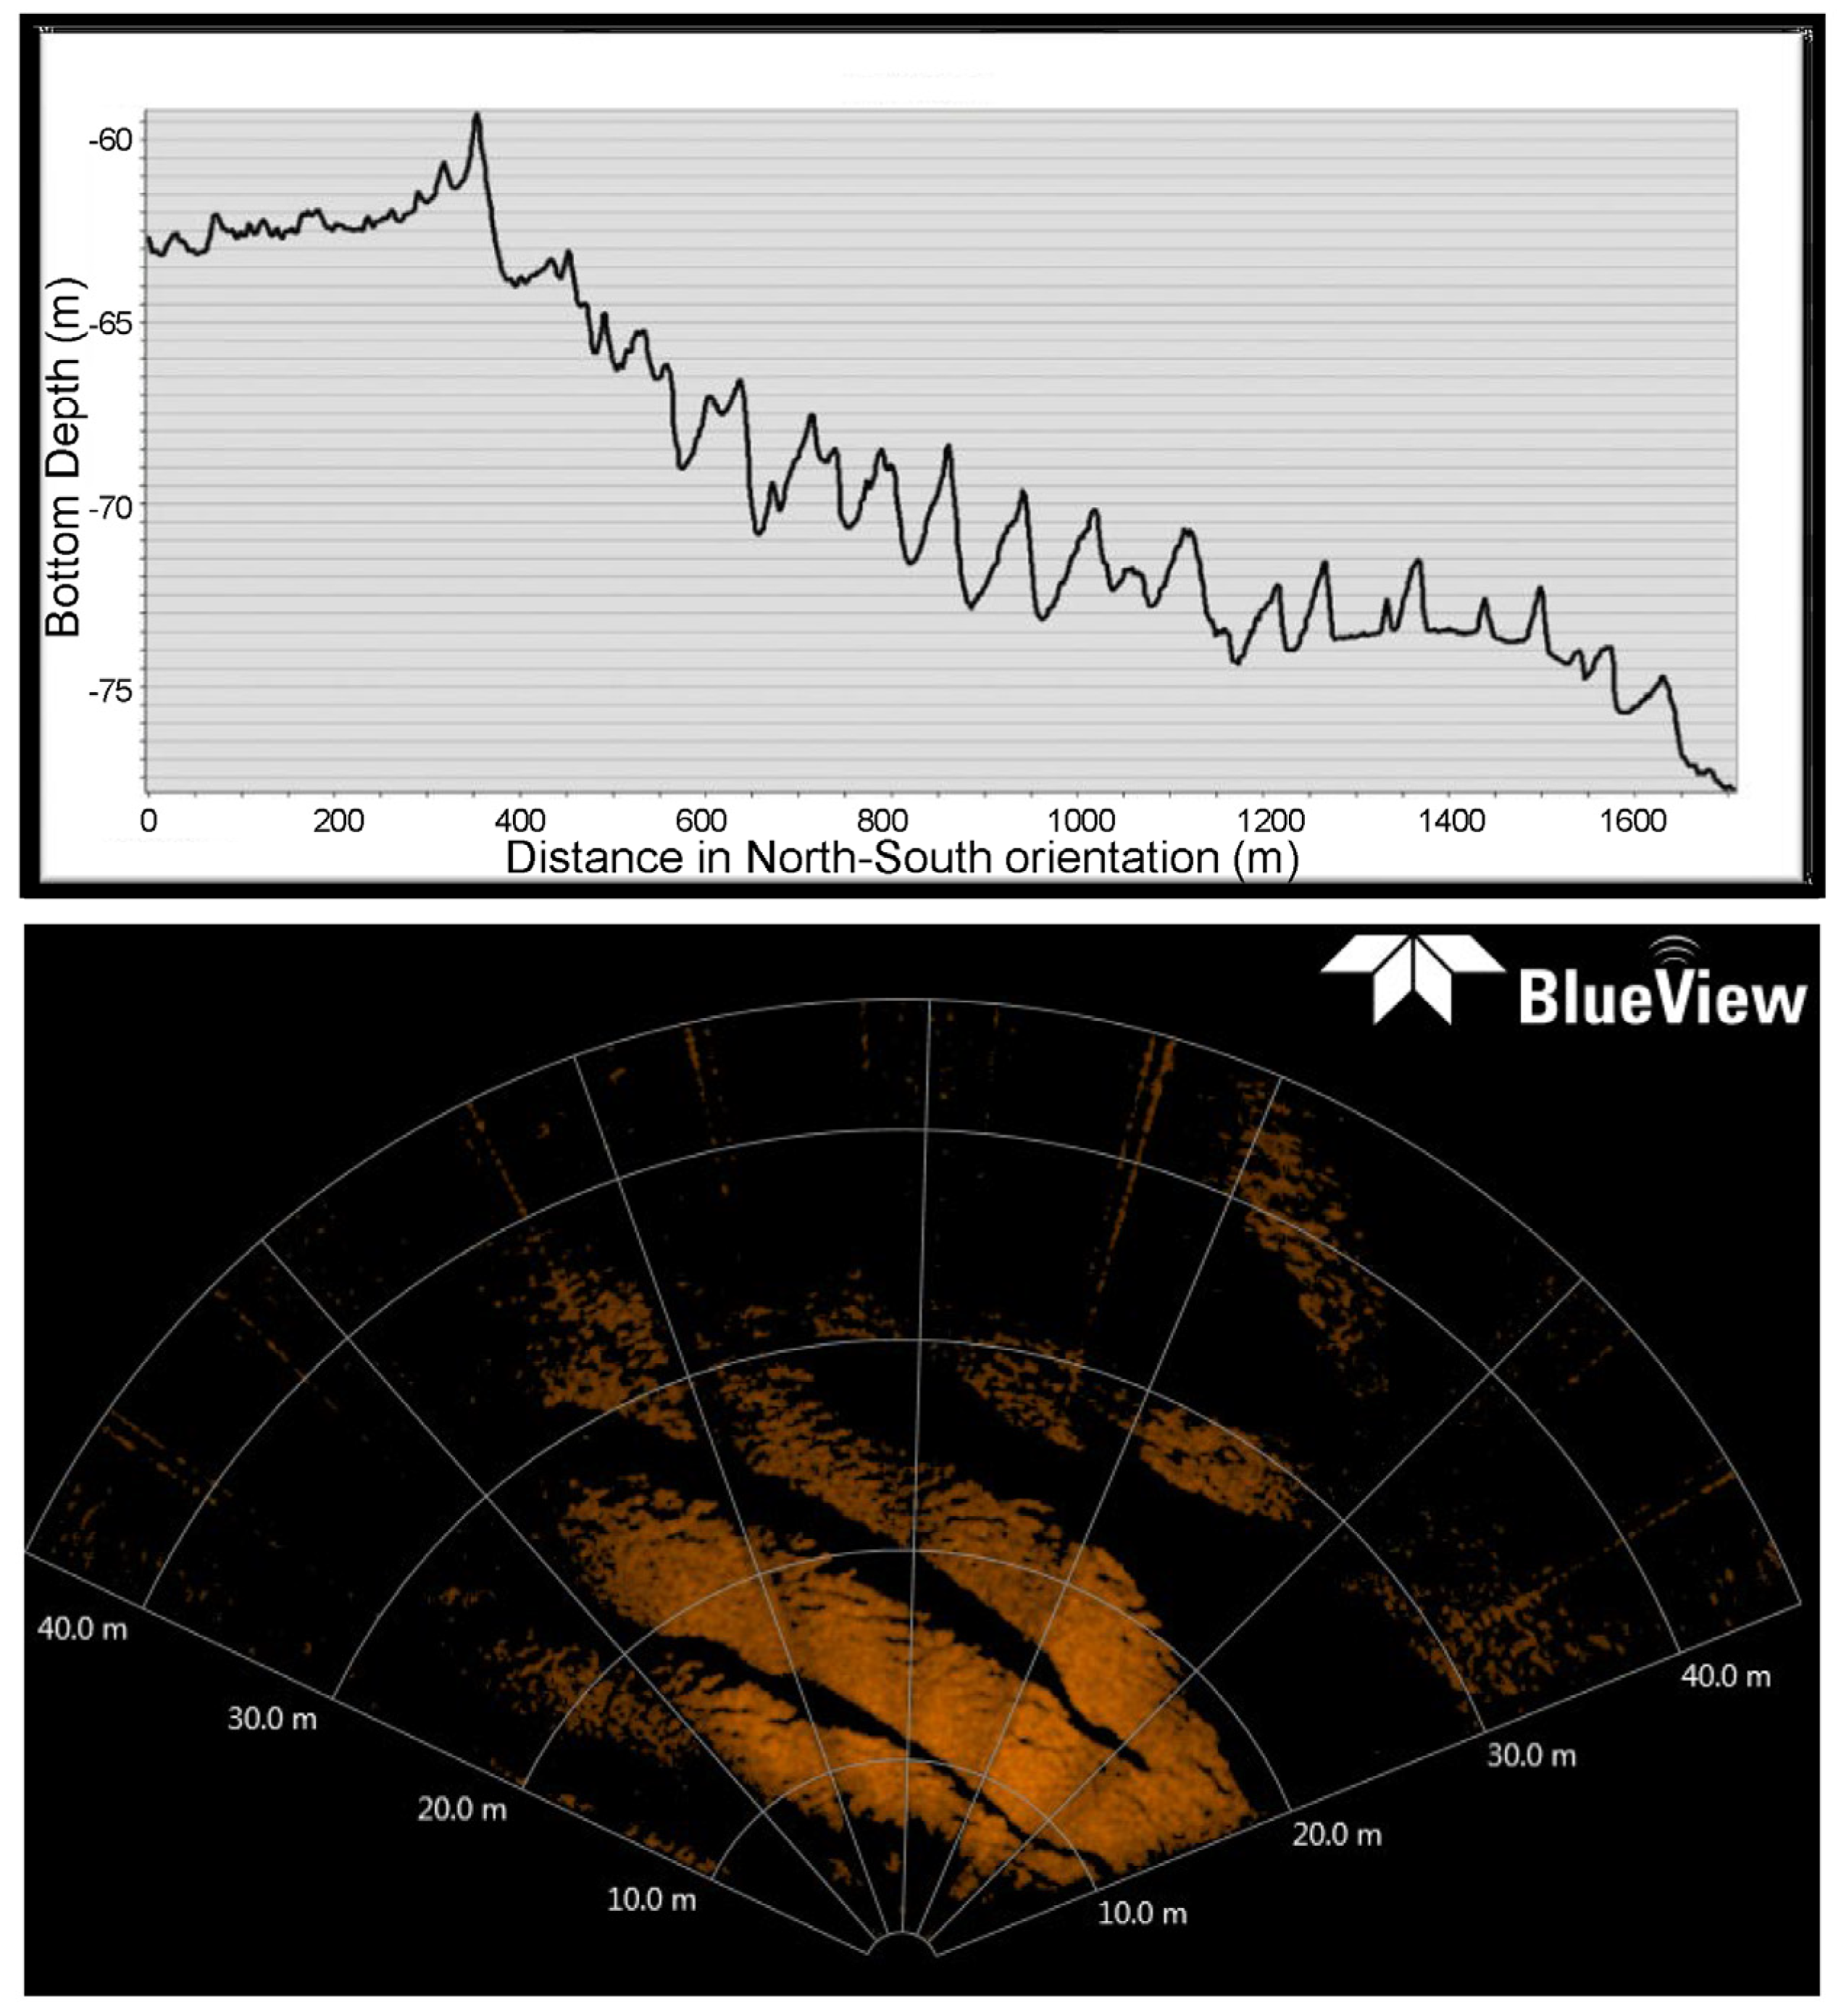
The bathymetric profile and MBES image of the SJC sand wave field provided insight into the different shapes of the sand waves of this subtidal bedform as well as the internal wave morphologies (Figure 4, panel 1). The sand wave field may be divided into two distinct sections (north and south) and five zones based on depth and micromorphology. Zone 1 (0–300 m, all distances are from the leading point) is relatively flat, with no net change in depth and no undulations or wave forms. Both zone 2 (300–550 m) and zone 3 (550–700 m) have an overall steep-inclined basal surface gradient (descending 10 m in depth over a distance of 0.4 km) and are characterized by sand waves that are sharp and well-defined with steeper flanks facing north (wave heights = 1–2 m; wave lengths = 30–40 m). Both zone 4 (700–1200 m) and zone 5 (1200–1700 m) are characterized by a reduced slope (descending 8 m over 1 km), and the sand waves are larger and more irregular (wave heights 2–4 m; wavelengths 50–100 m). Overall, the northern section (zones 1–3, total area = 0.19 km2) is approximately 40% of the sand wave field and is characterized by relatively small symmetrical wave forms. The southern section (zones 4–5, total area = 0.41 km2) is approximately 60% of the bedform and is characterized by relatively larger irregular wave forms. Sonar-derived 3-dimensional images of large wave formations in the central portion of the sand wave field (Figure 4, panel 2) provided insight into the periodicity and shape of sand wave formation. Waves are arranged in fields, some containing tens of thousands of individual ripples and waves. Individual waves are asymmetrical, highest at their proximal blunt ends and taper in the ebb–flow direction on their lee sides.

3.4. Derived Benthic Terrain Metrics

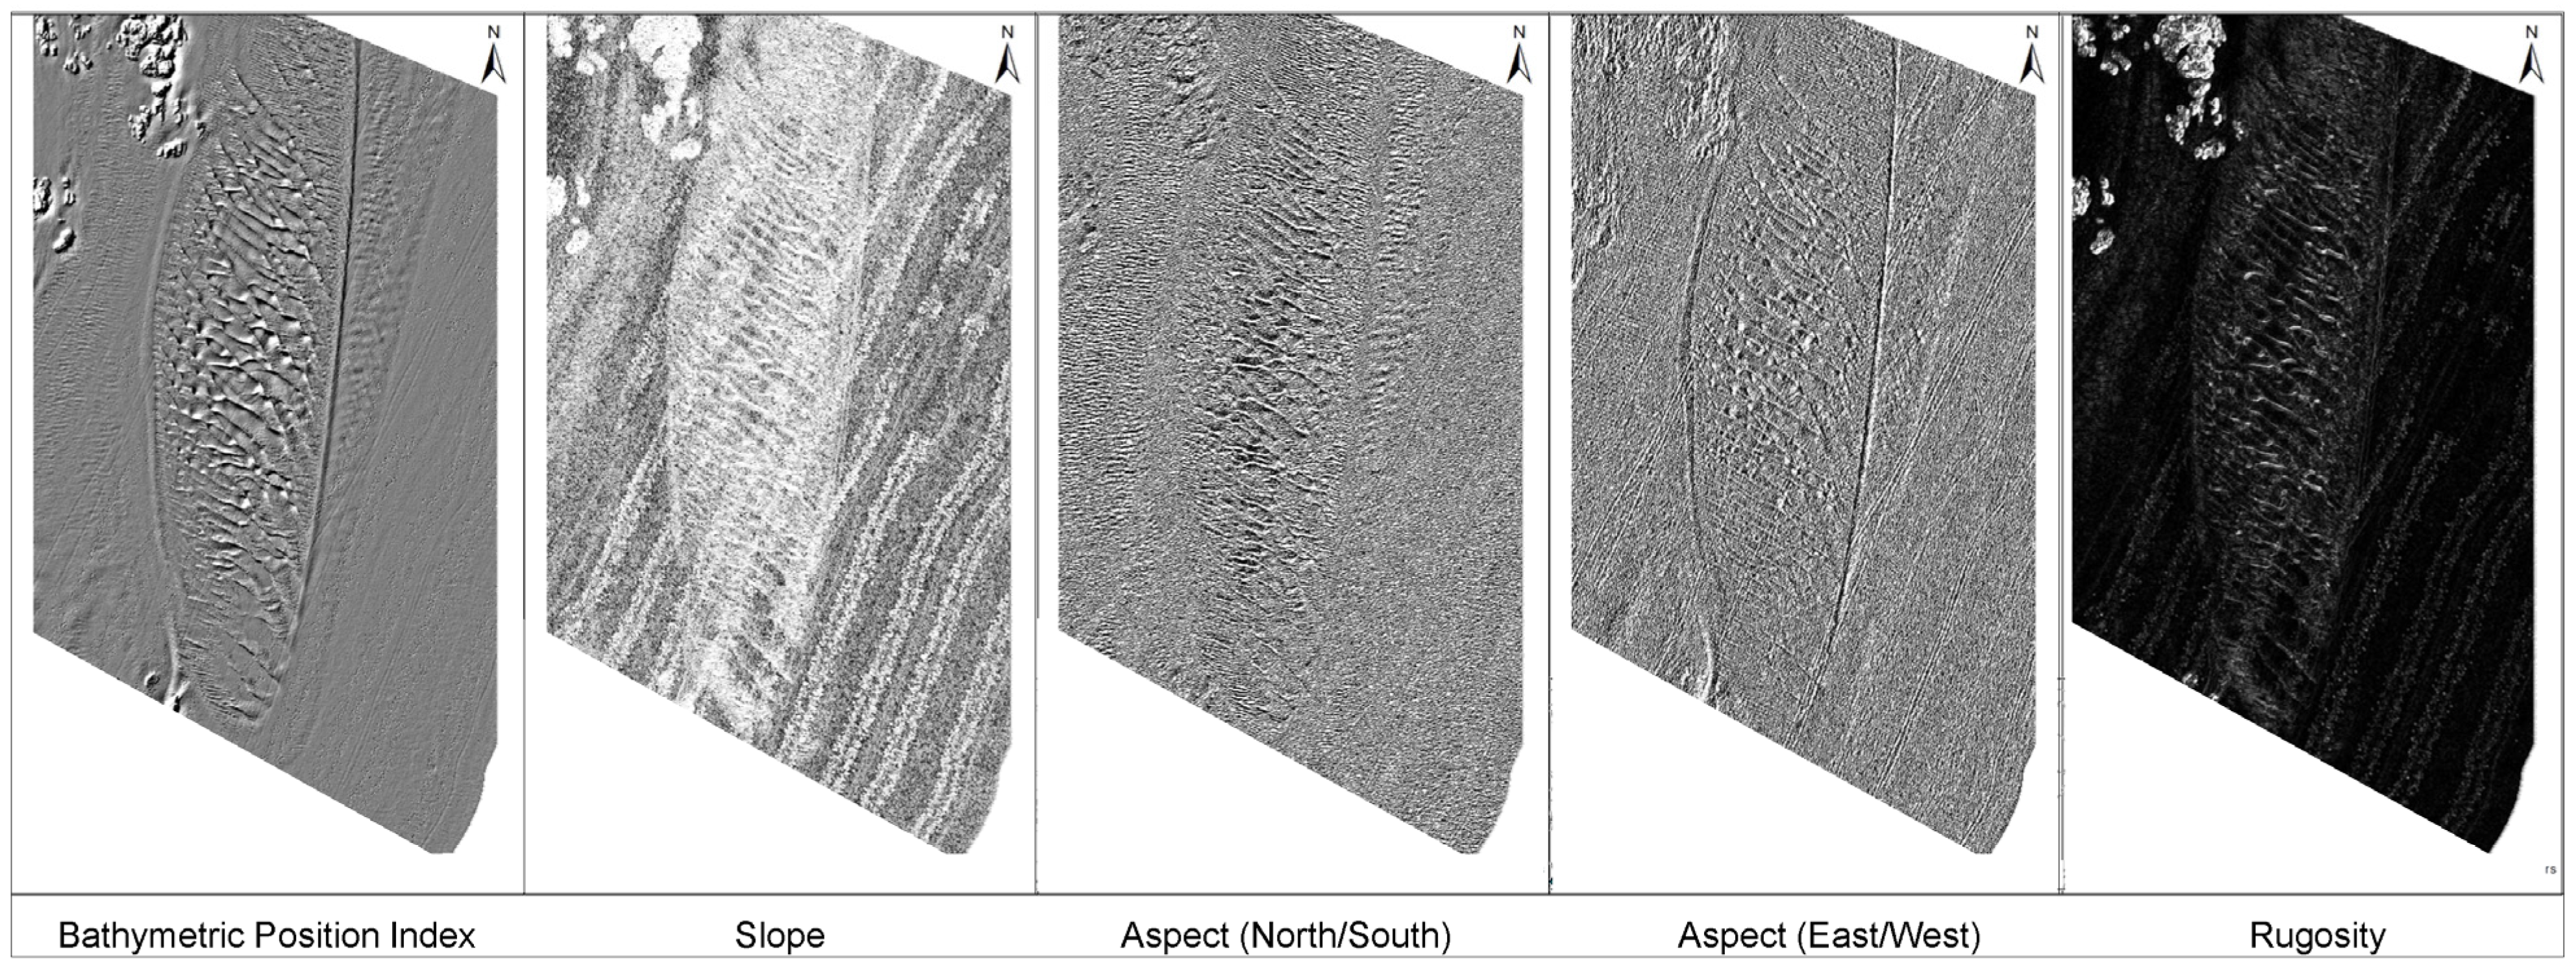
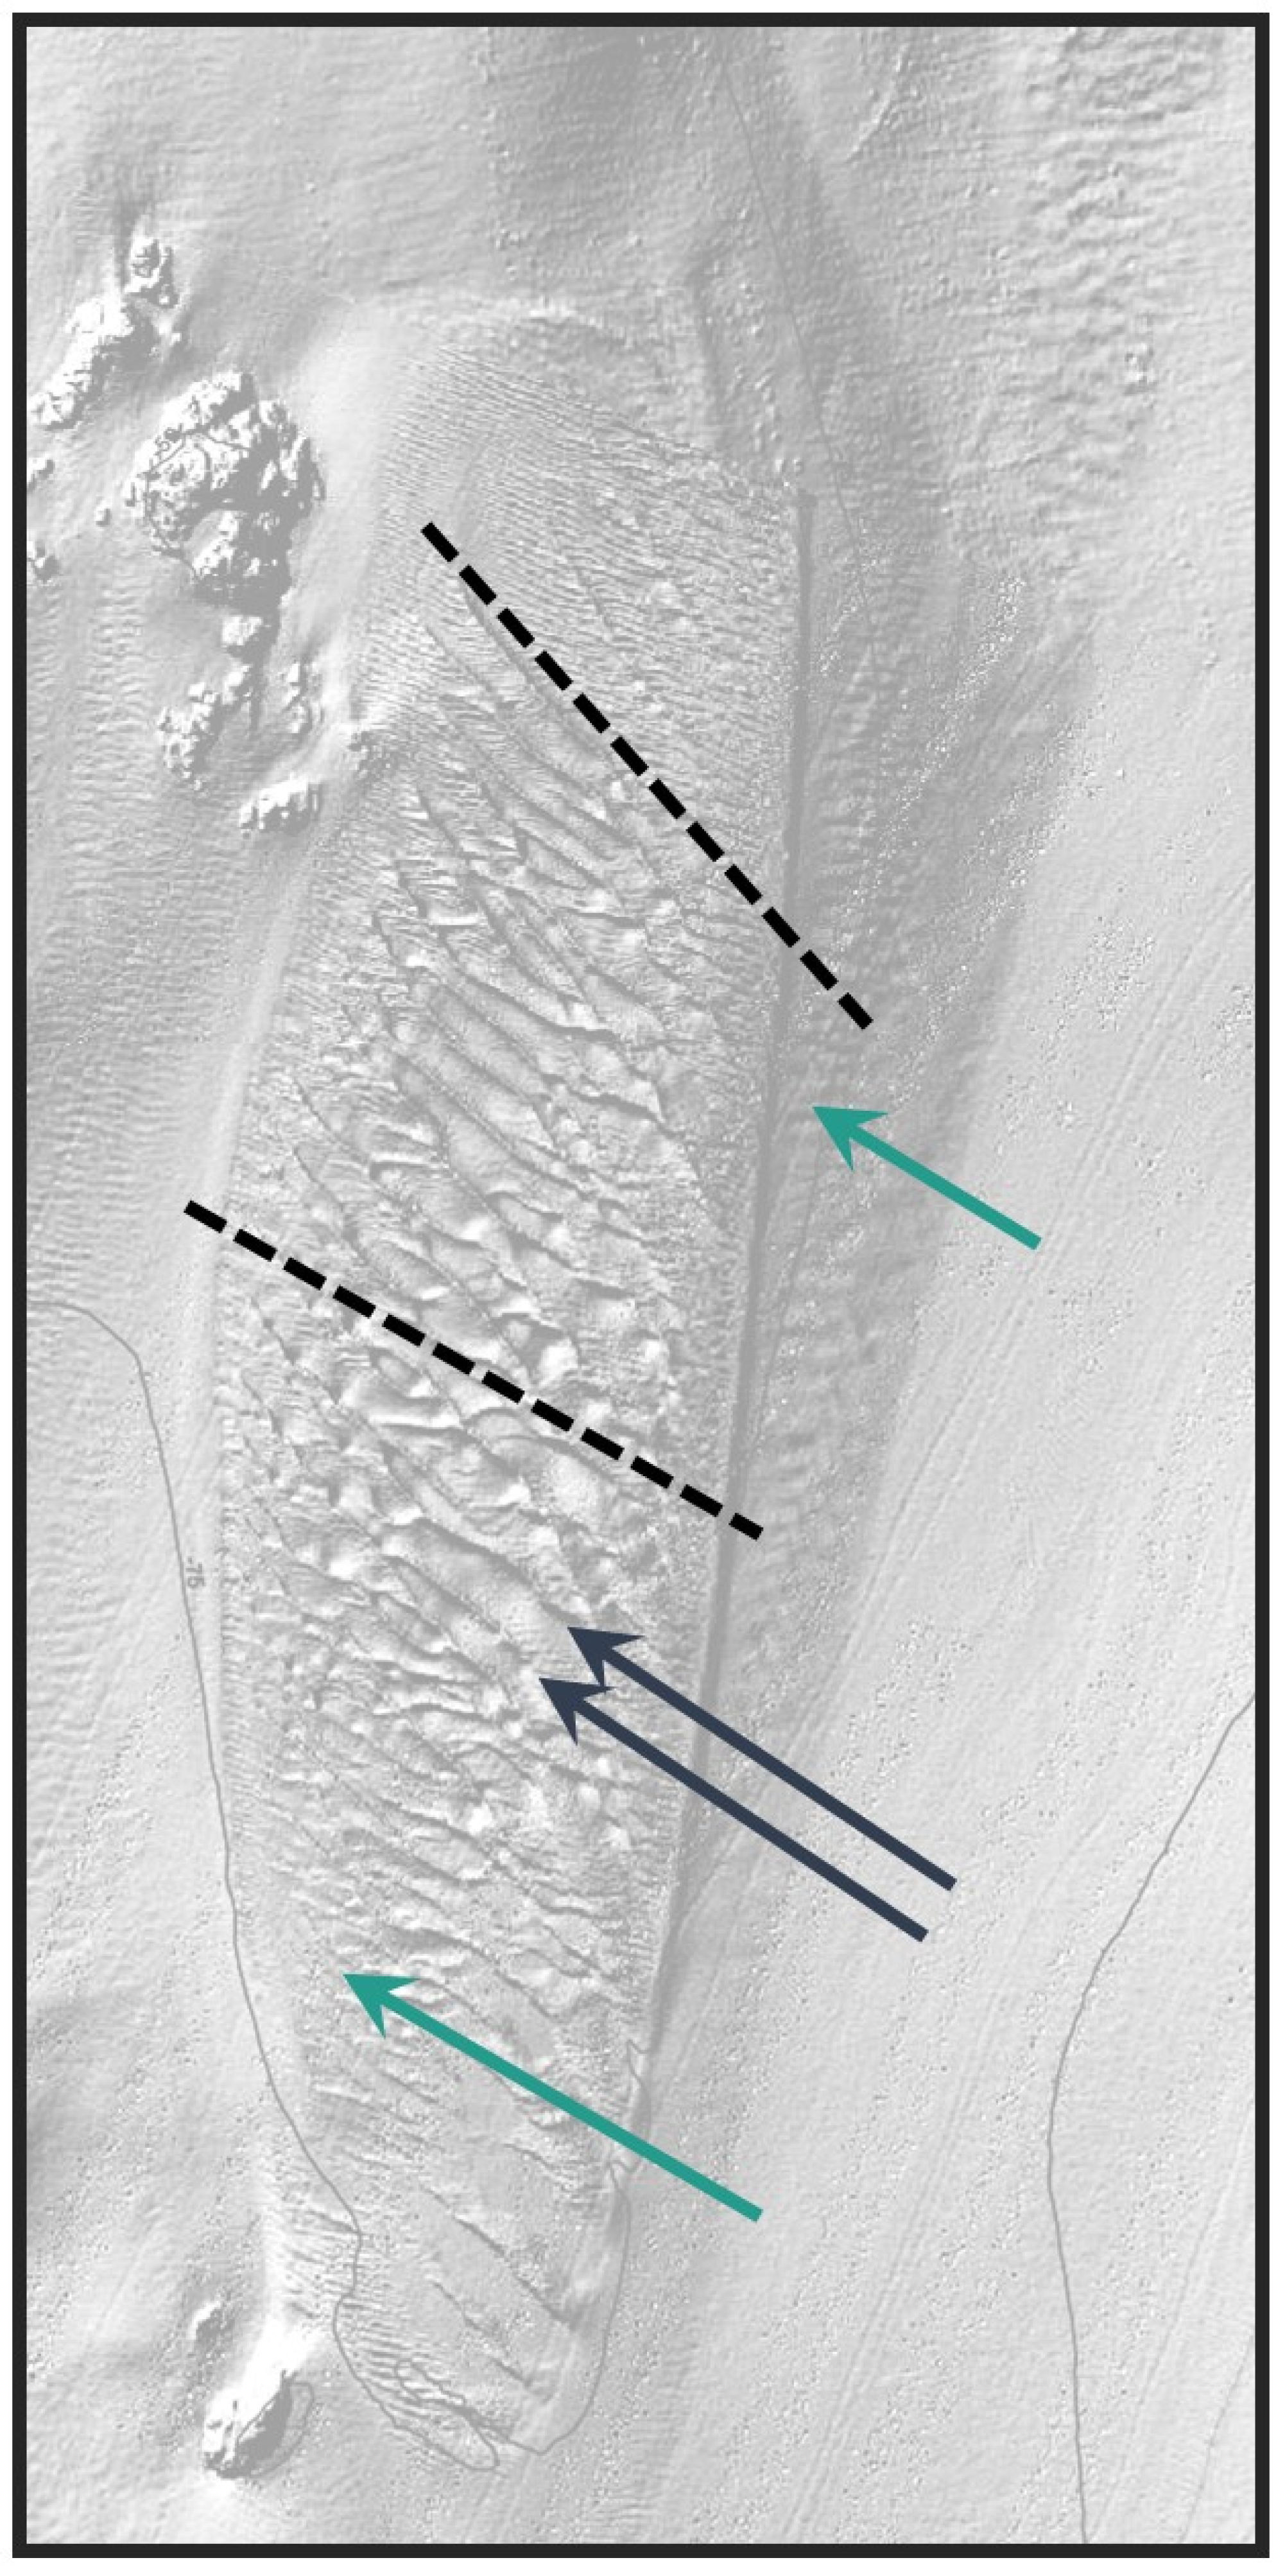
Map layers produced via ArcGIS interpolation and analytics of the MBES data (Figure 5) covered the entire survey area and the immediate area of substrate on all sides. Derived metrics from analyses using ArcGIS provide further insight into bedform morphology. The bathymetric position index (BPI) provided a detailed map of wave height forms throughout the subtidal sediment wave field habitat (Figure 5, panel 1). The BPI represents the difference in elevation between each point and the mean elevation of the surrounding cells, standardized to correct for spatial autocorrelation, and highlights variation in terrain in major features, including variation in height (amplitude) of ridges, wave troughs, and crests. Sand waves are reduced in period and height in the far north of the feature and increase to their greatest extent in the north and center, and then reduce and subside in the southern extent. Smaller megaripples and sand waves (wave heights 0.5–1.5 m; wavelengths 1–50 m) occur along the edges of the sand wave field (Figure 5). This visualization enhances rock outcrops in the northwest quadrant of the map, immediately north of the sand wave field. It also highlights the margins of the features with a distinct ridge or spine running the entire north–south extent of the feature off-center to the right. The slope value represents the steepness of the terrain (rate of change in bathymetry or maximum difference in depth of a cell and its immediate neighbors; Figure 5, panel 2). A pronounced slope is evident on the western margin of the feature and along the internal north–south spine. This north–south ridge represents the sloughed edge of the sand–gravel bank with a relatively steep angle between 25 and 30 degrees. This evident line likely results from the strong currents undercutting the edge of the sand wave field, resulting in mass wasting of the edge due to gravitational forces. The area to the east of the internal spine is flattened, while the area to the west of the internal spine (left) is raised relative to the seafloor. This western section of the wave field contains the pronounced sand waves. The area east of this ridge contains ripples and megaripples and represents a different current regime and material substrate. The aspect value is the angle of the seafloor in degrees relative to north (0°). The north–south aspect value (Figure 5, panel 3) displays the prevalence and attributes of the north–south face of wave formations (lee and stoss) perpendicular to current flow. Large sand waves with heights H = 1 to 4 m and wavelengths L = 20 to 100 m have two distinct crest orientations, reflecting different processes of steering by ebb and flood tidal currents, which reflect the direction of current flow (Figure 6); one set of sand waves oriented about 30 degrees counterclockwise from north appears to have longer crests and longer wavelengths (Figure 6). The east–west aspect value (Figure 5, panel 4) displays the prevalence of eastward-facing aspects and dynamics related to intersecting currents. Most prominent in this display are the bedform edges, including the western edge maintained predominantly via north-to-south flow and the eastern edge maintained predominantly via flood tides (south-to-north flow) on the eastern edge. This orientation highlights small-to-medium-scale sand waves (1 to 2 m wavelengths) between some of the larger waves with E-W crest orientations. The rugosity value (Figure 5, panel 5) denotes the variation in surface area over planar area, identifying additional topography within the bedform habitat and a different perspective, thus enhancing initial interpretations. Metrics for curvature (general, planar, and profile; not shown) were developed to analyze convexity, the intersection perpendicular to the maximum direction of slope, and the curvature along the line of maximum slope (rate of gradient change), but failed to show distinct patterns.

3.5. Sand Wave Composition and Structure

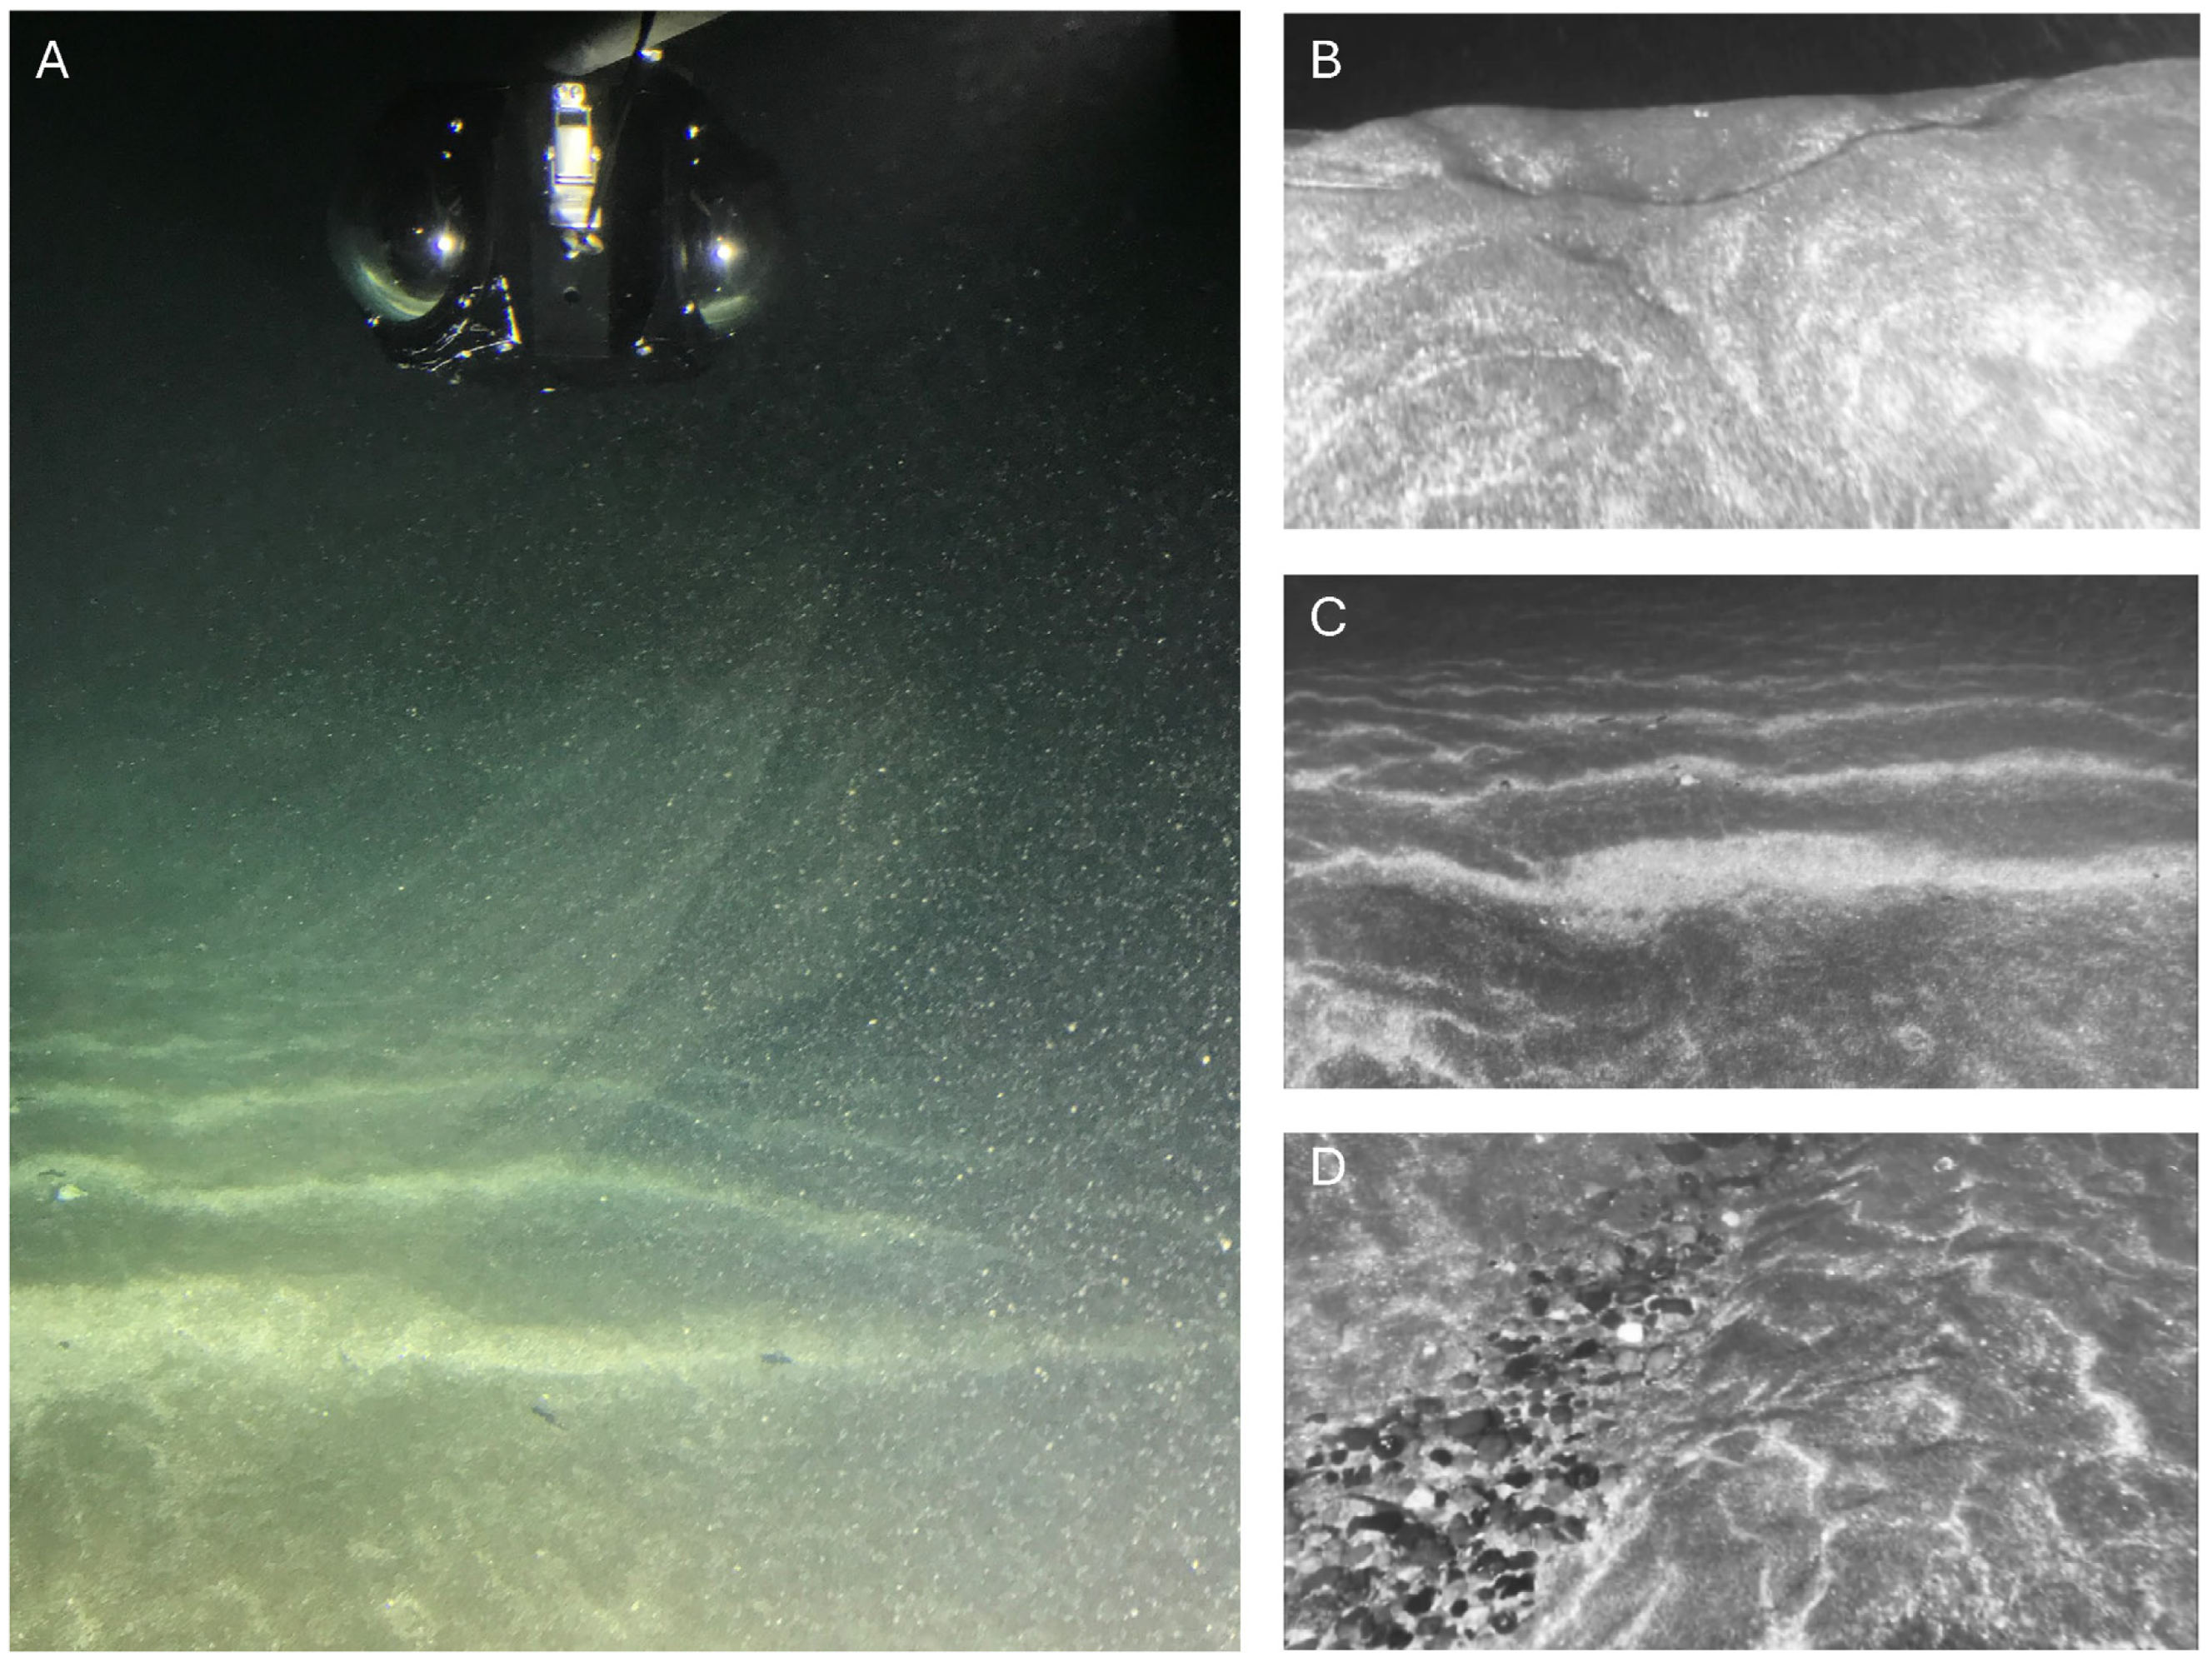
Photographs taken in the submersible dives provide graphic imagery for individual sand waves, including their morphology, orientation, and patterns of sediment distribution (Figure 7). Large sand waves are irregular with distinct patterns in steepness between the lee and stoss sides (Figure 7B). Smaller medium-scale waves and ripples also occur within these larger structures, as demonstrated by patterns in sediment distribution. Extensive amounts of shell hash (carbonate, lighter color shell fragments) highlight the surface of the peaks of waves in contrast against the predominant coarse-grained sand (silicate, darker sediment) present throughout the main body and trough of the waves (Figure 7C). Relic deposits of cobble are present in some locations in troughs (Figure 7D), particularly in the large troughs in the southern extent of the sand wave field. Shell hash also appeared to settle in the troughs, possibly representing modern and transient shell material that, lighter in weight and with a larger surface area, may come to rest in troughs at slack tide and reduced current strength.

3.6. Sediment Composition and Distribution Within the SJC Sand Wave Field

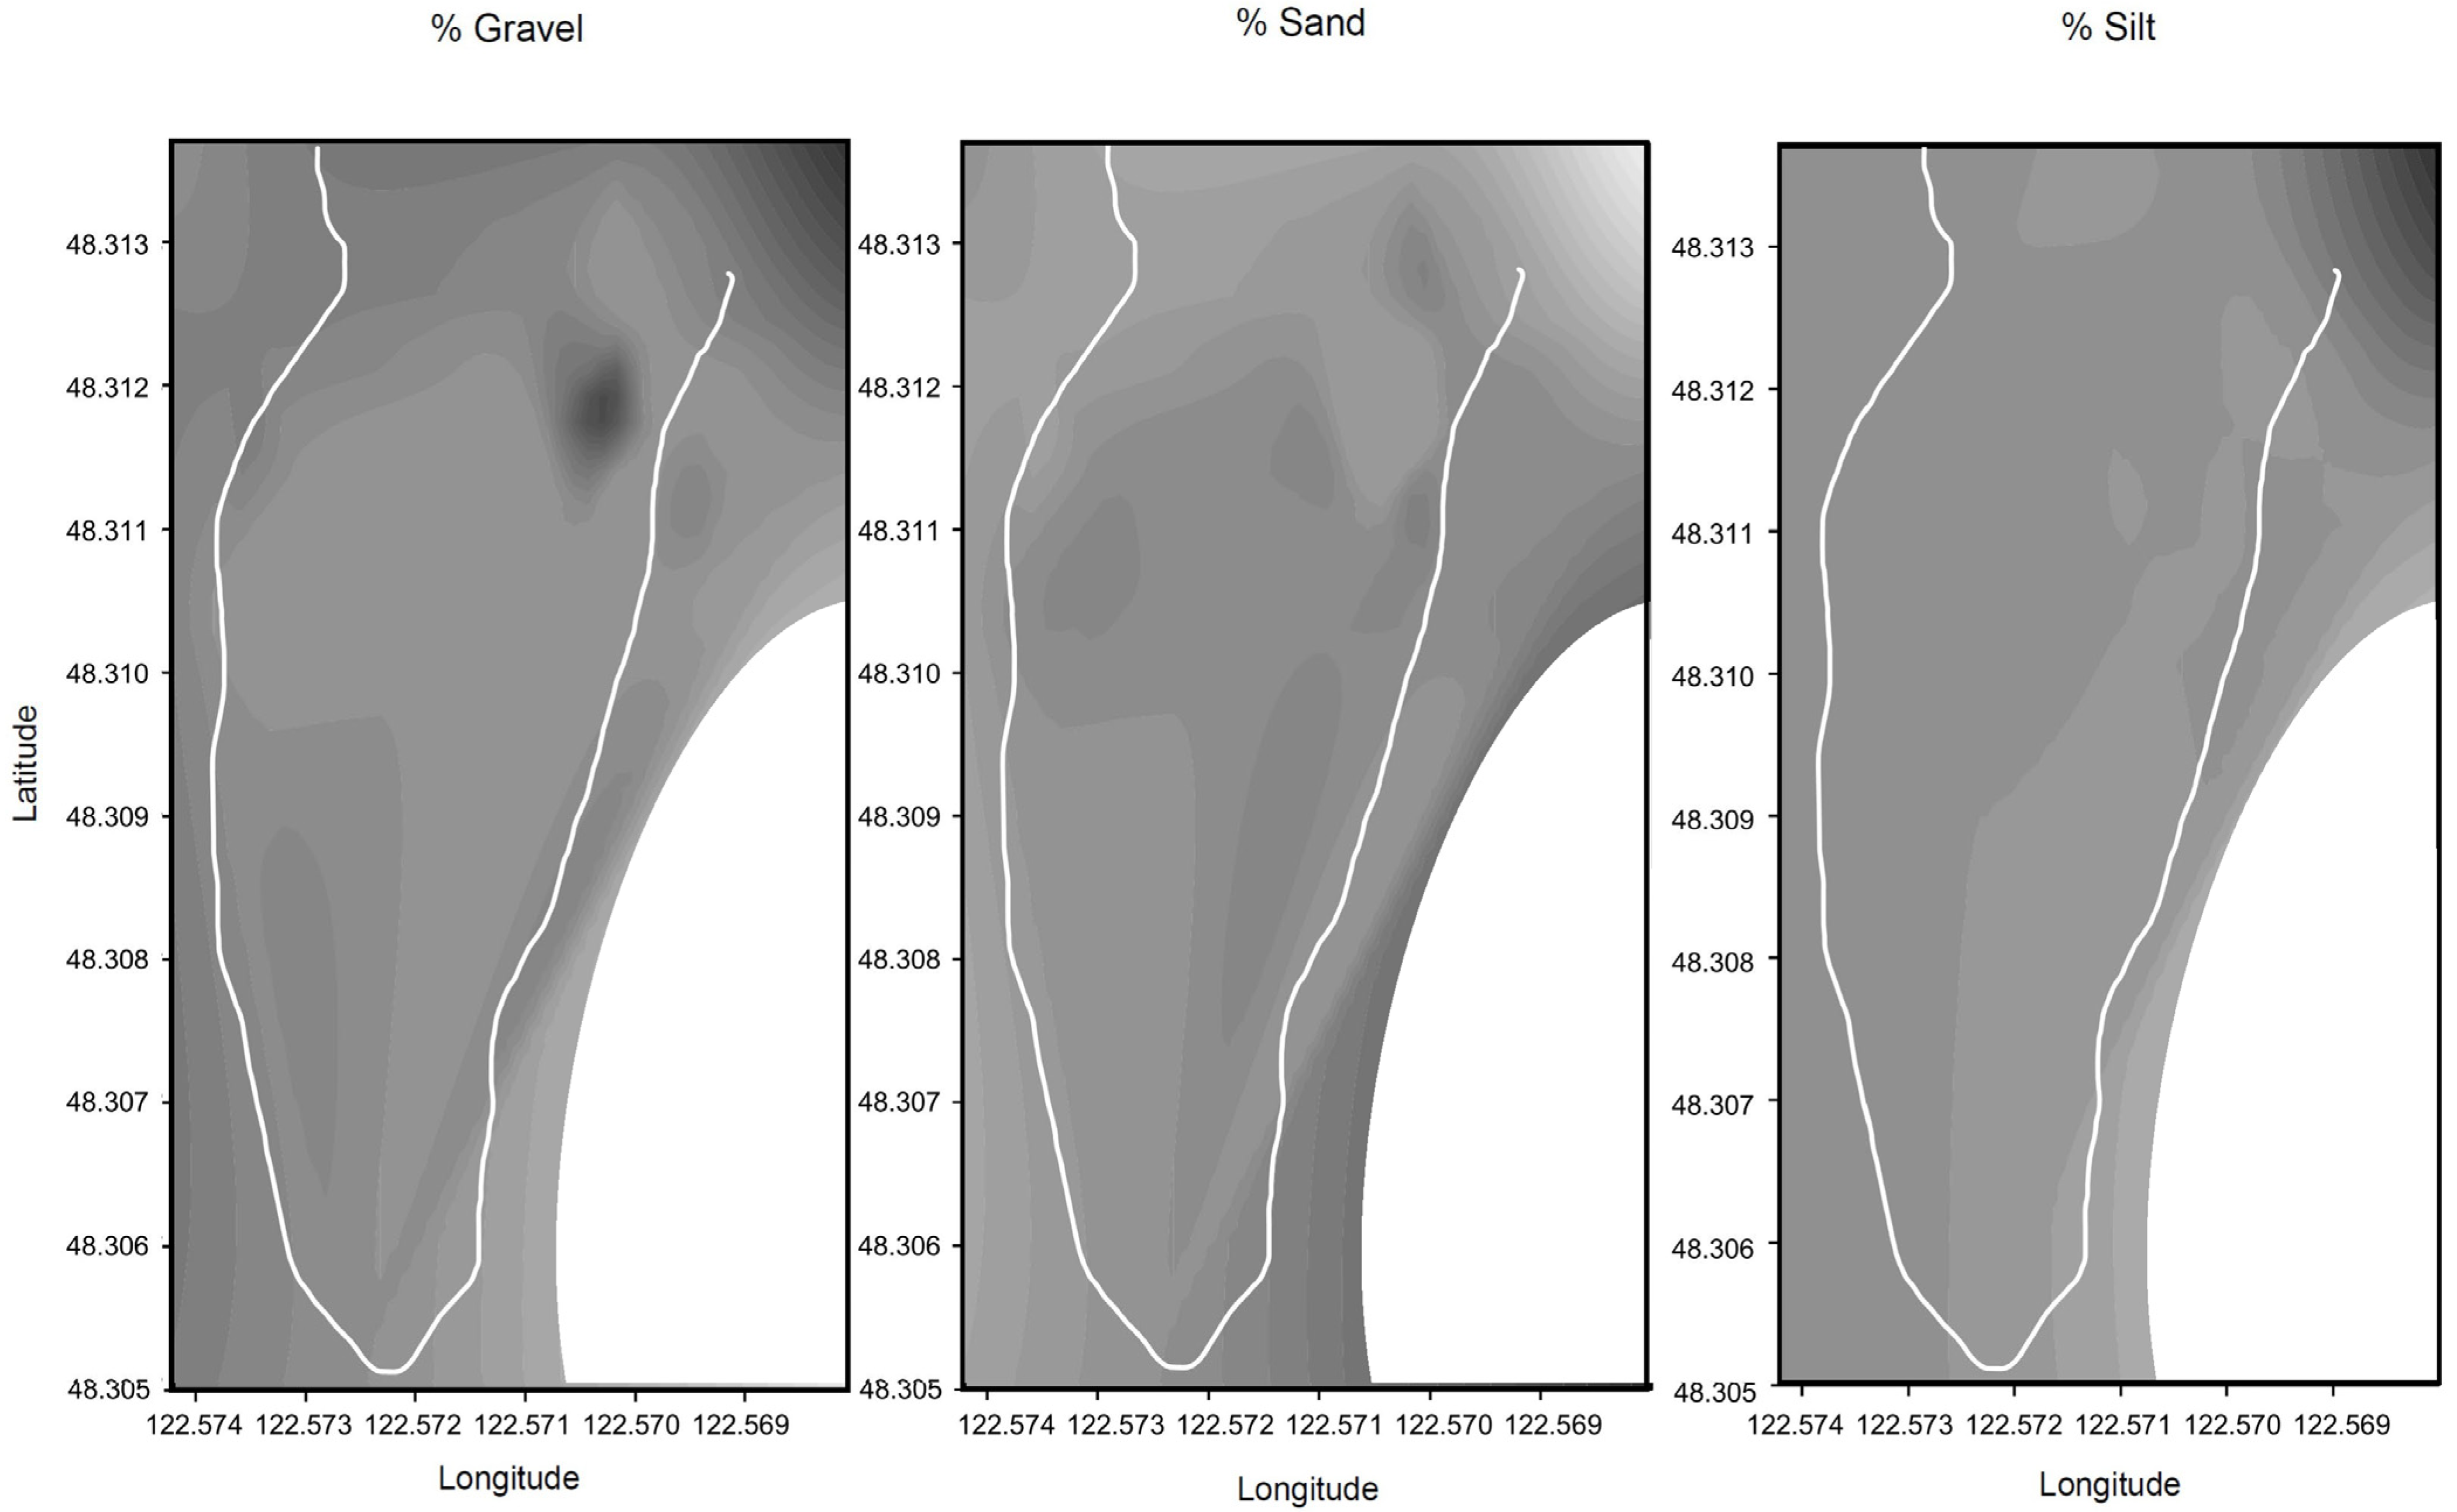
The distribution of sediment within the sand wave field is relatively uniform. The majority (89.29% ± 1.41) of sediment sampled across all sampling occasions in all years within this habitat feature was sand ( φ = 0 to φ = 3), with most of the remainder (10.60% ± 1.40) relatively fine-scale gravel ( φ = −1 to φ = −3). Only a small fraction (0.11% ± 0.02) was silt ( φ > 4). Throughout the sand wave field, the mean grain size was coarse sand with relatively low variance ( φ = 0.28 mm ± 0.03 SD). The overall composition was moderately well-sorted (0.80 ± 0.02), and the distribution of grain size was highly skewed (−0.78 ± 0.03) towards coarser sediment. Patterns in sediment grain size, sorting, skew, and kurtosis were highly consistent across years with no differences across years (Mann–Whitney Rank Sum test), demonstrating a high degree of stability in the composition of this benthic habitat. Interpolated plots (ArcToolBox, Inverse Distance Weighting) of percent sediment type within the wave field revealed that gravel concentrations were greatest in the northern end of the bedform, as well as the southwestern edge and along all margins (Figure 8, panel 1). Sand concentrations are most prevalent within the central portions of the sand wave field and along the eastern edge (Figure 8, Panel 2). In terms of sediment type and origin, smaller grain sizes (medium, fine, and very fine sand) are largely comprised of inorganic silicate material. Coarser grain sizes are predominantly comprised of organic-origin carbonate structures, including fragmented urchin spines and shell hash. Coarse sand is a composite of inorganic sediments and organic structures. Cobble and coarse-grained materials tended to settle in the troughs. Shell fragments tended to concentrate on the crest of wave structures, though that may be a function of observations that occurred in a waning current regime at the end of a tidal flow cycle.

3.7. Bedform Topography and Definition—Bathymetric Structure of the SJC Sand Wave Field

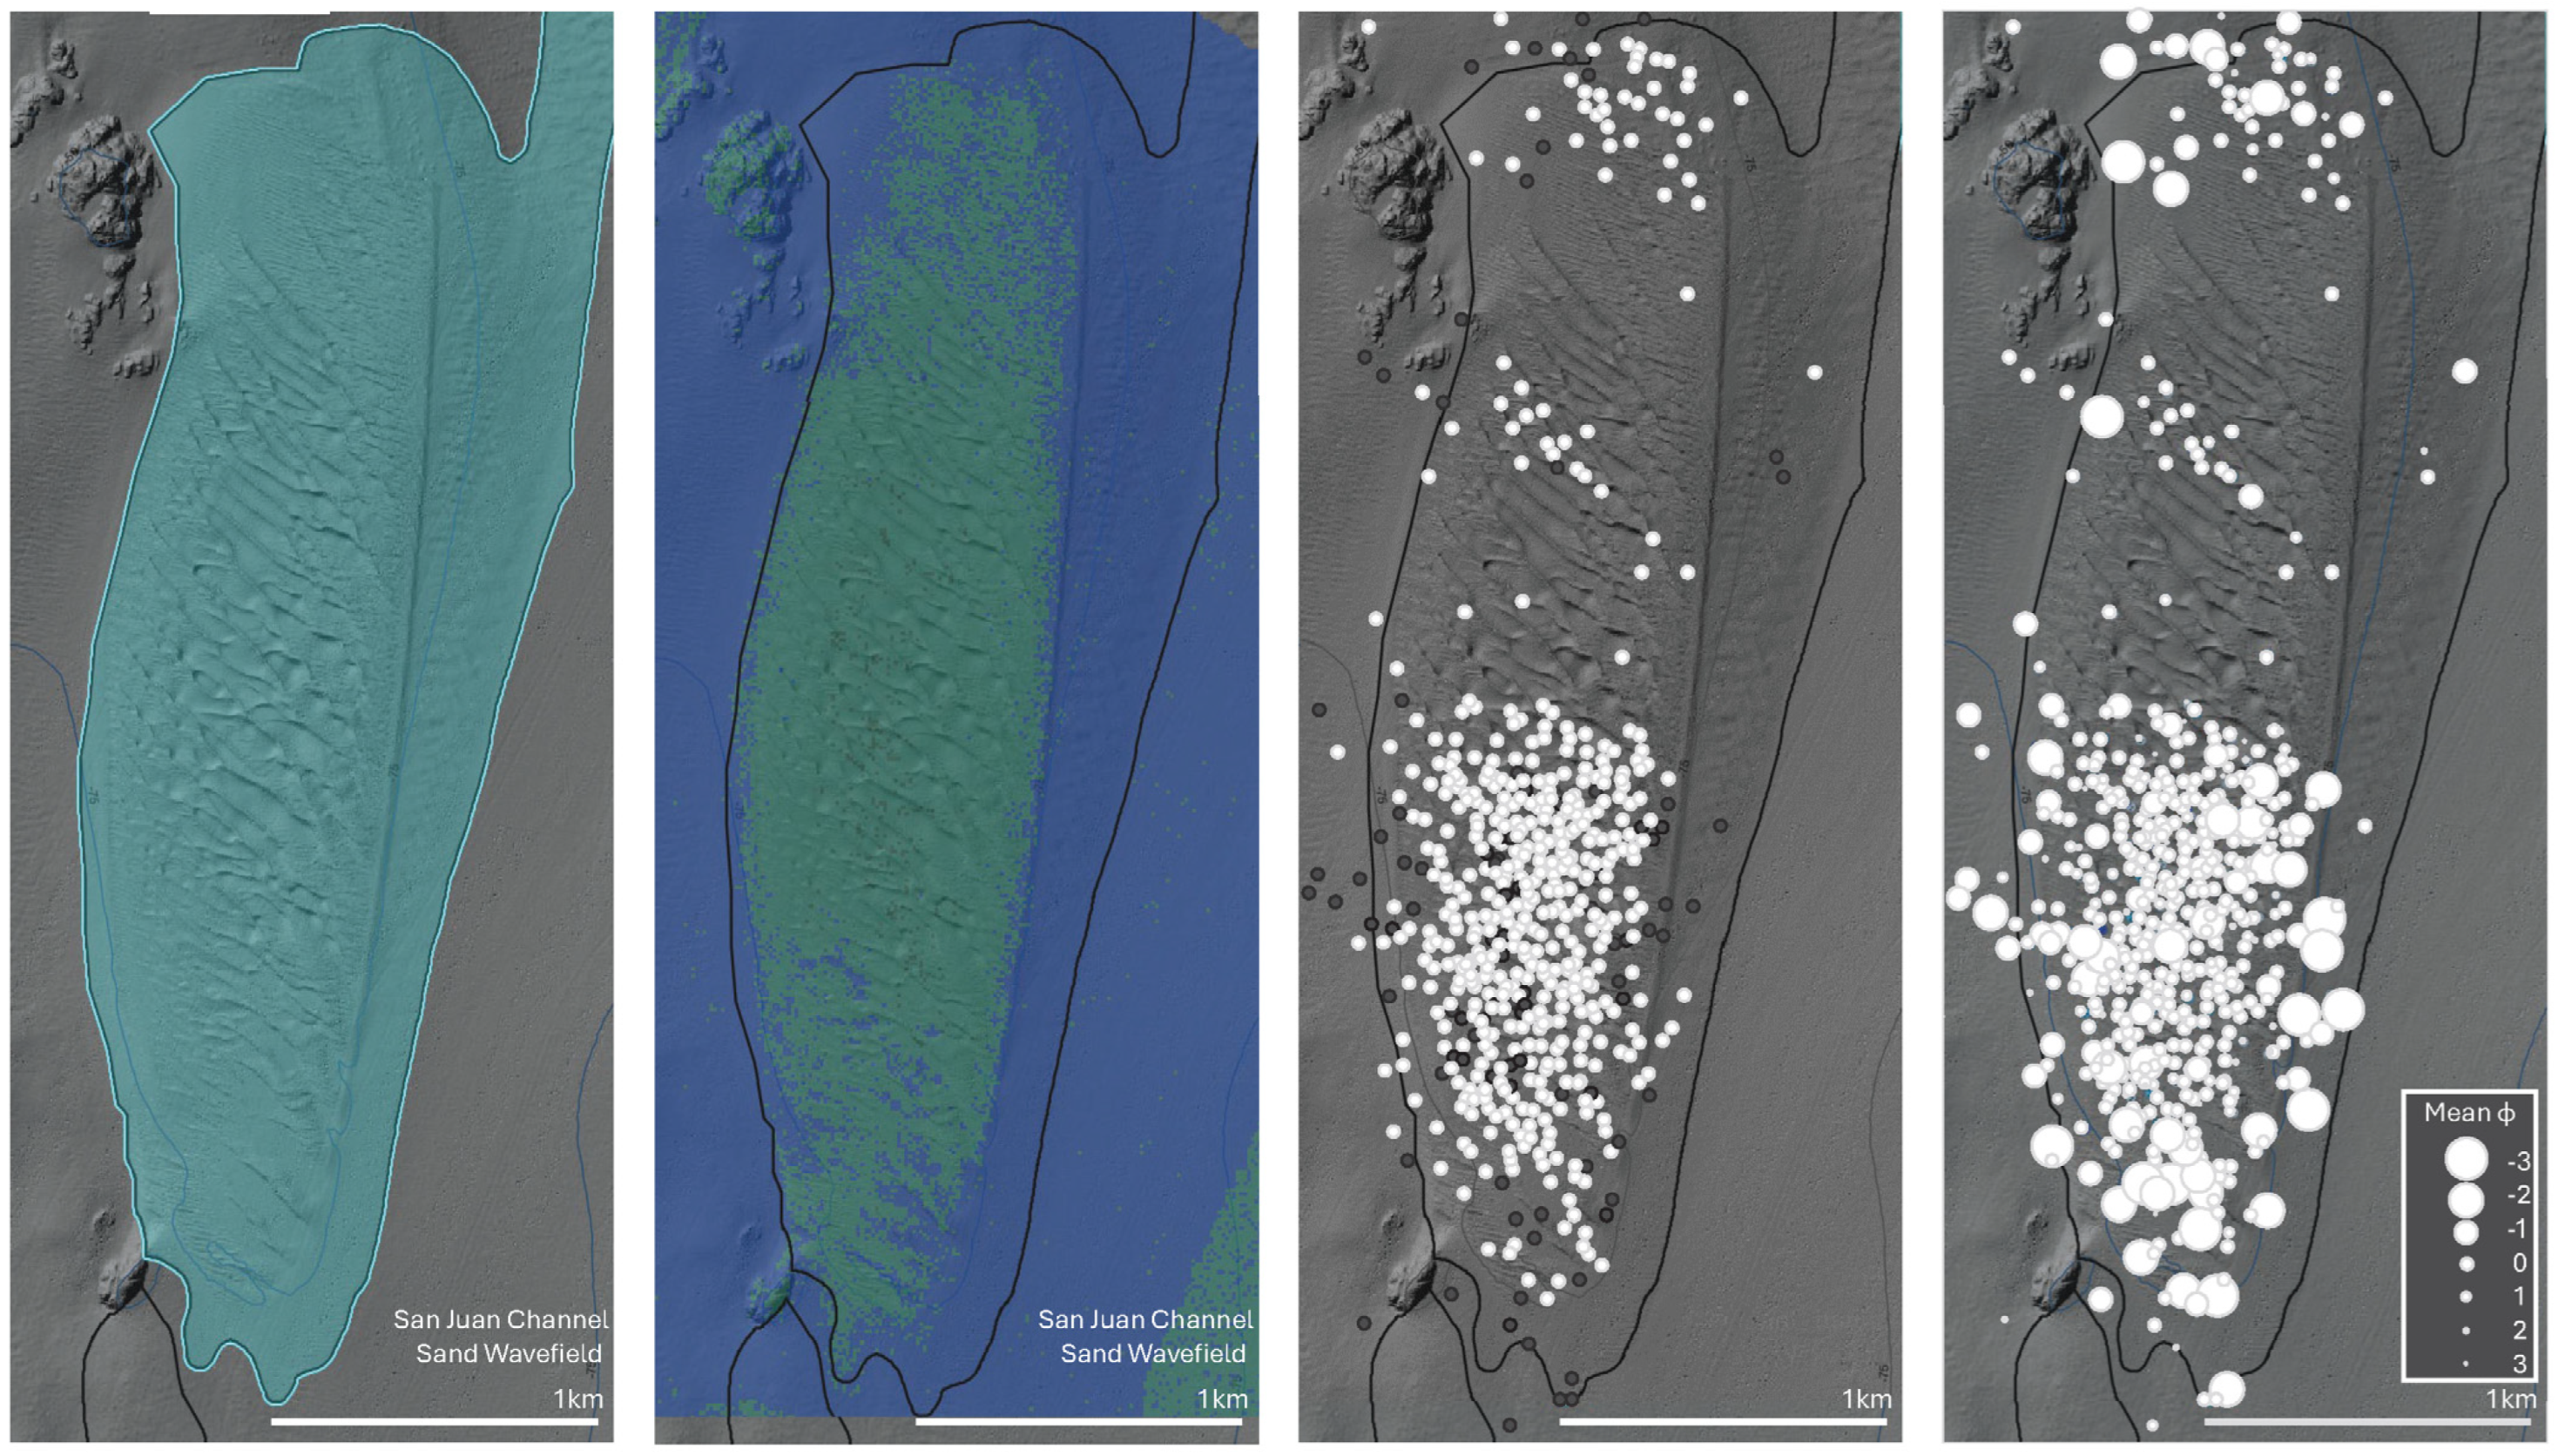
Imagery of MBES data provided insight into the sediment wave formation, shape, topography, and margins of this feature (Figure 9, panel 1). Backscatter images provide further insights into sediment distribution throughout the wave field (Figure 9). Sand was ubiquitous throughout the main part of the subtidal bedform and particularly concentrated in the western portion of the sand wave field immediately west of the spine. This is the area with the most pronounced wave formations. Coarser sediments (gravel/sand) were rare and located primarily in this area, in troughs between large waves. Finer sediments were more prevalent at the margins, in the far north and far south, and in the areas immediately right of the sloughed edge or spine on the eastern margin (Figure 9, panel 2). Mean sediment size ( φ ) sampled in situ via Van Veen grab is shown superimposed on the MBES bathymetry (Figure 9, panel 3). Smaller mean grain size is in the interior of the wave field, while the larger mean grain sizes are generally on the eastern and southern edges of the wave field. The largest mean phi ( φ ) size was just smaller than −3 φ , while the smallest mean phi ( φ ) size was just larger than 1 φ . Coarser sediments and gravel are predominantly on the outer margins of the sand wave field or within prominent troughs, reflecting cobble deposits. Further evidence for these trends is shown in the relative degree of sorting within the wave field (Figure 9, panel 4). Well-sorted sediments are concentrated in the interior of the wave field. Sediment grain size was largely uniform within the main area of the sand wave field, reflecting coarse-grained sand. Poorly sorted sediments are mostly found on the boundary of the wave field. This reflected a mix of gravel and silt evident along the margins and outside the edges of the sand wave field. Poorly sorted sediments were occasionally evident within troughs within the waves of the habitat feature the troughs. This reflected sand on the peak and the stoss and lee sides of the waves and sand with deposits of cobble or gravel within the trough (Figure 9, panel 4).

3.8. Physical Oceanography—Oxygen Levels in the Water Column

Vertical profiles for oxygen (mg L−1) in the water column sampled via CTD casts provide insight into water column attributes at the sand wave field (Figure 10). The water column is well-mixed, as evident by the near-vertical nature of the oxygen profiles. Oxygen concentrations are constant across depth within each cast, highlighting that oxygen availability at depth and at the surface of the SJC wave field (40–80 m) is similar to oxygen availability at the surface of the water (0 m). Oxygen concentration varied as a function of individual cast and ranged from 4.1 to 8.8 mg L−1. Data were aggregated according to season: Spring (March–April), Summer (August–September), and Fall (October–December). Oxygen concentration varied according to season, with the highest values in the Spring (8.5 mg L−1 and the lowest values in the Fall (4.0 mg L−1). All recorded levels of oxygen were above the minimum concentration required for sand lance.

4. Discussion

4.1. Essential Fish Habitat—Sand Wave Fields as Sand Lance Habitat

Pacific sand lance range from California to Alaska in the eastern Pacific and from Russia to Japan in the western Pacific [15,49]. Availability of benthic habitat is critical to these fish, which rely on specific sites for energy conservation [50,51], predator avoidance [52], and reproductive maturation [53]. Use of sediment occurs on diel [54] and seasonal [38] time scales. Distribution of preferred sediments is spatially restricted [55,56].
Sand wave fields consisting of low-silt, well-sorted, coarse-grained sand with low shear strength [16,57] are thought to comprise essential habitat. These types of depositional bedforms [4] occur at the sides of current pathways, often in channels [58]. Sediment waves within these bedforms are formed at flow velocities of 0.5 to 1.0 m s−1 and comprise grain sizes of 0.25–2.0 mm in diameter [50], often as the result of deposition by contour or turbidity currents [59]. Wave size and type (e.g., ripples, dunes, and sand waves) [60] are controlled by sediment grain size, current velocity, and water depth [48,61].

4.2. Attributes of SJC Sand Wave Field Sediments and Bedform Morphology

The SJC sand wave field represents an extensive subtidal habitat for sand lance. Research for more than a decade (2010–2025) has confirmed it to be a critical habitat for these fish [22,35,36,37,38]. The sand wave field in the SJC is influenced by strong currents and tides; this bedform occupies a surface of glacial till and rubble with sand sediments moving in dynamic equilibrium with movement driven by ebb tides (north-to-south flow) on the eastern edge and flood tides (south-to-north flow) on the western margin [17,62,63]. The lack of cross-channel variation in friction produces a uniform velocity profile across the San Juan Channel [62]. The flow structure is vertically homogeneous. The eastern margin is aligned with deeper topography currents with magnitudes of 1.8 m s−1. At maximum flood, currents on the western half of the channel are up to 2.25 m s−1. Ebb and flood tides over the channel had maximum velocities close to the middle of the channel [62]. Sand waves are created when the current speed is > 1 m s−1. In the central sand wave field, the currents are 1–2 m s−1.
The stability of the sand wave field is governed by bottom current strength and velocity and sediment type. There is no significant net flow of sediment. This is due to a constant impact of fluctuating tidal currents, and these underlying processes allow the sand wave field to maintain a relative position [34]. While the bedform and its margins have remained remarkably static across many years with a stable footprint on the seafloor, the interior structure is dynamic in the sense that internal sediment waves migrate back and forth during the tidal shifts (as evaluated across multiple years of MBES surveys) [34]. It appears that the deeper southern section of the sand wave field is in relative stasis, potentially a relic from a time of lower sea level. The stable or standing sediment waves have a symmetrical cross-section and result from aggradation. The variability in sediment wave orientation suggests that different depositional mechanisms are involved in the wave construction. These mechanisms are controlled by parameters such as current velocity, sea floor topography, Coriolis force, and the amount and nature of transported sediment [64]. Results developed in this manuscript, related to trends in sorting and mean phi ( φ ) provide further indication of the conditions under which the sediment was deposited and continues to move. Further research might investigate these flow patterns and determine how flow velocities shift along the interior and edges of these features.
The SJC sand wave field formed where the channel becomes constrained, causing a large amount of water to be transported through a small area, resulting in a higher velocity bottom current. This type of feature is not representative of surrounding seafloor conditions [65]. This suggests these type of habitats should be identified and further studied to determine the extent and permanence of these critical areas, habitat capacity, constraints on capacity, connectivity between these habitats and potential for those isolated habitats to support discrete populations, and potential for disturbance either through direct disturbance of human activities (dredging, fishing impacts) and potential shifts in oceanographic patterns that maintain these geomorphologic features (e.g., shifts in currents, rising sea levels with climate change).

4.3. Physical Oceanographic Dynamics and Oxygen

Oxygen is critical to marine life. Dissolved oxygen is essential to pelagic fish species, and water column concentrations often represent a limiting environmental parameter [66]. In many species, this sets the limits to horizontal and vertical distribution [67], including in forage fishes [68]. Low oxygen or hypoxia (<2 mg L−1, equivalent to <1.4 mL O2 L−1 or <60 μmol O2 L−1; <30% saturation) may impact growth, development, and schooling behavior [69,70]. Meta-analyses on hypoxia tolerance levels in fishes suggest that potential sublethal effects may occur <5.0 mg L−1 [71]. The US EPA [72] suggests lethal effects for marine fish species in estuarine and coastal systems at levels <2.3 mg L−1 and growth effects at 4.8 mg L−1. Still hypoxia tolerance and threshold values are species- and stage-specific and can vary enormously, with some species impacted at 3 mL O2 L−1 (4.29 mg L−1) and other species tolerant of levels as low as 0.1 mL O2 L−1 (0.14 mg L−1) [73]. Critical values for vertical distribution in select forage species (Sardinops sagax, Engraulis capensis, and Clupea harengus) have been estimated at 2.5–3 mL O2 L−1 (3.58–4.29 mg L−1) [70], though sprat and sardine have been shown to be tolerant to a level of 2.4 mL O2 L−1 (3.43 mg L−1) and herring have been found in waters as low as 1–2 mL L−1 (1.43–2.86 mg L−1) [74]. Sand lance and sand eel (Ammodytes spp.) are generally more tolerant of low oxygen concentration. In experimental studies, Behrens and Steffensen [75] documented that sand eels were oxygen independent across a wide range of ambient oxygen levels and do not show an evasive response when exposed to acute, progressive hypoxia. The ability to regulate oxygen uptake at low ambient oxygen levels is likely a prerequisite for the burrowing lifestyle. Sand lance possess the capacity to lower their metabolism, and hence oxygen dependency, though prolonged moderate (60% oxygen saturation) and severe hypoxia (35% oxygen saturation) will influence burial patterns [76,77]. Oxygen concentrations at the San Juan Channel sand wave field ranged from 4.1 to 8.8 mg L−1 across seasons, and the water column profiles remained at near constant levels from surface to 60–80 m depth. Therefore, it is presumed that the oxygen concentrations present, which are well above hypoxia, at the San Juan Channel sand wave field do not fall below tolerance thresholds for these fish in any season.
This important finding provides new and important insights into the potential for deep-water habitat for these fishes. Oxygen minimum zones are often associated with upwelling systems, including the eastern Pacific [78]. Some of the regions most vulnerable to hypoxia are estuaries, coastal areas, and enclosed or semi-enclosed seas where water exchange is limited [79]. Our area of study is a semi-enclosed sea in an upwelling region within the eastern Pacific; however, conditions such as bathymetric constrictions and strong tidal exchange at this particular site facilitate high water exchange and mixing, promoting high oxygen concentrations throughout the water column. Elsewhere, in deep waters, high densities of buried sand eel are also observed in sandbanks characterized by benthic waveform structures and strong bottom currents [50]. In these areas, interactions between flow velocity gradients and bathymetric relief may enhance advective water exchange and increase sediment oxygenation [80,81]. The lack of silt and small-grained sediment may allow for increased interstitial oxygen [50].

4.4. Limitations

Certain limitations and qualifications related to these findings should be noted. (1) Sediment samples were predominantly collected in the southern portion of the sand wave field due to prohibited sampling near cable crossings, limiting representation of the entire habitat. (2) Grain size analyses and discussion are based on mechanical sieve analysis and approaches applicable to the silicate materials that comprise the majority of sediments at this site, but do not encompass the complex hydrodynamic processes relevant to the surface sediments that consist of disks of biogenic material (i.e., shell hash) with different settling and transport velocities. (3) This study focuses on fall sampling for sediments and lacks year-round data on sediment dynamics and/or sand lance behavior, thus missing seasonal variations. (4) The CTD casts, while informative, are limited in number (52 casts) and may not fully capture the spatial and temporal variability in oxygen concentrations and water column mixing. Further research might explore direct links between specific bedform attributes (e.g., wave height and period, sediment type) and physical drivers within the context of the oceanographic processes in the system (e.g., tidal and current flow rates and vectors, micro-scale eddies).

4.5. Implications for Research Results and Avenues for Future Exploration

The overall distribution, spatial extent, and relative quality of suitable sand lance subtidal habitat remain largely unknown along the coast of Pacific coast of North America. Further insight into what defines quality habitat may lead to a better understanding of stock dynamics and habitat extent. The site investigated here exceeds the maximum depth allowed by regional habitat models developed for this species (80 m) [82] and greatly exceeds previous assumptions about the maximum depth for this species (40 m in the Gulf of Alaska [83]; 60 m in the Sea of Okhotsk [55]; and 50 m in Japan [84]), some of which made the often false assumption that deeper areas are characterized by reduced water movement [50]. Robinson et al. [82] suggested that while acoustic backscatter data shows several suitable sand patches for burying within the region, those below 80 m were considered nonviable. We consistently find sand lance at these depths at this site. While the relative stasis in bedforms at depths of 80 m suggests these deep sediment waves may be relics from a time of lower sea level [34], the water column remains well oxygenated at all depths. Our investigations and results suggest that habitat models should consider much deeper habitats given the appropriate oceanographic conditions [17]. The bathymetric profile in the San Juan Islands—deep straits and channels carved out by glaciers—along with the relatively large tidal exchange moving water throughout the region, is common throughout the heavily glaciated coastline from the Salish Sea to the Aleutian Islands. The prevalence of high-quality sand wave fields in this region [17] suggests similar habitats may be common.

5. Conclusions

Our research is intended to inform fisheries and benthic surveys and provide insight into methods and techniques to sample and assess stocks [85,86]. It may also refine and improve habitat selection models and improve the detection of critical habitat for sand lance [82,83]. This research may also help efforts to identify and evaluate emergent threats to these fish [87] related to pollution [88], anthropological disturbance [89], and fishing effects [90]. This research also provides insight into the processes responsible for the persistence and maintenance of such dynamic bedform habitats. Sand wave fields, while relatively stable, may shift or erode with changes in sea level rise and patterns in tidal exchange [34]. Shoreline development may also alter circulation dynamics.
This research builds on past efforts to identify critical habitat using in situ sampling and hydroacoustic approaches [91,92]. Predictive geomorphic models that incorporate this information have the potential to inform management and to identify these geomorphic features beyond the Salish Sea. Although the San Juan Channel is well studied, a more in-depth and longer time scale analysis will provide additional information on population fluctuations over time, in addition to correlating possible links between fish body size and preferred sediment size, and body size and burial depth. The information gained from the present study in comparison with previous studies might be used to identify habitats in less studied regions [93,94] and might further inform sustainable harvest in regions where commercial fisheries operate.

Author Contributions

M.R.B.: Conceptualization, Methodology, Data, Investigation, Analysis, Writing, Visualization, Resources, Supervision; H.G.G.: Conceptualization, Analysis; J.A.: Visualization; M.H.: Investigation, Analysis, Visualization; E.A.: Investigation; S.C.: Investigation; J.L.: Data; J.A.N.: Data, Resources. All authors have read and agreed to the published version of the manuscript.

Funding

This research received no external funding.

Institutional Review Board Statement

Animal Care protocols 4238-03 and 4485-01 were approved by the University of Washington Office of Animal Welfare and research was conducted in compliance with Institutional Animal Care and Use Committee (IACUC) standards.

Data Availability Statement

Data will be provided on request by the corresponding author.

Acknowledgments

We greatly appreciate the efforts of the editorial staff of the Journal of Marine Science and Engineering and the recommendations of two anonymous reviewers. This manuscript was significantly informed and improved by discussions with Parker MacCready. We particularly thank Dennis Willows, Wolf Kruger, Meegan Corcoran, Jacob Bueche, Eric Loss, Megan Dethier, David Duggins, Kristy Kull, Anna Boyar, W. Breck Tyler, Rebecca Guenther, Mike Sigler, and the Research Apprentices of the Pelagic Ecosystem Function Apprenticeship for their effort in data collection. We also thank the administration, staff, and faculty of the University of Washington, Friday Harbor Laboratories and School of Aquatic and Fishery Sciences, for supporting this research.

Conflicts of Interest

The authors declare no conflict of interest.

Appendix A

Figure A1. Wentworth scale of sediment grain size and GRADISTAT terminology associated with specific phi and sediment grain size diameter measurements.
Jmse 13 01469 g0a1
Figure A2. Sediment grain size categories (φ) according to the Wentworth and GRADISTAT scale. Sediments were collected at the San Juan Channel sand wave field and subsequently dried and separated using a Ro-Tap sieve shaker.
Jmse 13 01469 g0a2

References

  1. Allen, J.R.L. The Nature and Origin of Bedform Hierarchies. Sedimentology 1968, 10, 161–182. [Google Scholar] [CrossRef]
  2. Wynn, R.B.; Stow, D.A.V. Classification and Characterisation of Deep-Water Sediment Waves. Mar. Geol. 2002, 192, 7–22. [Google Scholar] [CrossRef]
  3. USGS Thesaurus. United States Geological Survey. Coastal and Marine Ecological Classification. 2025. Available online: https://apps.usgs.gov/thesaurus/ (accessed on 1 May 2025).
  4. Rodrigues, S.; Hernandez-Molina, F.J.; Fonnesu, M.; Miramontes, E.; Rebesco, M.; Campbell, D.C. A New Classification System for Mixed (Turbidite–Contourite) Depositional Systems: Examples, Conceptual Models and Diagnostic Criteria for Modern and Ancient Records. Earth-Sci. Rev. 2022, 230, 104030. [Google Scholar] [CrossRef]
  5. Rosenberg, A.; Bigford, T.E.; Leathery, S.; Hill, R.L.; Bickers, K. Ecosystem Approaches to Fishery Management through Essential Fish Habitat. Bull. Mar. Sci. 2000, 66, 535–542. [Google Scholar]
  6. Levin, P.S.; Stunz, G.W. Habitat Triage for Exploited Fishes: Can We Identify Essential “Essential Fish Habitat”? Estuar. Coast. Shelf Sci. 2005, 64, 70–78. [Google Scholar] [CrossRef]
  7. Quinn, T.J.; Armstrong, J.L.; Baker, M.R.; Heifetz, J.; Witherell, D. Assessing and Managing Data-Limited Fish Stocks. In Lowell Wakefield Fisheries Symposium; Alaska Sea Grant Publication: Anchorage, AK, USA, 2016; Available online: https://seagrant.uaf.edu/bookstore/pubs/AK-SG-16-01.html (accessed on 1 March 2025).
  8. Baker, M.R.; Siddon, E. Fishes and Invertebrates. In Marine Ecosystems of the North Pacific Ocean 2009–2016: Synthesis Report; Chandler, P.C., Yoo, S., Eds.; PICES Special Publication 7, North Pacific Marine Science Organization: Victoria, BC, Canada, 2021; pp. 46–61. ISBN 978-1-927797-42-6. Available online: https://meetings.pices.int/publications/special-publications/NPESR/2021/PICES_SP7_NPESR3_2021_SM_FNL.pdf (accessed on 1 March 2025).
  9. Peck, M.A.; Catalán, I.A.; Rykaczewski, R.R.; Takasuka, A.; Garrido, S.; Asch, R.G.; Baker, M.R.; Bowlin, N.M.; Boldt, J.; Brodeur, R.D.; et al. Advancing Ecological Understanding and Sustainable Management of Small Pelagic Fish. Fish Fish. 2025; in press. [Google Scholar]
  10. Catalan, I.A.; Bowlin, N.; Baker, M.R.; Berg, F.; Bertrand, A.; Brazier, A.; Brochier, T.; Del Favero, J.M.; Garrido, S.; Gherardi, D.F.M. Worldwide Appraisal of Knowledge Gaps in the Space Usage of Small Pelagic Fish—Highlights across Stock Uncertainties and Research Priorities. Rev. Fish. Sci. Aquacult. 2025, 1–62. [Google Scholar] [CrossRef]
  11. Kaplan, I.; Hazen, E.L.; Wildermuth, R.; Koenigstein, S.; Hill-Cruz, M.; Pierre-Yves, H.; Muhling, B. The Devil’s in the Details of Using Species Distribution Models to Inform Multispecies and Ecosystem Models. Rev. Fish Biol. Fish. 2025; in press. [Google Scholar]
  12. Gunther, K.; Baker, M.R.; Aydin, K. Using Predator Diets to Infer Forage Fish Distribution and Assess Responses to Climate Variability in the Eastern Bering Sea. Mar. Ecol. Prog. Ser. 2024, 741, 71–99. [Google Scholar] [CrossRef]
  13. Rovellini, A.; Punt, A.E.; Bryan, M.D.; Kaplan, I.C.; Dorn, M.W.; Aydin, K.; Fulton, E.A.; Alglave, B.; Baker, M.R.; Carroll, G.; et al. Linking Climate Stressors to Ecological Processes in Ecosystem Models—A Case Study from the Gulf of Alaska. ICES J. Mar. Sci. 2024, 82, fsae002. [Google Scholar] [CrossRef]
  14. Auster, P.J.; Stewart, L.L. Species Profiles: Life Histories and Environmental Requirements of Coastal Fishes and Invertebrates (North Atlantic): Sand Lance. Ammodytes spp.; Connecticut University: Groton, MA, USA, 1986. [Google Scholar]
  15. Robards, M.D.; Anthony, J.A.; Rose, G.A.; Piatt, J.F. Changes in Proximate Composition and Somatic Energy Content for Pacific Sand Lance (Ammodytes hexapterus) from Kachemak Bay, Alaska Relative to Maturity and Season. J. Exp. Mar. Biol. Ecol. 1999, 242, 245–258. [Google Scholar] [CrossRef]
  16. Bizzarro, J.J.; Peterson, A.N.; Blaine, J.M.; Balaban, J.P.; Greene, H.G.; Summers, A.P. Burrowing Behavior, Habitat, and Functional Morphology of the Pacific Sand Lance (Ammodytes personatus). Fish. Bull. 2016, 114, 445–460. [Google Scholar] [CrossRef]
  17. Baker, M.R.; Greene, H.G.; Aschoff, J.; Aitoro Bates, E.; Hesselroth, D.; Johnson, K.; Mather, B.; Sealover, N. Atlas of Benthic Habitat for Sand Lance—Application of Multibeam Acoustics and Directed Sampling to Identify Viable Subtidal Substrates. Mar. Environ. Res. 2024, 202, 106778. [Google Scholar] [CrossRef] [PubMed]
  18. Haynes, T.B.; Robinson, C.K.; Dearden, P. Modelling Nearshore Intertidal Habitat Use of Young-Of-The-Year Pacific Sand Lance (Ammodytes hexapterus) in Barkley Sound, British Columbia, Canada. Environ. Biol. Fish. 2008, 83, 473–484. [Google Scholar] [CrossRef]
  19. Barrie, J.V.; Conway, K.W.; Picard, K.; Greene, H.G. Large-Scale Sedimentary Bedforms and Sediment Dynamics on a Glaciated Tectonic Continental Shelf: Examples from the Pacific Margin of Canada. Cont. Shelf Res. 2009, 29, 796–806. [Google Scholar] [CrossRef]
  20. Aschoff, J.; Greene, H.G.; Baker, M.R. Pacific Sand Lance in the Central Salish Sea: StoryMap. ArcGIS StoryMaps. 2020. Available online: https://storymaps.arcgis.com/stories/9bac8e095b014cee98877e86393d5537 (accessed on 1 March 2025).
  21. Greene, H.G.; Aschoff, J. Oil Spill Assessment Maps of the Central Salish Sea–Marine Seafloor & Coastal Habitats of Concern–A Tool for Oil Spill Mitigation within the San Juan Archipelago, Washington State, USA. Cont. Shelf Res. 2023, 253, 104880. [Google Scholar]
  22. Baker, M.R.; Williams, K.; Greene, H.G.; Aschoff, J.; Greufe, C.; Lopes, H.; Towler, R. Use of Manned Submersible and Autonomous Stereo-Camera Array to Assess Forage Fish and Associated Subtidal Habitat. Fish. Res. 2021, 243, 106067. [Google Scholar] [CrossRef]
  23. Goff, J.A.; Mayer, L.A.; Traykovski, P.; Buynevich, I.; Wilkens, R.; Raymond, R.; Glang, G.; Evans, R.L.; Olson, H.; Jenkins, C. Detailed Investigation of Sorted Bedforms, or Rippled Scour Depressions, within the Martha’s Vineyard Coastal Observatory, Massachusetts. Cont. Shelf Res. 2005, 25, 461–484. [Google Scholar] [CrossRef]
  24. Holland, K.T.; Elmore, P.A. A Review of Heterogeneous Sediments in Coastal Environments. Earth-Sci. Rev. 2008, 89, 116–134. [Google Scholar] [CrossRef]
  25. Auster, P.J.; Malatesta, R.J.; Langton, R.W.; Watting, L.; Valentine, P.C.; Donaldson, C.L.S.; Langton, E.W.; Shepard, A.N.; Babb, W.G. The Impacts of Mobile Fishing Gear on Seafloor Habitats in the Gulf of Maine (Northwest Atlantic): Implications for Conservation of Fish Populations. Rev. Fish. Sci. 1996, 4, 185–202. [Google Scholar] [CrossRef]
  26. Snelgrove, V.R. Getting to the Bottom of Marine Biodiversity: Sedimentary Habitats. BioScience 1999, 49, 129–138. [Google Scholar] [CrossRef]
  27. Gerstner, C.L.; Webb, P.W. The Station-Holding Performance of the Plaice Pleuronectes platessa on Artificial Substratum Ripples. Can. J. Zool. 1998, 76, 260–268. [Google Scholar] [CrossRef]
  28. Stoner, A.W.; Titgen, R.H. Biological Structures and Bottom Type Influence Habitat Choices Made by Alaska Flatfishes. J. Exp. Mar. Biol. Ecol. 2003, 292, 43–59. [Google Scholar] [CrossRef]
  29. Baker, M.R.; Palsson, W.; Zimmermann, M.; Rooper, C.N. Model of Trawlable Area Using Benthic Terrain and Oceanographic Variables—Informing Survey Bias and Benthic Habitat in the Gulf of Alaska. Fish. Oceanogr. 2019, 28, 629–657. [Google Scholar] [CrossRef]
  30. Valavanis, V.D.; Pierce, G.J.; Zuur, A.F.; Palialexis, A.; Saveliev, A.; Katara, I.; Wang, J. Modelling of Essential Fish Habitat Based on Remote Sensing, Spatial Analysis and GIS. In Essential Fish Habitat Mapping in the Mediterranean; Springer: Cham, Switzerland, 2008; pp. 5–20. ISBN 978-1-4020-9140-7. [Google Scholar]
  31. Baker, M.R.; Hollowed, A.B. Delineating Ecological Regions in Marine Systems: Integrating Physical Structure and Community Composition to Inform Spatial Management in the Eastern Bering Sea. Deep Sea Res. II 2014, 109, 215–240. [Google Scholar] [CrossRef]
  32. Cox, A.; Sigler, M.; Baker, M.R.; Hendrix, N.; Tyler, B. Physical Oceanographic Conditions Drive Patterns in Seasonal Core Habitat among Marine Top Predators in the San Juan Archipelago. Mar. Ecol. Prog. Ser. 2025. [Google Scholar] [CrossRef]
  33. Moran, N.P.; Henriksen, O.; Lundberg, P.; Baker, M.R.; Brodin, T.; van Deurs, M. A Systematic Review of the Ecological Roles, Functions and Services Provided for Fish by North Sea Sand- and Gravel-Bank Ecosystems. 2025. Available online: https://osf.io/7c9sb (accessed on 1 March 2025).
  34. Greene, H.G.; Cacchione, D.A.; Hampton, M.A. Characteristics and Dynamics of a Large Sub-Tidal Sand Wave Field—Habitat for Pacific Sand Lance (Ammodytes personatus), Salish Sea, Washington, USA. Geosciences 2017, 7, 107. [Google Scholar] [CrossRef]
  35. Greene, H.G.; Baker, M.; Aschoff, J. A Dynamic Bedforms Habitat for the Forage Fish Pacific Sand Lance, San Juan Islands, WA, USA. In Seafloor Geomorphology as Benthic Habitat, 2nd ed.; Harris, P.T., Baker, E.K., Eds.; Elsevier Science: Amsterdam, The Netherlands, 2020; p. 1094. [Google Scholar] [CrossRef]
  36. Greene, H.G.; Baker, M.R.; Aschoff, J.; Pacunski, R. Hazards Evaluation of a Valuable Vulnerable Sand-Wave Field Forage Fish Habitat in the Marginal Central Salish Sea Using a Submersible. Oceanologia 2021, 65, 1–19. [Google Scholar] [CrossRef]
  37. Sisson, N.; Baker, M.R. Feeding Ecology of Pacific Sand Lance in the San Juan Archipelago. Mar. Coast. Fish. 2017, 9, 612–625. [Google Scholar] [CrossRef]
  38. Baker, M.R.; Matta, M.E.; Beaulieu, M.; Parris, N.; Huber, S.; Graham, O.J.; Pham, T.; Sisson, N.B.; Heller, C.P.; Witt, A. Intra-Seasonal and Inter-Annual Patterns in the Demographics of Sand Lance and Response to Environmental Drivers in the North Pacific. Mar. Ecol. Prog. Ser. 2019, 617–618, 221–244. [Google Scholar] [CrossRef]
  39. Høines, Å.S.; Bergstad, O.A. Density of Wintering Sand Eel in the Sand Recorded by Grab Catches. Fish. Res. 2001, 49, 295–301. [Google Scholar] [CrossRef]
  40. Wentworth, C.K. A Scale of Grade and Class Terms for Clastic Sediments. J. Geol. 1922, 30, 377–392. [Google Scholar] [CrossRef]
  41. Williams, S.J.; Arsenault, M.A.; Buczkowski, B.J.; Reid, J.A.; Flocks, J.G.; Kulp, M.A.; Penland, S.; Jenkins, C.J. Surficial Sediment Character of the Louisiana Offshore Continental Shelf Region: A GIS Compilation. U.S. Geological Survey Open-File Report 2006–1195. 2006. Available online: https://pubs.usgs.gov/of/2006/1195/index.htm (accessed on 1 March 2025).
  42. Blott, S.J.; Pye, K. GRADISTAT: A Grain Size Distribution and Statistics Package for the Analysis of Unconsolidated Sediments. Earth Surf. Process. Landf. 2001, 26, 1237–1248. [Google Scholar] [CrossRef]
  43. Zeeman, S.; Fortier, B. Sediment Grain Size Analysis. In BIO350 Oceanography; University of New England: Armidale, NSW, Australia, 2009. [Google Scholar]
  44. Alin, S.R.; Newton, J.A.; Feely, R.A.; Curry, B.; Greeley, d.; Herndon, J.; Warner, M. A decade-long cruise time-series (2008–2018) of physical and biogeochemical conditions in the southern Salish Sea, North America. Earth Syst. Sci. Data 2024, 16, 837–865. [Google Scholar] [CrossRef]
  45. Jenness, J.S. DEM Surface Tools. 2014. Available online: https://www.jennessent.com/arcgis/surface_area.htm (accessed on 1 November 2024).
  46. Wright, D.J.; Lundblad, E.R.; Larkin, E.M.; Rinehart, R.W.; Murphy, J.; Cary-Kothera, L.; Draganov, K. ArcGIS Benthic Terrain Modeler. NOAA Coastal Services Center and Oregon State University. 2005. Available online: https://maps.csc.noaa.gov/digitalcoast/tools/btm (accessed on 1 November 2024).
  47. Wright, D.J.; Pendleton, M.; Boulware, J.; Walbridge, S.; Gerlt, B.; Eslinger, D.; Huntley, E. ArcGIS Benthic Terrain Modeler (BTM), v. 3.0; Environmental Systems Research Institute, NOAA Coastal Services Center, Massachusetts Office of Coastal Zone Management: Wood Hole, MA, USA. 2012; Available online: https://www.arcgis.com/index.html (accessed on 1 November 2024).
  48. Southard, J.B. Representation of Bed Configurations in Depth-Velocity-Size Diagrams. J. Sediment. Petrol. 1971, 41, 903–915. [Google Scholar]
  49. Orr, J.W.; Wildes, S.; Kai, Y.; Raring, N.; Nakabo, T.; Katugin, O.; Guyon, J. Systematics of North Pacific Sand Lances of the Genus Ammodytes Based on Molecular and Morphological Evidence, with the Description of a New Species from Japan. Fish. Bull. 2015, 113, 129–156. [Google Scholar] [CrossRef]
  50. Wright, P.J.; Jensen, H.; Tuck, I. The Influence of Sediment Type on the Distribution of the Lesser Sandeel, Ammodytes marinus. J. Sea Res. 2000, 44, 243–256. [Google Scholar] [CrossRef]
  51. Horkan, E.; Baker, M.R. Experimental Trials Provide Insight to Potential Climate Impacts on Condition and Over-Winter Survival in Pacific Sand Lance, Ammodytes personatus. Behav. Process. 2025, 226, 105169. [Google Scholar] [CrossRef]
  52. Morrison, S.M.; Davoren, G.K. Habitat Characteristics and Diel Patterns of Sand Lance (Ammodytes spp.) in Coastal Newfoundland. Environ. Biol. Fishes 2024, 107, 443–457. [Google Scholar] [CrossRef]
  53. Zhukova, K.A.; Baker, M.R. Gonadal Maturation and Maturity Staging of the Pacific Sand Lance (Ammodytes personatus). J. Ichthyol. 2022, 62, 921–931. [Google Scholar] [CrossRef]
  54. Baker, M.R.; Smeltz, T.S.; Williams, K.; Greufe, C.; Chapman, J.; Ewing, M.; Glassy, J.; Hasegawa, E.; Cieri, K.; Matson, S. Diel Vertical Migration in a Pelagic Forage Fish—Pacific Sand Lance (Ammodytes personatus) Associated with Benthic Substrates. ICES J. Mar. Sci. 2023, 80, 1758–1772. [Google Scholar] [CrossRef]
  55. Tokranov, A.M. Distribution and Some Biological Features of the Pacific Sand Lance (Ammodytes hexapterus) in Waters off Kamchatka in the Sea of Okhotsk. J. Ichthyol. 2007, 47, 288–295. [Google Scholar] [CrossRef]
  56. Haynes, T.B.; Robinson, C.L. Re-Use of Shallow Sediment Patches by Pacific Sand Lance (Ammodytes hexapterus) in Barkley Sound, British Columbia, Canada. Environ. Biol. Fishes 2011, 92, 1–12. [Google Scholar] [CrossRef]
  57. Endo, A.; Iwasaki, N.; Shibata, J.Y.; Tomiyama, T.; Sakai, Y. The Burrowing Sand Lance Ammodytes japonicus (Teleostei, Ammodytidae) Prefers Benthic Sediments of Low Shear Strength. J. Ethol. 2019, 37, 213–219. [Google Scholar] [CrossRef]
  58. Butterworth-Heinemann. Principles and Processes of Sediment Transport. In Waves, Tides, and Shallow Water Processes; Academic: London, UK, 1999; pp. 96–124. [Google Scholar]
  59. Faugères, J.C.; Stow, D.A.; Imbert, P.; Viana, A. Seismic Features Diagnostic of Contourite Drifts. Mar. Geol. 1999, 162, 1–38. [Google Scholar] [CrossRef]
  60. Ashley, G.M. Classification of Large-Scale Sub-Aqueous Bedforms: A New Look at an Old Problem. J. Sediment. Petrol. 1990, 60, 160–172. [Google Scholar]
  61. Dalrymple, R.W.; Knight, R.J.; Lambiase, J.J. Bedforms and Their Hydraulic Stability Relationships in a Tidal Environment, Bay of Fundy, Canada. Nature 1978, 275, 100–104. [Google Scholar] [CrossRef]
  62. Banas, N.; Bricker, J.; Carter, G.; Gerdes, F.; Martin, W.; Nelson, E.; Ross, T.; Scansen, B.; Simons, R.; Wells, M. Flow, Stratification, and Mixing in San Juan Channel. In Coastal and Estuarine Geophysical Fluid Dynamics; University of Washington, School of Oceanography: Seattle, WA, USA, 1999; pp. 1–89. [Google Scholar]
  63. MacCready, P.; Geyer, W.R. Estuarine Exchange Flow in the Salish Sea. J. Geophys. Res. Oceans 2024, 129, e2023JC020369. [Google Scholar] [CrossRef]
  64. Faugères, J.C.; Mulder, T. Contour Currents and Contourite Drifts. In Developments in Sedimentology; Elsevier: Amsterdam, The Netherlands, 2011; Volume 63, pp. 149–214. [Google Scholar]
  65. Barrie, J.V.; Greene, H.G.; Conway, K.W.; Picard, K. Inland Tidal Sea of the Northeastern Pacific. In Seafloor Geomorphology as Benthic Habitat: Geohab Atlas of Seafloor Geomorphic Features and Benthic Habitats; Harris, P.T., Baker, E.K., Eds.; Elsevier Insights: Amsterdam, The Netherlands, 2011; pp. 623–634. [Google Scholar]
  66. Bograd, S.; Castro, C.; Di Lorenzo, E.; Palacios, D.; Bailey, H.; Gilly, W.F.; Chavez, F. Oxygen Declines and the Shoaling of the Hypoxic Boundary in the California Current. Geophys. Res. Lett. 2008, 35, L12607. [Google Scholar] [CrossRef]
  67. Pörtner, H.O.; Lannig, G. Oxygen and Capacity Limited Thermal Tolerance. In Fish Physiology; Academic Press: San Diego, CA, USA, 2009; Volume 27, pp. 143–191. [Google Scholar]
  68. Parker-Stetter, S.L.; Horne, J.K.; Langness, M.M. The Influence of Midwater Hypoxia on Nekton Vertical Migration. ICES J. Mar. Sci. 2009, 66, 1296–1302. [Google Scholar] [CrossRef]
  69. Moss, S.A.; McFarland, W.N. The Influence of Dissolved Oxygen and Carbon Dioxide on Fish Schooling Behavior. Mar. Biol. 1970, 5, 100–107. [Google Scholar] [CrossRef]
  70. Ekau, W.; Auel, H.; Pörtner, H.-O.; Gilbert, D. Impacts of Hypoxia on the Structure and Processes in Pelagic Communities (Zooplankton, Macro-Invertebrates and Fish). Biogeosciences 2010, 7, 1669–1699. [Google Scholar] [CrossRef]
  71. Vaquer-Sunyer, R.; Duarte, C.M. Thresholds of Hypoxia for Marine Biodiversity. Proc. Natl. Acad. Sci. USA 2008, 105, 15452–15457. [Google Scholar] [CrossRef]
  72. United States Environmental Protection Agency. Ambient Aquatic Life Water Quality Criteria for Dissolved Oxygen (Saltwater): Cape Cod to Cape Hatteras; EPA-822-R-00-012; U.S. Environmental Protection Agency: Washington, DC, USA, 2000. [Google Scholar]
  73. Miller, D.; Poucher, S.; Coiro, L.L. Determination of Lethal Dissolved Oxygen Levels for Selected Marine and Estuarine Fishes, Crustaceans, and a Bivalve. Mar. Biol. 2002, 140, 287–296. [Google Scholar] [CrossRef]
  74. Dommasnes, A.; Rey, F.; Røttingen, I. Reduced Oxygen Concentrations in Herring Wintering Areas. ICES J. Mar. Sci. 1994, 51, 63–69. [Google Scholar] [CrossRef]
  75. Behrens, J.W.; Steffensen, J.F. The Effect of Hypoxia on Behavioural and Physiological Aspects of Lesser Sandeel, Ammodytes tobianus (Linnaeus, 1785). Mar. Biol. 2007, 150, 1365–1377. [Google Scholar] [CrossRef]
  76. Behrens, J.W.; Ærtebjerg, G.; Petersen, J.K.; Carstensen, J. Oxygen Deficiency Impacts on Burying Habitats for Lesser Sandeel, Ammodytes tobianus, in the Inner Danish Waters. Can. J. Fish. Aquat. Sci. 2009, 66, 883–895. [Google Scholar] [CrossRef]
  77. Behrens, J.W.; Petersen, J.K.; Ærtebjerg, G.; Steffensen, J.F. Influence of Moderate and Severe Hypoxia on the Diurnal Activity Pattern of Lesser Sandeel Ammodytes tobianus. J. Fish Biol. 2010, 77, 538–551. [Google Scholar] [CrossRef] [PubMed]
  78. Helly, J.J.; Levin, L.A. Global Distribution of Naturally Occurring Marine Hypoxia on Continental Margins. Deep Sea Res. I 2004, 51, 1159–1168. [Google Scholar] [CrossRef]
  79. Diaz, R.J. Overview of Hypoxia around the World. J. Environ. Qual. 2001, 30, 275–281. [Google Scholar] [CrossRef]
  80. Forster, S.; Huettel, M.; Ziebis, W. Impact of Boundary Layer Flow Velocity on Oxygen Utilisation in Coastal Sediments. Mar. Ecol. Prog. Ser. 1996, 143, 173–185. [Google Scholar] [CrossRef]
  81. Behrens, J.W.; Stahl, H.J.; Steffensen, J.F.; Glud, R.N. Oxygen Dynamics Around Buried Lesser Sandeels Ammodytes tobianus (Linnaeus 1785): Mode of Ventilation and Oxygen Requirements. J. Exp. Biol. 2007, 210, 1006–1014. [Google Scholar] [CrossRef]
  82. Robinson, C.L.; Hrynyk, D.; Barrie, J.V.; Schweigert, J. Identifying Subtidal Burying Habitat of Pacific Sand Lance (Ammodytes hexapterus) in the Strait of Georgia, British Columbia, Canada. Prog. Oceanogr. 2013, 115, 119–128. [Google Scholar] [CrossRef]
  83. Ostrand, W.D.; Gotthardt, T.A.; Howlin, S.; Robards, M.D. Habitat Selection Models for Pacific Sand Lance (Ammodytes hexapterus) in Prince William Sound, Alaska. Northwest. Nat. 2005, 86, 131–143. [Google Scholar] [CrossRef]
  84. Murase, H.; Nagashima, H.; Yonezaki, S.; Matsukura, R.; Kitakado, T. Application of a Generalized Additive Model (GAM) to Reveal Relationships between Environmental Factors and Distributions of Pelagic Fish and Krill: A Case Study in Sendai Bay, Japan. Fish. Sci. 2009, 75, 1213–1222. [Google Scholar] [CrossRef]
  85. Boldt, J.; Baker, M.R.; Bernal, M.; Somarakis, S. SPF Workshop on Methods and Techniques for Sampling and Assessing Small Pelagic Fish Populations. In 2017 Inter-Sessional Science Board Meeting: A Note from the New Science Board Chair; PICES Press: Sidney, BC, Canada, 2017; Volume 25, p. 16. [Google Scholar]
  86. Baker, M.R.; Boldt, J.; McGowan, D.; Takasuka, A.; Takahashi, M. Improved Detection and Understanding of Factors Affecting Changes in North Pacific Forage Communities and Implications to Ecosystems. PICES Press 2024, 32, 23–25. [Google Scholar]
  87. Huard, J.; Hemming, V.; Baker, M.R.; Hipfner, M.J.; Davoren, G.K.; Koval, B.A.; Dionne, P.; Lowry, D.; Monks, R.; Nicholas, G.; et al. Assessment of Population Trajectory and Threats for Pacific Sand Lance in the Salish Sea. Front. Mar. Sci. 2024, 11, 1445215. [Google Scholar] [CrossRef]
  88. Selden, K.R.; Baker, M.R. Spatial Analysis of Microplastics in Forage Fish and Salmon in the Southern Salish Sea. Mar. Pollut. Bull. 2023, 193, 115748. [Google Scholar] [CrossRef]
  89. Carlson, N.V.; White, M.A.V.; Tavera, J.J.; O’Hara, P.D.; Baker, M.R.; Bertram, D.F.; Summers, A.; Fifield, D.A.; Juanes, F. Noise Results in Lower Energy Density in an Important Forage Fish—The Pacific Sand Lance. Mar. Pollut. Bull. 2025, 213, 117664. [Google Scholar] [CrossRef] [PubMed]
  90. Sethi, S.A.; Murphy, R.D.; Baker, M.R.; Kroska, A.; Hilborn, R.; Harris, B.P. Seeking Solutions: Challenges and Opportunities for Operationalizing Bottom-Towed Fisheries Sustainability. Fish Fish. in prep..
  91. Holland, G.J.; Greenstreet, S.P.R.; Gibb, I.M.; Fraser, H.M.; Robertson, M.R. Identifying Sandeel Ammodytes marinus Sediment Habitat Preferences in the Marine Environment. Mar. Ecol. Prog. Ser. 2005, 303, 269–282. [Google Scholar] [CrossRef]
  92. Greenstreet, S.P.R.; Holland, G.J.; Guirey, E.J.; Armstrong, E.; Fraser, H.M.; Gibb, I.M. Combining Hydroacoustic Seabed Survey and Grab Sampling Techniques to Assess Local Sandeel Population Abundance. ICES J. Mar. Sci. 2010, 67, 971–984. [Google Scholar] [CrossRef]
  93. Tanda, M. Relationship between the Habitat of Sand Lance and the Sandy Bottom in the Seto Inland Sea. In Marine Coastal Environment; Hirano, T., Ed.; Fuji Techno System: Tokyo, Japan, 1998; pp. 348–355. [Google Scholar]
  94. Baker, M.R.; De Robertis, A.; Levine, R.; Cooper, D.; Farley, E. Spatial Distribution of Arctic Sand Lance in the Chukchi Sea Related to the Physical Environment. Deep Sea Res. II 2022, 206, 105213. [Google Scholar] [CrossRef]
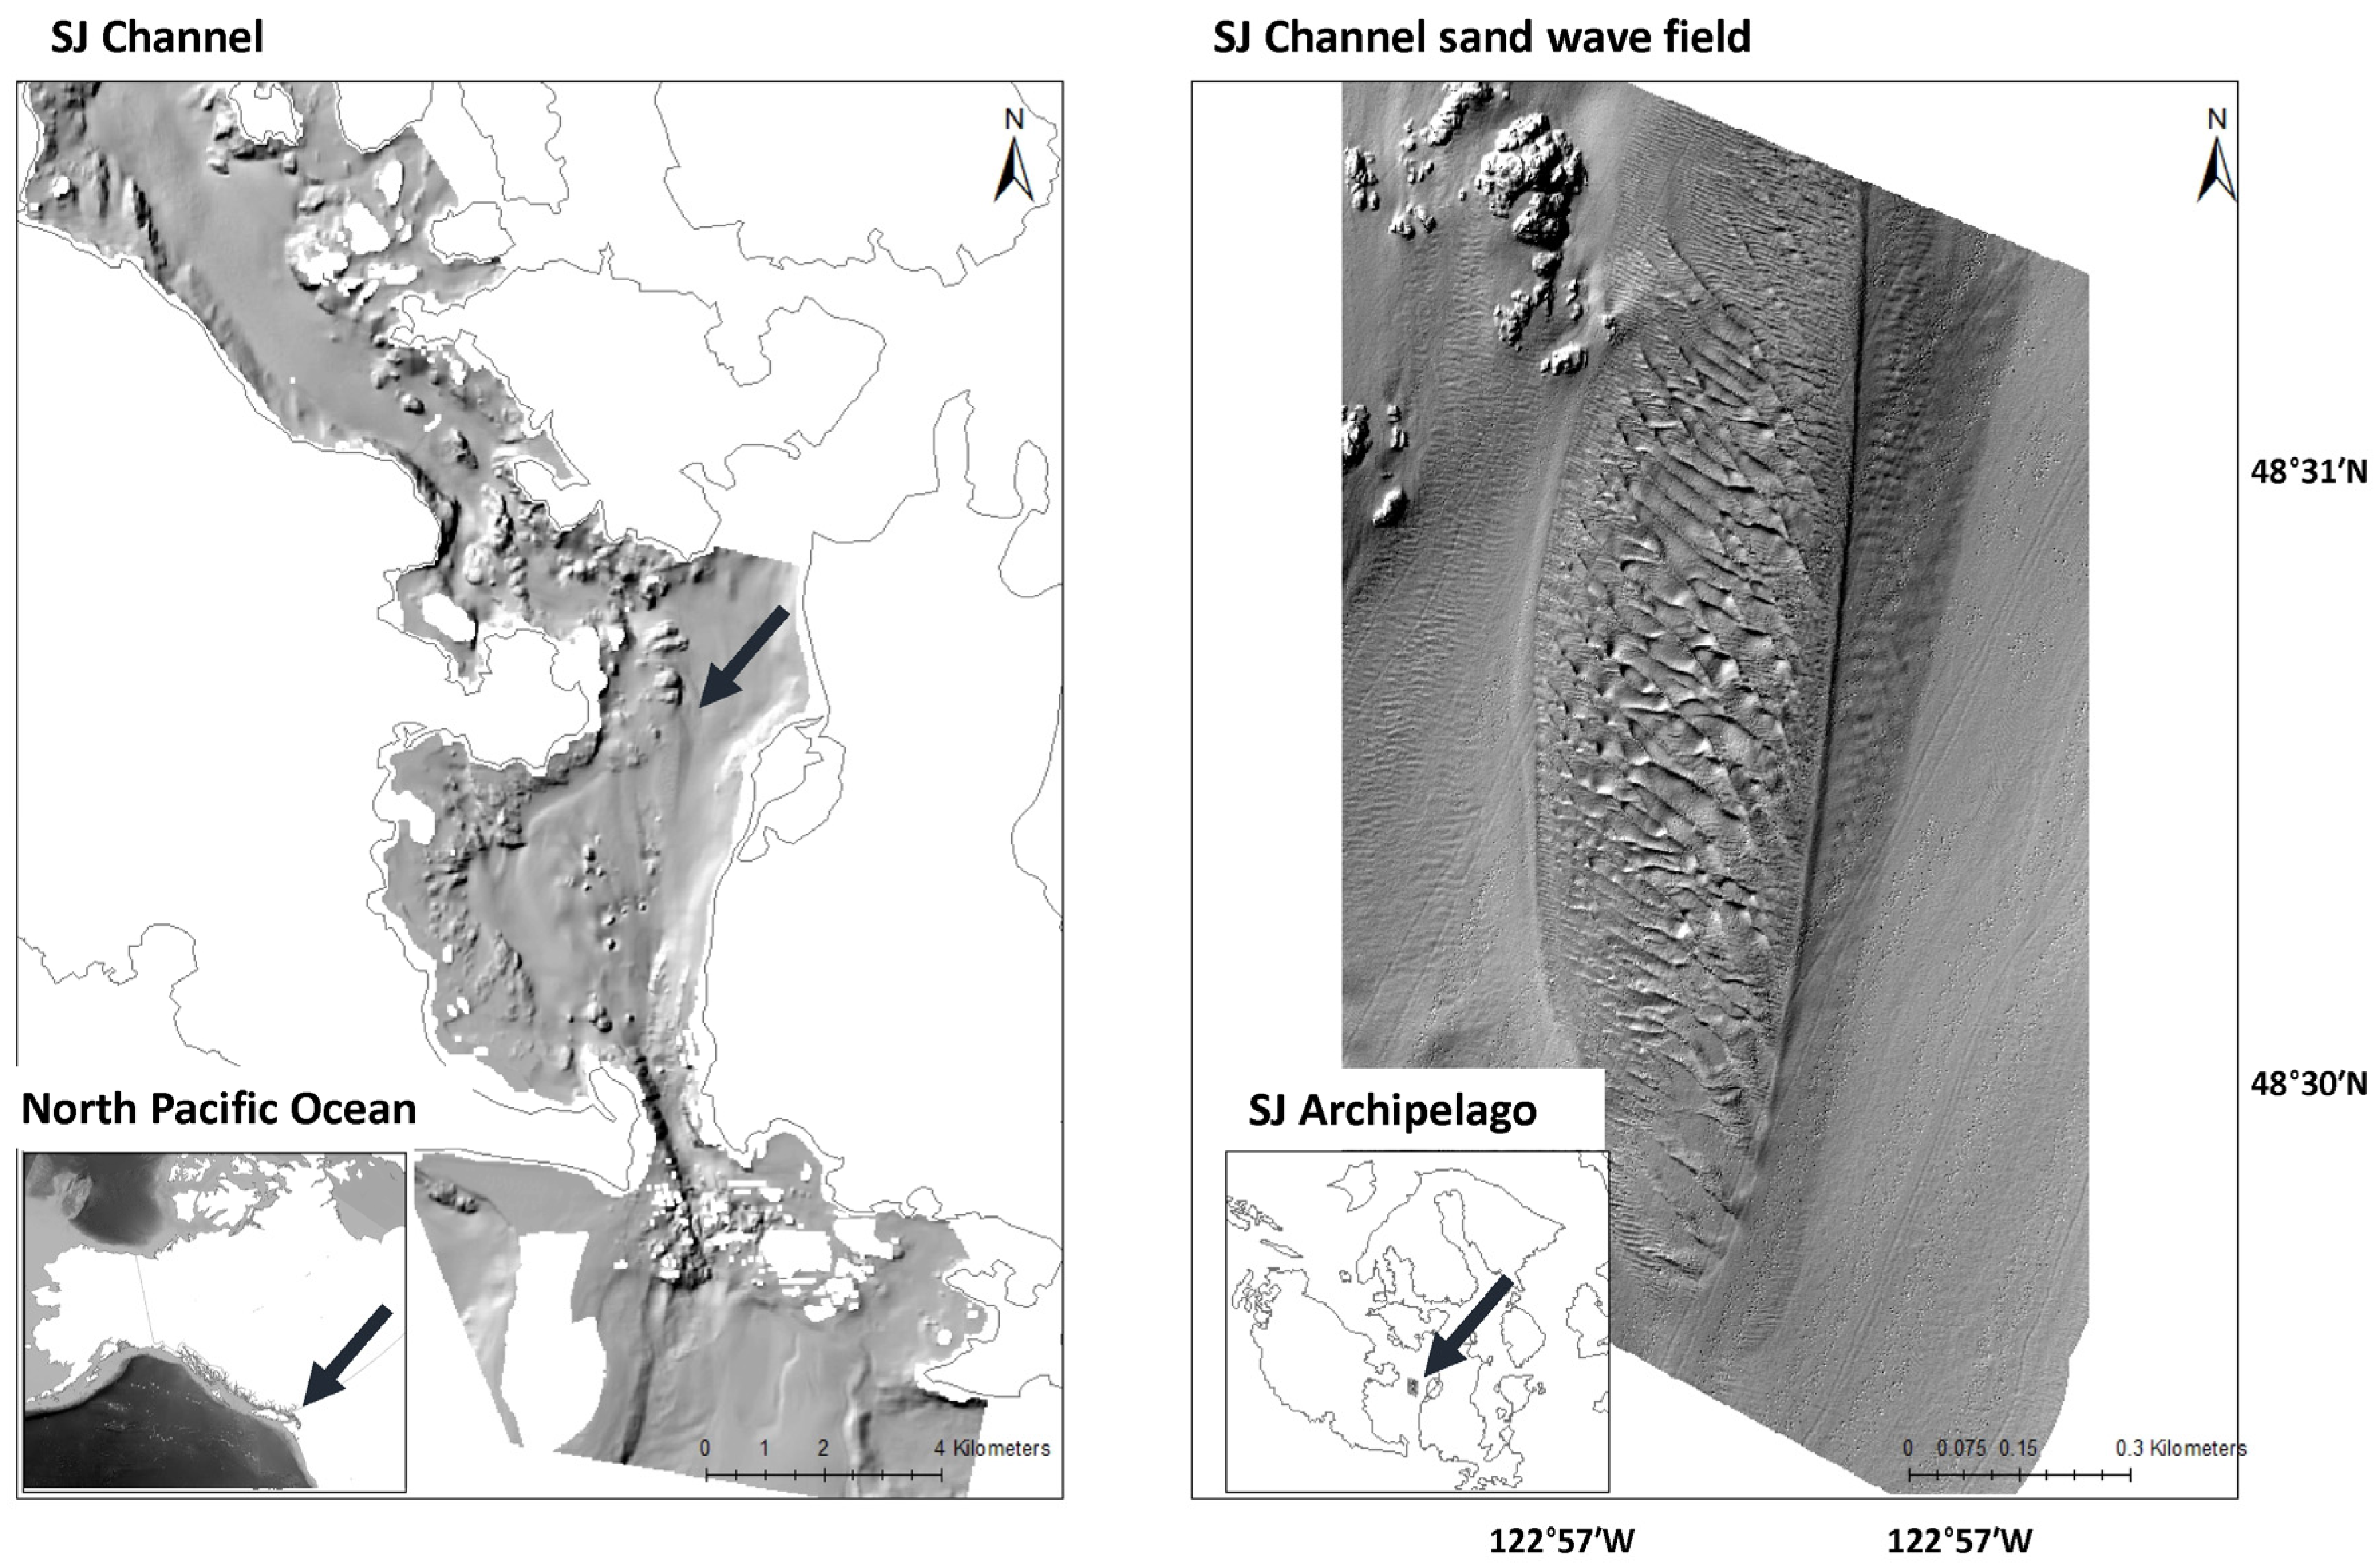
Figure 1. Map and bathymetric relief of the study site using data collected in multibeam acoustic surveys. Left Panel: San Juan Channel is shown with bathymetry for the full channel within the San Juan Islands (location within the North Pacific Ocean shown, inset map). Right Panel: High-resolution bathymetric profile for the entire San Juan Channel sand wavefield (location within the San Juan Archipelago is shown, inset map).
Jmse 13 01469 g001
Figure 2. Pacific sand lance (Ammodytes personatus) at rest, extending out of sediments extracted from the San Juan Channel sand wave field (mixed carbonate and siliciclastic coarse-grained substrates). Photo by Matthew Baker.
Jmse 13 01469 g002
Figure 3. Schematic of the wave field formation illustrating the teardrop shape. The bedform initiates in the north from the leading point, rising to the summit point, and tapering in the direction of the predominant tidal flow (tidal ebb current). Figure modified from Southard [48].
Jmse 13 01469 g003
Figure 4. Bathymetric profile and sonar images of the San Juan Channel sand wave field. Panel 1 shows a vertical representation of a cross-section of the wave formation period and amplitude along the north–south extent, as informed from MBES imagery from Tombolo Mapping Lab. Panel 2 shows a sonar image taken via Teledyne Marine BlueView M900-2250-130-Mk2 dual-frequency 900 kHz and 2250 kHz in the OceanGate Cyclops II submersible on site.
Jmse 13 01469 g004
Figure 5. Projections of ArcGIS benthic habitat metrics derived from multibeam echo sounder (MBES) bathymetry. Bathymetric derivatives include Bathymetric Position Index, slope, north–south aspect (north–south axis), east–west aspect (east–west axis), and rugosity. Areas with more extreme values for each metric are indicated in darker and lighter shading, relative to a neutral gray. Higher values for slope, aspect, and rugosity are embossed (raised relative to the background) for better visibility. Note: Stripping patterns (nadir artifacts) in panel 2 (slope imagery) are caused by specular echoes (reflections where the angle of incidence equals the angle of reflection) in the near-nadir region of the multibeam backscatter.
Jmse 13 01469 g005
Figure 6. MBES image of the San Juan Channel sand wave field, modified from Greene et al. [34], highlights two distinct size categories of sediment waves, including long high-amplitude waves (dark blue arrows) and short low-amplitude waves (light green arrows). Black dashed lines highlight two distinct orientations of the large sand waves.
Jmse 13 01469 g006
Figure 7. Photographs of sand waves in the San Juan Channel sand wave field as observed via the OceanGate Cyclops II submersible. (A) Sonar Teledyne Marine BlueView M900-2250-130-Mk2 dual-frequency 900 kHz and 2250 kHz sonar positioned on an extended mechanical arm on the OceanGate Cyclops II submersible on site immediately above the San Juna Channel sand wave field; (B) sand wave formation; (C) sand waves and visible patterns in the crest and trough distribution of silicate (sand) and carbonate (shell hash) sediments; and (D) sand wave trough with cobble deposits in the central troughline.
Jmse 13 01469 g007
Figure 8. Interpolated plots (Inverse Distance Weighting) of percent sediment type (gravel, sand, and silt; displayed left-to-right) within the SJC sand wave field (data includes all samples, 2012–2017). Boundaries of the sand wave field are shown as a superimposed white outline. Darker colors indicate higher concentrations. White indicates no data.
Jmse 13 01469 g008
Figure 9. Images developed through multibeam data of the bathymetric features of the San Juan Channel sand wave field and superimposed ArcMap projections of metrics related to sediment composition developed via an in situ sampling effort (panels left-to-right): Panel 1—Multibeam MBES data of the subtidal bedform outlined in white and highlighted in lighter gray shading. Panel 2—Backscatter images depict coarse sediments (gravel/cobble) in darker gray, sand sediments in lighter gray, and finer sediments (fine sand and silt/mud) in blue. Panel 3—Sediment sorting of in situ samples (all samples, 2010–2017). White points indicate well-sorted sediments, and dark gray points indicate poorly sorted sediments. Panel 4—Mean sediment size ( φ ) of in situ samples (all samples, 2010–2017). Mean sediment for each Van Veen grab is shown according to the Wentworth scale.
Jmse 13 01469 g009
Figure 10. Vertical profiles of oxygen (mg L−1) from surface (0 m) to depth (90 m) developed through CTD casts at the San Juan Channel sand wave field. Casts are colored according to seasonal timeframe, including Spring (aquamarine), Summer (green), and Fall (blue).
Jmse 13 01469 g010
Disclaimer/Publisher’s Note: The statements, opinions and data contained in all publications are solely those of the individual author(s) and contributor(s) and not of MDPI and/or the editor(s). MDPI and/or the editor(s) disclaim responsibility for any injury to people or property resulting from any ideas, methods, instructions or products referred to in the content.