Article

A New Eco-Physical, Individual-Based Model of Humpback Whale (Megaptera novaeangliae, Borowski, 1781) Swimming and Diving

by
Marisa González Félix
1,2,†,
Jennifer Coston-Guarini
3,†,
Pascal Rivière
1,† and
Jean-Marc Guarini
1,*,†
1
Univ Brest, CNRS, Ifremer, IRD, UMR6539 LEMAR, F-29280 Plouzané, France
2
Institut de Ciències del Mar (ICM-CSIC), Pg. Marítim de la Barceloneta 37-49, 08003 Barcelona, Spain
3
The Entangled Bank Laboratory, 11 Rue Anatole France, 66650 Banyuls sur Mer, France
*
Author to whom correspondence should be addressed.
These authors contributed equally to this work.
J. Mar. Sci. Eng. 2025, 13(8), 1388; https://doi.org/10.3390/jmse13081388
Submission received: 28 May 2025 / Revised: 10 July 2025 / Accepted: 18 July 2025 / Published: 22 July 2025
(This article belongs to the Section Marine Biology)

Abstract

Among marine organisms, baleen whale species like the humpback whale (Megaptera novaeangliae) are a case for which individual-based models are necessary to study population changes because individual trait variabilities predominate over average demographic rates to govern population dynamics. These models require quantification of individual organisms’ dynamics with respect to local conditions, which implies optimal strategy frameworks cannot be used. Instead, to quantify how individuals perform according to the environmental conditions they encounter, we formulated a model linking individual mechanical characteristics of swimming and diving with their aerobic metabolism and behavior. The model simulates the dynamics of swimming and diving for the reported range of whale sizes (1000 to 50,000 kg). Additional processes simulate foraging events including rapid accelerations and water engulfment, which modifies whale shape, weight and drag. Simulations show how the energy cost of swimming at equilibrium increases geometrically with velocity and linearly with mass. The duration and distance covered under apnea vary monotonically with mass but not with velocity; hence, there is a positive mass-dependent optimal velocity that maximizes the distance and duration of apnea. The dive limit was explored with a combination of the physiological state, mechanical force produced and distance to return to surface. This combination is imposed as an inequality constraint on the whale individual. The inequality constraint, transformed as a multi-layer perceptron, which continuously processes information about oxygen, depth and relative velocity, provides the whale individual with autonomous decision-making about whether or not to continue the dive. The results also highlight where missing metabolic information is needed to simulate the dynamics of a population of autonomous individuals at the scale of the Global Ocean.

1. Introduction

It is difficult to describe the extraordinary diving abilities of marine mammals without also treating their behavioral and physiological properties [1,2]. Some individuals spend as much as 90% of their time beneath the ocean’s surface [3], and diving includes a wide array of different behaviors, such as feeding and exploring [1], as well as reproductive and social interactions [4]. Any individual-based model of diving dynamics needs to include adequate behavioral flexibility and should simulate diving behaviors as an emergent property of underlying, interacting systems. The challenge, from the point of view of building a model, becomes identifying which systems to focus on and adequately representing complex population-specific diving characteristics.
Among marine organisms, baleen whale species, like the humpback whale (Megaptera novaeangliae), are distributed throughout the Global Ocean. Their large size prohibits experimental studies, and most early (pre-1980s) observations are a combination of surface behaviors observed during whaling activities and measurements made from dissections. Then, as species protection measures were put in place during the latter half of the 20th century, empirical research advanced when non-invasive technologies became feasible [5]. At the same time, information remains fragmented. For instance, we have a large amount of observations about humpback whale feeding on foraging grounds where they spend substantial amounts of time (e.g., [1]), but it has also been reported that they feed occasionally during migrations and at breeding grounds [1,6]. Furthermore, humpback whales feed using a type of filter feeding called lunge feeding [7]. During short periods of rapid accelerations, quantities of macrozooplankton (i.e., krill) or small forage fish are engulfed along with a volume of surrounding water [7]. These foraging dives, and lunge feeding in particular, have been assumed to require a large amount of energy. However, noticeably absent are the physiological measurements necessary to understand metabolic processes and energy requirements during baleen whale movements.
Earlier, in the 1930s, baleen whale dives and swimming were considered through the dynamics of gas exchanges (mainly oxygen and carbon dioxide) between the organism and its environment. Hence, diving was simplified to a problem of oxygen storage and use, based mainly on a series of theoretical principles. In 1933, Laurie [8] sketched out how dive limits could be estimated from the volumes of oxygen stored in the body and modulated by the oxygen consumption estimated from metabolic rates using allometric functions of body size, as were indicated by Kleiber [9] a year earlier. Tissue oxygenation estimates came from the cylindrical model of capillary transport and gas diffusion laws introduced by Krogh [10], and oxygen storage is treated in terms of oxygen solubility in body tissues and blood. Gas volumes were then estimated over different atmospheric pressures using the Hill equation (a logistic curve [11]). But the inability to confirm measurements on living specimens hindered progress on these ideas.
A half century later, another theory of diving behavior, called optimal diving [12,13], arose. It is a distinctly different approach developed by marine ecologists who transposed ideas from central foraging strategies and consumer optimization theory [14] to a new behavioral framework called “optimal diving strategy” [12,15]. This states that organisms are adapted to optimize their time in apnea underwater [12,15]. While it uses the insights from gas exchange dynamics, optimal diving is a common sense principle using a cost–benefit balance formulation that optimizes the use of oxygen acquired at the surface for consumption by underwater activities:
χ ( σ ) = χ m a x 1 e γ σ 0 = χ ( σ ) μ τ T τ μ ϕ T ϕ
where χ ( σ ) is the quantity of oxygen stored at time σ , the time spent at the surface, χ m a x is the maximum storage capacity, γ is the oxygen accumulation rate, μ τ is the rate of oxygen consumption during the travel period, T τ , and μ ϕ is the rate of oxygen consumption during the foraging period, T ϕ .
Importantly, this model tends to filter out individual-level variability. Optimization homogenizes every possible dive that can be done by any individual of the species, summarizing the dive characteristics only in terms of depth and duration. In addition, this model also implies that the dive is entirely predictable, or planned in advance, and secondly, that during a dive, all available oxygen will be used not until, but before, the individual returns to the surface. As more precise sensor information became available, Tyson et al. [16] showed that when the optimal diving model is used to quantify the energy balance from the two most commonly reported variables—dive duration and depth—the variability is so high that no conclusions can be reached (see Figures 1 and 3 in Tyson et al. [16]).
More recently, other authors (e.g., [17]) pointed out that many adaptive mechanisms, both physiological and behavioral ones, have been invoked to describe and explain large aerobic dive capacities, including (1) larger quantities of myo- and hemoglobin, (2) the asymmetric distribution of oxygenated blood during dives, (3) the regulation of organ function and (4) energy-efficient swimming. Watanabe and Goldbogen [18] highlighted the difficulties of obtaining data on large marine mammals, which are needed to quantify oxygen consumption, while they also point to the tremendous progress made with biologging sensors since the early studies by Kooyman [19,20]. Sensors now permit high-frequency recordings of not only cetacean and other mammals’ diving precise locations and behaviors but also some physiological parameters (heart beat and breathing rates, body temperature, etc.) along with environmental parameters recorded simultaneously [20,21,22]. These new datasets permit the reconstruction of dive tracks [1] and have led to new models that quantify particular foraging dive behaviors (e.g., engulfment events [23,24,25]). These models have the goal of linking estimates of the physical forces involved in a sequence of movements with physiological processes.
However, the central challenge in all this work remains the basic properties of cetacean blood gas management [20,26,27,28,29]. Today, with dive trajectories recorded using increasingly comprehensive sensor technologies (e.g., [20]), their interpretation continues to use a framework constructed from observations made from dissections [30] and analogies with a myriad of other smaller, diving mammal species, including human free-divers [26,31,32]. Quantitative properties are even derived from human free-diver blood gas studies [33,34]; hemoglobin–oxygen biochemical reactions in the human free-diver model remain important for understanding diving performance even as new technologies [35,36] modify and question earlier assumptions.
For our objective of modeling individual whale swimming and diving, including physiological regulations, and anticipating the strong potential to access physiological information in the near future, we defined a compatible function that links oxygen metabolism and the production of muscular force fueled by metabolic energy from consumed oxygen. This implies that individual behaviors during dives will condition the production of any mechanical force that generates forward movement. In summary, this means that the dynamic of movement is defined by the quantity of force that is intended to be produced by the individual, and the movement dynamic is also linked—retrospectively—to the quantity of energy (hence the quantity of oxygen) consumed for it, if available.
Finally, building the model around such an eco-physical function unexpectedly created an important design challenge concerning decision-making autonomy. During the development, it became evident that relying on the determinism of an ethogram would be unsatisfactory. Living organisms have a continuous perception of both their changing environmental and physiological conditions, which is not accounted for in an ethogram. Hence, the model ‘feeds’ whale individuals with both environmental and physiological information, triggering decisions leading to observable behaviors. It therefore also became necessary to give an individual the means of both perceiving and treating this information within autonomous decision-making. This could be called a crude form of awareness because, in essence, this gives the individual whales a biological imperative to survive a dive, without imposing any other constraints on its decision-making.
Our general objective was to design a model that details swimming and diving behavior in our global individual-based population model [37] while providing a quantitative framework for testing hypotheses, guiding observations and expanding on our understanding of whale diving physiology at the individual level.

2. Materials and Methods

All the symbols used in the model formulations described in the following sections are given in Appendix A.

2.1. Model Design Overview

The model described in this article simulates whale individual dynamics in its proximate environment (Figure 1). The dynamics of the individual encompass three interrelated categories of processes: behavioral, physiological and mechanical.
The behavioral component is based on an informed decision (consequence of external and internal stimuli) to produce a movement (mechanical dynamics of the motion of the body in space and time) while consuming metabolic energy. Environmental variables that are perceived by individuals are depth (through pressure) and water mass movement (described as a velocity vector). The direction and amplitude of the force produced by the muscles are controlled. To simulate foraging (including engulfment and engulfed water flushing), a dynamic submodel was formulated.
Three categories of behaviors were distinguished: swimming at the surface, exploring or prospecting dives and foraging dives. The capacity for an individual whale to decide when to end the dive, and return to the surface, uses the physiological limits of the dive. The limit is defined by the requirement to have enough remaining oxygen to return to the surface using active swimming and it is evaluated at each time step (0.1 s).
The mechanical component of the model, which represents the spatial physical motion of the individual, is a succession of four consecutive steps:
1.
The production of a muscular force F W .
2.
Muscular contractions provoke the sinusoidal movement of the flukes.
3.
A propulsive force F P is generated in the down phase of the sinusoidal fluke movement [4].
4.
The propulsive force generates an acceleration that induces a forward movement.
The production of a muscular force connects the mechanical component to the physiological one. It induces a metabolic cost, calculated as a consumption of oxygen in the muscle. In order to regulate the dive, it is necessary to have a mechanism that affects the amount of force produced. We assumed that this mechanism is primarily based on the availability of oxygen used for aerobic metabolism. This is a fundamental difference between our approach and optimal diving theory [15] for which no per se limitations can be accounted for during the dive since the starting point is the amount of energy available for the dive without any upstream mechanism to induce control. In addition, the full description of the limiting mechanism cannot be characterized as a simple threshold in only one of the oxygen compartment levels of the organism because this critical level of oxygen can be reached at different depths. In other words, the amount of oxygen and energy required to return to the surface vary with both the distance and swimming velocity.

2.2. Morphometric Description of Humpback Whale Individuals

The model depends first on the quantification of the humpback whale’s body dimensions. In the absence of a morphodynamic model of whale growth, the sizes of the whole and parts of the body were quantified with the following generic function:
Y = a M W b
where M W is the individual body mass (in kg). To homogenize value estimates from the literature, parameters a and b were re-calculated assuming isometric growth. The average density of the whale body ( ρ W ) at the surface was assumed to be equal to the density of the surrounding seawater ( ρ w a t ) and was used to calculate the body volume (in m3) as V W = M W / ρ W = M W / ρ w a t . Fluctuations of ρ w a t were assumed to not affect the volume significantly, and for all the simulations, ρ w a t was set as constant, equal to 1030.0 kg·m−3. The whale body “fineness”, X W (i.e., the ratio between the body length, L W , and the maximum section equivalent diameter), was assumed to be constant and set to the species-specific value equal to 5.0 (dimensionless) [38]. The allometry estimates, together with ranges of variations and original references, are given in Table 1. M W was assumed to vary between 1000 kg (average calf body mass) and 50,000 kg for average larger individuals.
When foraging, the maximum volume of water engulfed was estimated by the juxtaposition of two quarters of two rotational ellipsoids, anterior and posterior to the jaw articulation [23,39]:
V e , a = π 3 W h 2 L j 2 V e , p = π 3 W h 2 L j L v L j
with the length of the jaw ( L j , in m), the width of the head ( W h , in m) and the length of the ventral pouch ( L v , in m). The jaw dis-articulation factor and the jaw’s maximum opening angle were set implicitly to 1 and π / 2 , respectively. The engulfed water mass capacities (in kg), anterior ( M e , p ) and posterior ( M e , a ), respectively, are calculated as M e , a = ρ w a t V e , a and M e , p = ρ w a t V e , p .
The surface area of the engulfment pouch is calculated from the same two-quarter ellipsoid model, as the sum of the two components S e , a for the anterior quarter-ellipsoid and S e , p for the posterior quarter-ellipsoid:
S e , a = π L j 2 β + 2 L j β ( W h / 2 ) β 3 1.0 / β S e , p = π L j β ( W h / 2 ) β + L j β ( L v L j ) β + ( W h / 2 ) β ( L v L j ) β 3 1.0 / β
where β is an exponent equal to 1.6075 , which is the constant used to convert axis lengths to the surface of an ellipsoid (detailed in [40]).
Table 1. Morphometric parameters describing the dimensions of humpback whales. To calculate the volume, a volumic mass equal to 1030 kg.m−3, corresponding to the surrounding water volumic mass, ρ w a t , was considered. VPL: ventral pouch length.
SymbolDescriptionUnitsabMin.Max.Source
M W Body masskg11100050,000This paper
L W Body lengthm0.411/34.115.0[41]
S W Body surfacem20.052/35.067.0[42]
V W Body volumem39.7 × 10−410.9747.6This paper
M R Muscular masskg0.334133416,366[41]
V L Total lung capacitym368.6 × 10−610.073.36[43]
V B Blood volumem3127.0 × 10−610.136.22[44]
L j Length of the jawm89.9 × 10−31/30.93.3[39]
W h Width of the headm68.6 × 10−31/30.72.5[39]
L v VPLm195.7 × 10−31/32.07.2[39]
From Table 1, the calculation of oxygen compartments uses the total lung capacity, V L , in L, the blood volume, V B , in Ł, of which only 50 % was considered as oxygenated L, and the muscular mass, M R , in kg.

2.3. Quantifying the Spatial Dynamics of Movement

This section describes how the mechanical dynamics of the spatial whale movements are simulated. The spatial position of the whale individual is represented in Euclidean space using Cartesian coordinates, x , y , z , defined on a direct orthonormal basis. The water depths are negative. The dynamics are quantified in this frame by the velocity vector u x , u y , u z , induced by the acceleration vector a x , a y , a z , calculated from the budget of forces applied to the organism.
Motion is induced when the individual creates a propulsive force by fluking. In our model, it was done by the transfer of the muscular force F W (in N), produced by muscle contractions, to the oscillating tail (see Section 2.5, Equation (23), below). Hence, the propulsive force F P (in N) was assumed as equal to F P = F W m a x ( s i n ( ω F t ) , 0.0 ) , accounting for the propulsive force generated during the downward movement of the flukes [4,45]. Integrated over the oscillation period, T O , the propulsive force is equal to T O F P d t = T O F W d t / π .
The motion of the organism generates a drag force. The drag force (D, in N or (kg·m)·s−2) has two components [45], the skin friction drag (i.e., the friction between the fluid and the body) and the pressure drag (i.e., the pressure of the shear wakes generated by the displaced water). However, at high Reynold’s numbers, the pressure drag predominates in all conditions and was assumed to be the only relevant component for our modeling:
D = 1 2 ρ w a t S W C D U 2
with ρ w a t the seawater density (in kg·m−3), S W the wet surface of the body (in m2), considered as equal to the total surface area, C D (dimensionless) the drag coefficient (set to 7 × 10 6 M W / S W for the species considered in our study [46]; and U the magnitude of the velocity (in m·s−1) in the direction of the movement, U 2 = u u . The basic budget of the forces applied to the whale in motion is therefore the propulsive force minus the pressure drag force in the direction of movement.
Two other opposing forces (both in N) were added to this budget on the vertical dimension (z-axis), the weight F g = M W g and the buoyancy F a = ρ W V W g , with g being the gravity acceleration (in m·s−2). At the surface, it was assumed that F g = F a . When diving, the individual experiences increasing ambient pressure with depth, which compresses the gases and tissues of the body, decreasing the buoyancy of the diver. To account for this change in buoyancy [46], the whale individual volume V W ( z ) at depth z is calculated as
V W ( z ) = V W ( 0 ) 1 α c + α c 1 + 0.1 z
with V W ( 0 ) the volume at the surface (in m3), and α c [0,1[ (dimensionless) is the compressible volume fraction.
Finally, the components of acceleration, A (in m s−2), for each of the three axes, were estimated as a budget of the forces applied to the organism:
a x = ( F P x D x ) ( M W + ρ w a t V W C A ) 1 a y = ( F P y D y ) ( M W + ρ w a t V W C A ) 1 a z = ( F P z D z + F a F g ) ( M W + ρ w a t V W C A ) 1
where C A is the added mass coefficient, which is equal to the inverse of the fineness ( C A = X W 1 ), and used to account for the “force needed to accelerate the added mass of fluid backward” [45,47]. Then, ( M W + ρ w a t V W C A ) is described as being a “virtual mass” [45]. The components of velocity U, in m.s−1, were calculated by integrating the following system:
u ˙ x = a x u ˙ y = a y u ˙ z = a z
Then, the successive position coordinates in three-dimensional space, representing the motion trajectory, were calculated with
x ˙ = u x + u x , w a t y ˙ = u y + u y , w a t z ˙ = u z + u z , w a t
introducing U w a t = { u x , w a t , u y , w a t , u z , w a t } as the vector of the velocity components quantifying the movement of the water mass in which the individual whale is placed.

2.4. Foraging Dynamics Simulated Through Water Engulfment and Flushing Processes

The following calculations were adapted from Potvin et al. [23] to re-create the physical dynamics of engulfment and flushing. They mimic foraging movements but without considering how much resource is captured from the process in this version of the model. The energy consumption is re-integrated into the global dynamic model and is exposed in Section 2.5 below.
The foraging dynamics are considered as a sequence of three consecutive events: acceleration, engulfment and flushing. First, the whale individual accelerates for a period of T p , in s, to gain sufficient momentum needed to engulf a volume of water. Second, during engulfment (period of T e ), the shape and surface area of the body increase, adding an additional mass of engulfed water to the total body mass. The volume and mass of water engulfed during foraging are therefore state variables, described as V e ( t ) and M e ( t ) , that vary between 0 and ( V e , p + V e , a ) and ( M e , p + M e , a ) , respectively. The dynamics of the mouth opening and closing phases were computed as a change in angle, θ (in radians, from 0 to π / 2 and π / 2 to 0, respectively):
θ ˙ = + ζ o θ ˙ = ζ c
where ζ o and ζ c are the opening and closing rates (in radian.s−1), which are estimated from the duration of the engulfment, T e . Then, T e = T o + T c , with T o and T c being the duration of the mouth opening and closing, respectively. Therefore, ζ o = π / ( 2 T o ) and ζ c = π / ( 2 T c ) . The variation in the surface area of the engulfment pouch ( S e ( t ) , in m2) was calculated during T o ( t ] T p , T p + T o ] ) as a linear function of time, t:
S e ( t ) = S f + ( S e , p S f , a ) t T p T o
considering that the surface before engulfment is S f = S f , p + S f , a and that S e , p and S e , a (Equation (4)) are one fourth of the surface of the corresponding ellipsoids.
During the closing of the mouth ( t ] T p + T o , T p + T e ] ),
S e ( t ) = S e , p ( T o + T p ) + ( S e , a S f , p ) t T o T p T c
The increased pressure drag due to the engulfment was calculated from Equation (5) as
D ( t ) = 1 2 ρ w a t S W + S e ( t ) C D U 2
The variation in the engulfed water volume and mass during the opening of the mouth ( t ] T p , T p + T o ] ) were calculated as
V e ( t ) = V e , p t T p T o M e ( t ) = M e , p t T p T o
and during the closing of the mouth ( t ] T o , T e ] ):
V e ( t ) = V e ( T o + T p ) + V e , a t T o T p T c M e ( t ) = M e ( T o + T p ) + M e , a t T o T p T c
Finally, the buoyant force and weight were modified at each time step by changing the water mass in the body as
F g = ( M W + M e ) g
and,
F a = ρ w a t ( V W ( z ) + V e ) g
without changing the buoyancy nonetheless, since our conservative calculation ensures that M e ( t ) = ρ W V e ( t ) .
The third phase is the flushing of engulfed water (period of T f ). Water flushing was also quantified as a linear decrease in S e ( t ) , V e ( t ) and M e ( t ) during T f (in s), with t ] T e , T e + T f ] ):
S e ( t ) = S e ( T e ) S e ( T e ) t T e T f V e ( t ) = V e ( T e ) V e ( T e ) t T e T f M e ( t ) = M e ( T e ) M e ( T e ) t T e T f
The durations used in the simulations were T p = 8 s, T o = 2 s, T c = 2 s and T f = 14 s according to the estimates performed by Cade et al. [48] and Potvin et al. [23]. The time between two lunges was set at 45 s.

2.5. Oxygen Respiration and Energy Production

A minimal submodel describes the dynamics of oxygen consumption and energy production associated with the whale’s movements. The oxygen dynamics were adapted from Popel [49] and use 5 variables: the quantity of O 2 in the lung ( L O 2 ), the quantity of O 2 free in the blood ( B O 2 ), the quantity of O 2 bound to hemoglobin in the blood ( H O 2 ), the quantity of O 2 free in the muscle vessels ( R O 2 ) and the quantity of O 2 bound with myoglobin in the muscle ( G O 2 ).
The model is formulated as follows:
L ˙ O 2 = η O 2 ϕ L B L O 2 B ˙ O 2 = ϕ L B L O 2 μ B O 2 ϕ B R B O 2 k 1 B O 2 + k 2 H O 2 H ˙ O 2 = k 1 B O 2 k 2 H O 2 R ˙ O 2 = ϕ B R B O 2 κ O 2 R O 2 k 3 R O 2 + k 4 G O 2 G ˙ O 2 = k 3 R O 2 k 4 G O 2
where η O 2 , in m3 · s−1, is the breathing rate; κ O 2 , in s−1, is the standardized oxygen consumption rate by muscles (active metabolism); μ B O 2 , in m3 · s−1, is the oxygen consumption rate related to the basal metabolic rate; and ϕ L B and ϕ B R , both in s−1, are standardized transfer rates between the lung and blood and blood and muscles, respectively. k 1 and k 2 , and k 3 and k 4 , all in s−1, are standardized exchange rates between free and bound oxygen with hemoglobin and myoglobin, respectively [50].
Four parameters of the system (19), { η O 2 , κ O 2 , ϕ L B , ϕ B R } , were estimated at equilibrium, assuming that the processes they control are much faster than the changes in environmental and physiological conditions. The breathing rate, η O 2 , depends on the vertical position of the whale individual in the water column:
η O 2 [ z 0 ] = ( μ B O 2 + μ A O 2 ) η O 2 [ z < 0 ] = 0.0
where μ B O 2 is the oxygen consumption corresponding to the basal metabolic rate and μ A O 2 = κ O 2 R O 2 is the oxygen consumption corresponding to the active metabolism. This implies that at the surface, the breathing rate converges to a value such that B O 2 = B O 2 and is adjusted according to the basal and active metabolic requirements.
Conversely, when an individual starts to dive, the organism closes its blowholes to prevent water from entering the respiratory system. It appears to be a passive process of muscle relaxation and is considered in our model as a reflex, implicitly mediated by the tri-geminal facial sensory system [51]. When returning to the surface, a similar, but reversed, reflex provokes the contraction of muscles to open the nostrils and restart breathing. During the dive recovery period, it was assumed that temporarily high oxygen exchange rates between compartments are forced until equilibrium is reached again, even if the active metabolism μ A O 2 is at a minimum to ensure that the organism is resting.
The rest of the parameters are only constrained by the energy requirements and capacities of the compartments:
ϕ L B = μ B O 2 + μ A O 2 L O 2 ϕ B R = μ A O 2 B O 2 κ O 2 = μ A O 2 R O 2
The parameters L O 2 , B O 2 and R O 2 quantify the lung, blood and muscle compartment capacities, respectively, and are calculated as
L O 2 = ω L V L B O 2 = ω B V B 0 R O 2 = ω R M R
where V B 0 is the volume of oxygenated blood, in m3; M R is the muscular mass, in kg; and ω L (dimensionless), ω B (dimensionless) and ω R (dimensionless) are the conversion factors for the maximum oxygen content of the lung, blood and muscle compartments, respectively.
The quantity of oxygen consumed by the organism (with rates μ B O 2 and μ A O 2 = k O 2 R O 2 ) fulfilled the basal metabolism and was transformed into energy by the conversion factor = 21,100 J·L(O2)−1. The active metabolic energy was transformed into a mechanical force using the following relationship:
F W = ( ϵ κ O 2 R O 2 21 , 100 ) 2 / 3
where the parameter ϵ combines efficiency rates to convert metabolic energy to mechanical energy and mechanical energy to propulsion or mechanical force [52,53].

2.6. Perceptron Algorithm

To integrate physiological limits into the dives, the volume of oxygen at the moment the dive starts was calculated as V O ( 0 ) = L O 2 ( 0 ) + B O 2 ( 0 ) + H O 2 ( 0 ) + R O 2 ( 0 ) + G O 2 ( 0 ) . Considering that the force produced, F W , is constant (and hence the active metabolic rate, μ A O 2 , is also constant), the function linking V O ( 0 ) and the time duration underwater T d , and the distance d 0 covered at velocity u ¯ , can be expressed as follows:
V O ( 0 ) = μ B O 2 + μ A O 2 T d = μ B O 2 + μ A O 2 d 0 u ¯
The diving constraint, K, is applicable at any time during the dive as a condition to ensure that the individual returns to the surface:
K = V O ( t ) μ B O 2 + μ A O 2 d t u ¯ 0
where V O ( t ) is the remaining oxygen content, d t is the distance to cover to reach the surface and u ¯ is the average swimming velocity.
It is unrealistic to consider that K is being ‘calculated’ (i.e., μ A O 2 and u ¯ are adjusted to ensure reaching the surface) by a whale while diving. A more probable assumption is that the individual perceives a set of changing sensations (or an informational landscape) about the remaining oxygen available, the distance to reach the surface based on the distance already covered and the average velocity at which it can travel to reach the surface or the averaged effort it has to produce. A neural network algorithm (MLP, multi-layer perceptron [54]) was used to link this set of information to the decision to swim back to the surface. An artificial neural network can be partially conceived as mimicking a nervous system stimulated by received information to produce corresponding responses. We hypothesized that virtual whales can process information about their velocity (relative to an optimal velocity u ¯ o p t , which would minimize the effort to produce), the distance (depth) to return directly to the surface relative to the distance already covered at the past-averaged velocity (i.e., the time already spent under water) and sense the relative quantity of oxygen remaining. Hence, the multi-layer perceptron inputs were defined on [ 0 , 1 ] 3 as
x 1 = V O ( t ) / V O ( 0 ) x 2 = d t / ( d t + d b a c k ) x 3 = u ¯ / u ¯ o p t e 1 u ¯ / u ¯ o p t
where d t is the shortest distance that separates the whale from the surface at time t and d b a c k is the distance that the whale individual has covered underwater before time t. The average optimal velocity, u ¯ o p t , maximizes the distance of the whale individuals swimming while in apnea. In other words, the whale is assumed to perceive its current velocity, sensing whether it swims too slow or too fast, to be able to return to the surface at optimal velocity.
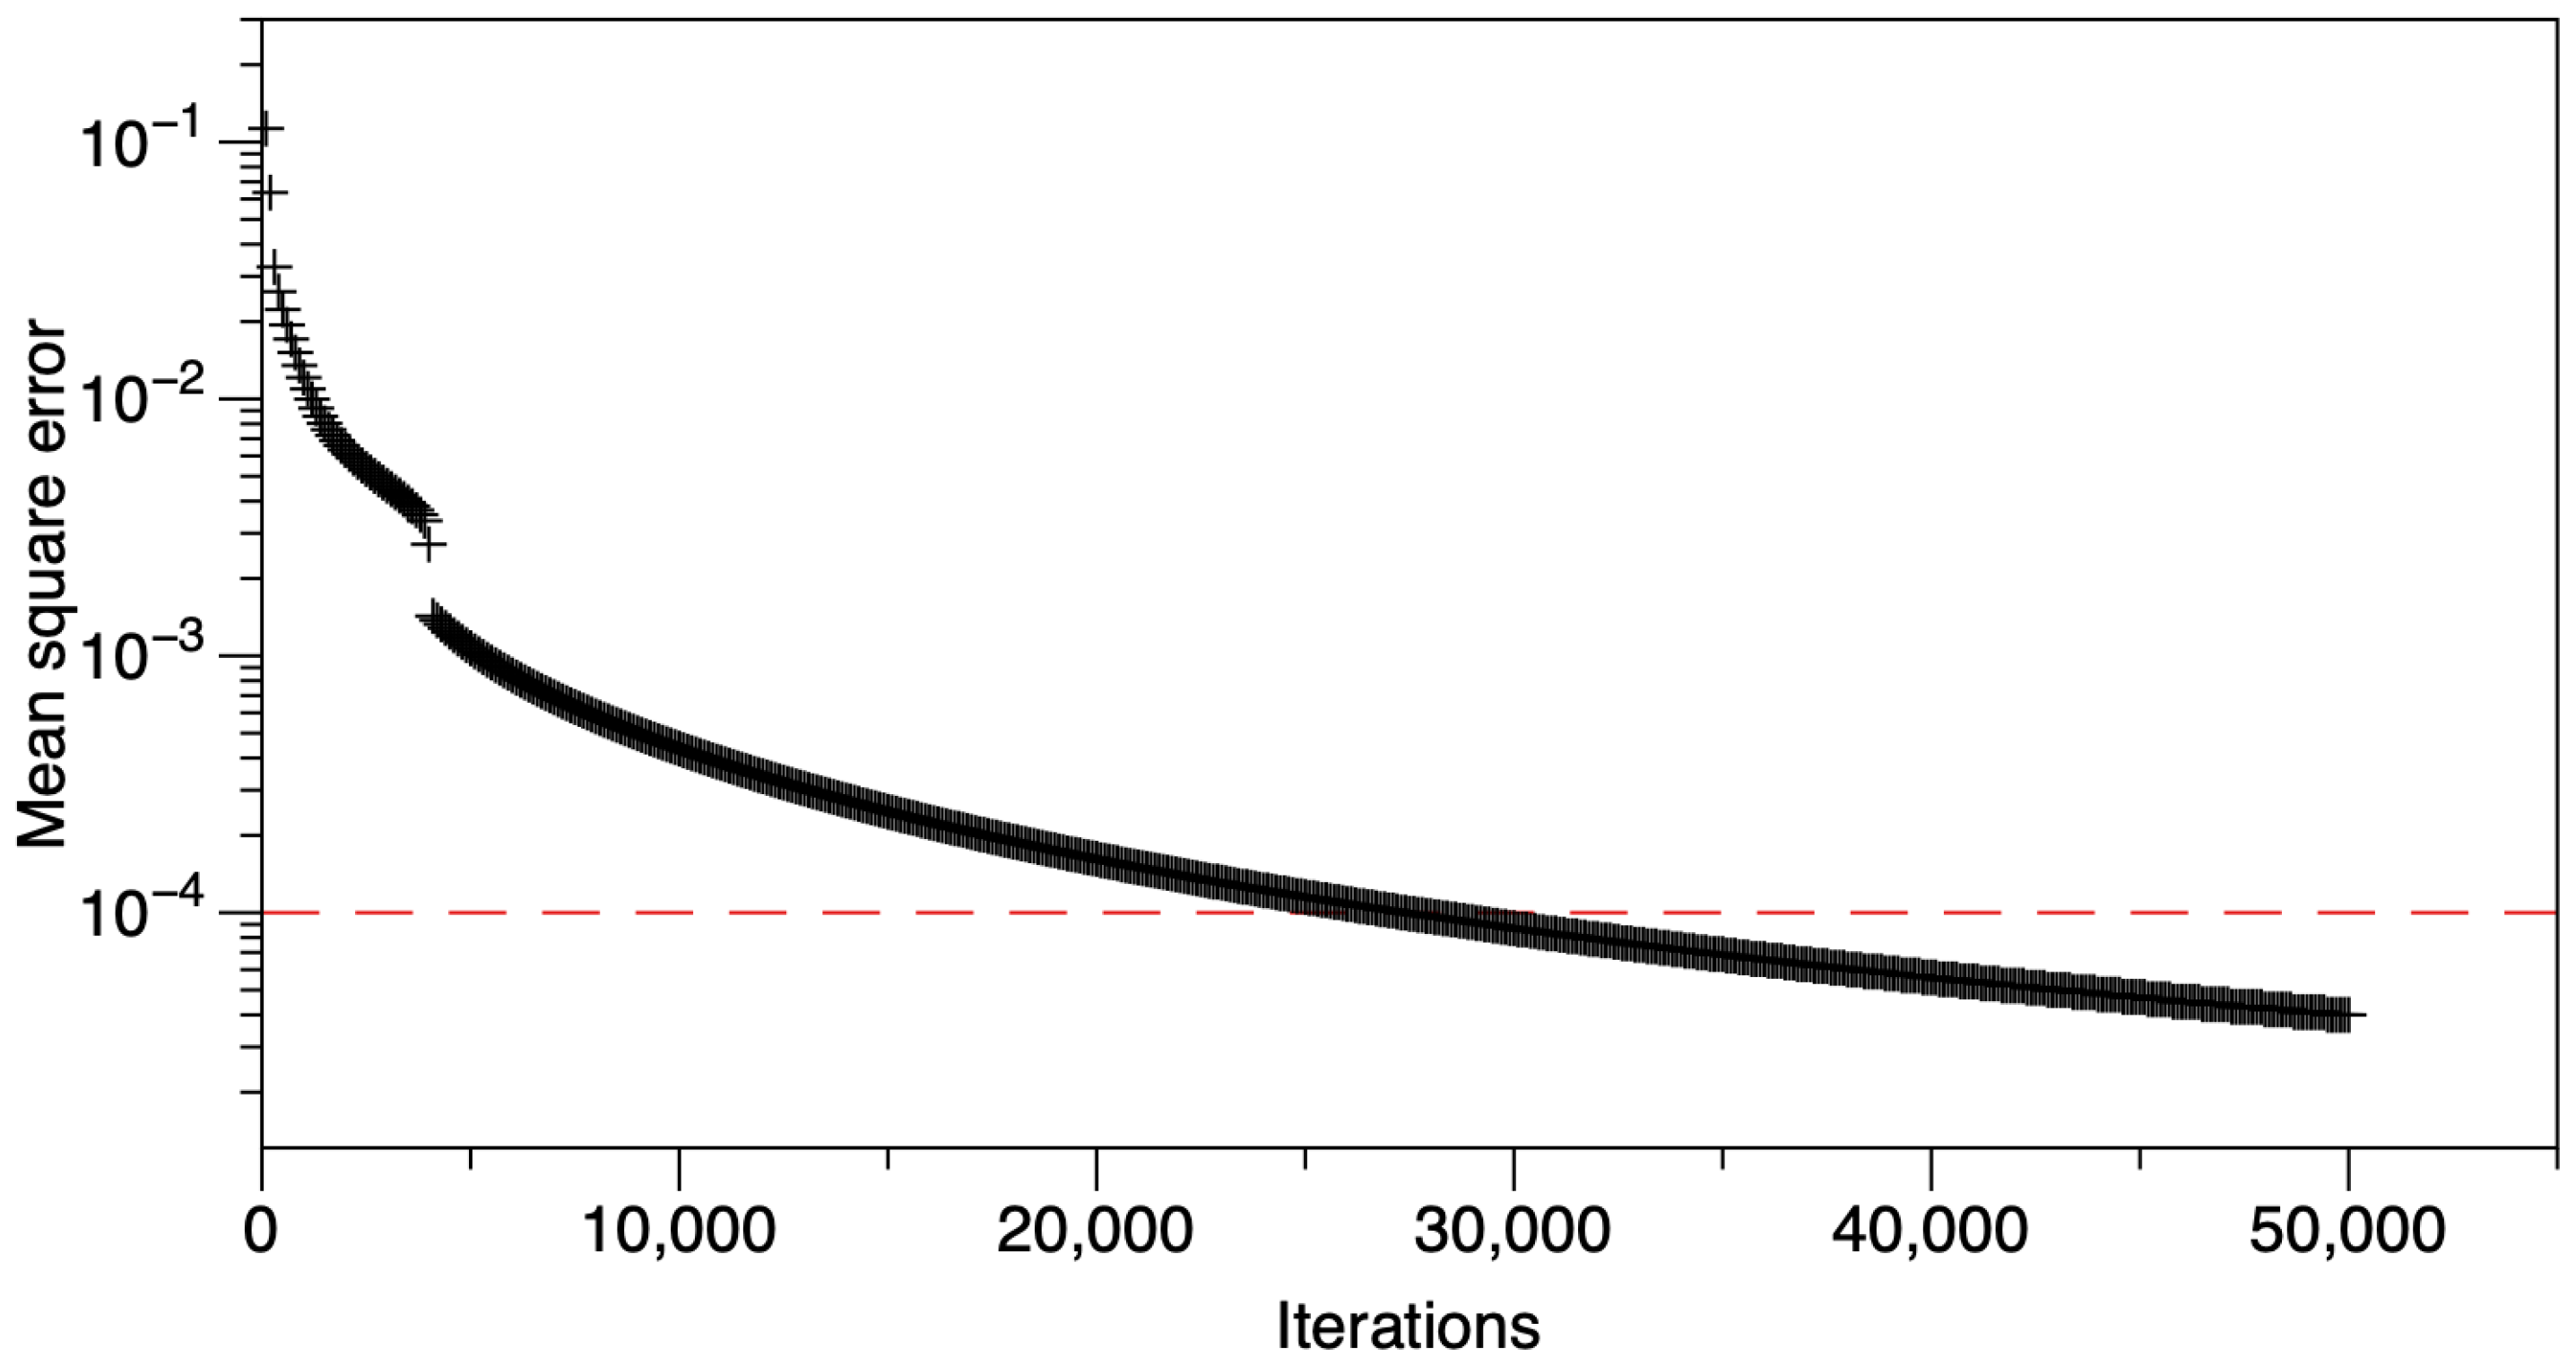
The multi-layer perceptron architecture is based on three layers with 6 and 4 units for the two hidden layers, respectively. A logistic, sigmoid function was used as the activation function. The learning algorithm, aiming at identifying weights and biases, was a forward-backward propagation algorithm minimizing the difference between the calculated output and the calculated index using a gradient method. The learning rate was set at 0.02 . The network weights and biases were initialized optimally using a normal Xavier initialization [55]. The output was defined on { 0 , 1 } and was compared with the calculated index y = 0.5 ( K + | K | ) / K . The criteria function (the mean squared differences between the calculated output and the calculated index) was monitored and the convergence (i.e., decrease in the mean squared differences) was ensured when the tolerance threshold equal to 10 4 was reached, within a maximum of 50,000 iterations.
Once back at the surface, the reversed transition between apnea and air breathing was designed as a double reflex. As soon as z 0 , then ν O 2 and all the other rates that transfer oxygen from lungs to the storage compartments in blood and muscles increase, while the metabolic activity rate decreases to a minimum resting value. The index remains equal to zero until all the oxygen compartments are replenished (then, the index resets to one) and the virtual whale is ready to dive again.
Computer codes were developed using Scilab (Scilab Version 2025.0.0) Dassault Systèmes (https://www.scilab.org (accessed on 22 May 2025)). Figures 2 and 5 were generated from the Scilab simulation results using ImageTank (build date: 9 May 2025), from Visual Data Tools, Inc., Chapel Hill, NC, USA (https://www.visualdatatools.com/ImageTank/ (accessed on 23 May 2025)). Figures 4, 6 and 7 were generated from the Scilab simulation results using DataGraph (Version 5.4) from Visual Data Tools, Inc. (https://www.visualdatatools.com/DataGraph/ (accessed on 22 June 2025)).

3. Simulations

In this section we present the results of our tests with the model under different conditions. The tested scenarios simulated the dynamics of a 10,000 kg individual. The general properties cover whale sizes ranging from 1000 to 50,000 kg, which includes the estimated mass of a humpback whale calf at birth up to the maximum mass estimated from the longest humpback whale reported in the literature [41]. Detailed results of the scenarios discussed in the sections below are plotted in Appendix B.

3.1. Swimming at the Surface

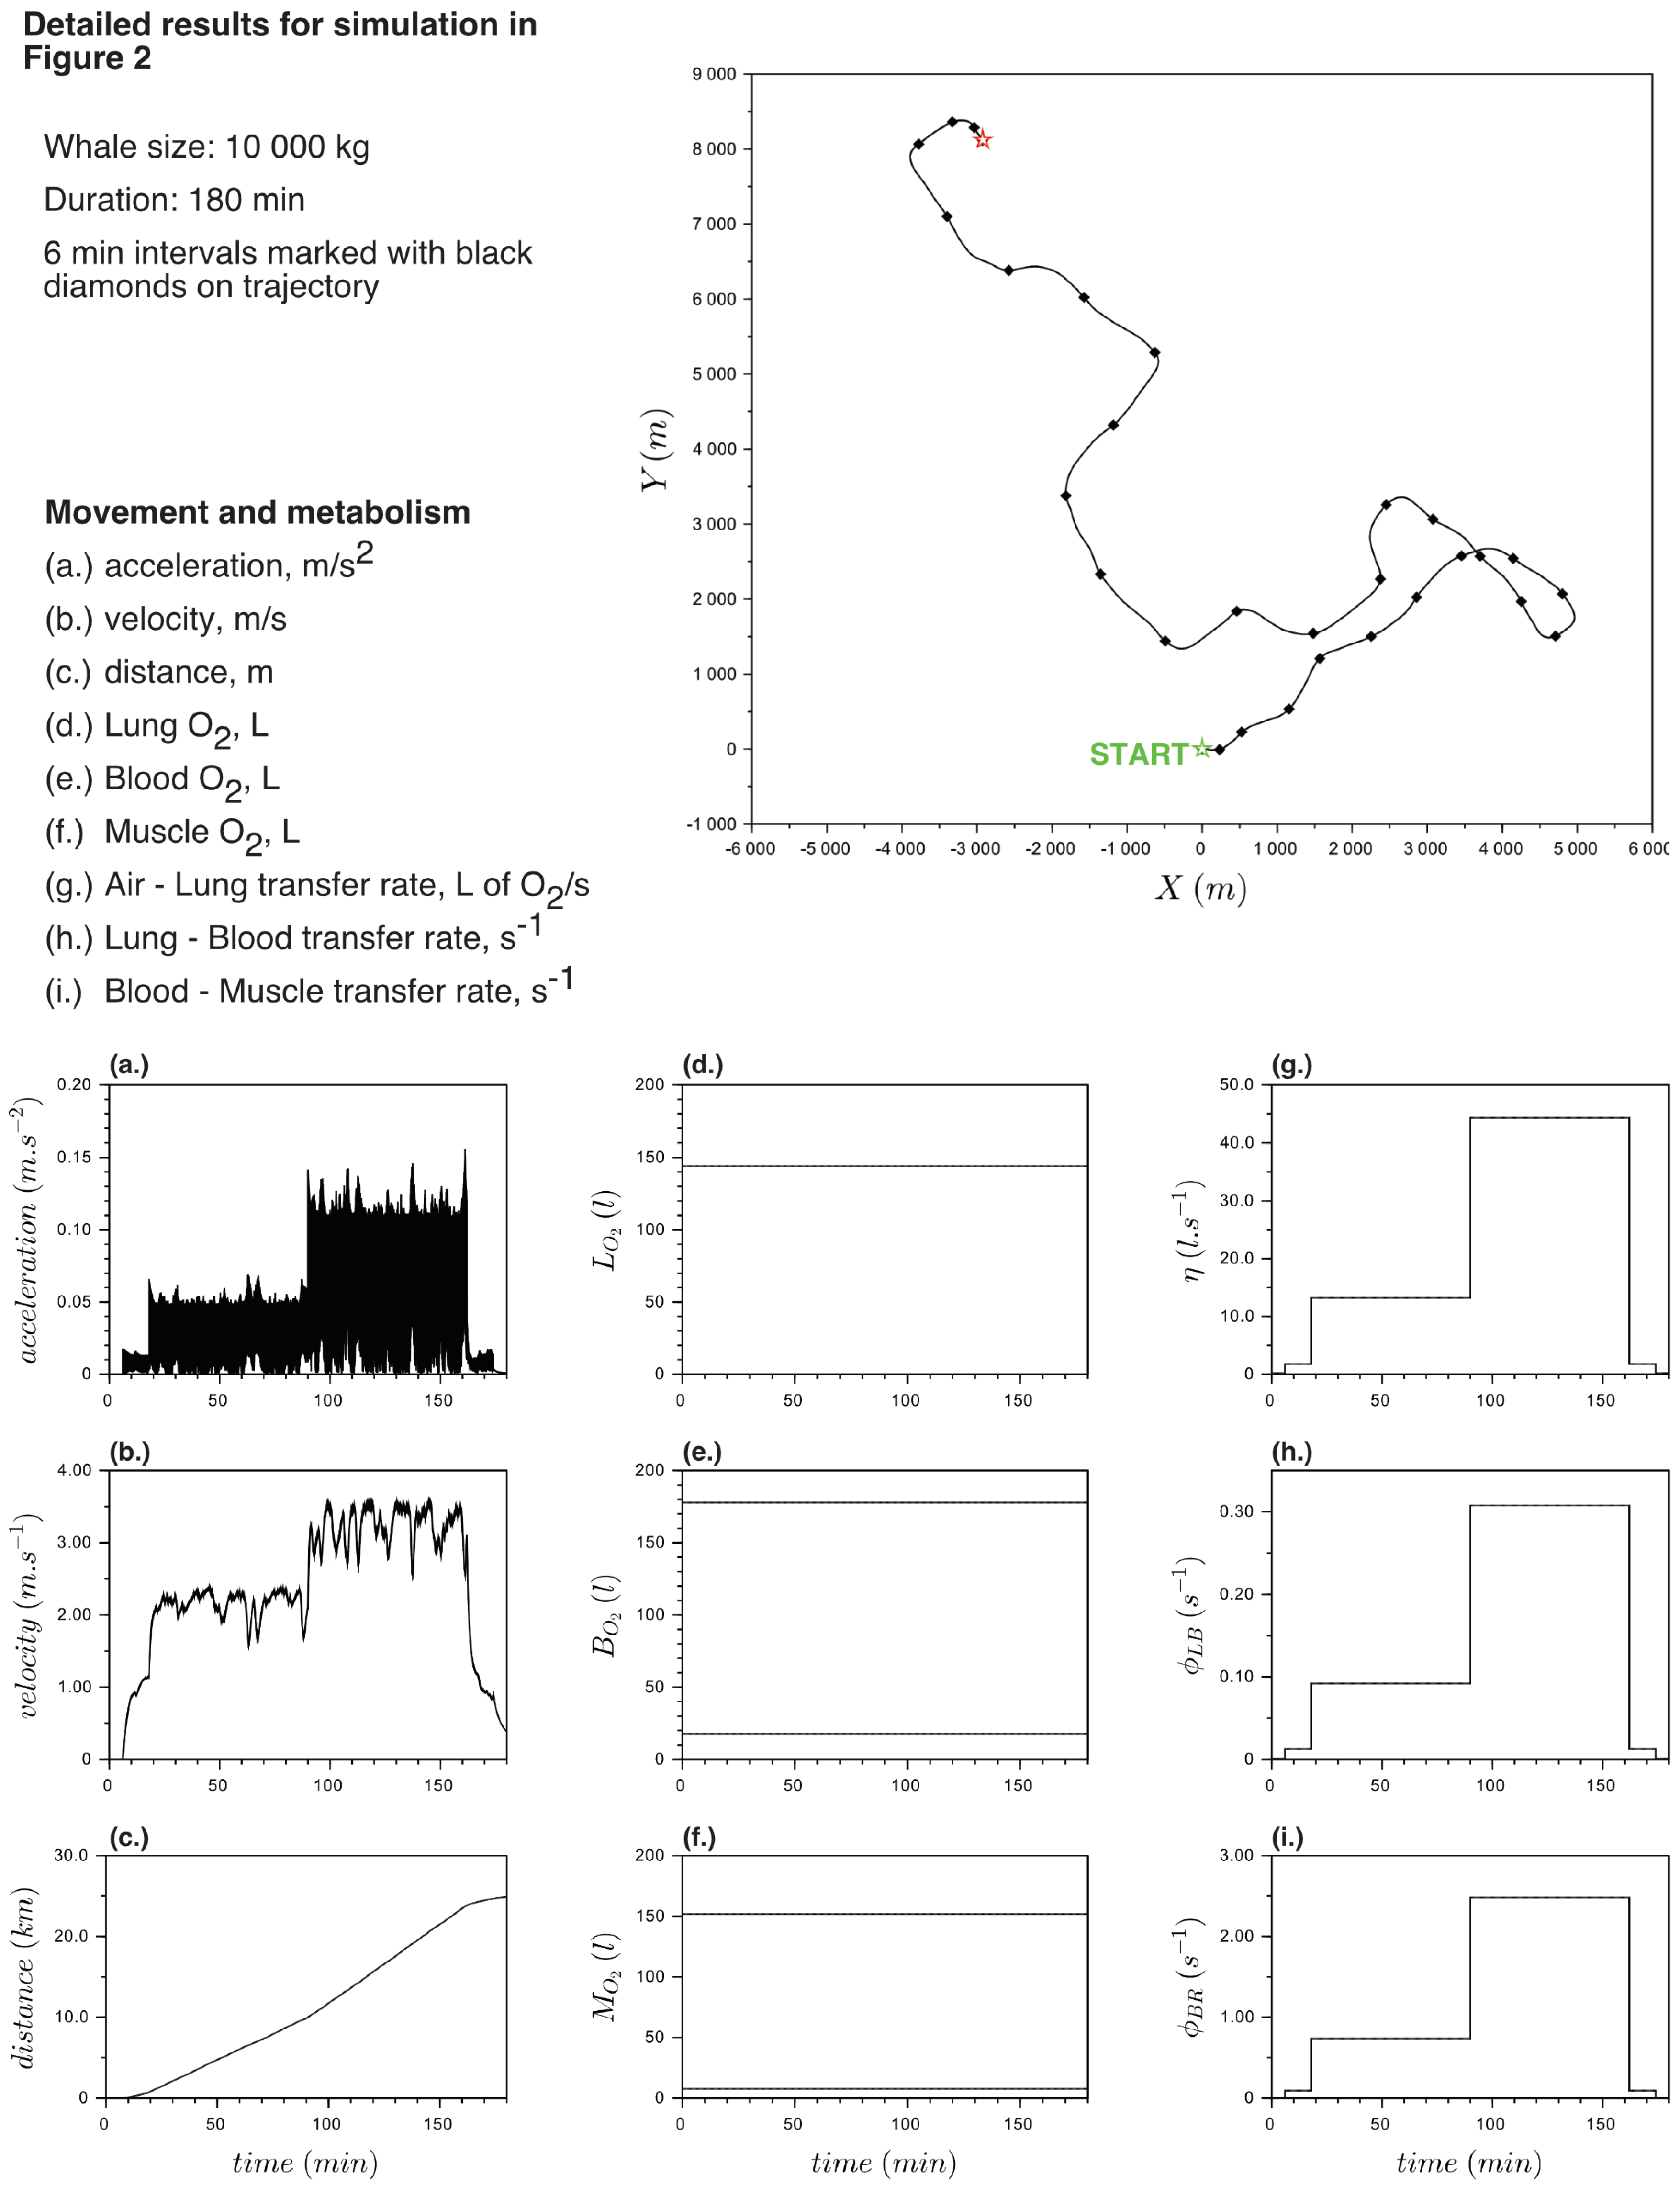
When individuals swim at the surface, all their oxygen compartments are supposed to be at equilibrium. This implies that all oxygen compartments remain saturated and all rates vary instantaneously when activity changes at the scale of the dynamics. Figure 2 shows results for a 10,000 kg whale swimming randomly at the surface with a stepwise increasing and decreasing speed (between 0 and 3 m·s−1). This scenario simulated a random surface exploration interval of 180 min in a feeding ground; the individual heading variability is simulated using a Wiener process. In the example shown, the results confirm that the oxygen contents remain constant (Figure 2a) even while movement rates changed instantaneously at the simulation variation scale (time step is 0.1 s) as muscular and propulsion forces vary (Figure 2b).
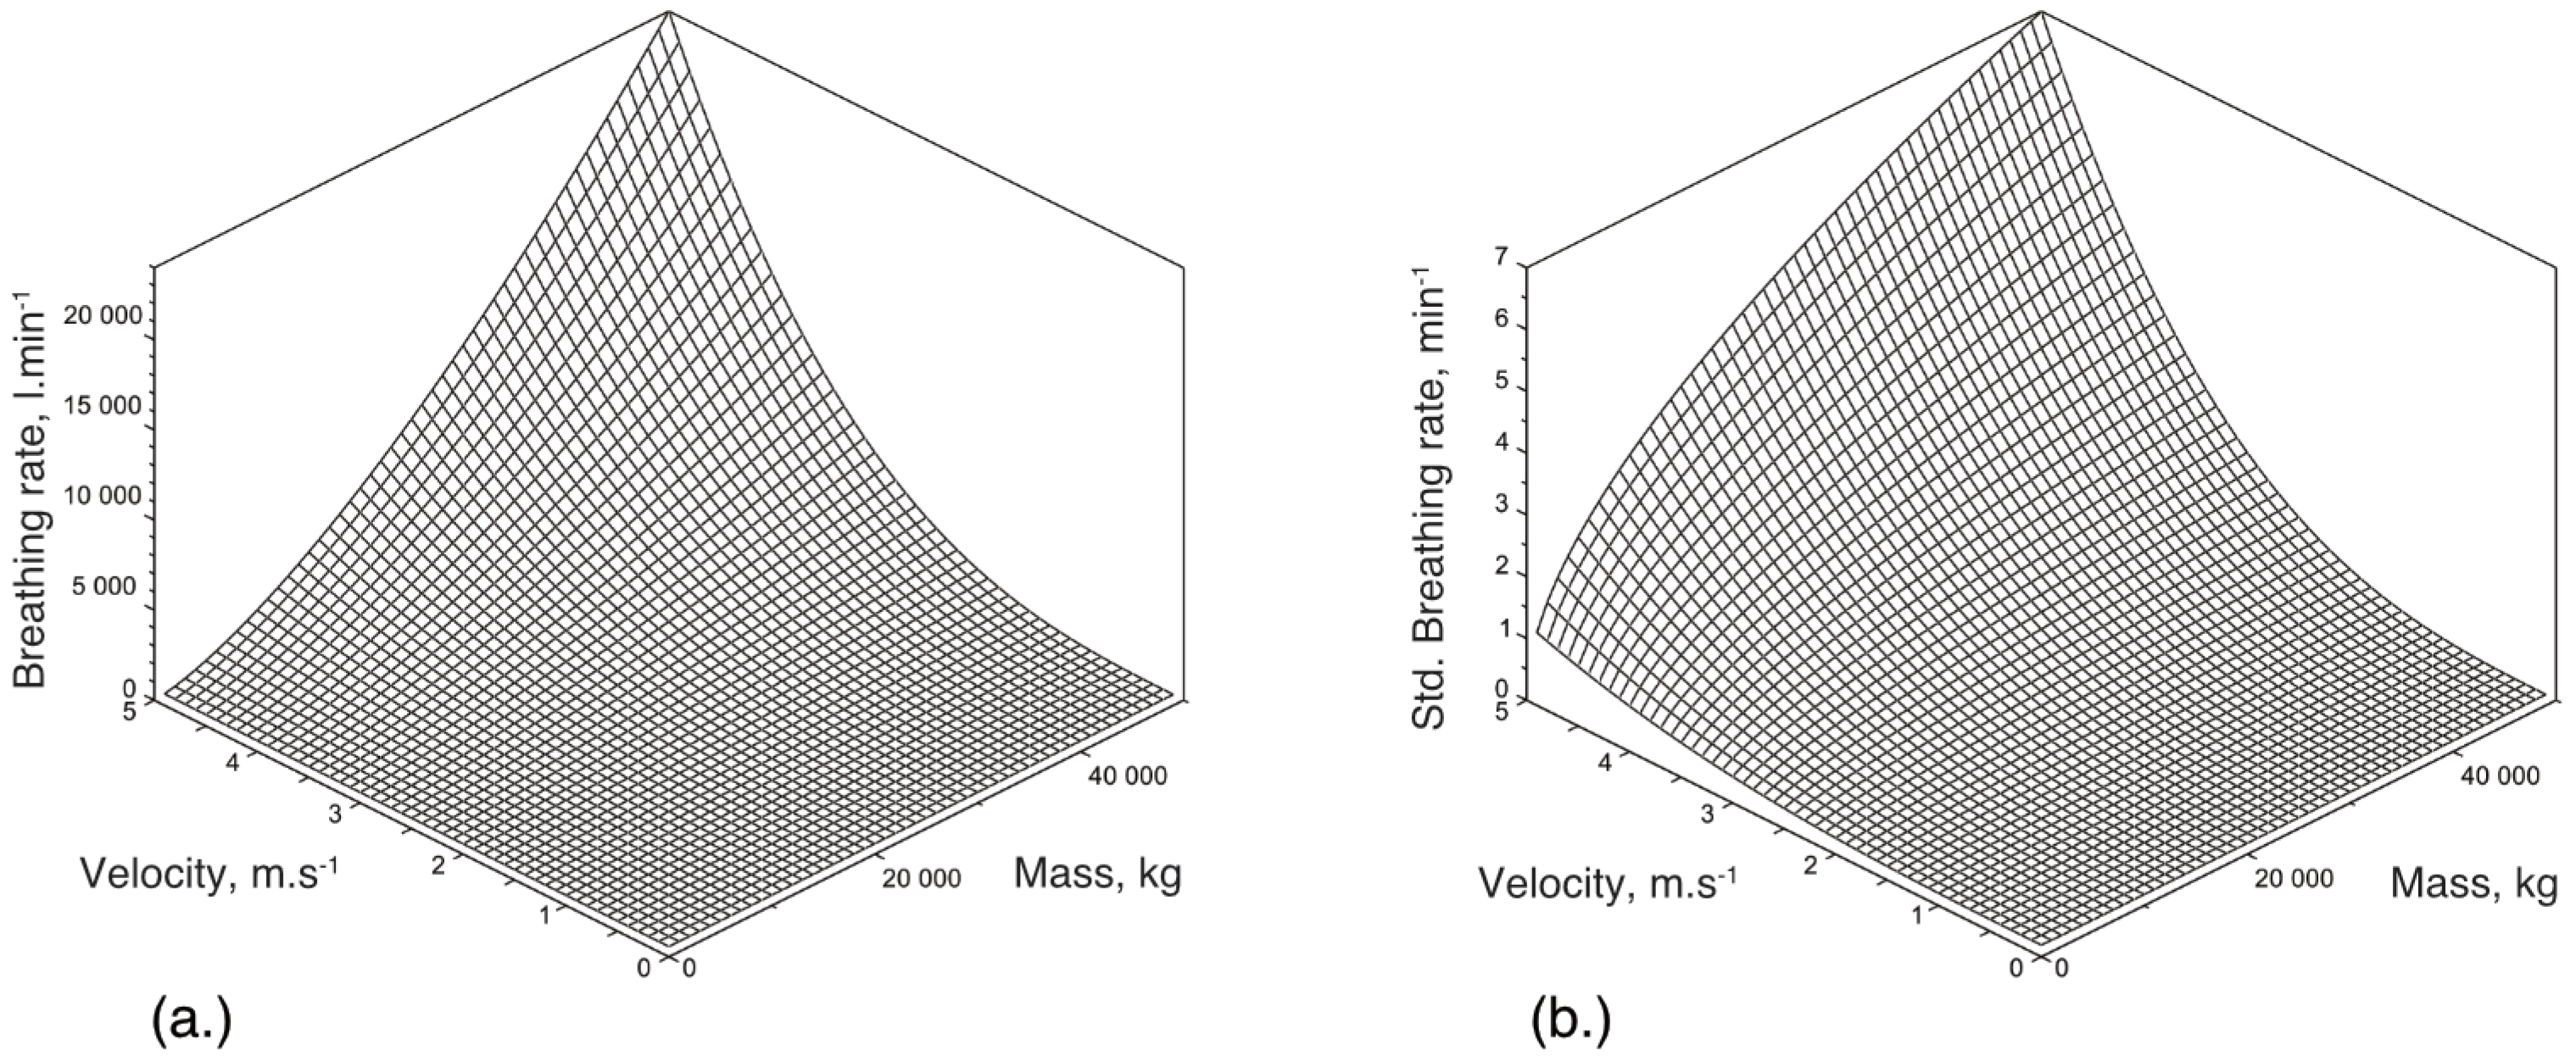
In the model, the muscular force produced was computed as a function of the mass of the individual and the average velocity reached at steady state during surface swimming (See Appendix B, Figure A1, for details). The velocities ranged between 0 and 5 m·s−1 for the mass range tested, from 1000 to 50,000 kg. The muscular force necessary to achieve a velocity increases monotonically with mass and velocity but at different rates. Force increases quadratically with velocity, while it increases linearly with mass. The maximum force, developed for a 50,000 kg whale to reach 5 m·s−1, was estimated as 14,820 (kg·m)·s−2.
The force to accelerate the mass at a certain velocity has a physiological cost. To quantify this cost, the breathing rate and the standardized breathing rate were computed as a function of the mass and velocity in the same ranges as defined previously. It increases geometrically with velocity but linearly with mass. The maximum reached for a 50,000 kg whale to achieve a steady velocity, equal in average to 5 m·s−1, was estimated to be 21,480 L O 2 ·min−1. When standardized to the total lung capacity, the breathing rate represents the frequency to take a breath. The distribution according to mass and velocity is characterized by a slightly different pattern, varying exponentially as a function of the velocity but logarithmically as a function of the mass (See Appendix B, Figure A2, for details). The maximum value of this frequency, reached when individuals swam at an average steady velocity of 5.0 m·s−1 and for a 50,000 kg individual, was 7.0 min−1.

3.2. The Physiological Limits of Humpback Whale Dives

In Houston and Carbone [15] as in Tyson et al. [16], dives are characterized by only two primary estimators: the duration of the dive (split into a travel and foraging time) and the optimal depth at which whales forage underwater in apnea, regardless of the distance they actually cover. In our model, distance covered matters: whales can vary their underwater velocities as well as their descending or ascending angle. They can also perform a complex trajectory (e.g., spiraling down or up). This has strong implications not only when comparing the optimal foraging depth and depth at which patches of prey are observed but also when estimating whales’ active metabolic rates. It is a marked difference in our approach from the optimal diving strategy analyses.
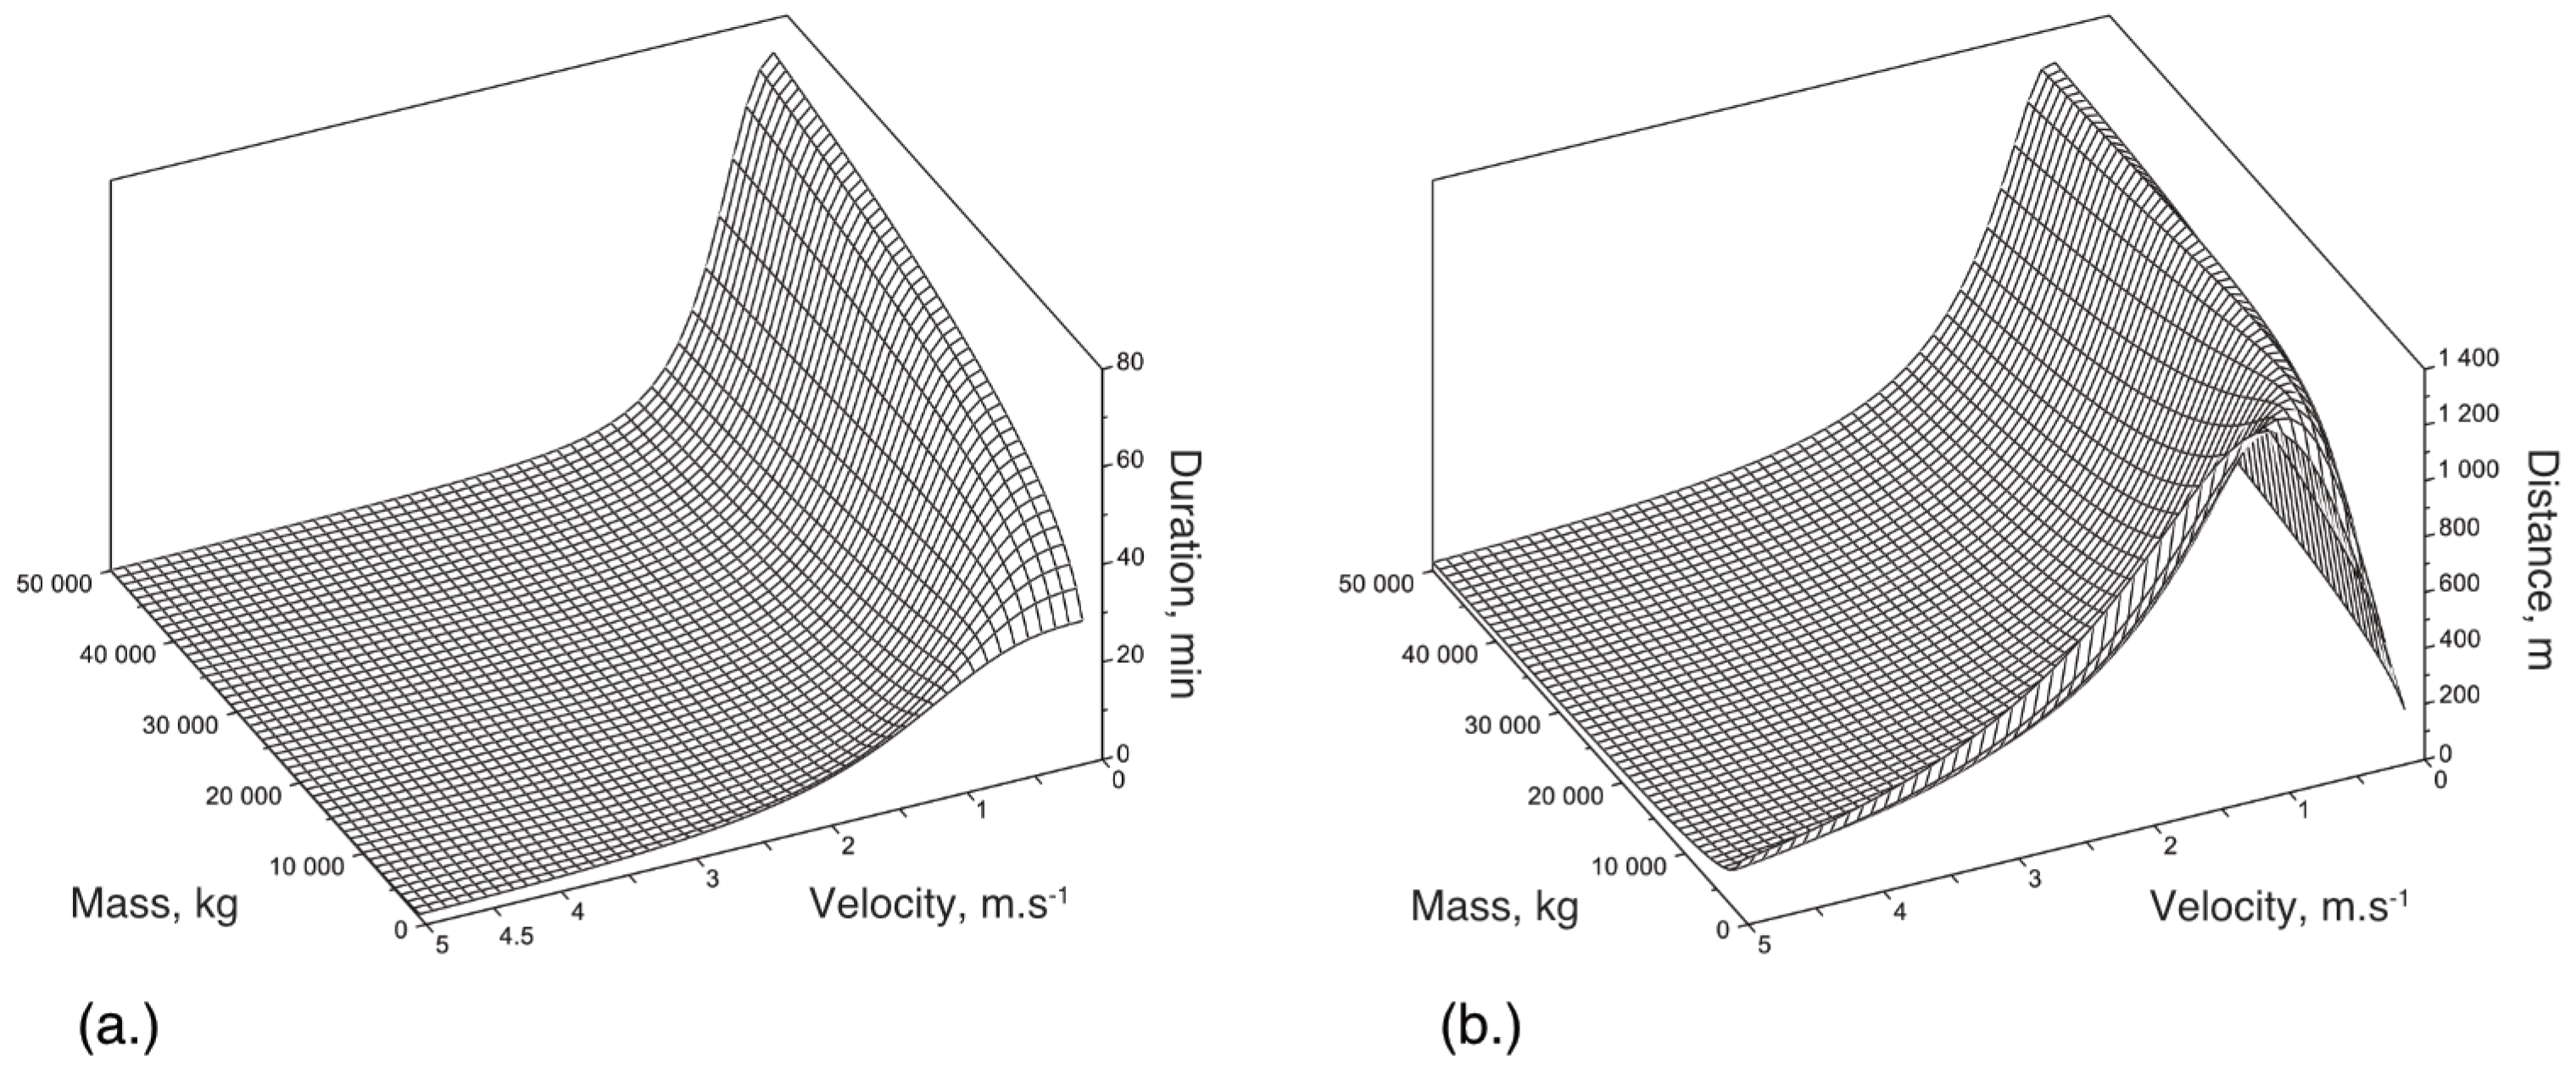
To compare our simulations and the optimal approach, we expressed the dive as the amount of oxygen available in the lungs at the dive start and the rate of activity during the dive (Equation (24)). What we were interested in determining was a maximum time underwater that could be spent by the individual whale, whether or not this individual chooses to stay submerged for that interval. Furthermore, accounting for an average velocity at which the whale swims underwater in apnea, the maximum time underwater can be converted to a maximum distance covered (Equation (24)).
Figure 3a shows that the maximum duration of the dive decreases monotonically with increasing velocity. The calculated maximum duration underwater for a calf (1000 kg) is about 29 min, while for the largest individuals (50,000 kg), the maximum duration would be about 77 min. The distance, however, has a maximum at a particular optimal velocity. Below the optimal velocity, the distance decreases down to 0 because of the basal metabolism consumption rate μ B O 2 . Above the optimal velocity, the distance decreases down to 0 because of the active metabolism consumption rate μ A O 2 . This optimal velocity, u ¯ , is estimated numerically as between 1.10 and 1.30 m·s−1 for a 1000 kg individual, decreasing to only between 0.40 and 0.60 m·s−1 for a 50,000 kg. The analytical values were obtained by solving the following function:
V O ( 0 ) u ¯ ( μ B O 2 + μ A O 2 ) 1 u ¯ = 0
which leads to
u ¯ = μ B O 2 2 ( 0.5 C D S W ρ w a t ) 3 / 2 π 3 / 2 ( ϵ 21,100 ) 1
which does not depend on V O ( 0 ) but only on μ B O 2 and μ A O 2 . The results indicated that the optimal velocity would be 1.17 m·s−1 for a 1000 kg individual that can then travel 1350 m underwater. This value decreases monotonically to 0.47 m·s−1 for a 50,000 kg individual that can then travel at this optimal velocity for the same distance (1350 m) underwater.

3.3. Diving Limitations, Perception and Decision Autonomy

Equations (24) and (25) were used to define the constraint to return to the surface for any time t during the dive. This constraint then constitutes a limitation of the dive with the constraint to reach the surface before all oxygen is exhausted. Combining the results of the calculation of u ¯ (Equation (28)) with Equation (26) (i.e., u ¯ estimates u o p t ) allowed for the calculation of the ultimate limitation of the dive, since the straight-line distance to reach the surface is maximized and cannot be exceeded.
The multi-layer perceptron (MLP) was trained at the beginning of each simulation and typically achieved convergence before the maximum of 50,000 iterations (Figure 4). In cases where the convergence tolerance threshold was not reached before 50,000 iterations, the simulation was aborted, assuming that the convergence problem was due to a lack of optimization of the initial weights and biases.
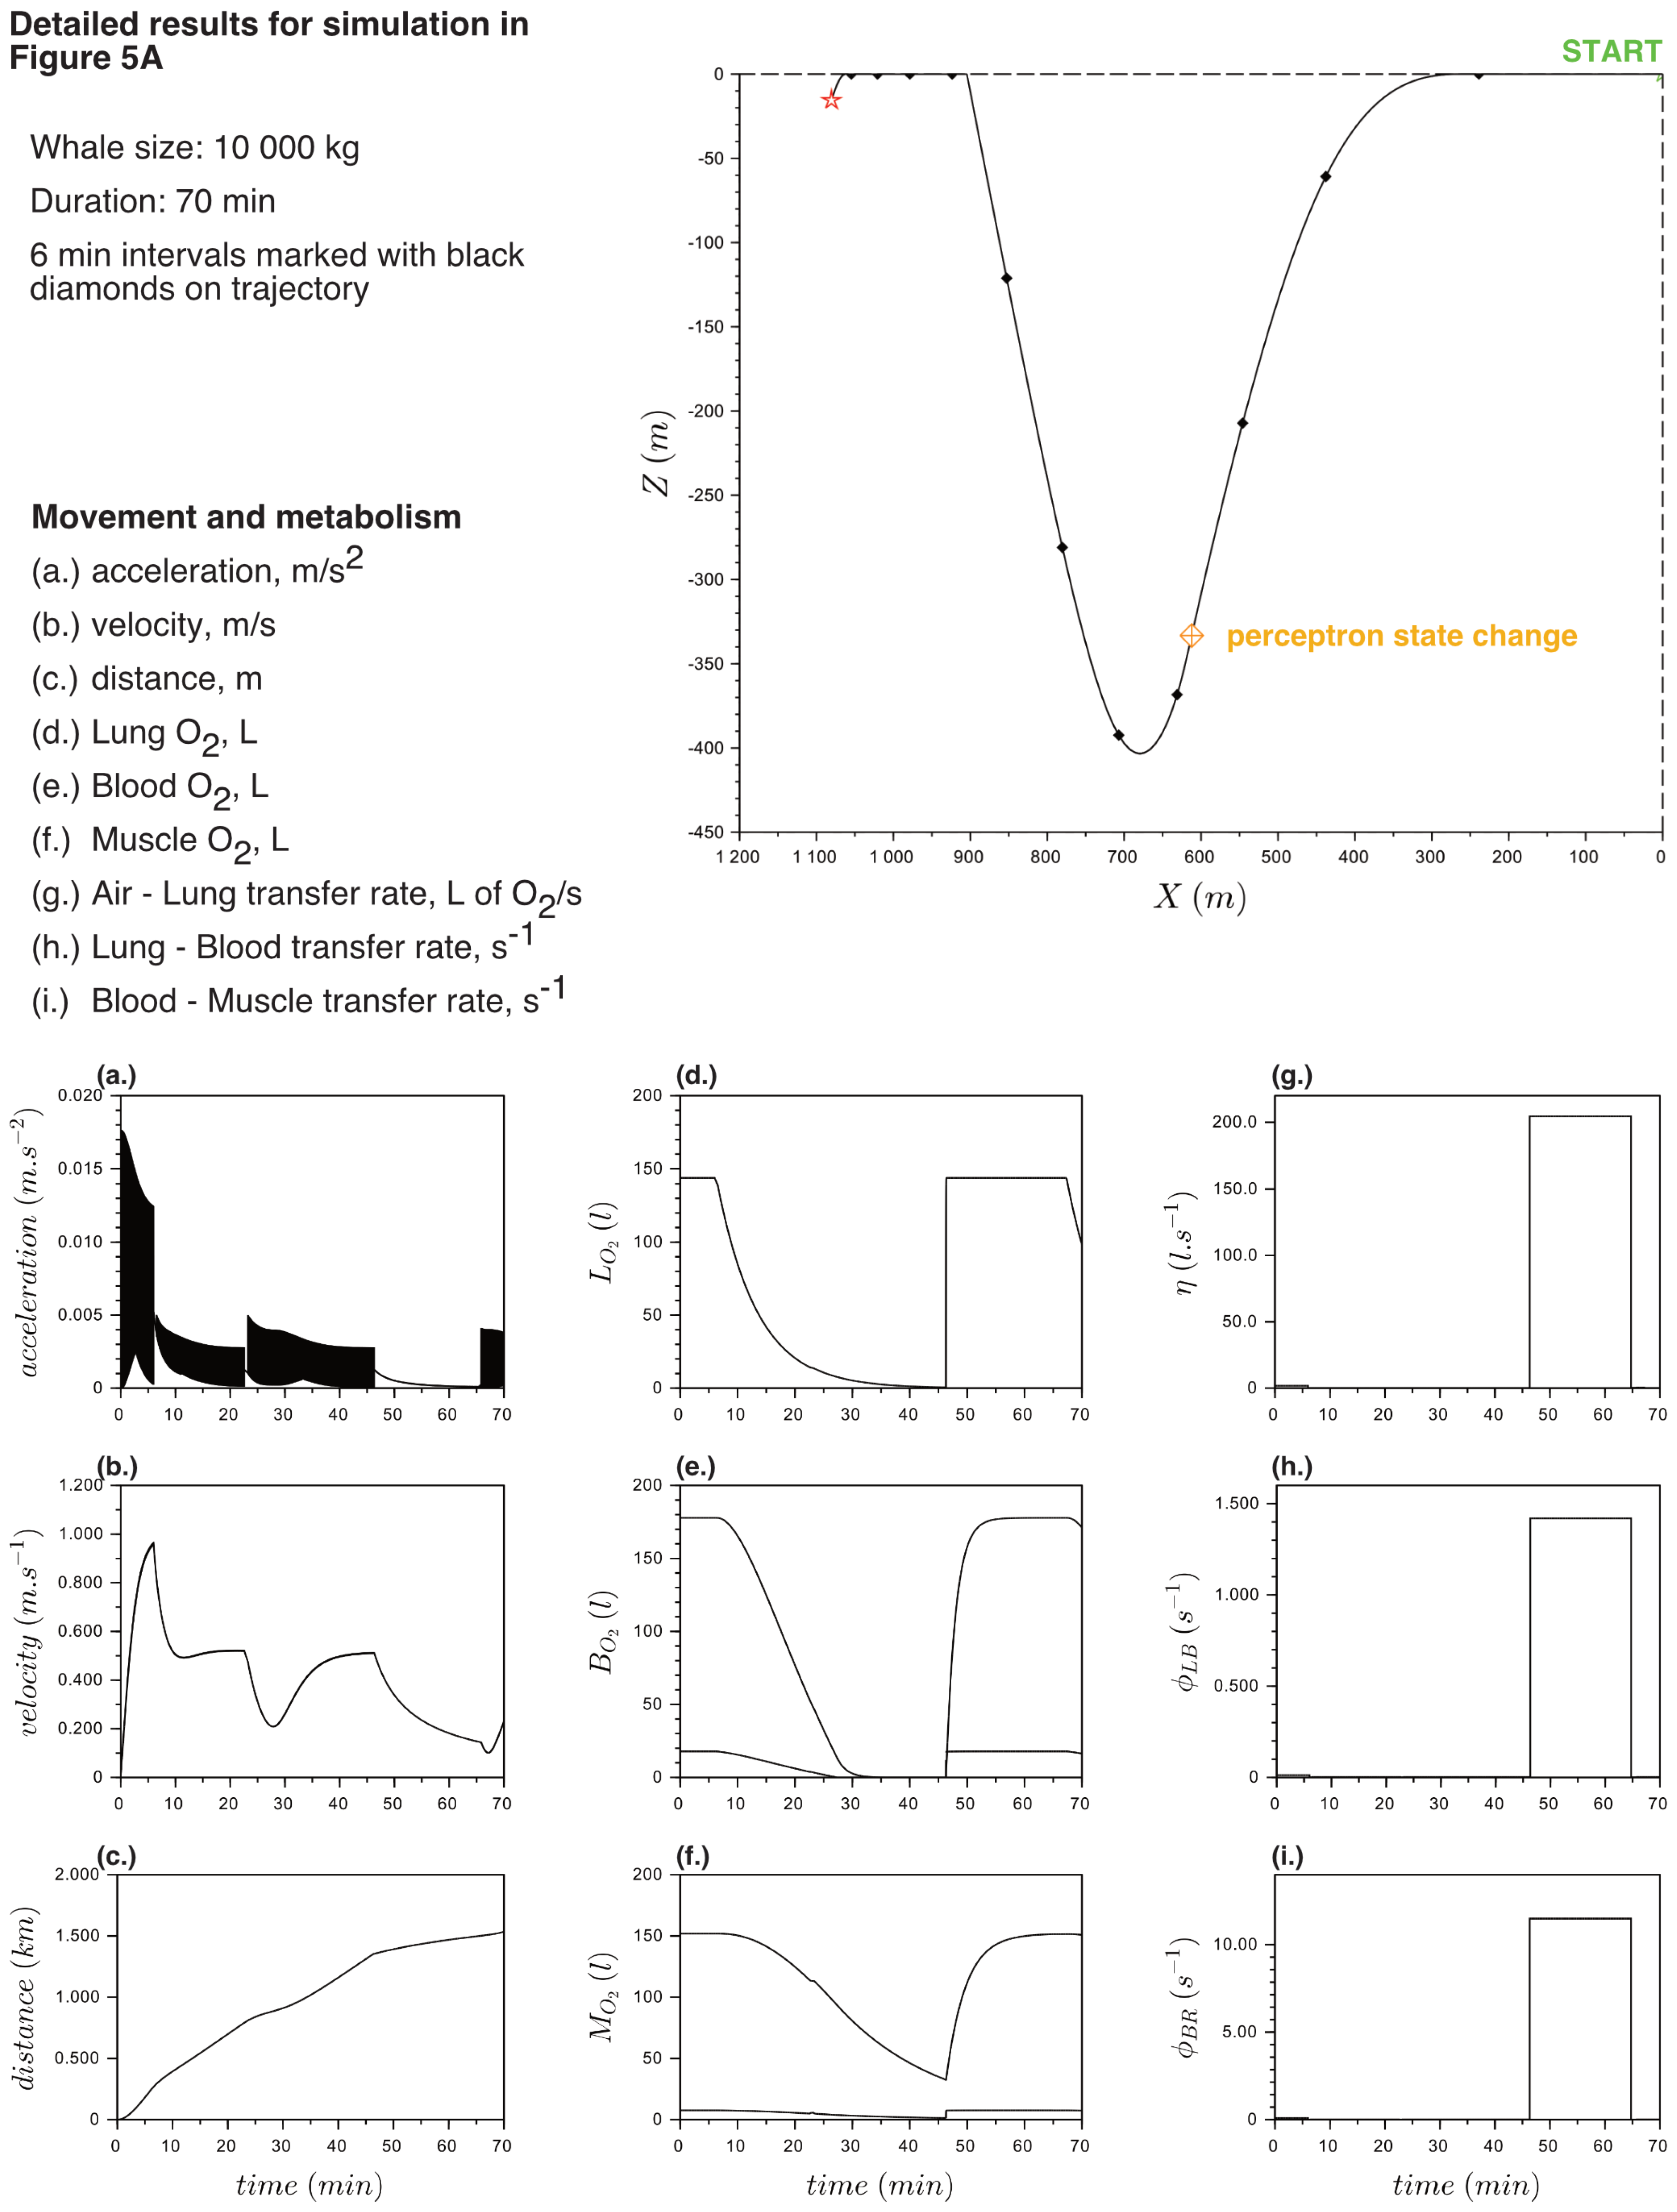
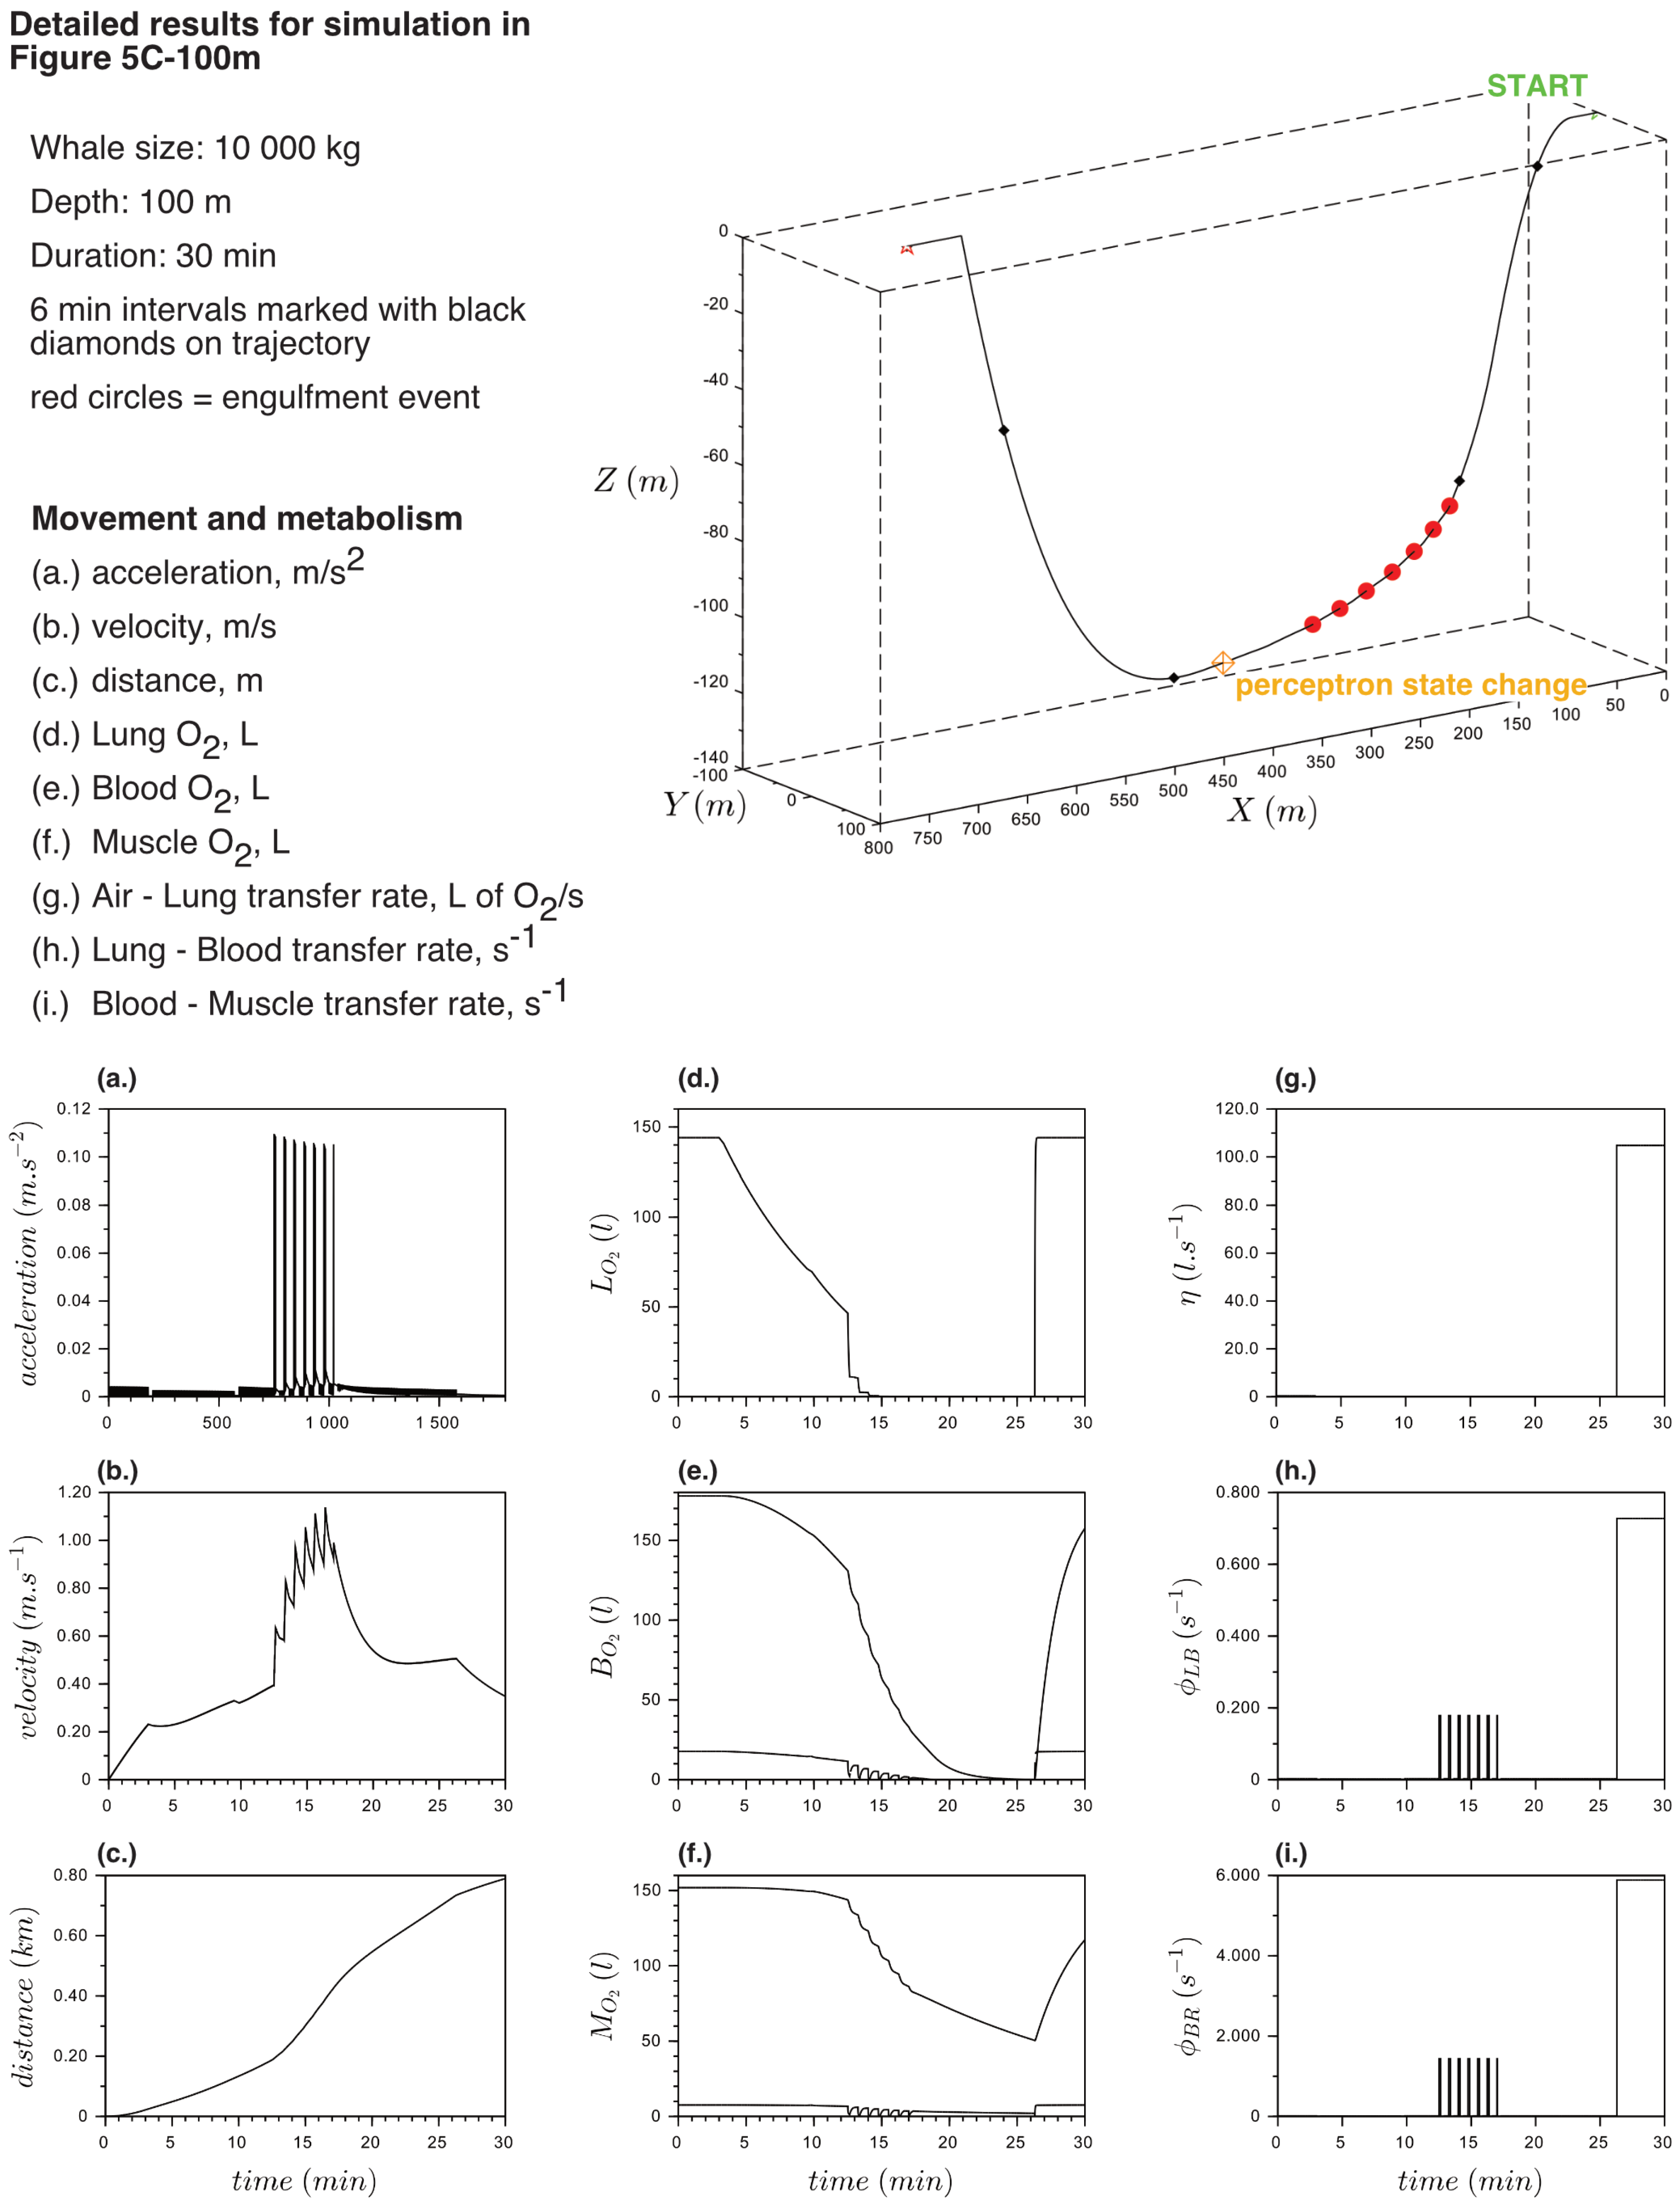
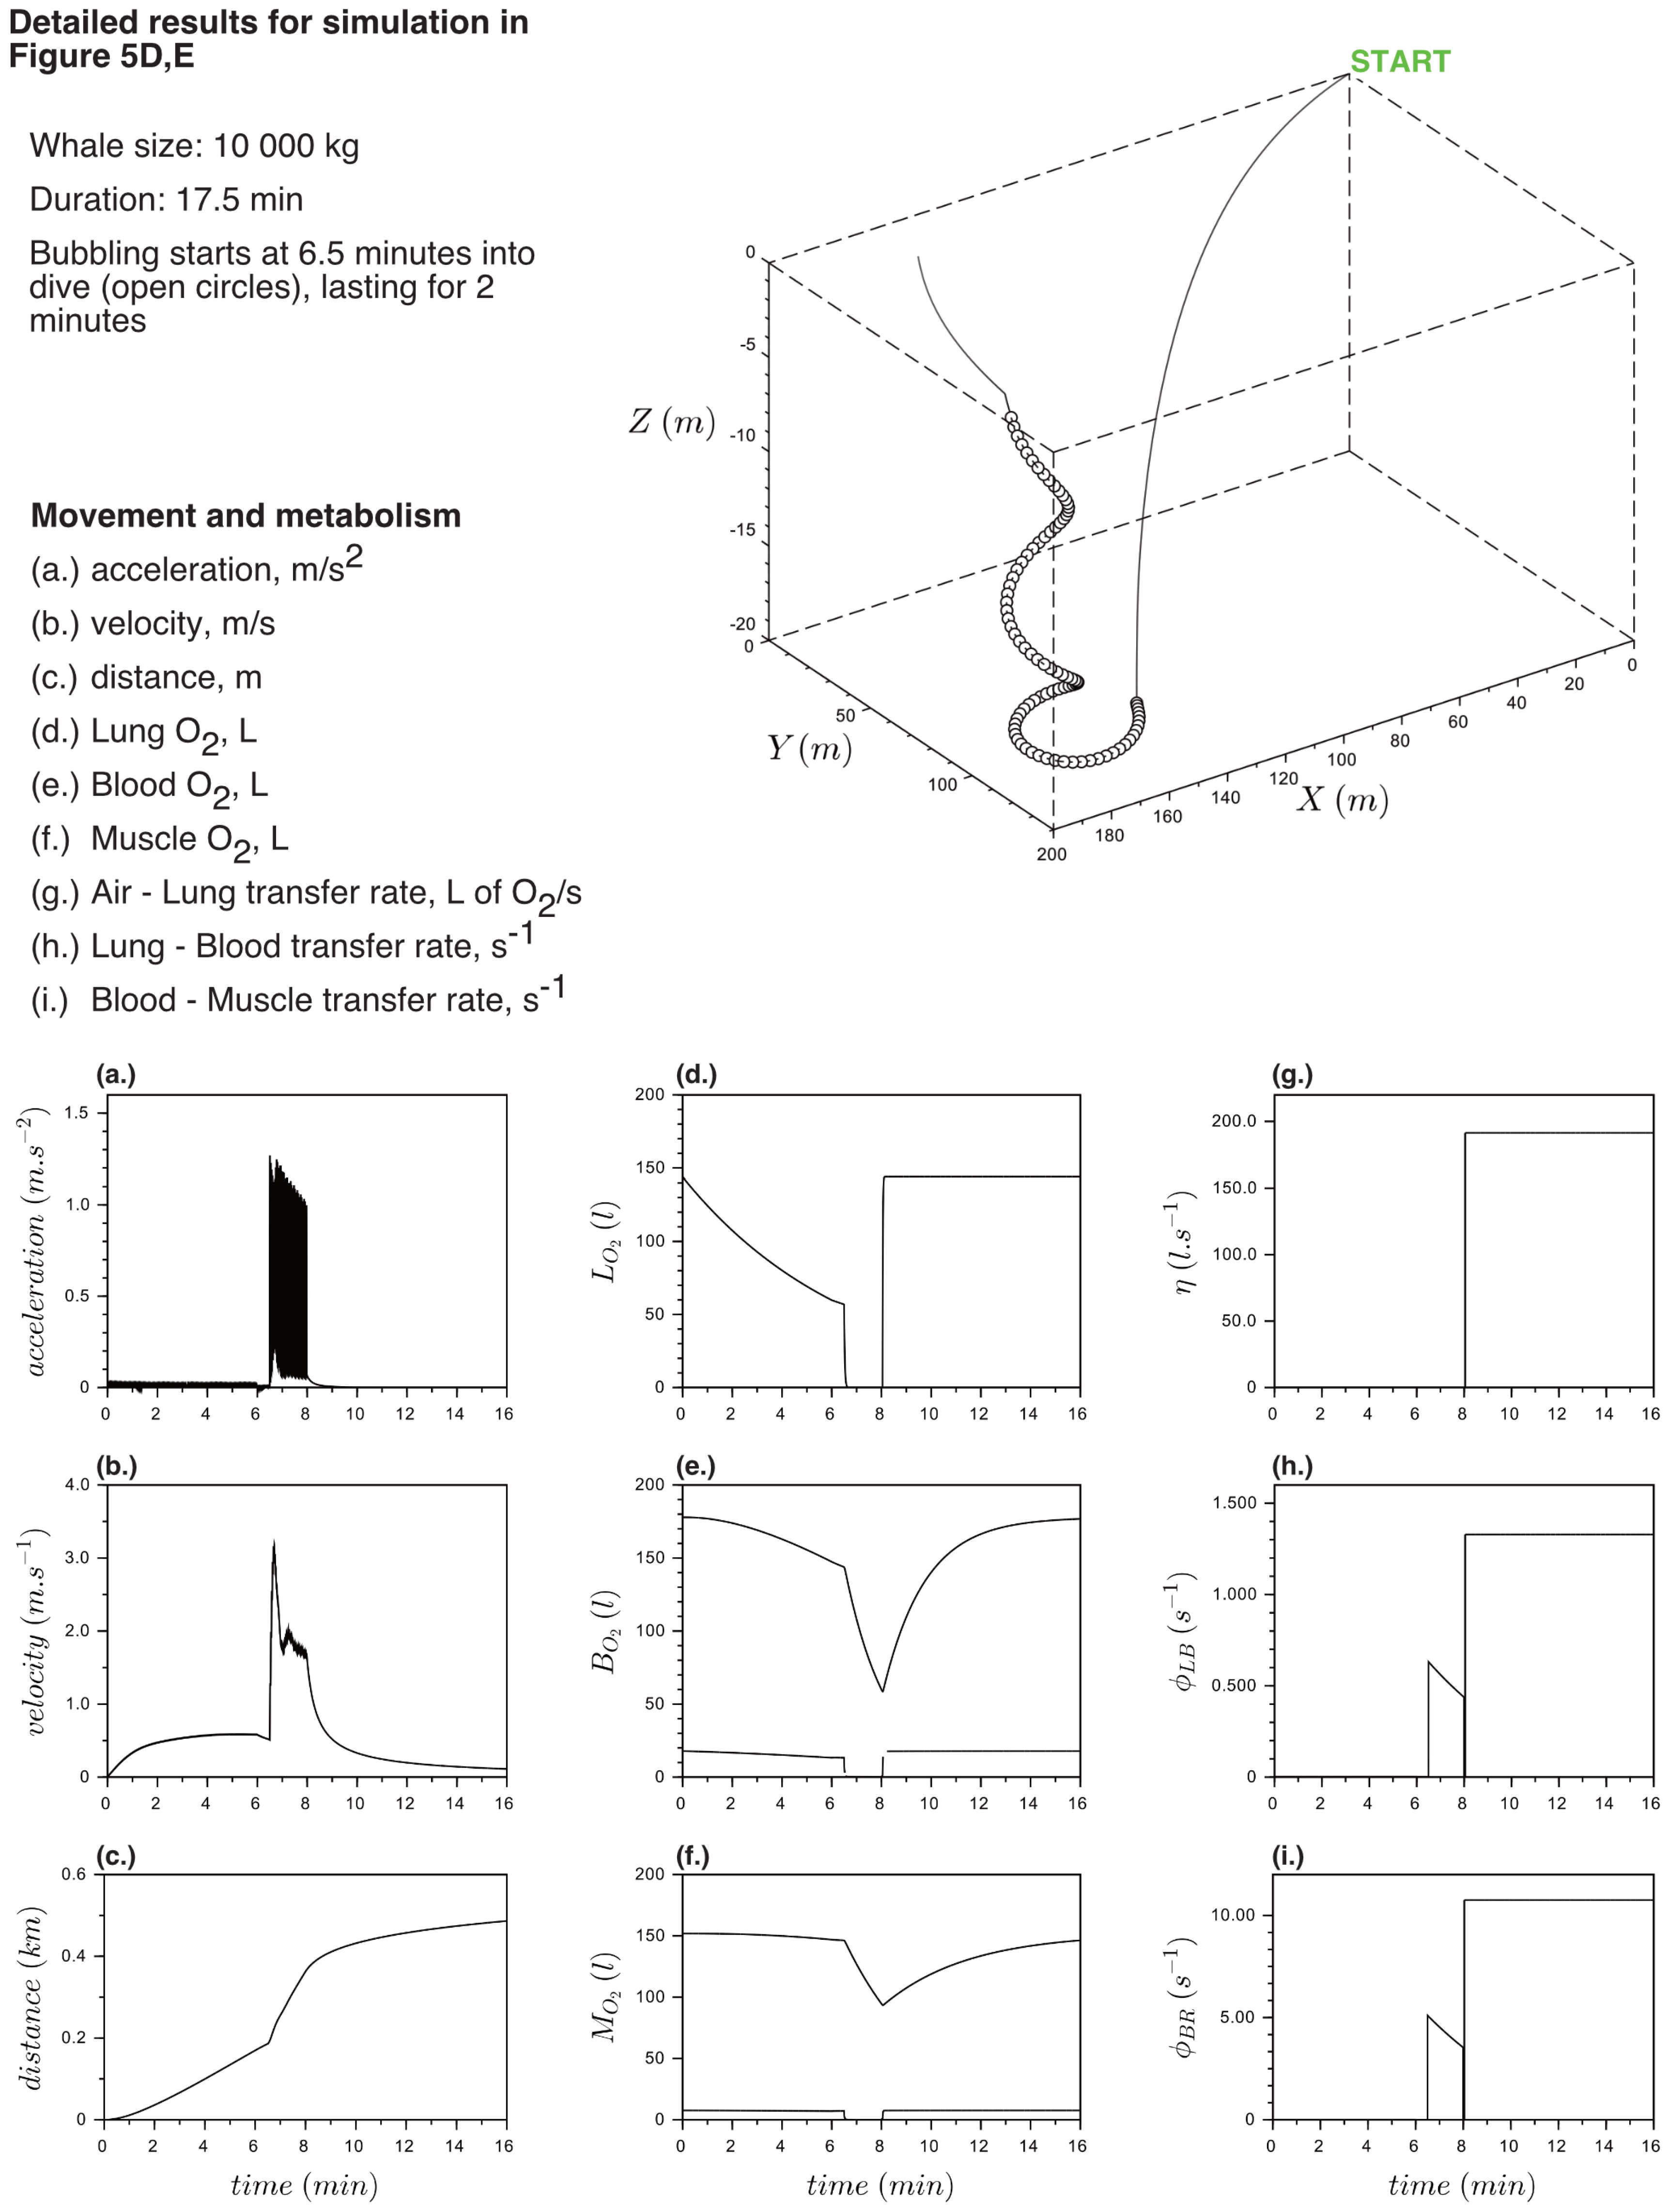
Once the multi-layer perceptron was initialized, the dive status of the whale was set to ‘on’ (output value is 1) and remained in this status until the perceptron switches it to ‘off’ (output value is 0). In the plots of Figure 5, the moment the perceptron is activated is indicated by the perceptron symbol placed on the dive trajectory (conversely, if the perceptron is not used, there is no symbol, e.g., Figure 5d,e). The whale dives directly downward (Figure 5a), with a maximum descent angle equal to 80 deg. and a maximum velocity of about 0.5 m·s−1, reaching −400 m before returning to the surface (maximum ascent angle equal to 80 deg., at optimal velocity) when the end of the dive is triggered by the change in state in the MLP output. At the end of the dive, after the individual reaches the surface, breathing restarts. Individuals remain in a resting, recovery mode (i.e., small swimming effort, hence low velocity). To speed up the replenishment of oxygen reserves and return to equilibrium states (as formulated in Equations (20)–(22)), the model allows for rapid breathing and oxygen transfer rates until recovery is complete. Then, the breathing rates decrease back to resting values. The recovery time to reach full oxygen capacity for the next dive was estimated at about 18 min for the simulation shown in Figure 5a. To simulate several diving cycles, the state of the MLP resets to 1 after full oxygen capacity is restored, such that a new dive can be initiated (Figure 5a,b).
A more complex dive trajectory was also simulated (Figure 5b). This dive starts as a downward spiral, with a descending angle equal to about 5 deg. and a velocity close to the optimal value. The virtual whale reached about 107 m depth, before returning to the surface, after the dive end was triggered by the change in state in the MLP output.

3.4. Exploring the Physiological Costs of Foraging Dives: Engulfment Events and Bubble Net Feeding

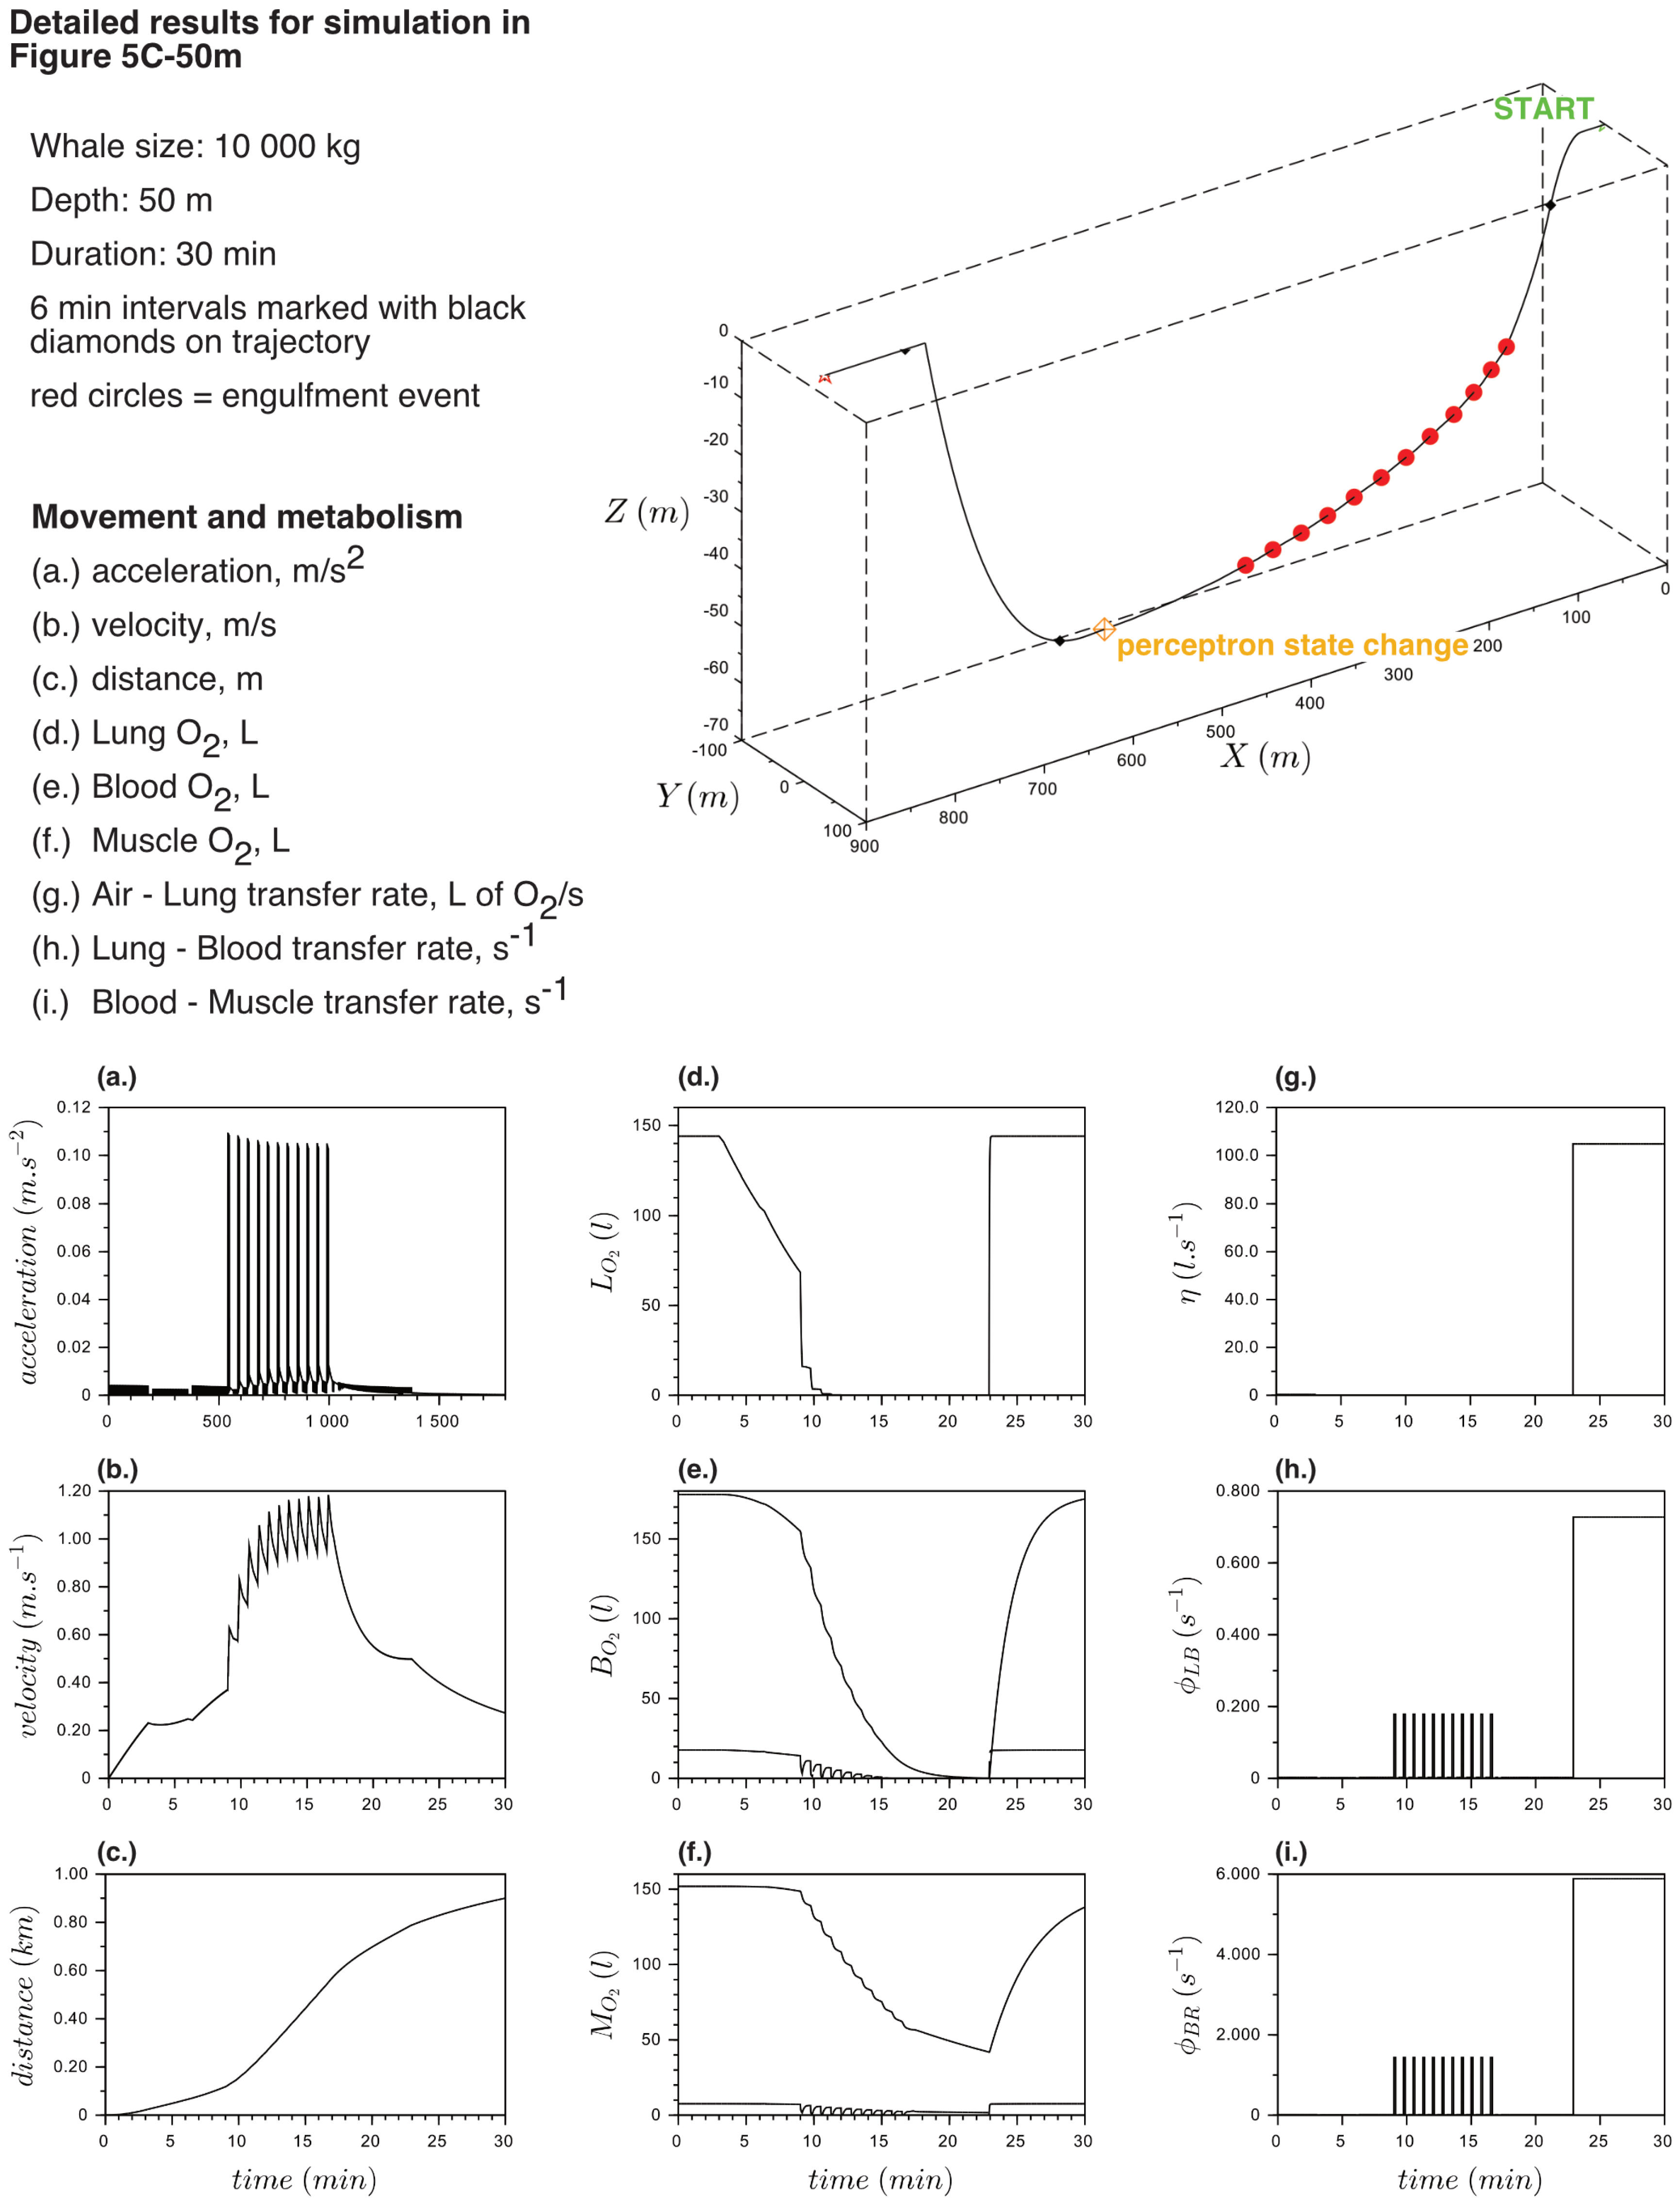
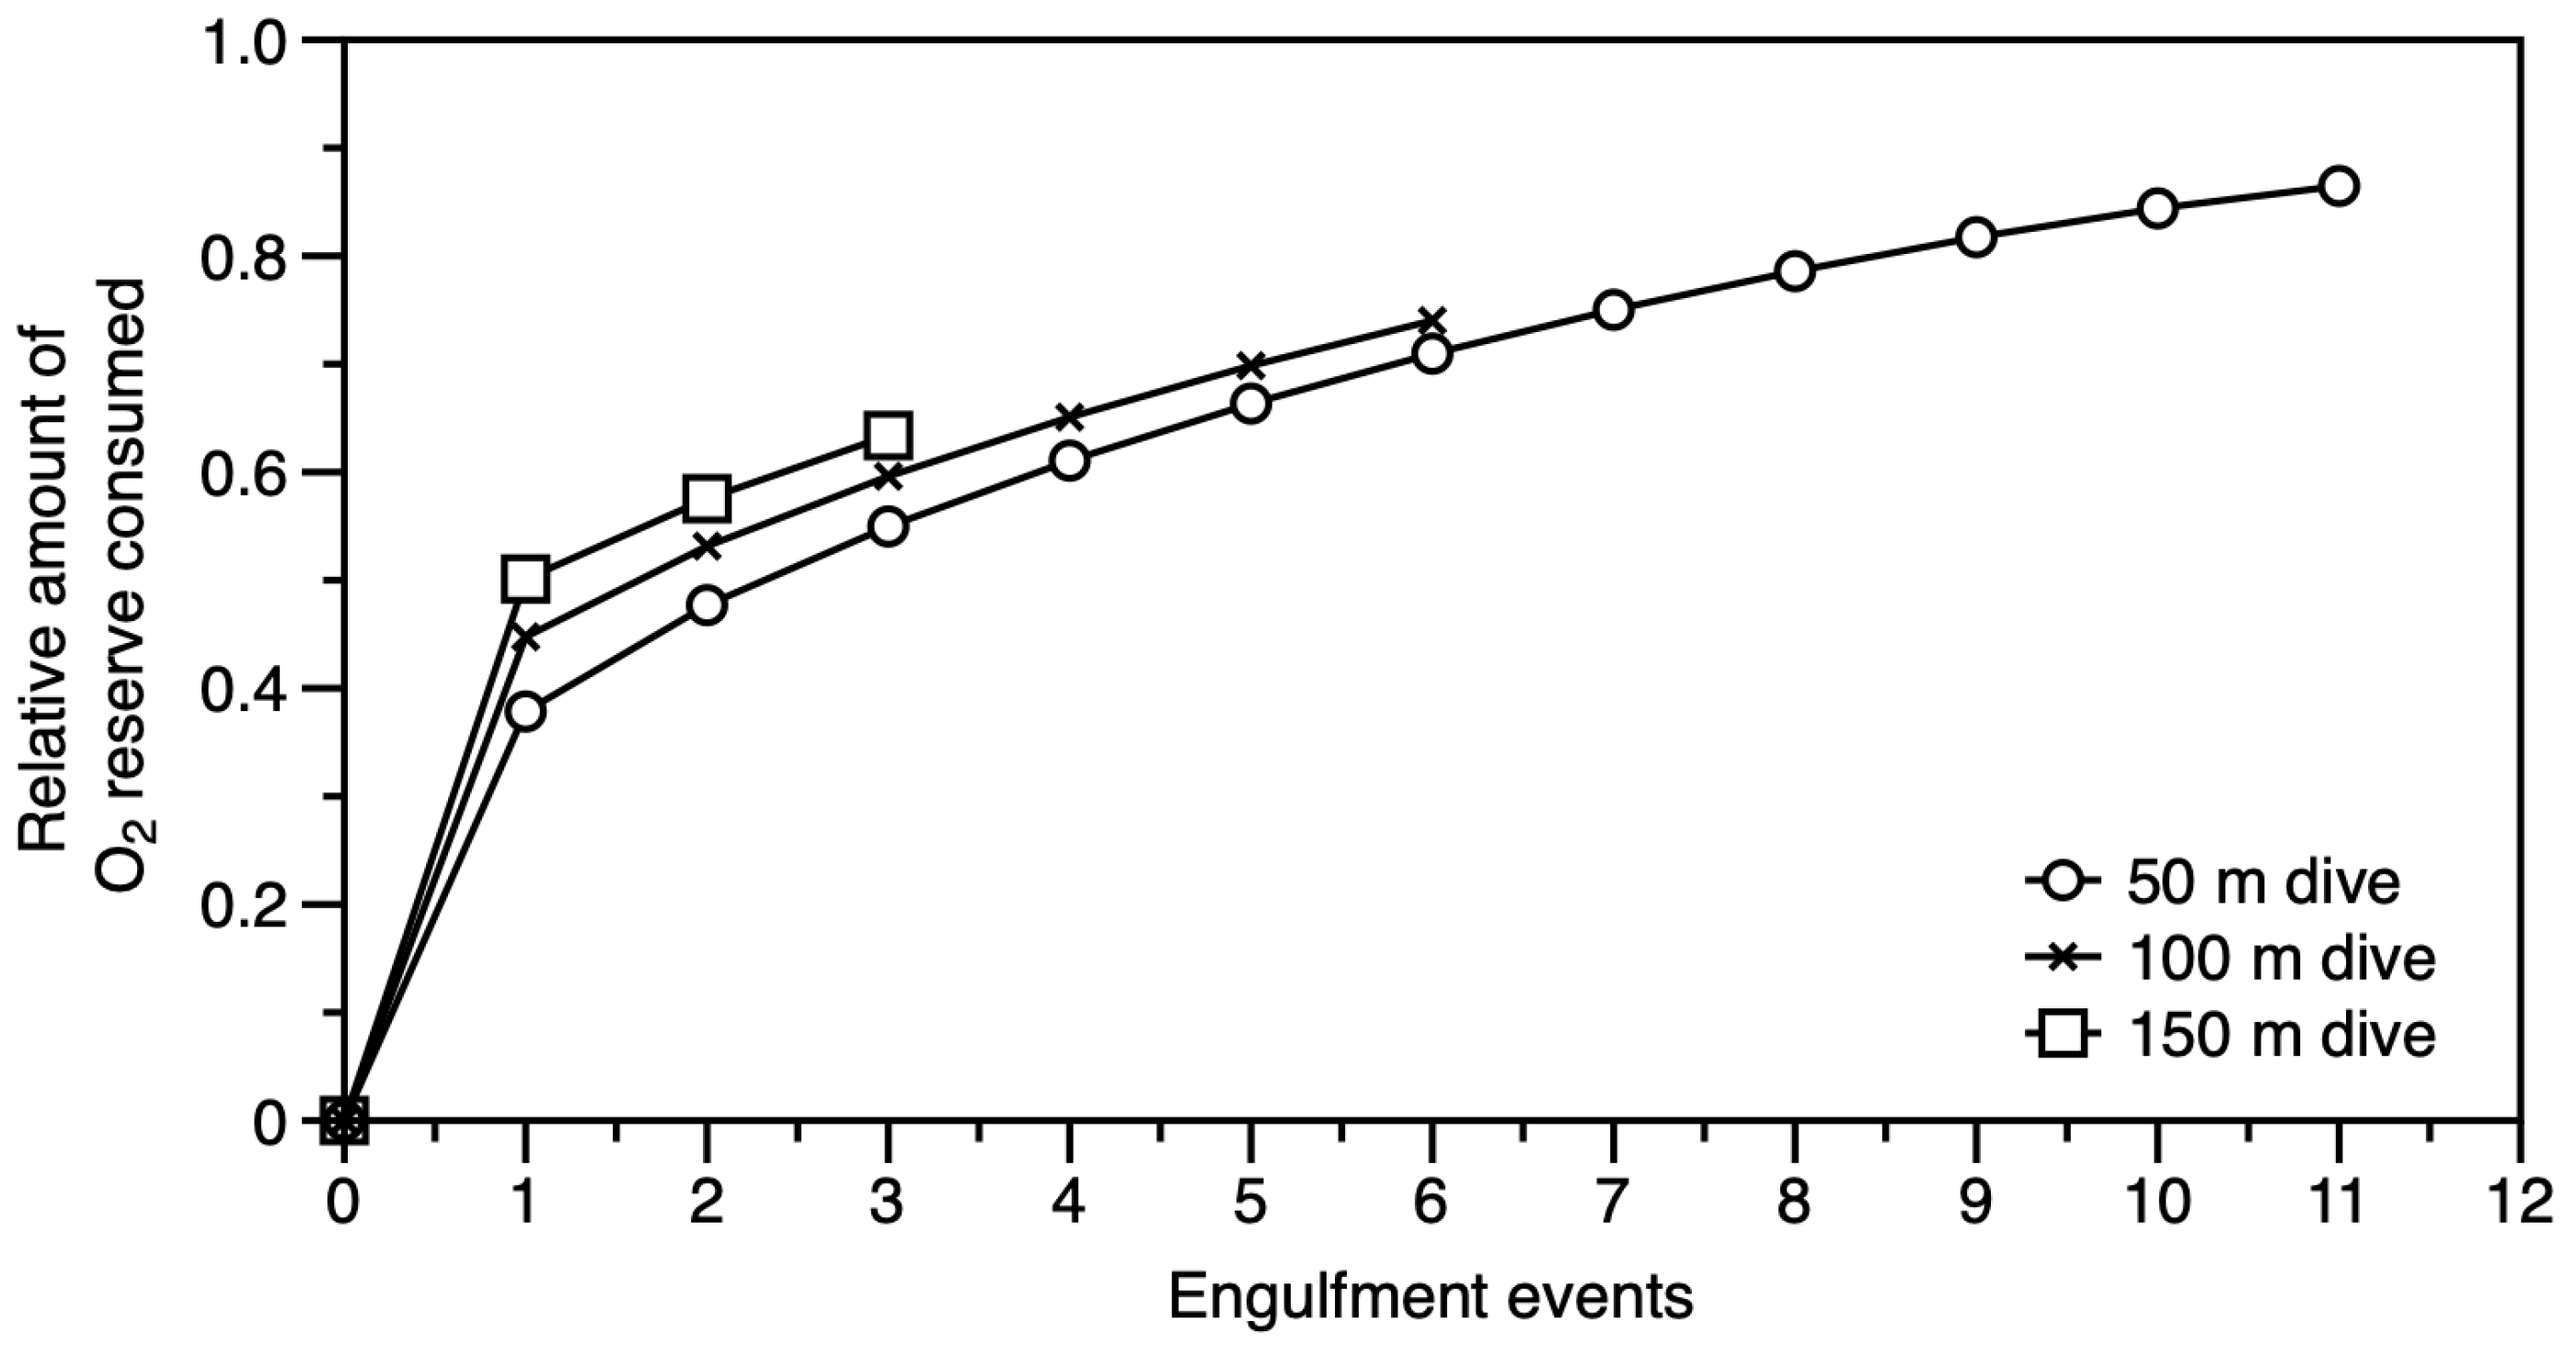
Several simulations of successive engulfment events were completed. For this, a whale individual is set to start at the surface, it dives to a specified depth, then turns to stabilize its horizontal position, followed by a series of engulfments at 45 s intervals until the multi-layer perceptron triggers the return to surface. Series of regularly spaced engulfments were performed until the oxygen limit was exhausted for the individual (Figure 5c). At 50 m, up to 12 successive engulfments could be completed before the return to surface was triggered. This number decreased to 7 at 100 m and 4 at 150 m.
To explore the correspondence of our estimates with Kramer’s optimal diving strategy theory [12], we calculated the relative amount of available oxygen content consumed as a proxy of the quantity of energy used. This can be thought of as the energy that needs to be gained from foraging as a function of the number of engulfment events (Figure 6). With similar parameters controlling the dives (i.e., velocities, descent angle, etc.), the curves tend to show a similar convergence to 1, but the last values (which is the final or boundary value of the curve) indicate the relative amount of the quantity of oxygen that is required to be able to reach back to the surface before exhaustion. The values depended on the dive depth and past energy consumed to reach this depth and to engulf successive volumes of water. At 50 m, the relative quantity of oxygen remaining is about 0.14. This value increased to 0.26 at 100 m and 0.37 at 150 m.
Qualitatively, the model correctly represented an engulfment pattern; however, compared to velocity profile observations published in Cade et al. [48] and Potvin et al. [23] on humpback whales, the simulations seem to have a greater inertia (Figure 7, 1× drag). This is expressed by the slow (exceeding 120 s) return to the initial velocity. Indeed, in Cade et al., Figure 3b,c [48] for example, the velocity generally decreased faster (in less than 10 s, on average) down to the initial value observed before the acceleration. To explore this issue, the change in drag (i.e., the difference in drag of the body with or without engulfed water) was artificially increased, successively, by factors of 2, 4, 8, 16, 32 and 64 times. This change in drag occurs for 4 s in our simulations; only using a factor between 32× and 64× produces a pattern resembling the velocity decrease reported in the cited literature. This drag inflation was artificially simulated and cannot be assimilated to any mechanism here, but it does show that changes in only surface and volume are not sufficient to account for the action of the change in shape on the drag force generated by the motion during engulfment.
Finally, in Figure 5d,e, we show that more complicated foraging scenarios can be constructed with spiraling, like bubble net feeding [56,57]. Bubble net feeding is a strategy used by both solitary and groups of humpback whales with engulfment [58,59]. In the simulation shown (Figure 5d,e), decisions to spiral were forced. A complex sequence was simulated, initiating the dive with a descent angle equal to ca. 10 deg, reaching about 20 m depth, and then spiraling upward while releasing air bubbles every 2 s (as represented by open circles in Figure 5e). During the bubble net feeding, the velocity and force are high at the beginning and then decrease, while the rotation radius decreases, to contract the spiral around the center and any supposed prey present. Engulfment was not included as it occurs, in this configuration, near or at the surface. This sequence was accomplished in aerobic conditions without exhausting any of the oxygen compartments, hence without triggering the end of the dive perceptron and modifying the behavior for a safe return to the surface; it was possible only for shallow dives, similar to what are depicted in the literature (e.g., [57,59]).

4. Discussion

In reviewing the theoretical work on marine mammal diving, the results presented by Tyson et al. [16] suggested that the optimal strategy framework—which dominates the field—should be reconsidered as a concept for studying dives. Optimal strategies have a long history and have shaped behavioral ecology [60]. For marine mammals, optimal foraging and diving strategies are the two major theories that aim to predict feeding behaviors. These theories have had many implications for morphological studies of individuals’ and their physiologies, especially the focus on anatomic and metabolic transformations during growth intervals presumed to optimize net energy gains. This is because the primary hypothesis in optimal strategy frameworks is that natural selection shapes individuals to be more efficient in ways that maximize their net energy budgets under constraints. For baleen whales, optimal diving models, applied to central place foragers, have been used to characterize diving behaviors (e.g., [15,16,61]). Friedlaender et al. [62] expressed this as “Baleen whales are central place foragers where oxygen at the surface represents the central place and depth acts as the distance to prey”. Yet despite the appeal of optimal diving strategy theory, when large numbers of observations from individual dives are compiled, the data envelope does not correspond well with the theoretical description [16].
It is important to note that the foundational article by Kramer [12] has made the transition from the optimal foraging strategy, which emphasizes the cumulative energy gain during feeding, to the optimal diving strategy, which emphasizes the dive limits in terms of depth and time spent beneath the surface. The optimal diving strategy focuses on the oxygen stored at the surface (see Equation (1)) as a proxy for energy expenditure during dives. The constraint is to use all the stored oxygen while maximizing energy gains and optimality are imposed, being defined as an evolutionary outcome. Still, there have been strong criticisms of the optimal theory in ecology. For example, Pierce and Ollason [63] wrote the following: “Optimization theory has no place in current evolutionary thought: its use is a throwback to the comfortable determinism of Divine Creation; to the endeavors of natural philosophers seeking to demonstrate the wisdom of the Creator”. The same authors concluded their critical review by writing: “[…] current literature suggests very little change in the way ecologists think about foraging behaviour.” Nonetheless, to date, no other frameworks have emerged. The simplicity of the optimal strategies continue to make them appealing to a wide range of problems in behavioral ecology, where detailed information on mechanisms is often lacking.
Nonetheless, we are not suggesting discarding the optimal diving strategy literature. This literature is a rich source of information of both analyses and debate. For instance, notions of optimization of food catches were discussed by Friedlaender et al. [1], who suggested that the foraging pattern does not directly confirm maximization of catches. More recently, maximization of catches was also contradicted by Videsen et al. [64] who have estimated that the energy spent during foraging can easily be compensated by the gain from a very low concentration of food in the volumes engulfed.
In our approach, no optimal strategies were used; an individual-based eco-physical dynamic model was formulated in which different decisions can be taken at any time according to environmental conditions and the internal physiological state of the organism. If conditions exist, optimality can only be an emergent property of the dynamic model that leads to minimizing energy losses while maximizing the increase in target criteria. In our diving model, this would be seen as an emergent property of a set of processes that lead to minimizing the oxygen spent while maximizing the potential energy gain for the whale organism. However, nothing in our formulation leads to the calculation of an optimal solution for state variables of energy consumption (i.e., μ A only depends on the force produced and μ B is constant). The limit of the dive, however, exists, constrained by the requirement to reach the surface before the oxygen content is exhausted. This implies that a dive can be interrupted at any time before the limit is reached but cannot be prolonged hereafter.
Finally, the dive limit fluctuates as a consequence of the efforts produced prior and is therefore not fixed at the beginning of the dive by what will happen after. This constitutes the major difference between our approach and what optimal strategies intend (e.g., [61]). Since our objective was to develop a model simulating the eco-physical dynamics of individual humpback whales, it led us to re-evaluate several operational assumptions present in the mammal diving literature.

4.1. The Definition of Whale Shape Has Consequences

The model simulates the physical displacement of individuals by moving a single point in three-dimensional space. To allow this point to change position, we needed to define its physical characteristics of mass, volume and shape. This requires having information about the physical dimensions of whale individuals, including estimates of their variability. In the absence of a parametric morphodynamic model of the whale shape [65], or a published compilation of dimensions of living individuals [66], we relied on a collection of disconnected relationships, which were established for the same species but on different samples taken at different locations to represent a whale body. The set of variables used were mainly length, surface and volume. In our previous study [37], as for the present one, all relationships were refit to maintain the isometric scaling of the shape. This was necessary to be able to manage the transformation between energy and force. The model primarily uses force, which generates acceleration and velocity and compensates the body’s drag and buoyancy, all producing position changes.
However, the drag calculation requires parameters (mainly the drag coefficient) that are usually determined empirically [67] or by simulation [68], instead of using fundamental laws with universal parameters. In our study, all the parameter values were determined using the literature, but two difficulties arose:
  • Estimates assembled from different publications give inconsistent results;
  • Individual variability cannot be apprehended by an ‘average individual’ that possess averaged characteristics for all variables.
To illustrate these difficulties, combining the available information gathered about length, surface, volume, mass and fineness (Table 1), the minimum shape model that can be proposed is an ellipsoid. However, by using length and mass as references, isometric scaling can only be maintained in the ellipsoidal model if the fineness is changed from 5.0 to 6.1 and the a coefficient of the surface function is changed from 0.050 to 0.069 .
There is a need to quantify shape better to be able to link the whales’ biology [69,70] with physics [71] and ecology [66,72]. An accurate description of the whale shape has been challenging to assess because it must be performed while it is living and immersed [73]. Recently, whale shapes are being described with drone-based photogrammetry [65,71]. Thus far, however, the focus has been on describing the shape of a single individual at a particular time rather than constructing a generalization of the whale shape.
Many studies have pointed out that an isometric scaling hypothesis is unsatisfactory because allometric growth can be seen as an evolutionary process with functional advantages (e.g., [39]). However, this is in a direct prolongation of the optimal foraging theory; for example, a positive allometric scaling in the growth of components of the engulfment apparatus was assumed to increase the engulfment capacity, hence the feeding efficiency [74]. A negative allometric scaling of the caudal peduncle, although seen as a trade-off with the positive engulfment capacity allometric scaling [39,75], can be seen as an advantage when associated with the positive allometric scaling of the fluke span and flipper length, both assumed to increase maneuverability and related hydrodynamic characteristics [76]. Nonetheless, without collecting more measurements on large numbers of individuals, applying these results at the individual level is unjustified here.
Napoli et al. [66] have studied the relationship between the length and volume of humpback whales in the West Indies population segment (North Atlantic Ocean). They calculated a condition index based on the relative deviation between the observed volume and the expected volume, which was calculated by the fitted relationship between the length and volume. They found that in addition to the individual variability, this condition index varied according to the different foraging areas where individuals were observed. This suggests that humpback whales with a similar body size can accumulate different amounts of energy reserves, resulting in significant variations in the body length-to-mass relationship. In addition, by refining their analysis to a pre-defined population segment, they suggested that the shape varied according to the spatial distribution, separating whales observed in the Gulf of Maine from other areas.
Their results have profound implications for using allometric scaling. If we consider the shape of whales as an ellipsoid, with isometric relationships between length, surface, volume and mass, an increase of 10 % in the fineness induces an apparent negative allometry scaling between the length and weight (the fitted exponent decreases from 3.0 to 2.95 , while the multiplier increases from 14.47 to 16.33 ). On the contrary, a decrease in the fineness (fasting conditions) induces an apparent positive allometry scaling between the length and weight (the fitted exponent decreases from 3.0 to 3.05 , while the multiplier decreases from 14.47 to 12.81 ).
Finally, the calculation of whale body dimensions has consequences on the high-frequency dynamics of swimming and diving. In our model, the effect of a buoyancy change can be accounted for during the dive, using the principle that lungs and other tissues are compressed with increasing pressure [46]. This density change assists with the descent, conserving energy. However, surprisingly, the counterpart of this argument (increasing consumption in the ascending phase) was consistently ignored in the literature. As far as we can determine, the body compression rate has not been quantified, and without any precise volume and mass characterizations, no mechanism can fully explain how pressure is regulated by an individual.
All of this suggests that allometric scaling in the humpback whale cannot be approached through a set of allometric relationships. Instead, it must be understood as part of an integrated approach in which the dynamics of the shape during the growth of whale individuals is explicitly accounted for. Whale shapes are more complex than a simple ellipsoid, and a parametric model that can both represent how this shape fluctuates and expands as individuals age seems difficult to conceive without morphodynamic studies. Some techniques could be used, for example, like adapting a Fourier transformation to study 3D surfaces [77,78]. The shape, once established, could be used in environmental simulations to estimate its hydrodynamic properties, particularly drag coefficients [71,79].

4.2. Major Challenges Remain for Quantifying Metabolic Processes

In the model, dives are strictly aerobic. Two metabolisms are accounted for: the basal metabolism, which has, for a given individual weight, a constant rate, and the active metabolism, which is a function at the exponent 1.5 of the developed muscular force [52]. All of this depends on the assumption that the transformations are isometric and that the conversion of the oxygen consumption rate to the rate of muscular force produced is constant. A constant conversion rate was set (21.1 kJ·L(O2)−1) based on glucose oxidation [80]. This assumption is probably too simplistic, since it has already been shown that baleen whales can switch from a lipid-based metabolism to glucose-based metabolism while diving, depending on the intensity of the effort produced and on the duration of the dive [81,82]. Furthermore, the mitochondrial activity, producing adenosine tri-phosphate from oxygen, is variable [82,83] and has been characterized as an adaptation in marine mammals to prolong dive durations by extending the limits of aerobic metabolism [82].
Baleen whale respiration has been studied at the surface, for shallow dives [84] and while traveling [85,86]. Their observations of breathing rates range from 0.6 breath·min−1 for velocities lower than 1.5 m·s−1 to 1.1 breath·min−1 for speeds up to approximately 3 m·s−1 [85,86]. Our simulations have breathing rate estimates that are concordant at low velocities (Figure A2), and at higher velocities (5 m·s−1) our estimates increase to a maximum of 7 breaths·min−1 for a 50,000 kg individual. Simulations are also consistent with field observations of a stepwise breathing dynamic, as indicated by the maintenance at a regular number of breaths, as long as there is not a change in the whale’s mean active swimming activity [85].
We assumed that the breathing rate would momentarily increase at the surface post-dive to recover from oxygen depletion and that this occurs while the whale is resting (very low velocity swimming, 0.050 m·s−1). This was performed to be consistent with Gunnufsen’s observations [84] who reported values of 5.07 breaths·min−1 for 1.3 min before preparing for a second dive. However, the recovery time after a dive was estimated to be much longer by the model. Other studies have estimated that individuals spend from 2.3 [87] to 6 min [25] at the surface between two consecutive dives. In our simulations, recovery times to return to pre-dive saturation levels were longer (up to 18 min for a 10,000 kg individual). This is reasonably concordant with blood oxygenation measurements made using NIRS (near-infrared spectroscopy) sensors on diving seals: McKnight et al. [88] indicated that the time for full post-dive recovery oxygenation levels was between 5 to 15 min. If, in general, breathing rates are found to increase with fast swimming velocities and oxygen depletion [85], our estimates of longer recovery times are reasonable given the assumptions made in the model. However, if similar blood oxygenation measurements become available on baleen whales, the model can be adjusted to account for differing re-oxygenation trends in each compartment.
The synthetic framework of oxygen metabolism described by Popel [49] mainly explains comprehensive human oxygen biology in standard conditions but remains insufficient to understand human free-diving capacities [33,34] and, a fortiori, the oxygen metabolism in large cetaceans. In addition, specific mechanisms have been invoked for marine mammals during deep dives: the increase in hydrostatic pressure compresses the lungs of marine mammals until gas exchanges with the blood are stopped or slowed to very small rates [89]. Humpback whale anatomical studies have suggested that individuals can experience such phenomena [30]. Nevertheless, blood biochemistry and circulation have been inferred only by analogy with other species [17], partial reasoning from anatomical studies [90,91] and measurements on dead organisms [92].
Exchanges of oxygen between the blood and tissues in blue whales (Balaenoptera musculus, Linnaeus, 1758) have suggested that during dives, individuals can reduce their heart beat rate and regulate the flow of oxygen differently between organs by changing blood vessel diameters [3,17]. Heart rates have only recently become quantifiable for large cetacean species, such as the blue whale [93]. Many of the adaptive characteristics of large marine mammals remain inferred from indirect measurements or by analogy; for example, the importance of oxygen storage mechanisms is inferred from increased hemoglobin and myoglobin concentrations in blood and muscles, respectively [3]. These characteristics were included in the model. However, storage capacities and energetic conversion estimates were described using allometric relationships, established from a mix of many species and extrapolated for larger cetaceans [26]. These estimates have been used extensively because they have been the only estimations available [92], but Croll et al. [94] suggested that this approach provided inaccurate results when exploring dive limits in blue and fin whales (Balaenoptera physalus, Linnaeus, 1758). While the use of allometric relationships to estimate states and rates from averaging measurements at the population level has been demonstrated to be useful for species traits, these values are less desirable when representing the physiology of a single individual [92].
Since the model treats only aerobic metabolism, dives are limited by the capacity of individuals to store oxygen before diving. Our final submodel required five state variables to represent this system in a minimal way [49]. The oxygen levels in each of these five compartments are evaluated at each time step, depending on the global dynamics of the individual during swimming and dives. This design also means our model does not imply a dive has a pre-determined contingency to use all stored oxygen, a possibility that has been explored for seals using Poisson estimates of underwater prey capture [95]. Friedlaender et al. [62] proposed a forage dive should be characterized as “multiple step foraging decisions”, connected to environmental variables, such as prey depth and patch density, but without going any further. Our approach was to conceive of any diving behavior as the outcome of multiple decisions, explicitly responding to both physiological and environmental conditions during the dive. In fact, we would argue that diving behaviors cannot be considered in such a piecemeal manner, as much of the optimal foraging literature has done, but must be treated holistically since the dynamics depend on continuous interactions between the organism’s physiology and environmental perceptions by the organism.

4.3. How Can We Identify Dive Limits Without Reliable Metabolic Information?

Initially, we intended to assess the limit of dives by defining a threshold for the oxygen level in one of the compartments as a trigger for the return-to-surface decision. However, the large number of hypotheses emitted about blood gases in baleen whales and other diving marine mammals argued against this. These organisms have high tolerances for hypoxia according to some studies (e.g., [96]). Studies based on human divers (e.g., [33]) suggest that the return to surface could be triggered by the quantity of dissolved carbon dioxide present in the blood. Using a phenomenological model, Roos [85] considered a metabolic role for carbon dioxide for humpback whale diving by introducing an offloading concept to classical gas exchange calculations. Ponganis [3] suggested that a dive limit is defined by a combination of the depth and nitrogen blood concentration. Diving marine mammals are considered tolerant to increasing concentrations of dissolved nitrogen in the blood, which should contribute to permitting deeper dives [17]. Very early studies, particularly Laurie [8], reported unusual low nitrogen concentrations in whale blood samples. He postulated that baleen whales have developed mechanisms to prevent nitrogen toxicity. In a recent article, Ponganis and McDonald [97] hypothesized that nitrogen blood gas might be regulated by the thoracospinal rete, a series of blood vessels that could absorb nitrogen from the blood and transfer it to the fat storage compartment, reducing the risk of nitrogen narcosis during dives. These same authors also point out that marine mammals’ blood biochemistry is complex and there are several possible candidates with the potential to regulate and limit dive duration and depth.
Even without any reliable information about biochemical mechanisms in the humpback whale, oxygen exchange dynamics with hemoglobin and myoglobin are known well enough to build a simplified oxygen metabolism function, as we have done. Using a dynamic function, instead of a phenomenological one, enables analysis of the state variables during a dive and, eventually, would enable comparisons with measured values as sensor technologies improve. In addition, the functionality permits a high tolerance to oxygen depletion, which means individuals can approach physiological limits without artificially setting a fixed physiological threshold. Thresholds have implications for the capacity to return to the surface and few studies have evoked the possibility that whales use anaerobic metabolic pathways during dives. In their first attempts to describe the dynamics of dives with an optimal diving strategy, Houston and Carbone [15] evoked aerobic and anaerobic pathways but assumed all dives should be aerobic. In diving birds, Ydenberg and Clark [98] showed that both pathways occur for Western Grebes and that this could be qualified as energetically efficient under particular conditions (i.e., dense aggregation of prey) in the framework of the optimal foraging strategy. Kooyman et al. [99] demonstrated that Weddell seals use anaerobic pathways for long dives but also suggested that most individual dives were short and aerobic. Dolphin et al. [13] stated that humpback whales could use an anaerobic metabolic pathway at a threshold depth of 60 m, emphasizing as well that most of the dives were shallower than this and deeper dives would be energetically inefficient. Carbone and Houston [100] reconsidered their earlier work [15] in light of the possible use of both metabolic pathways during dives. They were confronted by the difficulty to define how the changeover might occur and proposed the existence of a discrete commutation mode (a “switch”) between metabolic pathways and a “mixed mode”, or a continuous flipping between each pathway.

4.4. Resolving Behavioral Decisions During a Dive

Whale individuals can accomplish frequent dive cycles each day, many during intensive foraging periods in foraging areas. In our approach, we postulated that whales have developed biological capacities to ensure vital functions and survive dives. Recent work from McKnight et al. [101] identified experimentally a plausible voluntary role for the central nervous system that could allow marine mammals to sense their internal oxygen levels and regulate dives. Consistent with this work, we defined a dive limiting function (Equation (26)) that combined several variables: the distance to reach the surface, the velocity it will require to cover this distance and the remaining content of oxygen and oxygen consumption rates for basal and active metabolism. This dive limiting function is therefore a combination of environmental and physiological variables linking force production to oxygen consumption. This function was used as a translation of environmental and physiological information to determine a behavioral response corresponding, for the individual, to the decision to end the dive and return to the surface. One original aspect of our approach is that this information is processed by a neural network algorithm (multi-layer perceptron [54]), which is trained by adjusting the decision to the calculated dive limiting function. To our knowledge, this has not been done before.
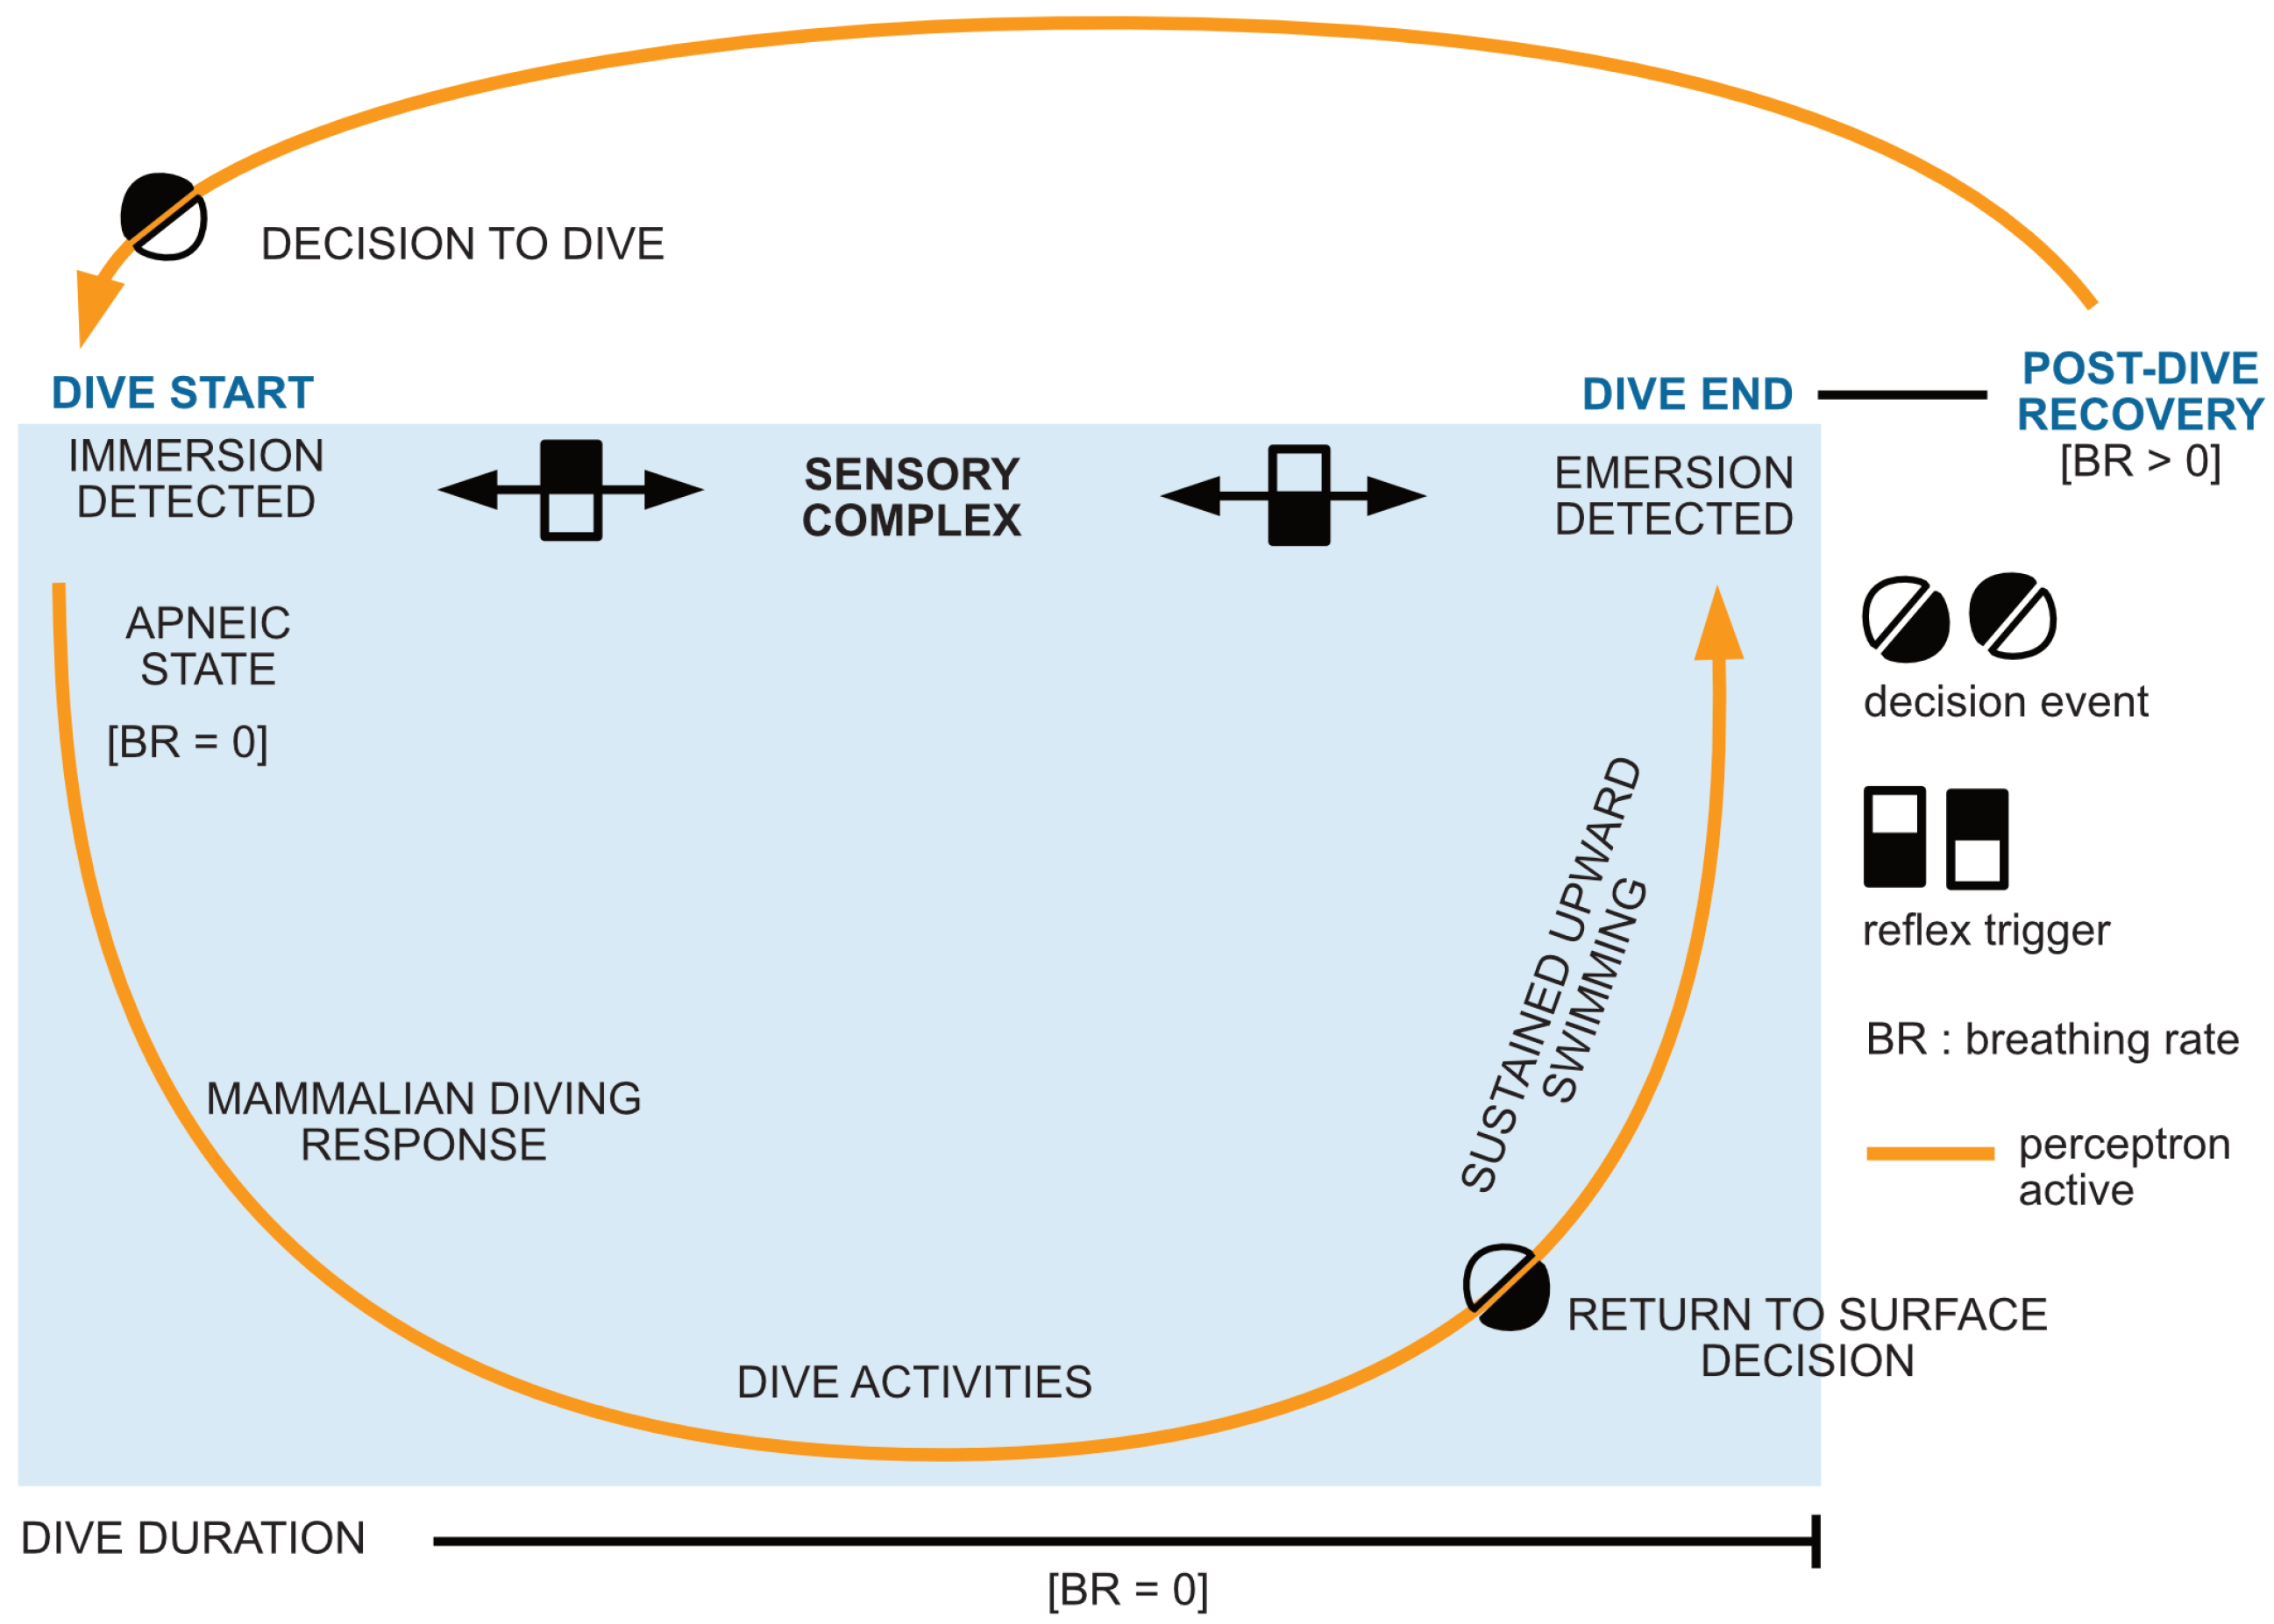
We have assumed that whale individuals make different decisions according to an intention or motivation (i.e., to explore or forage [1]), the conditions they encounter, such as the presence, abundance or quality of the prey [102,103], or the presence of other individuals on the same diving location [85,104]. In terms of the model, from the perspective of a dive cycle, ‘decisions’ were separated from ‘reflexes’ (Figure 8). The first decision to dive was forced, triggered only if all oxygen levels in all compartments are at equilibrium. The initiation of the dive was defined as a sequence of acceleration and re-orientation of the body downward. The transition from air breathing to apnea was considered a reflex. As soon as the depth, indicated by the component of position state z becomes negative, the uptake oxygen rate ( ν O 2 ) became equal to zero. While diving, whale individuals could perform specific motions and tasks (see Figure 5). Hence, the choices are conditioned by their internal states, and, by adjusting effort and performance, individuals can achieve different dives.
Implementing the neural network algorithm allowed individuals autonomy over the decision to end the dive using information about their velocity, the water depth, the distance already covered and the amount of remaining oxygen available. Once back at the surface, the transition between apnea to air breathing occurs, and post-dive recovery can begin. Neural network methods are used in robotics to provide autonomous mobility [105] and these techniques offer a new perspective for individual-based simulations in ecology. Particularly exciting is the ability to generate ethograms from the virtual individual for comparison with observations of living organisms. These approaches have the potential to redefine ecological dynamics as a continuous flow of information modulated by biotic and abiotic interactions in different environments (Figure 8).
The feeding process was the most difficult to implement and evaluate, from both the point of view of the engulfment dynamics and the sequence of events and phases during the dive. Goldbogen et al. [24] reported that the average number of lunges a humpback whale executes is 9 per dive, with a maximum of 12. Our model conformed with these estimates for shallow dives, but not for deeper ones, in the conditions we have simulated. The energy cost of each engulfment is high, not optimally efficient hydrodynamically [106] and requires more effort to be performed in series. As mentioned in the results, engulfment processes are very short and observations exhibit a large variability [48]. The engulfment process also varied according to the type of prey, being much faster for krill than for forage fishes [48]. In addition, Cade et al. [102], studying humpback whales foraging on krill in the Antarctic, showed that individuals can adjust their feeding effort in response to the size of the krill patches and the size of the Euphausiaceae individuals. This context makes the comparison between the simulations and observations difficult without having an accurate and detailed set of observations distributed in space for prey.
Humpback whales can also adopt particular feeding behaviors, alone or in small groups, by encircling their prey in a bubble net, in which they can engulf concentrated food [57,58,59], which is assumed to increase foraging efficiency. This particular behavior exhibits many patterns [57,59]. Our model can simulate observed patterns and estimate the energetic cost that they imply. However, it remains difficult to identify in what cases decisions are taken for feeding strategy decisions.
Baleen whale behaviors and actions during dives are far from being fully characterized [1]. Our long-term goal is to make the virtual whale fully autonomous, ensuring basic life-cycle processes, including migrations [37] and reproduction. From a broader point of view, our modeling shows that we do not need to analyze a large set of observations to be able to replicate the general behavioral features of individuals when diving. Mainly, we do not need to impose a pre-supposed outcome to represent the process of diving. This is consistent with our previous study [37] in which we suggested that migration patterns can be conceived without predetermining the track and destination. Conversely, we also show that the primary features of whale diving can be simulated without requiring a comprehensive set of species-specific observations.

5. Conclusions

Petersen [107] observed the following in marine behavioral ecology studies: “With the higher animals, actions are often observed which naturally lead to the supposition that they are caused, or accompanied, by mental attributes which we think are comparable to our own state of consciousness, then it will often be found easier to describe the movements (behavior) by means of psychical expressions than to describe the movements actually made …”. We have confronted numerous challenges in this study engendered by the lack of basic information about fundamental biological parameters, especially in animal morphology and aerobic metabolism. Consequently, the model presented in this article makes two important innovations: 1. It implements a mechanistic approach to individual whale swimming and diving dynamics, without evoking any intentions or goals, for movements, and 2. It abandons optimality paradigms to allow for individual variability to be expressed, making it compatible with the scale of baleen whale observations, in particular those using multi-parameter sensors. Faced with large gaps in the information about physiological processes and behaviors, we felt it is important to build an open structure, capable of representing patterns from well-known mechanisms, but also flexible enough to be able to integrate the new non-invasive physiological measurements starting to provide exactly what is required for such models [20].

Author Contributions

M.G.F., J.C.-G., P.R. and J.-M.G. contributed equally to all the steps of this work. All authors have read and agreed to the published version of the manuscript.

Funding

Marisa González Félix’s work was funded by two research fellowships: 1. European Institute of Marine Sciences at Brest University (France); 2. IMBRSea ERASMUS+ program at the Ghent University (Belgium). The research received no other funding.

Data Availability Statement

The original data presented in the study are available on Zenodo (https://doi.org/10.5281/zenodo.15846700).

Acknowledgments

The authors would like to express their gratitude to the scientific committee of the European Institute of Marine Sciences at Brest University and the IMBRSea ERASMUS+ program board at the Ghent University (Belgium) for their support of our research initiative. This work was done as part of The Entangled Bank Laboratory’s open science initiative.

Conflicts of Interest

The authors declare no conflicts of interest.

Appendix A. Symbols Used

Table A1. Table of symbols used in models, description, unit, first equation and value, when constant.
SymbolDescriptionUnitEq.Value
t, TTime, Durations
σ Time spent at the surface(time)(1)-
χ ( σ ) , χ m a x Oxygen stored at time s, maximumL(O2)(1)-
γ Oxygen accumulation rate(time)−1(1)-
μ τ , μ ϕ Oxygen consumption rate (traveling, foraging)L(O2)·(time)−1(1)-
T τ , T ϕ Travel, foraging periods(time)(1)-
ρ w a t Water volumic masskg·m−3(5)1030.0
u . , w a t Components of the water velocity vector (. is x, y, z)m·s−1(9)
gGravity acceleration constantm·s−2(16), (17)9.8067
L W Whale lengthm(2)
S W Whale surfacem2(2)
V W Whale volumem3(2)
M W , M R Whale mass, whale muscular masskg(2)
ρ W Whale volumic masskg·m−3 1030.0
X W Whale’s body finenessdim.less 5.0
V L , V B Total lung volume capacity, blood volumeL
L j , W h Jaw length, head widthm(3), (4)
L v Length of the ventral pouchm(4)
S e , a , S e , p Engulfment pouch surface, anterior, posteriorm2(4)
V e , a , V e , p Engulfment pouch volume, anterior, posteriorm3(3)
β Exponent to convert ellipsoid axis length to surfacedim.less(4)1.605
x , y , z Whale coordinates in the Cartesian systemm(9)
a . Comp. of the whale acceleration vector (. is x, y, z)m·s−2(7)
u . Comp. of the whale velocity vector (. is x, y, z)m·s−1(8)
UNorm of the whale velocity vectorm·s−1(5)
F W , F P , F P . Muscular, propulsive forces and comp. (. is x, y, z)N(7)
D, D . Drag force and comp. (. is x, y, z)N(5), (7)
C D , C A Drag, added mass coefficientsdim.less(5), (7)
α c Volume compression factordim.less(6)[0,1[
F a , F g Buoyancy force, whale’s weightN(7)
θ Opening angle of the jawradian(10) [ 0 , π / 2 ]
ζ o , ζ c Opening closing ratesradian.s−1(10)
T p , T o , T c Prep., open., clos. time phase of engulfments(11), (15)
T f Flushing time of engulfed waters(18)
S e , V e , M e Surf., vol., mass of the engulfmentm2, m3, kg(11), (14)
L O 2 , L O 2 Oxygen in the lung, capacityL(O2)(19), (22)
B O 2 , B O 2 Oxygen dissolved in blood, capacityL(O2)(19), (22)
H O 2 Oxygen bound with hemoglobin in bloodL(O2)(19)
R O 2 , R O 2 Oxygen in capillary vessels of muscles, capacityL(O2)(19), (22)
G O 2 Oxygen bound with myoglobinL(O2)(19)
μ A O 2 , μ B O 2 Active, basal metabolic rates (oxygen)L(O2).s−1(20), (19)
η O 2 Breathing rateL(O2).s−1(19)
ϕ L B , ϕ B R Transfer rates between L and B, and B and Rs−1(19)
κ 0 2 Oxygen consumption rate in muscless−1(19)
k 1 , k 2 Exch. rates between free oxygen and hemoglobins−1(19)
k 3 , k 4 Exch. rates between free oxygen and myoglobin,s−1(19)
ω L , ω B , ω R Oxygen conversion factors for L, B, Odim.less(22)
ϵ Efficiency coefficientdim.less(23)0.20 ∈ [0,1[
V O Total oxygen volumeL(O2)(24)
u ¯ , u ¯ o p t Average and average optimal velocitiesm.s−1(24)
d 0 , d t , d b a c k Forward init. and at t, and past diving distancess(24)
K, yConstraint and constraint indexdim.less(25)

Appendix B. Detailed Results for Simulations Shown
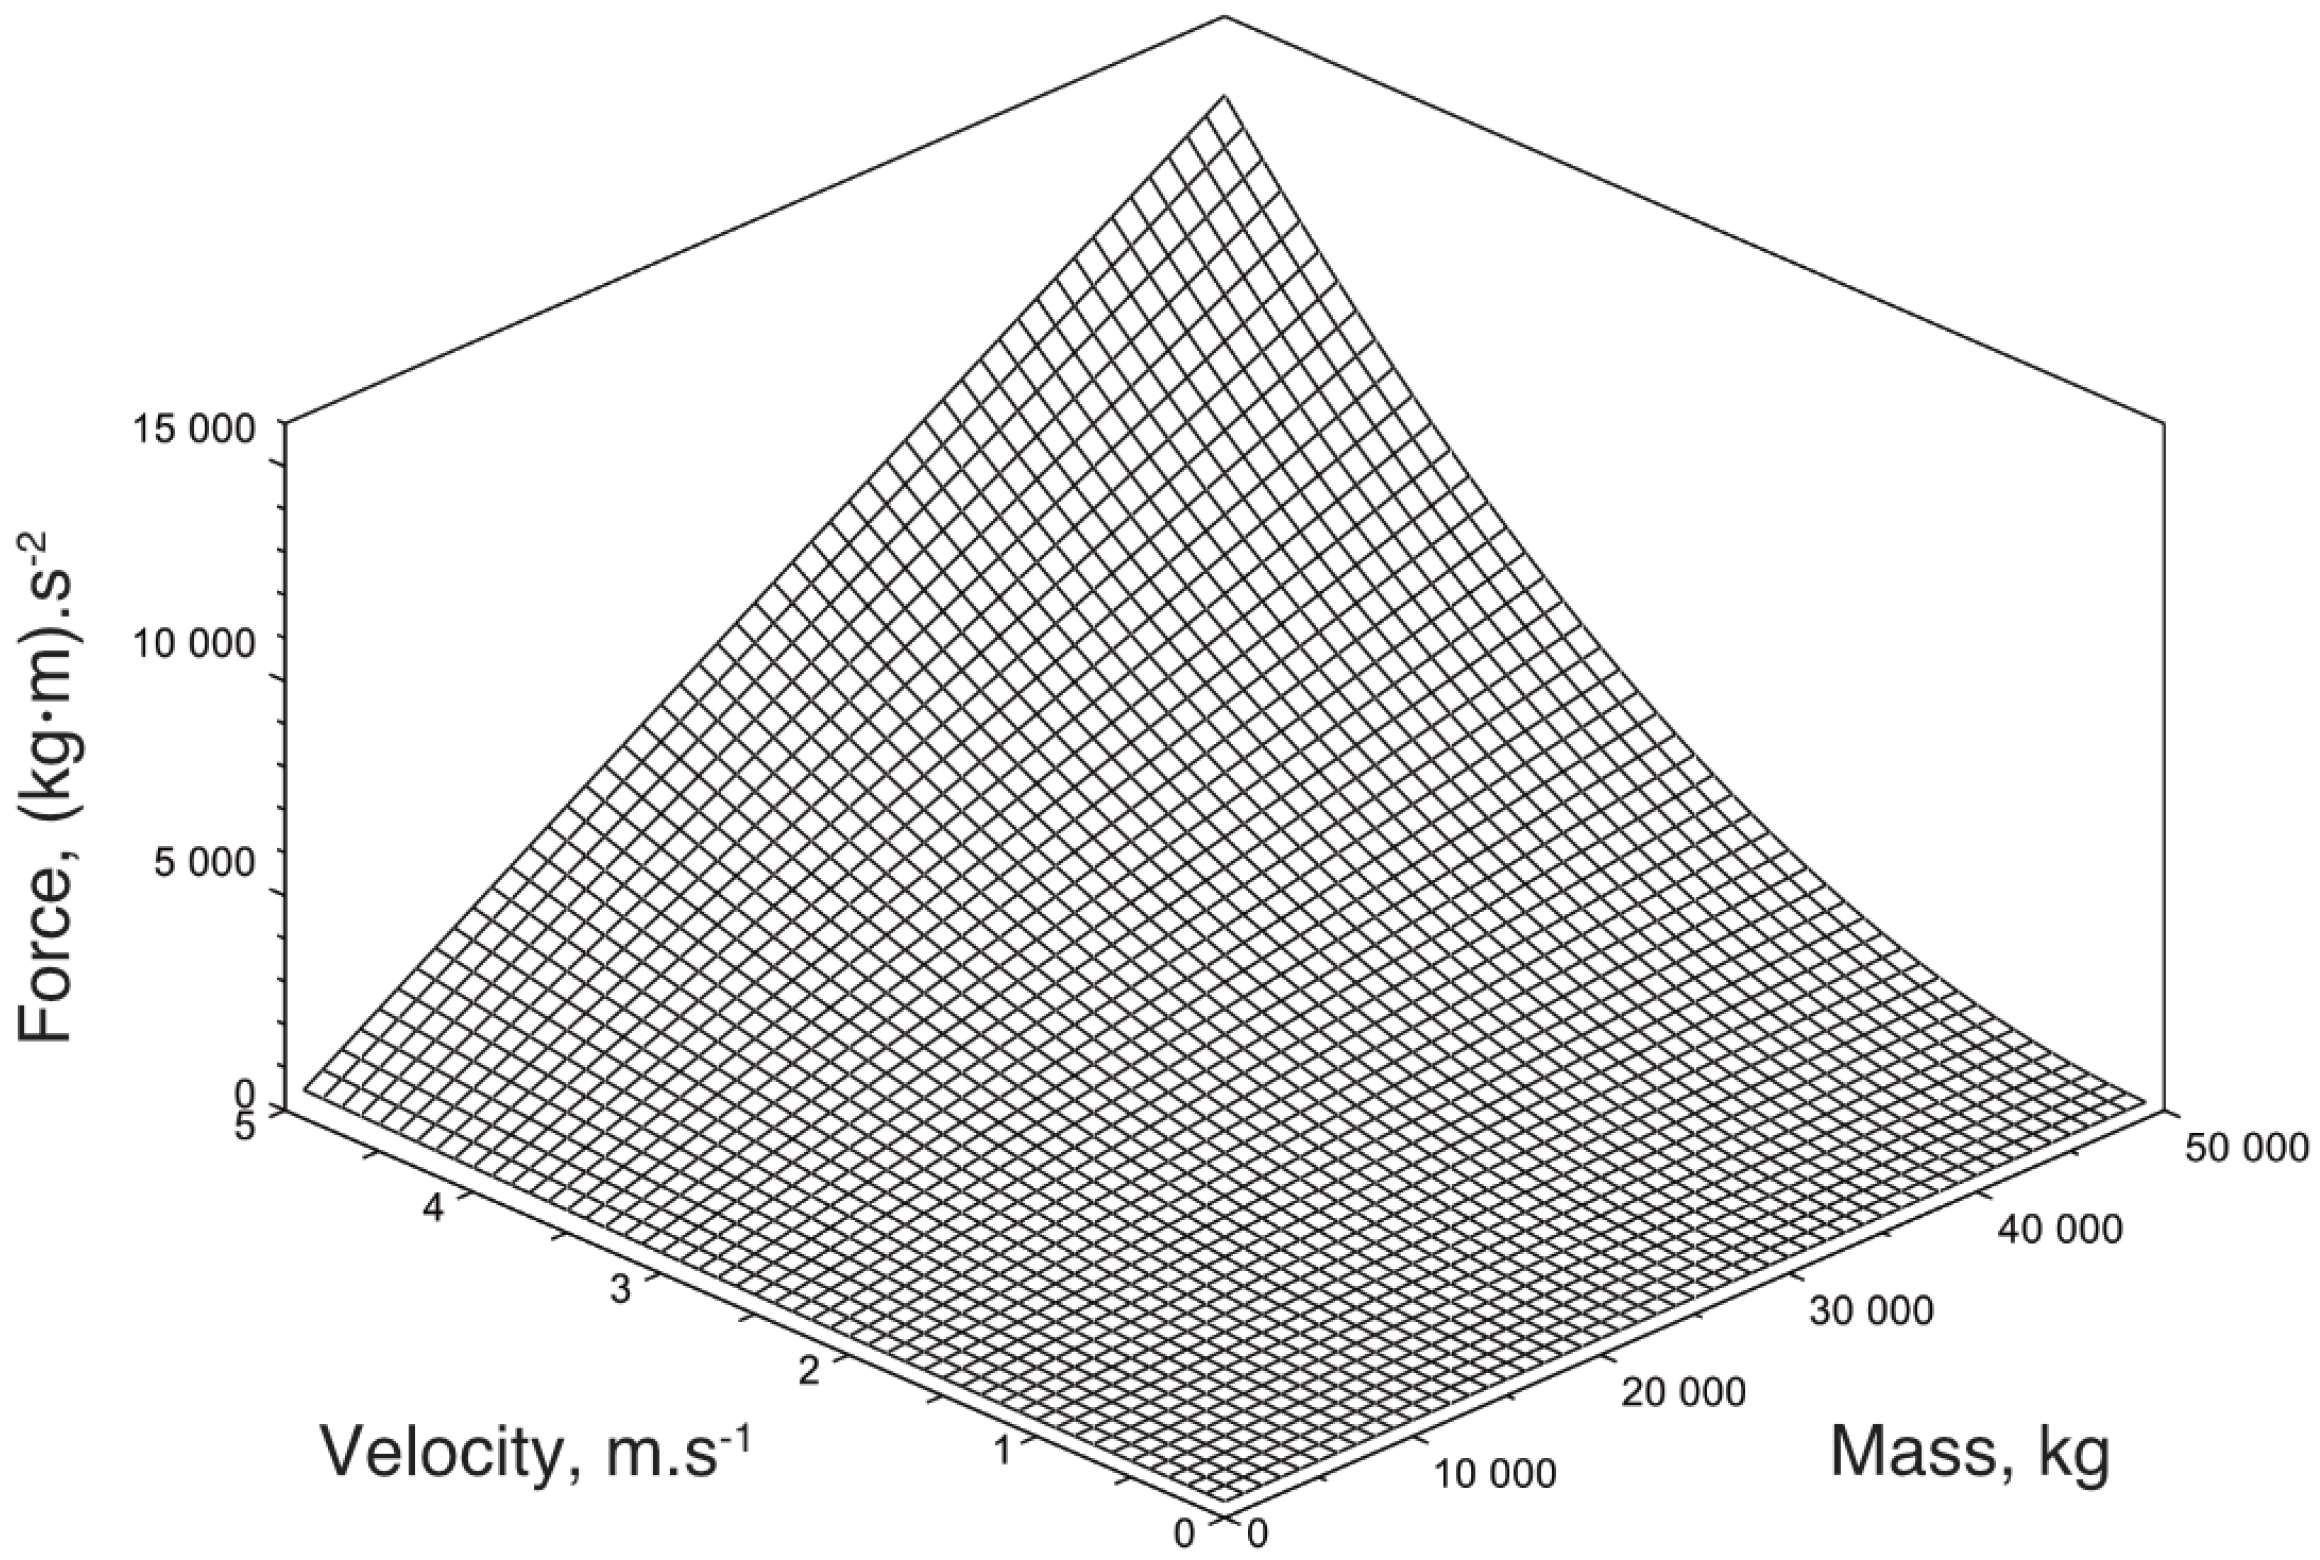
Figure A1. Surface described by the muscular force as a function of individual whale masses and average steady-state velocities in the model system.
Jmse 13 01388 g0a1
Figure A2. Surface described by the breathing rates as a function of individual whale and average steady-state velocities in the model system. This only applies when the whale is at the water surface. (a.) Breathing rate in L O 2 .min−1; (b.) breathing rate standardized to the total lung capacity, in min−1.
Jmse 13 01388 g0a2
Figure A3. Additional information for the simulations presented in Figure 2. The start (green star) and end (red star) are indicated on the trajectory.
Jmse 13 01388 g0a3
Figure A4. Additional information for the simulations presented in Figure 5a. The start (green star) and end (red star) are indicated on the trajectory.
Jmse 13 01388 g0a4
Figure A5. Additional information for the simulations presented in Figure 5b. The start (green star) and end (red star) are indicated on the trajectory.
Jmse 13 01388 g0a5
Figure A6. Additional information for the simulations presented in Figure 5c, dive at 50 m. The start (green star) and end (red star) are indicated on the trajectory.
Jmse 13 01388 g0a6
Figure A7. Additional information for the simulations presented in Figure 5c, dive at 100 m. The start (green star) and end (red star) are indicated on the trajectory.
Jmse 13 01388 g0a7
Figure A8. Additional information for the simulations presented in Figure 5c, dive at 150 m. The start (green star) and end (red star) are indicated on the trajectory.
Jmse 13 01388 g0a8
Figure A9. Additional information for the simulations presented in Figure 5d,e. The start is indicated on the trajectory.
Jmse 13 01388 g0a9

References

  1. Friedlaender, A.; Tyson, R.; Stimpert, A.; Read, A.; Nowacek, D. Extreme diel variation in the feeding behavior of Humpback whales along the western Antarctic Peninsula during autumn. Mar. Ecol. Prog. Ser. 2013, 494, 281–289. [Google Scholar] [CrossRef]
  2. Davis, R.; Fuiman, L.; Williams, T.; Horning, M.; Hagey, W. Classification of Weddell seal dives based on 3-dimensional movements and video-recorded observations. Mar. Ecol. Prog. Ser. 2003, 264, 109–122. [Google Scholar] [CrossRef]
  3. Ponganis, P.J. Diving Mammals. Compr. Physiol. 2011, 1, 447–465. [Google Scholar] [CrossRef] [PubMed]
  4. Gough, W.T.; Smith, H.J.; Savoca, M.S.; Czapanskiy, M.F.; Fish, F.E.; Potvin, J.; Bierlich, K.C.; Cade, D.E.; Di Clemente, J.; Kennedy, J.; et al. Scaling of oscillatory kinematics and Froude efficiency in baleen whales. J. Exp. Biol. 2021, 224, jeb237586. [Google Scholar] [CrossRef]
  5. Hunt, K.E.; Moore, M.J.; Rolland, R.M.; Kellar, N.M.; Hall, A.J.; Kershaw, J.; Raverty, S.A.; Davis, C.E.; Yeates, L.C.; Fauquier, D.A.; et al. Overcoming the challenges of studying conservation physiology in large whales: A review of available methods. Conserv. Physiol. 2013, 1, cot006. [Google Scholar] [CrossRef]
  6. Modest, M.; Irvine, L.; Andrews-Goff, V.; Gough, W.; Johnston, D.; Nowacek, D.; Pallin, L.; Read, A.; Moore, R.T.; Friedlaender, A. First description of migratory behavior of Humpback whales from an Antarctic feeding ground to a tropical calving ground. Anim. Biotelem. 2021, 9, 42. [Google Scholar] [CrossRef]
  7. Shadwick, R.E.; Potvin, J.; Goldbogen, J.A. Lunge Feeding in Rorqual Whales. Physiology 2019, 34, 409–418. [Google Scholar] [CrossRef]
  8. Laurie, A. Adaptations to Hydrostatic Pressure in Whales. Nature 1933, 132, 135–136. [Google Scholar] [CrossRef]
  9. Kleiber, M. Body size and metabolic rate. Physiol. Rev. 1932, 27, 511–541. [Google Scholar] [CrossRef]
  10. Krogh, A. The supply of oxygen to the tissues and the regulation of the capillary circulation. J. Physiol. 1919, 52, 457–474. [Google Scholar] [CrossRef]
  11. Hill, A.V. A new mathematical treatment of changes of ionic concentration in muscle and nerve under the action of electric currents, with a theory as to their mode of excitation. J. Physiol. 1910, 40, 190–224. [Google Scholar] [CrossRef] [PubMed]
  12. Kramer, D.L. The behavioral ecology of air breathing by aquatic animals. Can. J. Zool. 1988, 66, 89–94. [Google Scholar] [CrossRef]
  13. Dolphin, W.F. Ventilation and dive patterns of Humpback whales, Megaptera novaeangliae, on their Alaskan feeding grounds. Can. J. Zool. 1987, 65, 83–90. [Google Scholar] [CrossRef]
  14. MacArthur, R.H.; Pianka, E.R. On optimal use of a patchy environment. Am. Nat. 1966, 100, 603–609. [Google Scholar] [CrossRef]
  15. Houston, A.I.; Carbone, C. The optimal allocation of time during the diving cycle. Behav. Ecol. 1992, 3, 255–265. [Google Scholar] [CrossRef]
  16. Tyson, R.; Friedlaender, A.; Nowacek, D. Does optimal foraging theory predict the foraging performance of a large air-breathing marine predator? Anim. Behav. 2016, 116, 223–235. [Google Scholar] [CrossRef]
  17. Davis, R.W. A review of the multi-level adaptations for maximizing aerobic dive duration in marine mammals: From biochemistry to behavior. J. Comp. Physiol. B 2013, 184, 23–53. [Google Scholar] [CrossRef]
  18. Watanabe, Y.Y.; Goldbogen, J.A. Too big to study? The biologging approach to understanding the behavioural energetics of ocean giants. J. Exp. Biol. 2021, 224, jeb202747. [Google Scholar] [CrossRef]
  19. Kooyman, G.L. Techniques used in measuring diving capacities of Weddell Seals. Polar Rec. 1965, 12, 391–394. [Google Scholar] [CrossRef]
  20. Williams, T.M.; Davis, R.W. Physiological resiliency in diving mammals: Insights on hypoxia protection using the Krogh principle to understand COVID-19 symptoms. Comp. Biochem. Physiol. Part A Mol. Integr. Physiol. 2021, 253, 110849. [Google Scholar] [CrossRef]
  21. Palacios, D.M.; Irvine, L.M.; Lagerquist, B.A.; Fahlbusch, J.A.; Calambokidis, J.; Tomkiewicz, S.M.; Mate, B.R. A satellite-linked tag for the long-term monitoring of diving behavior in large whales. Anim. Biotelem. 2022, 10, 26. [Google Scholar] [CrossRef]
  22. Ware, C.; Arsenault, R.; Plumlee, M.; Wiley, D. Visualizing the underwater behavior of Humpback whales. IEEE Comput. Graph. Appl. 2006, 26, 14–18. [Google Scholar] [CrossRef]
  23. Potvin, J.; Goldbogen, J.A.; Shadwick, R.E. Metabolic Expenditures of Lunge Feeding Rorquals Across Scale: Implications for the Evolution of Filter Feeding and the Limits to Maximum Body Size. PLoS ONE 2012, 7, e44854. [Google Scholar] [CrossRef] [PubMed]
  24. Goldbogen, J.A.; Calambokidis, J.; Croll, D.A.; McKenna, M.F.; Oleson, E.; Potvin, J.; Pyenson, N.D.; Schorr, G.; Shadwick, R.E.; Tershy, B.R. Scaling of lunge-feeding performance in rorqual whales: Mass-specific energy expenditure increases with body size and progressively limits diving capacity. Funct. Ecol. 2011, 26, 216–226. [Google Scholar] [CrossRef]
  25. Goldbogen, J.A.; Calambokidis, J.; Croll, D.A.; Harvey, J.T.; Newton, K.M.; Oleson, E.M.; Schorr, G.; Shadwick, R.E. Foraging behavior of Humpback whales: Kinematic and respiratory patterns suggest a high cost for a lunge. J. Exp. Biol. 2008, 211, 3712–3719. [Google Scholar] [CrossRef] [PubMed]
  26. Kooyman, G.L.; Ponganis, P.J. The physiological basis of diving to depth: Birds and mammals. Annu. Rev. Physiol. 1998, 60, 19–32. [Google Scholar] [CrossRef]
  27. Stimmelmayr, R.; Horstmann, L.; Person, B.T.; George, J. Chapter 11—Hematology, serum, and urine composition. In The Bowhead Whale, Balaena mysticetu: Biology and Human Interactions; Elsevier: Amsterdam, The Netherlands, 2021; pp. 151–163. [Google Scholar] [CrossRef]
  28. Castellini, M.A.; Baskurt, O.; Castellini, J.M.; Meiselman, H.J. Blood Rheology in Marine Mammals. Front. Physiol. 2010, 1, 1–8. [Google Scholar] [CrossRef]
  29. Fahlman, A.; van der Hoop, J.; Moore, M.J.; Levine, G.; Rocho-Levine, J.; Brodsky, M. Estimating energetics in cetaceans from respiratory frequency: Why we need to understand physiology. Biol. Open 2016, 5, 436–442. [Google Scholar] [CrossRef]
  30. Piscitelli, M.A.; Raverty, S.A.; Lillie, M.A.; Shadwick, R.E. A review of cetacean lung morphology and mechanics: Cetacean lung morphology and mechanics. J. Morphol. 2013, 274, 1425–1440. [Google Scholar] [CrossRef]
  31. Ommanney, F.D. The vascular networks (retia mirabilia) of the Fin whale (Balaenoptera physalus). Discov. Rep. 1932, 5, 327–362. [Google Scholar]
  32. Laurie, A. Physiology of Whales. Nature 1935, 135, 823. [Google Scholar] [CrossRef]
  33. Bosco, G.; Rizzato, A.; Martani, L.; Schiavo, S.; Talamonti, E.; Garetto, G.; Paganini, M.; Camporesi, E.M.; Moon, R.E. Arterial Blood Gas Analysis in Breath-Hold Divers at Depth. Front. Physiol. 2018, 9, 1558. [Google Scholar] [CrossRef] [PubMed]
  34. Tetzlaff, K.; Lemaitre, F.; Burgstahler, C.; Luetkens, J.A.; Eichhorn, L. Going to Extremes of Lung Physiology–Deep Breath-Hold Diving. Front. Physiol. 2021, 12, 710429. [Google Scholar] [CrossRef] [PubMed]
  35. Eaton, W.A.; Henry, E.R.; Hofrichter, J.; Mozzarelli, A. Is cooperative oxygen binding by hemoglobin really understood? Nat. Struct. Biol. 1999, 6, 351–358. [Google Scholar] [CrossRef] [PubMed]
  36. Poole, D.C.; Musch, T.I. Capillary-Mitochondrial Oxygen Transport in Muscle: Paradigm Shifts. Function 2023, 4, zqado13. [Google Scholar] [CrossRef]
  37. Guarini, J.M.; Coston-Guarini, J. A First Individual-Based Model to Simulate Humpback Whale (Megaptera novaeangliae) Migrations at the Scale of the Global Ocean. J. Mar. Sci. Eng. 2022, 10, 1412. [Google Scholar] [CrossRef]
  38. Gough, W.T.; Segre, P.S.; Bierlich, K.C.; Cade, D.E.; Potvin, J.; Fish, F.E.; Dale, J.; di Clemente, J.; Friedlaender, A.S.; Johnston, D.W.; et al. Scaling of swimming performance in baleen whales. J. Exp. Biol. 2019, 222, jeb204172. [Google Scholar] [CrossRef]
  39. Kahane-Rapport, S.R.; Goldbogen, J.A. Allometric scaling of morphology and engulfment capacity in rorqual whales. J. Morphol. 2018, 279, 1256–1268. [Google Scholar] [CrossRef]
  40. Patial, J.S. A Study on Mensuration with Special Reference to Ellipse and Ellipsoid. J. Res. Appl. Math. 2023, 9, 1–13. [Google Scholar]
  41. Lockyer, C. Body weights of some species of large whales. ICES J. Mar. Sci. 1976, 36, 259–273. [Google Scholar] [CrossRef]
  42. Ryg, M.; Lydersen, C.; Knutsen, L.Ø.; Bjørge, A.; Smith, T.G.; ØRitsland, N.A. Scaling of insulation in seals and whales. J. Zool. 1993, 230, 193–206. [Google Scholar] [CrossRef]
  43. Stephens, P.A.; Carbone, C.; Boyd, I.L.; McNamara, J.M.; Harding, K.C.; Houston, A.I. The Scaling of Diving Time Budgets: Insights from an Optimality Approach. Am. Nat. 2008, 171, 305–314. [Google Scholar] [CrossRef]
  44. Ridgway, S.H.; Bowers, C.A.; Miller, D.; Schultz, M.L.; Jacobs, C.A.; Dooley, C.A. Diving and blood oxygen in the white whale. Can. J. Zool. 1984, 62, 2349–2351. [Google Scholar] [CrossRef]
  45. Vogel, S. Life in Moving Fluids, 2nd ed.; Princeton University Press: Princeton, NJ, USA, 1994. [Google Scholar]
  46. Narazaki, T.; Isojunno, S.; Nowacek, D.P.; Swift, R.; Friedlaender, A.S.; Ramp, C.; Smout, S.; Aoki, K.; Deecke, V.B.; Sato, K.; et al. Body density of Humpback whales (Megaptera novaengliae) in feeding aggregations estimated from hydrodynamic gliding performance. PLoS ONE 2018, 13, e0200287. [Google Scholar] [CrossRef]
  47. Daniel, T.L. Unsteady Aspects of Aquatic Locomotion. Am. Zool. 1984, 24, 121–134. [Google Scholar] [CrossRef]
  48. Cade, D.E.; Friedlaender, A.S.; Calambokidis, J.; Goldbogen, J.A. Kinematic Diversity in Rorqual Whale Feeding Mechanisms. Curr. Biol. 2016, 26, 2617–2624. [Google Scholar] [CrossRef] [PubMed]
  49. Popel, A.S. Theory of oxygen transport to tissue. Crit. Rev. Biomed. Eng. 1989, 17, 257–321. [Google Scholar] [PubMed]
  50. Helbo, S.; Fago, A. Functional properties of myoglobins from five whale species with different diving capacities. J. Exp. Biol. 2012, 215, 3403–3410. [Google Scholar] [CrossRef]
  51. Michael Panneton, W. The Mammalian Diving Response: An Enigmatic Reflex to Preserve Life? Physiology 2013, 28, 284–297. [Google Scholar] [CrossRef]
  52. Hind, A.T.; Gurney, W.S.C. The Metabolic Cost Of Swimming In Marine Homeotherms. J. Exp. Biol. 1997, 200, 531–542. [Google Scholar] [CrossRef]
  53. Woledge, R.C.; Curtin, N.A.; Homsher, E. Energetic Aspects of Muscle Contraction; Number 41 in Monographs of the Physiological Society; Academic Press: London, UK, 1985; pp. 1–357. [Google Scholar]
  54. Popescu, M.C.; Balas, V.; Perescu-Popescu, L.; Mastorakis, N. Multilayer Perceptron and Neural Networks. WSEAS Trans. Circuits Syst. 2009, 8, 579–588. [Google Scholar]
  55. Boulila, W.; Driss, M.; Alshanqiti, E.; Al-Sarem, M.; Saeed, F.; Krichen, M. Weight Initialization Techniques for Deep Learning Algorithms in Remote Sensing: Recent Trends and Future Perspectives. In Advances on Smart and Soft Computing; Springer: Berlin/Heidelberg, Germany, 2021; Volume 1399, pp. 477–484. [Google Scholar] [CrossRef]
  56. Laplanche, C.; Marques, T.A.; Thomas, L. Tracking marine mammals in 3D using electronic tag data. Methods Ecol. Evol. 2015, 6, 987–996. [Google Scholar] [CrossRef]
  57. Wiley, D.; Ware, C.; Bocconcelli, A.; Cholewiak, D.; Friedlaender, A.S.; Thompson, M.A.; Weinrich, M.T. Underwater components of Humpback whale bubble-net feeding behaviour. Behaviour 2011, 148, 575–602. [Google Scholar] [CrossRef]
  58. Mastick, N.C.; Wiley, D.; Cade, D.E.; Ware, C.; Parks, S.E.; Friedlaender, A.S. The effect of group size on individual behavior of bubble-net feeding Humpback whales in the southern Gulf of Maine. Mar. Mammal Sci. 2022, 38, 959–974. [Google Scholar] [CrossRef]
  59. Szabo, A.; Bejder, L.; Warick, H.; van Aswegen, M.; Friedlaender, A.S.; Goldbogen, J.; Kendall-Bar, J.M.; Leunissen, E.M.; Angot, M.; Gough, W.T. Solitary Humpback whales manufacture bubble-nets as tools to increase prey intake. R. Soc. Open Sci. 2024, 11, 240328. [Google Scholar] [CrossRef] [PubMed]
  60. Davies, N.B.; Krebs, J.R. (Eds.) Behavioural Ecology, 4th ed.; Blackwell Science: Oxford, UK, 1997. [Google Scholar]
  61. Doniol-Valcroze, T.; Lesage, V.; Giard, J.; Michaud, R. Optimal foraging theory predicts diving and feeding strategies of the largest marine predator. Behav. Ecol. 2011, 22, 880–888. [Google Scholar] [CrossRef]
  62. Friedlaender, A.S.; Johnston, D.W.; Tyson, R.B.; Kaltenberg, A.; Goldbogen, J.A.; Stimpert, A.K.; Curtice, C.; Hazen, E.L.; Halpin, P.N.; Read, A.J.; et al. Multiple-stage decisions in a marine central-place forager. R. Soc. Open Sci. 2016, 3, 160043. [Google Scholar] [CrossRef]
  63. Pierce, G.J.; Ollason, J.G. Eight Reasons Why Optimal Foraging Theory Is a Complete Waste of Time. Oikos 1987, 49, 111. [Google Scholar] [CrossRef]
  64. Videsen, S.K.A.; Simon, M.; Christiansen, F.; Friedlaender, A.; Goldbogen, J.; Malte, H.; Segre, P.; Wang, T.; Johnson, M.; Madsen, P.T. Cheap gulp foraging of a giga-predator enables efficient exploitation of sparse prey. Sci. Adv. 2023, 9, eade3889. [Google Scholar] [CrossRef]
  65. Christiansen, F.; Sironi, M.; Moore, M.J.; Di Martino, M.; Ricciardi, M.; Warick, H.A.; Irschick, D.J.; Gutierrez, R.; Uhart, M.M. Estimating body mass of free-living whales using aerial photogrammetry and 3D volumetrics. Methods Ecol. Evol. 2019, 10, 2034–2044. [Google Scholar] [CrossRef]
  66. Napoli, C.; Hirtle, N.; Stepanuk, J.; Christiansen, F.; Heywood, E.I.; Grove, T.J.; Stoller, A.; Dodds, F.; Glarou, M.; Rasmussen, M.H.; et al. Drone-based photogrammetry reveals differences in Humpback whale body condition and mass across North Atlantic foraging grounds. Front. Mar. Sci. 2024, 11, 1336455. [Google Scholar] [CrossRef]
  67. Zhang, D.; van der Hoop, J.M.; Petrov, V.; Rocho-Levine, J.; Moore, M.J.; Shorter, K.A. Simulated and experimental estimates of hydrodynamic drag from bio-logging tags. Mar. Mammal Sci. 2019, 36, 136–157. [Google Scholar] [CrossRef]
  68. Wu, C.; Nowacek, D.P.; Nousek-McGregor, A.E.; McGregor, R.; Howle, L.E. Computational fluid dynamics of flow regime and hydrodynamic forces generated by a gliding North Atlantic right whale (Eubalaena glacialis). Mar. Mammal Sci. 2021, 37, 826–842. [Google Scholar] [CrossRef]
  69. Hirtle, N.O.; Stepanuk, J.E.F.; Heywood, E.I.; Christiansen, F.; Thorne, L.H. Integrating 3D models with morphometric measurements to improve volumetric estimates in marine mammals. Methods Ecol. Evol. 2022, 13, 2478–2490. [Google Scholar] [CrossRef]
  70. Christiansen, F.; Sprogis, K.R.; Gross, J.; Castrillon, J.; Warick, H.A.; Leunissen, E.; Bengtson Nash, S. Variation in outer blubber lipid concentrations does not reflect morphological body condition in Humpback whales. J. Exp. Biol. 2020, 223, jeb213769. [Google Scholar] [CrossRef]
  71. Sun, T.; Chen, G.; Yang, S.; Wang, Y.; Wang, Y.; Tan, H.; Zhang, L. Design and optimization of a bio-inspired hull shape for AUV by surrogate model technology. Eng. Appl. Comput. Fluid Mech. 2021, 15, 1057–1074. [Google Scholar] [CrossRef]
  72. Miller, C.; Best, P.; Perryman, W.; Baumgartner, M.; Moore, M. Body shape changes associated with reproductive status, nutritive condition and growth in Right whales Eubalaena glacialis and E. australis. Mar. Ecol. Prog. Ser. 2012, 459, 135–156. [Google Scholar] [CrossRef]
  73. Williamson, G.R. The true body shape of rorqual whales. J. Zool. 1972, 167, 277–286. [Google Scholar] [CrossRef]
  74. Goldbogen, J.A.; Cade, D.E.; Wisniewska, D.M.; Potvin, J.; Segre, P.S.; Savoca, M.S.; Hazen, E.L.; Czapanskiy, M.F.; Kahane-Rapport, S.R.; DeRuiter, S.L.; et al. Why whales are big but not bigger: Physiological drivers and ecological limits in the age of ocean giants. Science 2019, 366, 1367–1372. [Google Scholar] [CrossRef]
  75. Goldbogen, J.A.; Potvin, J.; Shadwick, R.E. Skull and buccal cavity allometry increase mass-specific engulfment capacity in Fin whales. Proc. R. Soc. B Biol. Sci. 2009, 277, 861–868. [Google Scholar] [CrossRef]
  76. Segre, P.S.; Gough, W.T.; Roualdes, E.A.; Cade, D.E.; Czapanskiy, M.F.; Fahlbusch, J.; Kahane-Rapport, S.R.; Oestreich, W.K.; Bejder, L.; Bierlich, K.C.; et al. Scaling of maneuvering performance in baleen whales: Larger whales outperform expectations. J. Exp. Biol. 2022, 225, jeb243224. [Google Scholar] [CrossRef]
  77. Zhang, H.; Van Kaick, O.; Dyer, R. Spectral Mesh Processing. Comput. Graph. Forum 2010, 29, 1865–1894. [Google Scholar] [CrossRef]
  78. Shen, L.; Kim, S.; Saykin, A.J. Fourier method for large-scale surface modeling and registration. Comput. Graph. 2009, 33, 299–311. [Google Scholar] [CrossRef]
  79. Xue, G.; Bai, F.; Guo, L.; Ren, P.; Liu, Y. Research on the effects of complex terrain on the hydrodynamic performance of a deep-sea fishlike exploring and sampling robot moving near the sea bottom. Front. Mar. Sci. 2023, 10, 1091523. [Google Scholar] [CrossRef]
  80. Scott, C. Misconceptions about Aerobic and Anaerobic Energy Expenditure. J. Int. Soc. Sport. Nutr. 2005, 2, 32–37. [Google Scholar] [CrossRef] [PubMed]
  81. Rivero, J.L.L. Locomotor muscle fiber heterogeneity and metabolism in the fastest large-bodied rorqual: The Fin whale (Balaenoptera physalus). J. Exp. Biol. 2018, 221, jeb177758. [Google Scholar] [CrossRef] [PubMed]
  82. Sierra, E.; Fernández, A.; Espinosa de los Monteros, A.; Díaz-Delgado, J.; Bernaldo de Quirós, Y.; García-Álvarez, N.; Arbelo, M.; Herráez, P. Comparative histology of muscle in free ranging cetaceans: Shallow versus deep diving species. Sci. Rep. 2015, 5, 15909. [Google Scholar] [CrossRef] [PubMed]
  83. Salin, K.; Auer, S.K.; Rey, B.; Selman, C.; Metcalfe, N.B. Variation in the link between oxygen consumption and ATP production, and its relevance for animal performance. Proc. R. Soc. B Biol. Sci. 2015, 282, 20151028. [Google Scholar] [CrossRef]
  84. Gunnufsen, R. Dive Behaviour and Respiration Rates of Humpback Whales (Megaptera novaeangliae) During Foraging off Northern Norway, with Implications for Metabolic Rate Estimates. Master’s Thesis, The Arctic University of Norway, Faculty of Bioscience, Fisheries and Economics, Tromsø, Norway, 2022. [Google Scholar]
  85. Roos, M.M.H. Respiratory Behaviour in Migrating Lactating Humpback Whales. Ph.D. Thesis, University of Queensland (Australia), School of Veterinary Science, Brisbane, Australia, 2021. [Google Scholar] [CrossRef]
  86. Horton, T.W.; Hauser, N.; Cassel, S.; Klaus, K.F.; Fettermann, T.; Key, N. Doctor Drone: Non-invasive Measurement of Humpback Whale Vital Signs Using Unoccupied Aerial System Infrared Thermography. Front. Mar. Sci. 2019, 6, 466. [Google Scholar] [CrossRef]
  87. Tyson, R.; Friedlaender, A.; Ware, C.; Stimpert, A.; Nowacek, D. Synchronous mother and calf foraging behaviour in humpback whales Megaptera novaeangliae: Insights from multi-sensor suction cup tags. Mar. Ecol. Prog. Ser. 2012, 457, 209–220. [Google Scholar] [CrossRef]
  88. McKnight, J.C.; Bennett, K.A.; Bronkhorst, M.; Russell, D.J.F.; Balfour, S.; Milne, R.; Bivins, M.; Moss, S.E.W.; Colier, W.; Hall, A.J.; et al. Shining new light on mammalian diving physiology using wearable near-infrared spectroscopy. PLoS ONE 2019, 17, e3000306. [Google Scholar] [CrossRef]
  89. Fahlman, A.; Moore, M.J.; Garcia-Parraga, D. Respiratory function and mechanics in pinnipeds and cetaceans. J. Exp. Biol. 2017, 220, 1761–1773. [Google Scholar] [CrossRef]
  90. Reidenberg, J.S. Where does the air go? Anatomy and functions of the respiratory tract in the Humpback whale (Megaptera novaeangliae). Madag. Conserv. Dev. 2018, 13, 91. [Google Scholar] [CrossRef]
  91. Riggs, A. Bohr Effect in the Hæmoglobins of Marine Mammals. Nature 1961, 190, 94–95. [Google Scholar] [CrossRef] [PubMed]
  92. Boyd, I.L.; Bowen, W.D.; Iverson, S.J. (Eds.) Marine Mammal Ecology and Conservation: A Handbook of Techniques; Techniques in ecology and conservation series; Oxford University Press: Oxford, UK, 2010. [Google Scholar]
  93. Goldbogen, J.A.; Cade, D.E.; Calambokidis, J.; Czapanskiy, M.F.; Fahlbusch, J.; Friedlaender, A.S.; Gough, W.T.; Kahane-Rapport, S.R.; Savoca, M.S.; Ponganis, K.V.; et al. Extreme bradycardia and tachycardia in the world’s largest animal. Proc. Natl. Acad. Sci. USA 2019, 116, 25329–25332. [Google Scholar] [CrossRef] [PubMed]
  94. Croll, D.A.; Acevedo-Gutierrez, A.; Tershy, B.R.; Urban-Ramirez, J. The diving behavior of Bue and Fin whales: Is dive duration shorter than expected based on oxygen stores? Comp. Biochem. Physiol. Part A Mol. Integr. Physiol. 2001, 129, 797–809. [Google Scholar] [CrossRef] [PubMed]
  95. Thompson, D.; Fedak, M.A. How long should a dive last? A simple model of foraging decisions by breath-hold divers in a patchy environment. Anim. Behav. 2001, 61, 287–296. [Google Scholar] [CrossRef]
  96. Tian, R.; Yin, D.; Liu, Y.; Seim, I.; Xu, S.; Yang, G. Adaptive Evolution of Energy Metabolism-Related Genes in Hypoxia-Tolerant Mammals. Front. Genet. 2017, 8, 205. [Google Scholar] [CrossRef]
  97. Ponganis, P.J.; McDonald, B.I. Chapter 5—Cardiovascular physiology in dolphins and other cetaceans. In The Physiology of Dolphins; Elsevier: Amsterdam, The Netherlands, 2024; pp. 77–105. [Google Scholar] [CrossRef]
  98. Ydenberg, R.; Clark, C.W. Aerobiosis and anaerobiosis during diving by Western Grebes: An optimal foraging approach. J. Theor. Biol. 1989, 139, 437–447. [Google Scholar] [CrossRef]
  99. Kooyman, G.L.; Wahrenbrock, E.A.; Castellini, M.A.; Davis, R.W.; Sinnett, E.E. Aerobic and anaerobic metabolism during voluntary diving in Weddell seals: Evidence of preferred pathways from blood chemsitry and behavior. J. Comp. Physiol. B 1980, 138, 335–346. [Google Scholar] [CrossRef]
  100. Carbone, C.; Houston, A. The optimal allocation of time over the dive cycle: An approach based on aerobic and anaerobic respiration. Anim. Behav. 1996, 51, 1247–1255. [Google Scholar] [CrossRef]
  101. McKnight, J.C.; Bønnelycke, E.M.; Balfour, S.; Milne, R.; Moss, S.E.W.; Armstrong, H.C.; Downie, C.; Hall, A.J.; Kershaw, J.L. Cognitive perception of circulating oxygen in seals is the reason they don’t drown. Science 2025, 387, 1276–1280. [Google Scholar] [CrossRef] [PubMed]
  102. Cade, D.E.; Kahane-Rapport, S.R.; Wallis, B.; Goldbogen, J.A.; Friedlaender, A.S. Evidence for Size-Selective Predation by Antarctic Humpback Whales. Front. Mar. Sci. 2022, 9, 747788. [Google Scholar] [CrossRef]
  103. Akiyama, Y.; Akamatsu, T.; Rasmussen, M.H.; Iversen, M.R.; Iwata, T.; Goto, Y.; Aoki, K.; Sato, K. Leave or stay? Video-logger revealed foraging efficiency of humpback whales under temporal change in prey density. PLoS ONE 2019, 14, e0211138. [Google Scholar] [CrossRef] [PubMed]
  104. Braithwaite, J.E.; Meeuwig, J.J.; Hipsey, M.R. Optimal migration energetics of humpback whales and the implications of disturbance. Conserv. Physiol. 2015, 3, cov001. [Google Scholar] [CrossRef]
  105. Sánchez-Ibáñez, J.R.; Pérez-del Pulgar, C.J.; García-Cerezo, A. Path Planning for Autonomous Mobile Robots: A Review. Sensors 2021, 21, 7898. [Google Scholar] [CrossRef]
  106. Gough, W.T.; Cade, D.E.; Czapanskiy, M.F.; Potvin, J.; Fish, F.E.; Kahane-Rapport, S.R.; Savoca, M.S.; Bierlich, K.C.; Johnston, D.W.; Friedlaender, A.S.; et al. Fast and Furious: Energetic Tradeoffs and Scaling of High-Speed Foraging in Rorqual Whales. Integr. Org. Biol. 2022, 4, obac038. [Google Scholar] [CrossRef]
  107. Peterson, C. On some biological principles. Det Kgl. Dan. Vidensk. Selsk. Biol. Meddeleser 1928, VII, 1–53. [Google Scholar]
Figure 1. Informational flow scheme of the humpback whale diving model. The model is organized into three cycles driven by environmental information perceived (blue arrows) and internal biological information exchanges (black arrows). The main mechanical movements included are swimming, diving and engulfment. These three interacting cycles produce the behavioral dynamics of individuals (see text for details).
Jmse 13 01388 g001
Figure 2. Test simulation of the oxygen saturation hypothesis during an extended period of surface swimming with variable speeds. The simulation is for a 10,000 kg whale; the x, y and z coordinates of the axes are indicated in m. (a.) Oxygen content in the lungs, blood and muscles and two dissolved components: blood, B d , and muscle, M d . As expected, the oxygen content in all the body compartments at equilibrium is constant during the test. (b.) A plot of the force (change in line radius) and velocity (color scale) changes during the 3 h random trajectory, covering a swimming distance of 24,887 m. The peak speed reached was 3.56 m·s−1. Note that the plot was rotated 90° counterclockwise and that the higher velocities correspond to a larger muscular force.
Jmse 13 01388 g002
Figure 3. Surface describing how dive estimators vary as a function of whale individual masses and the average steady-state velocities reached in the model system. (a.) Theoretical maximum dive duration in min. (b.) Theoretical maximum dive distance in m.
Jmse 13 01388 g003
Figure 4. Validation of the multi-layer perceptron training step. The + signs indicate the Mean Square Error calculated at each successive iteration, showing the convergence of the perceptron optimization algorithm during training. The threshold value (dashed line) is fixed at 10 4 iterations and the convergence is assumed to be complete when it reaches the threshold before the maximum number of iterations allowed (50,000). Example shown is from the dive in Figure 5a.
Jmse 13 01388 g004
Figure 5. Examples of typical dive patterns simulated for a 10,000 kg humpback whale (x, y and z coordinates of the axes are indicated in m). The line radius changes according to the relative force exerted by the whale. The color scale shows relative velocity changes; all the velocities in the simulations plotted are normalized by the highest value found in the set (3.185 m·s−1, plot (d.)). Plots a. and b. show two dives without foraging: (a.) a deep dive, actual velocity range: 0 to 0.96 m·s−1; (b.) a complex dive, actual velocity range: 0 to 0.41 m·s−1. Plots (c.,d.) show how foraging dynamics can be simulated: (c.) consecutive engulfments at three different depths, 50 m, actual velocity ranges: 0 to 1.18 m·s−1; 100 m, 0 to 1.14 m·s−1; and 150 m, 0 to 0.99 m·s−1. (d.) Example of a bubble net foraging behavior sequence in 3D (d.) and in plan view (e.); actual velocity range: 0 to 3.185 m·s−1.
Jmse 13 01388 g005
Figure 6. Foraging dive engulfment dynamics simulated for a whale of 10,000 kg. Three forage diving depth scenarios were simulated at ca. 50 m, 100 m and 150 m. The descent speed was set to 1.5 m·s−1 and the maximum speed before lunging was 2.5 m·s−1.
Jmse 13 01388 g006
Figure 7. Effect of drag force changes on the forward movement of a 10,000 kg whale during three consecutive engulfments. Plot shows how the velocity profile changes when the difference between the drag force on the body, with and without the engulfed water volume, is increased by a factor of 2× to 64×. To emphasize the effect, the interval between engulfment events was set to 120 s for the simulation.
Jmse 13 01388 g007
Figure 8. Overview of the semi-autonomous humpback whale diving model. The model simulates a complete surface-to-surface dive cycle of an individual humpback whale that can be repeated automatically. The dive has four parts: dive initiation (immersion and apnea), diving activity intervals, the return-to-surface decision and the post-dive recovery interval. At the start of a dive, the whale is swimming with fully oxygenated lungs and tissues. Immersion triggers a hypothetical sensory complex apneic reflex inspired by the breathing rate response to facial immersion, as described in human physiology. The reflex switch is defined as an automatic, rapid, reversible response to stimulation. Several decisions can be made during the dive: exploring, engulfment or even spiraling to create a bubble net. At some point, the whale ‘decides’ when to return to the surface, based on a change in the perceptron state. When the individual returns to the surface (1 atm P = 1 bar), the apneic state is reversed and breathing resumes, and the whale begins its post-dive recovery phase when body blood and tissues are re-oxygenated. After the oxygenation state returns to pre-dive conditions, the whale is ready to dive again, closing the dive cycle.
Jmse 13 01388 g008
Disclaimer/Publisher’s Note: The statements, opinions and data contained in all publications are solely those of the individual author(s) and contributor(s) and not of MDPI and/or the editor(s). MDPI and/or the editor(s) disclaim responsibility for any injury to people or property resulting from any ideas, methods, instructions or products referred to in the content.