Article

Effect of Biological Fouling on the Dynamic Responses of Integrated Foundation Structure of Floating Wind Turbine and Net Cage

1
Key Laboratory of High Performance Ship Technology (Wuhan University of Technology), Ministry of Education, Wuhan 430063, China
2
School of Naval Architecture, Ocean and Energy Power Engineering, Wuhan University of Technology, Wuhan 430063, China
3
School of Civil Engineering and Architecture, East China Jiaotong University, Nanchang 330013, China
4
State Key Laboratory of Geomechanics and Geotechnical Engineering Safety, Institute of Rock and Soil Mechanics, Chinese Academy of Sciences, Wuhan 430010, China
*
Authors to whom correspondence should be addressed.
J. Mar. Sci. Eng. 2025, 13(7), 1372; https://doi.org/10.3390/jmse13071372
Submission received: 17 June 2025 / Revised: 7 July 2025 / Accepted: 16 July 2025 / Published: 18 July 2025
(This article belongs to the Section Ocean Engineering)

Abstract

This paper proposes a novel integrated foundation structure of floating wind turbine and net cage by combining large capacity semi-submersible wind turbines with aquaculture cages. The research mainly focuses on the effect of biological fouling on net cage structures and safety performance of mooring systems. The study firstly validates the simplified model of net cage through comparing with results of existing scaled experimental models. Then, a hydrodynamic analysis is conducted on the net cage model to obtain the RAOs of motion response of the structure under frequency-domain analysis, and damping correction is also carried out on the structure. Finally, time-domain analyses under irregular wave conditions are conducted to evaluate the effects of biofouling fouling on motion responses of net cage foundation and tensions of mooring lines.

1. Introduction

In recent years, the resource constraints in nearshore waters and environmental pollution issues have spurred the demand for large-scale development of deep-sea aquaculture [1,2]. Driven by global energy transition strategies and blue economy initiatives, the integrated development of offshore floating wind power and deep-sea aquaculture has emerged as a cutting-edge direction for comprehensive marine resource utilization [3]. This composite structure enhances resource utilization efficiency through shared mooring facilities and optimized spatial allocation of marine areas, while simultaneously reducing operational cost [4,5,6]. It is demonstrated that border marine space and superior water quality condition in deep-sea region could be crucial to increase the production of healthy fish [7,8]. Therefore, these environmental advantages concurrently are beneficial to lower disease incidence rates in fish populations and to decrease feed wastage [9,10]. Germany was the first to conduct small-scale algae cultivation experiments in the North Sea wind farm as early as 1990. However, due to technical limitations, the early grid system was insufficient in strength under harsh sea conditions [11,12]. Furthermore, in 2016, South Korea initiated the construction of its first large-scale offshore wind farm integrated with seaweed and shellfish cultivation off its southeastern coast. This project aimed to develop a tension leg platform (TLP) combined with a seaweed cultivation system [13]. The semi-submersible platform to be put into operation in Fujian, China in 2024 marks the birth of the world’s first commercialized wind-fish integration project, innovatively achieving the integrated integration of the wind turbine foundation and the cage aquaculture system.
The semi-submersible offshore aquaculture platform as an emerging technological approach has garnered significant attention due to its superior wave resistance capabilities [1,2]. Its fundamental configuration typically comprises a main platform, aquaculture cage systems, mooring systems and associated auxiliary facilities [14]. Through rational structural design, such platforms can not only maintain stability under extreme marine conditions but also achieve efficient fishery production [2]. Therefore, a plenty of scholars have proposed various innovative solutions for system design level of this platforms. Zhang et al. employed a fully coupled aero-hydro-elastic-servo-mooring dynamics model to evaluate the synergistic effects between steel aquaculture cages and floating wind turbines of FOWT-AC system [15]. It was shown that the integrated FOWT-AC system exhibited excellent anti-overturning capability under the selected wind-wave combined conditions. In addition, better motion response characteristics and higher stability could be found in the optimized semi-submersible platforms made of porous shell structures, significant performance improvements in pitch and heave degrees of freedom could also be observed by Yao et al. [16]. Simultaneously, the WindFloat-type floating offshore wind turbine mooring system designed for 60 m water depth exhibited satisfactory performance under various wind-wave combination conditions, applied loading on the wind turbine tower and tension on the mooring line remained in a proper range by Gao et al. [17].
The selection of numerical models and theoretical methods exerts significant influence on the structural response and fatigue life assessment of floating wind turbines. Han et al. demonstrated that Morison equation was more suitable for low-frequency resonance capture, while potential flow theory was more applicable in high frequency response prediction [18]. Through systematic simulations encompassing respectively regular waves, irregular waves and combined wind-wave interactions, Han et al. established that potential flow theory achieves higher accuracy in heave response predictions, whereas certain deviation still existed in bending moment calculations at tower base [18]. Gong et al. revealed that vortex-induced vibrations may trigger large-scale bending mode vibrations within specific wind speed ranges, whereas the possibility of significant vibration in the rigid body mode was relatively lower by using a rigid-flexible coupling dynamic model based on Lagrange equations [19]. Regarding innovations in numerical simulation methodologies, a coupled finite element-Morison model had successfully quantified hydrodynamic response deviations in net cage structures by Ma et al. [20,21]. This integrated approach not only enabled error quantified but also deeply studied the effect of environmental factors and net cage parameters on the performance of net cage structures [22]. The Response amplitude operators (RAO) and acceleration response spectra of WindFloat-type platforms were meticulously measured and validated by comparing with benchmark models [23]. Such investigations provide reliable data support for the design of future floating wind turbine. Furthermore, Robertson A.N. et al. conducted comprehensive validation of the OC4-DeepCwind platform model using FAST software by systematically comparing computational extreme loads and fatigue loads derived from eight distinct wave-only and combined wind-wave test scenarios against experimental data from testing model at scale ratio of 1:50 [24]. Calibration procedures were rigorously implemented under wind-only, and wave-only operational conditions to validate the model. Concurrently, extreme weather conditions including intense winds, colossal waves, and rapid currents impose increase demands on the stability and durability of aquaculture infrastructure by Huang et al. [25] and Kristiansen et al. [26]. According to physical model tests, when aquaculture net panels extend above the water surface, the wave-induced loads acting on the emerged net structures are 200% greater than those on fully submerged counterparts, a phenomenon primarily attributed to water jet effects during wave-structure interactions by Chen et al. [27]. Therefore, the design process should thoroughly account for the coupled effects of numerical modeling methodologies and structural net configuration design on the dynamic response characteristics and hydrodynamic stability performance of paltforms.
The stability issue of aquaculture facilities in strong current environments has persistently been a significant research challenge. DeCew et al. revealed that net solidity is a key parameter to determine submergence depth of small-sized fish cages [28]. As current velocity increased, the system could undergo a transitional process from a floating state to an unstable submerged state. Furthermore, biofouling had been considered as a pivotal challenge to restrict the long-term operation of marine ranching infrastructure by Li et al. and Liu et al. [29,30]. Bi et al. indicated that biological communities adhering to net surface areas could induce substantial alterations in hydrodynamic characteristics of aquaculture facilities, potentially increasing drag forces to over tenfold greater than their original values [31]. Moreover, biological fouling can lead to a significant increase in the drag coefficient of the cage, up to 240% of the clean state at most, among which the growth of sea anemone organisms is particularly obvious according to Swift et al. and Nobakht-Kolur et al. [32,33]. Nobakht-Kolur et al. also further found that biological fouling did not only increase the flow velocity gradient in the local area, but also led to an intensification of wave height attenuation in the downstream area [33].
As a key component of fish farms, fluid-structure coupling effect of the net cage structure directly affected the strength of the main structure. Chen et al. found that higher current velocities significantly amplified the effects of net presence, which could lead to an increase in leg column stress and truss utilization rate of cage structures [34]. Mechanical characteristics and deformation of flexible circular net structures under diverse steady-state flow velocities were systematically investigated. When additional weight at the bottom was different, overall force and deformation of the net cage structure existed significant differences. Three different sizes of bottom counterweights were adopted in the experiments. Lader and Enerhaug concluded that the size of the counterweights directly affects the stiffness and stability of the net structure [35]. To evaluate the dynamic behavior of flexible network structures more accurately, a variety of numerical simulation methods were also proposed. Among them, a commonly used method was to regard the grid as a porous medium and simulated it in combination with Computational Fluid Dynamics (CFD). This method could not only capture the complex flow field characteristics, but also effectively predicted the force conditions of downstream structures according to Cheng et al. [36]. In addition to its own material properties, the external flow environment is also one of the key factors determining the mechanical behaviors of the network structure. Fan et al. thought that both wave forces and tidal currents could cause significant displacements and deformations in the net structure, therefore, utilization rate of aquaculture space was reduced and health of organisms was threaten [37]. Especially under the conditions of strong winds or rapid currents, net structures could suffer irreversible damage, seriously affecting the safety of the aquaculture system. Therefore, an appropriate net structure should be selected with the aim of maintaining the structural stability and service life. In this paper, a numerical method to simplify the net cage structures is validated by comparing numerical modelling and existing experimental results and then a novel integrated foundation structure of floating wind turbine and net cage with catenary and taut mooring systems is proposed. Finally, this study focuses on the effect of biological fouling on integrated net cage foundation and safety performance of mooring lines.

2. Methods and Materials

2.1. Numerical Methods

2.1.1. Potential Flow Theory

As the fluid is assumed to be incompressible and irrotational characterized by micro amplitude waves based on potential flow theory, its velocity potential function could be defined and the velocity potential can be devided as Equation (1):
Φ x , y , z = Φ r + Φ ω + Φ d
where Φ r represents the radiation potential, generated by the motion-induced disturbance of the floating structure. Φ ω denotes the incident potential of waves without interference from floating structures. Φ d represents the wave diffraction potential generated after the wave passes through the floating body. The first-order velocity potential in the flow field satisfies the Laplace equation and associated boundary conditions. Once the velocity potential function is obtained, the fluid velocity can be derived by taking partial derivatives of the potential function with respect to spatial coordinates.

2.1.2. Morison’s Equation

Morison’s equation is a classical formulation in engineering practice to calculate wave and hydrodynamic forces acting on marine structures [38]. The fluid forces acting on the structures could be devided into two distinct components including inertial force and drag force based on the Morison’s equation. Morison’s equation could be expressed as Equation (2),
F t = 1 2 ρ C D A u t u t + ρ C M V du t dt
where F is total hydrodynamic force acting on the structure, ρ is fluid density, C D is drag coefficient, C M is added mass coefficient, A is frontal projected area of the structure, V is volume of the structure, u t is velocity of the fluid relative to the structure, du t dt is acceleration of the fluid relative to the structure.

2.1.3. Wind Loads

The formula of wind load could be expressed as Equation (3) [39]:
F wind = 1 2 C dw ρ a A a U 2 M wind = 1 2 C dw ρ a A a U 2 L
C dw = C s × C h
where C s denotes shape coefficient of one structural member and C h represents height coefficient of one structural member. U is the relative wind velocity. L denotes the distance from the force application point to the buoy. A a is the projected area of the buoy in the direction of the wind.

2.1.4. A Simplified Cage Model

For knotless net structures, screen model could be predominantly employed according to Fredriksson et al. [40]. The most important parameter in this model is solidity ratio S n , which is defined as ratio of the actual area to the projected area of the netting. The solidity ratio of equivalent fishing netting in the model should maintain the same as that of physical fishing netting.
S n = 2 d w l w d w l w 2
where l w represents the length of a single wire in one fishing netting structure and d w is outer diameter of a wire of fishing netting.
The equations of horizontal drag force and vertical lift force are given in the Equation (6):
F D = C D · 1 2 ρ AU 2 F L = C L · 1 2 ρ AU 2
where A is area of the net, ρ denotes density of water, U represents the relative incoming flow velocity, C D is drag coefficient and C L is lift coefficient.
In the study of dynamic response of net cage structures, investigation of the drag coefficient remains an key issue. Experimental approaches is still a predominant methodology to study the drag coefficient. Besides, the empirical formula developed by Løland through experiments can also be utilized for calculation [41].
C D = 0.04 + ( 0.04 + 0.33 S n + 6.54 S n 2 4.88 S n 3 ) cos θ
C L = ( 0.05 S n + 2.3 S n 2 1.76 S n 3 ) sin 2 θ
where S n is the solidity ratio of one net structures, θ denotes the angle between wave or current direction and normal vector of the fishing netting plane.
In the analysis, due to excessive number of meshes in the netting, computational time cost is extremely high. To enable the netting loads to be transferred to the rigid frame of net cage, it is necessary to simplify the net system into an equivalent form through the mesh grouping method [42].
To simplify the computational process, the equivalent volume method as one of the mesh grouping method is adopted for structural finite element model of the net cage structure. Specifically, it is assumed that the volume of the equivalent netting is equal to that of the original netting and weight of the net in air or water must remain consistent during the grouping process. The main frame of the net cage designed in this study is rigid.

2.2. The Model

2.2.1. The Experimental Model

The experimental model of the integrated semi-submersible aquaculture cage and wind turbine foundation structure in this paper is referred to the literature of Su et al. [43,44]. According to the reference, the experimental model is divided into an wind turbine in the upper part and a hexagonal semi-submersible aquaculture cage in the lower part. The platform contains six thick vertical columns requiring ballast configuration. The integrated structure of this semi-submersible platform and the aquaculture cages is mainly constructed with acrylic pipes and 3D printing materials. The density of the acrylic tubes is 1190 kg/m3. Among them, density of the acrylic pipe is 1190 kg/m3, side length of the combined structure is 0.4 m, maximum width is 0.8 m, total height is 0.4 m and working draft is 0.255 m. At the top of the central column of the aquaculture net cage, a 5 MW wind turbine tower model made at a geometric scale of 1:100 was installed. Its height is 87.6 cm, and it is equipped with three blades each of a length of 61.5 cm as shows in Figure 1.
The design parameters of the integrated semi-submersible cage and wind turbine foundation structure are systematically detailed in Table 1 and Table 2 and Figure 2. Based on the provided data, geometric model of this experimental structure was established by using SolidWorks software (2024 version) as shown in Figure 1.
For the mooring system, a taut mooring system was adopted, the length of the anchor chain was 3 m and the water depth was set at 0.7 m. The specific parameters of the mooring system are presented in Table 3, and the mooring arrangement is illustrated in Figure 3.

2.2.2. The Numerical Model

The dimensions of the numerical model and the configuration of the mooring system are identical to those of the aforementioned experimental model. However, to simplify the modeling process and enhance computational efficiency, net cage component of the numerical model underwent equivalent modeling. As Morison equation is applicable to the calculation of wave forces for small-scale structures, the numerical model employs Morison equation to simulate the net cage wire. The calculation of the cage structure is simplified through the equivalent volume method, thereby achieving efficient hydrodynamic analysis in the ANSYS AQWA (2022 version) solver environment. As for potential flow theory, hydrodynamic analysis of the model could be performed based on potential flow theory in ANSYS AQWA. The results of this equivalent treatment are presented in Table 4. The specific equivalent calculations were derived based on the theoretical formulas specified in the preceding section.
In experimental validation analysis, hydrodynamic model was established using Ansys AQWA and numerical results were subsequently compared with experimental results. The thick columns and the central column in the integrated structure of the semi-submersible aquaculture cage and wind turbine foundation are meshed through the surface element model, while arc tubes, diagonal braces and beam structures are modeled using the Morrison model. Figure 4 shows complete hydrodynamic model configuration. In its original experiment, a knotless nylon net jacket with a mesh length of 12.5 mm and a wire diameter of 2 mm was adopted ( S n = 0.32 ).

2.3. Numerical Results and Validation

The experimental wave flume measures 50 m in length, 3 m in width, and 1 m in depth, with a maximum operational water depth of 0.7 m. It is capable of generating waves with heights up to 0.3 m and periods ranging from 0.5 s to 5.0 s. A wave absorption system installed at the downstream end could achieve a wave dissipation efficiency of over 90%. Due to the numerous assumptions inherent in the numerical model, experimental validation is required to verify the applicability of the numerical modeling. In this study, under the regular wave conditions with a wave height of 0.06 m and periods of 0.8 s, 1.0 s, 1.2 s, 1.4 s and 1.6 s respectively, a comparative analysis was conducted on the two models under six different working conditions. During the experiment, a high-resolution CCD camera was used to capture the displacement of the experimental model under the action of waves. The mooring tension in the mooring system is measured by a waterproof tensile sensor of model KD41100, with a sensor accuracy of 0.5%, and the data was recorded by a UBK-8 type data set line instrument. The SDA2000 sensors is used as data acquisition system, with the sampling frequency of 50 Hz [44].

2.3.1. Convergence Analysis

To ensure the accuracy of mesh generation, convergence analysis should firstly be conducted. Typically, the computational results of second-order mean drift forces obtained through near-field and far-field methods can be compared to verify their consistency, which serves as an indirect indicator of mesh convergence. When the wave incidence angle is 0°, the mean drift forces in the surge degree of freedom direction of the wind turbine-cage platform calculated by both near-field and far-field methods are presented in Figure 5. As shown in Figure 5, as the calculation results of the near-field method and the far-field method are basically consistent, therefore, mesh convergence is good.

2.3.2. A Validation

A comparative analysis was conducted between the structural motion responses and mooring line forces obtained through numerical simulations and experimental results as shown in Table 5 and Figure 6. Hydrodynamic responses including surge motion, heave motion, pitch motion of the structure and tension of the mooring line on the wave-facing side were respectively compared with the experimental results under corresponding working conditions.
As can be observed from the tabulated data, the majority of error results remain below 5%. For individual cases where the error exceeds 5%, the absolute magnitude of discrepancy is maintained below 0.2 units. Therefore, the error analysis demonstrates that the Morison equation method and the equivalent volume method can provide reasonably accurate simulations of the structural load characteristics of net cage systems under combined wave-current loading conditions. Therefore, in the subsequent dynamic response and stability analysis of the integrated structure of the wind power converter and semi-submersible aquaculture cage in this paper, the above-mentioned method is selected to conduct hydrodynamic analysis on the structure.

3. Hydrodynamic Analysis of the Integrated Foundation

3.1. Integrated Foundation Model

3.1.1. Model Setup

The main frame of aquaculture cage selects the semi-submersible platform in reference from Zahle et al. [45], this platform adopts the same steel semi-submersible structure as the VolturnUS-S platform with one outer column and one central column according to Allen et al. [46]. The specific dimension of the platform foundation could be given in Figure 6. In contrast to conventional flexible aquaculture cage structures, a rigid structural configuration is employed for the net cage framework in this design. The net system covers three lateral surfaces and one bottom surface of the semi-submersible platform. Furthermore, four reinforcement ropes are implemented on the lateral net surfaces to enhance the system stability, they are made of polypropylene material with a diameter of 5 cm as shown in Figure 7.
To ensure the service life of the net under long term exposure to seawater, reinforced high-strength polyethylene (HDPE) was selected as the primary material of the net. The reinforced HDPE formulation does not only demonstrate excellent resistance to seawater corrosion, but also has a relatively high tensile strength, which can effectively resist the tension exerted by current and marine biofouling on the netting system. The grid shape of the selected net system is square, the diameter of one net wire is 6 mm and side length of a single net wire is 7.2 cm as shown in Figure 8. According to Equation (5), areal density of the netting is equal to 1.48 kg/m2 and solidity ratio of net system is 0.16.
Core functionality of AQWA focused on far-field wave-structure interaction solutions. Far-field boundary was set at 5 times the characteristic length of offshore structures (measured from the structure centerline). Seafloor interaction was modeled as a rigid boundary with no sediment-structure coupling. The semi-submersible floating platform is modeled using the surface element method. AQWA solves the control equation for the pressure integral of the linearized Bernoulli equation on the wet surface through the boundary element method (BEM). As net cage system is composed of a large number of slender components with diameters much smaller than the characteristic wavelength, Morrison element is adopted for net cage modeling. This method avoids the excessively high computational cost caused by direct fine surface element dispersion of complex net cage geometries.
The cross-section of the bar based on the Morrison model is circular. The Morrison bar in this study is modeled as a slender cylinder, with added mass coefficient of 0.75. According to the above volume equivalent method, length and diameter of equivalent single wire is respectively 3.6 m and 4.1 cm and density of the wire is 0.94 g/cm3, water depth is 200 m. The schematic configuration of the integrated wind turbine-cage foundation is comprehensively illustrated in Figure 9. The hydrodynamic parameters are summarized in Table 6.

3.1.2. Mooring System Design

The operating water depth of the floating structure is set to 200 m. Based on the hydrodynamic characteristics of the platform foundation, this section presents the catenary mooring design in accordance to the reference of Lei et al. [47]. For the tensioning mooring design, a single-factor analysis is conducted to ensure consistency between the tensioning mooring line parameters and the catenary mooring scheme. Detailed mooring system parameters of steel catenary and taut mooring are provided in Table 7. The layout of the mooring system and numbering of the mooring chains are illustrated in Figure 10. The position arrangement of mooring Line 3 is shown in Figure 11. The cage foundation structure exhibits a symmetrical angular configuration, the angles between two adjacent mooring chains is 120°. Furthermore, Table 8 provides the coordinate positions of the mooring anchor points and fairleads for the mooring plan.

3.1.3. Environmental Condition

For the computational environmental conditions, the China Classification Society (CCS) Rules for Classification of Offshore Floating Installations were referred to CCS [48]. The one-year recurrence period sea conditions in the northern part of the South China Sea with a water depth of more than 150 m are selected as the operation sea conditions and the 25-year recurrence period sea conditions are selected as the self-existing sea conditions. The wave load adopts the JONSWAP wave spectrum. The wind speed is considered as constant wind that is calculated based on the one-hour average wind speed at a height of 10 m above the average sea level. Current loads are considered as constant flow and uniform flow. Detailed parameters of the selected environmental conditions are listed in Table 9.
The wind turbine selected in this study is the IEA 22 MW offshore wind turbine, jointly developed by the Technical University of Denmark (DTU) and the National Renewable Energy Laboratory (NREL) [45]. Figure 12 displays wind speed versus thrust curve of wind turbine. Equivalent thrust and moment of foundation of net cage structure could be obtained via this thrust curve. Steady wind loads were obtained by applying a wind coefficient matrix. Under survival conditions, as the wind turbine is parked, aerodynamic loads could be neglected. Only the wind pressure loads of the structure under extreme wind speeds is considered. The relevant codes and standards are summarized in Table 10 CCS [48]. In the time domain analysis, the simulation duration was set as 3 h with a time step of 0.01 s and a water depth of 200 m.

3.1.4. Effect of Biofouling

(1)
On the net cage foundation
When exposed to the underwater environment for a long time, the surface of the cage is prone to attach various biofouling. These fouling organisms not only increase the self-weight of cage structure but also significantly alter its hydrodynamic properties [31]. To simulate the hydrodynamic behavior of the netting under different biological fouling states, this study simplistically change the diameter of the netting wire to adjust the real density of the netting. Real density refers to the ratio of the surface area per unit length of the net cable to the total area of the grid. This simulation considered four levels of biological fouling: 0% (no fouling), 25% (mild), 50% (moderate), and 75% (severe). As the density of net coating is set at a constant of 0.94 g/cm3, therefore, weight change of mooring lines under different levels of biological fouling are simulated by adjusting the diameter of net cable to simplify the weight change on mooring cables due to change of biological fouling. On this basis, grid grouping is carried out for net systems with different biological attachment levels based on the volume equivalent method. The equivalent net parameters through volume equivalent method are shown in Table 11.
(2)
On the mooring lines
In the time-domain mooring analysis of AQWA, the hydrodynamic forces on mooring lines are calculated using key parameters including added mass coefficient, equivalent diameter, transverse drag coefficient and longitudinal drag coefficient. To simulate the effects of various marine biofouling level, parameters of the mooring chain in AQWA model could be adjusted. As adhesion of marine organisms will increase the external dimensions of the anchor chain, effect of biological attachment could be simplified by increasing the equivalent diameter of the anchor chain. The calculation formula for the equivalent diameter is:
D e q = D c h a i n + 2 t b i o f o u l i n g
where D eq is the equivalent diameter, D chain is the original diameter of the mooring chain, and t biofouling is the thickness of the biofouling layer.
As biological attachment alters the surface roughness and fluid-facing shape of the anchor chain, hydrodynamic coefficient could be affected significantly. Effect of biological attachment on the added mass of anchor chains could be performed by changing added mass coefficient and effect of biological attachment on the transverse drag force of the anchor chain could be simplified by changing the transverse drag coefficient (i.e., perpendicular to the primary axis of the object). Furthermore, due to the relatively small numerical value of the longitudinal drag coefficient and its small contribution to the force of the anchor chain, influence of biological adhesion on mooring chain is not considered in this study.
The biological attachment conditions of mooring chains with biofouling thickness of 0 cm, 10 cm and 20 cm were simulated respectively. Three different combinations of hydrodynamic parameters were selected to simplify three different levels of biological attachment. Detailed parameters are provided in Table 12.

3.2. Response Amplitude Operator (RAO) Analysis

In frequency domain hydrodynamic calculations, wave incident angles could affect response amplitude operators (RAO). To obtain greatest effect of wave incident angle on the structures, the hydrodynamic responses under different wave incident angles should be calculated. Figure 13 defines the orientations of different wave incident angles.

3.2.1. Effect of Biological Fouling on RAOs

To evaluate the effect of biological fouling on structural hydrodynamic responses under operational condition, response amplitude operators in different motion responses of net structures under different ratios of biological fouling are studied including surge RAO, pitch RAO and heave RAO at a wave direction angle of 0°, sway RAO and roll RAO at a wave direction angle of 90°, yaw RAO at a wave direction angle of 120°.
At a wave direction angle of 0°, Figure 14a and demonstrate that the surge RAO reaches its peak in the vicinity of frequency of 0 with biofouling varies due to resonance of the floating structure in the low frequency range of 0.02 Hz to 0.05 Hz. Surge RAO declines rapidly until around 0.1 Hz with the frequency increases, which indicates that the structure has good stability under medium and high frequency waves. Therefore, it could be found that effect of biological fouling on the surge RAO is very slight as the RAO curves tend to be consistent in the high-frequency band under different ratios of biological fouling. According to Figure 14b, at a wave direction angle of 0°, pitch RAO increases rapidly with the increase of frequency and reaches to the peak of 8.5°/m in the vicinity of 0.07 Hz. As ratio of biological fouling increases from 0% to 75%, the peak values gradually decreased to only 11.7% of the initial peak at 0% of biological fouling, and the curves in the vicinity of the peak points rapidly flattens. Therefore, it could be inferred that as damping characteristics of the structure have been improved, pitch response of the structure is weakened and risk of resonance of this structure could decrease.
Variation trends of heave RAO of this structure under a wave direction angle of 0° could be shown in Figure 14c. In low frequency range of 0.02 Hz to 0.05 Hz, heave RAOs increase to peak values with frequencies increase. For the 0% of biological fouling, its peak of heave RAO is 1.6 m/m. It could be observed that the peak values decline with ratios of biological fouling increase. Therefore, damping characteristic of this structure could be enhanced, and thus heave response gradually decrease close to 0.1°/m in high frequency range which demonstrates good stability according to Figure 14c. Figure 14d displays that sway RAO curves of this structure under a wave direction angle of 90° for different ratios of biological fouling. It could be estimated that resonance of this structure could be occurred in the vicinity of 0.025 Hz due to greater way RAO in low frequency range. Subsequently, RAO curves rapidly decay to low levels in medium to high frequency. Therefore, effect of biological fouling on the sway RAO responses is slight.
Roll RAO responses of this structure under a wave direction angle of 90° could be obtained in Figure 14e. Roll RAO responses go up rapidly with frequency increases in low frequency range of 0.02 to 0.07 Hz and their peak values occur in the vicinity of 0.07 Hz. The peak decreases to 11.1% of corresponding initial peak magnitude with ratios of biological fouling increase. In Figure 14f, yaw RAO responses of the structure under a wave direction angle of 120° are illustrated. The RAO curves for different ratios of biological fouling almost overlap throughout the entire frequency range. Yaw RAO reaches their peak at the magnitudes of 0.35°/m in the range of 0.1 Hz to 0.15 Hz. Yaw RAO magnitudes gradually decline to a stable value after higher than frequency of 0.15 Hz.
In addition, effect of net structures with different ratios of biological fouling on RAO responses under survival conditions is also performed by using same method. It could be also revealed that variation trend of RAO responses across six motion degrees of freedom (DOF) and effect of ratios of biological fouling remain consistent for the operational and survival conditions.

3.2.2. Damping Correction

In the time-domain calculations of AQWA, as time domain response of the structures under the actual waves could be obtained by convolutionally integrating with the random wave duration and RAO response obtained from the frequency domain calculation, to ensure the accuracy of time-domain calculation, damping correction should be performed for frequency-domain analysis by incorporating a damping matrix in order to correct RAO response of the frequency-domain calculation to the RAO response considering the drag force of the Morrison member.
According to Section 3.2.1, it could be known that effect of ratios of biological fouling on the RAOs in the pitch, roll, and heave motion is most pronounced. The damping correction percentages could be obtained through AQWA. Table 13 displays damping correction percentages in pitch and heave motion at a wave direction angle of 0°and in roll motion at a wave direction angle of 90°. Then, added damping matrices of the system with different ratios of biological fouling under different irregular wave loadings are obtained by based on the results of static water calculation.

3.3. Effect of Biofouling on the Integration Foundation

Based on the hydrodynamic frequency domain analysis, time domain analysis could be performed by using the AQWA response solver. In the time-domain analysis, combined load angle among wind, wave and current is all set as −90° and the calculation time is set as 3 h. Effect of ratios of biological fouling in Table 11 could be studied by comparing motion response and mooring cable tension of integrated foundation structures of wind turbine and net cage.

3.3.1. With Catenary Mooring

According to Figure 15a,f, the mean and maximum values on the sway motion gradually increase with the increase of ratios of biological fouling under operational and survival sea conditions. The maximum sway values under the two sea conditions are both the 75% of biological fouling with the maximum values of 30.9 m and 55.04 m respectively.
Figure 15b,g demonstrate that the mean displacement also increases with biofouling levels rise for the roll motion under the two sea conditions. At 75% of biological fouling, the mean values under both sea states reach their maxima of 1.14° and 1.2°, respectively. However, the standard deviations of roll response in both sea conditions gradually decrease with the increase of biofouling levels, which is related to the damping effect brought about by the increase of ratios of biological fouling. Figure 15c,h show that the average displacements at each ratio of biological fouling are relatively small for the heave responses, and the maximum values under the operating sea conditions decrease with the increase of ratios of biological fouling. Maximum heave motion of this integrated foundation structures of wind turbine and net cage under the operating sea conditions is 2.31 m occurring at 75% of biological fouling, only 49% of heave motion at 0% of biological fouling. Whereas maximum heave displacement increases to 4.63 m at 75% of biological fouling under survival condition.
Figure 15d,i indicate that the average tension of Line 1 under the two sea conditions gradually decreases with the increase of ratios of biological fouling, but the maximum value tends to be stable and is less affected by variation of biological fouling. However, it is revealed that average and maximum values of tension of Line 3 under both sea conditions gradually increase with the increase of ratios of biological fouling. Maximum tension in 75% of biological fouling increases by 72.3% and 292% respectively than that in non biological fouling under the two sea condition. Furthermore, the increase level in sea conditions has also led to a significant rise in the tension of Line 3, it could be obtained that maximum tension under survival sea conditions increases by 302% compared with that under operation sea conditions for 75% of biological fouling.
To sum up, for 75% of biological fouling, the sway displacement in both sea conditions exceeds the specified requirement values for each defined sea condition. Moreover, in the survival sea condition, safety factor of Line 3 is 1.15 less than the specified value of 1.67. Therefore, it is shown that biological adhered to the net cage can have a significant impact on the motion response of the entire structure, thus it should be considered for the design of net cage structures.

3.3.2. With Taut Mooring

It can be known from Figure 16a,f that average and maximum values on the sway motion gradually increase with the increase of biological fouling under different sea conditions similar to the case in the catenary mooring. The maximum sway displacements under both sea states occur at 75% of biological fouling and are 9.68 m and 17.38 m, respectively. Figure 16b,g show that average and maximum values of roll motion exhibits similar trends to those of sway motion. Maximum roll values of this foundation under 75% of biological fouling are respectively 5.28° and 12.5° under the two sea conditions. Furthemore, maximum value of heave motion gradually decreases with the increase of the bioattachment degree under the operating sea condition with the increase of biological fouling in Figure 16c. it could be seen that maximum value of heave motion occurs at 0% of biological fouling and is 5.69 m. Mean heave displacement remains to be close to zero whereas the standard deviation gradually decreases with increase of biological fouling. Therefore, it could be estimated that increase of biological fouling enhances drag forces, thus narrows heave motion amplitude of this paltform. For the Figure 16h, it could be observed that maximum heave motion could reach its peak at 75% of biological fouling and its magnitude is 8.5 m under survival sea state.
According to Figure 16d,i, average tension of Line 1 gradually decreases with the increase of biological fouling of the net cage under the two sea conditions, while maximum value is less affected by the biological fouling and always remains at about 3.34 × 10⁴ kN and 3.32 × 10⁴ kN respectively. However, the Line 3 is the main force-bearing cable due to the effect of the load direction, the average and maximum values of its tension gradually increase with the increase of biological fouling, therefore, the effect of 75% of biological fouling is most significant. Maximum tension of Line 3 under the working sea conditions is 3.32 × 10⁴ kN with the safety factor of 2.35 complying with safety specification, which is 1.49 times than that of 50% of biological fouling as displayed in Figure 16e. Figure 16j shows that maximum tension of Line 3 at 75% of biological fouling under survival sea conditions is 1.31 × 10⁵ kN. This tension increases by 244% compared with the tension without biological fouling and by 186% compared with the tension with 75% of biological fouling under operating sea conditions.
To sum up, maximum sway in both sea conditions does not exceed 20 m meeting the specification requirements. However, safety factor of Line 3 at 75% of biological fouling under under survival sea conditions is 0.82 not meeting the specification requirements. Therefore, it could be concluded that effect of biological fouling on the design of mooring cable and safety of marine structures should be considered under different levels of sea conditions.

3.4. Effect of Biofouling on Mooring Cables

To study effect of biofouling on the dynamic responses of two types of mooring cables including catenary mooring and taut mooring types, tensions and motion responses under three different levels of biofouling as shown in Table 12 on the mooring cables are compared in the time domain analysis.

3.4.1. Catenary Mooring Systems

Under survival sea condition, it could be indicated that mean value of sway motion increases by 7.1% and 16.4% under biofouling levels 1 and 2 respectively compared to that without biofouling as displayed in Table 14. Furthermore, maximum value also shows a similar increase trend. According to Table 14, mean roll displacement of this foundation structure is 0.53 m without biofouling under the survival sea state and that increase to 0.69 m and 0.86 m at biofouling levels 1 and 2 respectively in accordance to growth rates of 30.2% and 62.3%. As maximum value and standard deviation of roll slightly decrease under the biofouling levels 1 and 2, it could be indicated that biological adhesion could alleviate the instability of the roll response to a certain extent. For heave motion, mean displacement is 0.17 m without biofouling, whereas it decreases to 0.09 m at biofouling level 1 and 0.03 m at biofouling level 2 with biofouling levels increase. Furthermore, as maximum value and standard deviation of sway also slightly decrease, it could be indicated that effect of biological adhesion on the amplitude of the sway movement was relatively weak. According to Table 14, it is most prominent in tension increase of Line 3 that maximum tension of Line 3 increases to 25.43 MN with a maximum increase ratio of 9% whereas safety factor droppes to 4.24 with a maximum reduction ratio of 8.4% under survival sea state conditions.
Overall, as ratios of biological adhesion increases, amplitude of sway significantly increases, whereas the volatility of roll and heave motion gradually weakens. Furthermore, biological adhesion has a significant impact on the tension and safety performance of mooring cables and increase of tension intensifies with the increase of ratios of biological adhesion. Under survival sea states at biofouling level 2, safety factor on Line 3 reaches a minimum value of 4.24 meeting the specification requirements, which is indicated that the ultimate load-bearing capacity of the mooring lines decreases relatively with increase of biofouling levels. For the Line 3, the increase in tension and the decrease in safety factor caused by biological adhesion are particularly significant.

3.4.2. Taut Mooring Systems

According to Table 15, it is revealed that mean sway displacement increases from 3.17 m without biofouling to 3.47 m at biofouling level 2 and by 9.5% under the survival sea state, and maximum displacement rises from 7.74 m to 8.28 m and by 7%. Biological adhesion will increase the amplitude of sway motion, but the rate of increase is not as significant as that of the catenary mooring method. Under the survival sea state, maximum roll displacement decreases from 6.95° at non biofouling to 5.50° at biofouling level 2 as display Table 15. Therefore, it could be found that effect of biological adhesion on the roll motion is obvious and it could enhance stability of this structure in the roll motion. For heave motion, its average value changes slightly but maximum value decreases from 5.19 m to 3.84 m. Therefore, it could be estimated that higher biofouling levels effectively suppress heave motion amplitudes. Table 15 indicates that under the survival sea conditions, the average and maximum tension of mooring Line 1 decreased with the increase of biofouling, and the safety factors increased by up to 1.3% and 2.3% respectively, which is manifested that biological adhesion could improve the safety of Line 1. Maximum tension of Line 3 decreases with biological adhesion increases whereas its safety factor increases by 6.6% under survival sea state conditions.
In summary, under a taut mooring system configuration, sway and roll motion amplitudes increase with biofouling level rises, while the stability of roll and heave motions is moderately improved. Furthermore, the increase in biological adhesion exhibits a limited impact on the tension of mooring lines. For Line 1, both the mean tension and peak tension gradually decrease as biofouling coverage increases. In contrast, for Line 3, the peak tension decreases marginally, while mean tension exhibits a slight upward trend. Moreover, the minimum safety factor is 3.07, which complies with specification requirements. Furthermore, comparing with biofouling occurred on the net cage, impact of biofouling adhesion on mooring lines is limited. For catenary and taut mooring systems under survival sea states, safety factors of the mooring lines consistently meet the structural safety requirements.

4. Conclusions

This study introduces a novel integrated foundation structure combining a 22 MW wind turbine semi-submersible platform with an aquaculture cage and focuses on the impact of biological adhesion on the net cage structure and the mooring system during the farming process. Firstly, experimental models were used to verify the appropriateness of equivalent volume method. Then, this paper compares the safety factor variations of catenary and taut mooring systems under different sea conditions. Finally, time-domain analysis was employed to obtain motion and mooring tension responses under various ratios of biological adhesion of net cage structures and mooring lines for both mooring methods. Some conclusions have been obtained.
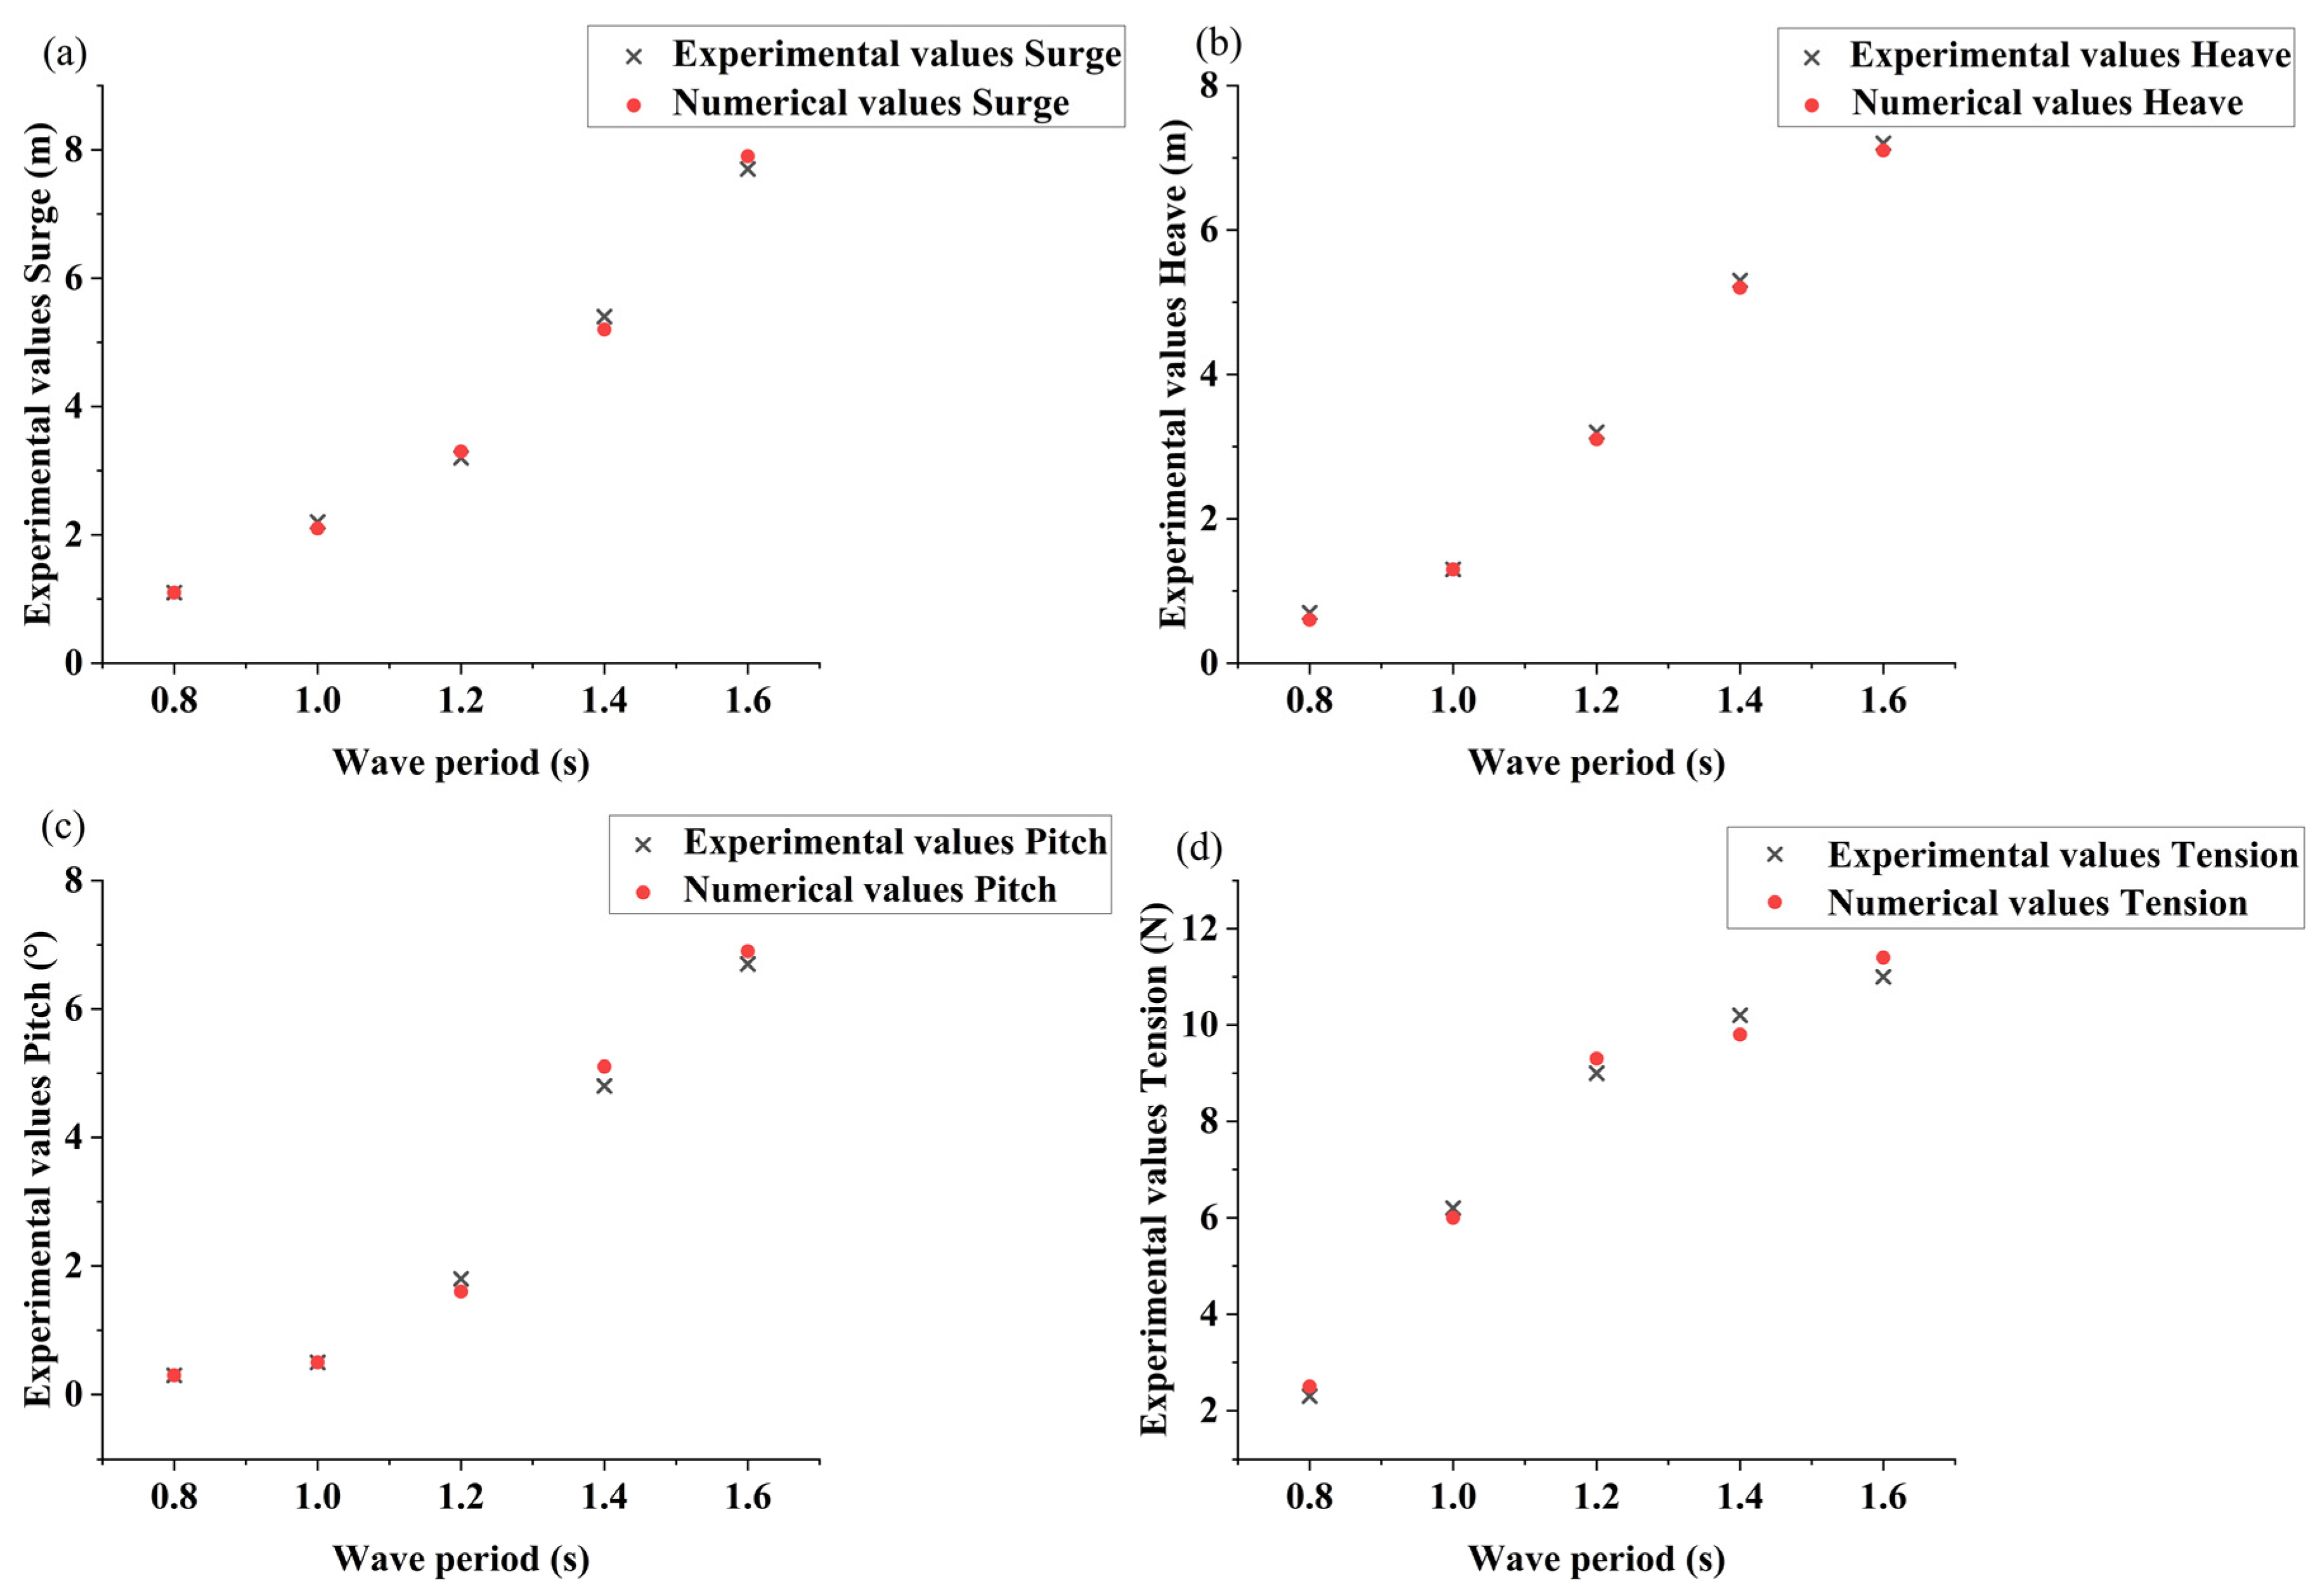
The equivalent volume method was applied to simulate existing experimental models. Structural surge, heave, pitch, and tension of the anchor chain on the wave-facing side were compared with existing experimental results. It could be concuded that the values obtained by using the equivalent volume method are clode to the experimental results.
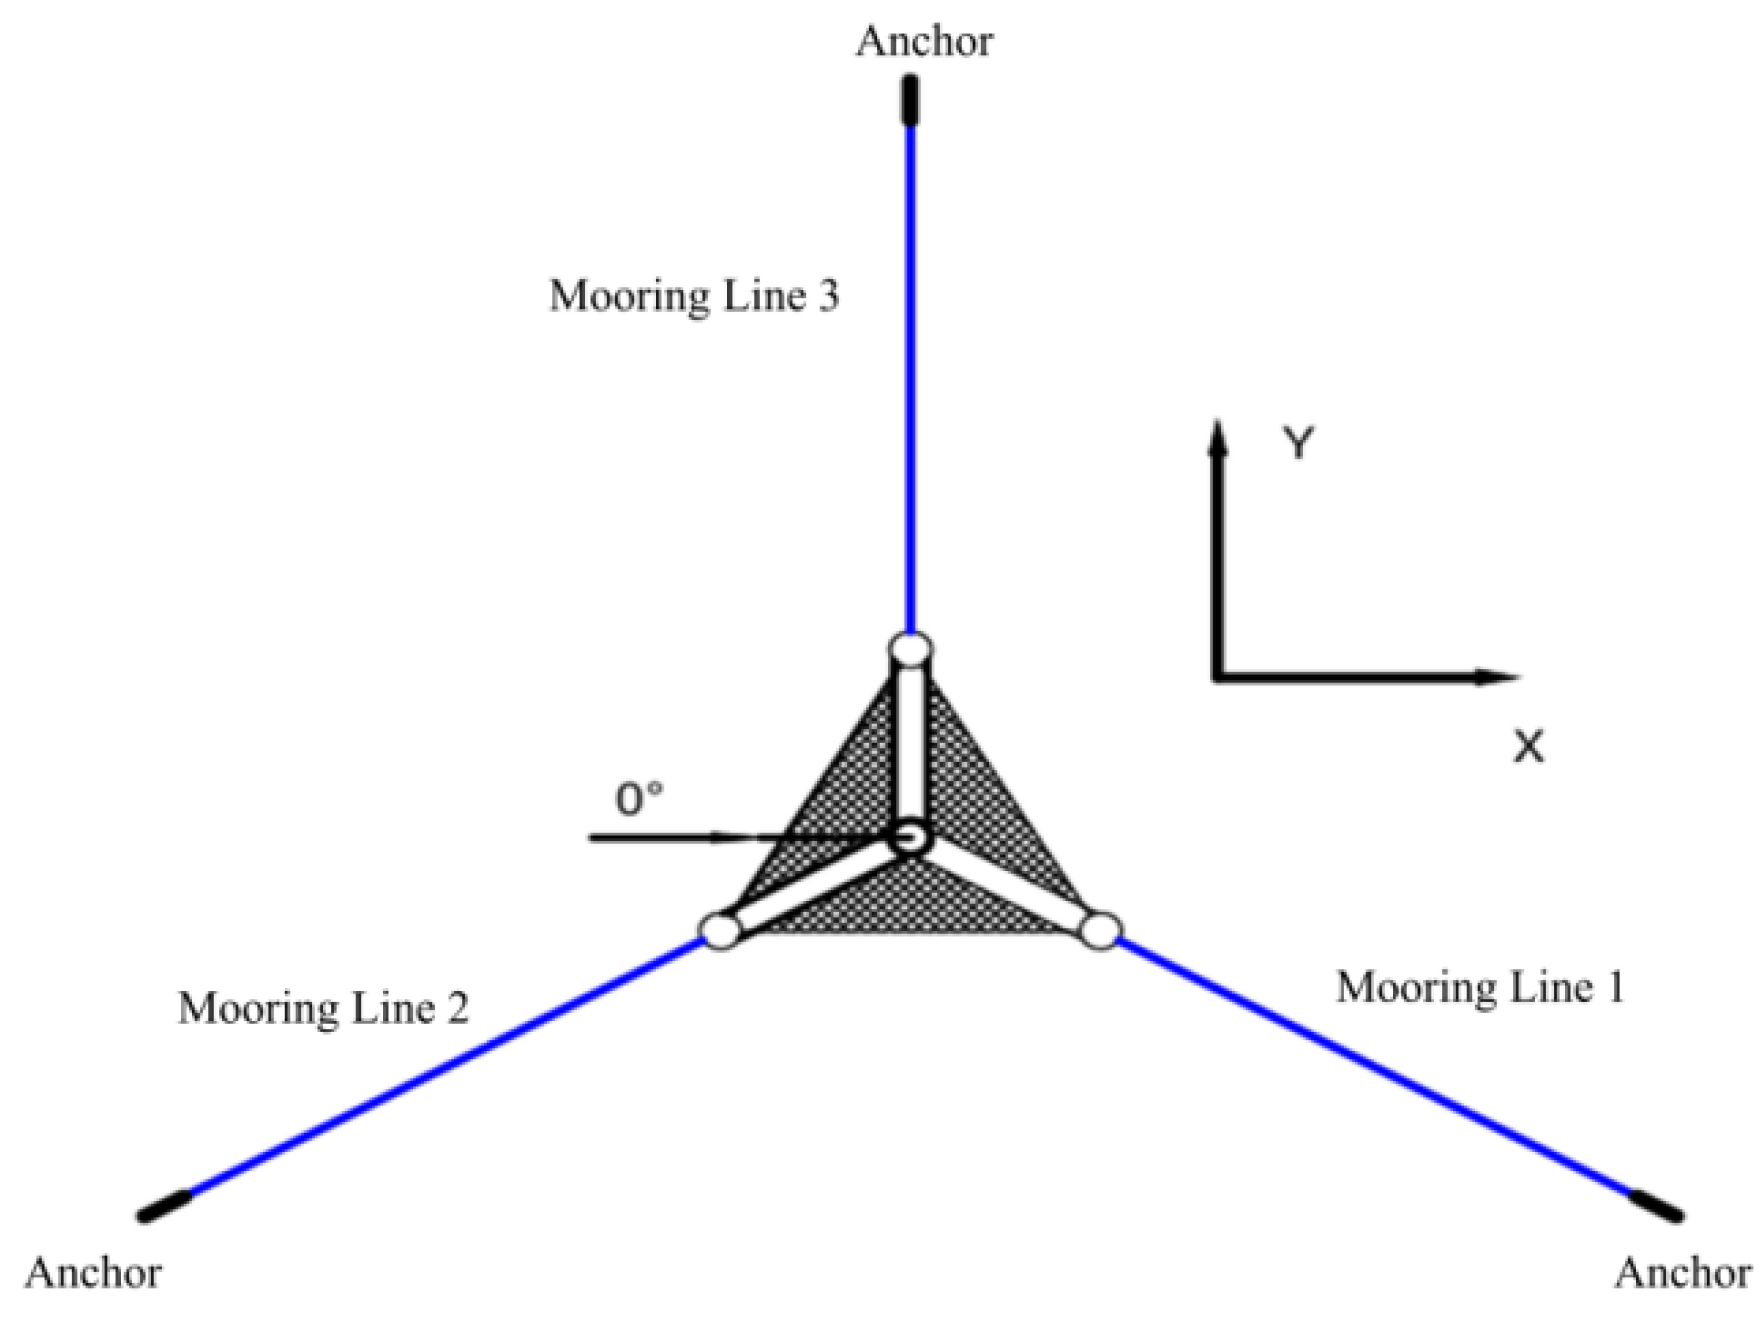
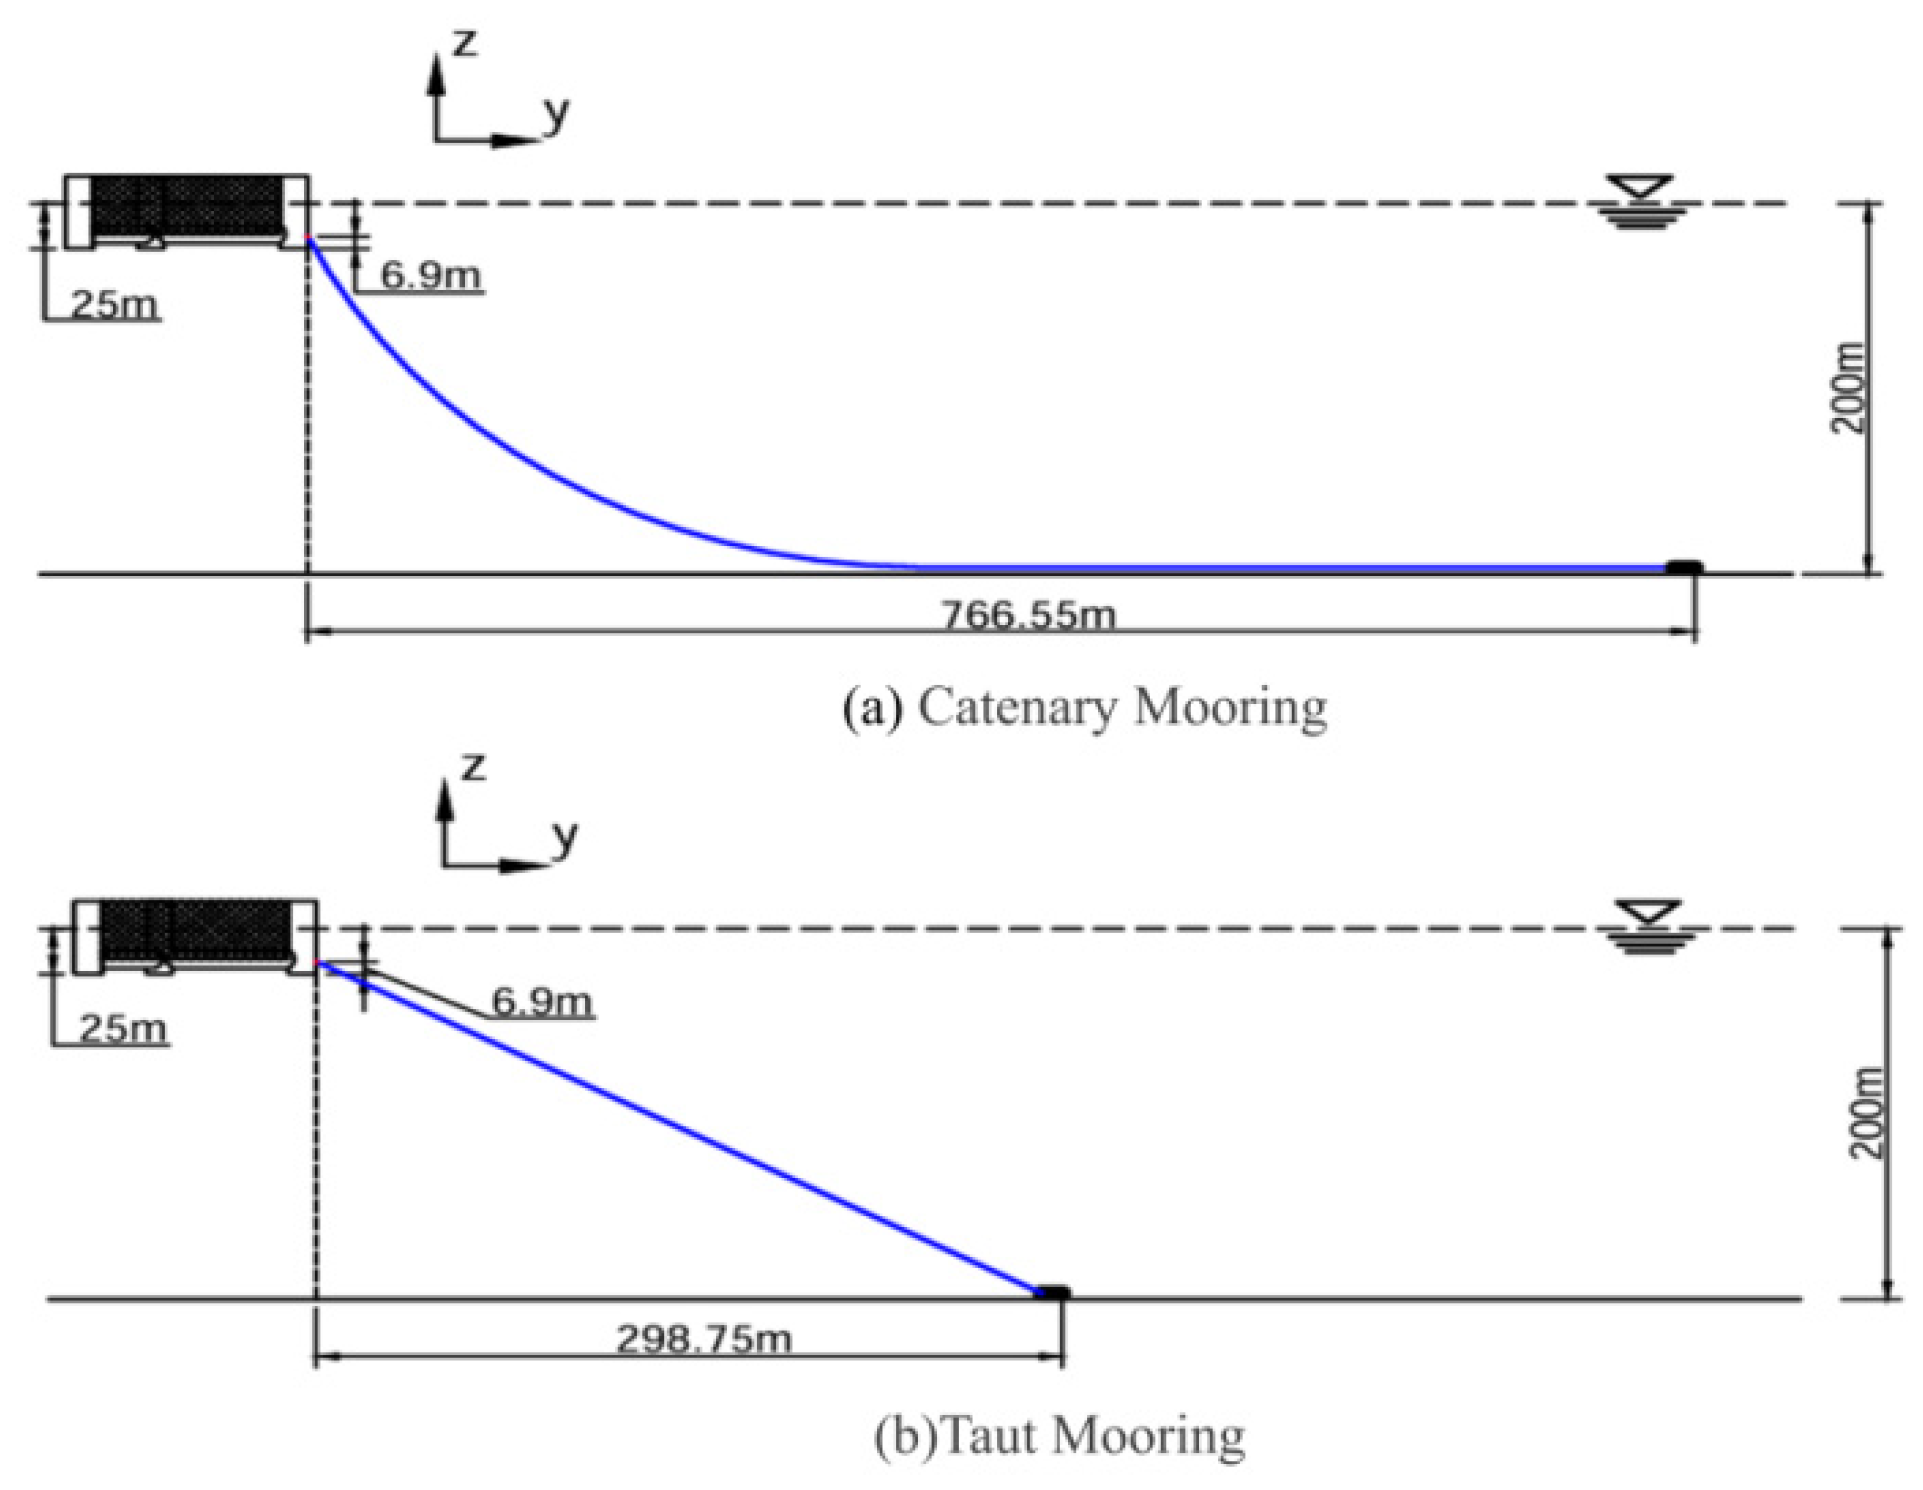
For the South China Sea with a water depth of 200 m, the taut mooring outperforms the catenary mooring system in terms of sway performance. Its maximum sway displacement is much lower than the 40 m recommended by the specification, while that of catenary mooring is only slightly lower than 40 m. For the tension of mooring lines, safety factor of Line 3 is 2.62 for the taut mooring system and that is 4.25 for the catenary mooring system greater than the regulatory requirement of 1.67. Two mooring design meet the safety requirements, however, the catenary mooring system has an advantage of safety factor, while the taut mooring system save cost in material use due to its use in shorter mooring lines.
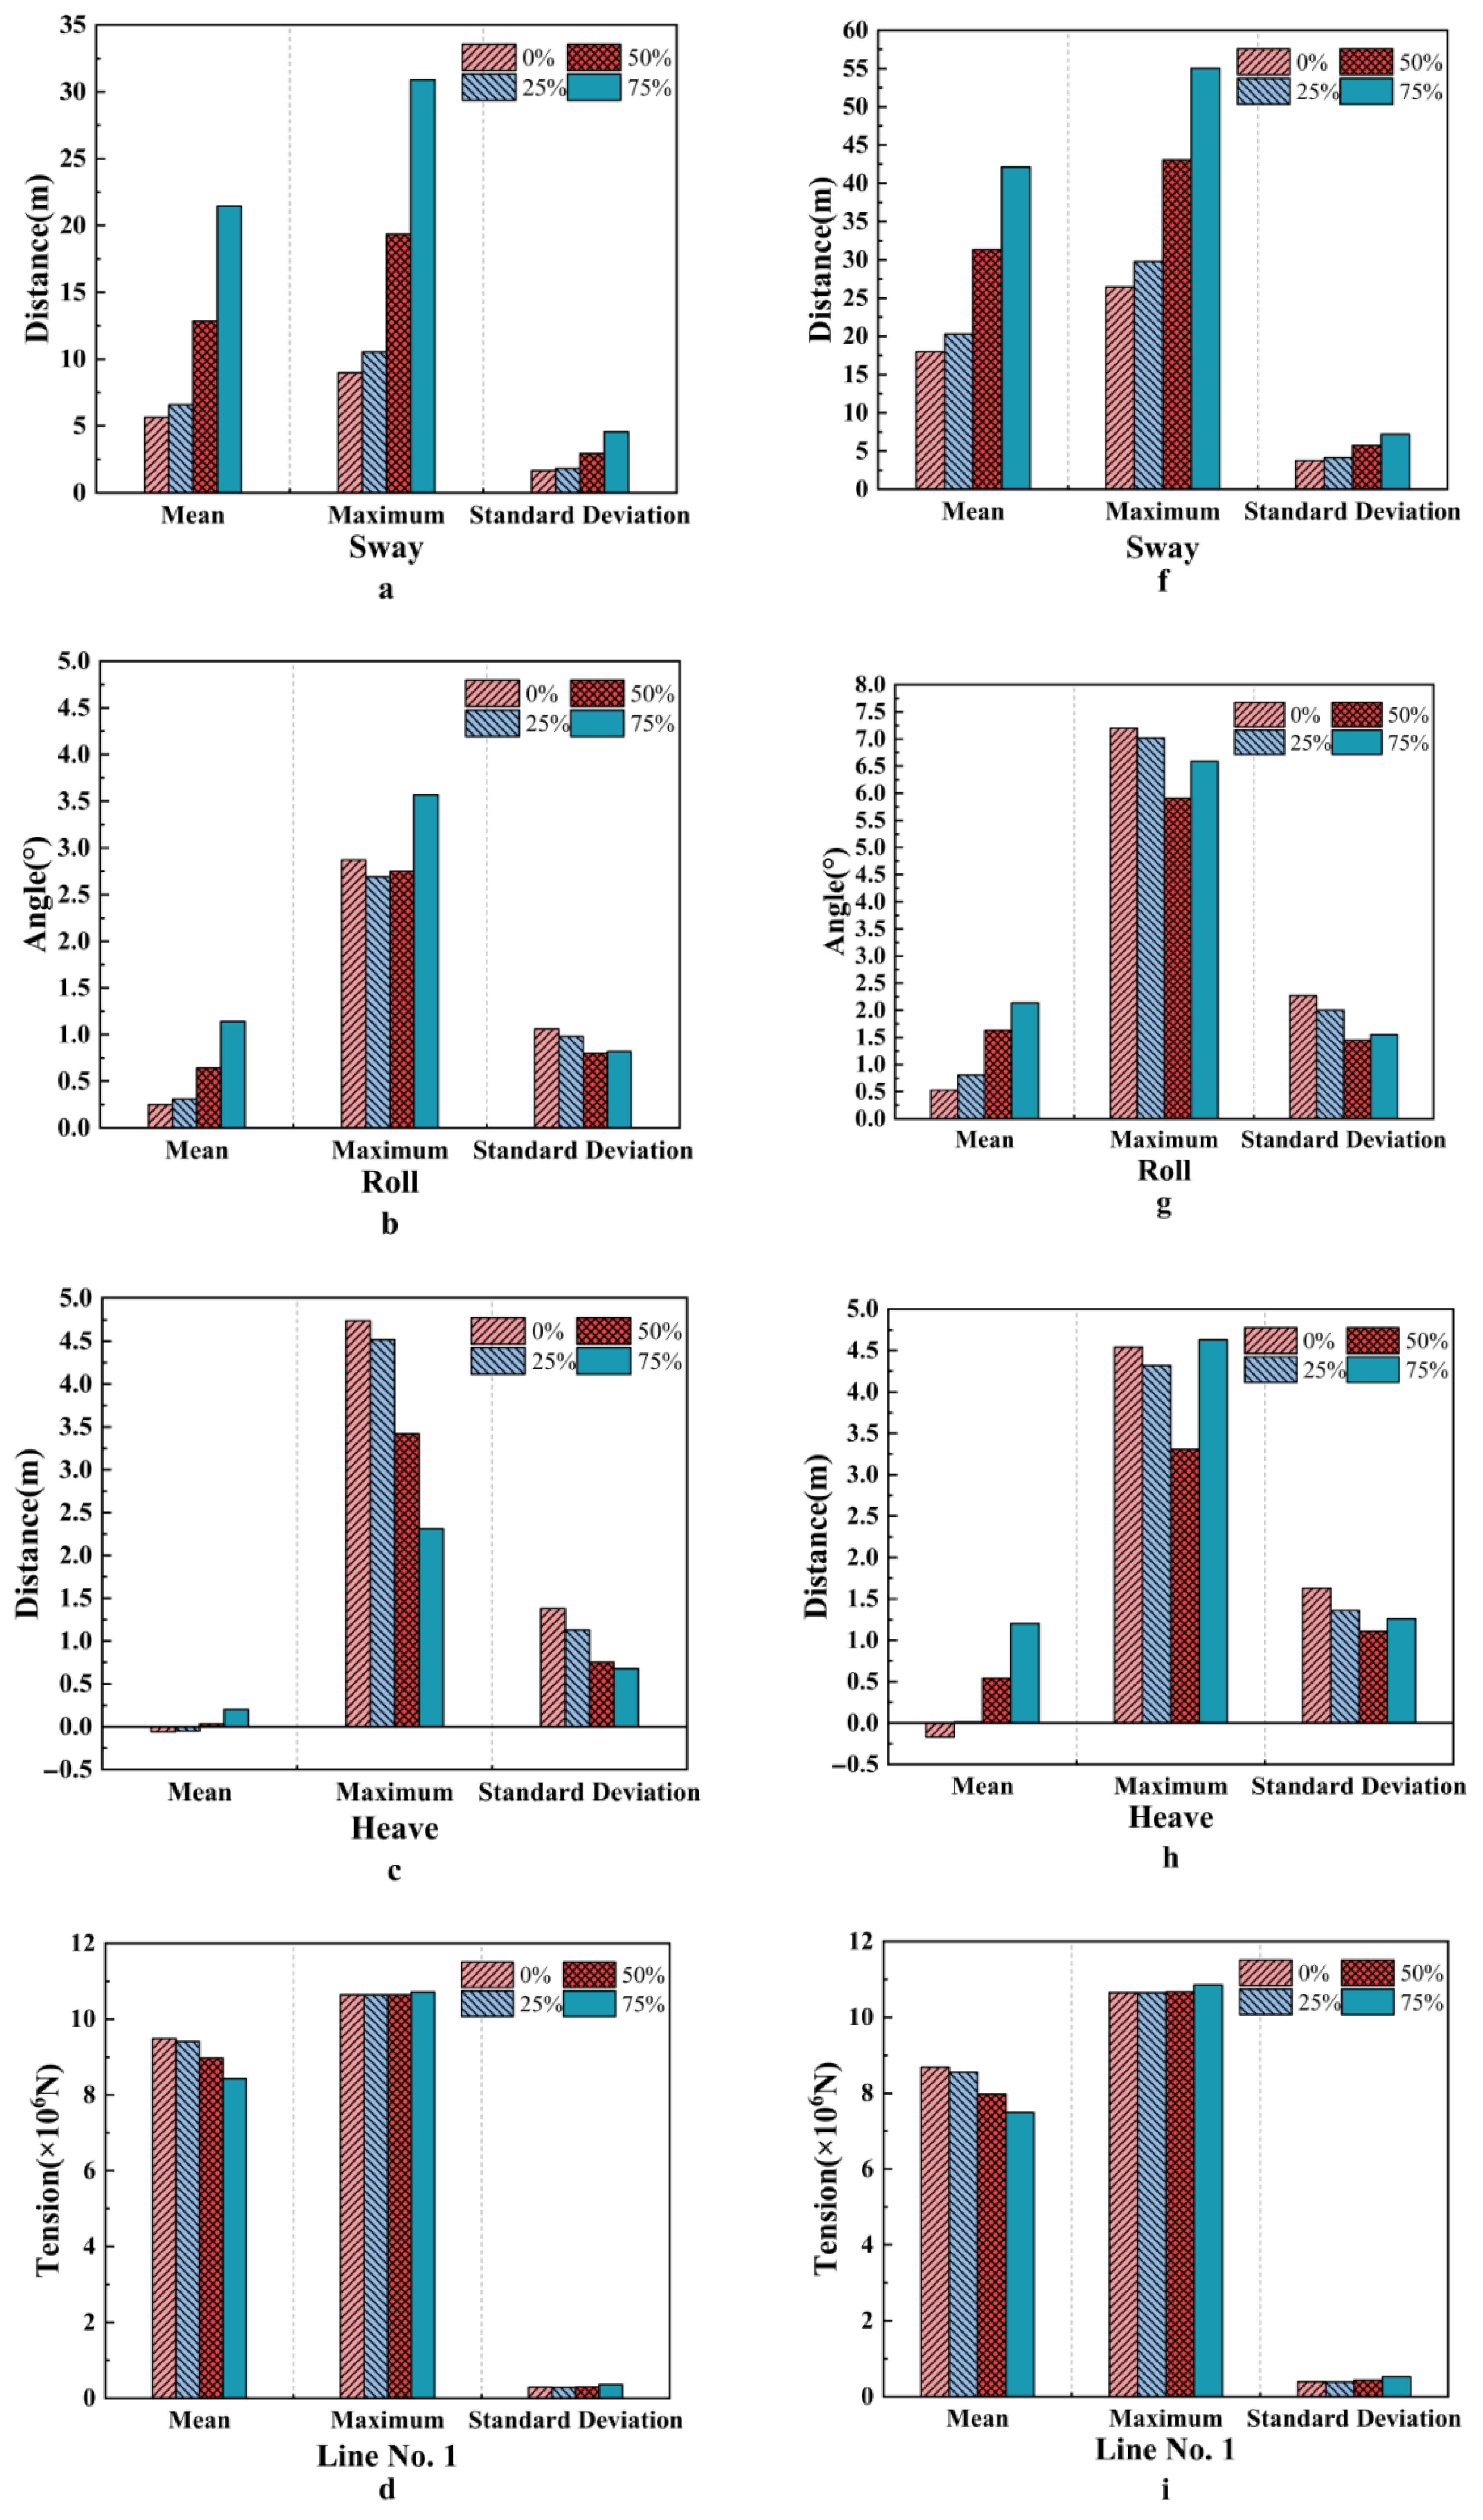
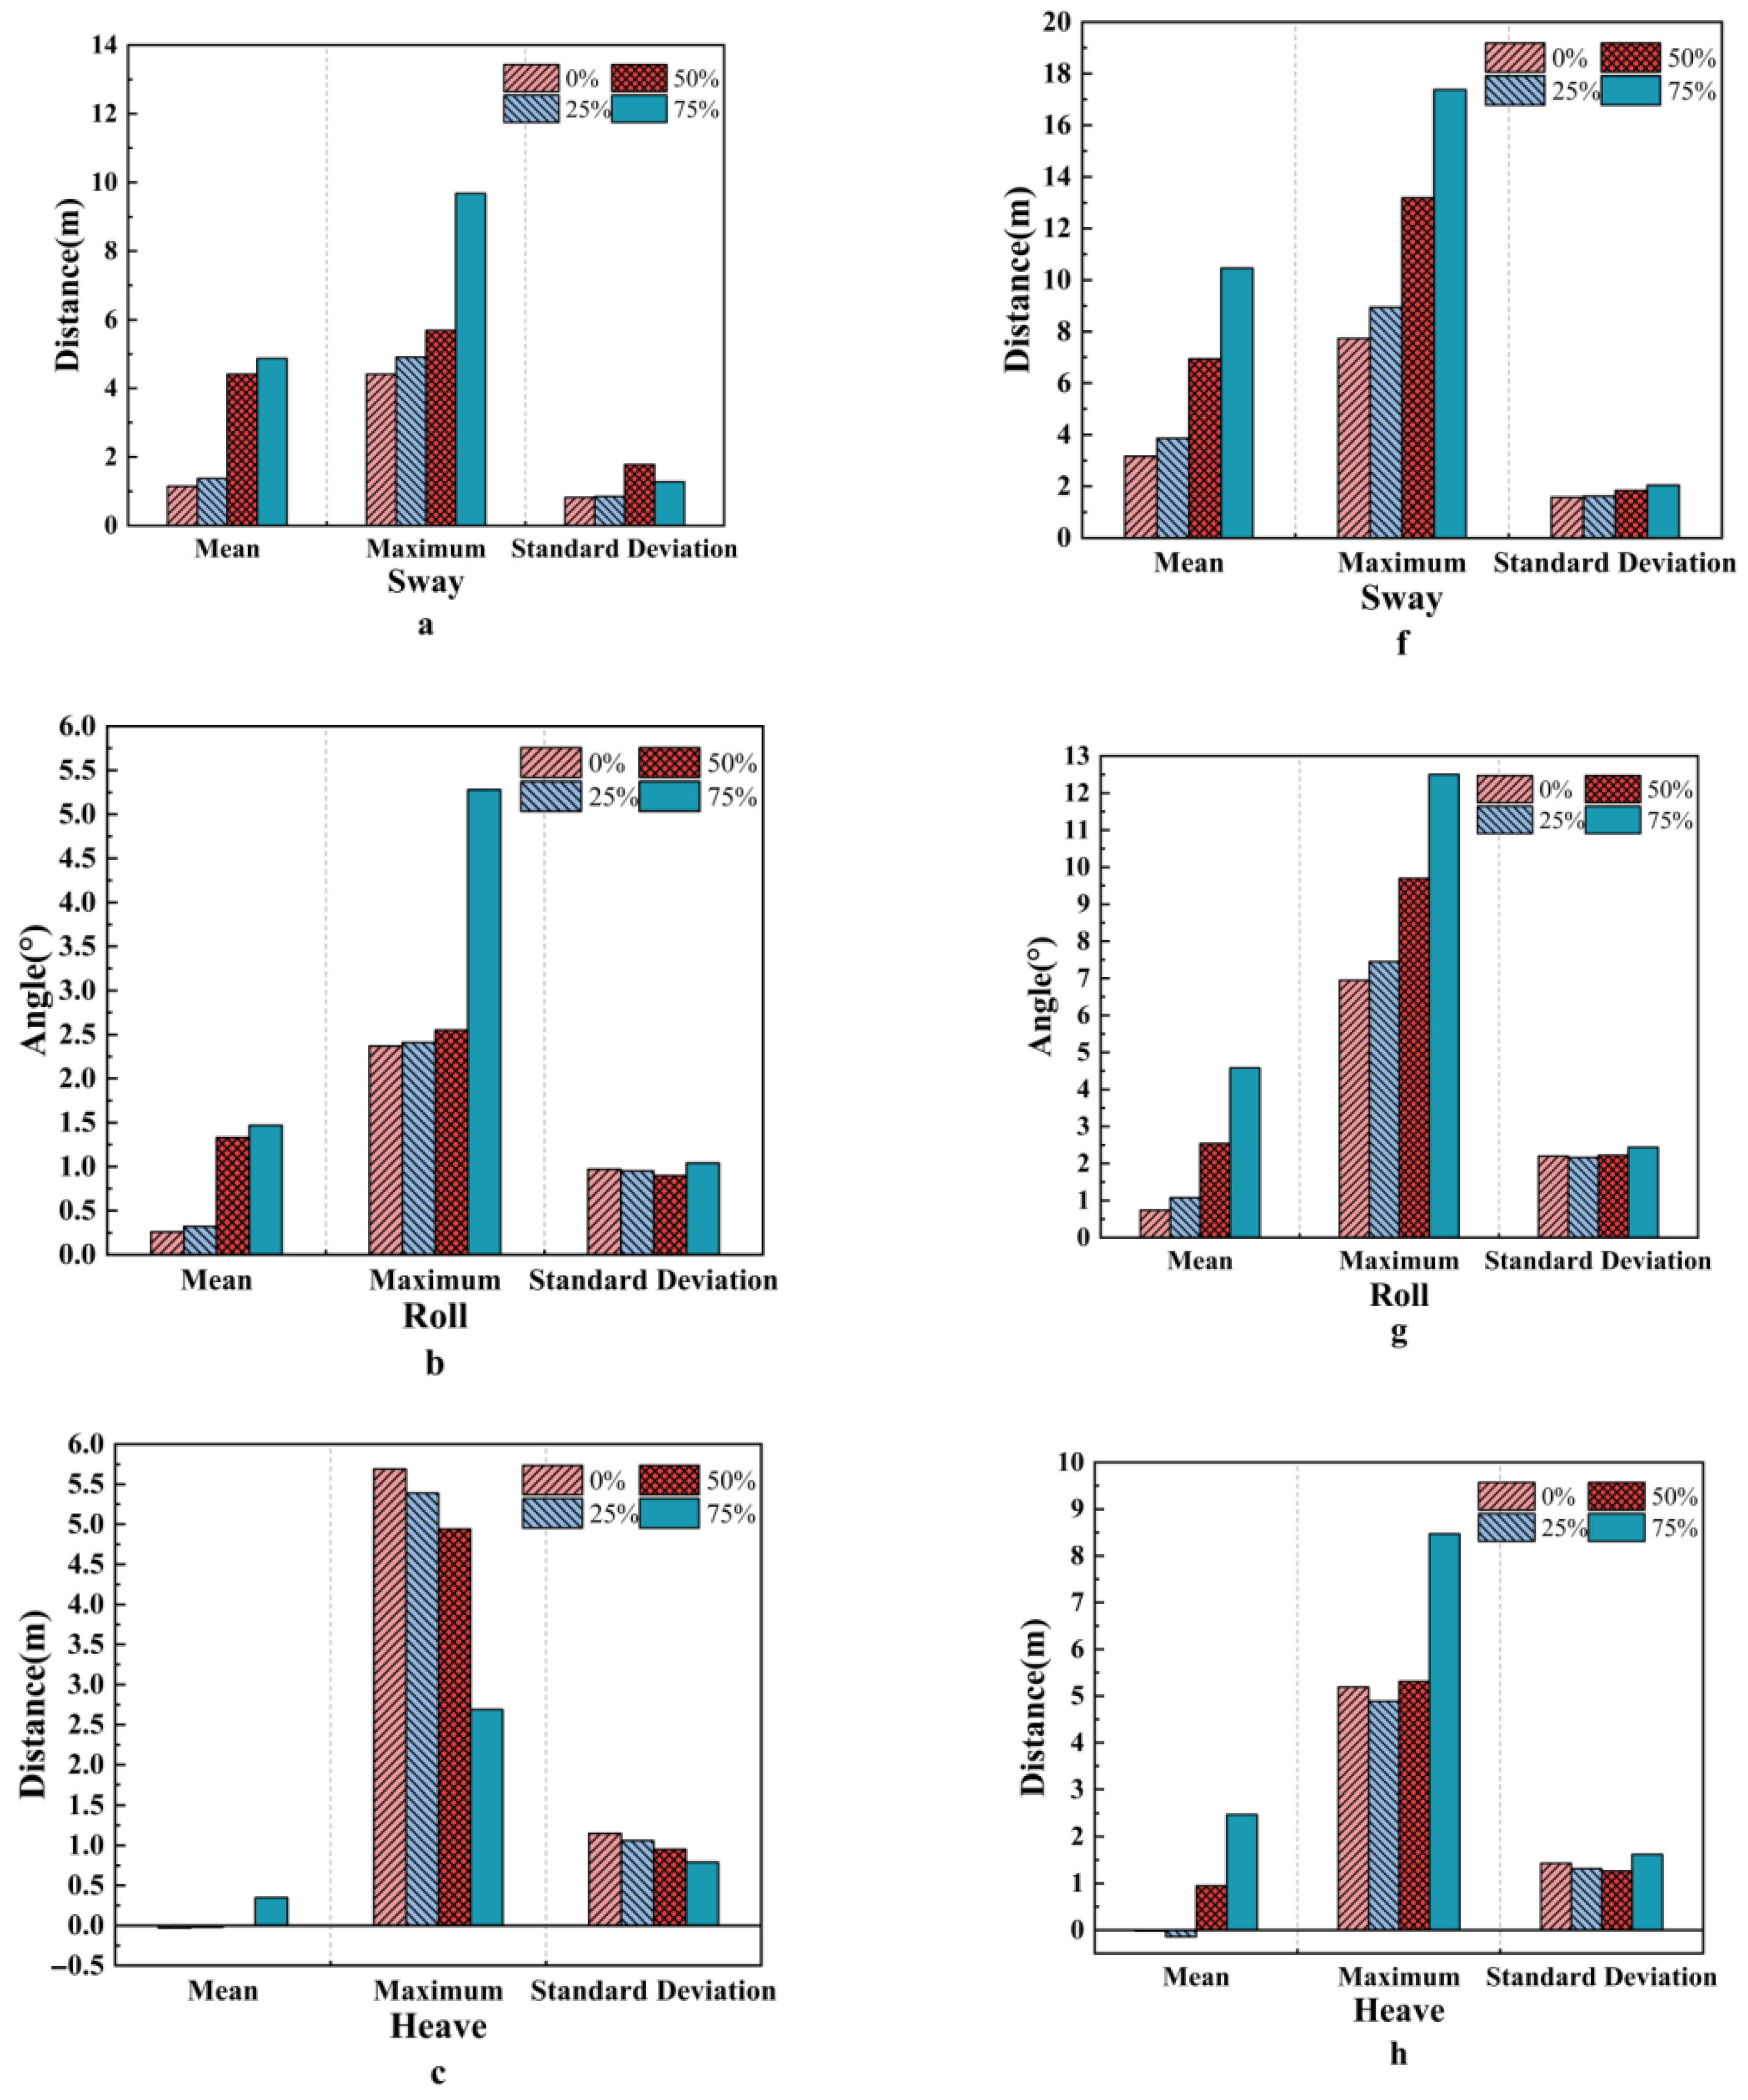
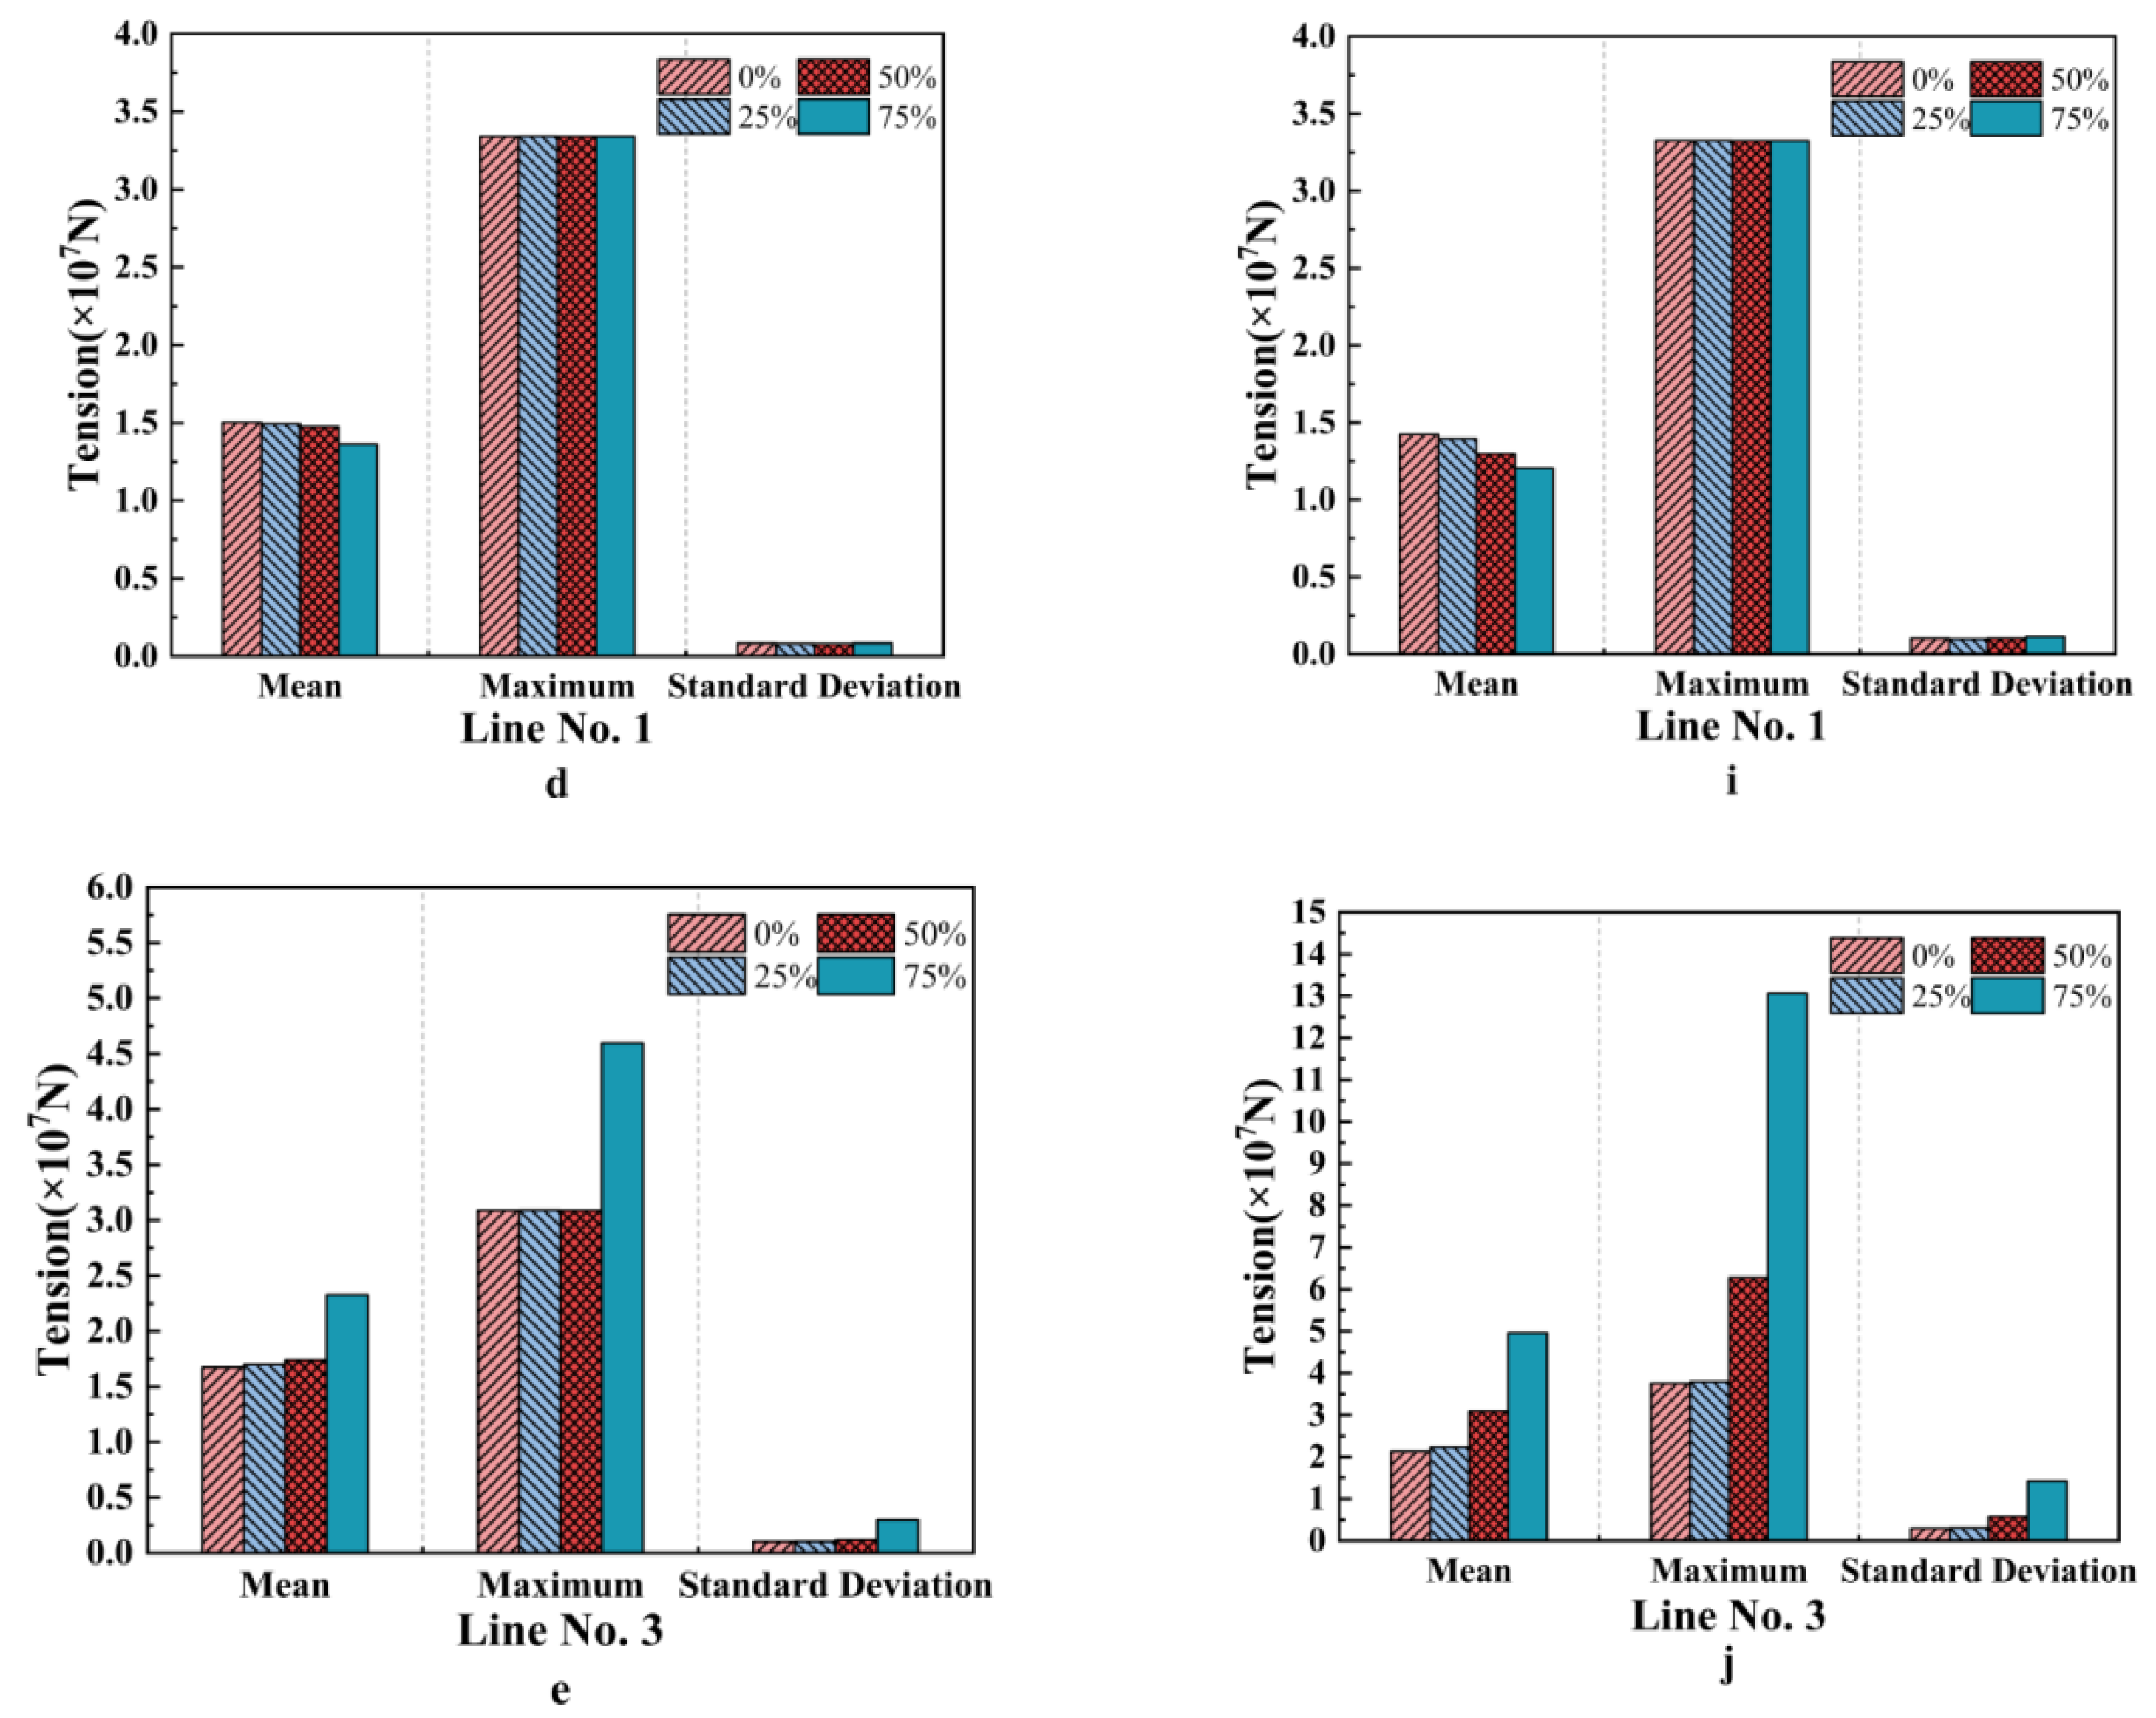
As the ratios of biological adhesion on the net cage increases, both mean and maximum displacements in the sway motion show an increasing trend. For the case in 75% of biological adhesion, sway displacements under the catenary mooring configuration in both sea conditions do not meet the requirement of specification. However, the sway displacements in both sea conditions meet the requirements for the taut mooring configuration. In the survival sea condition for the case in 75% of biological adhesion, the safety factors of Line 3 for both mooring methods fail to meet the regulatory requirements. Therefore, it should be cleaned regularly of the net cages and mooring cables to reduce the safety impact of biological adhesion on the integrated foundation of net cage structure and mooring lines under the case in over 50% of biological adhesion.
In both mooring configurations, biofouling on the mooring lines significantly increases the amplitude of sway motion, the increase in the amplitude of sway motion becomes more and more obvious with the increase of biofouling adhesion rate. Damping effect of biofouling adhesion on the roll and heave motion could be found. Effect of biofouling adhesion on the tension and safety of the mooring lines could be obvious, especially for the Line 3 with greater tension. Minimum safety factors of catenary and taut mooring are 4.24 and 3.07 respectively, both of which meet the requirements of the specifications.
In this paper, the limitations of this study are: (1) This study does not take into account the strength and deformation analysis of the integrated foundation of the wind turbine net cage caused by external loads. (2) As the determination of the drag force coefficient of Morrison bars can rely on more precise experiments rather than empirical formulas, the equivalent method of biological adhesion in this study can be further improved.

Author Contributions

Conceptualization, Y.H.; methodology, Y.H. and H.L.; software, H.L.; validation, J.L. (Junxin Liu); formal analysis, Y.C.; investigation, Y.H.; resources, Y.H.; data curation, J.L. (Jichao Lei); writing—original draft preparation, Y.H.; writing—review and editing, Y.H.; visualization, J.L. (Junxin Liu); supervision, J.L. (Jichao Lei); project administration, J.L. (Jichao Lei); funding acquisition, Y.C. All authors have read and agreed to the published version of the manuscript.

Funding

The first author acknowledges with thanks the research financial support provided by the Wuhan Talent Project for Excellent Youth (No. 45222071) and Hubei Province government for oversea youth talent project. The third author thanks to the Science and Technology Project of Jiangxi Provincial Department of Transportation (2024QN011) and also appreciates the State Key Laboratory of Geomechanics and Geotechnical Engineering Safety, Institute of Rock and Soil Mechanics, Chinese Academy of Sciences, Grant NO. (SKLGGES-024013). All authors also would like to thank the anonymous reviewers for their constructive comments to improve the quality of the paper.

Data Availability Statement

Data is available upon request to the corresponding authors.

Conflicts of Interest

The authors declare no conflict of interest.

References

  1. Liu, J.; Wang, K.; Han, R.; Huang, S.; Xiao, Y. SPH simulation of hydrodynamic response of a semi-submersible aquaculture platform. In Proceedings of the ASME 2024 43rd International Conference on Ocean, Offshore and Arctic Engineering, Singapore, 9–14 June 2024. [Google Scholar] [CrossRef]
  2. Pang, G.L.; Zhang, S.; Liu, H.Y.; Zhu, T.P.; Li, G.; Han, X.X.; Huang, X.H. Hydrodynamic response analysis for a new semi-submersible vessel-shaped fish farm platform based on numerical simulation. Front. Mar. Sci. 2023, 10, 1135757. [Google Scholar] [CrossRef]
  3. Zhang, Z.; Liu, Y. The status quo, issues and foreign experiences of deep sea aquaculture equipment of China. In Proceedings of the 2018 2nd International Conference on Social Sciences, Arts and Humanities (SSAH 2018), Tianjin, China, 9–10 June 2018. [Google Scholar] [CrossRef]
  4. Chen, P.; Kang, Y.R.; Xu, S.J.; Lie, L.; Cheng, Z.S. Numerical modeling and dynamic response analysis of an integrated semi-submersible floating wind and aquaculture system. Renew. Energy 2024, 225, 120355. [Google Scholar] [CrossRef]
  5. Zhang, Y.M.; Bi, C.W.; He, S.Y.; Huang, L.Y. Numerical analysis of the hydrodynamic response of an aquaculture-cage group in offshore wind farm. Ocean Eng. 2024, 309, 118404. [Google Scholar] [CrossRef]
  6. Zhai, Y.T.; Zhao, H.S.; Li, X.; Feng, M.W.; Zhou, Y.M. Effects of aquaculture cage and netting on dynamic responses of novel 10 MW barge-type floating offshore wind turbine. Ocean Eng. 2024, 295, 116896. [Google Scholar] [CrossRef]
  7. Chu, Y.I.; Wang, C.M.; Park, J.C.; Lader, P.F. Review of cage and containment tank designs for offshore fish farming. Aquaculture 2020, 519, 734928. [Google Scholar] [CrossRef]
  8. Guo, G.B.; You, X.X.; Hu, F.X.; Yamazaki, R.; Zhuang, X.; Wu, Q.L.; Lan, G.H.; Huang, L.Y. Hydrodynamic characteristics of fine-mesh minnow netting for sampling nets. Ocean Eng. 2023, 281, 114738. [Google Scholar] [CrossRef]
  9. Liu, Z.Q.; Hu, F.X.; Wan, R.; Zhang, T.Z.; Wang, Y.C.; Guo, S.J.; Zhou, C. Evaluating the hydrodynamic characteristics and shape configuration of fine-mesh nettings for sampling nets. Ocean Eng. 2024, 312, 119143. [Google Scholar] [CrossRef]
  10. Huang, X.H.; Guo, G.X.; Tao, Q.Y.; Hu, Y.; Liu, H.Y.; Wang, S.M.; Hao, S.H. Dynamic deformation of the floating collar of a net cage under the combined effect of waves and current. Aquac. Eng. 2018, 83, 47–56. [Google Scholar] [CrossRef]
  11. Buck, B.H. Farming in a high energy environment: Potentials and constraints of sustainable offshore aquaculture in the German Bight (North Sea). Rep. Polar Mar. Res. 2007, 543, 1–235. [Google Scholar] [CrossRef]
  12. Buck, B.H.; Buchholz, C.M. The offshore-ring: A new system design for the open ocean aquaculture of macroalgae. J. Appl. Phycol. 2004, 16, 355–368. [Google Scholar] [CrossRef]
  13. Buck, B.H.; Langan, R. Aquaculture Perspective of Multi-Use Sites in the Open Ocean: The Untapped Potential for Marine Resources in the Anthropocene; Springer International Publishing: Cham, Switzerland, 2017; pp. 51–52. [Google Scholar] [CrossRef]
  14. Chen, C.; Wang, H.B.; Zhang, X.Y.; Zhang, X.T. Numerical investigation on coupling hydrodynamics of cylinder and nets of semi-submersible aquaculture net cage under uniform flow. Chin. J. Hydrodyn. Ser. A 2024, 39, 606–614. [Google Scholar] [CrossRef]
  15. Zhang, C.L.; Wang, S.M.; Cui, M.C.; Liu, H.; Liu, A.D.; Xu, J.C.; Xie, S.Y. Modeling and dynamic response analysis of a submersible floating offshore wind turbine integrated with an aquaculture cage. Ocean Eng. 2022, 263, 112338. [Google Scholar] [CrossRef]
  16. Yao, Y.S.; Mayon, R.; Zhou, Y.; Zhu, Y.; Ning, D.Z. Integrated system of semi-submersible offshore wind turbine foundation and porous shells. J. Mar. Sci. Appl. 2024, 23, 491–505. [Google Scholar] [CrossRef]
  17. Gao, S.; Zhang, L.X.; Shi, W.; Wang, B.; Li, X. Dynamic responses for windfloat floating offshore wind turbine at intermediate water depth based on local conditions in China. J. Mar. Sci. Eng. 2021, 9, 1093. [Google Scholar] [CrossRef]
  18. Han, Y.Q.; Le, C.H.; Zhang, P.Y.; Xu, S.N. Comparisons of wave force model effects on the structural responses and fatigue loads of a semi-submersible floating wind turbine. J. Ocean. Univ. China 2024, 23, 69–79. [Google Scholar] [CrossRef]
  19. Gong, D.H.; Zhou, J.W.; Liu, X.F.; Li, F.M. Modeling and vortex-induced vibrations of semi-submersible floating offshore wind turbines. Mech. Syst. Signal Process 2024, 220, 111667. [Google Scholar] [CrossRef]
  20. Ma, G.; Bai, L.; Sun, K.; Zhang, J.; Du, Z.; Ren, Z.; Bai, Y. Hydrodynamic analysis of a semi-submersible aquaculture platform with mesh grouping impact. Ships Offshore Struct. 2025, 1–10. [Google Scholar] [CrossRef]
  21. Ma, Y.; Tan, Q.T.; Zhu, Y.Y.; Hu, C. Numerical modeling and hydrodynamic response analysis of spar-type floating offshore wind turbine integrated with aquaculture cage. Ocean Eng. 2025, 318, 120003. [Google Scholar] [CrossRef]
  22. Liu, H.F.; Huang, X.H.; Pang, G.L.; Li, G.; Yuan, T.P.; Hu, Y.; Tao, Q.Y. Assessment on drag force distribution of a semi-submersible truss fish cage in currents. Front. Mar. Sci. 2025, 12. [Google Scholar] [CrossRef]
  23. Son, D.; Pinguet, R.; Roddier, D. Global Sizing of the WindFloat for a 10 MW Generic Wind Turbine. In Proceedings of the ASME 2018 1st International Offshore Wind Technical Conference, San Francisco, CA, USA, 4–7 November 2018. [Google Scholar] [CrossRef]
  24. Robertson, A.N.; Wendt, F.; Jonkman, J.M.; Popko, W.; Dagher, H.; Gueydon, S.; Qvist, J.; Vittori, F.; Azcona, J.; Uzunoglu, E.; et al. OC5 project phase II: Validation of global loads of the deepcwind floating semisubmersible wind turbine. Energy Procedia 2017, 137, 38–57. [Google Scholar] [CrossRef]
  25. Huang, X.H.; Liu, H.Y.; Hu, Y.; Yuan, T.P.; Tao, Q.Y.; Wang, S.M.; Liu, Z.X. Hydrodynamic performance of a semi-submersible offshore fish farm with a single point mooring system in pure waves and current. Aquac. Eng. 2020, 90, 102075. [Google Scholar] [CrossRef]
  26. Kristiansen, T.; Faltinsen, O.M. Experimental and numerical study of an aquaculture net cage with floater in waves and current. J. Fluids Struct. 2015, 54, 1–26. [Google Scholar] [CrossRef]
  27. Chen, Q.P.; Ma, C.; Zhao, Y.P.; Bi, C.W.; Liu, H.F. Hydrodynamics of focused waves acting on netting that extends above the mean sea level. Ocean Eng. 2024, 309, 118516. [Google Scholar] [CrossRef]
  28. DeCew, J.; Tsukrov, I.; Risso, A.; Swift, M.R.; Celikkol, B. Modeling of dynamic behavior of a single-point moored submersible fish cage under currents. Aquac. Eng. 2010, 43, 38–45. [Google Scholar] [CrossRef]
  29. Li, L.; Fu, S.X.; Xu, Y.W.; Wang, J.G.; Yang, J.M. Dynamic responses of floating fish cage in waves and current. Ocean Eng. 2013, 72, 297–303. [Google Scholar] [CrossRef]
  30. Liu, H.F.; Liu, Y. Numerical investigation on the dynamic response of the semi-submersible aquaculture platform in regular waves. Ocean Eng. 2024, 294, 116718. [Google Scholar] [CrossRef]
  31. Bi, C.W.; Zhao, Y.P.; Dong, G.H.; Wu, Z.M.; Zhang, Y.; Xu, T.J. Drag on and flow through the hydroid-fouled nets in currents. Ocean Eng. 2018, 161, 195–204. [Google Scholar] [CrossRef]
  32. Swift, M.R.; Fredriksson, D.W.; Unrein, A.; Fullerton, B.; Patursson, O.; Baldwin, K. Drag force acting on biofouled net panels. Aquac. Eng. 2006, 35, 292–299. [Google Scholar] [CrossRef]
  33. Nobakht-Kolur, F.; Zeinoddini, M.; Aliakbari, T.; Bahram, M. Wave attenuation/build-up around and inside marine fouled floating aquaculture cages under regular wave regimes. J. Ocean Eng. Mar. Energy 2021, 7, 59–81. [Google Scholar] [CrossRef]
  34. Chen, Y.S.; Pang, G.L.; Huang, X.H.; Li, G.; Yuan, T.P.; Hu, Y.; Tao, Q.Y. Influence of net on structural response of jack-up truss net cage. South China Fish. Sci. 2024, 20, 43–53. [Google Scholar] [CrossRef]
  35. Lader, P.F.; Enerhaug, B. Experimental investigation of forces and geometry of a net cage in uniform. IEEE J. Ocean. Eng. 2005, 30, 79–84. [Google Scholar] [CrossRef]
  36. Cheng, H.; Aydemir, O.; Ong, M.C. Numerical investigations on wake effects of fish cages. J. Offshore Mech. Arct. Eng. 2024, 146, 061301. [Google Scholar] [CrossRef]
  37. Fan, Z.Q.; Liang, Y.H.; Zhao, Y.P. Review of the research on the hydrodynamics of fishing cage nets. Ocean Eng. 2023, 276, 114192. [Google Scholar] [CrossRef]
  38. Gudmestad, O.K.; Moe, G. Hydrodynamic coefficients for calculation of hydrodynamic loads on offshore truss structure. Mar. Struct. 1996, 9, 745–758. [Google Scholar] [CrossRef]
  39. Benham, F.A. Prediction of Wind and Current Loads on VLCCs; Witherby & Co Ltd: London, UK, 1997. [Google Scholar]
  40. Fredriksson, D.W.; Decew, J.C.; Irish, J.D. A field study to understand the currents and loads of a near shore finfish farm. In Proceedings of the OCEANS 2006, Boston, MA, USA, 18–21 September 2006. [Google Scholar] [CrossRef]
  41. Løland, G. Current force on and flow through fish farms. Aquac. Int. 1991, 1, 72–89. [Google Scholar] [CrossRef]
  42. Huang, L.; Li, Y.; Ni, Y.; Cheng, H.; Wang, X.; Wang, G.; Zhao, F. Study on the influence of mesh grouping on numerical simulation results of fish cages. In Proceedings of the ASME 2019 38th International Conference on Ocean, Offshore and Arctic Engineering, Glasgow, UK, 9–14 June 2019. [Google Scholar] [CrossRef]
  43. Su, H.; Bi, C.; Zhao, Y. Numerical analysis of the dynamic response of an integrated structure of the floating wind turbine and the fish cage to regular waves. In Proceedings of the 9th Conference on Computational Methods in Marine Engineering (Marine 2021), Online, 2–4 June 2021. [Google Scholar] [CrossRef]
  44. Su, H. Dynamic Response of Integrated Structure of Semi-Submersible Cage and Wind Turbine Under Wave and Currents. Master’s Thesis, Dalian University of Technology, Dalian, China, 2022. (In Chinese). [Google Scholar]
  45. Zahle, F.; Barlas, T.; Lonbaek, K.; Bortolotti, P.; Zalkind, D.; Wang, L.; Labuschagne, C.; Sethuraman, L.; Barter, G. Definition of the IEA Wind 22-Megawatt Offshore Reference Wind Turbine: IEA Wind TCP Task 55; Technical University of Denmark: Lyngby, Denmark, 2024. [Google Scholar] [CrossRef]
  46. Allen, C.; Viscelli, A.; Dagher, H.; Goupee, A.; Gaertner, E.; Abbas, N.; Hall, M.; Barter, G. Definition of the UMaine VolturnUS-S Reference Platform Developed for the IEA Wind 15-Megawatt Offshore Reference Wind Turbine: IEA Wind TCP Task 37. 2020. Available online: https://docs.nrel.gov/docs/fy20osti/76773.pdf (accessed on 15 July 2025).
  47. Lei, Y.; Zhao, S.X.; Zheng, X.Y. Effects of fish nets on the nonlinear dynamic performance of a floating offshore wind turbine integrated with a steel fish farming cage. Int. J. Struct. Stab. Dyn. 2020, 20, 2050042. [Google Scholar] [CrossRef]
  48. CCS. Classification Code for Offshore Floating Facilities; China Classification Society: Beijing, China, 2023. (In Chinese)
Figure 1. Schematic diagram of the experimental model.
Jmse 13 01372 g001
Figure 2. Geometric dimensions of the experimental model (cm).
Jmse 13 01372 g002
Figure 3. Experimental mooring configuration.
Jmse 13 01372 g003
Figure 4. Hydrodynamic model of the integrated foundation.
Jmse 13 01372 g004
Figure 5. Mean drift force results.
Jmse 13 01372 g005
Figure 6. Error comparison between numerical and experimental models. (a) Surge. (b) Heave. (c) Pitch. (d) Tension.
Jmse 13 01372 g006
Figure 7. Main dimensions of the wind turbine-cage foundation structure (m).
Jmse 13 01372 g007
Figure 8. Schematic Diagram of the HDPE Aquaculture Net.
Jmse 13 01372 g008
Figure 9. Schematic diagram of integrated foundation of floating wind turbine and net cage.
Jmse 13 01372 g009
Figure 10. Top view of mooring layout.
Jmse 13 01372 g010
Figure 11. Side view of mooring Line 3.
Jmse 13 01372 g011
Figure 12. Thrust versus wind speed curve of the 22 MW Wind Turbine.
Jmse 13 01372 g012
Figure 13. Wave incident angles.
Jmse 13 01372 g013
Figure 14. RAOs under different biofouling levels in operational sea state. (a) Surge RAOs, 0° (b) Pitch RAOs, 0° (c) Heave RAOs, 0° (d) Sway RAOs, 90° (e) Roll RAOs, 90° (f) Yaw RAOs, 120°.
Jmse 13 01372 g014
Figure 15. Time-domain response statistics of catenary mooring under operational sea state (left) and survival sea state (right). (a,f) Sway Displacement under Two Sea States; (b,g) Roll Displacement under Two Sea States; (c,h) Heave Displacement under Two Sea States; (d,i) Tension of Line 1 under Two Sea States; (e,j) Tension of Line 3 under Two Sea States.
Jmse 13 01372 g015aJmse 13 01372 g015b
Figure 16. Time-domain response statistics of taut mooring under operational sea state (left) and survival sea state (right). (a,f) Sway Displacement under Two Sea States; (b,g) Roll Displacement under Two Sea States; (c,h) Heave Displacement under Two Sea States; (d,i) Tension of Line 1 under Two Sea States; (e,j) Tension of Line 3 under Two Sea States.
Jmse 13 01372 g016aJmse 13 01372 g016b
Table 1. Basic parameters of the experimental model.
ParameterValuesParameterValues
Side length0.4 mHeight0.4 m
Draft0.255 mBlade length61.5 cm
Total mass8.7 kgUpper turbine mass0.6 kg
Lower cage mass8.1 kgCounterweight1804 g
Mesh size12.5 mmNumber of bent tubes6 + 6
Set water depth0.7 mNet wire diameter2 mm
Number of diagonal braces6 + 6 + 6Blade mass0.6 kg
Table 2. Dimension parameters of the experimental model.
Name of Components Length (m)Diameter (mm)Thickness (mm)
Upper arc pipe0.4163
Lower arc pipe0.4163
Thick column0.41205
Central column0.4655
Diagonal brace0.565163
Lower beam0.4163
Wind turbine tower0.876505
Table 3. Parameters of the experimental mooring.
Mooring ParameterNo.Length (m)Diameter (mm)MaterialPlatform Connection Position (m)Anchor Point Position (m)
Taut mooring132.2Nylon(−0.35, 0.2, −0.25)(−3.20, 1, −0.7)
2(−0.35, −0.2, −0.25)(−3.20, −1, −0.7)
3(0.35, −0.2, −0.25)(3.20, −1, −0.7)
4(0.35, 0.2, −0.25)(3.20, 1, −0.7)
Table 4. Equivalent results of grid grouping.
Equivalent Volume MethodMesh Size (cm)Cage Diameter (mm)Solidity RatioDrag Coefficient
Values 53.160.121.65
Table 5. Comparative results of surge, heave, pitch and mooring line tension.
Wave Period (s)0.81.01.21.41.6
Experimental valuesSurge (m)1.12.23.25.47.7
Heave (m)0.71.33.25.37.2
Pitch (°)0.30.51.84.86.7
Tension (N)2.36.29.010.211.0
Numerical valuesSurge (m)1.12.13.35.27.9
Error (%)04.53.13.72.5
Heave (m)0.61.33.15.27.1
Error (%)14.303.131.891.39
Pitch (°)0.30.51.65.16.9
Error (%)0011.16.33
Tension (N)2.569.39.811.4
Error (%)8.73.23.33.93.6
Table 6. Hydrodynamic parameters of the integrated foundation.
ParametersUnitValues
Integrated foundationPlatform displacementm324,727
Center of gravity coordinates to still water levelm−15.2
Draft depthm25
Water plane aream2481
Roll moment of inertia to the center of gravitykg·m22.30 × 1010
Pitch moment of inertiakg·m22.30 × 1010
Yaw moment of inertiakg·m24.32 × 1010
Morrison barSpacing between two adjacent bar m3.6
Diameter of bar cm4.8
Drag coefficient1.33
Mass coefficient1.75
Table 7. Parameters of catenary and taut mooring.
ParametersUnitValue 1Value 2
Mooring system typeCatenary mooringTaut mooring
Breaking strengthMN103.8103.8
Anchor depthm200200
Fairlead depthm18.118.1
Mooring radiusm837.8370
Mooring chain angle°120120
Anchor chain lengthm837319.2
Linear density of air kg/m3184.03184.0
Linear density of waterkg/m2778.42778.4
Equivalent cross-sectional aream20.4060.406
Axial stiffnessMN13,67013,670
Added mass coefficient11
Transverse drag coefficient1.61.6
Tangential drag coefficient0.10.1
Equivalent diameterm0.40.4
Table 8. Mooring position parameters of Lines 1, 2 and 3.
Mooring Lines No.123
Fairlead coordinates/mXCatenary61.7−61.70
Taut61.7−61.70
YCatenary−35.63−35.6371.5
Taut−35.63−35.6371.5
ZCatenary−18.1−18.1−18.1
Taut−18.1−18.1−18.1
Anchor point coordinates/mXCatenary725.6−725.60
Taut320.4−320.40
YCatenary−418.9−418.9837.8
Taut−185−185370
ZCatenary−200−200−200
Taut−200−200−200
Table 9. Environmental condition parameters.
ParametersUnitOperational ConditionSurvival Condition
Wave spectrumJONSWAPJONSWAP
Peak enhancement factor3.33.3
Peak periods11.813.8
Significant wave heightm6.912.1
Wind speedm/s16.734.4
Current speedm/s0.841.72
Table 10. Design criteria for mooring system.
Design ElementGeneral Design RequirementsMaximum Structural OffsetSafety Factor
Design conditionIntact conditionOperational conditionSurvival conditionIntact condition
Design criteriaNo failure≤20 m≤40 m≥1.67
Table 11. Parameters of the netting system under different ratios of biological fouling.
Ratios of Biological Fouling/%Solidity RatioTwine Diameter/cmCD
Before EquivalenceAfter EquivalenceBefore EquivalenceAfter Equivalence
00.160.604.100.201.47
250.250.976.630.423.04
500.502.1114.421.198.71
750.753.6024.591.8713.67
Table 12. Equivalent parameters of mooring lines under different biofouling levels.
ParametersEquivalent Diameter (m)Added Mass CoefficientTransverse Drag Coefficient
No biofouling0.411.6
Biofouling level 10.61.052.0
Biofouling level 20.81.102.4
Table 13. Damping correction results.
Sea State LevelOperational ConditionSurvival Condition
Ratios of Biological Fouling0%25%50%75%0%25%50%75%
Damping correction percentagePitch0.41.14.19.81.02.06.714.3
Heave0.81.75.613.21.63.19.519.8
Roll0.51.24.210.01.12.27.315.1
Table 14. Motion responses and mooring tensions of a catenary mooring system under survival conditions.
Motion DOFTension of Mooring Line
Sway (m)Roll (°)Heave (m)Line 1 (MN)Line 3 (MN)
No biofoulingMean17.980.530.178.6915.23
Maximum26.467.214.5410.6523.32
Standard deviation/Safety factor3.752.271.6310.144.63
Biofouling level 1Mean19.250.690.098.7615.90
Maximum27.456.324.3910.7324.41
Standard deviation/Safety factor3.811.891.4710.074.42
Biofouling level 2Mean20.920.860.038.9816.81
Maximum28.875.774.2310.9725.43
Standard deviation/Safety factor3.941.671.359.854.24
Table 15. Motion responses and mooring tensions of taut mooring system under survival conditions.
Motion DOFTension of Mooring Line
Sway (m)Roll (°)Heave (m)Line 1 (MN)Line 3 (MN)
No biofoulingMean3.170.750.0114.2221.31
Maximum7.746.955.1916.3237.53
Standard deviation/Safety factor1.572.201.436.612.88
Biofouling Level 1Mean3.320.870.0214.0921.54
Maximum8.045.924.5016.1535.46
Standard deviation/Safety factor1.581.861.256.693.05
Biofouling Level 2Mean3.471.020.0113.9421.86
Maximum8.285.503.8415.9835.23
Standard deviation/Safety factor1.591.641.136.763.07
Disclaimer/Publisher’s Note: The statements, opinions and data contained in all publications are solely those of the individual author(s) and contributor(s) and not of MDPI and/or the editor(s). MDPI and/or the editor(s) disclaim responsibility for any injury to people or property resulting from any ideas, methods, instructions or products referred to in the content.

