Abstract
To achieve efficient and sustainable marine aquaculture, STAR-CCM+ was used to simulate the internal and external field characteristics of a semi-submersible aquaculture platform based on a porous media model, focusing on the influence of incoming flow velocity and net solidity ratio. The results indicate that the flow field distribution around the platform exhibits no significant regularity and that low-velocity vortex regions are primarily concentrated near the pillars and nets. After velocity attenuation, the velocity reduction coefficients at the centers of the three cages are 90.26%, 63.65%, and 52.56%, respectively. Furthermore, the velocity attenuation inside the cages is minimally influenced by incoming flow velocity, with a maximum difference of 3.10%. In contrast, differences in net solidity ratio significantly affect velocity attenuation, particularly in downstream regions. The velocity reduction coefficient in the third cage varies by up to 43.25% depending on the net solidity ratio. These findings provide practical insights for the engineering design and application of aquaculture platforms.
1. Introduction
Amid intensifying competition for global marine resources and the escalating deterioration of the offshore aquaculture environment [1,2], deep-sea aquaculture has emerged as a pivotal direction for the sustainable development of marine fisheries. A series of innovative aquaculture facilities have been developed in recent years, including the aquaculture workboat JOSTEIN ALBERT, the fully submersible net cage ‘Deep Blue 1’, and the semi-submersible aquaculture platforms ‘Ocean Farm 1’ and ‘Strait Farm 1’. Among these, a truss-type aquaculture platform characterized by its semi-submersible structural design and superior resistance to wind and waves has been deployed in Guangdong, China. However, aquaculture platforms in deep and remote sea areas are often subjected to extreme environmental loads such as intense wind, waves, and currents, which can adversely affect farmed fish. Consequently, the hydrodynamic problems of deep-sea aquaculture platforms have garnered significant attention from researchers [3].
The net is a critical factor influencing the flow field around aquaculture platforms; its flexible, small-scale structure results in an exceptionally complex flow field distribution. To study the hydrodynamic characteristics of the net, extensive research has been conducted using both experimental and numerical methods [4,5,6]. In response to the structural complexity of the net, researchers have proposed various simplified models, including the Morrison model [7,8,9] and the screen model [6,10,11]. Among these, the porous media model has been widely adopted in computational fluid dynamics (CFD) methods. Patursson et al. [12] pioneered the use of the porous media model to simulate the net, optimizing the process of determining the best-fitting porous media coefficients. Subsequently, Zhao et al. [13] simulated the flow field around the net and validated the accuracy of the numerical model through experimental studies. Bi et al. [14] employed the porous media model in conjunction with particle image velocimetry (PIV) and acoustic Doppler velocimetry (ADV) techniques to research the flow velocity attenuation downstream of the net. Furthermore, Chen et al. [15] integrated the porous media model with the concentrated mass method to analyze the fluid-structure interaction between water flow and the net.
Currently, aquaculture equipment is evolving from traditional net cages to advanced farming platforms that integrate flexible nets with rigid structural frameworks. The stability and safety of these aquaculture platforms in marine environments are fundamental prerequisites for ensuring the sustainable development of marine fisheries [16,17,18]. Moreover, the flow velocity within the net cages is a critical factor influencing the survival and growth of cultured fish [19]. Accurately predicting and analyzing the flow field characteristics inside aquaculture platforms can provide a vital theoretical foundation for optimizing the aquaculture environment and enhancing fish survival rates. Zhao et al. [20] and Liu et al. [21] introduced a novel approach combining the porous media model and rigid wall boundary conditions to analyze the flow field both inside and around semi-submersible aquaculture platforms. Their findings revealed that the presence of nets significantly expanded the low-velocity flow regions and increased the hydrodynamic load on the nets. Yang et al. [22] conducted a detailed investigation into the effects of flow velocity, angle of attack, and on the flow field around bottom-fixed aquaculture platforms (BFAF), providing valuable suggestions for optimizing platform layout. Furthermore, Ji et al. [23,24] explored the hydrodynamic mechanisms of double-layer nets on bottom-supported platforms. Their results demonstrated that platforms equipped with double-layer nets exhibit more pronounced flow velocity attenuation compared to those with single-layer nets. They also recommended selecting an appropriate and number of net layers to achieve efficient water exchange.
However, existing studies have primarily focused on prediction and analysis of the flow field distribution within individual net cages. In contrast, the flow field characteristics of a specific truss-type aquaculture platform representing a complex structural system comprising multiple net cages are influenced not only by the nets but also by the integrated interactions between multiple pillar structures and the nets. Currently, research on such aquaculture platforms remains limited, necessitating further exploration.
To address the aforementioned challenges, this study employs STAR-CCM+ (17.04.007) to discretize the governing equations using the finite volume method (FVM). The discretized equations are solved to obtain the velocity field and pressure field of the fluid. We incorporate a porous media model to simulate the net’s effect on the flow field, thereby conducting simulation analysis of the internal and external flow field characteristics of the semi-submersible aquaculture platform with multiple cage configuration. The rest of this paper is structured as follows: Section 2 provides a detailed introduction to the physical model, mathematical equations, boundary conditions, and mesh division; Section 3 conducts convergence analysis and rigorously validates results; Section 4 offers a detailed analysis of the flow field characteristics of semi-submersible aquaculture platforms with multiple net cage configurations as well as the influences of and on the platform’s flow field; finally, Section 5 summarizes the key findings and conclusions of the study.
2. Numerical Model
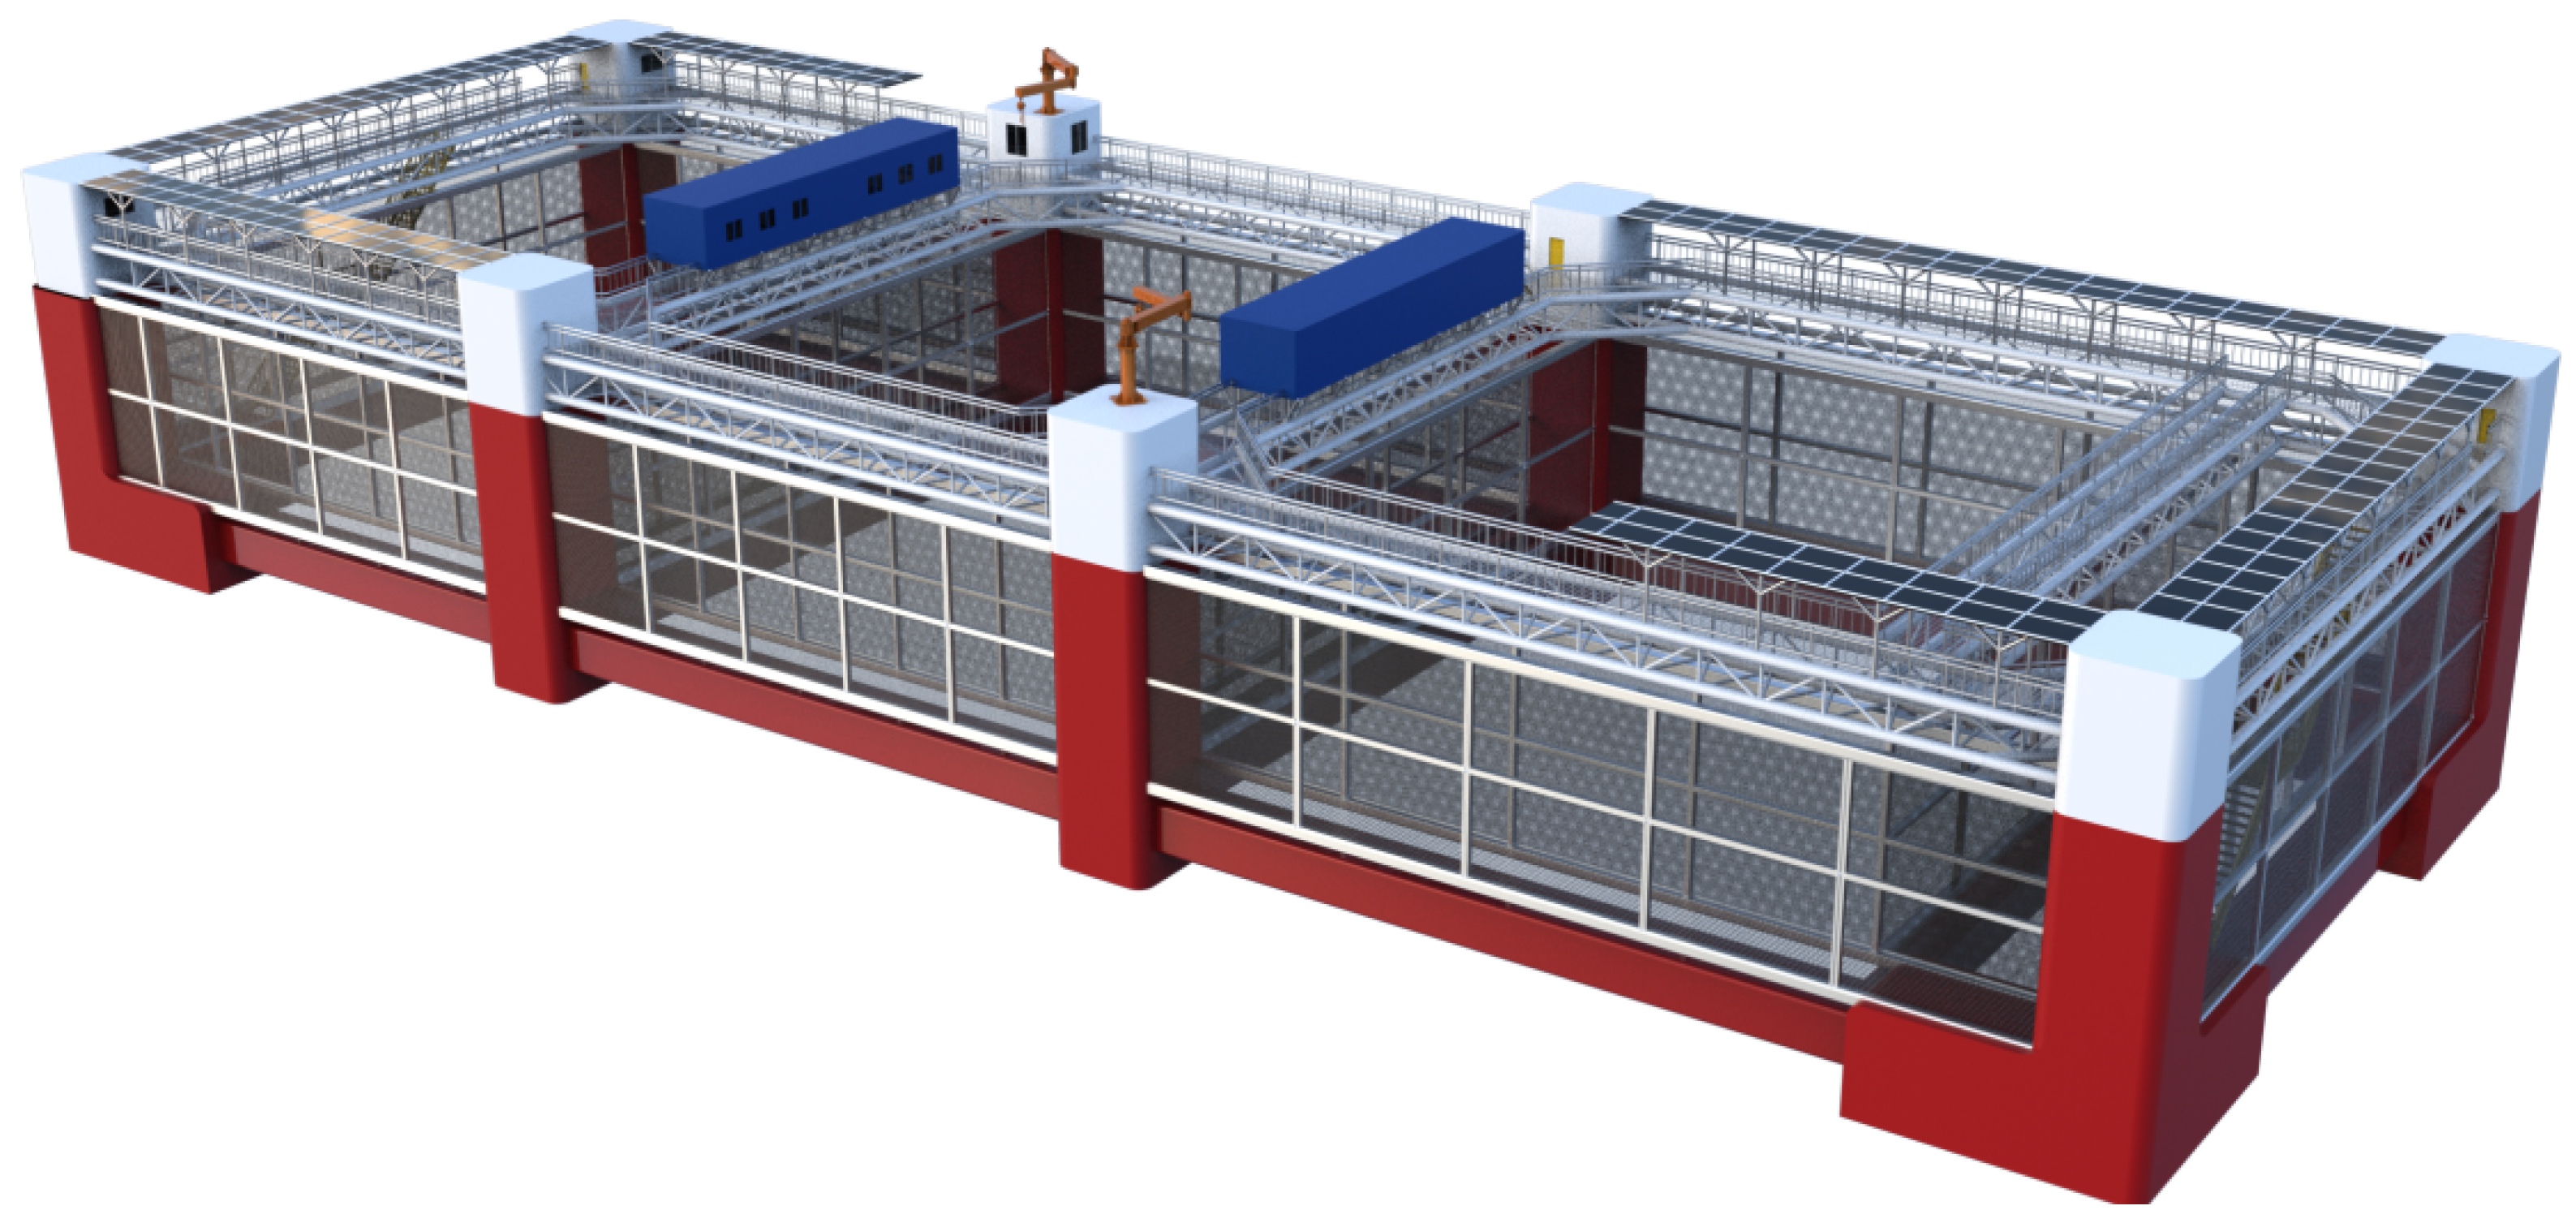
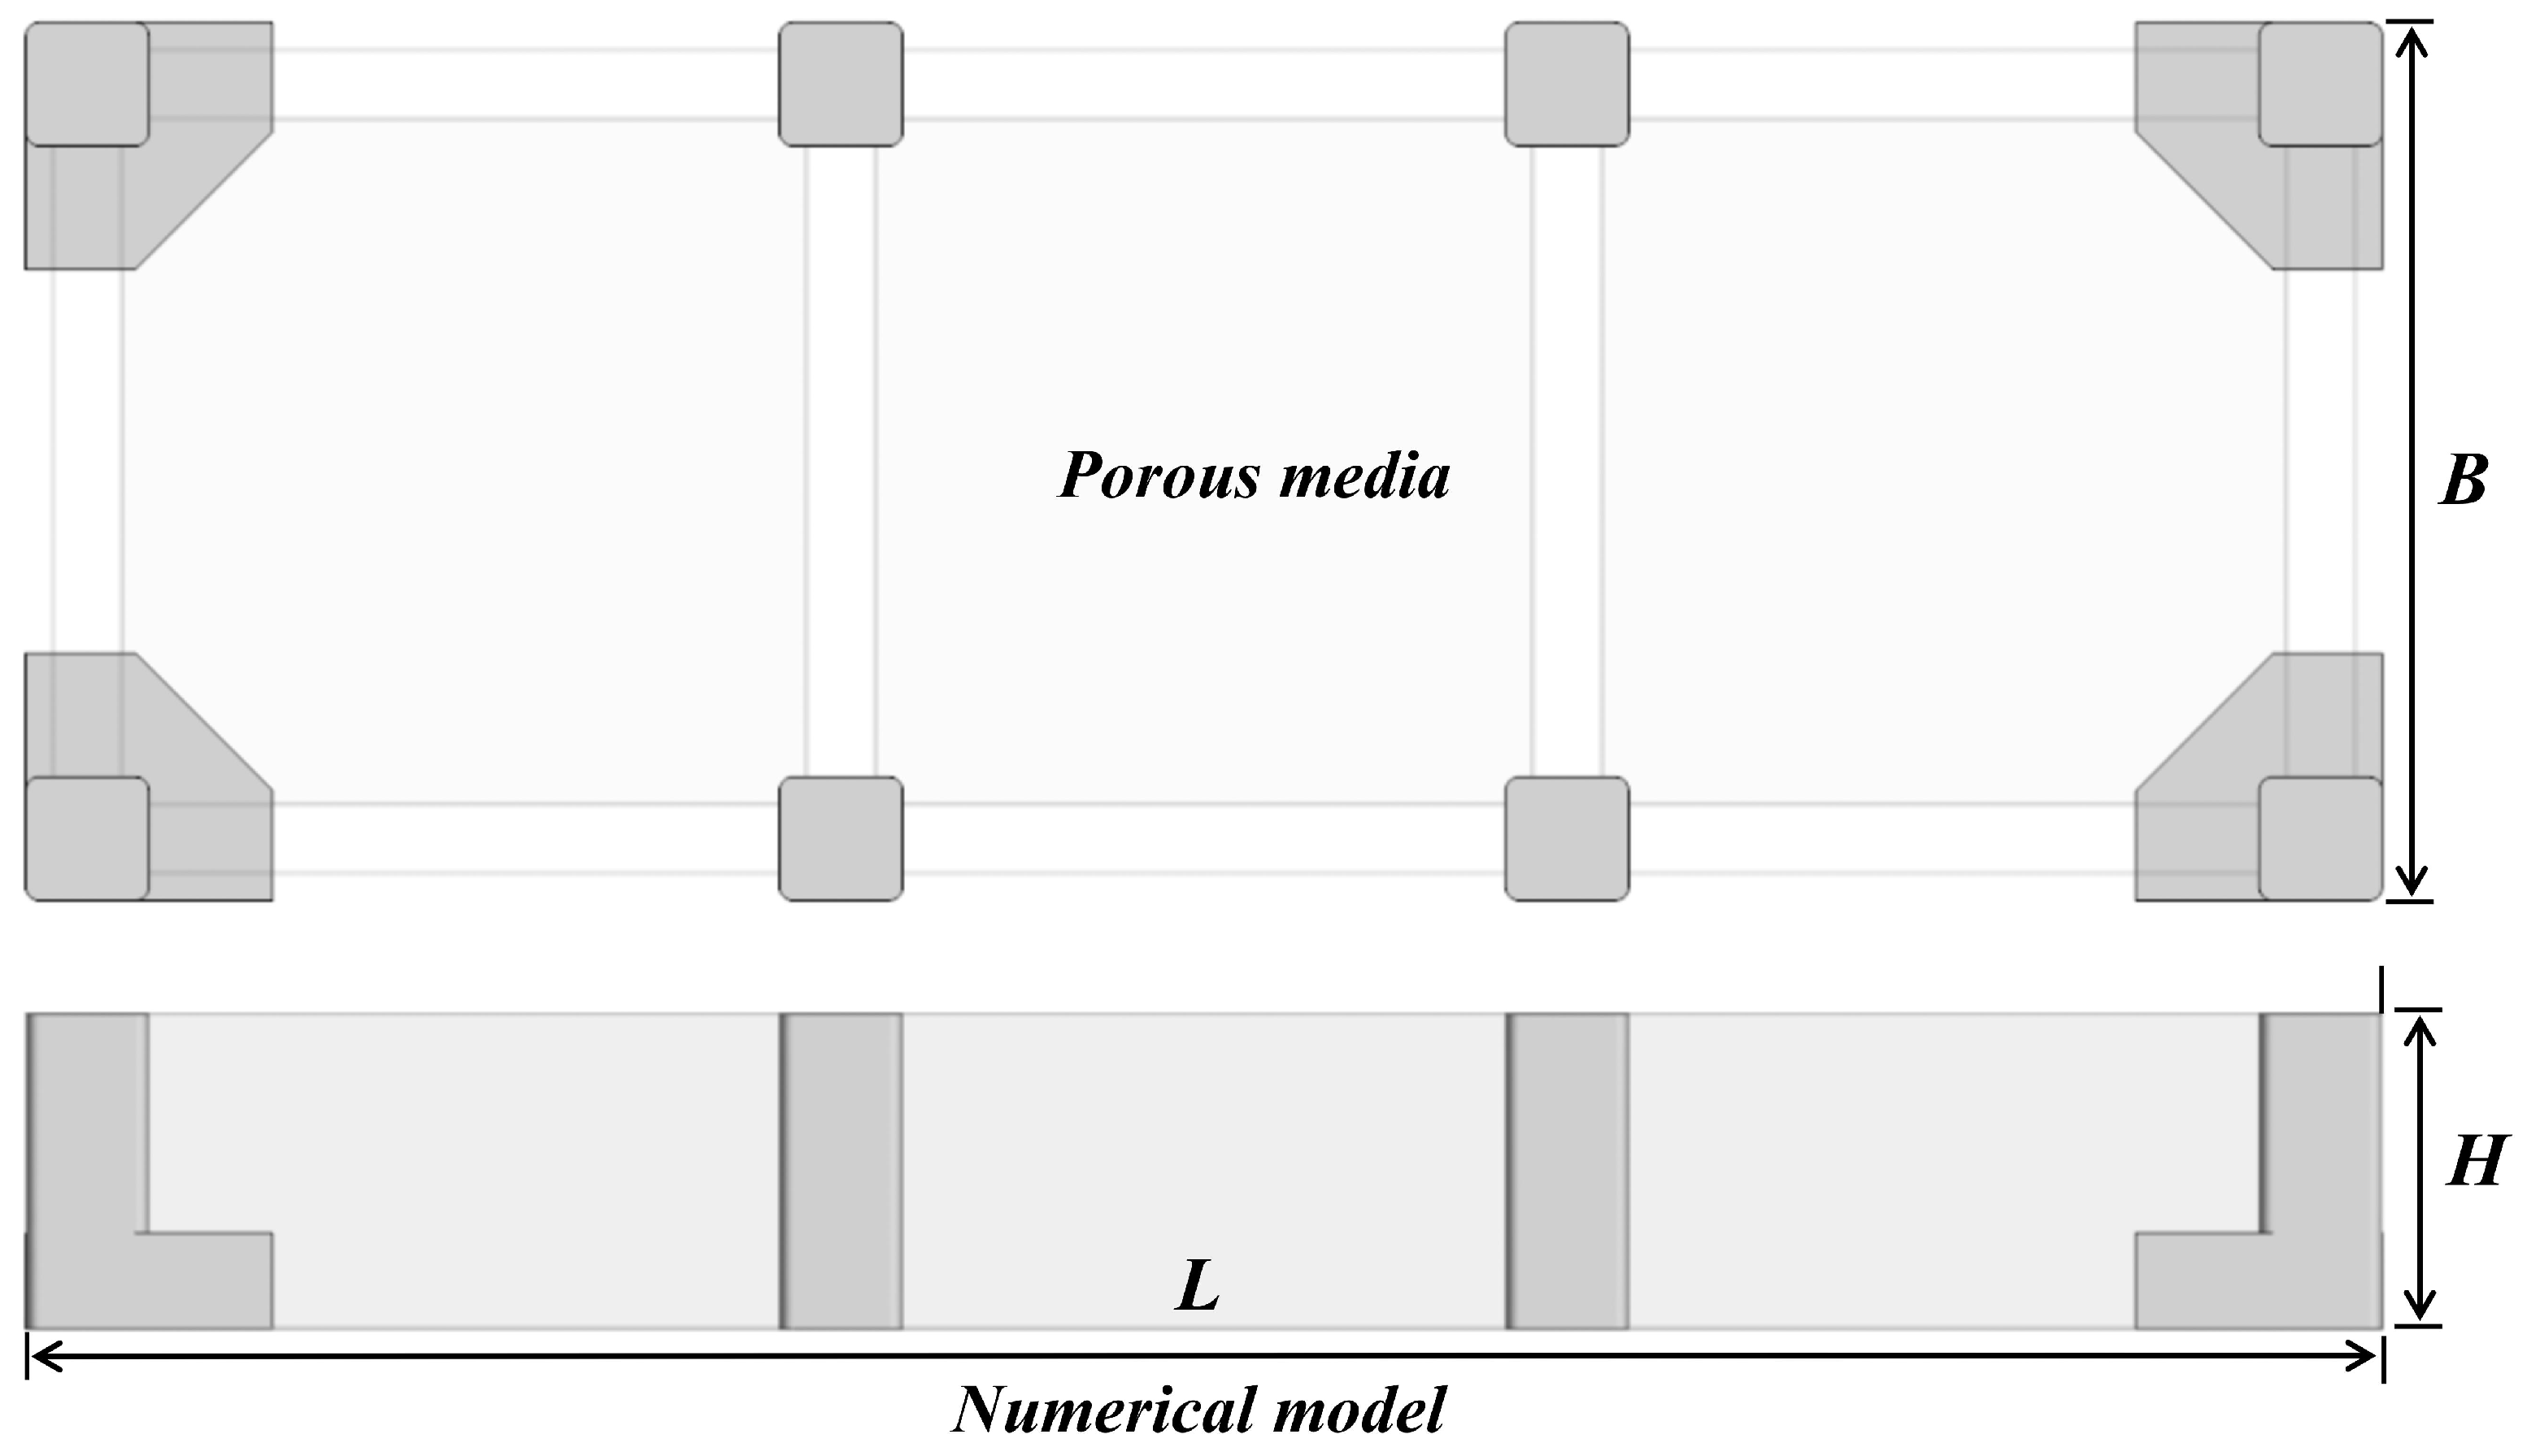
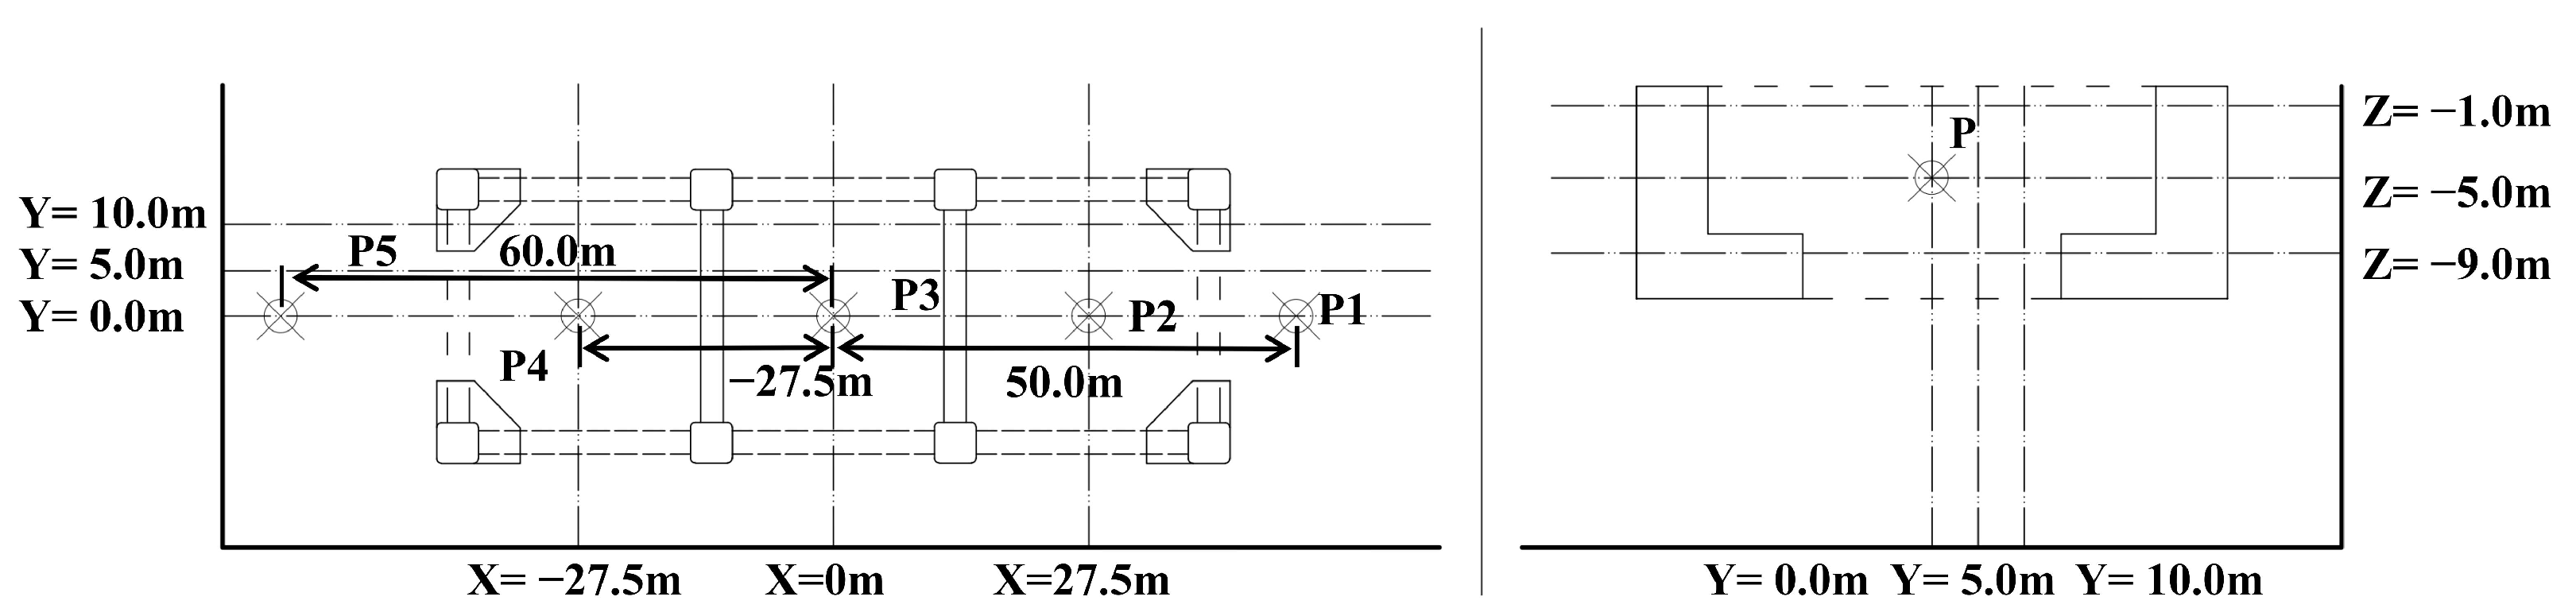
2.1. Physical Models
As shown in Figure 1, a truss-type aquaculture platform is a complex structural system mainly consisting of several components, including the truss, pillars, nets, and mooring system, with all cages employing a planar net configuration. Its main parameters are shown in Table 1. As illustrated in Figure 2, considering computational efficiency and engineering practicability, this study simplifies the three-dimensional model of the truss-type aquaculture platform such that only the underwater part of the pillar structure and the net system are retained, while the deformation of the net and pillar structure caused by the action of water currents is ignored.
Figure 1.
Three-dimensional model of the truss-type aquaculture platform.
Table 1.
Main parameters of the truss-type aquaculture platform.
Figure 2.
Simplified model of the truss-type aquaculture platform.
2.2. Mathematical Model
2.2.1. Control Equations
The objects of study in this research are all incompressible viscous fluids, for which the basic governing equations are the continuity equation, momentum conservation equation, and energy conservation equation. The continuity equation (mass conservation equation) and Navier–Stokes equation (momentum conservation equation) are expressed in Cartesian tensor notation as shown below.
2.2.2. Turbulence Model
The realizable k- model is a turbulence model with wider applicability. Due to the flow resistance effect of the net, there is a large pressure gradient before and after the net cage, meaning that the water movement near the net cage is more intense. The realizable k- model has a good effect on the simulation of this problem [13]; thus, in this paper we choose this model for numerical simulation.
k-equation:
-equation:
where k in the turbulence model represents the turbulent kinetic energy and is dissipation rate.
2.2.3. Porous Media Model
The porous media are modeled as a continuum containing a fluid and a fine solid structure. The pressure drop is approximated by introducing a source term into the momentum transfer equation, which is calculated from Forchheimer’s equation [25,26]:
where k in the porous media model is the permeability tensor.
Laminar flows through porous media are characterized by peristaltic flow, where the pressure drop is usually proportional to the velocity. Thus, Equation (5) is reduced to Darcy’s law, as follows:
The commercial CFD software STAR-CCM+ (17.04.007) introduces source terms into the momentum transport equations to approximate the pressure drop. The momentum equation incorporating is expressed as follows:
In STAR-CCM+ (17.04.007), denotes the momentum sink of the porous media that generates the pressure drop, which is determined by the velocity and porous resistance tensor, as follows:
Similarly, Zhao et al. [13] also used to denote the damping properties of the net, defined as follows:
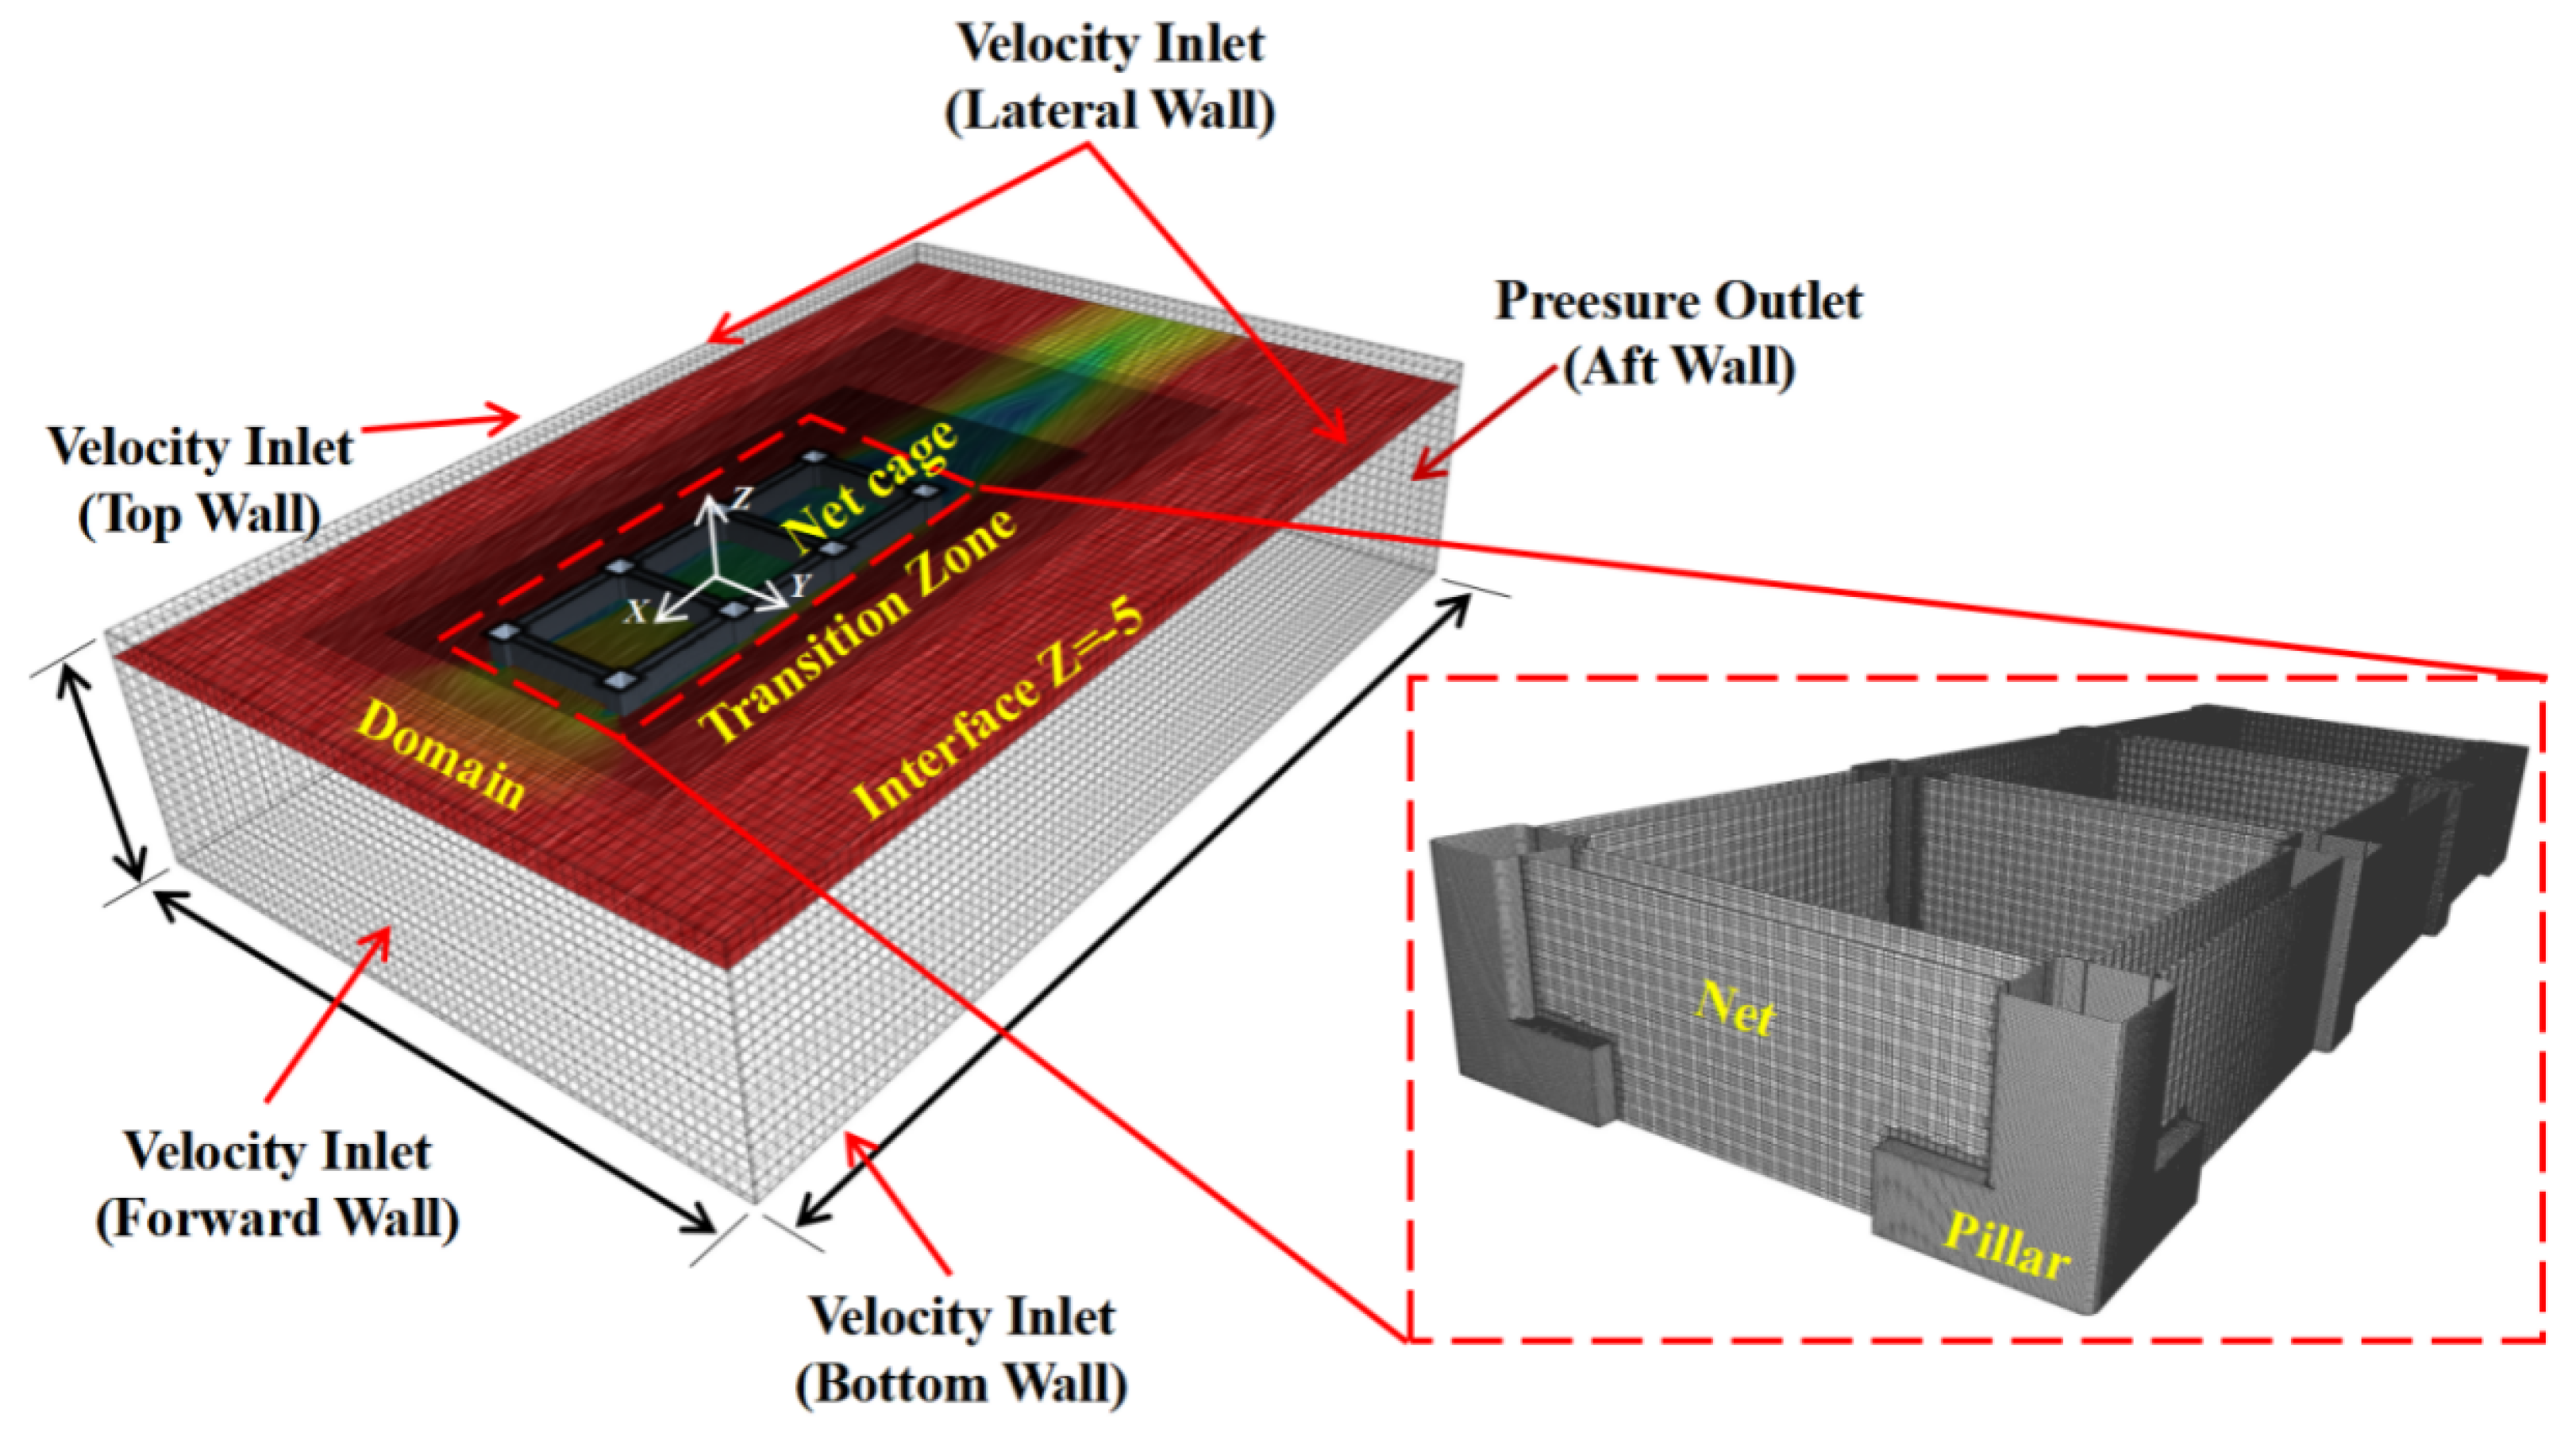
2.3. Boundary Conditions and Meshing
As shown in Figure 3, a full-scale model is used in this study. Based on the Cartesian coordinate system, the coordinate origin is set at the center projection of the truss-type aquaculture platform on the water surface. The X-axis negative direction is defined as the current direction, the Y-axis is perpendicular to the current direction, and the Z-axis is vertically upward. The inlet, the lateral wall, and the top and bottom of the computational domain are provided as velocity inlet conditions [27], while the outlet is provided as a pressure outlet condition. The porous media model is used to simulate the net, with the pillar structure defined as a full-wall surface. For the net, the porous media is configured to produce the same flow resistance effect as the actual net by setting reasonable , , and . In addition, the finite volume method is used in this study to discretize the governing equations in numerical calculations. The governing equations are solved using a pressure-based discrete solver, while the SIMPLE algorithm is chosen to achieve pressure–velocity coupling.
Figure 3.
Boundary conditions and meshing.
To ensure better mesh quality, the mesh division of the computational domain is performed using the trimmed cell mesher. The surface of the pillar structure is used to capture the boundary layer flow through prismatic layers. The total thickness of the prismatic layer is 0.068 m, the number of prismatic layers is 7, and the stretching ratio is 1.2. For the flow field near the net cage, a two-layer mesh transition zone is set up to ensure the accuracy of the calculation. The dimensions of the computational domain and the specific grid refinement methods are provided in Table 2.
Table 2.
Computational domain and grid refinement.
3. Model Validation and Convergence Analysis
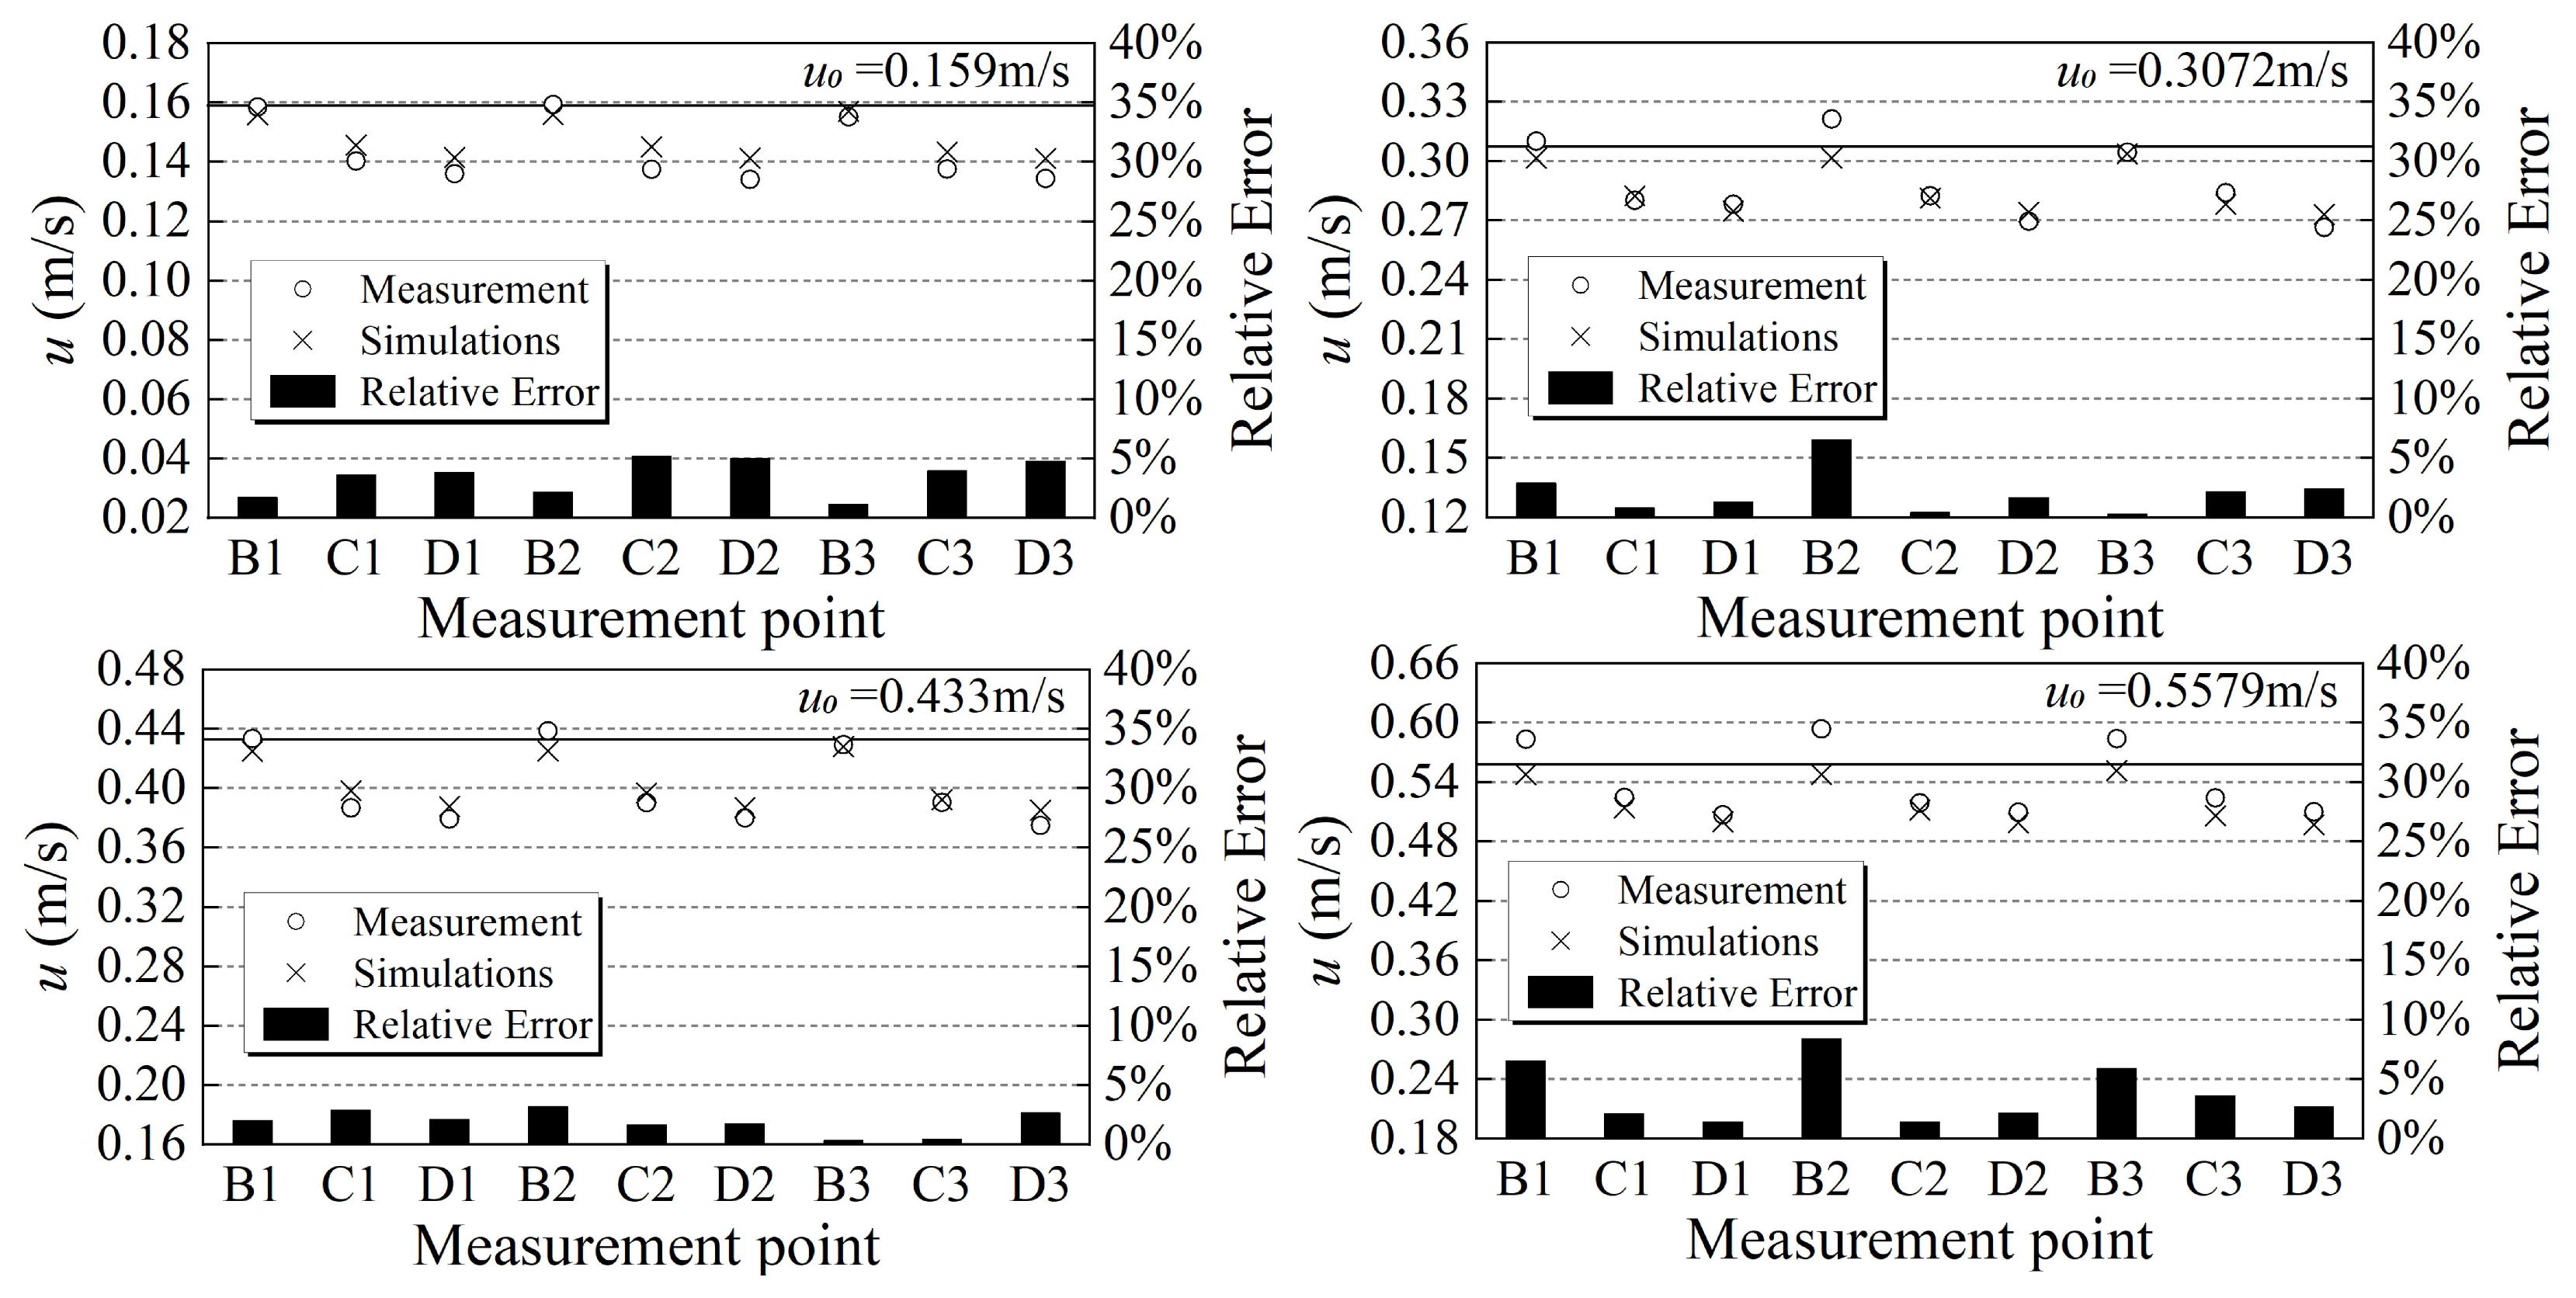
3.1. Model Validation
To verify the accuracy of the numerical method, this study simulates the working condition of a planar net perpendicular to the flow direction using the planar net model from Zhao et al. [13]. The numerical flume has a depth of 0.7 m and a width of 1.0 m. The planar net is simulated as a porous medium with a height of 0.4 m, a width of 1.0 m, and . In addition, and can be derived from Equations (10) and (11) based on and respectively, as shown experimentally by Zhao et al. [13]. Notably, Liu et al. [27] demonstrated that the product of the coefficient and the thickness of a porous medium should be constant, i.e., the coefficient is inversely proportional to the thickness. Figure 4 shows the arrangement of the conditions and the velocity distribution under . The location of the detection point and the physical modeling are consistent with Zhao et al. [13]. Figure 5 compares the simulation results of the flow velocity at the detection point with the experimental results from Zhao et al. [13]. The results indicate that the numerical method used in this study exhibits good agreement with the experimental data, verifying the reliability and accuracy of the numerical model in simulating problems related to porous media.
Figure 4.
Layout of measuring points (a: horizontal view; b: vertical view) and velocity distribution at m/s (c: horizontal view; d: vertical view).
Figure 5.
Flow velocity comparison.
3.2. Convergence Analysis
To ensure the stability of the simulation results, in this study we select the average value of at each point in the flow field as the basis for convergence judgment under the conditions of , = 0.2, and ; the arrangement of the monitoring points and monitoring planes is shown in Figure 6. Additionally, sensitivity analysis of porous media parameters by Patursson et al. [12] and others has demonstrated that the viscous term has a limited effect on the calculation error. Therefore, only the inertial resistance is considered in this study; based on the experiments of Patursson et al. [12], and are obtained for the net, with .
Figure 6.
Arrangement of monitoring points and monitoring planes.
To ensure the accuracy of the numerical simulation, the residual values of the continuity equation, turbulent kinetic energy k, and specific dissipation rate are all set to 0.001. The computation time is set to 900 s, which allows the numerical simulation to achieve the predetermined accuracy. The temporal discretization utilizes a first-order implicit unsteady scheme, with the time step determined to ensure a convective Courant number of less than 1.
As shown in Table 3, our study first conducted a convergence analysis for different numbers of grids at the same time step, followed by a convergence analysis for the time step based on the optimal grid scheme. Figure 7 demonstrates the comparison of at each point under three sets of grids and three time steps. Considering computational accuracy and efficiency along with the need to prevent excessively coarse grids and avoid large time steps that fail to capture critical hydrodynamic phenomena, for this study we selected million and as the total number of grids and time steps, respectively.
Table 3.
Case settings for different total meshes and time steps.
Figure 7.
Mesh convergence analysis and time step convergence analysis.
4. Results and Discussion
4.1. Characterization of the Flow Field in the Vicinity of the Aquaculture Platforms
A truss-type aquaculture platform is a system of multiple net cages consisting of pillars and nets, which together exhibit an extremely complex flow field structure due to intricate interactions. To study the characteristics of the flow field around the aquaculture platform, this study takes and as an example. The computational conditions are consistent with those in Section 3.2, and both flow pattern analysis and flow velocity distribution analysis are conducted.
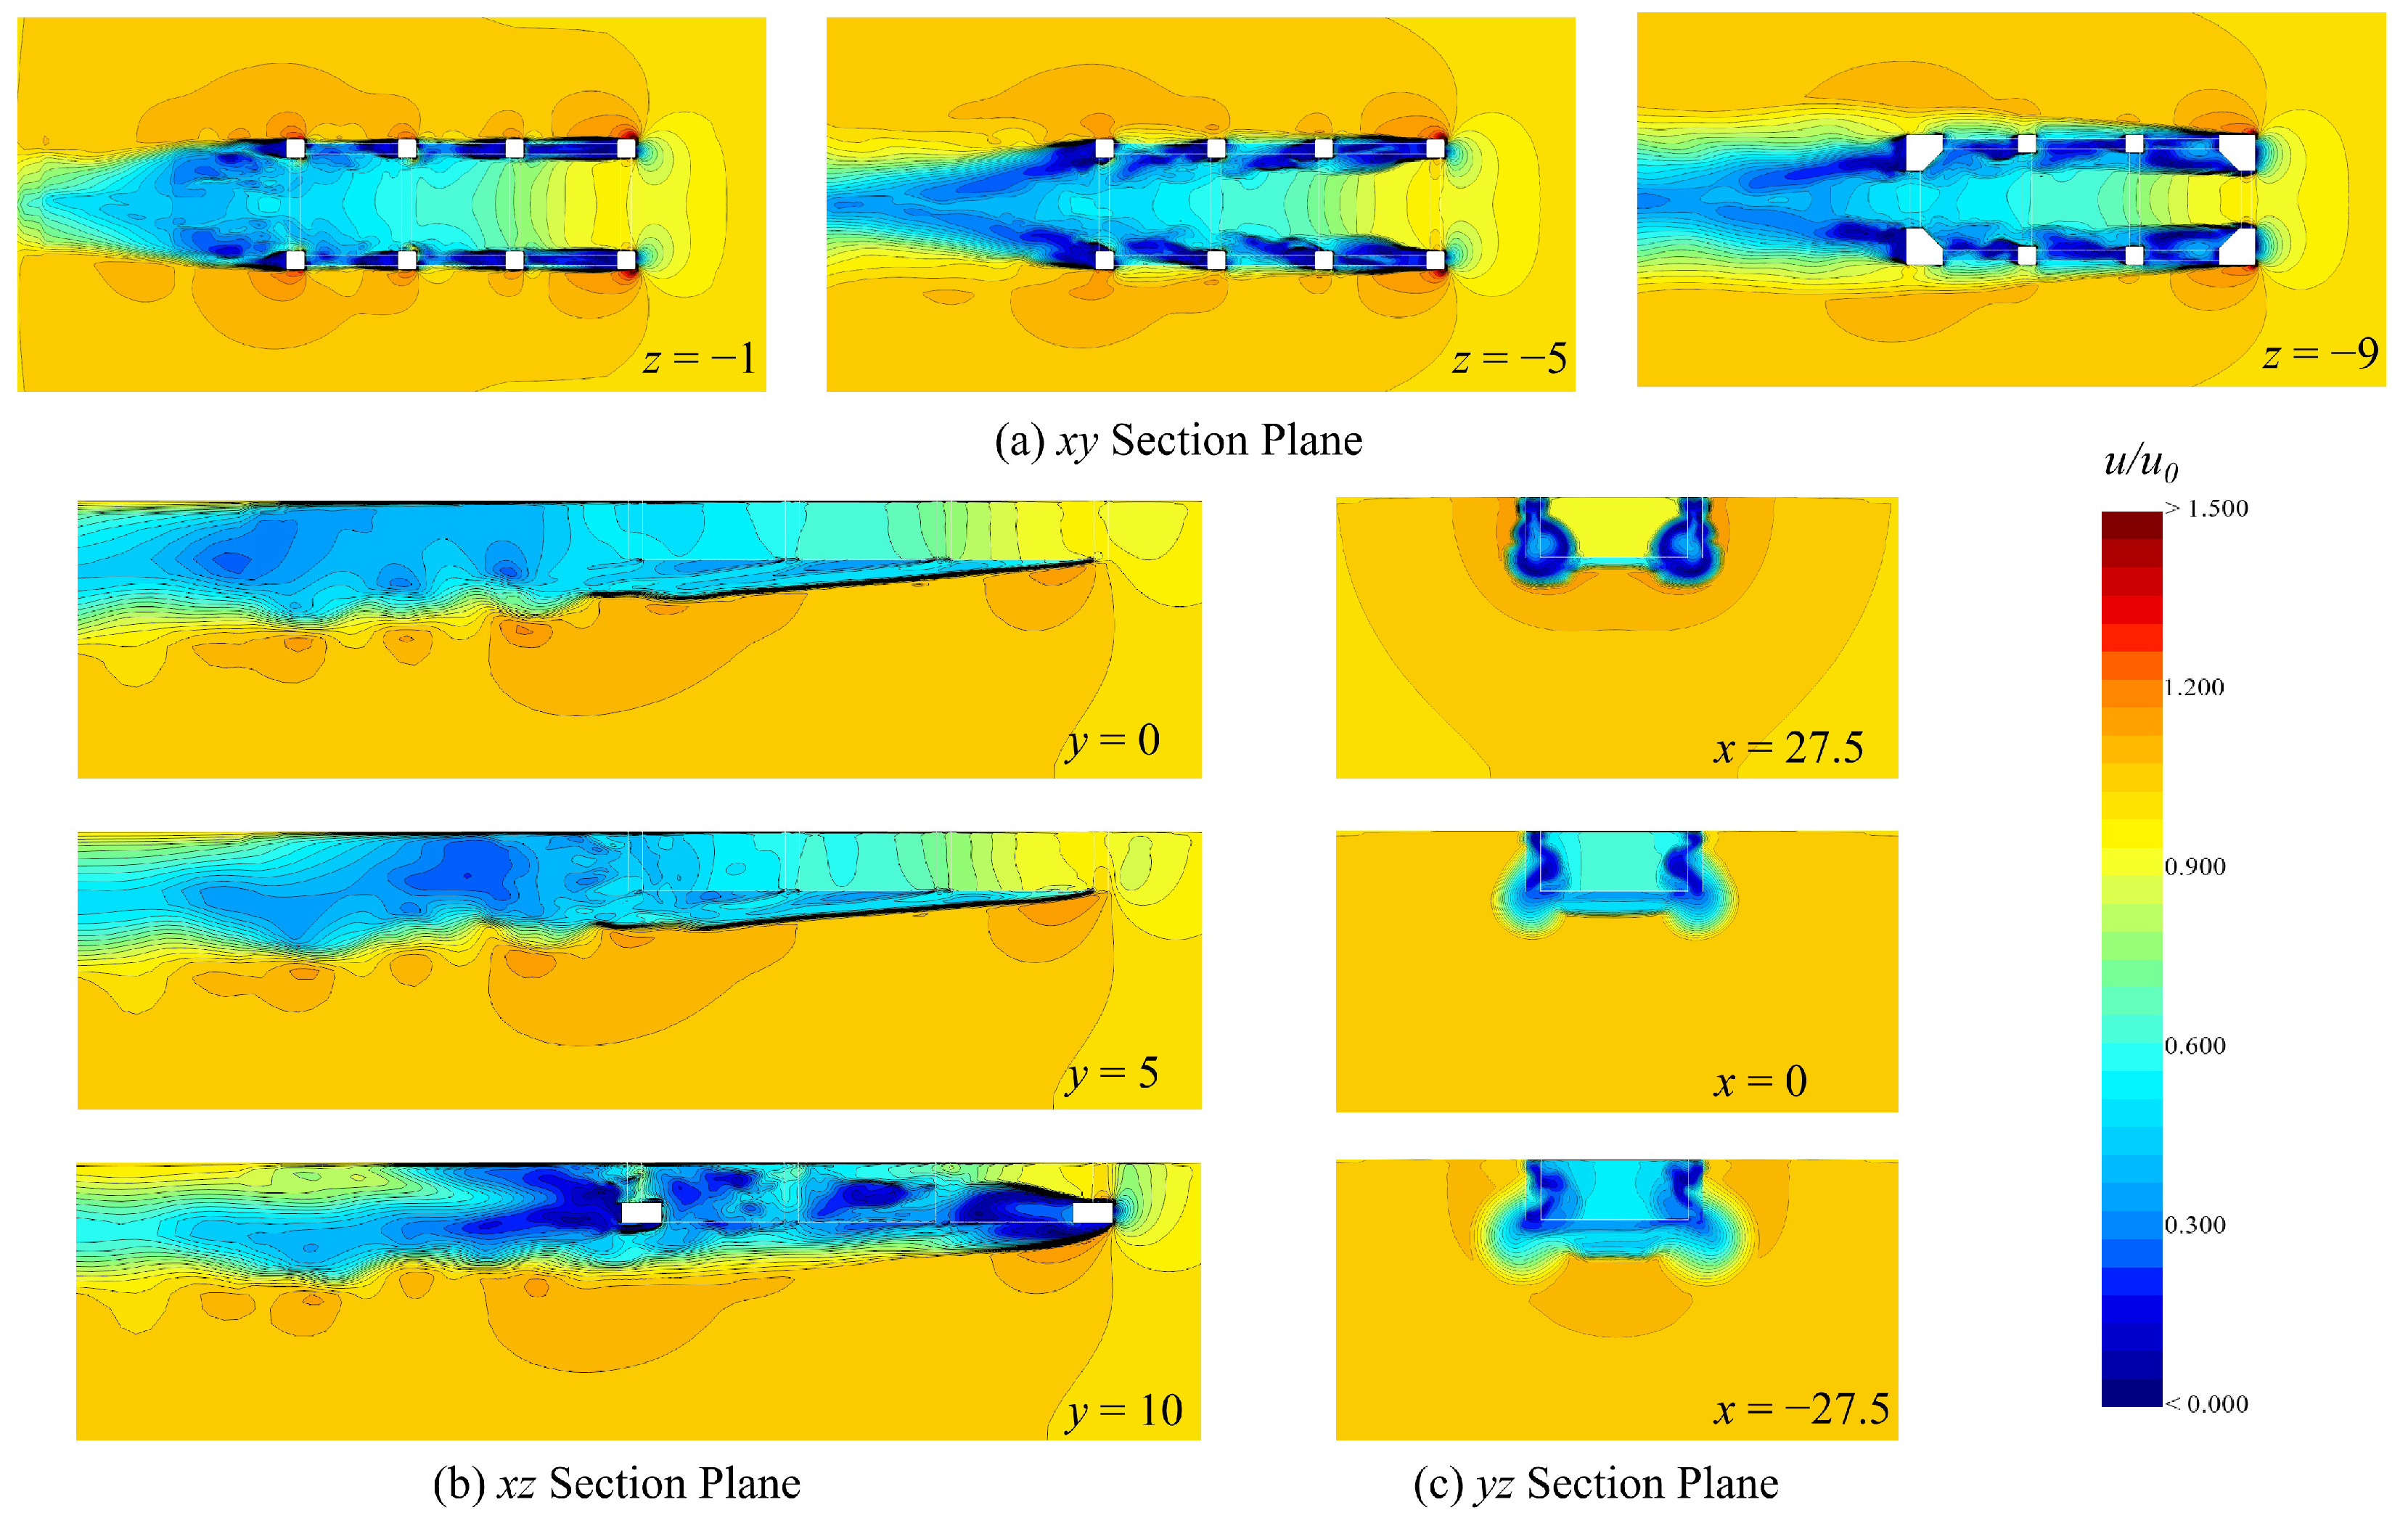
4.1.1. Analysis of Flow Patterns
Figure 8 illustrates the flow velocity contours inside and outside the aquaculture platform for different profiles. It can be observed that there are some common features among the different location profiles. The aquaculture platform has a significant resistance effect on the water flow, and generally exhibits a characteristic of decreasing first and then increasing. The water flow near the pillars is nearly stagnant, forming low-velocity vortex regions of varying sizes. This phenomenon is caused by the mutual conversion of kinetic energy and pressure energy when the viscous fluid passes through the impermeable wall. Additionally, the complex interactions between the pillars, net, and water flow result in a lack of fixed regularity in the flow field near the aquaculture platform.
Figure 8.
Flow velocity contours inside and outside the aquaculture platform at different profiles.
Figure 8a shows the flow velocity contours of the XY profiles at , , and , illustrating the flow characteristics at different water depth locations. It is evident that the flow velocity attenuation and disturbance regions vary at different water depths. The lower layer exhibits a wider zone of low-velocity vortices compared to the upper layer. This phenomenon arises from the structural complexity of the aquaculture platform, leading to distinct spatial variations in the flow field distribution. These observations are consistent with the findings of Liu et al. [21], Yang et al. [22], and Ji et al. [24].
Figure 8b illustrates the flow velocity contours of the XZ profiles at m, 5 m, and 10 m, illustrating the flow characteristics near and away from the pillars. Due to the presence of the pillars, the flow velocity distribution from the inside to the outside is influenced by different vortices. Near the longitudinal profile within the aquaculture platform, i.e., away from the pillars, the vortex zone is smaller and the flow velocity distribution is relatively stable. On the other hand, at the edges of the platform, i.e., near the pillars, the vortex area is wider and the flow velocity distribution is more chaotic. It can be observed that the flow field within the aquaculture platform is uniformly distributed along the direction at locations away from the pillars, which is further discussed in the data analysis in Section 4.1.2.
Figure 8c shows the YZ profiles at , , and , representing the state of the internal and external flow fields in the three cages before and after. The results indicate that the flow velocity inside the cage is relatively stable, but decreases layer by layer due to the accumulation of the drag effect along the length scale. This is consistent with the observations in Figure 8a,b. It should be noted that along the direction, the vortex zone inside the first cage () has the lowest flow velocity, the vortex zone inside the third cage () is the widest, and the situation in the middle cage () is relatively better. This suggests that the first cage provides good protection for the middle cage, while the vortex zone inside the third cage is relatively more disorganized due to the influence of the upstream vortex zone.
The flow field near the aquaculture platform is highly complex due to the presence of vortices. To observe the global flow field characteristics more intuitively, the Q-criterion isosurface () is used in this study to illustrate the three-dimensional vortex structure in the vicinity of the aquaculture platform, as shown in Figure 9. It can be observed that along the direction, the vortex region induced by the first pillar structure exhibits a broader lateral scale accompanied by significant energy dissipation of the flow. This phenomenon substantially reduces the downstream flow velocity, resulting in diminished velocity gradients around the second pillar structure. Consequently, this generates only localized vortex regions, while the combined influence of pressure near the third and fourth pillar structures and the flow resistance of the multi-layer net results in the vortex zone shrinking toward the inner part of the net cage. Under the combined effects of the residual vortex shedding from the pillar structures, the cumulative effect of multiple cages, and the drag effect of the net, the inside the first cage is highest near the center and lower at the edges. In contrast, the inside the third cage is lower and the flow field disturbance is the most complex. The middle cage, shielded by the front and rear nets, exhibits flow field conditions that are significantly more favorable for fish movement. These phenomena are also illustrated in Figure 8 and are further discussed in the data analysis in Section 4.1.2.
Figure 9.
Three-dimensional vortex structure by Q-criterion isosurfaces.
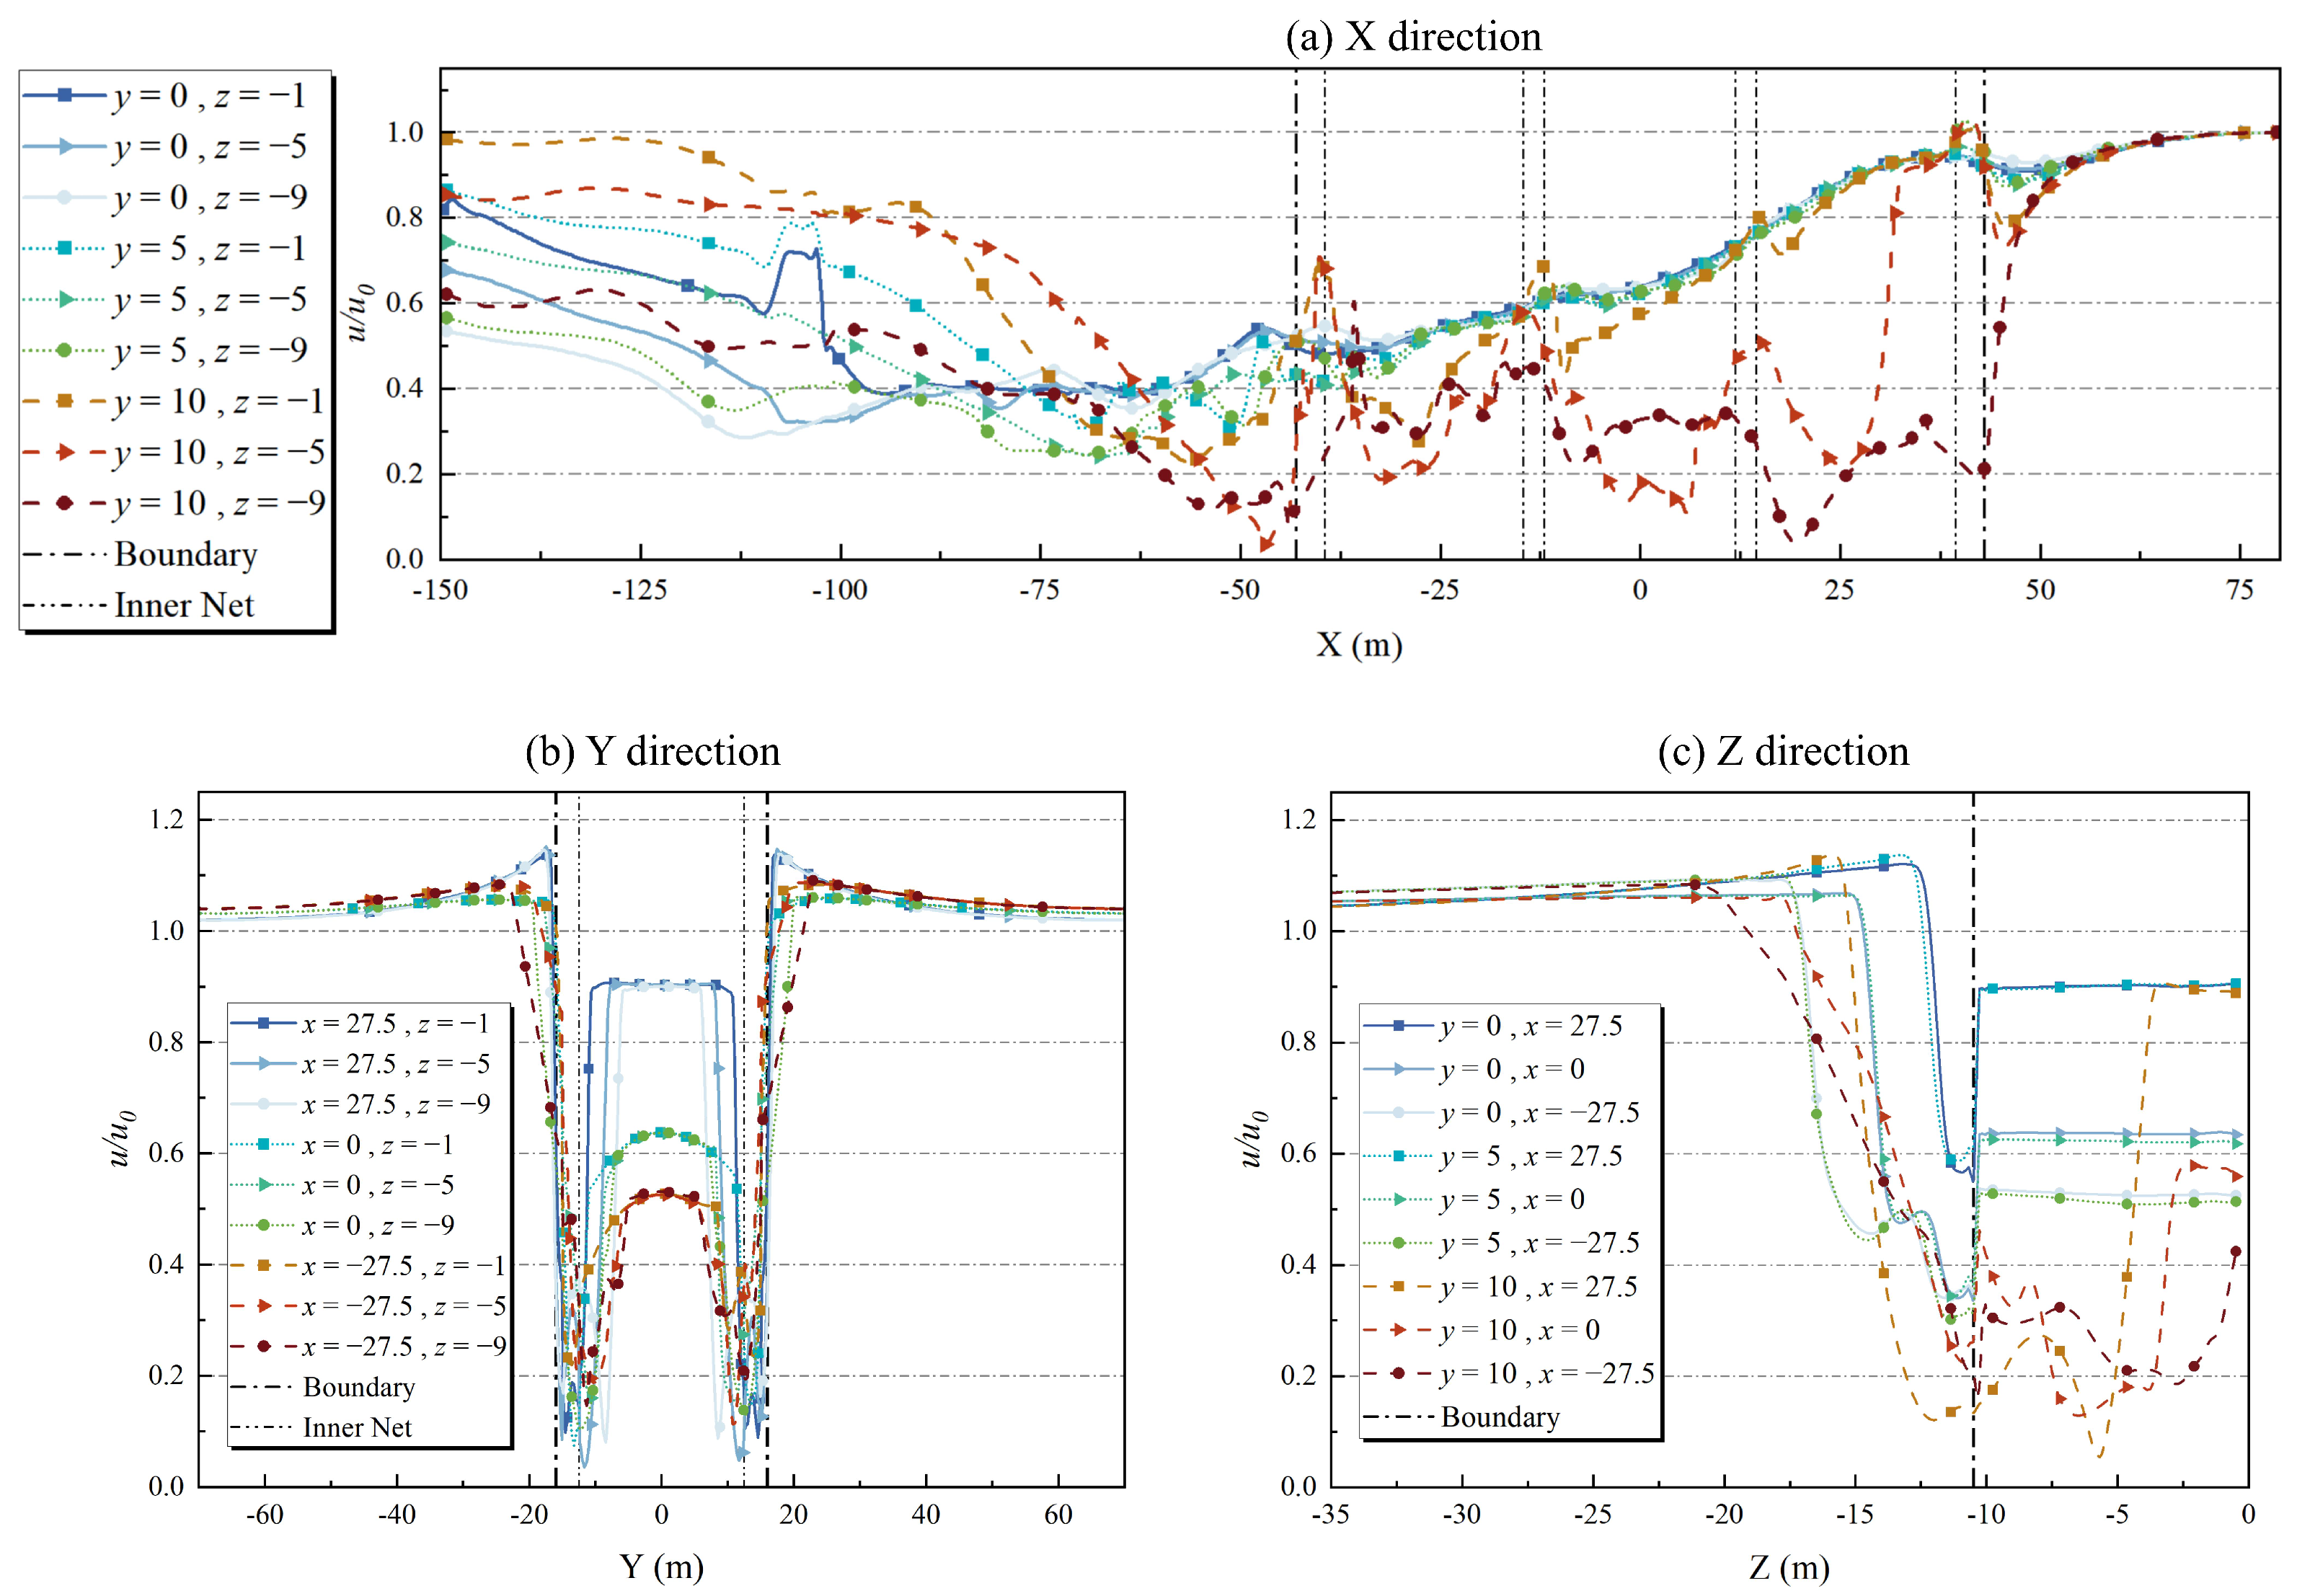
4.1.2. Velocity Distribution Analysis
Figure 10 shows the for different profile lines, providing a data-driven basis for interpreting the flow pattern analysis in the previous section.
Figure 10.
The for different profile lines.
Figure 10a demonstrates the variation of in the X-direction. Inside the aquaculture platform, the near the pillar side () decreases more significantly and fluctuates sharply, while the away from the pillar side () shows a smooth decreasing trend. All values near the pillar side are lower than those away from the side, a phenomenon caused by the different distribution of vortices. Taking the profile lines , , and , the from the entry to the exit of the aquaculture platform () is cumulatively attenuated by , , and , respectively, demonstrating the significant effect of the pillar vortices on . In contrast, the height factor has less impact on , especially on the side away from the pillar, where the values for profile lines at different heights exhibit high consistency. Taking the profile lines with , , and , the is cumulatively attenuated by , , and , respectively, showing very little difference. Near the pillar side, however, the curve fluctuations at different heights exhibit obvious differences, indicating that the vortices amplify the effect of the height factor on . At the rear of the aquaculture platform, the recovers significantly after the water flow exits the platform, with faster recovery near the pillar side. Observing the profile lines with , and , it can be seen that the final values recover to , , and , respectively. This is due to the conversion of pressure energy to kinetic energy outside the aquaculture platform and the greater pressure difference at locations with vortices. An interesting phenomenon is that the decreases and then increases in front of the first net layer of the aquaculture platform. The underlying principle involves mutual energy conversion: upstream of the net, decreases due to the obstruction effect of the net and the water surface slightly elevates. During this process, part of the kinetic energy converts to potential energy. Subsequently, as water flows from the elevated surface toward the net, potential energy converts back to kinetic energy, again causing an increase in . This is consistent with part of the study by Yang et al. [22], who referred to this phenomenon as a “hydraulic jump”.
Figure 10b demonstrates the variation of in the Y-direction. It can be observed that the figure exhibits a clear symmetrical pattern in which gradually increases as it approaches the aquaculture platform, decreases sharply after passing through the net, and then gradually increases and stabilizes inside each cage. Similar to Figure 10a, it can also be noted that the curves of at different heights are nearly overlapping, indicating that the height factor has a negligible effect on . Taking a fixed height m at the center of the three cages ( m, 0 m, and m), the values are , , and , respectively. This shows that is continuously attenuated under the influence of the multi-layer net, but that the attenuation effect gradually weakens due to the reduction in . Additionally, due to the interaction of the double-layer nets, a sudden increase in occurs between the nets, similar to a squeezing effect. This is similar to the mechanism of the “hydraulic jump” phenomenon mentioned earlier. It should be noted that the flow field is not completely symmetric due to the presence of vortices and that the fluctuations in on both sides are not identical near the net and the pillar.
Figure 10c shows the variation of in the Z-direction. As can be seen from the figure, the bottom net divides the curves into two distinct forms inside and outside the net. Except for the positions near the pillars, which are still influenced by vortices, the inside the net is significantly more stable compared to that outside the net. This indicates that a certain low-velocity vortex region exists outside the net due to the effect of the bottom net, but that the vortices at the bottom do not significantly affect the interior of the net. Taking the central axis of the aquaculture platform ( m) and the interior of the middle cage ( m) as an example, the maximum and minimum values of with height are 63.84% and 63.41%, respectively, showing a very small difference. The situation inside the other cages is similar, reflecting the result that the flow field inside the aquaculture platform exhibits stable in the vertical direction at fixed locations and is uniformly distributed along direction. This is consistent with the discussion in Section 4.1.1.
From the perspective of aquaculture, this configuration of the aquaculture platform exhibits distinct flow velocity distribution characteristics: the first cage maintains a relatively higher , the middle cage sustains moderate flow conditions, and the third cage experiences significantly slower . Leveraging these characteristics, precision-classified aquaculture operations can be implemented based on species-specific optimal flow velocity requirements. For example, Salmo salar thrive in moderate flow velocity environments, which enhance their growth and physiological performance [28], whereas Micropterus salmoides demonstrate accelerated growth rates under high flow velocity conditions [29].
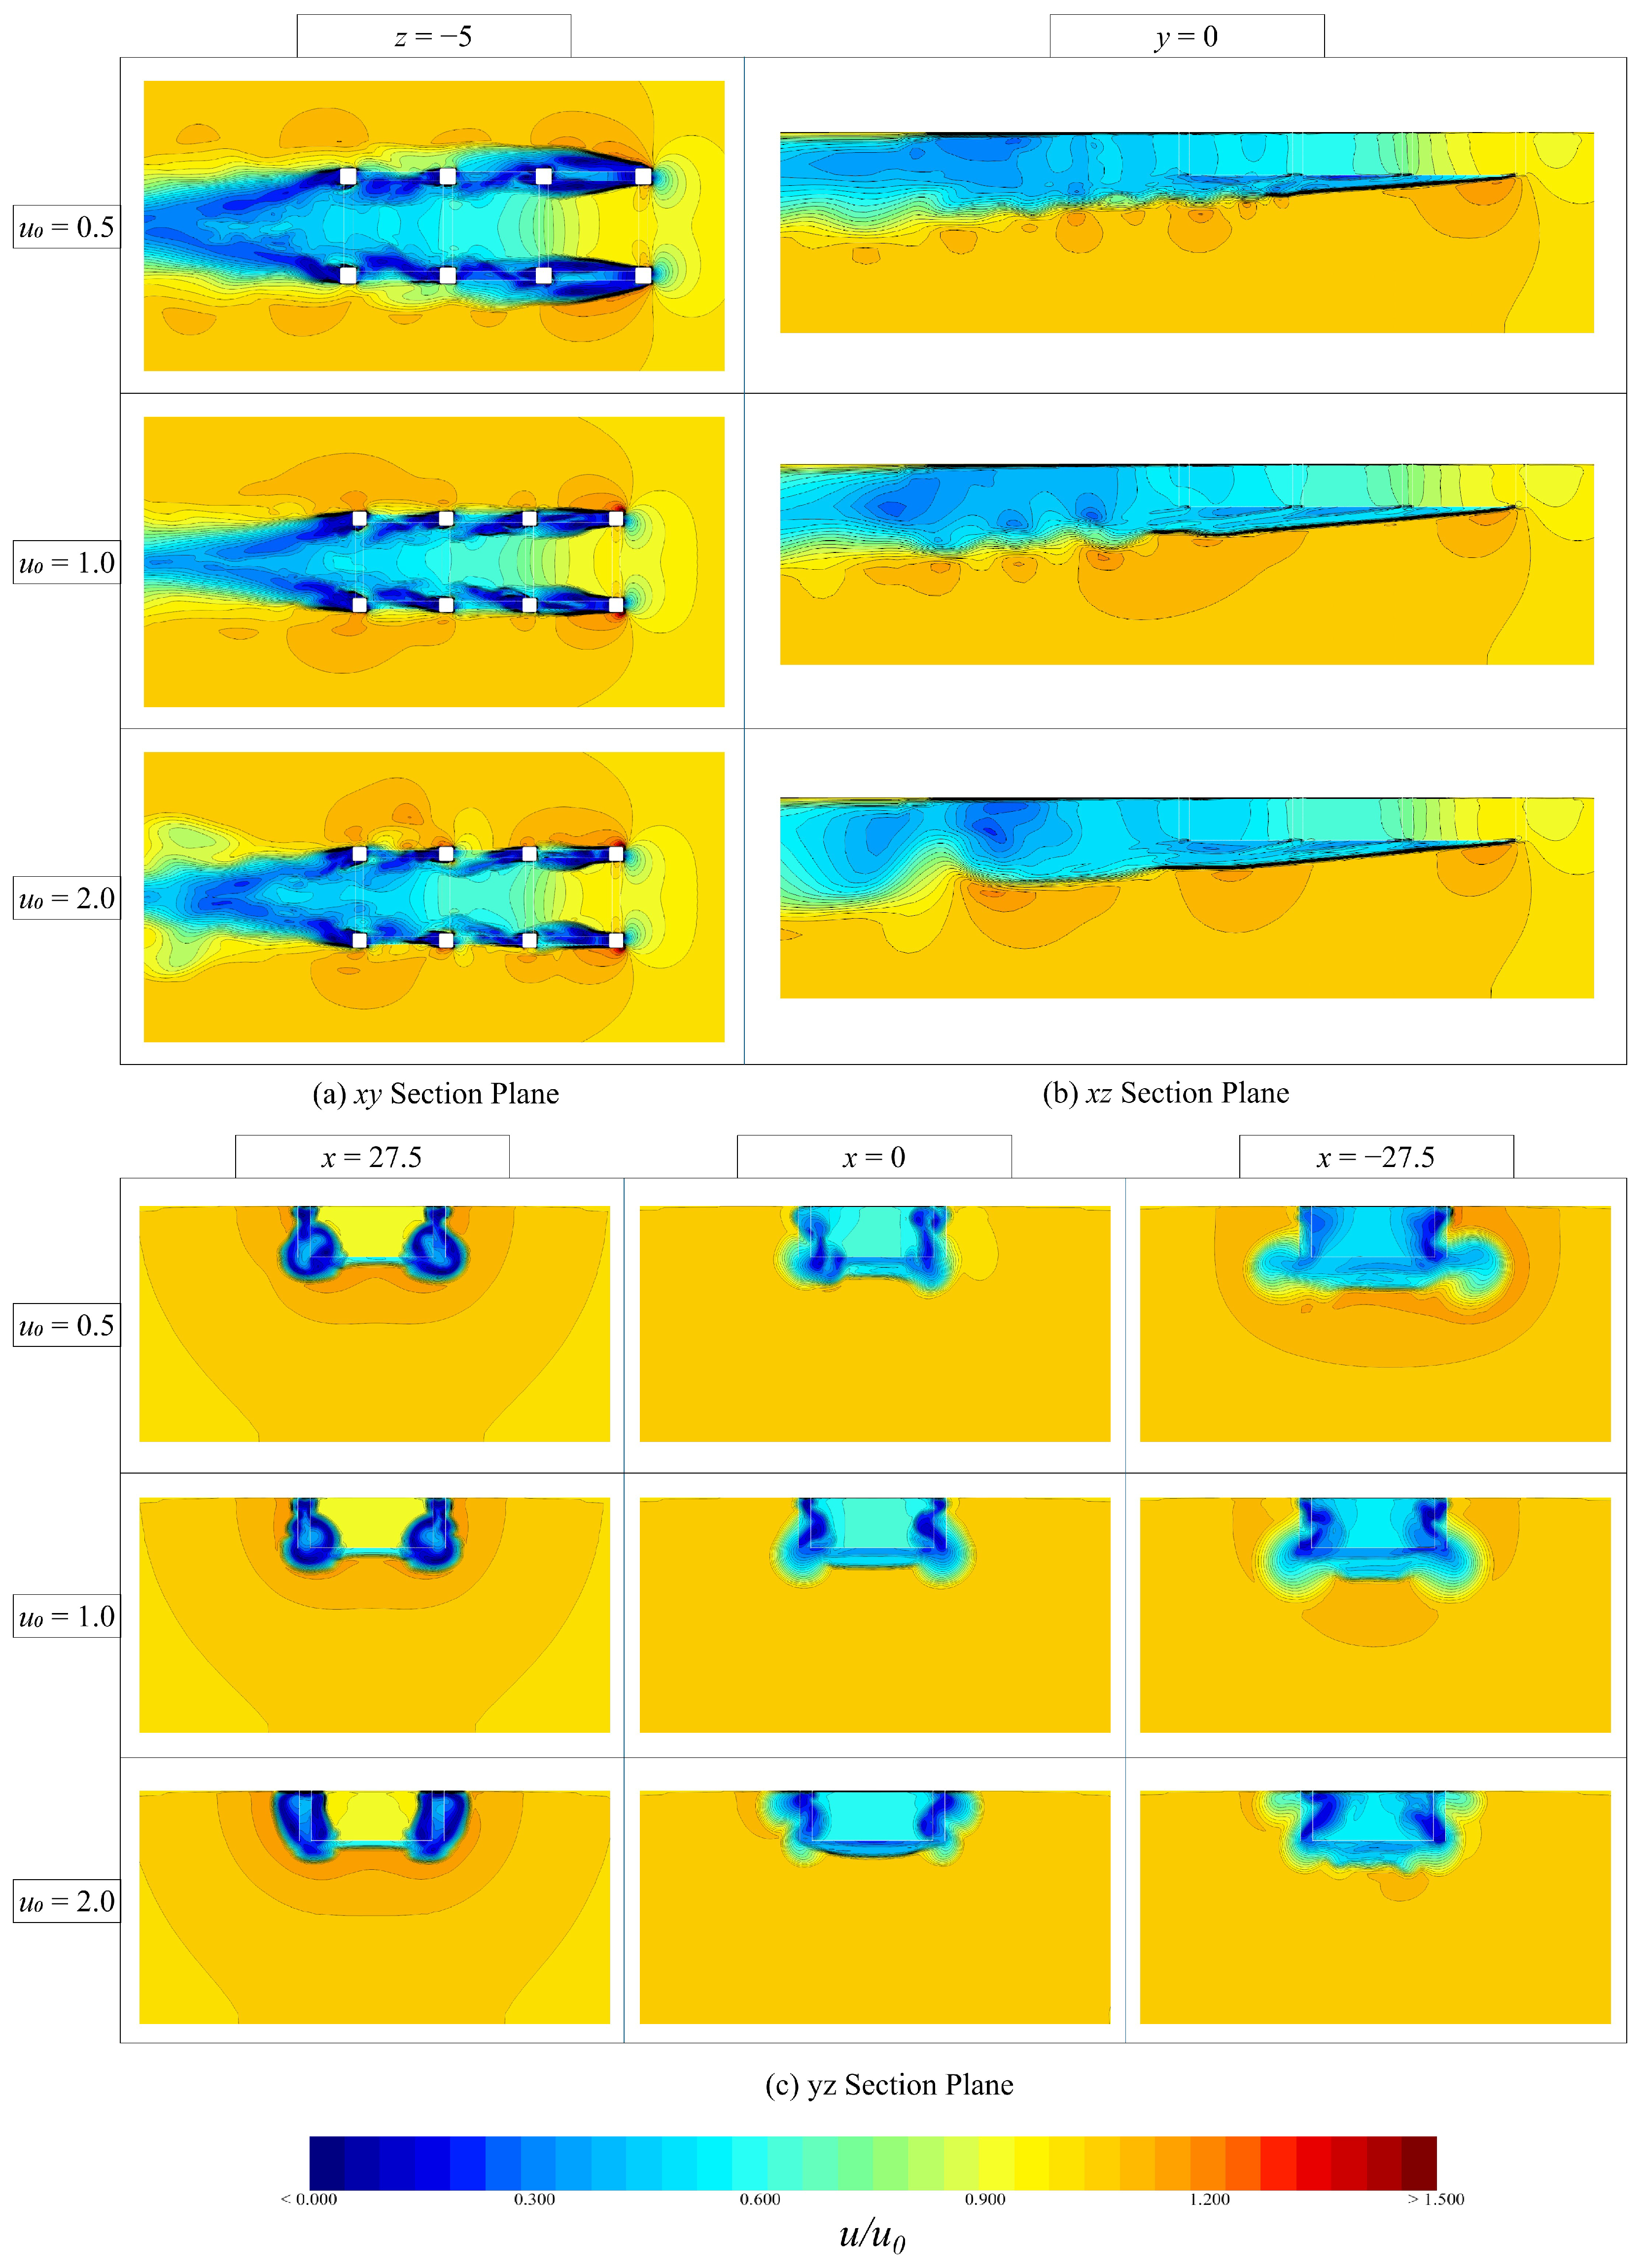
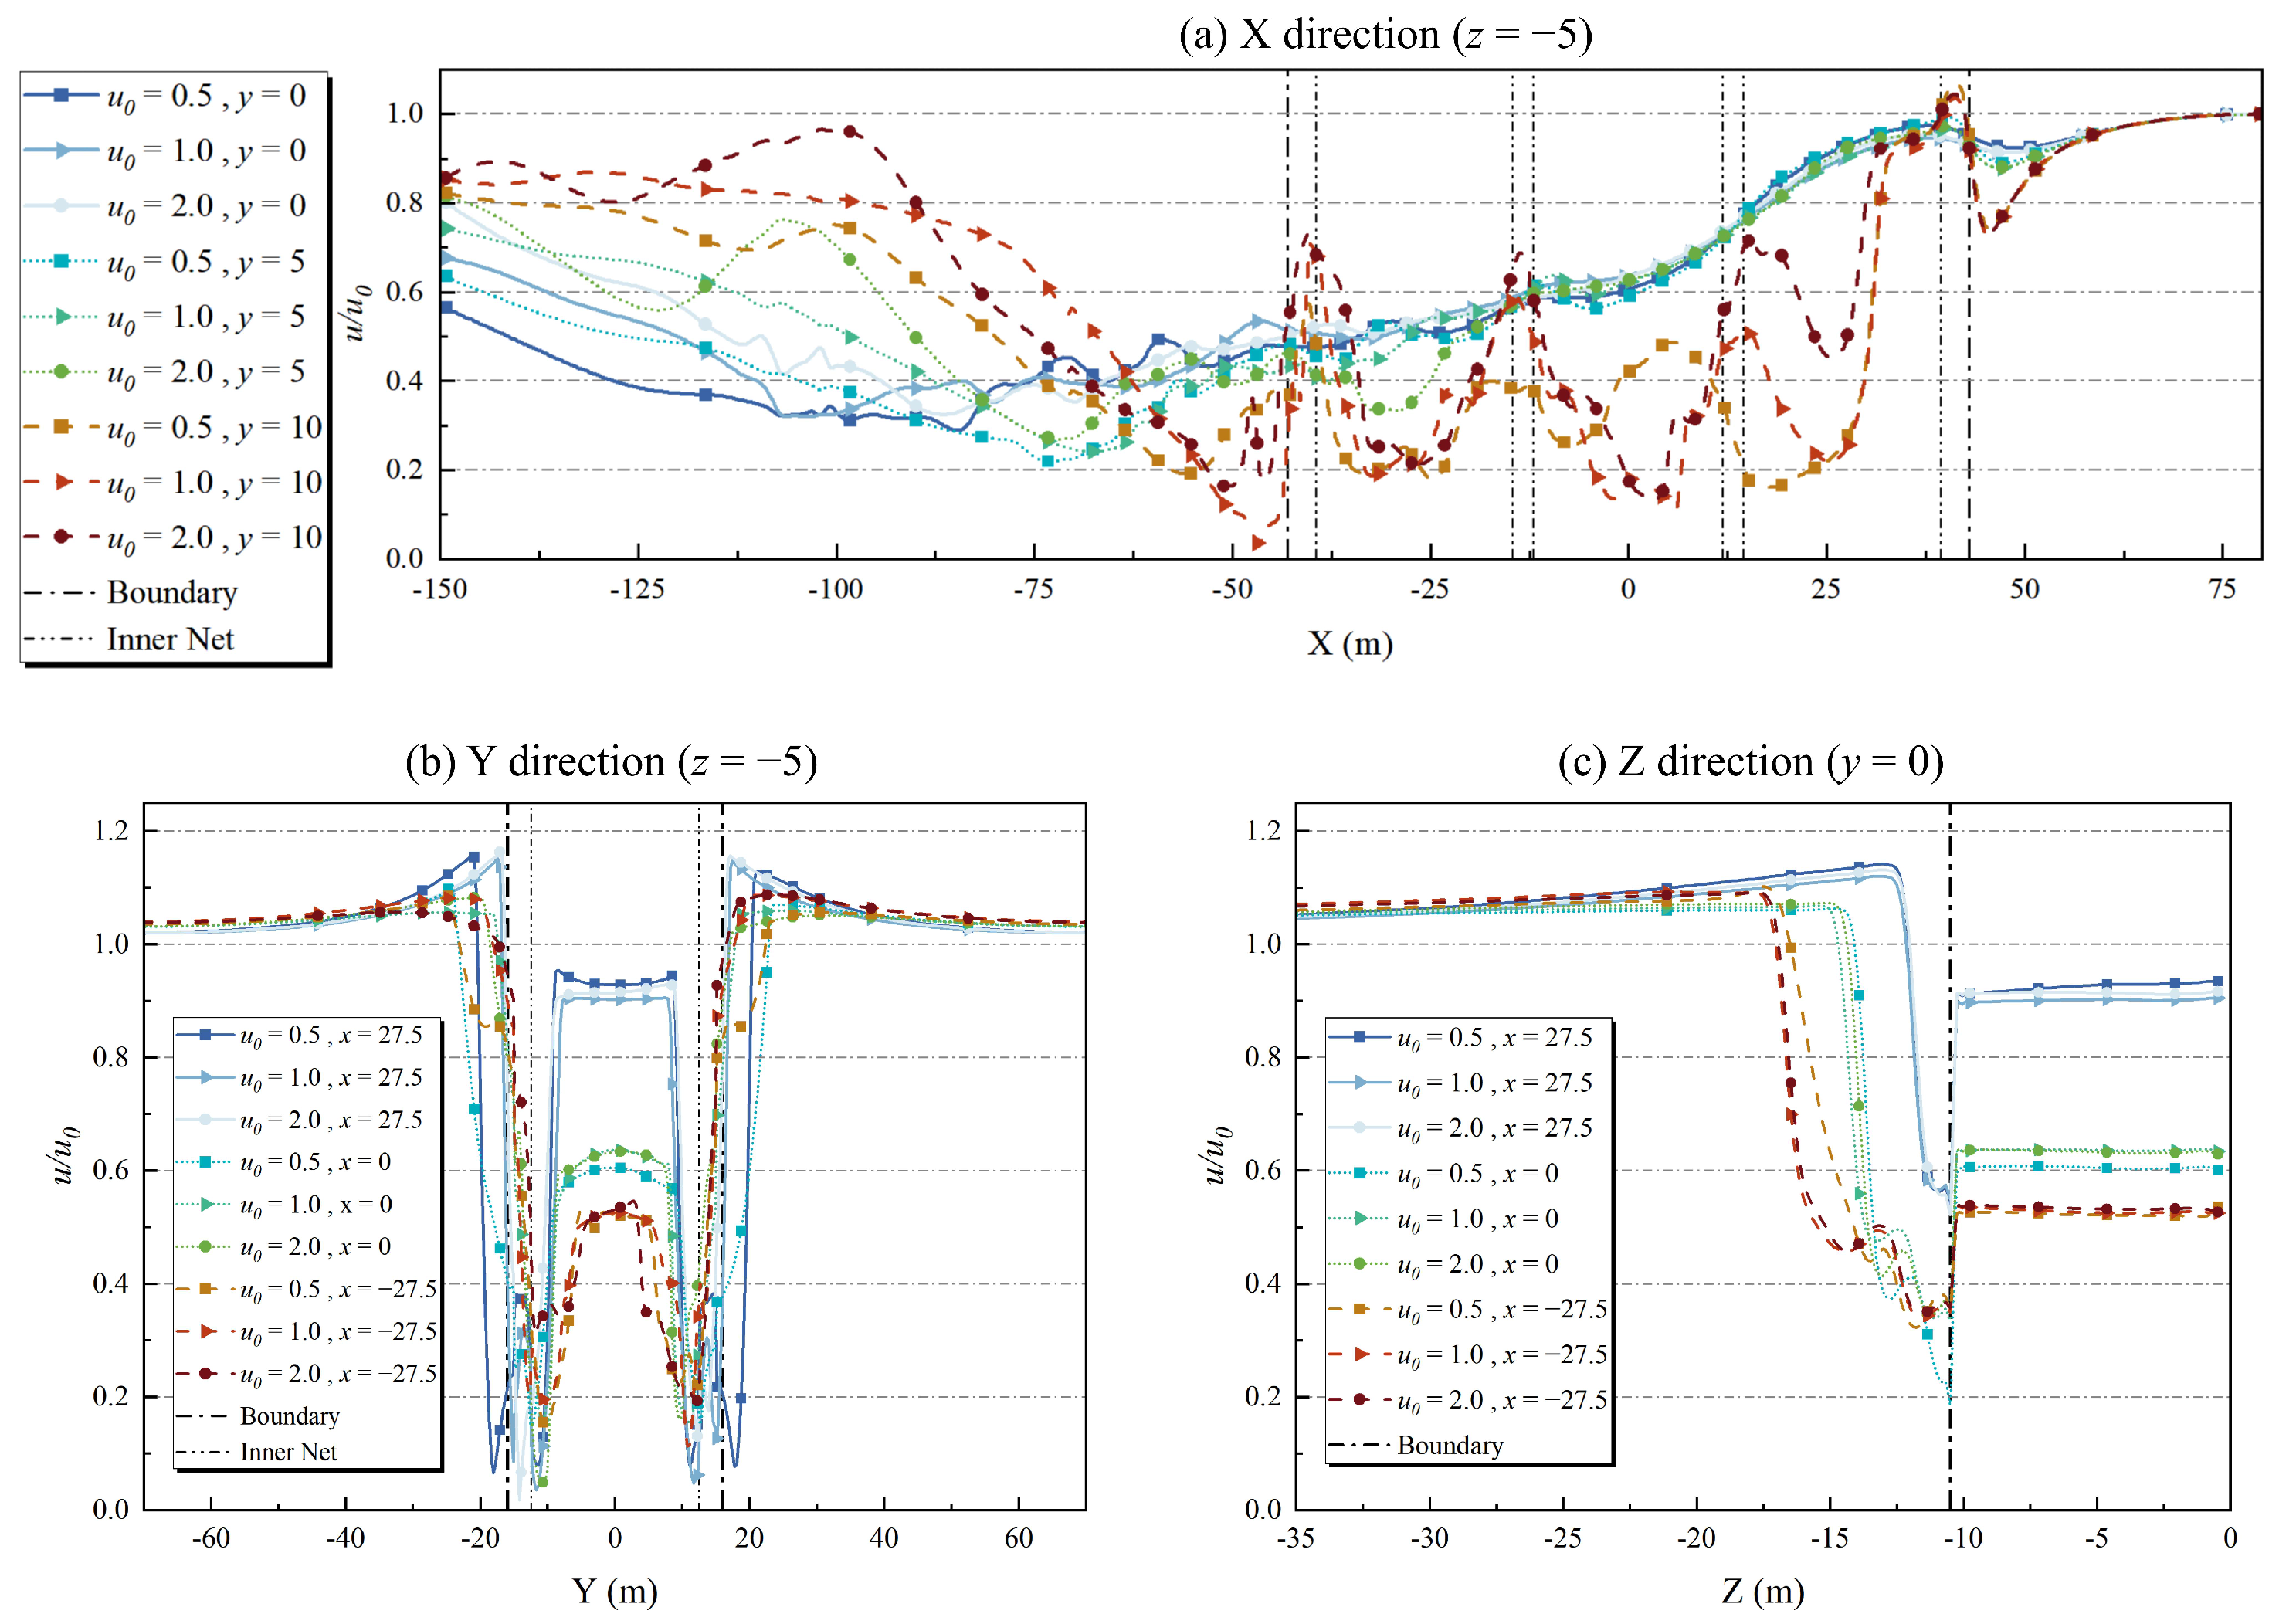
4.2. Effects of Different Incoming Flow Velocity
Appropriate flow velocity helps to promote the exchange of water inside and outside the net cage, thereby optimizing the survival environment of cultured fish. The calculation conditions in this section are consistent with those in Section 4.1, with the variable set to 0.5 m/s, 1.0 m/s, and 2.0 m/s, respectively.
Figure 11 illustrates the profile-specific flow velocity contours of the aquaculture platform for different . As shown in Figure 11a, as decreases, the vortex zone near the first pillar expands, which provides a more significant shielding effect on the downstream cage, resulting in a relatively lower level of flow field chaos in the downstream cage. This is because fluid with high kinetic energy accelerates the vortex shedding frequency, leading to concentrated energy loss, while the pressure difference caused by variation also affects the extent of the low-velocity vortex region. As shown in Figure 11b,c, the influence of on the flow at the center of the aquaculture platform is minimal and can be neglected. The flow field still maintains the characteristics of a small vortex zone and a uniform stable flow velocity distribution. It can be observed that the vortex zone near the pillar is significantly affected by , while this factor has less influence on flow velocity attenuation effect of the net. Therefore, if necessary, deflector plates can be installed behind the pillars or the pillar shape can be optimized to reduce flow velocity fluctuations and make the flow velocity distribution around the platform more stable.
Figure 11.
Contours of flow velocity in specific profiles of the aquaculture platform for different .
Figure 12 demonstrates for specific profile lines under different . As shown in Figure 12a, the locations near the pillar side () and inside the first cage () were selected. The values for and exhibit a decreasing trend followed by an increase, with attenuations of 48.36% and 29.95%, respectively. In contrast, for displays a linear decreasing trend with an attenuation of 77.95%. As shown in Figure 12b, the curves are more stable within each cage and the range of the curve stabilization stage gradually decreases along direction. Taking as an example, the values at the center profile lines of the three cages are 17.60 m, 16.00 m, and 7.68 m, respectively, along the direction. Figure 12c reveals that has minimal influence on the bottom net. Specifically, at the bottom net location of the first cage ( m, m), the values for m/s, m/s, and m/s are , , and , respectively. Subsequently, shows an upward trend after moving away from the bottom grid. Figure 13 shows the at the centers of the cages under different . Taking the center of the middle cage ( m) as an example, the corresponding to , , and are , , and , respectively, with a maximum difference of . Clearly, the above data reflect the phenomenon described in Section 4.1.1, further indicating that has a limited influence on the internal flow velocity of the aquaculture platform.
Figure 12.
The for specific profile lines under different .
Figure 13.
The at the centers of the cages under .
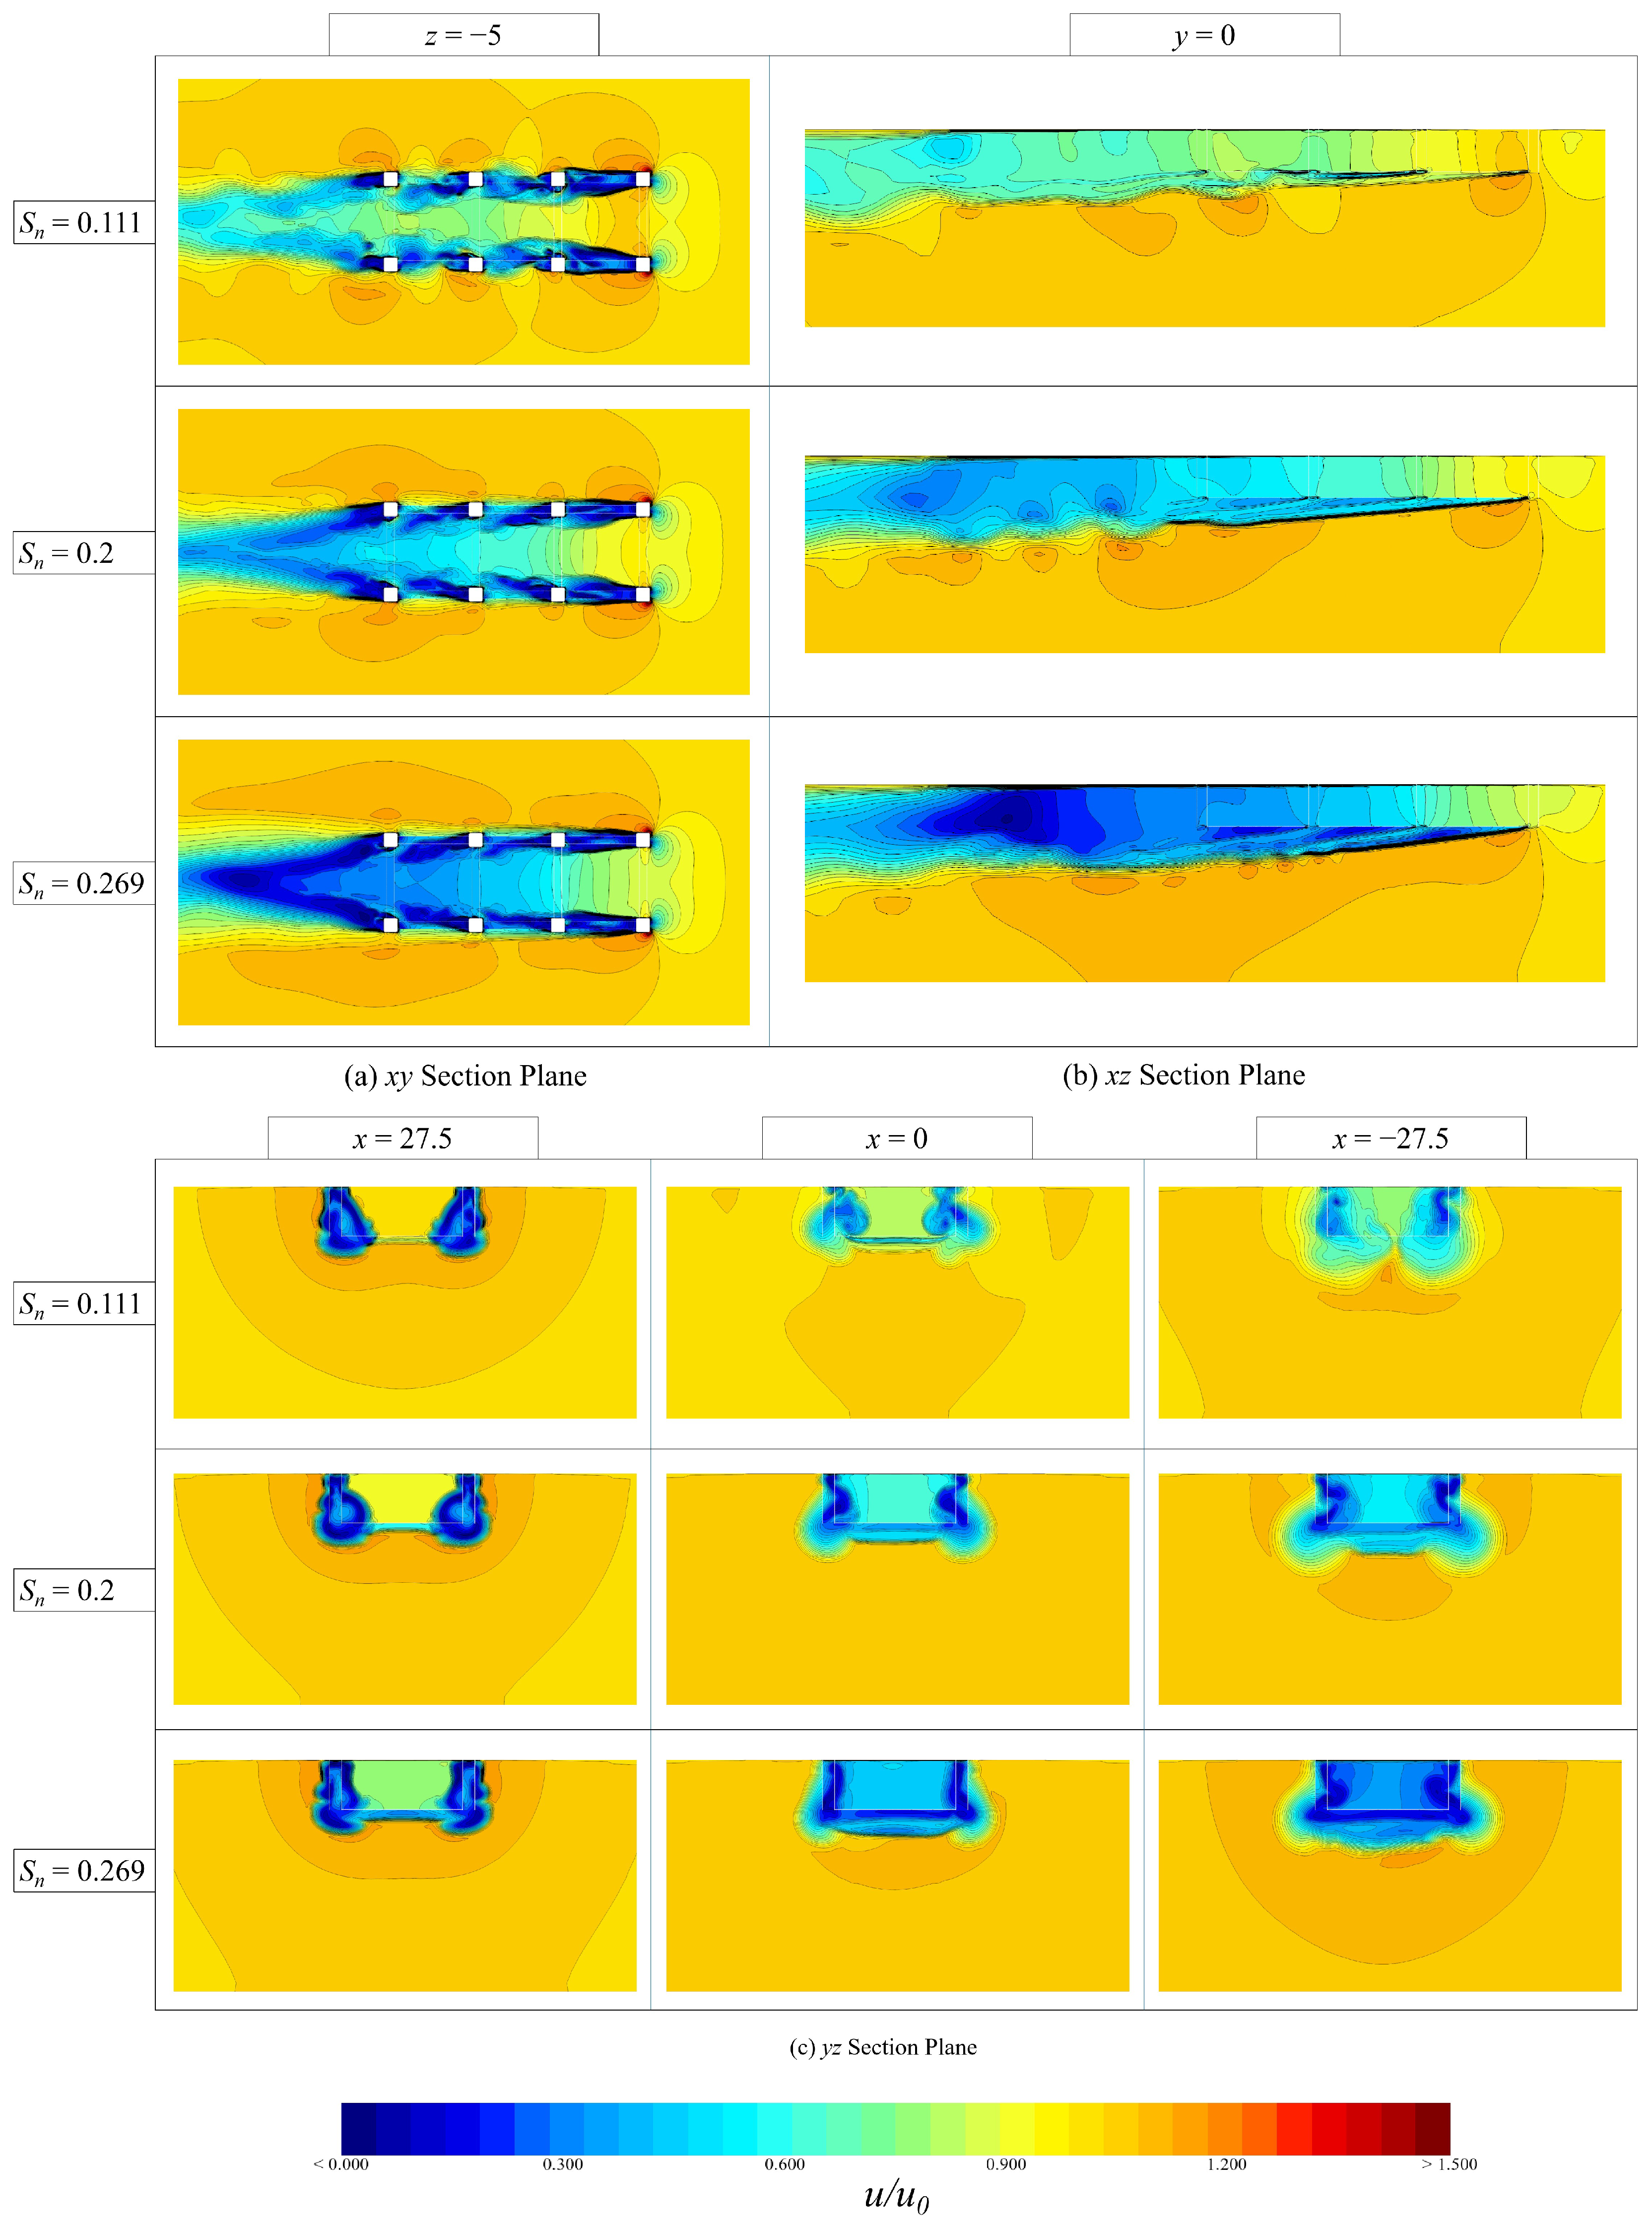
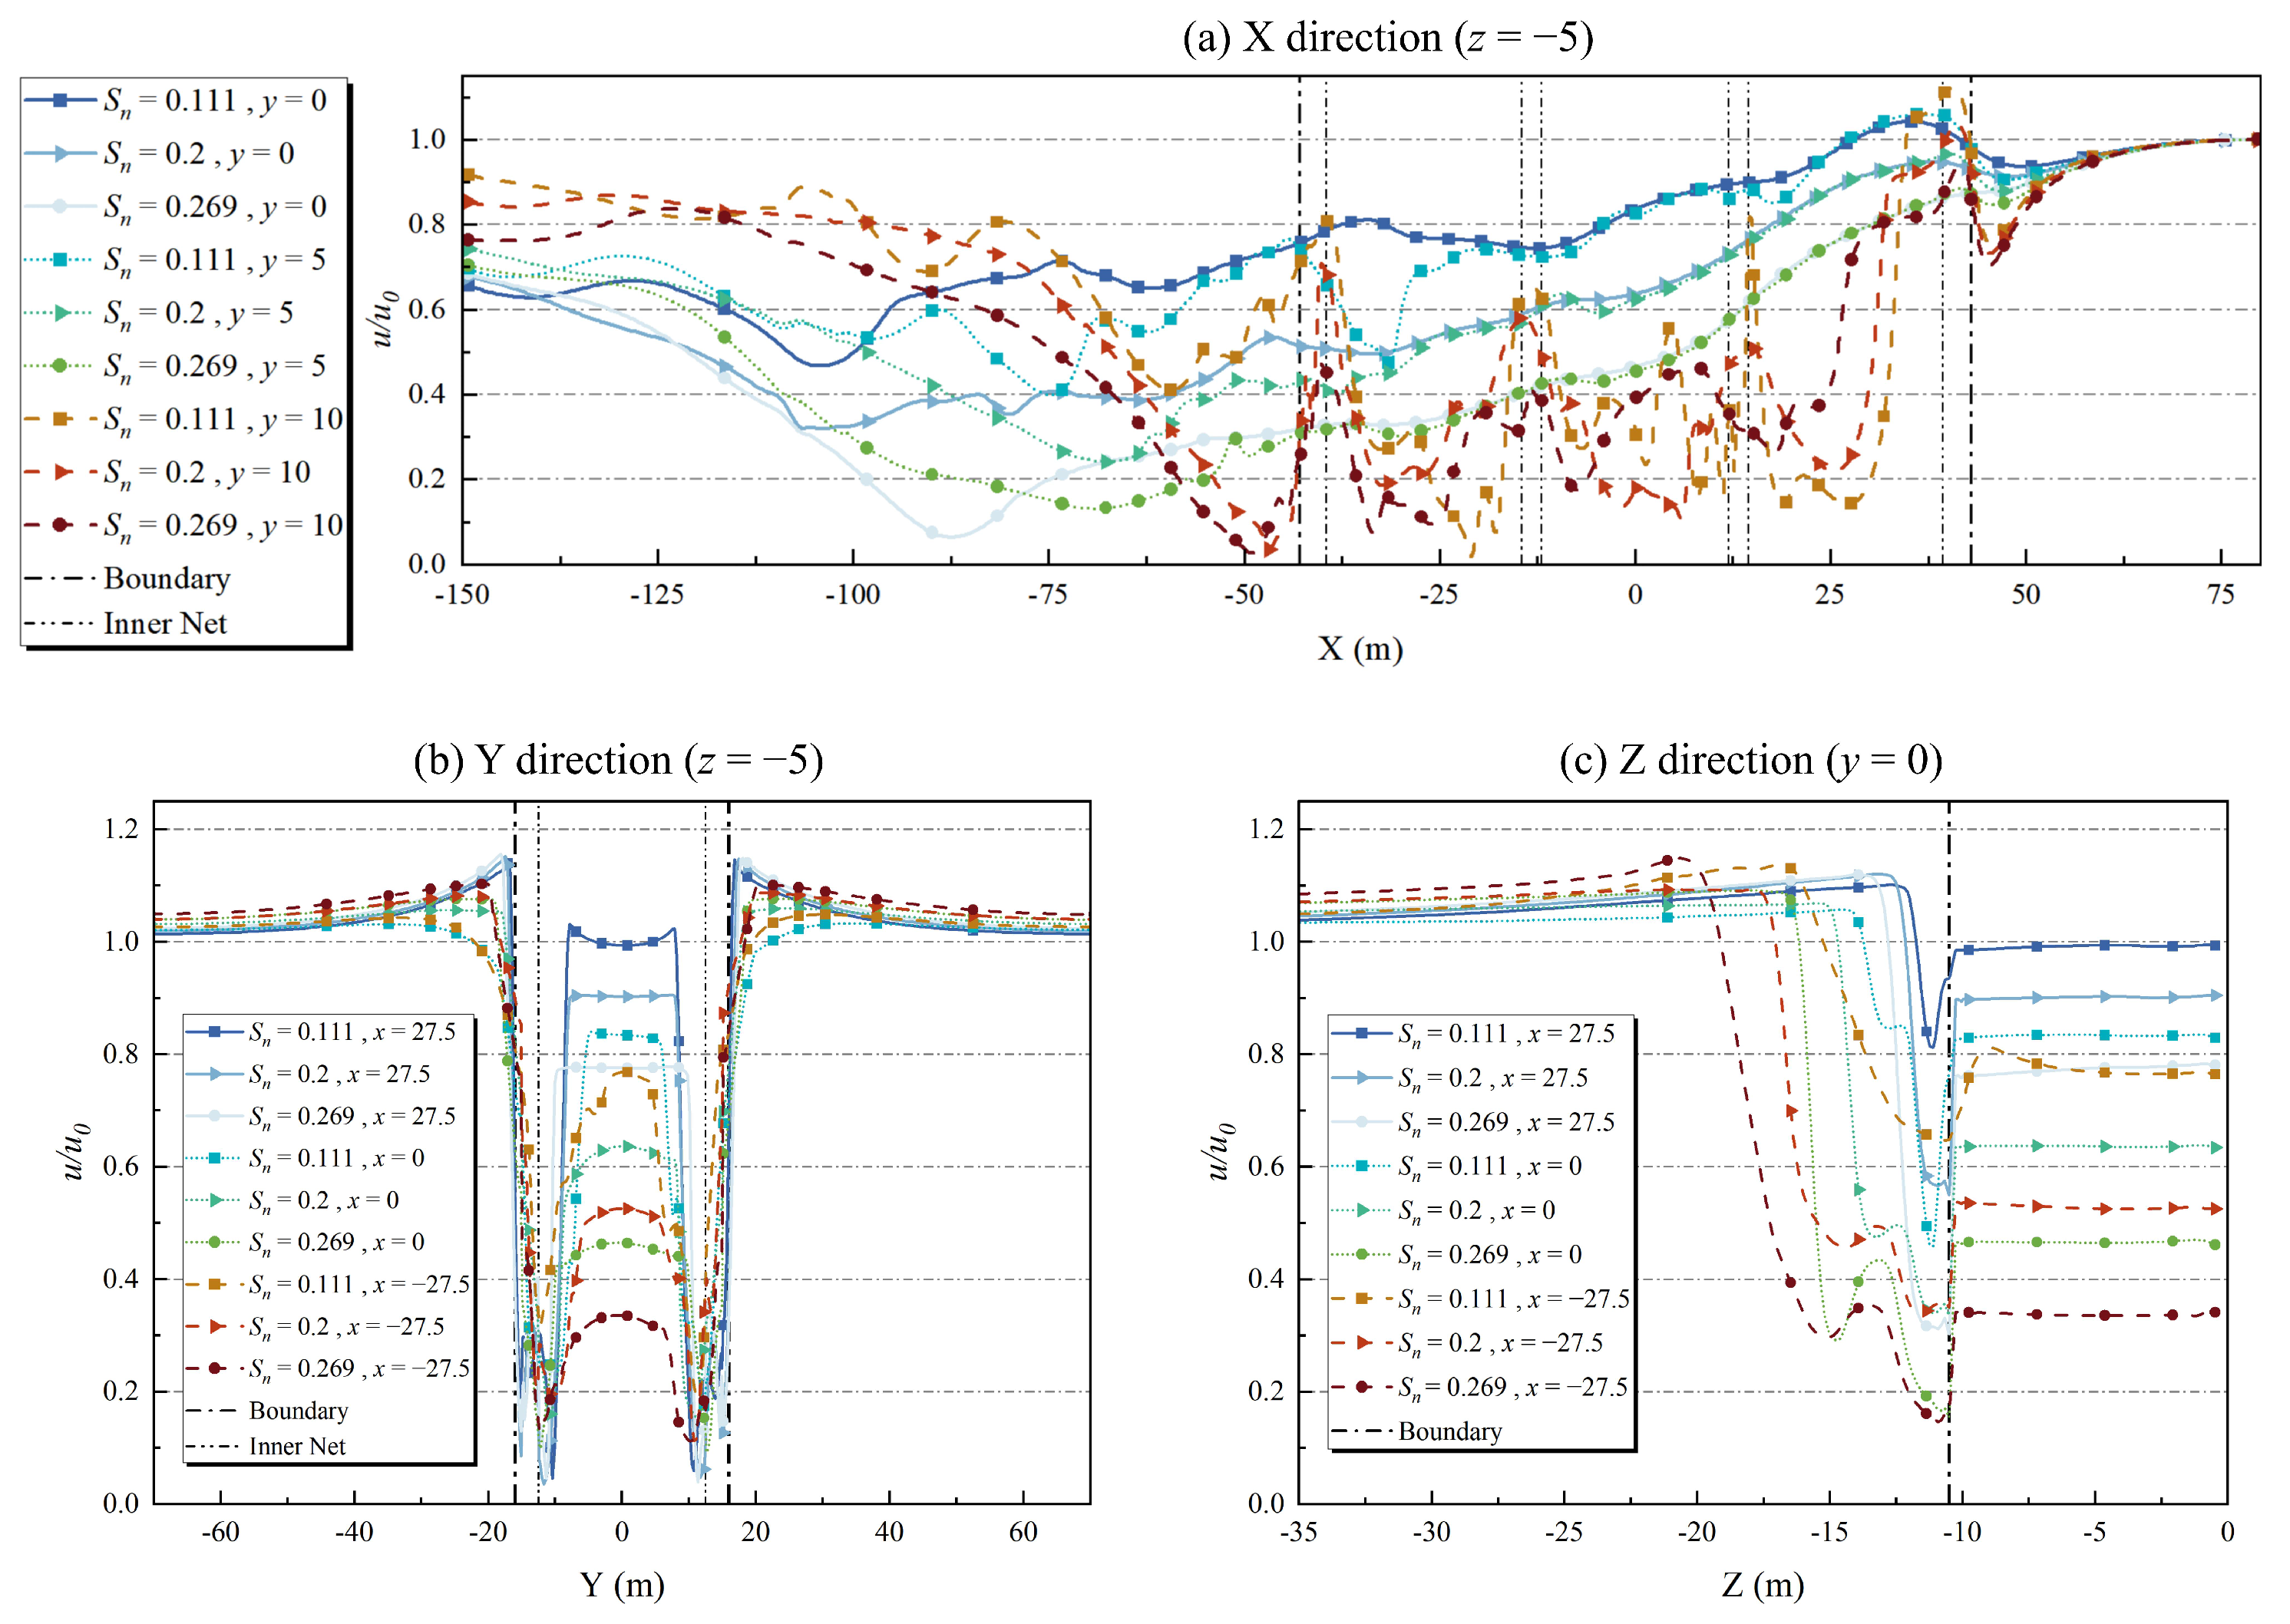
4.3. Effect of Different Net Solidity Ratios
In deep-sea aquaculture, the net belongs to a relatively rough porous medium; its structural robustness ensures that typically lies within the range of 0.1 to 0.4 [30]. Based on the phenomenon observed in the previous section, is selected as the benchmark in this section. The computational conditions are consistent with Section 4.1, with of 0.111, 0.2, and 0.269, respectively. The corresponding parameters and are derived from Liu et al. [27], as shown in Table 4.
Table 4.
The and corresponding and values.
Figure 14 illustrates the profile-specific flow velocity contours of the aquaculture platform for different . As shown in Figure 14a, the vortex zones of the flow field in the inner and downstream portions of the aquaculture platform become more concentrated, stable, and uniformly distributed with increasing , while the attenuation effect of becomes more significant. This phenomenon can be explained by the fact that the denser structure of the high-solidity net increases the obstruction of the water flow, leading to greater deflection of the flow lines and forming a more concentrated and stable vortex structure. At the same time, this effect is combined with the cumulative impact of multiple cages, further exacerbating the energy loss of the water flow. As shown in Figure 14b,c, the decreases significantly near the water surface and the low-velocity zone is concentrated near the bottom net and pillar structure. As the increases, the low-velocity zone downstream becomes wider and the flow velocity attenuation becomes more pronounced. As the depth of the water increases, the disturbance effect of the low-solidity net diminishes compared to the high-solidity net. In the deeper region, there is no longer an obvious low-velocity zone, and the flow tends to approach a free-flowing state. It can be observed that the high-solidity net increases the energy loss inside the aquaculture platform, while the low-solidity net promotes the recovery of the deep flow velocity. By matching the appropriate and depth requirements, the flow field of the aquaculture platform can be optimized efficiently.
Figure 14.
Contours of flow velocity in specific profiles of aquaculture platforms with different .
Figure 15 demonstrates the for specific profile lines under different . As shown in Figure 15a, the curves exhibit significant stratification according to the different attenuation effects of , indicating that has a significant influence on flow velocity attenuation which can trigger a substantial degree of change. Taking the positions away from the side () and inside the culture platform () as an example, the attenuation effect for is the weakest, with attenuation of and , respectively. In contrast, the attenuation effect is the strongest for , with attenuation of and , respectively. As shown in Figure 15b and Figure 16, the at the center of the third cage () is , , and for , , and , respectively, with the maximum difference reaching 43.25%. As shown in Figure 15c, at the bottom net position () of the first cage (), the values corresponding to , , and are attenuated by , , and , respectively. In summary, the reduction ratio of this aquaculture platform configuration is positively correlated with the ; the higher the , the more significant the effect of the netting on flow obstruction. This phenomenon is consistent with the findings of Yao et al. [31] and Winthereig et al. [32].
Figure 15.
The for specific profile lines under different .
Figure 16.
The at the centers of the cages under different .
5. Conclusions
Based on the porous media model, STAR-CCM+ (17.04.007) is used to conduct a comprehensive and systematic investigation into the flow field characteristics inside and outside a semi-submersible aquaculture platform with a multiple net cage configuration. First, the accuracy of the numerical method and stability of the numerical model are verified. Subsequently, the flow field characteristics of the aquaculture platform are analyzed and the effects of different and on the internal and external flow fields of the aquaculture platform are explored. The conclusions of this study are as follows:
- (1)
- Due to the combined effects of the pillar, net, and water flow, the flow field near the aquaculture platform is highly complex and lacks a fixed pattern. The low-velocity vortex region is concentrated near the pillar and net.
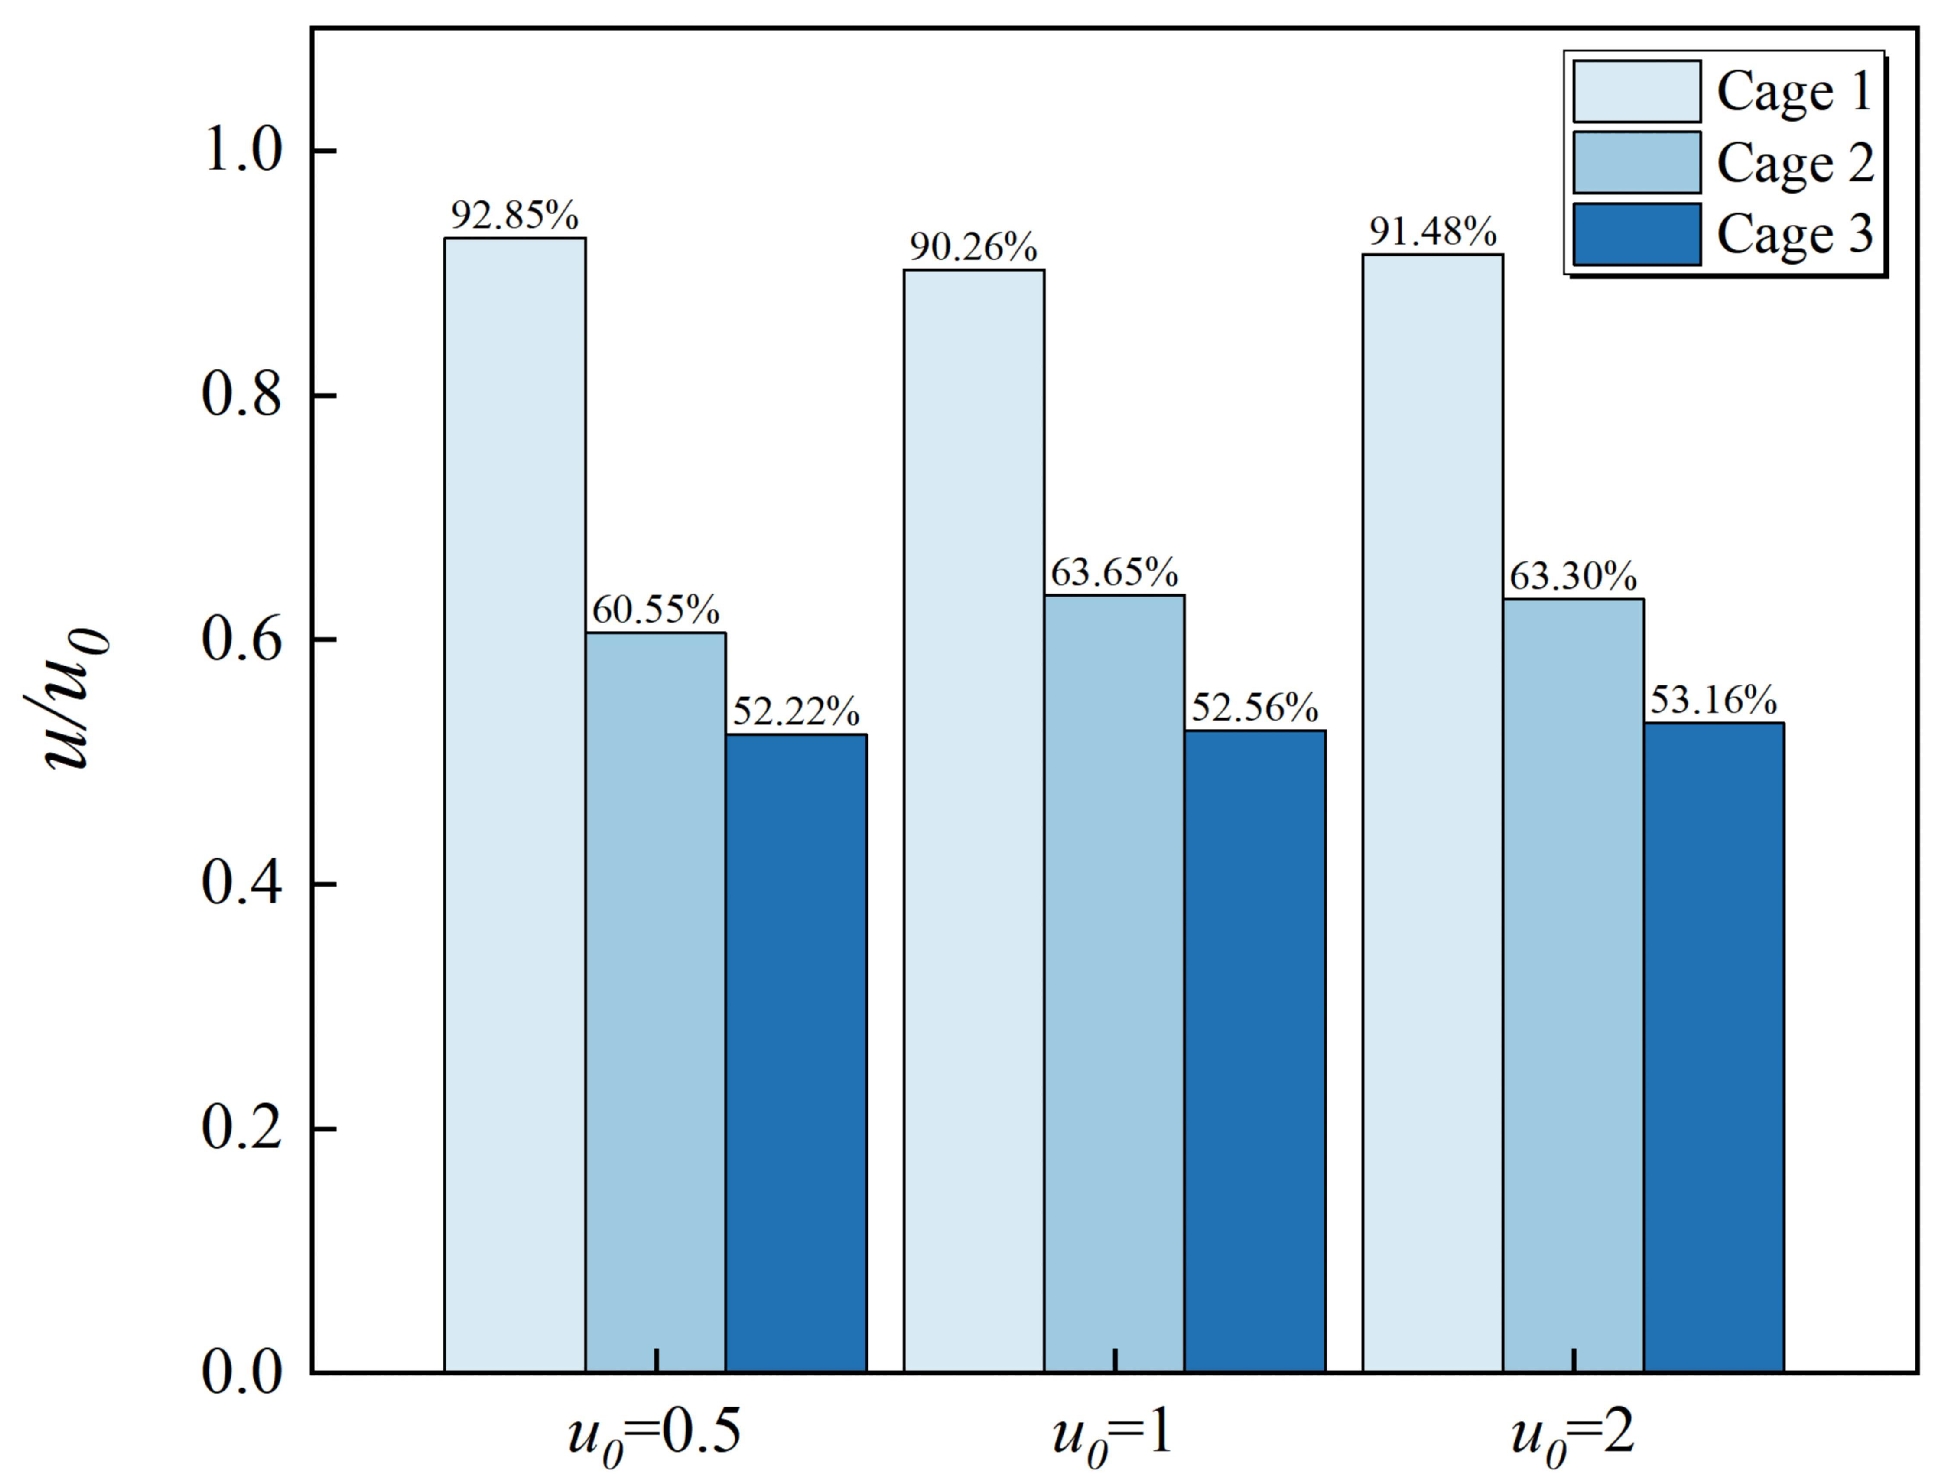
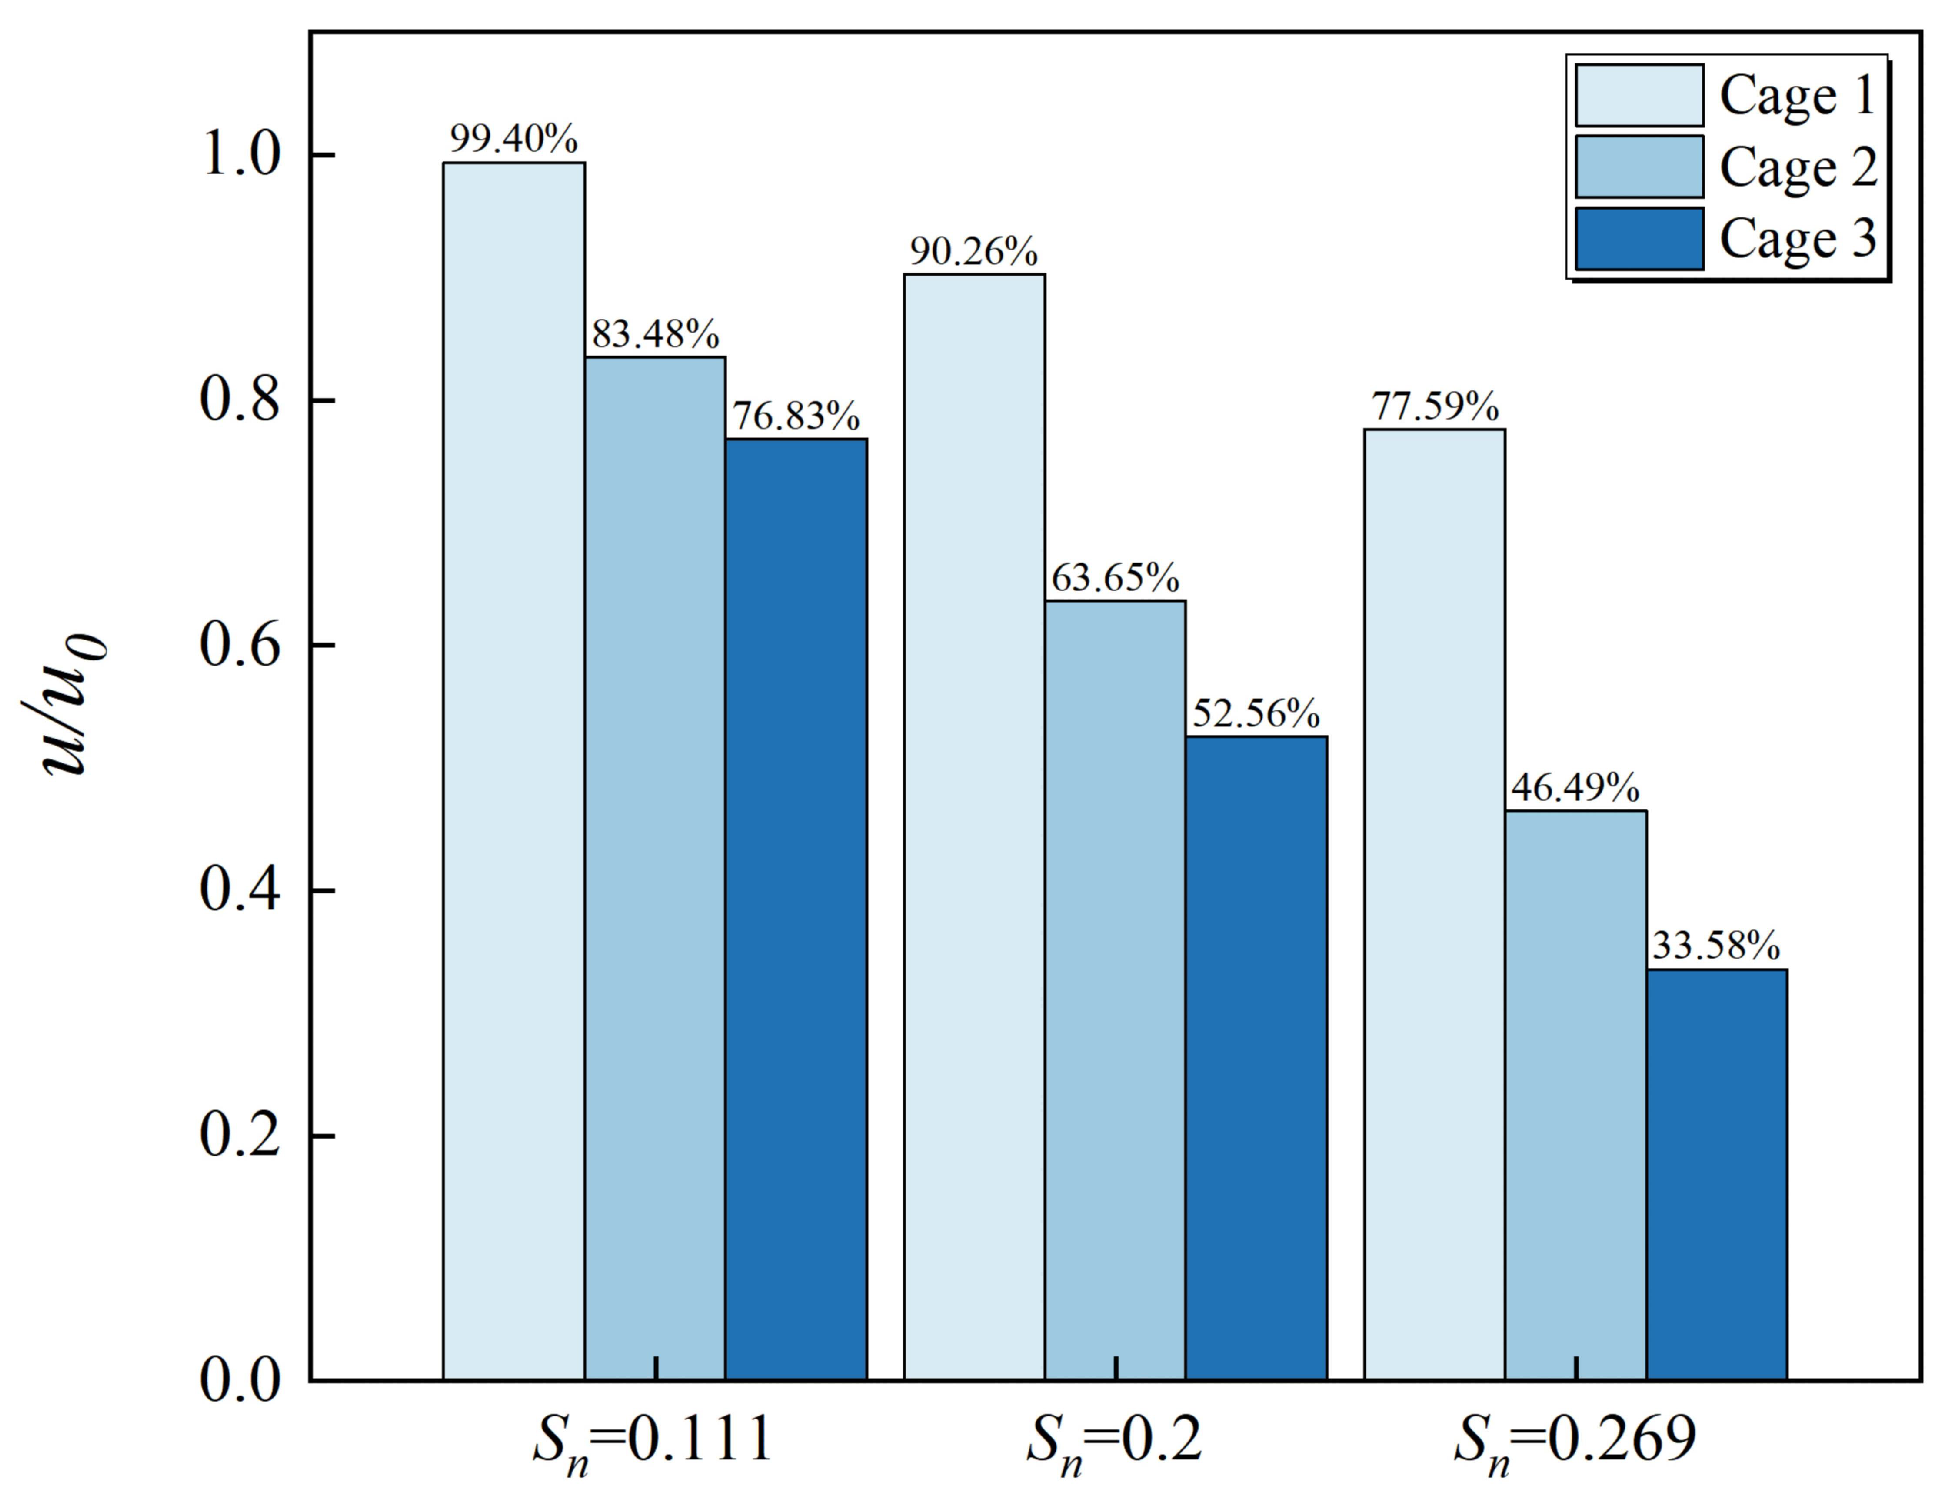
- (2)
- After velocity attenuation, the at the centers of the three cages is 90.26%, 63.65%, and 52.56%, respectively. By leveraging these characteristics, precision-classified aquaculture operations can be implemented based on species-specific optimal flow velocity requirements.
- (3)
- The has minimal effects on the flow velocity inside the cages, with a maximum difference of 3.10%.
- (4)
- Variations in the markedly impact velocity attenuation, particularly in downstream areas. The in the third cage varies by up to 43.25% due to differences in the .
Investigating the internal and external flow field characteristics of aquaculture platforms holds significant importance for practical marine aquaculture engineering. Flow field analysis not only provides scientific foundations for rationally planning aquaculture density and feeding strategies that can ensure stable growth environments for fish but also offers theoretical support for net selection and platform layout design, effectively reducing trial-and-error costs in engineering. However, certain challenges remain in our current research. Cross-sectional analyses and probe lines struggle to deliver a reliable quantitative method for assessing the suitability of fish to specific flow conditions. In order to achieve precise evaluations, more appropriate metrics or statistical analysis methods should be adopted. Additionally, due to physiological differences among fish species, their optimal flow velocity ranges vary significantly, necessitating further studies on species-specific requirements. It should be noted that in practical engineering, semi-submersible aquaculture platforms typically apply pre-tension to nets in order to maintain the entire structure in a taut state with minimal deformation; hence, these are modeled as rigid structures. However, under wave–current coupling conditions or extreme environmental loads, the deformation of flexible nets, fluid–structure interactions, and corresponding flow field characteristics require further investigation. Furthermore, low-velocity vortex regions within aquaculture platforms may lead to sediment and fish waste accumulation, increasing the of the nets and compromising velocity attenuation effect. Despite these limitations, the methodologies and conclusions of this study can provide valuable references for practical engineering applications.
Author Contributions
Conceptualization, J.H. (Ji Huang); methodology, J.H. (Ji Huang) and J.L.; software, B.H. and J.R.; validation, B.H. and J.R.; formal analysis, B.H. and J.R.; resources, J.H. (Ji Huang); data curation, J.H. (Jiawei Hao); writing—original draft, B.H. and J.R.; visualization J.H. (Jiawei Hao); writing—review and editing, J.L. and J.H. (Ji Huang); funding acquisition, J.H. (Ji Huang). All authors have read and agreed to the published version of the manuscript.
Funding
This research received funding from the Ocean Young Talent Innovation Programme of Zhanjiang City (Grant No. 2022E05002), the Young Innovative Talents Grants Programme of Guangdong Province (Grant No. 2022KQNCX024), the China Institute of Navigation Young Elite Scientist Sponsorship Program by CIN (Grant No. YESSCIN2023008), the College Student Innovation Team of Guangdong Ocean University (Grant No. CXTD2021013), the Student Innovation Team of Guangdong Ocean University’s College of Port and Maritime Industry and Technology (Grant No. GHCY2024015), and the Innovation and Entrepreneurship Training Program for College Students (Grant No. CXXL2024217).
Data Availability Statement
All data are contained within the article.
Conflicts of Interest
The authors declare no conflicts of interest.
Nomenclature
| u | flow velocity |
| incoming flow velocity | |
| flow velocity reduction coefficients | |
| net solidity ratio | |
| , | components of velocity |
| dynamic viscosity | |
| p | pressure |
| Reynolds stress term | |
| , | coordinate components |
| , | Prandtl numbers |
| turbulent kinetic energy production term | |
| kinematic viscosity coefficient | |
| , | empirical constants |
| density | |
| E | modulus of the mean strain-rate tensor |
| P | pressure (distinct from p used in the pressure drop) |
| v | velocity |
| tortuosity tensor | |
| t | time |
| T | stress tensor |
| viscous resistance tensor | |
| inertial resistance tensor | |
| D | viscous coefficient tensor |
| C | inertial coefficient tensor |
| normal viscous resistance coefficient | |
| normal inertial resistance coefficient | |
| normal inertial coefficient | |
| tangential inertial coefficient | |
| net thickness | |
| normal viscous coefficient |
References
- Simone, M.N.; Vopel, K. The need for proactive environmental management of offshore aquaculture. Rev. Aquac. 2024, 16, 603–607. [Google Scholar] [CrossRef]
- Verdegem, M.; Buschmann, A.H.; Latt, U.W.; Dalsgaard, A.J.T.; Lovatelli, A. The contribution of aquaculture systems to global aquaculture production. J. World Aquacult. Soc. 2023, 54, 206–250. [Google Scholar] [CrossRef]
- Fan, Z.-Q.; Liang, Y.-H.; Zhao, Y.-P. Review of the research on the hydrodynamics of fishing cage nets. Ocean Eng. 2023, 276, 114192. [Google Scholar] [CrossRef]
- Lee, C.-W.; Kim, Y.-B.; Lee, G.-H.; Choe, M.-Y.; Lee, M.-K.; Koo, K.-Y. Dynamic simulation of a fish cage system subjected to currents and waves. Ocean Eng. 2008, 35, 1521–1532. [Google Scholar] [CrossRef]
- Zhan, J.M.; Jia, X.P.; Li, Y.S.; Sun, M.G.; Guo, G.X.; Hu, Y.Z. Analytical and experimental investigation of drag on nets of fish cages. Aquacult. Eng. 2006, 35, 91–101. [Google Scholar] [CrossRef]
- Balash, C.; Colbourne, B.; Bose, N.; Raman-Nair, W. Aquaculture net drag force and added mass. Aquacult. Eng. 2009, 41, 14–21. [Google Scholar] [CrossRef]
- Moe, H.; Fredheim, A.; Hopperstad, O.S. Structural analysis of aquaculture net cages in current. J. Fluids Struct. 2010, 26, 503–516. [Google Scholar] [CrossRef]
- Huang, L.; Li, Y.; Wang, G.; Wang, Y.; Wu, Q.; Jia, M.; Wan, R. An improved Morison hydrodynamics model for knotless nets based on CFD and metamodelling methods. Aquacult. Eng. 2022, 96, 102220. [Google Scholar] [CrossRef]
- Cifuentes, C.; Kim, M.H. Hydrodynamic response of a cage system under waves and currents using a Morison-force model. Ocean Eng. 2017, 141, 283–294. [Google Scholar] [CrossRef]
- Lader, P.F.; Fredheim, A. Dynamic properties of a flexible net sheet in waves and current—A numerical approach. Aquacult. Eng. 2006, 35, 228–238. [Google Scholar] [CrossRef]
- Kristiansen, T.; Faltinsen, O.M. Modelling of current loads on aquaculture net cages. J. Fluids Struct. 2012, 34, 218–235. [Google Scholar] [CrossRef]
- Patursson, Ø.; Swift, M.R.; Tsukrov, I.; Simonsen, K.; Baldwin, K.; Fredriksson, D.W.; Celikkol, B. Development of a porous media model with application to flow through and around a net panel. Ocean Eng. 2010, 37, 314–324. [Google Scholar] [CrossRef]
- Zhao, Y.-P.; Bi, C.-W.; Dong, G.-H.; Gui, F.-K.; Cui, Y.; Guan, C.-T.; Xu, T.-J. Numerical simulation of the flow around fishing plane nets using the porous media model. Ocean Eng. 2013, 62, 25–37. [Google Scholar] [CrossRef]
- Bi, C.-W.; Zhao, Y.-P.; Dong, G.-H.; Xu, T.-J.; Gui, F.-K. Experimental investigation of the reduction in flow velocity downstream from a fishing net. Aquacult. Eng. 2013, 57, 71–81. [Google Scholar] [CrossRef]
- Chen, H.; Christensen, E.D. Development of a numerical model for fluid-structure interaction analysis of flow through and around an aquaculture net cage. Ocean Eng. 2017, 142, 597–615. [Google Scholar] [CrossRef]
- Yue, W.; Wang, W.; Sheng, S.; Ye, Y.; Hong, T. Analysis of the wave load and dynamic response of a new semi-submersible wave-energy-powered aquaculture platform. Ocean Eng. 2022, 248, 110346. [Google Scholar] [CrossRef]
- Pang, G.; Zhang, S.; Liu, H.; Zhu, S.; Yuan, T.; Li, G.; Han, X.; Huang, X. Hydrodynamic response analysis for a new semisubmersible vessel-shaped fish farm platform based on numerical simulation. Front. Mar. Sci. 2023, 10, 1135757. [Google Scholar] [CrossRef]
- Liu, H.-F.; Liu, Y. Numerical investigation on the dynamic response of the semi-submersible aquaculture platform in regular waves. Ocean Eng. 2024, 294, 116718. [Google Scholar] [CrossRef]
- Hvas, M.; Folkedal, O.; Solstorm, D.; Vågseth, T.; Fosse, J.O.; Gansel, L.C.; Oppedal, F. Assessing swimming capacity and schooling behaviour in farmed Atlantic salmon Salmo salar with experimental push-cages. Aquaculture 2017, 473, 423–429. [Google Scholar] [CrossRef]
- Zhao, Y.-P.; Liu, H.-F.; Bi, C.-W.; Cui, Y.; Guan, C.-T. Numerical study on the flow field inside and around a semi-submersible aquaculture platform. Appl. Ocean Res. 2021, 115, 102824. [Google Scholar] [CrossRef]
- Liu, H.-F.; Bi, C.-W.; Xu, Z.; Zhao, Y.-P. Hydrodynamic assessment of a semi-submersible aquaculture platform in uniform fluid environment. Ocean Eng. 2021, 237, 109656. [Google Scholar] [CrossRef]
- Yang, C.; Yuan, H.; Bai, X.; Hao, Z.; Sun, Y.; Wu, D.; Johanning, L. Numerical investigations on fluid characteristics around the bottom-fixed aquacultural farm. Ocean Eng. 2022, 266, 112689. [Google Scholar] [CrossRef]
- Ji, J.; Zhou, L.; Liu, B.; Guedes Soares, C. Experimental and numerical analysis of a bottom-supported aquaculture platform in uniform flow. Ocean Eng. 2024, 311, 118859. [Google Scholar] [CrossRef]
- Ji, J.; Zhou, L.; Liu, B.; Guedes Soares, C. Experimental and numerical study on the flow field of a bottom-supported net cage with double-layer fishing nets. Ocean Eng. 2025, 319, 120228. [Google Scholar] [CrossRef]
- Huang, H.; Ayoub, J. Applicability of the Forchheimer equation for non-Darcy flow in porous media. SPE J. 2008, 13, 112–122. [Google Scholar] [CrossRef]
- Patursson, Ø. Flow Through and Around Fish Farming Nets. Ph.D. Thesis, University of New Hampshire, Durham, NH, USA, 2008. [Google Scholar]
- Liu, Q.; Chen, H.; Wang, B. A true double-body method based on porous media model for simulation and froude scaling verification of an aquaculture vessel resistance. Ocean Eng. 2024, 310, 118501. [Google Scholar] [CrossRef]
- Solstorm, F.; Solstorm, D.; Oppedal, F.; Olsen, R.E.; Stien, L.H.; Fernö, A. Not too slow, not too fast: Water currents affect group structure, aggression and welfare in post-smolt Atlantic salmon Salmo salar. Aquacult. Environ. Interact. 2016, 8, 339–347. [Google Scholar] [CrossRef]
- Ji, M.; Li, H. Effects of exercise training on growth and physiology of large-mouth bass (Micropterus salmoides) reared in a recirculating aquaculture system. Front. Mar. Sci. 2024, 11, 1423146. [Google Scholar] [CrossRef]
- Cheng, H.; Li, L.; Aarsæther, K.G.; Ong, M.C. Typical hydrodynamic models for aquaculture nets: A comparative study under pure current conditions. Aquacult. Eng. 2020, 90, 102070. [Google Scholar] [CrossRef]
- Yao, Y.; Chen, Y.; Zhou, H.; Yang, H. Numerical modeling of current loads on a net cage considering fluid–structure interaction. J. Fluids Struct. 2016, 62, 350–366. [Google Scholar] [CrossRef]
- Winthereig-Rasmussen, H.; Simonsen, K.; Patursson, Ø. Flow through fish farming sea cages: Comparing computational fluid dynamics simulations with scaled and full-scale experimental data. Ocean Eng. 2016, 124, 21–31. [Google Scholar] [CrossRef]
Disclaimer/Publisher’s Note: The statements, opinions and data contained in all publications are solely those of the individual author(s) and contributor(s) and not of MDPI and/or the editor(s). MDPI and/or the editor(s) disclaim responsibility for any injury to people or property resulting from any ideas, methods, instructions or products referred to in the content. |
© 2025 by the authors. Licensee MDPI, Basel, Switzerland. This article is an open access article distributed under the terms and conditions of the Creative Commons Attribution (CC BY) license (https://creativecommons.org/licenses/by/4.0/).