Article

Optimization Study of the Line Array Layout of Slope–Pendulum Wave Energy Conversion Device

1
Ocean College, Zhejiang University, Zhoushan 316021, China
2
Ningbo Jiangbei District Agriculture and Rural Affairs Bureau, Ningbo 315021, China
3
Department of Engineering Science, University of Oxford, Oxford OX1 3PJ, UK
*
Author to whom correspondence should be addressed.
J. Mar. Sci. Eng. 2025, 13(7), 1367; https://doi.org/10.3390/jmse13071367
Submission received: 30 May 2025 / Revised: 18 June 2025 / Accepted: 19 June 2025 / Published: 18 July 2025

Abstract

The development of wave energy is of great ecological and commercial value. This paper studies the linear vertical array arrangement of the slope–pendulum wave energy conversion device (S-PWEC). Based on the WEC-Sim open-source program, we build four wave energy-generating devices with linear vertical array distributions to study the power generation performance of the array platform and establish the factors influencing the array. S-PWEC is affected by radiation and a shading effect from neighboring devices in a linear vertical array configuration. The overall and individual power generation efficiencies are similar. An increase in the number of devices in the linear vertical array exacerbates the fluctuation of wave excitation moment and output power, indicating that there exists an optimal array configuration for maximizing the power generation efficiency. The performance of the array devices is significantly affected by the direction of incoming waves, and the spacing of the arrays should therefore be adjusted according to the periods of the sea state: increasing the spacing in small periods and decreasing the spacing in large periods can effectively improve the overall power generation. In the future, we will continue to study other array forms of S-PWEC to improve the conversion efficiency of array wave power generation devices.

1. Introduction

The marine environment, covering over 70% of the globe, is rich in energy resources and thus holds significant strategic value for development [1]. Compared with conventional solar and wind energy, wave energy is characterized by a wider distribution range and higher energy storage density, which is more reliable for capturing and converting energy. As one of the most promising marine renewable energy sources, the sustainable capture and efficient conversion of wave energy are core topics [2,3].
Despite the many advantages of wave energy, the large-scale exploitation and utilization of ocean wave energy still faces two technical bottlenecks. The non-stationary nature of the wave field at sea makes it difficult for wave energy conversion devices to efficiently capture waves and smoothly convert wave energy into mechanical energy [4,5,6]. There are two main meanings of optimization. One is to optimize the floats to achieve a higher capture width ratio [7,8,9], and the other is to optimize the float array layout to quantitatively increase wave energy capture and form a large-scale wave power farm [3,10,11,12].
In 2009, Wave Star installed a large-scale wave energy converter (WEC) with two floats on one side on the west coast of Denmark. This was used as a demonstration to propose a commercial version of the Wave Star device. The commercial version of the wave farm comprised an array of 20 floats and was expected to be installed in water depths of 10–20 m, with a power generation capacity of up to 600 kW [11]. In 2014, the ‘Hailing’ hybrid oscillating float WEC was installed in the southern waters of Huangdao District, Qingdao, with a rated capacity of 10 kW, and consisted of four conical floats [13]. Tay [14] investigated the power generation performance of multiple pendulum-type WECs in arrays under conditions with regular waves, unidirectional irregular waves, and multidirectional sea states. Then, Tay [15] systematically investigated the power output characteristics of single-device, 5-device and 21-device point-suction wave energy conversion (WEC) device arrays, focusing on the coupling mechanism between the moon pool resonance effect and the hydrodynamic interaction between the arrays. Yang et al. [16] proposed a multi-body wave energy converter consisting of a floating central platform, multiple oscillators, and driving arms. The numerical results show that the dynamic characteristics and energy conversion efficiency are not only related to the circumferential frequency of incident waves but also related to the connection length between individuals and the central platform, the total number of vibrating objects, the PTO damping coefficient, and the PTO elastic coefficient. It is pointed out that automatically adjusting the connection length results in a higher wave energy absorption efficiency. Zhao et al. [17] proposed that seesaw WEC can improve the power generation capacity by increasing the single-cell area and producing an array. By controlling a single variable, it was found that the power generation performance per unit area of the single-cell array was better than that of the large-area single-cell device. All of the above studies demonstrate that controlling the distribution parameters of the array is beneficial in enhancing the capture efficiency of WECs. The research and development of array-type WEC is in a period of rapid acceleration. The goal of researchers across many countries keen on developing wave energy is to optimize the array layout of WEC to improve conversion efficiency [2,18,19].
In this paper, the Zhoushan Sea area of Zhejiang Province in China is taken as the study’s sea area. Based on the original stand-alone S-PWEC device, the optimization study of linear array layout is carried out. Section 2 of the article presents and describes in detail the mathematical concepts of array modeling. Next, Section 3 describes the steps and methods used in the simulation of this device and discusses the relevant experimental results. Finally, in Section 4, meaningful results are obtained from these numerical simulation experiments. Based on these results, relevant substantive conclusions are presented on the array arrangement of wave energy to promote the commercialization and industrialization of wave power generation plants.

2. Theoretical Model

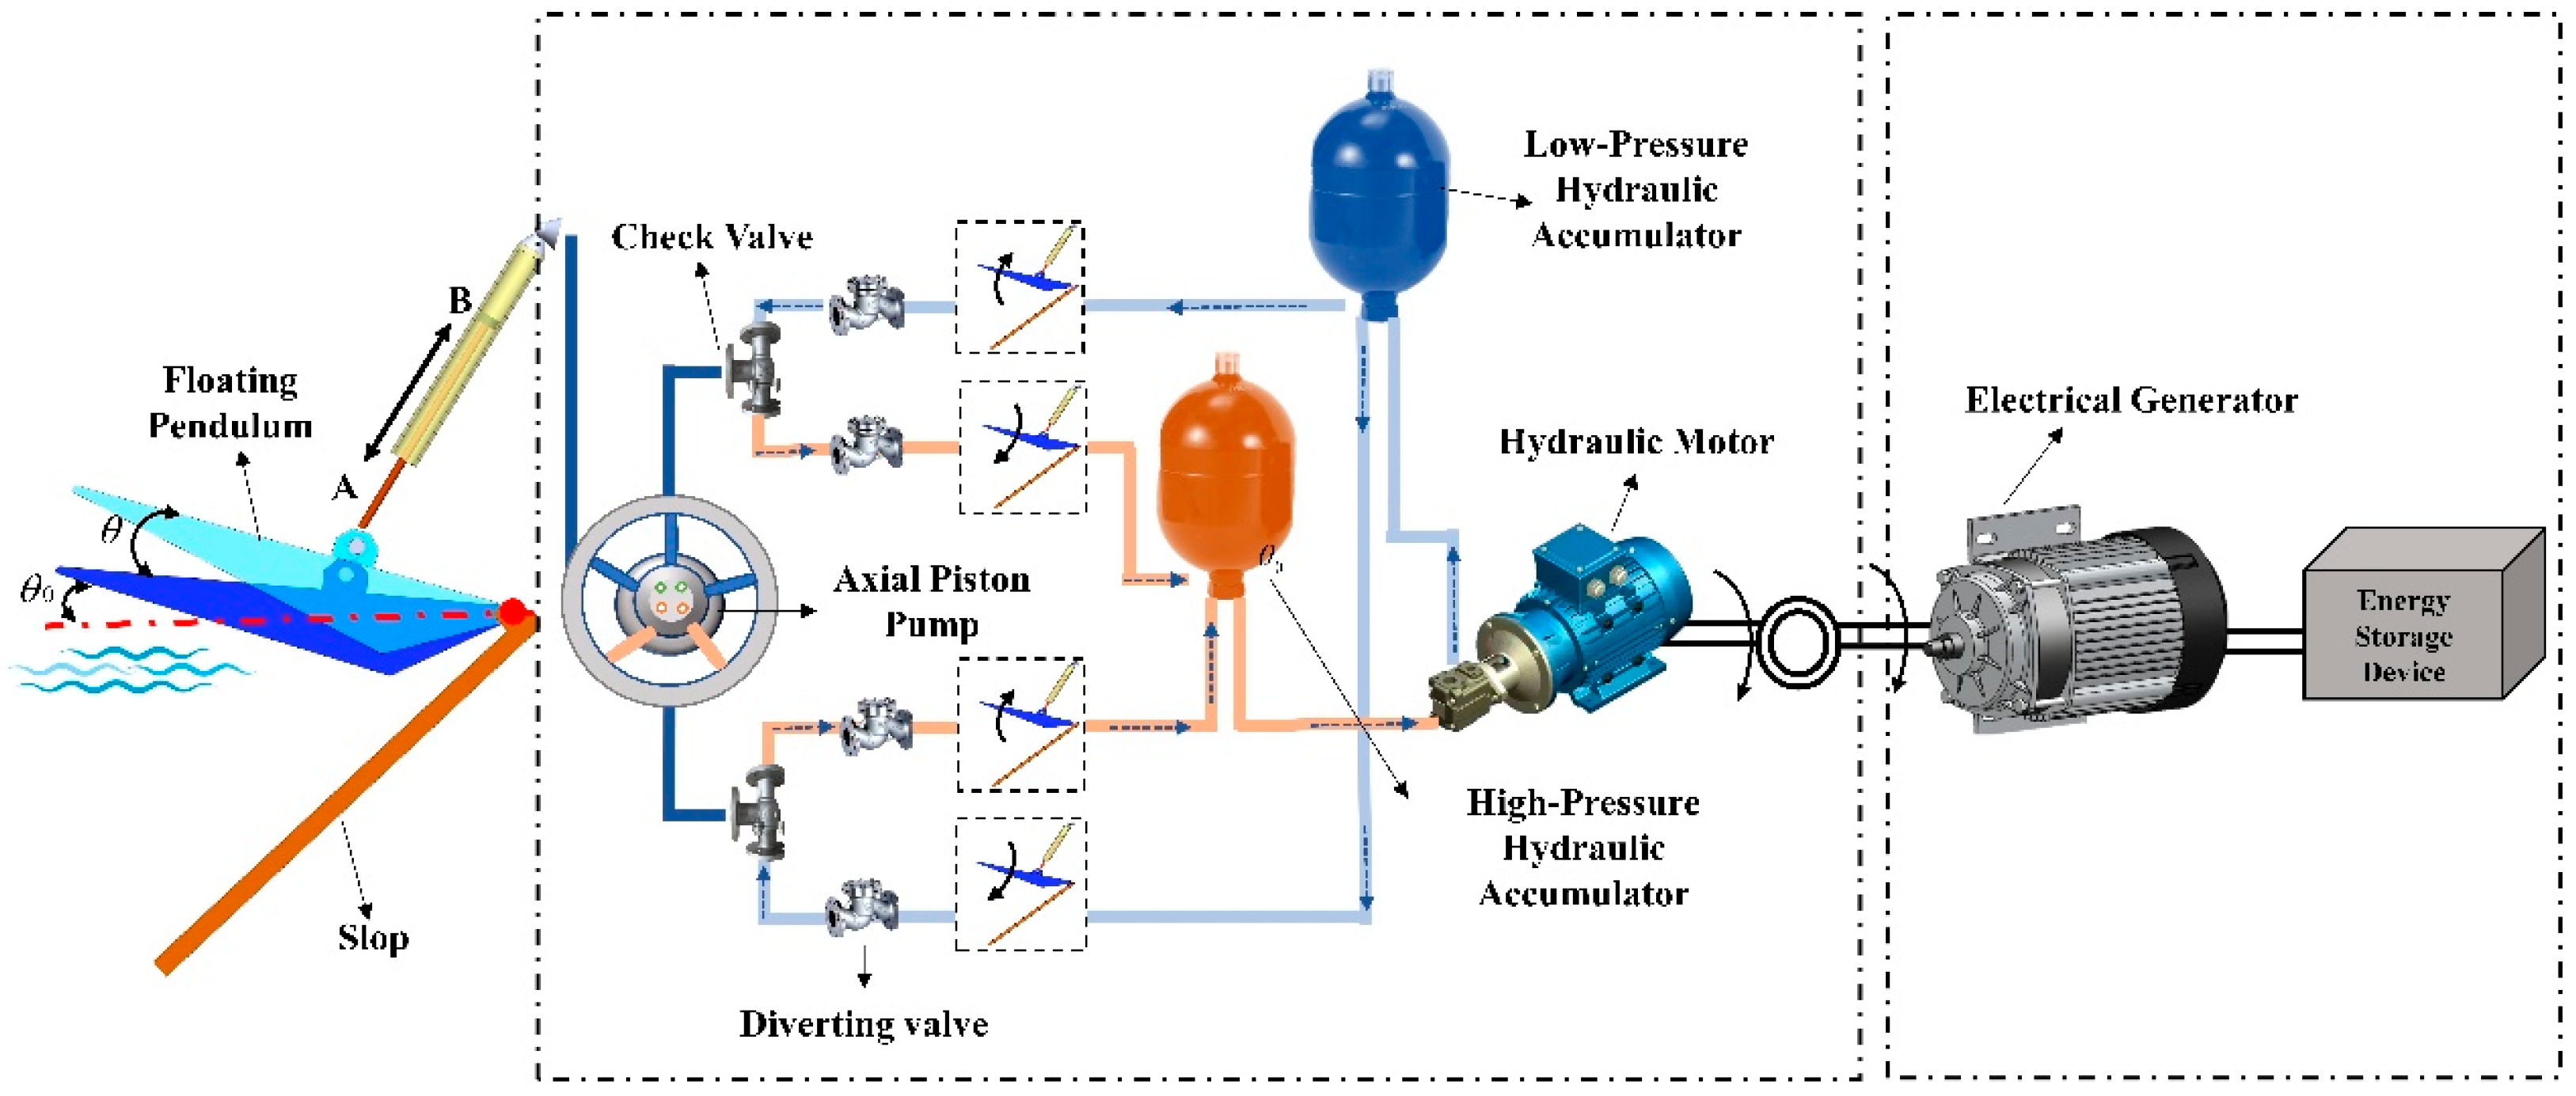
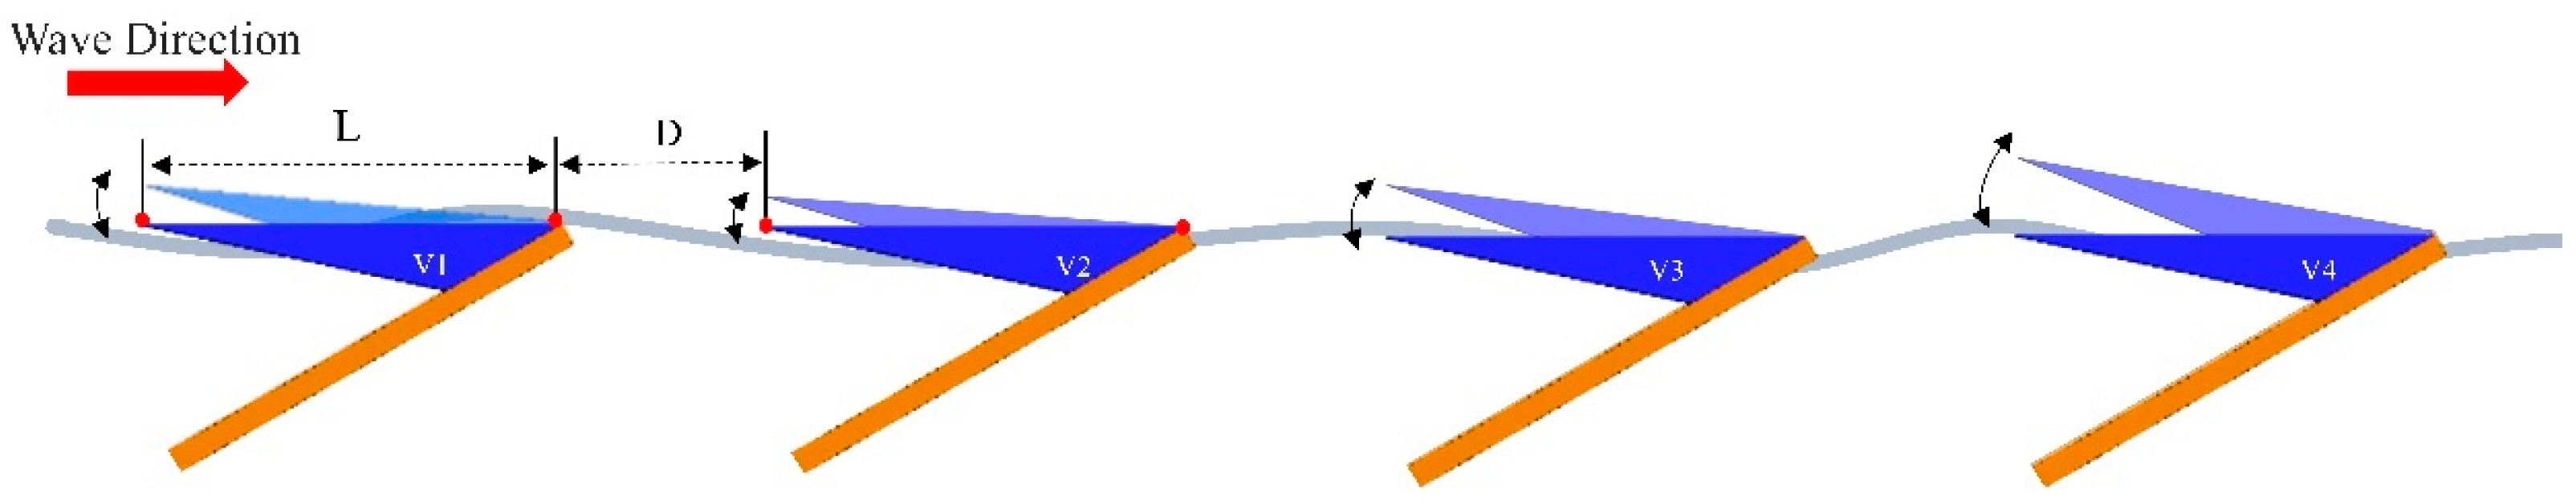
2.1. Individual and Linear Array Layout of S-PWEC

As shown in Figure 1, a single S-PWEC device comprises three core functional modules: a hydrodynamic capture module, a hydraulic transmission module, and a power conversion module. The hydrodynamic capture module converts the kinetic energy of waves into mechanical energy via a pendulum. When waves hit the device, the floating pendulum moves back and forth around a fixed pivot point. This forces the hydraulic rod connected to the pendulum to reciprocate, and slope setting can effectively enhance the pendulum’s capture power [20,21]. In the hydraulic transmission module, the hydraulic rod reciprocates to push hydraulic oil into the high- and low-pressure accumulators, converting the mechanical energy captured by the floating pendulum into hydraulic energy. Finally, the power conversion module uses a generator to convert the captured wave energy into electrical energy.
The array layout of the S-PWEC directly affects hydrodynamic performance and the wave energy capture efficiency. As shown in Figure 2, we adopt a linear vertical array layout for the current study. In this layout, the opening direction of each device is consistent with the direction of the incident wave. The distance between the two devices is defined as D, and for an individual S-PWEC the pendulum length (L) is 8 m, the pendulum width (B) is 4 m, and the slope inclination angle is 60°. The initial spacing (D) between two adjacent S-PWECs is set to 8 m, and the four pendulums are labelled sequentially as V1, V2, V3 and V4 in the direction of the incident wave.

2.2. Motion Response

In this paper, we study the linear vertical array layout of S-PWEC, which is fixed on a platform over water, without considering the effect of slope and platform motion on the device power generation; only the motion in the longitudinal rocking direction of the floating pendulum is considered. Therefore, according to the Cummins time-domain equation [22], the motion response equation of the S-PWEC device in an array layout reads as follows:
( I + A ) ξ ¨ ( t ) + M r ( t ) + M s ( t ) = M e x ( t ) + M P T O ( t ) + M v i s ( t ) + M e s ( t )
In the above Equation (1)
  • M r , M s , M e x , and ξ are the column vector of the radiative moments to which the units are subjected, the hydrostatic recovery moment matrix, the wave excitation moment matrix in the longitudinal rocking direction, and the column vector of the displacement response, respectively. ξ ˙ ( t ) is the column vector of the velocity response and ξ ¨ ( t ) is the acceleration response vector in pitch direction.
  • I = I 1 0 0 0 I 2 0 0 0 I n is the mass matrix of array wave energy conversion device, n is the number of array devices, and A = A 1 0 0 0 A 2 0 0 0 A n represents the additional moment of inertia in the longitudinal direction.
  • The wave radiation moment M r i i = 1 , 2 , , n is given as follows:
    M r i = j = 1 n M r i j = j = 1 n 0 t K i j ( t τ ) ξ ˙ j ( t ) d τ
    M r i represents the radiation moment on the j th pendulum caused by the motion of the i th pendulum. K i j is the delay function of the radiative force on the i th floating pendulum caused by the motion of the j th floating pendulum, characterizing the memory effect of the fluid; this can be solved by the spatial equation of state. d τ represents an integral variable, which is a differential element in time integration.
  • The hydrostatic restoring moment M s is the combined moments of gravity and static buoyancy of the generating unit:
    M s = M b M G
    where M b and M G are the moments of buoyancy and gravity, respectively.
  • M v i s is the secondary viscous drag moment. In the field operation, the wave energy conversion device undergoes vortex detachment during its interaction with waves, leading to viscous interaction [23]. This is modeled as follows:
    M v i s = C D V V 0 V V 0 × L v i s
    In Equation (4),   C D = 1 2 ρ C d A d i is the coefficient of the secondary damping term in viscous moment. C D can be obtained from the published data or hydrodynamic experiments. V is the velocity of the floating plate, V 0 is the velocity of the surrounding fluid, and L v i s is the moment of the viscous force on the pivot point.
  • M P T O is the damping torque of the hydraulic power take-off (PTO):
    M P T O = p p i s t o n A p i s t o n × L P T O
    where p p i s t o n is the pressure difference on the piston in the hydraulic rod, A p i s t o n is the force area of the piston in the hydraulic rod, and L P T O is the length of the force arm from the hydraulic rod to the floating pendulum.
  • M e s is the braking torque of the limiting device, which is achieved by installing springs with large stiffness coefficients at the articulation point. Assuming that the braking torque is proportional to the angular velocity of the floating pendulum, M e s is given by
    M e s = k e s ξ ˙ H ξ ξ e s k e s ξ ˙ H ξ ξ e s
    where k e s is the large stiffness coefficient of the limit spring, ξ e s is the limit angle, and H x the step function. This is given as
    H x = 0   x < 0 1   x 0
  • Coupling the above equations yields the overall time-domain equation for the arrayed wave energy conversion device:
    I 1 + A 0     I n 1 + A n 1 0 I n + A n ξ ¨ ( t ) 1 ξ ¨ ( t ) n 1 ξ ¨ ( t ) n + 0 t K 1 ( t τ ) ξ ˙ ( t ) 1 d τ 0 t K n 1 ( t τ ) ξ ˙ ( t ) n 1 d τ 0 t K n ( t τ ) ξ ˙ ( t ) n d τ + M s 1 M s n 1 M s n = M e x 1 M e x n 1 M e x n + M P T O 1 M P T O n 1 M P T O n + M v i s 1 M v i s n 1 M v i s n + M e s 1 M e s n 1 M e s n
  • In order to determine the rationality of the array field and the superiority of the wave energy-generating device’s power generation performance, it is necessary to introduce the dimensionless array impact factor q . The array impact factor q is an important index to measure the performance of array device, which is defined as follows:
    q = P ¯ a r r a y P i s o l a t e d
    In Equation (9), P i s o l a t e d is the power generated by a single S-PWEC at normal operation conditions, and P ¯ a r r a y is the average of the total power of all S-PWECs at the following array layout:
    P ¯ a r r a y = 1 n 1 n P 3
    where P 3 is the generating power of each S-PWEC.
If q > 1 , it means that the array arrangement scheme is favorable to capturing wave energy. The wave energy captured by a single unit in this array is greater than that captured by a single device placed in the same sea area. This suggests that the array arrangement scheme promotes wave energy conversion. If q < 1 , it indicates that the array arrangement scheme is not conducive to wave energy capture; then, the overall average wave energy captured by a single device in this type of array is less than that captured by a single device. If q = 1 , it indicates that the array layout has no effect on wave energy capture by wave energy generators.

3. Results & Discussion

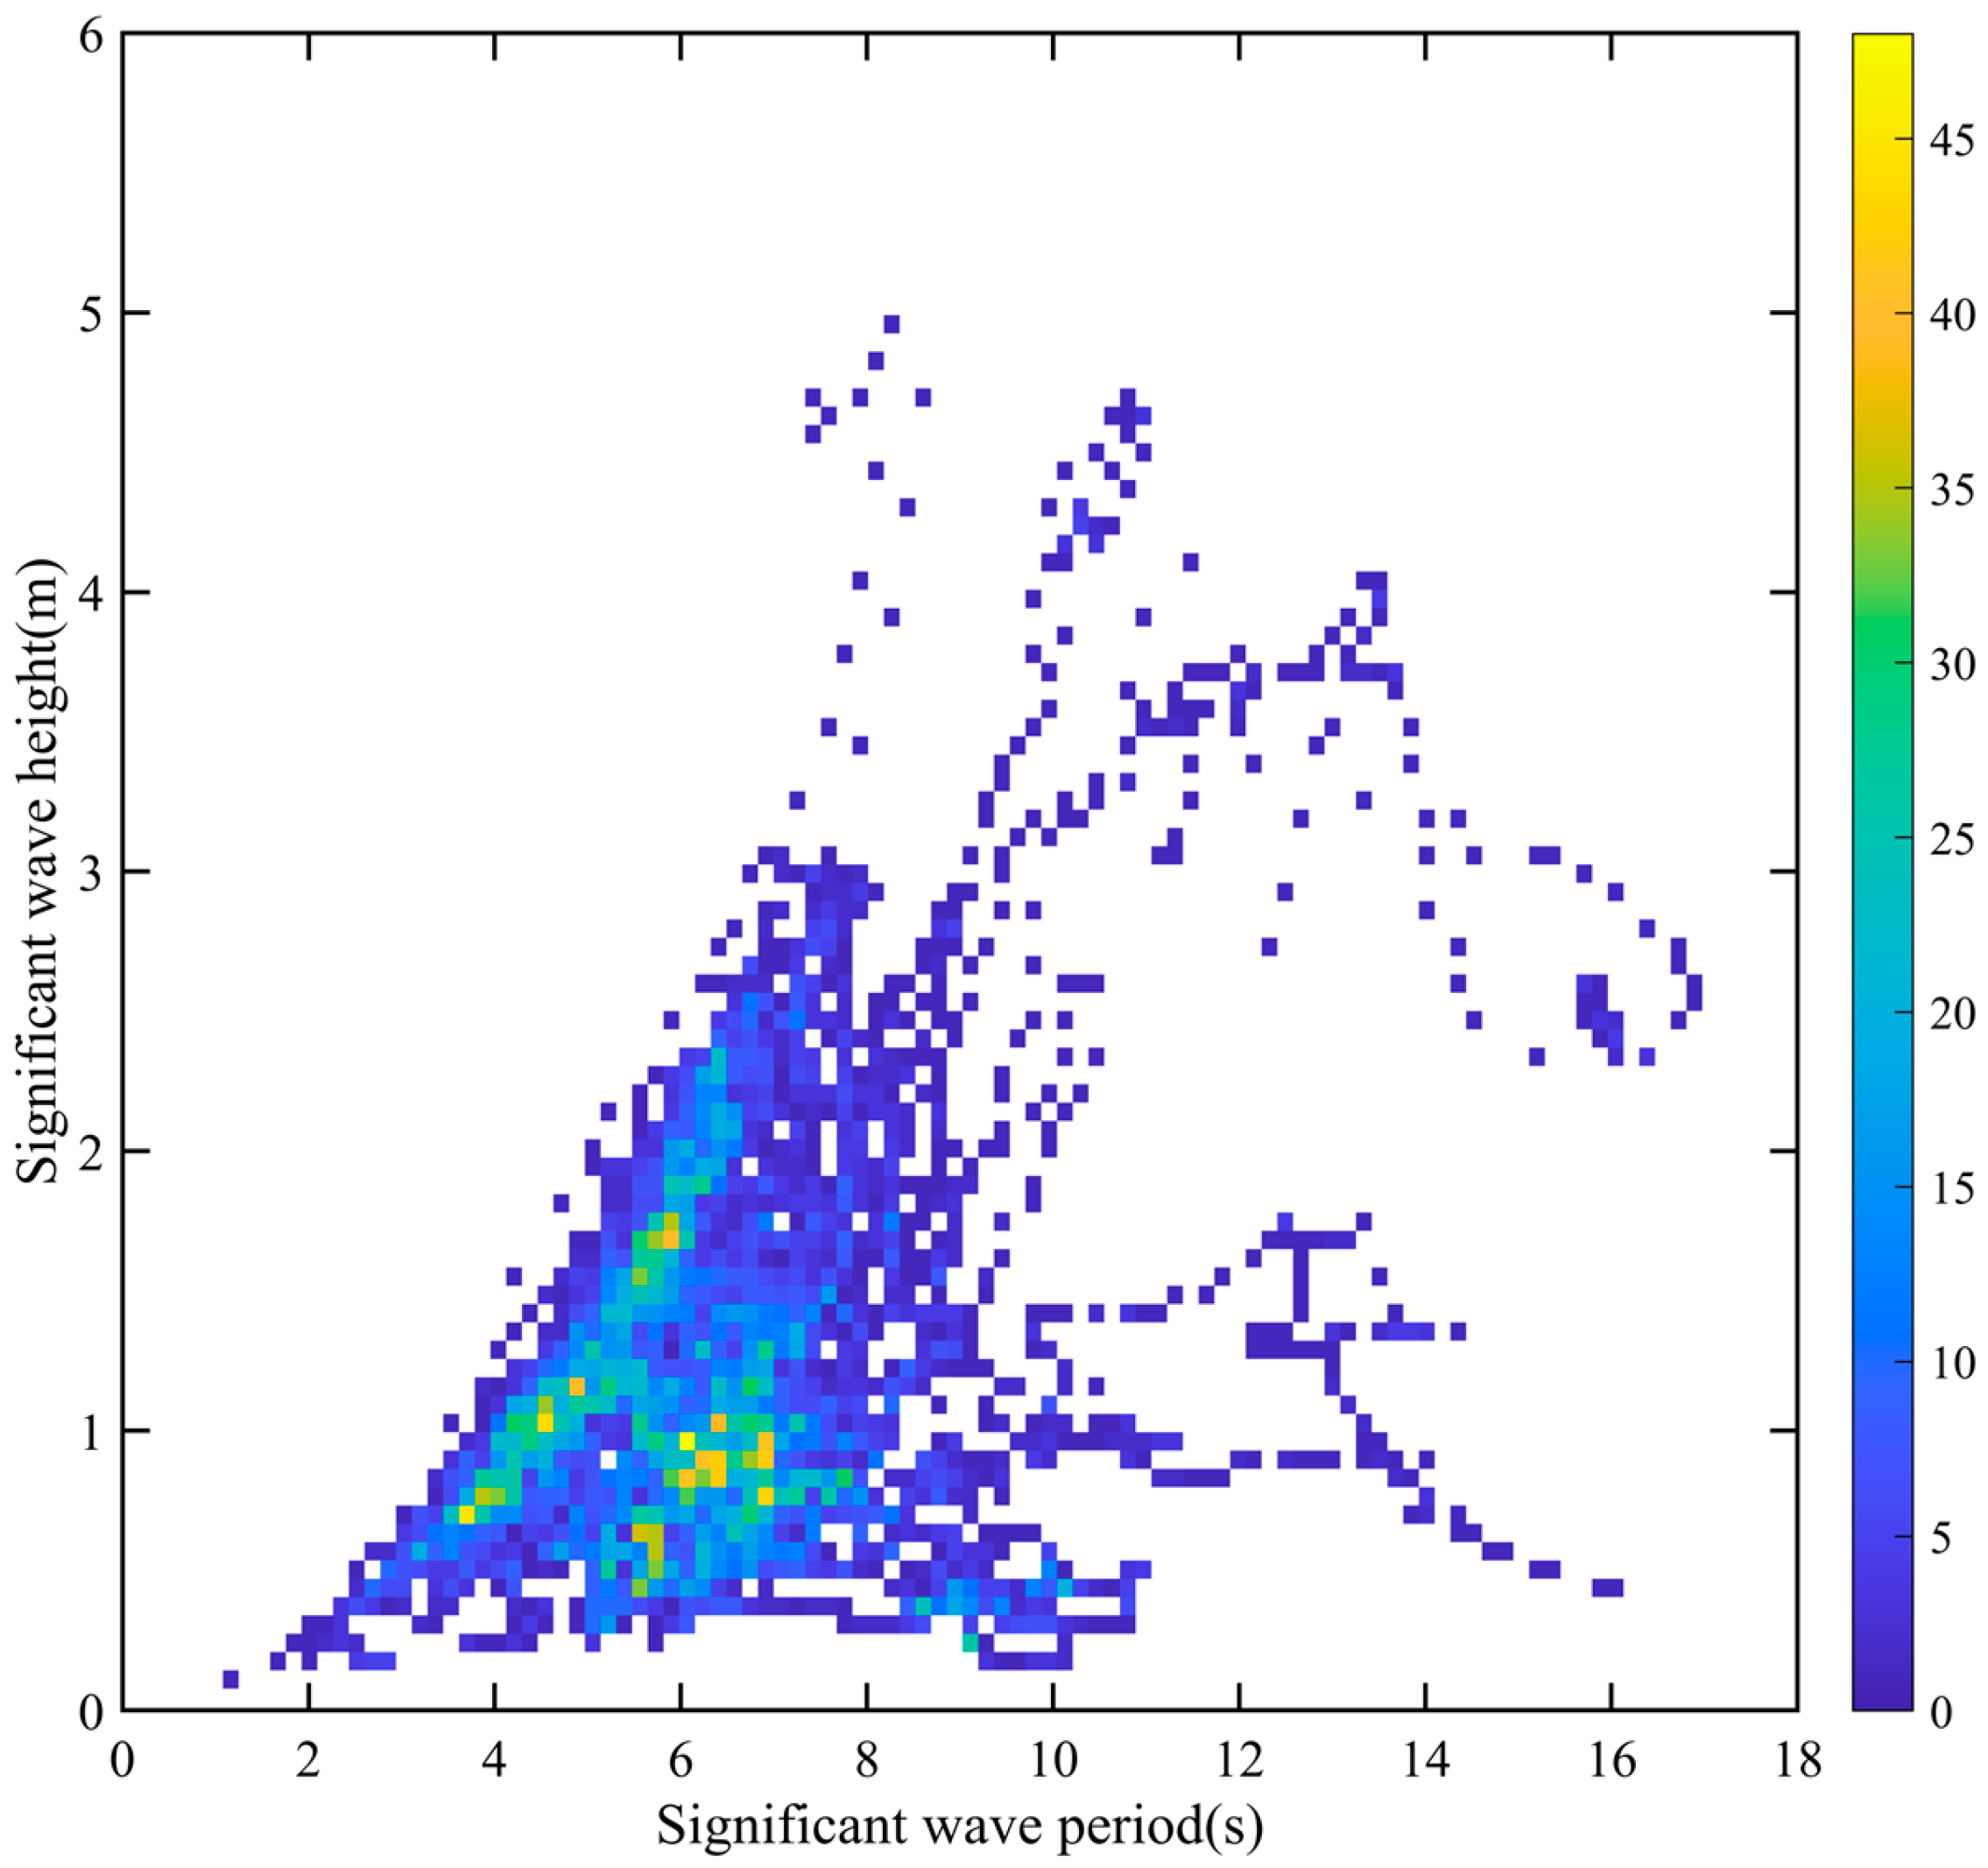
3.1. Setup of Initial Sea State Parameters

The Zhoushan Islands are in the north-eastern part of the East China Sea and consist of numerous islands. The eastern part of the islands has unique marine resources and a superior marine environment, which belongs to an areas with high levels of wave energy resources [24]. Sea condition data near the Zhoushan Sea in Zhejiang Province (30° N, 123° E) were obtained from the official NOAA website [25] for the period from 1 January 2024 to 1 January 2025. The statistical distribution of sea condition data is shown in Figure 3.
Across one year, the main sea conditions in the target sea area concentrates on a period of 5–9 s and a wave height of 0–2 m. This aligns with the statistical results of the sea conditions in the Zhoushan Sea area in recent years [24,26]. These baseline sea state parameters provide a realistic hydrodynamic environment for optimizing the S-PWEC array layout, thereby enhancing the reliability and applicability of the following findings.

3.2. Full-System Modeling for Arrayed S-PWEC

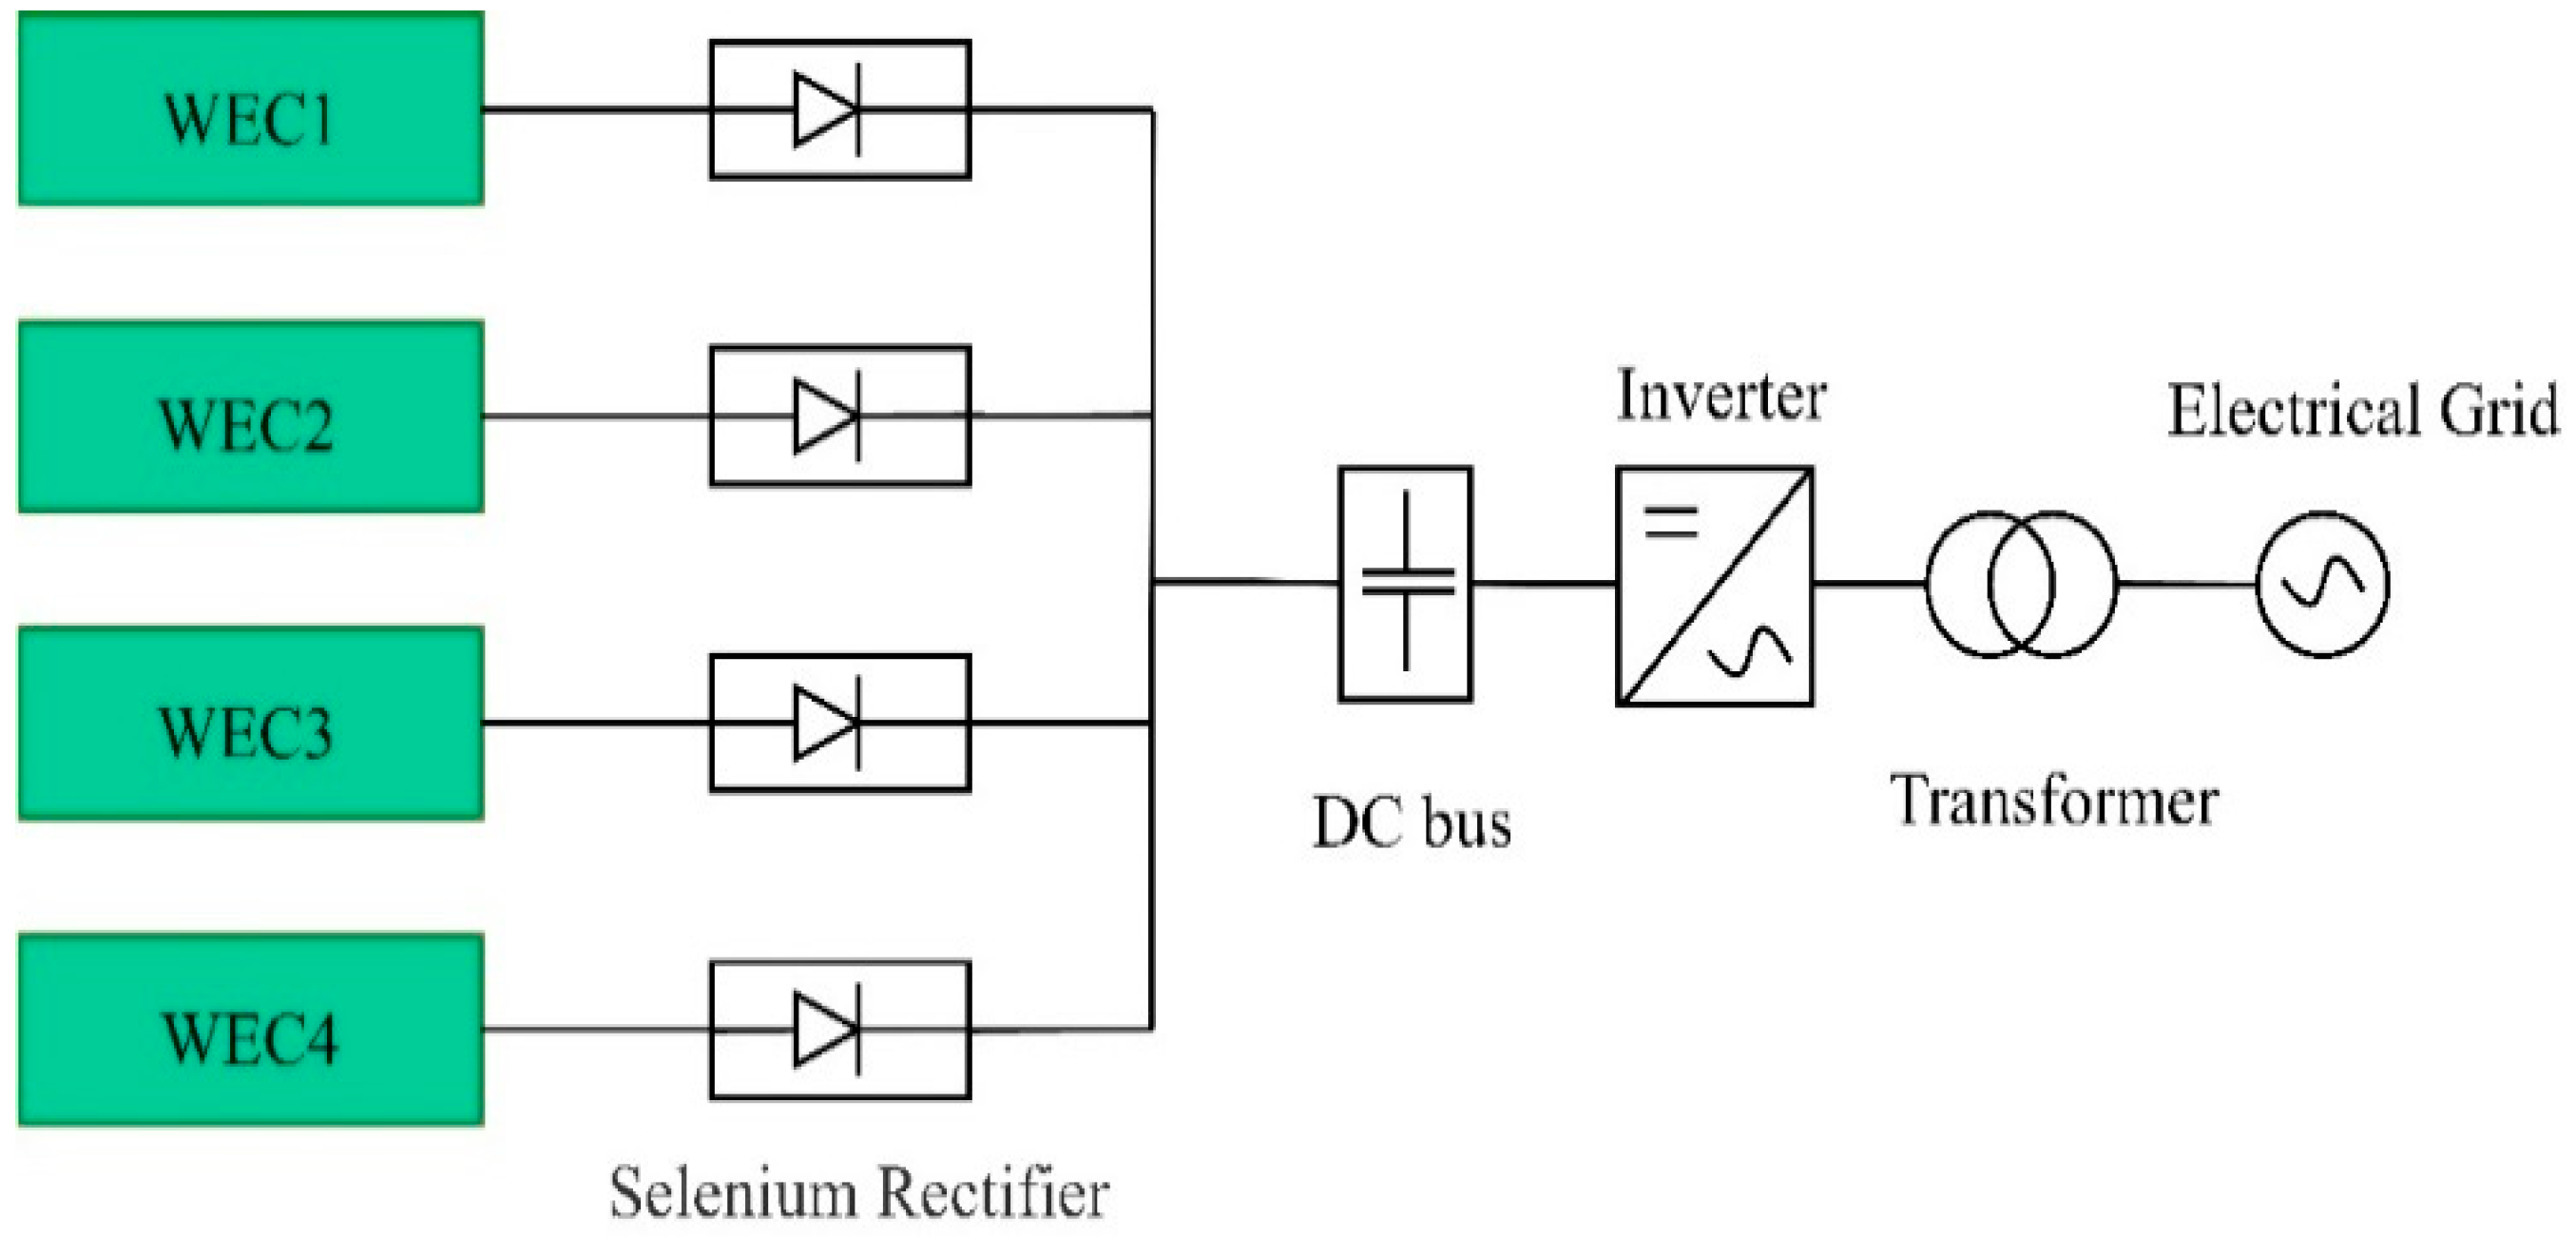
3.2.1. Power Integration System Design

Figure 4 shows the arrangement of the four S-PWEC arrays for electrical energy integration. Each S-PWEC array converts the output current into direct current (DC) via a rectifier, which then outputs the DC current via a DC bus. The DC current is then converted into alternating current (AC) at a specific frequency by an inverter and transformer while performing voltage step-up. Finally, the converted power is fed into the electrical grid.

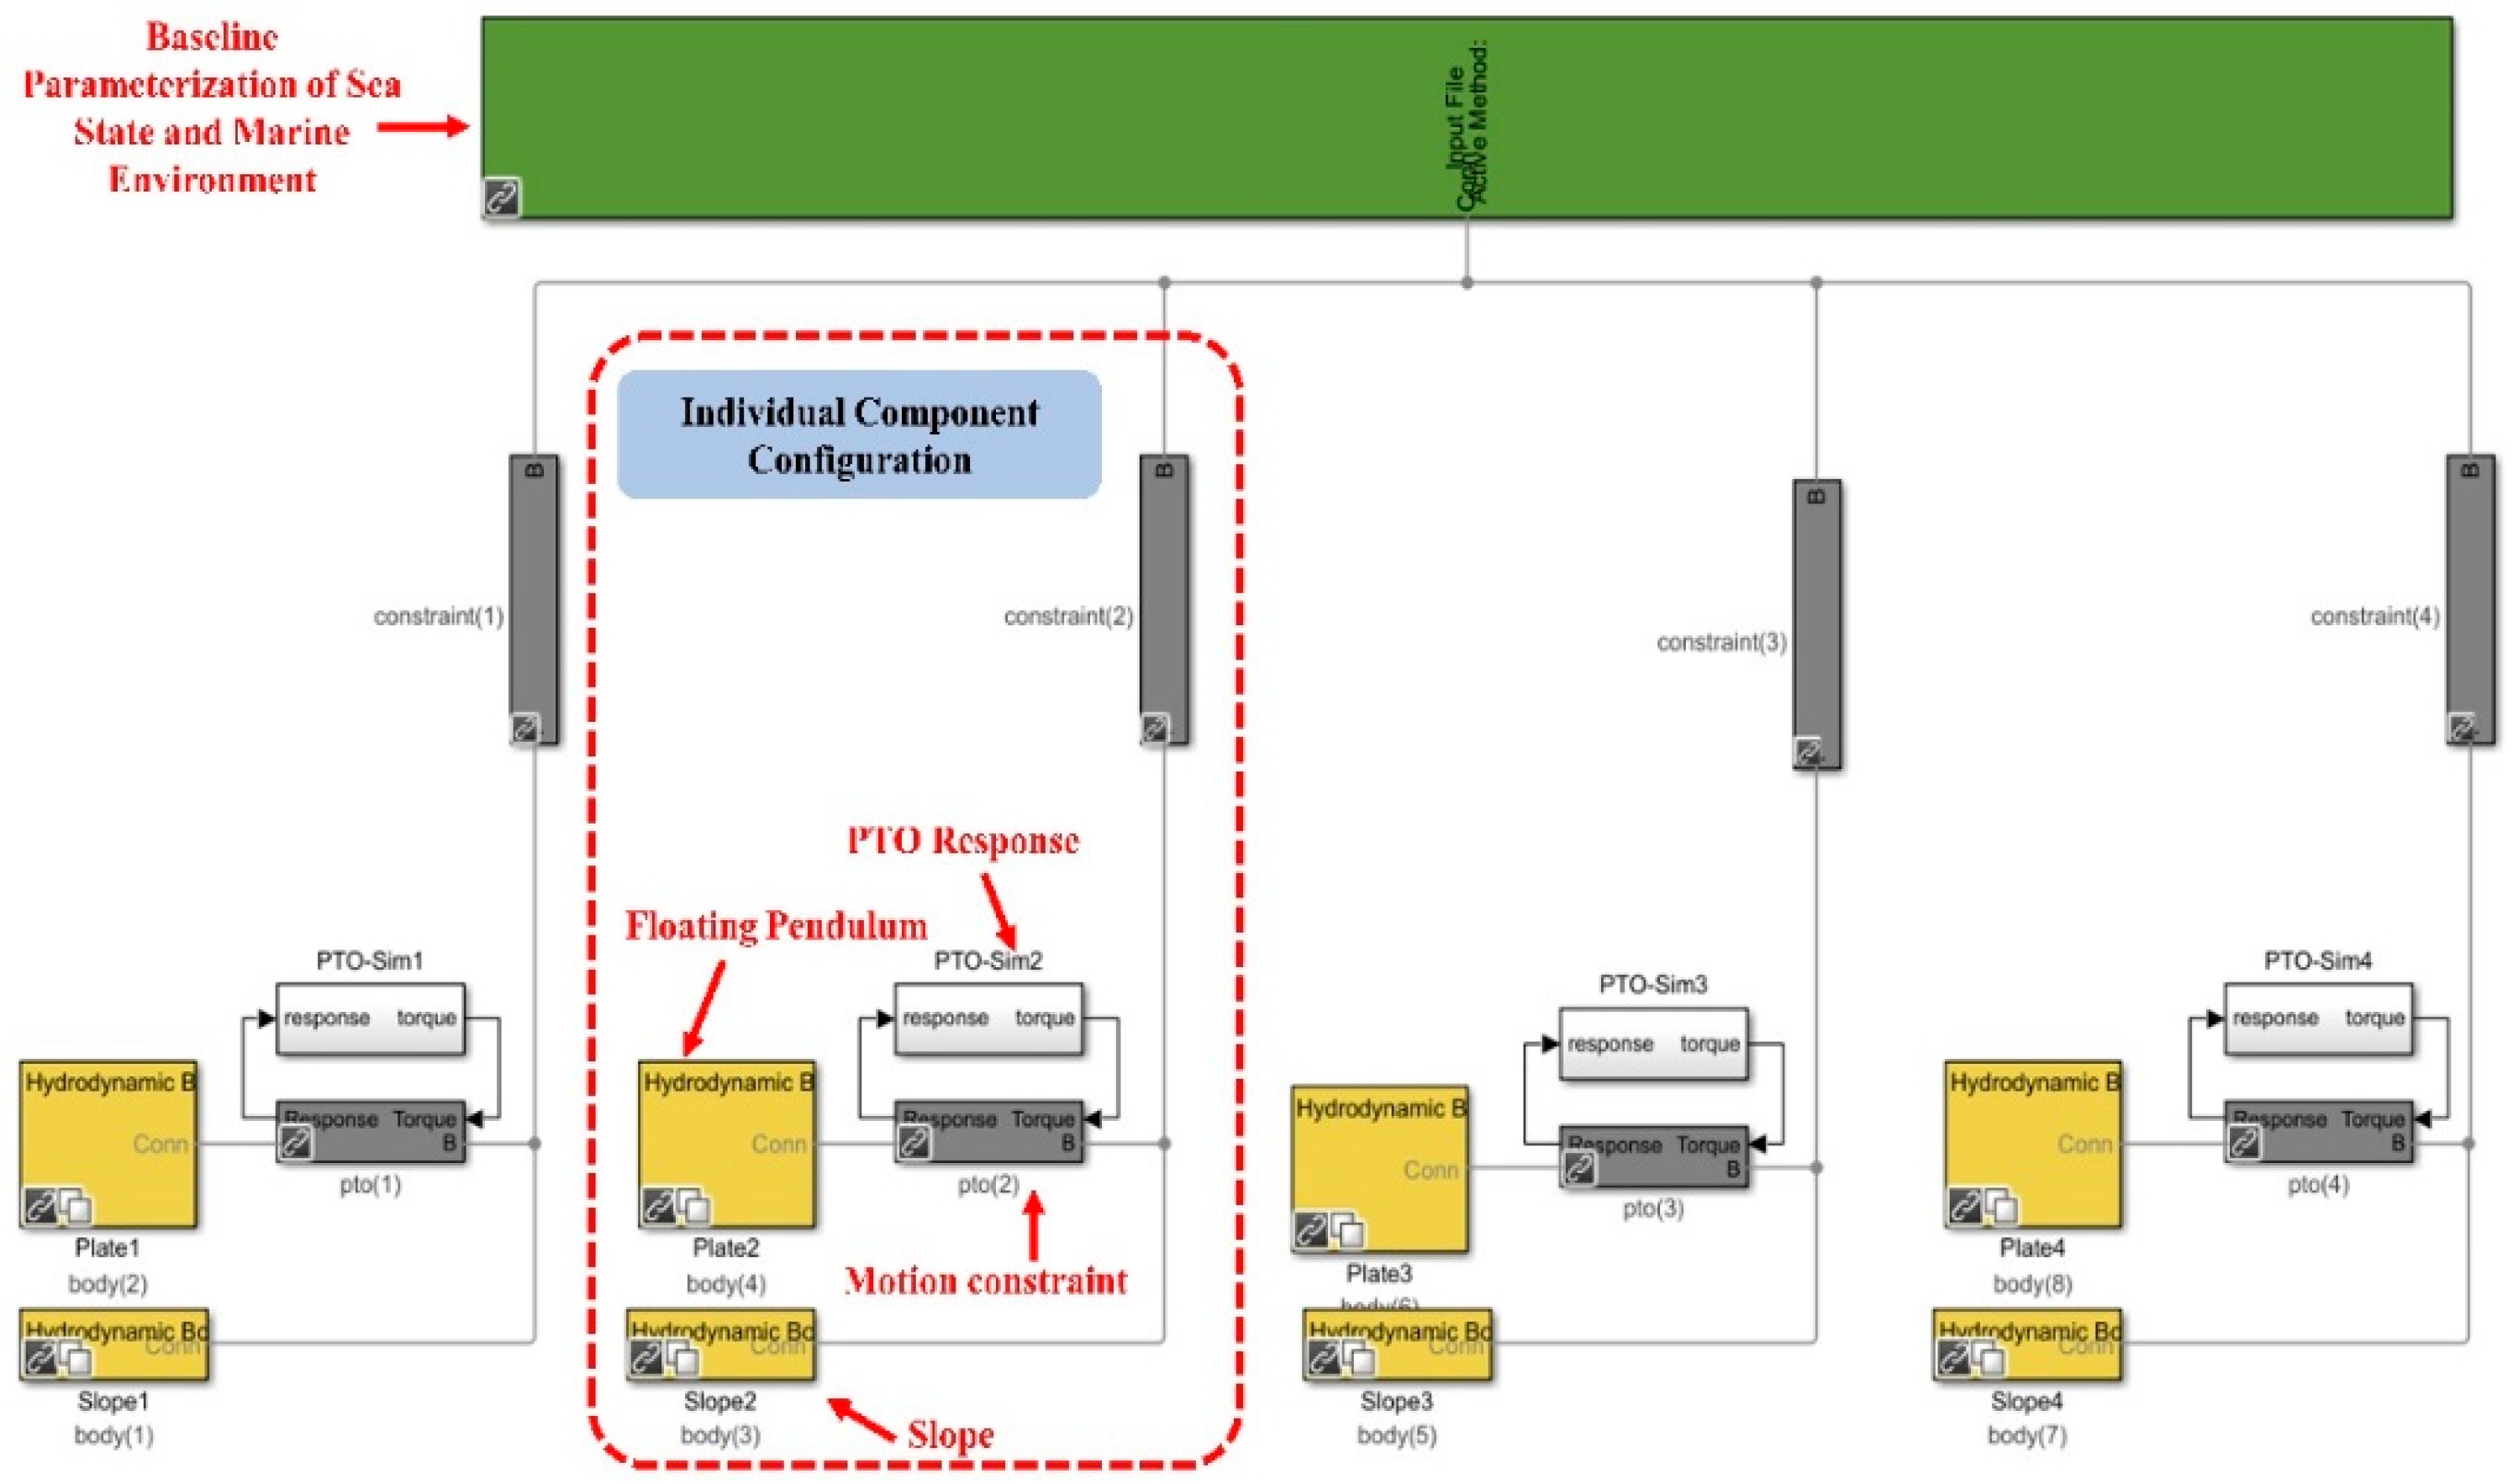
3.2.2. Simulation Platform for Arrayed S-PWEC

The array-type S-PWEC simulation platform was developed using the WEC-Sim program. The hydrodynamic coefficients of the S-PWEC were obtained using the Boundary Element Method (BEM) in the ANSYS AQWA hydrodynamic software in the prepared stage. These coefficients were then imported into the WEC-Sim platform as fundamental input parameters. The main sea conditions analyzed in Section 3.1 are used to determine the wave environment conditions for the time-domain calculations of the array-type S-PWEC.
A constrained WEC-Sim model was used in the simulation to represent the experimental conditions, since determining certain device parameters requires us to constrain the available degrees of freedom and range of motion. In this study, four individual units are arranged in an array configuration, as shown in Figure 5. The Global Reference Frame from the WEC-Sim library serves as the reference system for the marine environment. The pendulum and slope (yellow module, Hydrodynamic Body) act as hydrodynamic bodies, while motion constraints (grey module, Constraint) are applied to restrict the movement of the pitching float and the entire device, ensuring the validity of their dynamic responses. The motion of the pendulum is transmitted to the PTO-Sim hydraulic response module (the white module, Response-torque), the mechanical energy is converted into hydraulic energy by the hydraulic module, and then the electric energy is output [27]. The motion constraints are applied to the entire module to simulate the process of capturing and converting wave energy into an electrical energy output.

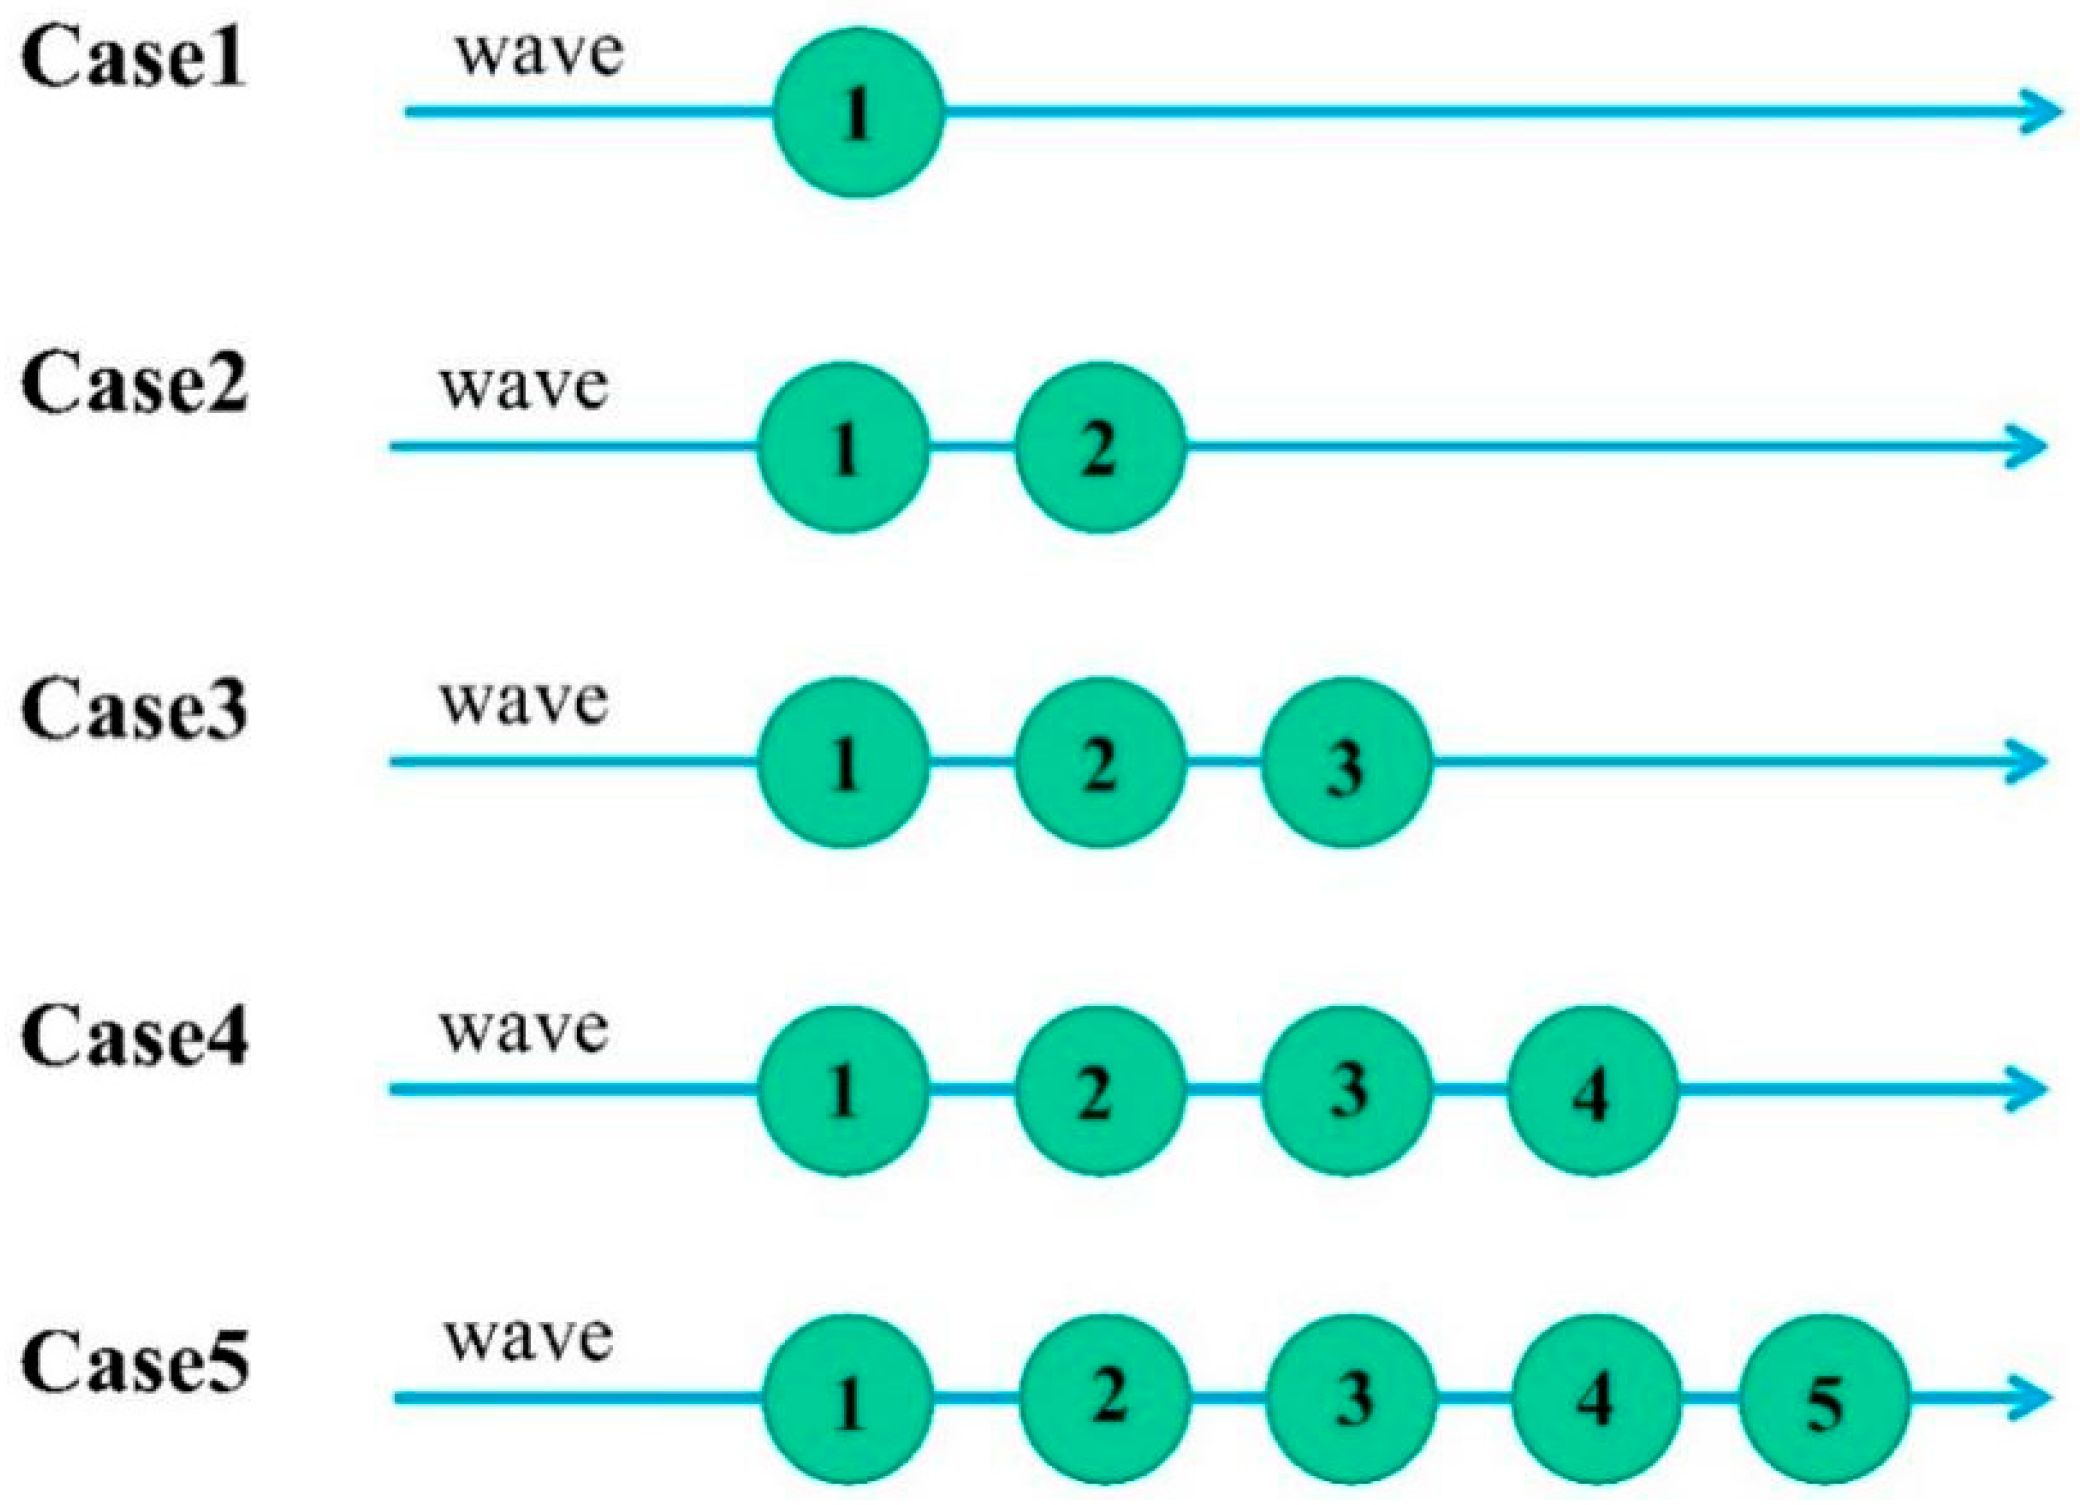
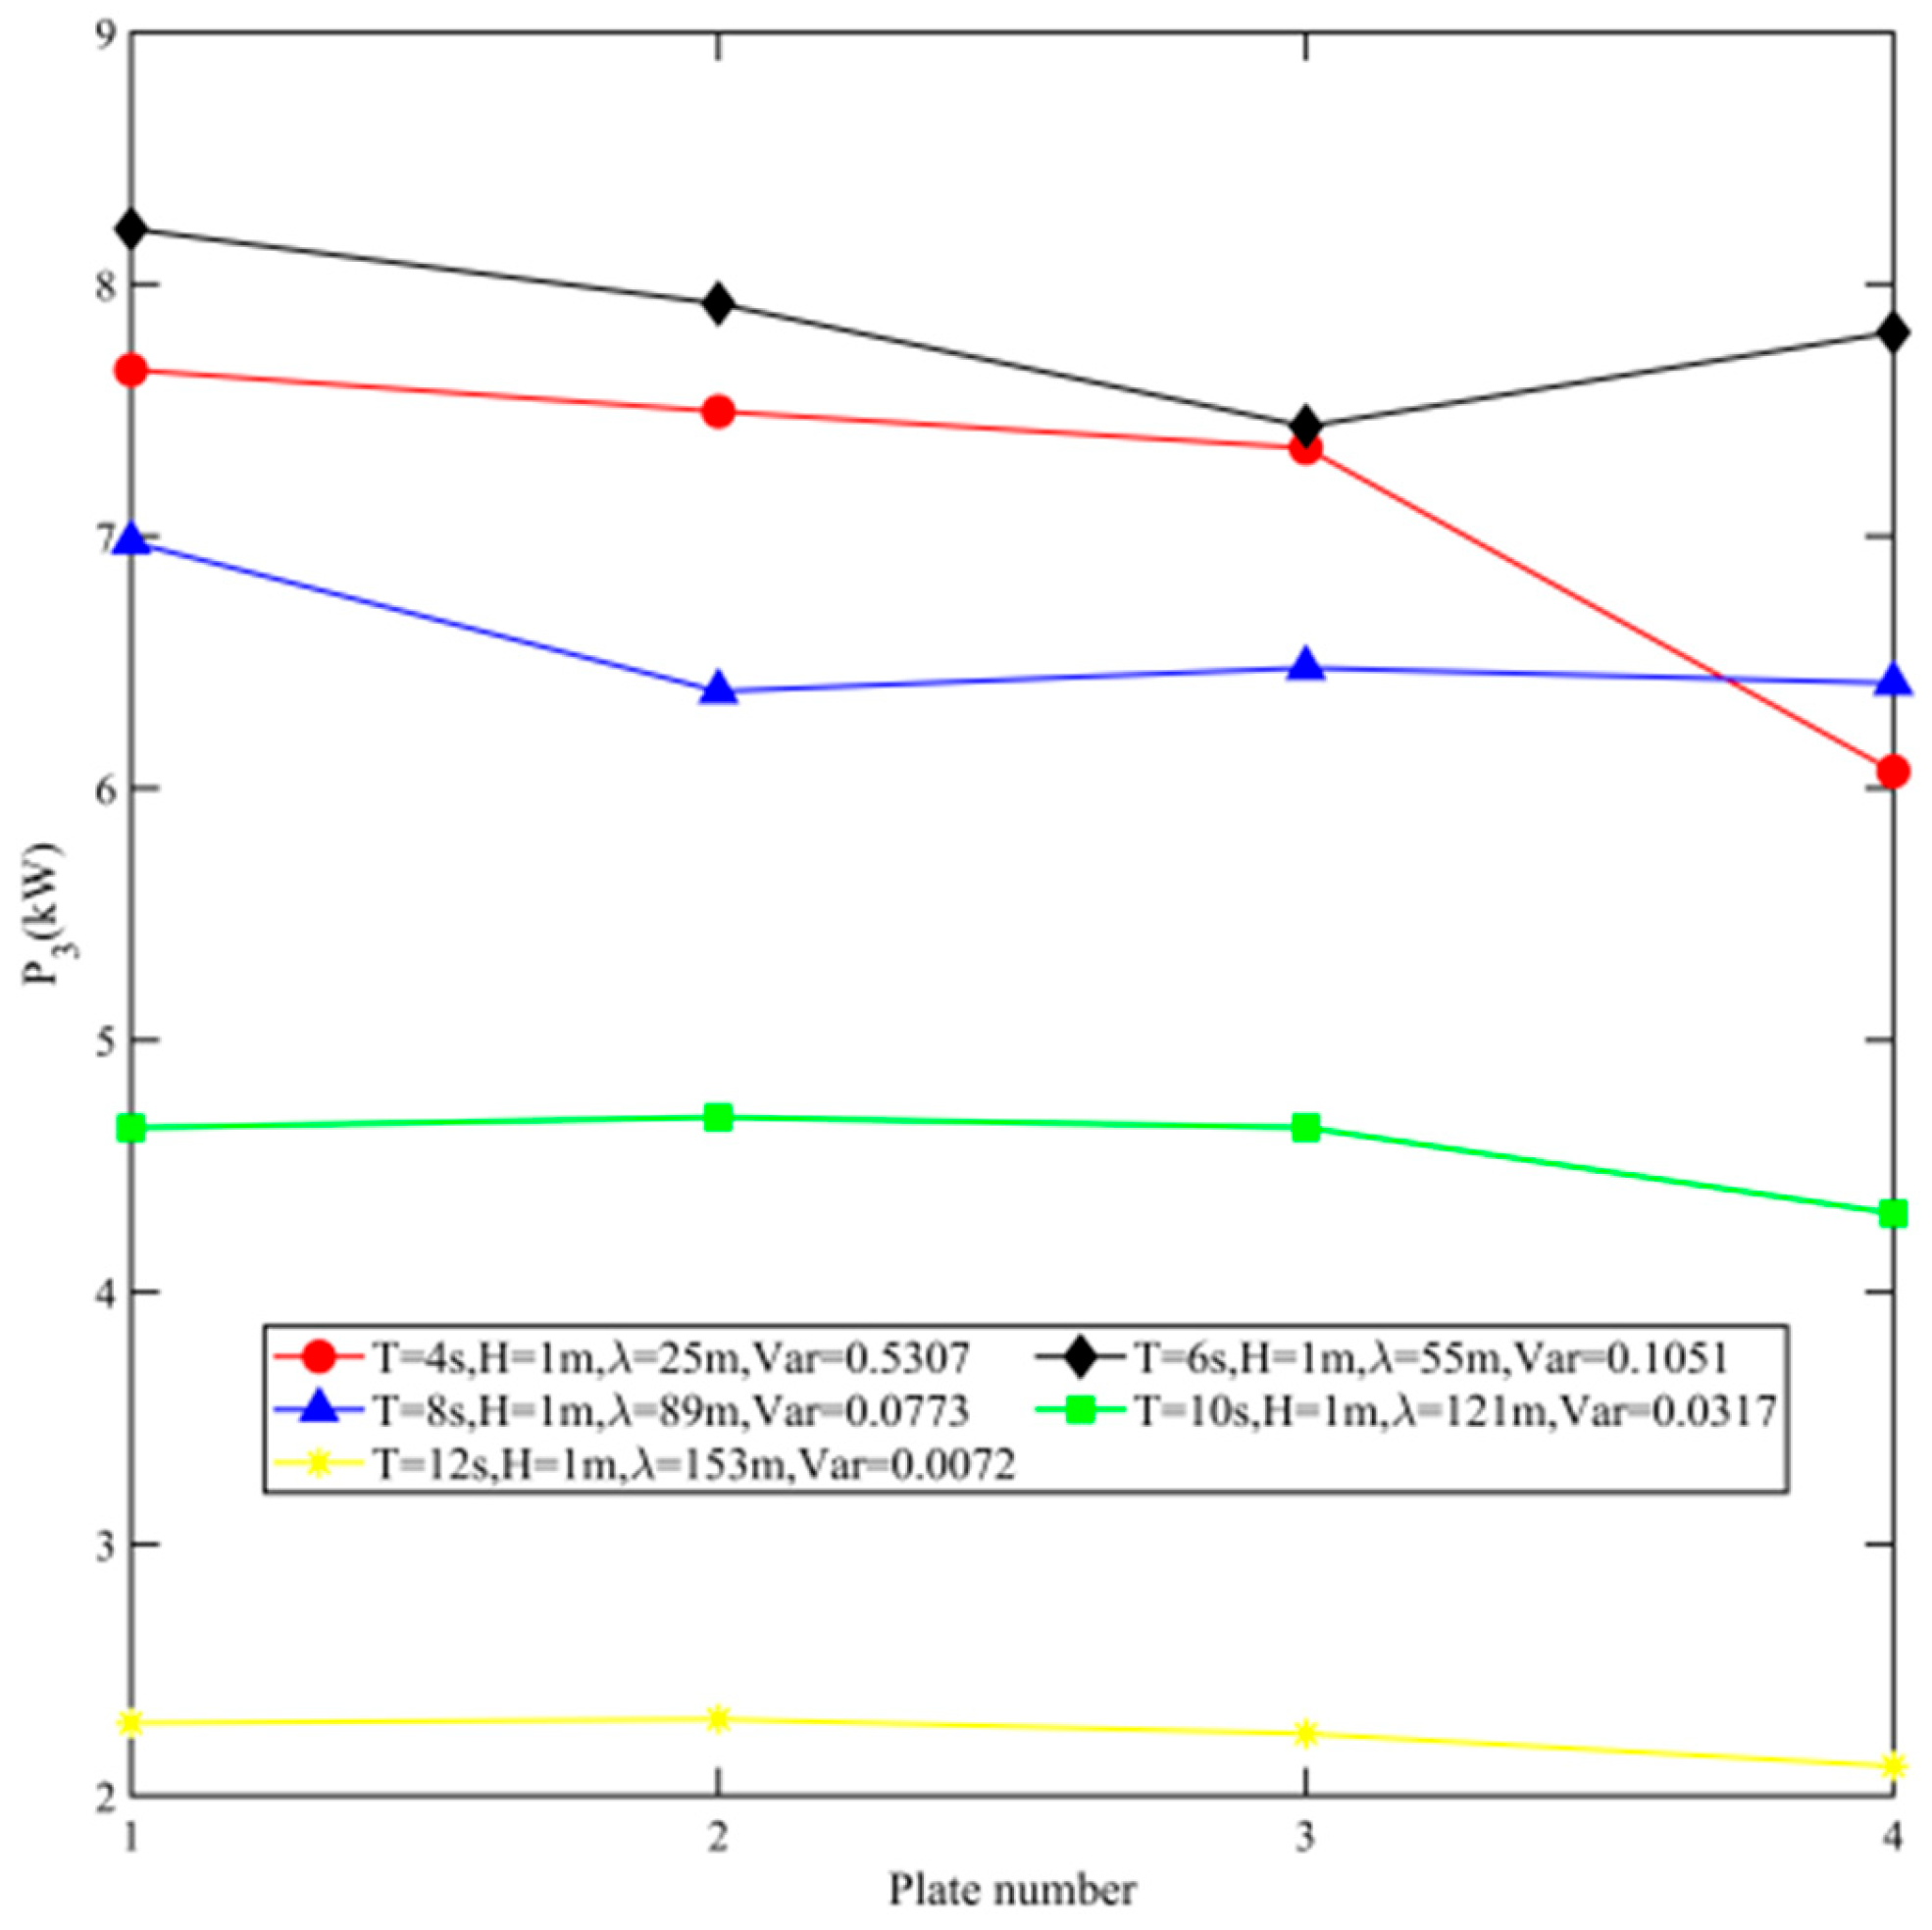
3.3. The Effect of Array Scale on System Output Characteristics

As shown in Figure 6, the number of devices on the array characteristics of the power generation are studied in the direction of the incoming wave, with the number of power generation devices arranged in different working conditions. The spacing distance between two neighboring S-PWECs is set to 8 m. Figure 7 shows the numerical results for the wave period of 5 s and wave height of 1 m.
As shown in Figure 7a, the performance of S-PWECs varies depending on the number of devices in the array configuration. As the number of devices increases, the wave excitation moment acting on the first S-PWEC’s welcoming wave gradually decreases. This phenomenon has a positive impact in terms of the long-term use and fatigue resistance of the device, indicating that the array layout of the S-PWECs affects the wave excitation moment of the pendulum.
As shown in Figure 7b, two adjacent S-PWECs in the proposed array configuration will directly affect each other’s power generation performance. Under the tested spacing arrangement, the array impact factors are all greater than one. In addition, the hydrodynamic performance shows a phase growth trend, which improves wave energy capture and electrical energy output efficiency.
In summary, the array configuration exerts varying degrees of influence on the power generation performance of individual wave energy conversion devices. Due to hydrodynamic interactions, including scattering and radiation effects, each wave energy conversion unit in the array experiences scattering and radiation forces from the other units. The position and motion of the units within the wave field can strongly affect the intensity and structure of the scattered and radiated waves from the wave energy conversion devices, which in turn affects the interactions between the S-PWECs. Further research is required to determine whether there is a specific quantitative relationship between the array layout and the motion response of the wave energy conversion devices.

3.4. Power Generation Characterization of Linear Vertical Arrayed S-PWECs

As described in Section 3.2, the array configuration involves arranging four S-PWECs with a linear vertical spacing of 8 m. A series of wave energy capture efficiency tests are conducted under different sea conditions.
In Figure 8a, the power generation profile of a vertical row of array units in different periodic sea states follows the same trend as the power generation characteristic profile of an individual unit. This shows that the interaction between the power generation units in the array does not change the peak position of the total power captured from the waves. This provides theoretical support for computational studies of the relationship between interaction among a large number of wave energy generators and overall performance, reducing the workload for subsequent array wave energy generators in practical engineering applications.
In Figure 8b, the array impact factor of the vertically arrayed S-PWECs fluctuates more in short-period wave sea states and less in long-period wave sea states. This is because the wavelength increases significantly as the period increases, indicating that long waves have a greater ability to penetrate and diffract through the first wave energy generator to encounter the wave, bypassing the generator behind it. Therefore, under long-wave conditions, the interaction between the wave energy generators in the vertical array has less influence, and the array influence factor approaches one.
However, it is also worth noting that the wave period at peak power with the linear vertical array row is not the same as the wave period at peak power achieved by a single S-PWEC, suggesting that the sea state at the resonance period is not the peak power sea state of the wave energy generator with the linear vertical array.

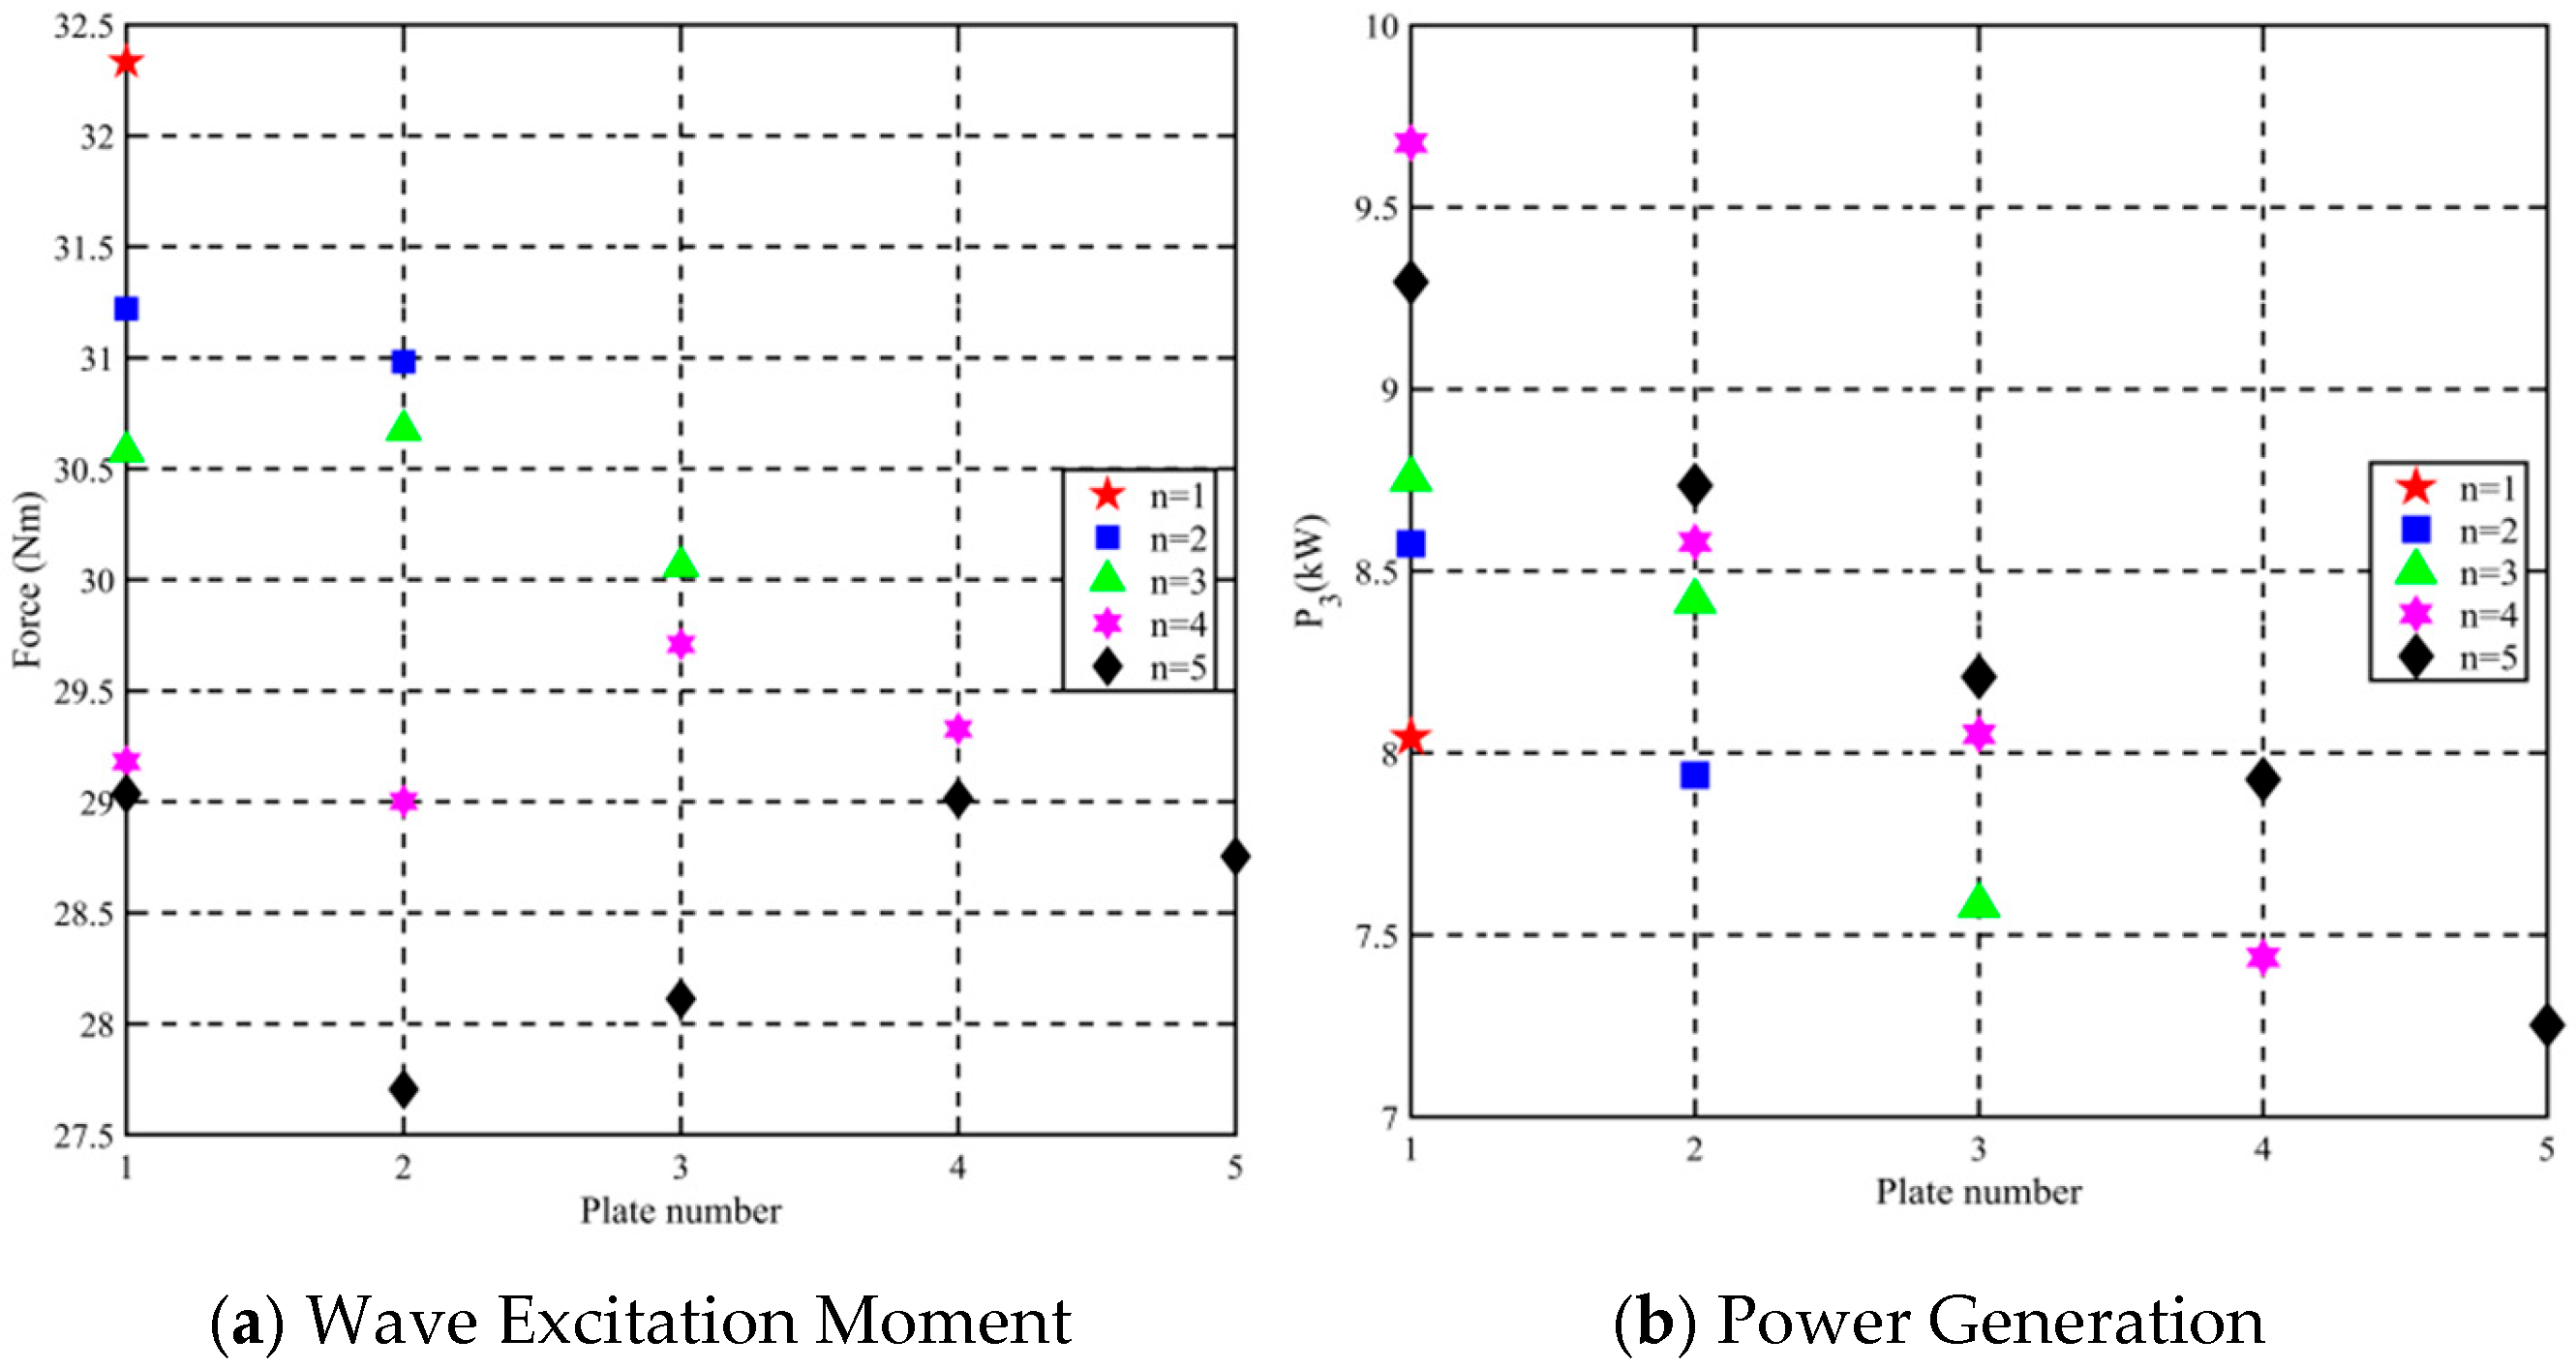
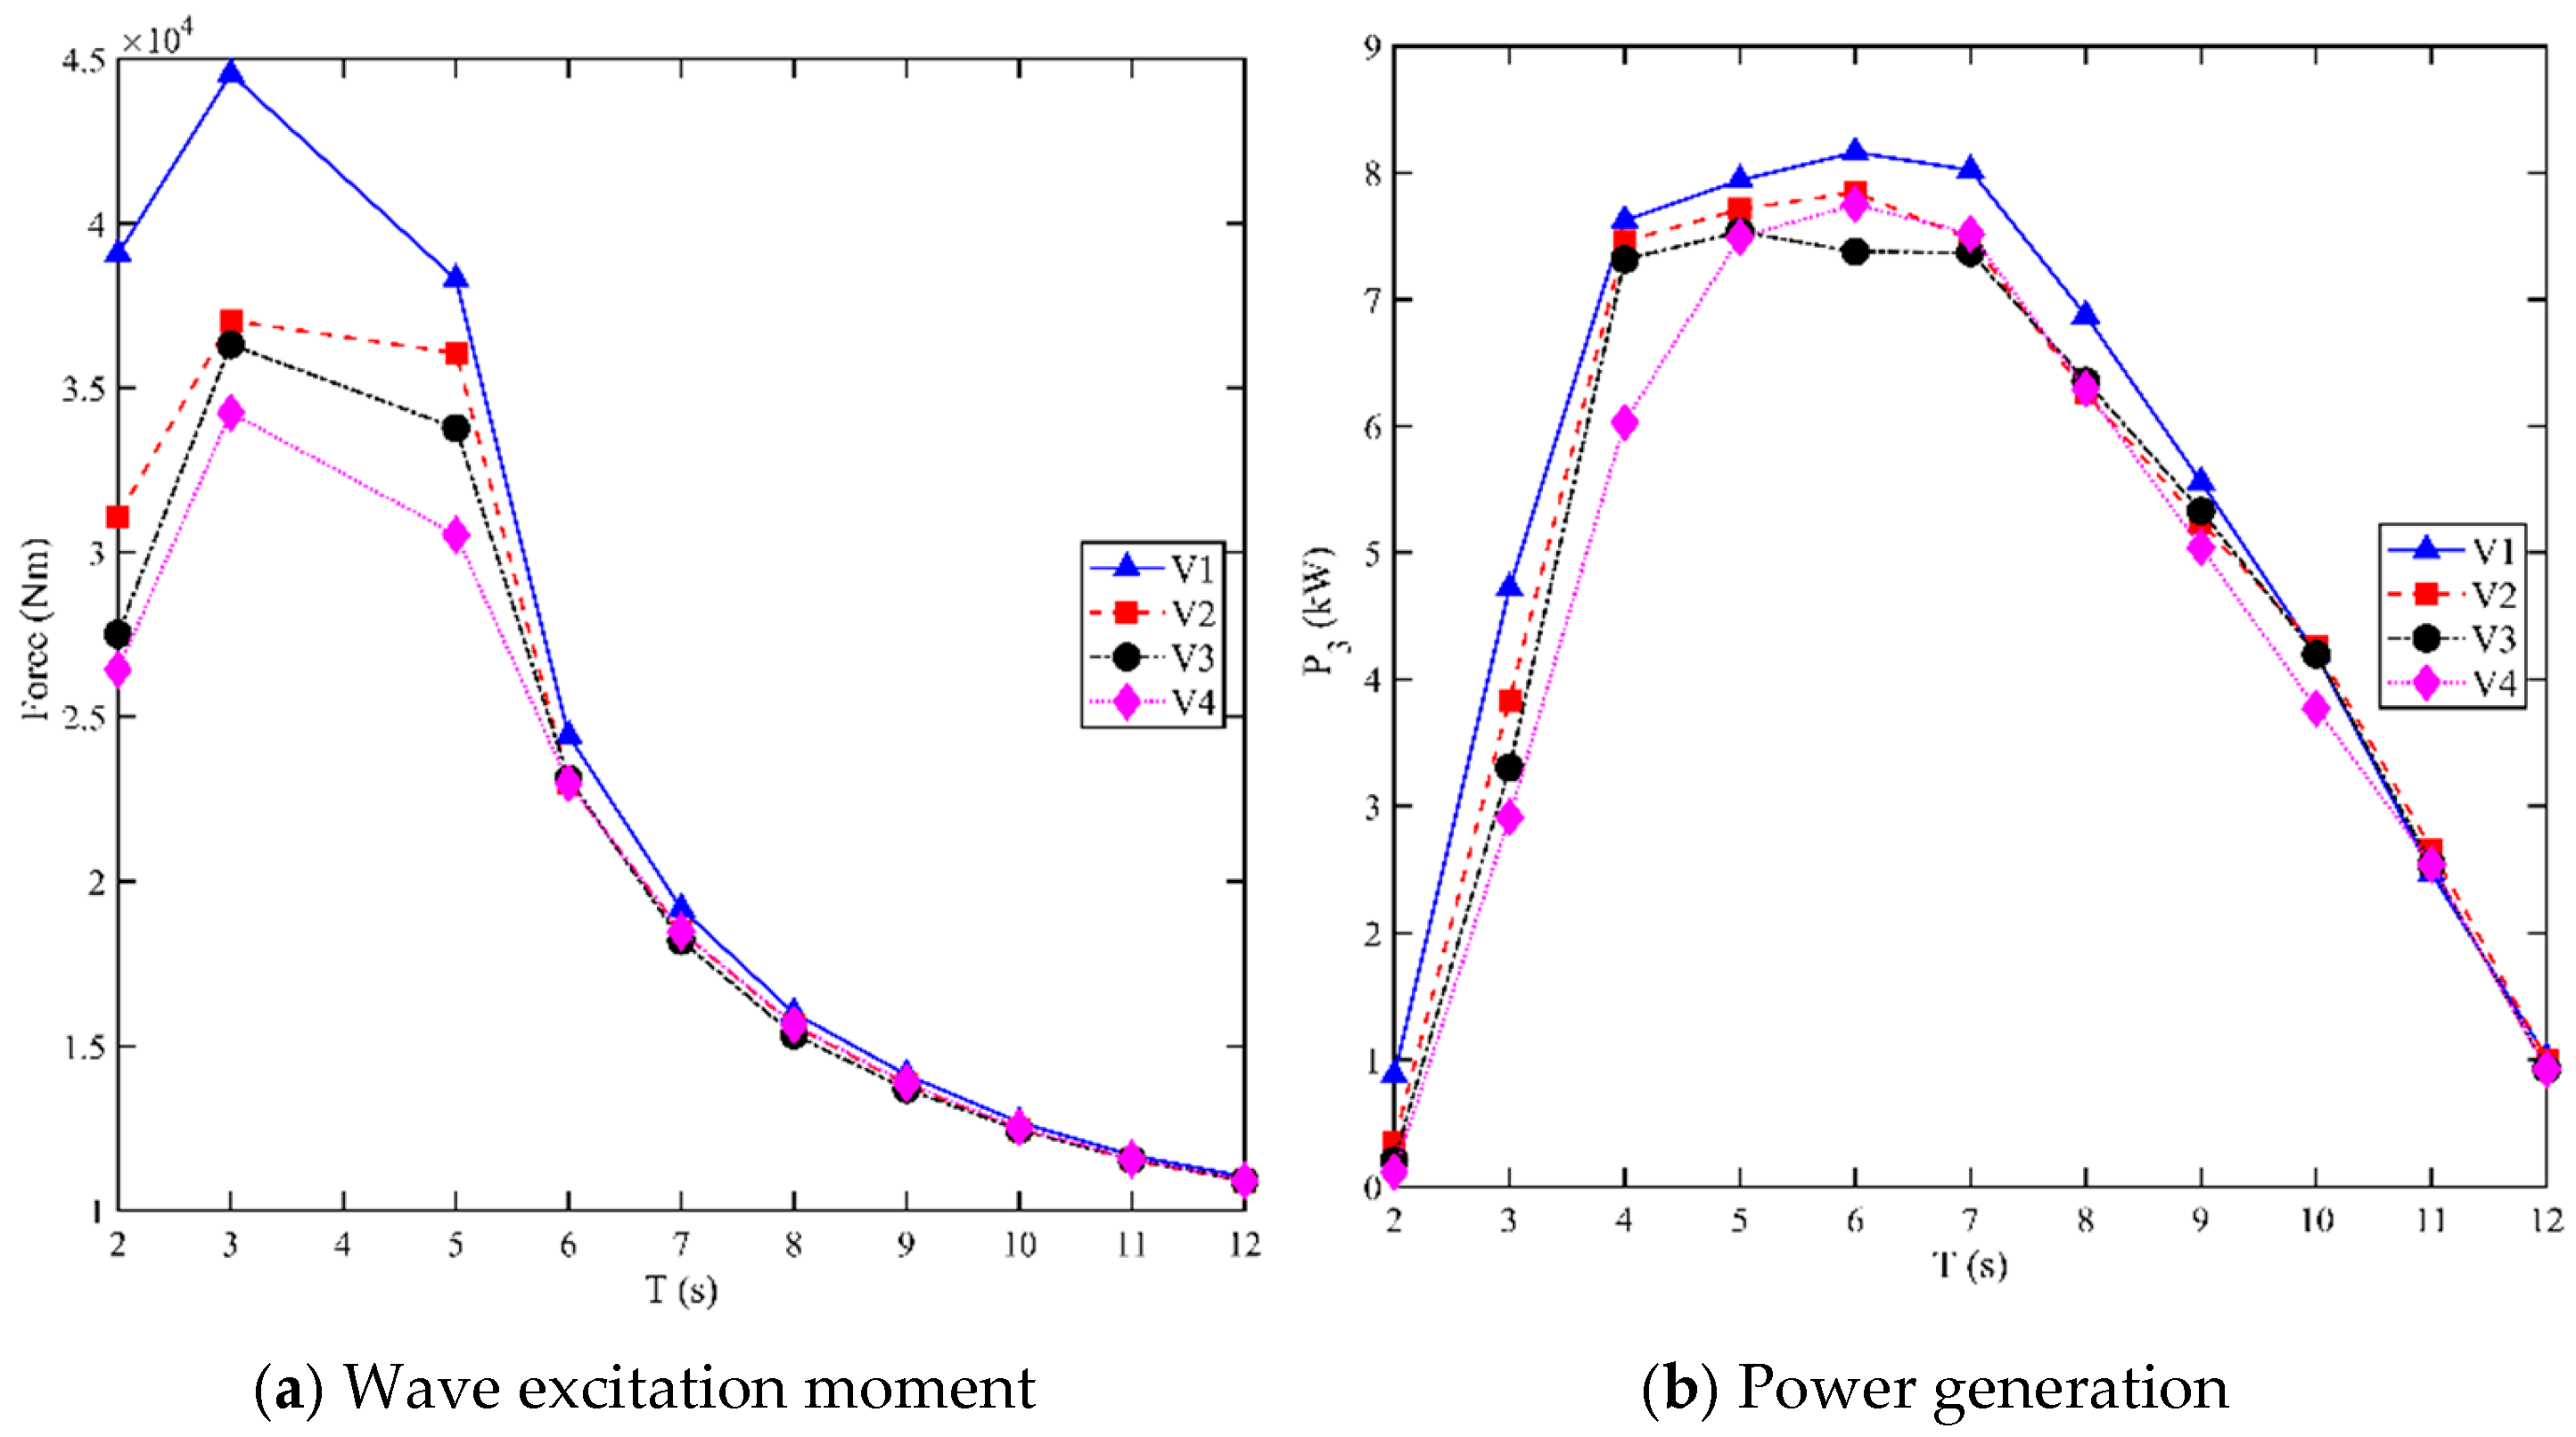
3.5. Characterization of S-PWEC Power Generation by Individuals in an Array

The hydrodynamic performance and electrical energy output of S-PWECs at different locations varied in the above wave capture simulations, and the specific results are shown in Figure 9.
Figure 9a shows the results of the excitation moments applied to the floating pendulum of the four S-PWECs. The results demonstrate that the forces acting on the power generators vary depending on their location, particularly in short-period wave conditions. The excitation moment of pendulum V1 is greater than that of V4; the first pendulum is subjected directly to wave action, whereas the wave action on subsequent floating pendulums is weakened due to the shadowing effect of the device array arrangement.
Figure 9b shows the S-PWEC’s output power results at different locations, which are consistent with the overall power generation curve’s trend. Therefore, the S-PWEC under an array arrangement behaves similarly to a stand-alone wave energy generator, and an optimal wave period exists for generating power under different state cycles. As the wave period increases, the power generated by the four S-PWECs approaches that of the stand-alone wave energy generator, and the variance decreases, indicating reduced interaction between the devices. This is favorable for stable wave energy conversion and output, but the output power is reduced massively (see Figure 10).

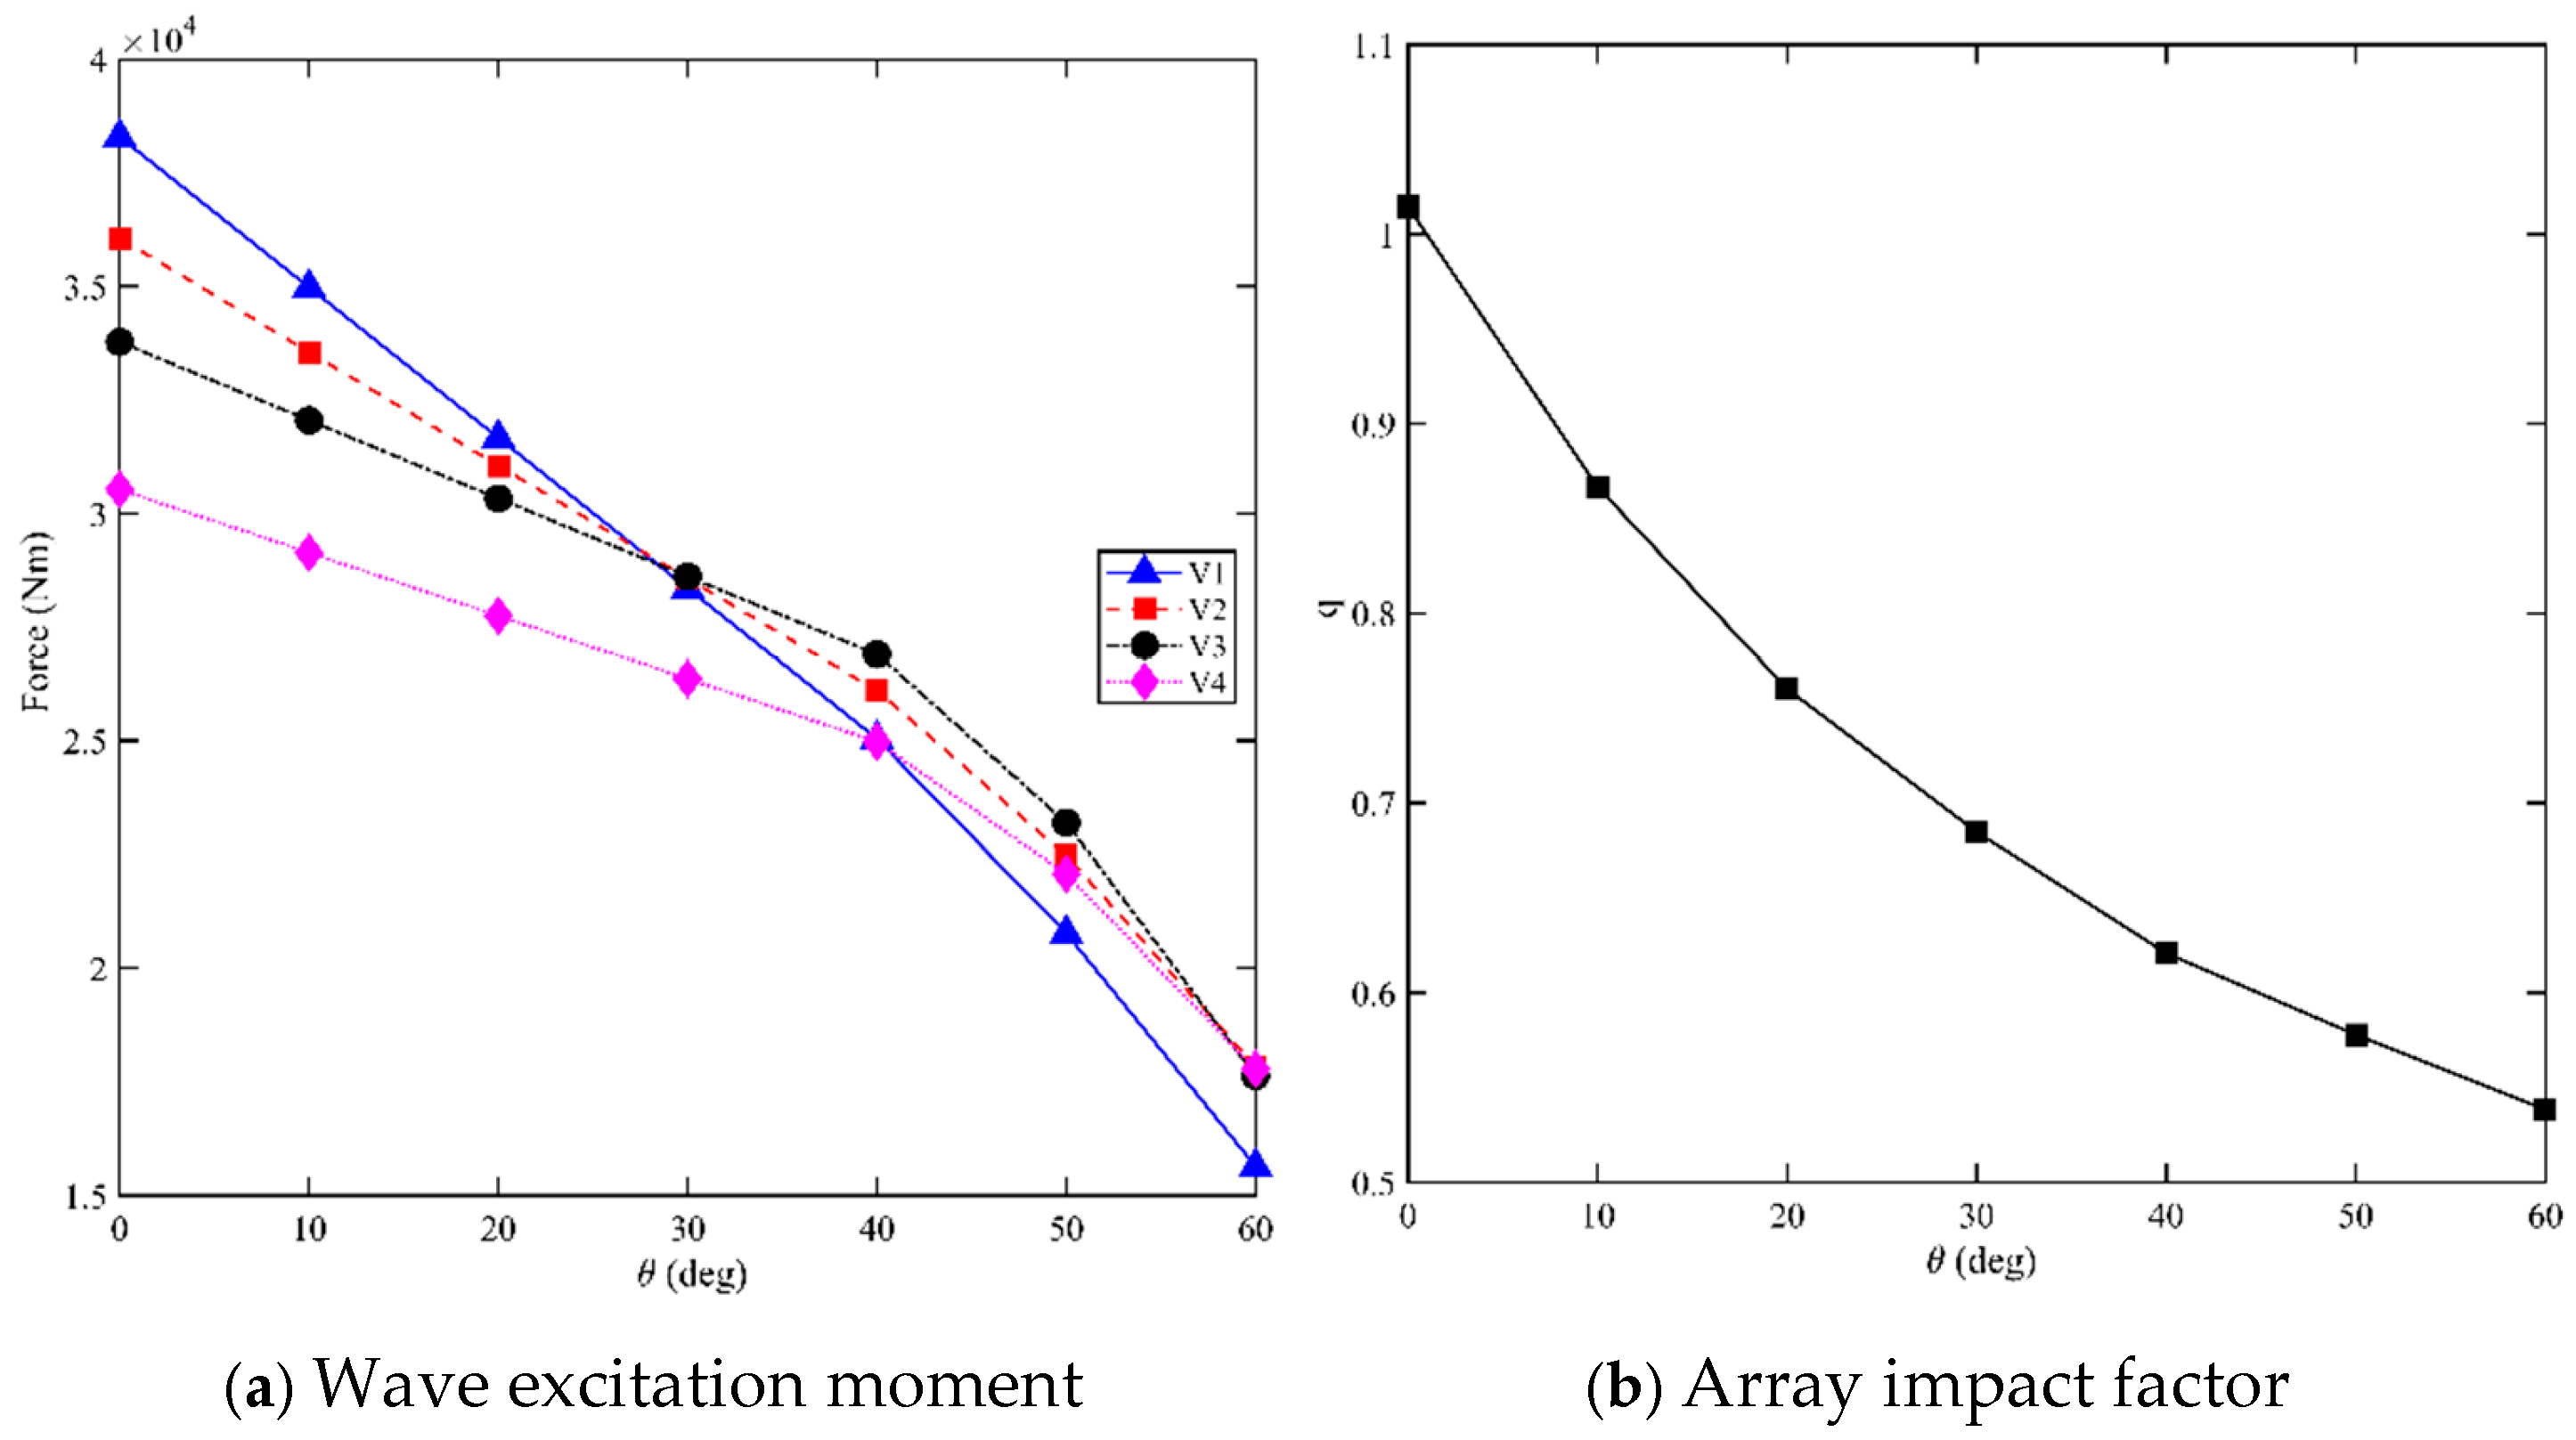
3.6. Effect of Wave Incidence Angle on Power Generation Characteristics

To investigate the effect of different incident wave directions on the linear vertical array S-PWECs, seven sets of simulations were implemented using different incoming wave directions: 0°, 10°, 20°, 30°, 40°, 50° and 60°.
Under regular sea conditions, with waves having a period of 5 s and a height of 1 m, the direction of the incident wave significantly affects the hydrodynamic performance and power output of the S-PWECs in a linear vertical array. As shown in Figure 11a, the results demonstrate that, as the angle between the incident wave direction and the array increases, the wave excitation moments acting on all four S-PWECs decrease dramatically. This significantly weakens the hydrodynamic performance of the array device.
Figure 11b shows the array impact factor versus incoming wave directions. As the wave incidence angle increases, the array impact factor obviously weakens, indicating that the electrical energy output of the four S-PWECs is ineffective. This is primarily due to the unique structure of the S-PWEC device, which uses a floating pendulum and a slope to open and close. This method requires frontal impact of the incident wave to optimize wave energy capture.
The wave direction is not constant in actual sea conditions. Therefore, subsequent simulations should prioritize the circular array arrangement of S-PWECs, while the linear arrangement should be positioned near the shore or equipment such as breakwaters.

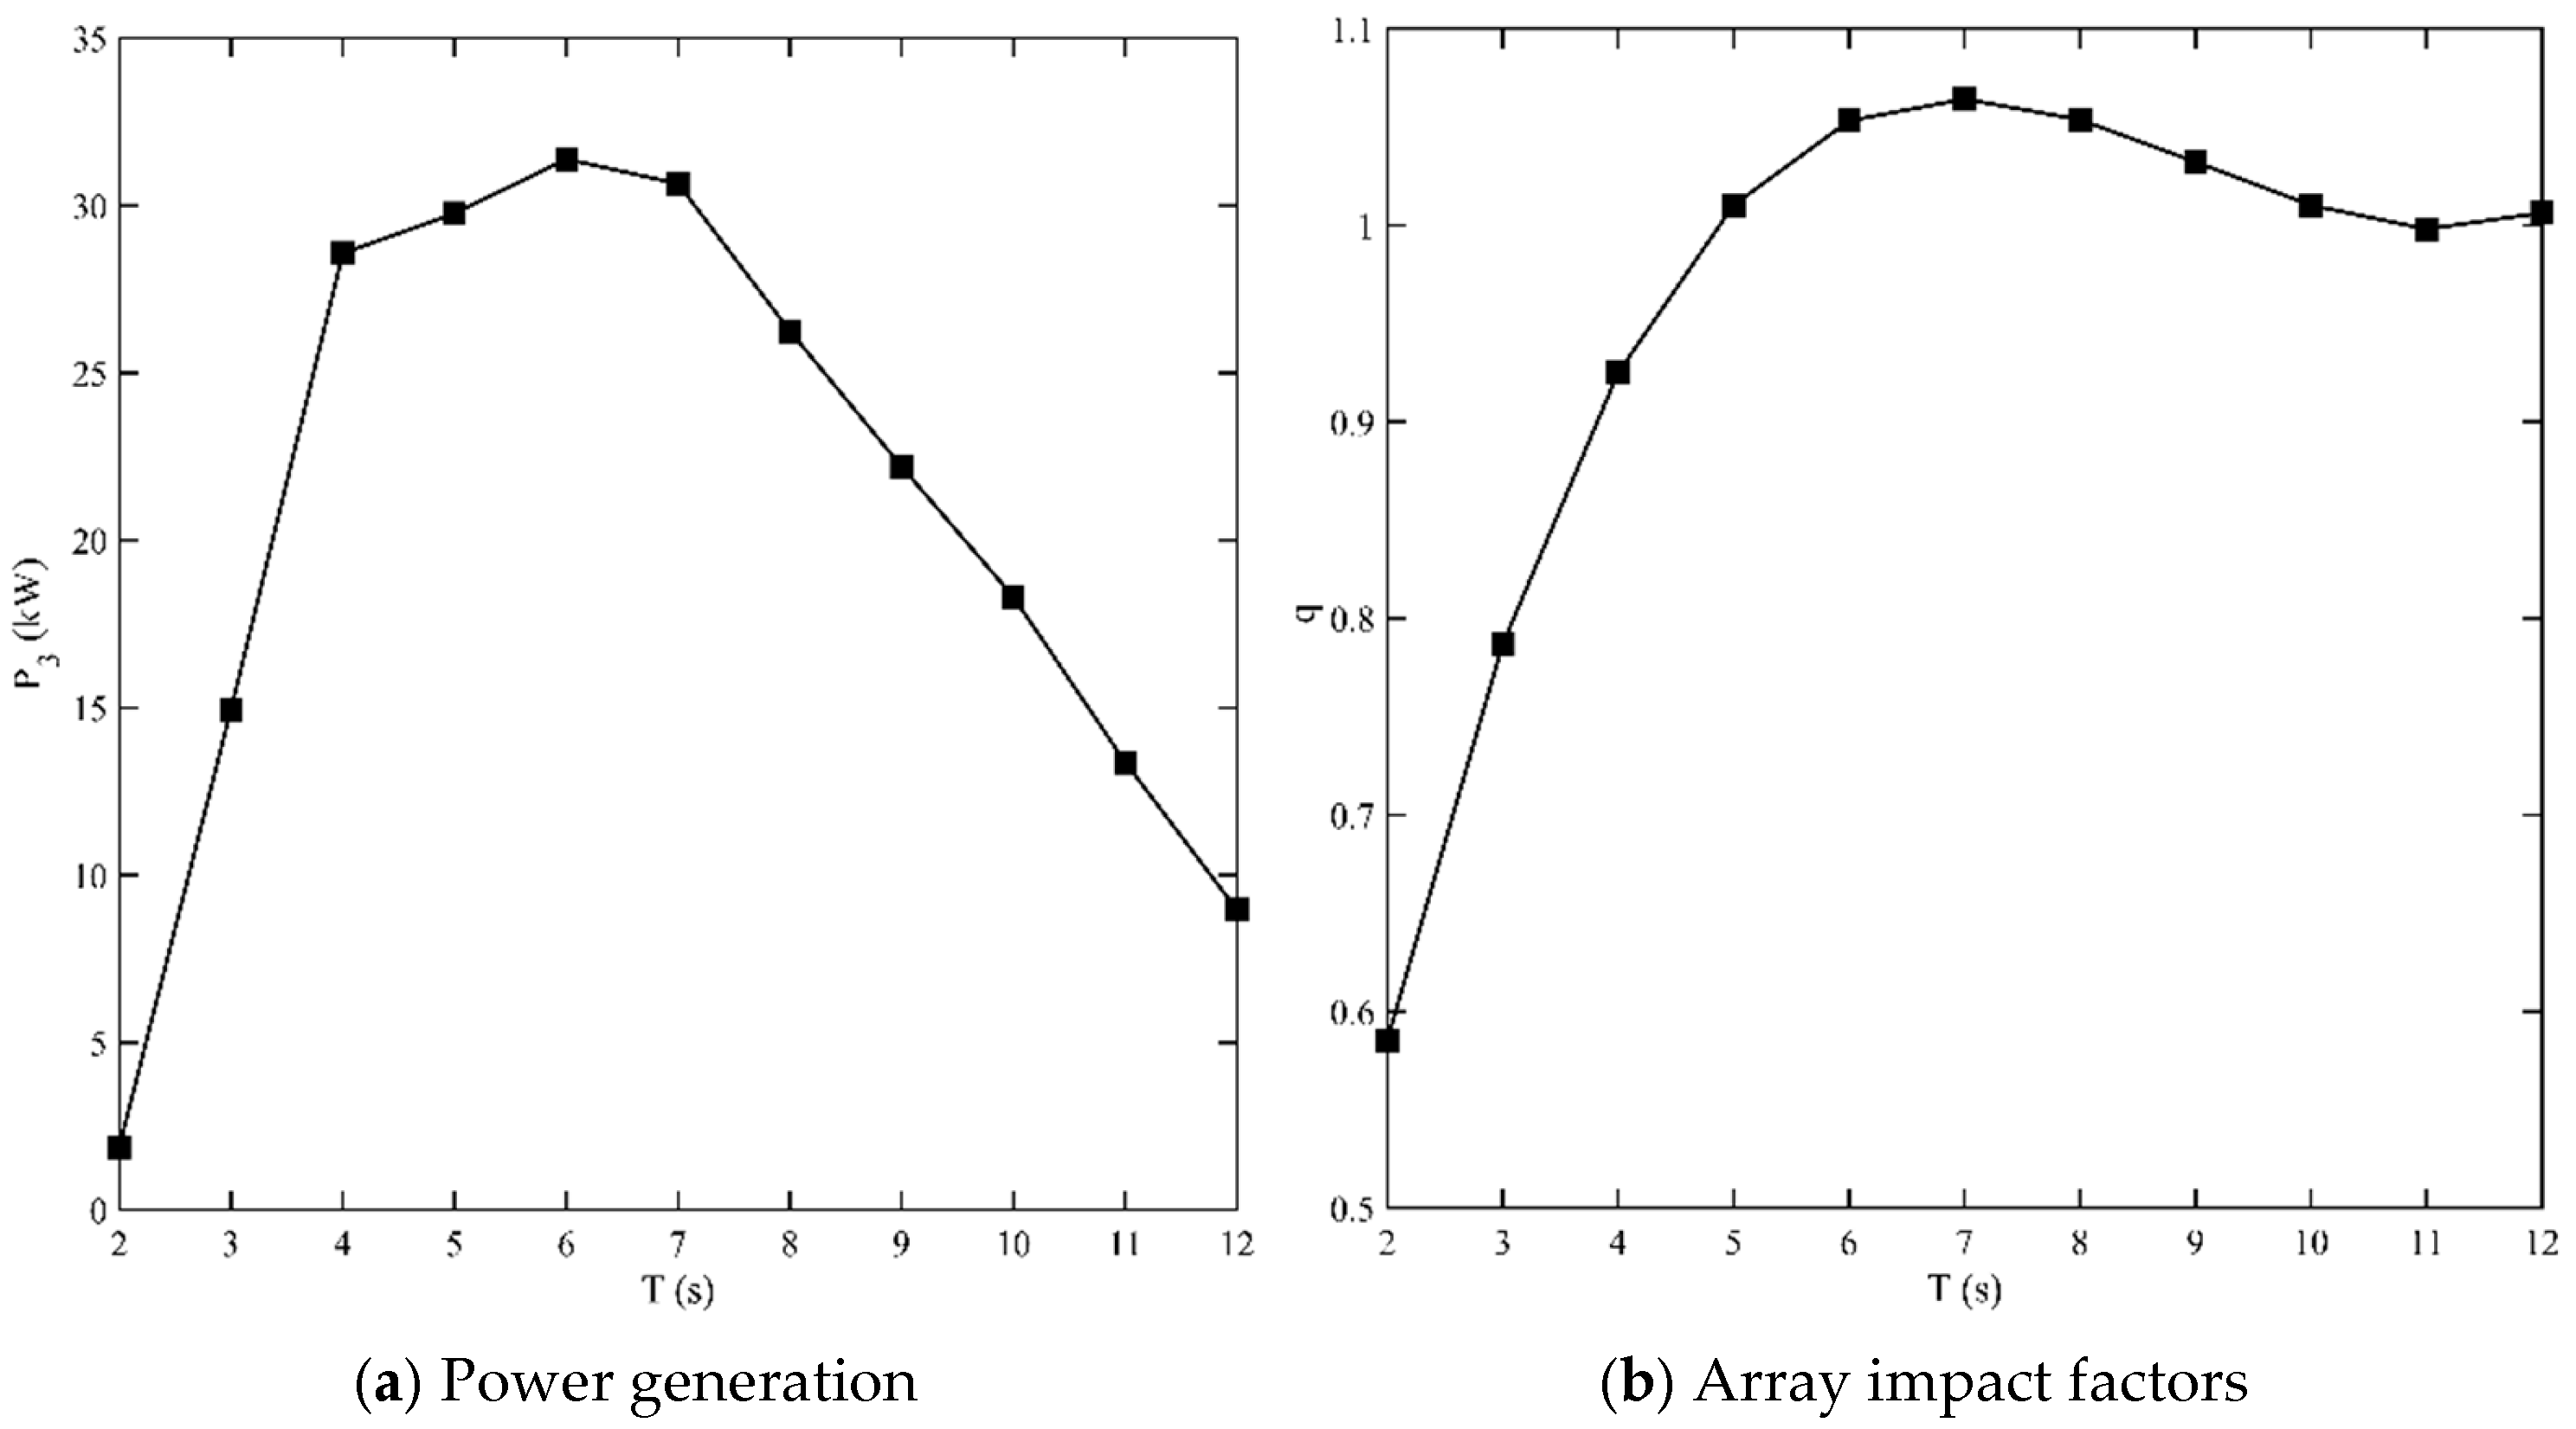
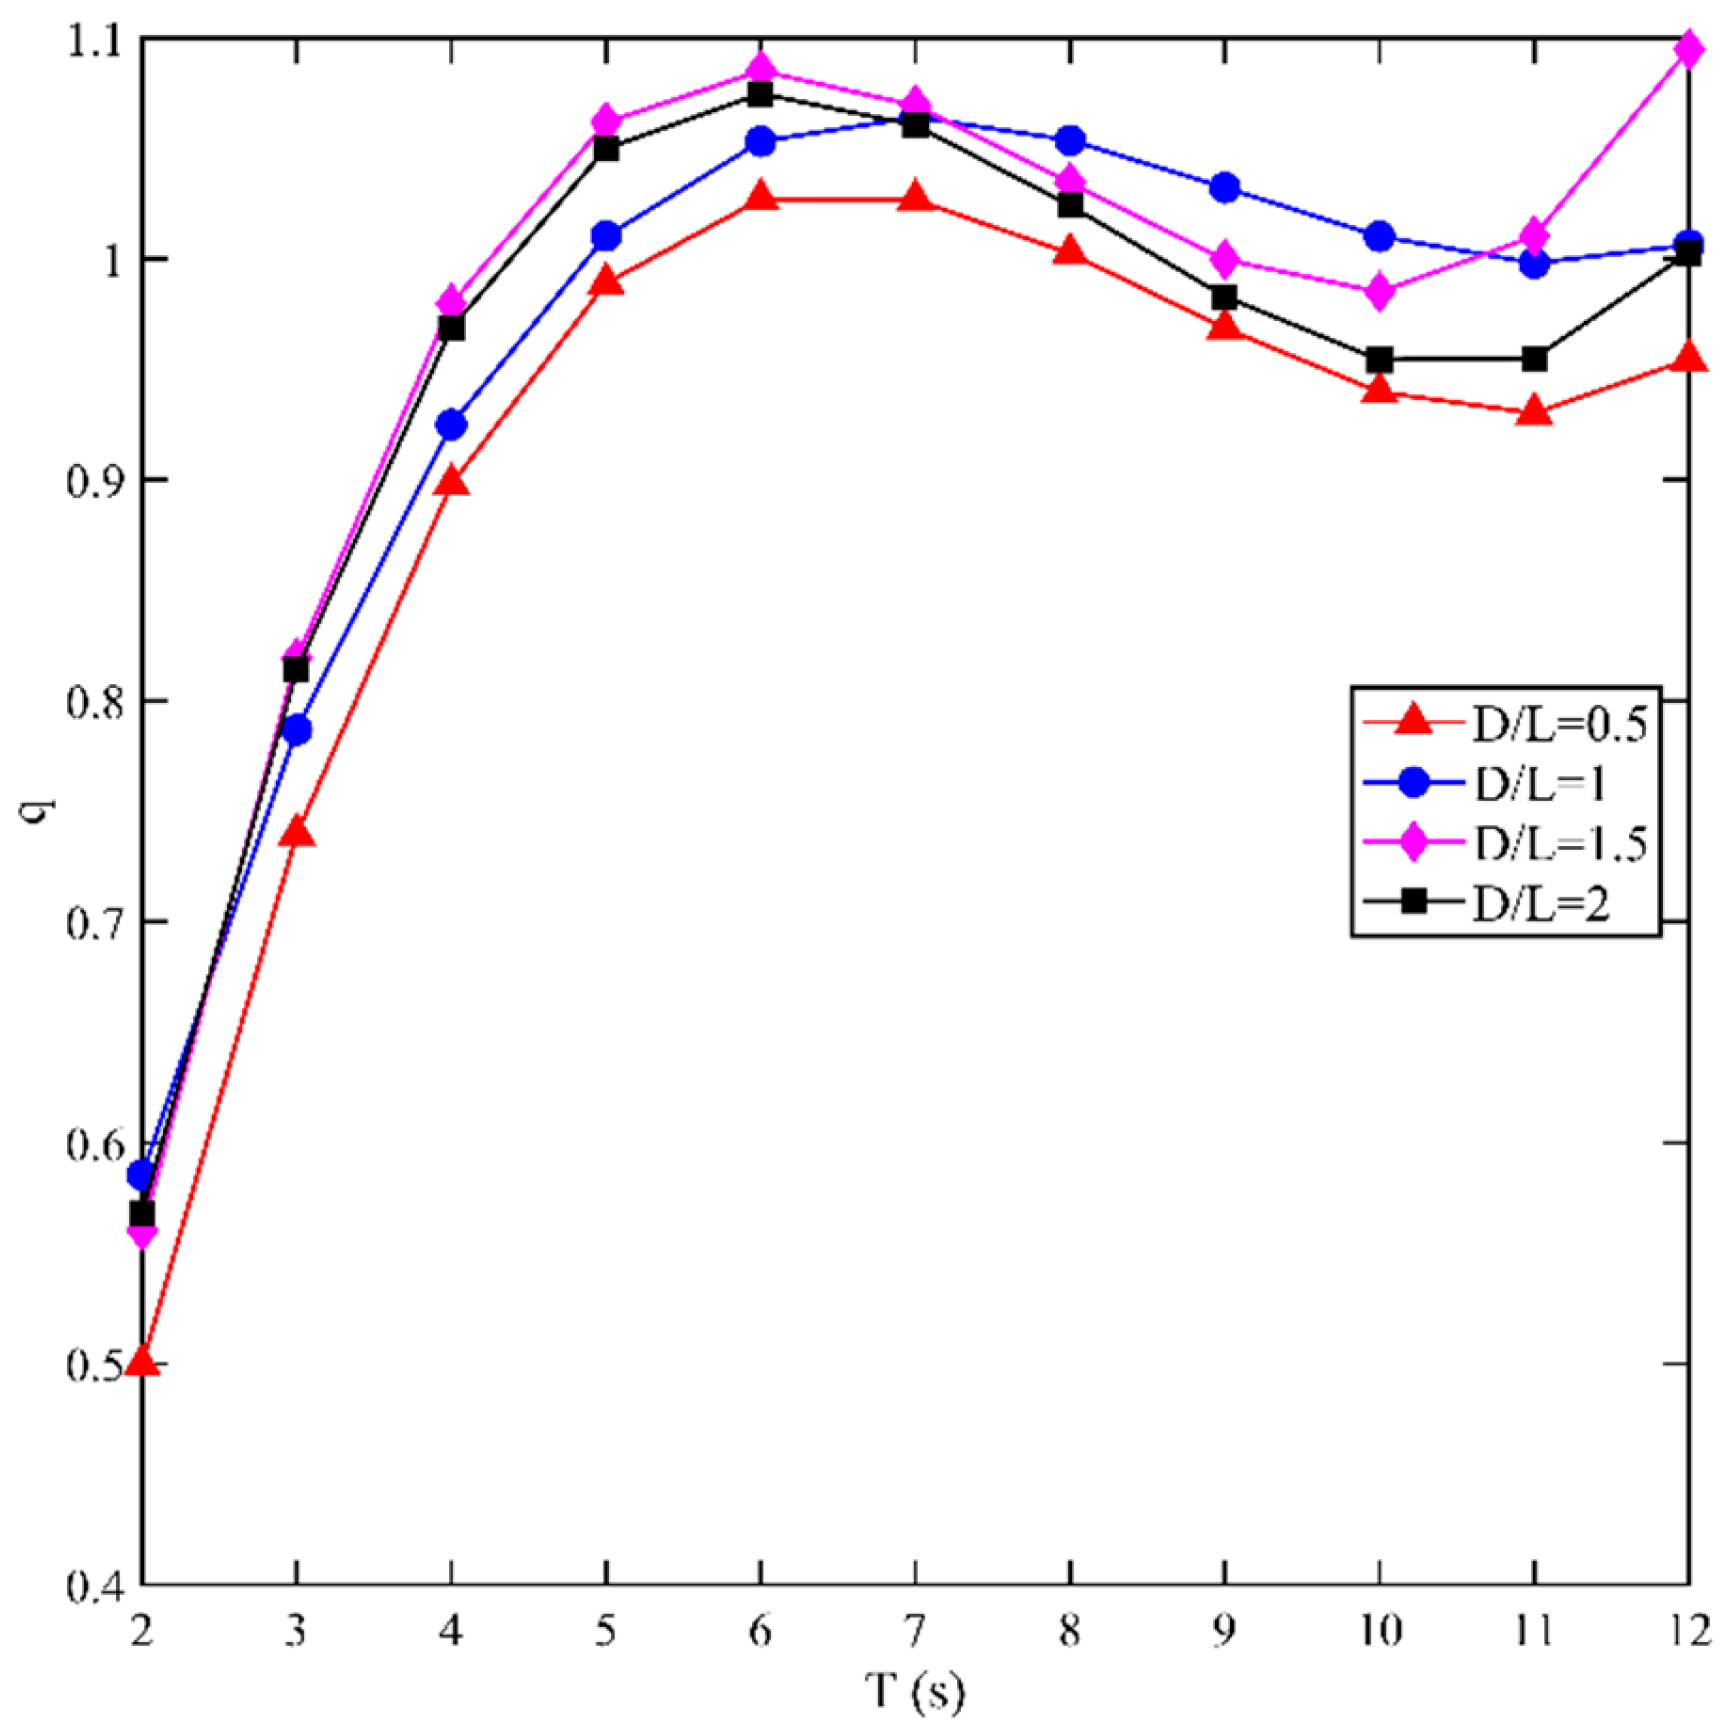
3.7. Influence of S-PWECs Array Spacing on System Power Generation Characteristics

To investigate the optimal spacing between the vertical array rows of S-PWECs, four sets of simulations were implemented with different spacing ratios: D/L = 0.5, D/L = 1, D/L = 1.5, D/L = 2.
Figure 12a shows the sum of the wave excitation moments received by the four S-PWECs. The excitation moments of the S-PWECs at different spacing ratios are affected to some extent. Under typical sea conditions with a wave period of 5 s and a wave height of 1 m, the vertical array configuration demonstrates an optimal spacing that maximizes the overall hydrodynamic performance of the device cluster, yielding the most favorable wave excitation moment response. This finding provides crucial theoretical guidance for the engineering optimization of S-PWEC arrays.
Figure 12b shows the power generation of each device at various spacing ratios. D denotes the distance from the aft end of the former device to the forward section of the latter device, and L is the pendulum length. The overall sum of power generation is highest when D/L = 1.5. This may balance the wave scattering and multi-body resonance between the devices, maximizing the absorption and conversion of wave energy at this spacing.
The power generation output of the S-PWEC linear vertical array layout varies with spacing. When the spacing between two S-PWECs is too small, the overall electrical output of the array is adversely affected, although the hydrodynamic performance of the middle and tail-end devices is enhanced.
In Figure 13, the D/L spacing ratio of 1.5 is optimal for vertical line array wave energy conversion under short-period wave conditions, while a ratio of 1 is more favorable for wave energy conversion under long-period wave conditions. Therefore, for main sea states with shorter wave periods, it is recommended to increase the spacing between S-PWECs, while for sea states with longer wave periods, reducing the spacing can effectively improve the overall energy conversion performance of an array-type wave energy conversion device.

4. Conclusions

This study investigates the hydrodynamic characteristics and power generation performance of four S-PWEC devices arranged in a linear vertical array based on a single S-PWEC device. We summarize the conclusions:
  • In a linear vertical array configuration, the S-PWEC devices interact with each other. As the number of devices in the array increases, the wave excitation moment and output power of each individual S-PWEC undergo more pronounced variations, suggesting the existence of an optimal array configuration for maximum power output.
  • Incident waves arriving from different directions have a great impact on the linear vertical array arrangement. Therefore, the linear vertical array configuration of S-PWEC devices is not suitable for deep-sea areas, but can be used near the shore or near breakwaters where incident waves mostly come from one direction only.
  • The spacing arrangement between S-PWEC devices is significantly influenced by sea conditions. Increasing the distance between adjacent S-PWECs under smaller wave periods, and decreasing it when the wave period is large, can effectively enhance the overall power generation of the linear vertical array layout. Among these, the linear vertical array device has the best power generation effect for the Zhejiang Sea area when D/L = 1.5.
In future work, we will continue to study the different array layouts and different integration methods of array S-PWEC by numerical simulation and hydrodynamic testing, so as to continuously optimize and improve the power generation efficiency and array influence factors of array S-PWEC.

Author Contributions

Conceptualization, Y.Z. and Z.W.; methodology, Y.Z.; software, Y.Z.; validation, Y.Z. and Z.W.; formal analysis, Y.Z.; resources, Y.Z.; visualization, Y.Z.; writing original draft preparation, Y.Z.; writing-review and editing, Z.W., Z.L. and G.C.; supervision, Z.W. and Z.L. All authors have read and agreed to the published version of the manuscript.

Funding

The support by National Natural Science Foundation of China (NOs. 11572283, 11602179), the National Key Research & Development Plan of China (NOs. 2017YFC1403306, 2016YFC1401603).

Data Availability Statement

Data available on request due to restrictions of privacy.

Conflicts of Interest

The authors declare no conflicts of interest.

Glossary

M r Column vector of the radiative moments
M s Hydrostatic recovery moment matrix
M e x Wave excitation moment matrix in the longitudinal rocking direction
ξ Column vector of the displacement response
ξ ˙ ( t ) Column vector of the velocity response
ξ ¨ ( t ) Acceleration response vector in pitch direction
I Mass matrix of array wave energy conversion device
A Additional moment of inertia in the longitudinal direction
M r i Wave radiation moment
K i j Delay function of the radiative force
d τ Differential element in time integration
M b Moments of buoyancy
M G Moments of gravity
M v i s Secondary viscous drag moment
C D Coefficient of secondary damping term in viscous moment
V Velocity of the floating plate
V 0 Velocity of the surrounding fluid
L v i s Moment of the viscous force on the pivot point
M P T O Damping torque of the hydraulic power take-off
p piston Pressure difference on the piston in the hydraulic rod
A piston Force area of the piston in the hydraulic rod
L P T O Length of the force arm from the hydraulic rod to the floating pendulum
M e s Braking torque of the limiting device
k e s Large stiffness coefficient of the limit spring
ξ e s Limit angle
H x Step function
q Array impact factor
P i s o l a t e d Power generated by a single S-PWEC at normal operation conditions
P ¯ a r r a y Average of the total power of all S-PWECs at the array layout
P 3 Generating power of each S-PWEC

References

  1. Cui, Y.; Zhao, H. Marine Renewable Energy Project: The Environmental Implication and Sustainable Technology. Ocean Coast. Manag. 2023, 232, 106415. [Google Scholar] [CrossRef]
  2. Clément, A.; McCullen, P.; Falcão, A.; Fiorentino, A.; Gardner, F.; Hammarlund, K.; Lemonis, G.; Lewis, T.; Nielsen, K.; Petroncini, S.; et al. Wave Energy in Europe: Current Status and Perspectives. Renew. Sustain. Energy Rev. 2002, 6, 405–431. [Google Scholar] [CrossRef]
  3. Astariz, S.; Iglesias, G. The Economics of Wave Energy: A Review. Renew. Sustain. Energy Rev. 2015, 45, 397–408. [Google Scholar] [CrossRef]
  4. Mitigation, C.C. IPCC Special Report on Renewable Energy Sources and Climate Change Mitigation. Renew. Energy 2011, 20, 2–24. [Google Scholar]
  5. Silva, D.; Martinho, P.; Soares, C.G. Wave Energy Distribution along the Portuguese Continental Coast Based on a Thirty Three Years Hindcast. Renew. Energy 2018, 127, 1064–1075. [Google Scholar] [CrossRef]
  6. Huang, H.S.; Wang, Y.Z.; Tang, Y.F.; Zhang, J. Discussion on Issues Related to Wave Power Generation in the Context of Low Carbonization. China Eng. Consult. 2021. Available online: https://kns.cnki.net/kcms2/article/abstract?v=a4fp6zKrpgahNuMfE8tySoUeeyrBcAYM5IqcatAetCnn570em8Kf7Hrd43ywHqwnvVa48r3diXaTHTa5vN2BujSqHCsao1xYPB_HFczCDb0JV3TKjoityPd5AF_WQGmbzxapEA12Fmp7-g9w9tvf_yh-h42EGJFEuOwDxOQU71Jj-BDIo6hNyQ==&uniplatform=NZKPT&language=CHS (accessed on 11 May 2025).
  7. Ruehl, K.; Forbush, D.D.; Yu, Y.-H.; Tom, N. Experimental and Numerical Comparisons of a Dual-Flap Floating Oscillating Surge Wave Energy Converter in Regular Waves. Ocean Eng. 2020, 196, 106575. [Google Scholar] [CrossRef]
  8. Alkhabbaz, A.; Hamzah, H.; Hamdoon, O.M.; Yang, H.-S.; Easa, H.; Lee, Y.-H. A Unique Design of a Hybrid Wave Energy Converter. Renew. Energy 2025, 245, 122814. [Google Scholar] [CrossRef]
  9. Bhaskar, G.; Sarkar, A. Numerical Study on the Performance of a Floating Circular Cross Section U-Tube Type Wave Energy Extractor Unit in the Ocean Environment. Renew. Energy 2025, 245, 122817. [Google Scholar] [CrossRef]
  10. Ermakov, A.M.; Ali, Z.A.; Mahmoodi, K.; Mason, O.; Ringwood, J.V. Optimisation of Heterogeneous Wave Energy Converter Arrays: A Control Co-Design Strategy. Renew. Energy 2025, 244, 122637. [Google Scholar] [CrossRef]
  11. Kramer, M. Performance Evaluation of the Wavestar Prototype. In Proceedings of the 9th European Wave and Tidal Conference, Southampton, UK, 5 September 2011. [Google Scholar]
  12. Han, M.; Shi, H.; Cao, F.; Wei, Z.; Zhu, K.; Wang, C.; Yu, M. Layout Optimization of Wave Energy Converter Arrays in Realistic Wave Climates. Renew. Sustain. Energy Rev. 2025, 218, 115829. [Google Scholar] [CrossRef]
  13. Shi, H.; Wang, C. Progress and Prospects of China’s Ocean Energy Technology. Sol. Energy 2017, 3, 30–37. [Google Scholar]
  14. Tay, Z.Y.; Venugopal, V. Hydrodynamic Interactions of Oscillating Wave Surge Converters in an Array under Random Sea State. Ocean Eng. 2017, 145, 382–394. [Google Scholar] [CrossRef]
  15. Tay, Z.Y. Energy Generation Enhancement of Arrays of Point Absorber Wave Energy Converters via Moonpool’s Resonance Effect. Renew. Energy 2022, 188, 830–848. [Google Scholar] [CrossRef]
  16. Yang, S.; Wang, Y.; He, H.; Zhang, J.; Chen, H. Dynamic Properties and Energy Conversion Efficiency of A Floating Multi-Body Wave Energy Converter. China Ocean Eng. 2018, 32, 347–357. [Google Scholar] [CrossRef]
  17. Zhao, J.; Fan, M.; Jin, Y.; Zhou, J. Analysis of power generation performance of seesaw wave energy device array. Sci. Technol. Rev. 2021, 39, 35–41. [Google Scholar]
  18. Tay, Z.Y.; Htoo, N.L.; Konovessis, D. A Comparison of the Capture Width and Interaction Factors of WEC Arrays That Are Co-Located with Semi-Submersible-, Spar- and Barge-Supported Floating Offshore Wind Turbines. J. Mar. Sci. Eng. 2024, 12, 2019. [Google Scholar] [CrossRef]
  19. Zhong, Q.; Yeung, R.W. On Optimal Energy-Extraction Performance of Arrays of Wave-Energy Converters, with Full Consideration of Wave and Multi-Body Interactions. Ocean Eng. 2022, 250, 110863. [Google Scholar] [CrossRef]
  20. Wan, Z.; Li, Z.; Zhang, D.; Zheng, H. Design and Research of Slope-Pendulum Wave Energy Conversion Device. J. Mar. Sci. Eng. 2022, 10, 1572. [Google Scholar] [CrossRef]
  21. Song, T.; Li, Z.; Zheng, H.; Liang, C.; Wan, Z. Optimization on Hydrodynamic Performance for First Level Energy-Capturing Enhancement of a Floating Wave Energy Converter System with Flapping-Panel-Slope. J. Mar. Sci. Eng. 2023, 11, 345. [Google Scholar] [CrossRef]
  22. Cummins, W.E. The Impulse Response Functions Snd Ship Motion. Schiffstechnik 1962, 9, 101–109. [Google Scholar]
  23. Giorgi, G.; Ringwood, J.V. Comparing Nonlinear Hydrodynamic Forces in Heaving Point Absorbers and Oscillating Wave Surge Converters. J. Ocean Eng. Mar. Energy 2018, 4, 25–35. [Google Scholar] [CrossRef]
  24. Wan, Y.; Fan, C.; Zhang, J.; Meng, J.; Dai, Y.; Li, L.; Sun, W.; Zhou, P.; Wang, J.; Zhang, X. Wave Energy Resource Assessment off the Coast of China around the Zhoushan Islands. Energies 2017, 10, 1320. [Google Scholar] [CrossRef]
  25. NOAA Website. Available online: https://www.ncei.noaa.gov/maps/hourly/ (accessed on 11 May 2025).
  26. Shi, X.; Li, S.; Liang, B.; Zhao, J.; Liu, Y.; Wang, Z. Numerical Study on the Impact of Wave-Current Interaction on Wave Energy Resource Assessments in Zhoushan Sea Area, China. Renew. Energy 2023, 215, 119017. [Google Scholar] [CrossRef]
  27. So, R.; Simmons, A.; Brekken, T.; Ruehl, K.; Michelen, C. Development of PTO-Sim: A Power Performance Module for the Open-Source Wave Energy Converter Code WEC-Sim. In Proceedings of the ASME 2015 34th International Conference on Ocean, Offshore and Arctic Engineering, St. John’s, NL, Canada, 31 May–5 June 2015; American Society of Mechanical Engineers: New York, NY, USA, 2015; Volume 9, p. V009T09A032. [Google Scholar]
Figure 1. Schematic of single S-PWEC.
Jmse 13 01367 g001
Figure 2. Schematic of linear vertical array layout of S-PWEC.
Jmse 13 01367 g002
Figure 3. Statistical distribution of sea condition data.
Jmse 13 01367 g003
Figure 4. S-PWEC array integration system.
Jmse 13 01367 g004
Figure 5. WEC-Sim modeling for arrayed S-PWECs.
Jmse 13 01367 g005
Figure 6. Working conditions in terms of the number of devices.
Jmse 13 01367 g006
Figure 7. Effect of number of devices on array power generation characteristics.
Jmse 13 01367 g007
Figure 8. Overall performance of vertical array S-PWECs.
Jmse 13 01367 g008
Figure 9. Evaluation of power generation characteristics at different locations.
Jmse 13 01367 g009
Figure 10. Stability analysis of four S-PWECs under different wave periods.
Jmse 13 01367 g010
Figure 11. Characterization of S-PWECs with different incidence angles.
Jmse 13 01367 g011
Figure 12. Power generation characteristics of S-PWEC with different spacings (T = 5 s, H = 1 m).
Jmse 13 01367 g012
Figure 13. Array impact factor of S-PWE line array layout at different spacing ratios.
Jmse 13 01367 g013
Disclaimer/Publisher’s Note: The statements, opinions and data contained in all publications are solely those of the individual author(s) and contributor(s) and not of MDPI and/or the editor(s). MDPI and/or the editor(s) disclaim responsibility for any injury to people or property resulting from any ideas, methods, instructions or products referred to in the content.

