Abstract
The non-metallic armored optoelectronic cable (NAOC) serves as a critical component in deep-sea scientific winch systems. Due to its low density and excellent corrosion resistance, it has been widely adopted in marine exploration. However, as the operational water depth increases, the NAOC is subjected to multi-layer winding on the drum, resulting in a cumulative temperature rise that can severely impair insulation performance and compromise the safety of deep-sea operations. To address this issue, this paper conducts temperature rise experiments on NAOCs using a distributed temperature sensing test rig to investigate the effects of the number of winding layers and current amplitude on their temperature rise characteristics. Based on the experimental results, an electromagnetic thermal multi-physics field coupling simulation model is established to further examine the influence of these factors on the maximum operation time of the NAOC. Finally, a multi-variable predictive model for maximum operation time is developed, incorporating current amplitude, the number of winding layers, and ambient temperature, with a fitting accuracy of 97.92%. This research provides theoretical and technical support for ensuring the safety of deep-sea scientific operations and improving the reliability of deep-sea equipment.
1. Introduction
During scientific winch operations, the optoelectronic cable must withstand not only mechanical loads such as its own weight and the pulling force from attached equipment, but also ensure the stable transmission of power and signals. As deep-sea exploration progresses toward full-ocean-depth missions, greater demands are imposed on the cable’s mechanical strength and corrosion resistance [1,2]. Among these factors, the selection of the cable’s armor structure is particularly critical. Compared to conventional metallic armored optoelectronic cables, non-metallic armored optoelectronic cables (NAOCs) offer a significantly reduced self-weight, with a density approximating that of seawater, thereby improving overall load-bearing capacity. Furthermore, their superior corrosion resistance markedly extends the service life. As a result, NAOCs are increasingly replacing metallic armored cables and have been widely adopted in deep-sea exploration applications [3,4,5].
Under high-voltage and high-current operating conditions, Joule heating can induce a significant temperature rise, directly impacting the safe and stable performance of the cable. Therefore, the in-depth investigation of the cable’s temperature field is essential to ensure its reliable operation. The primary approaches for analyzing the temperature field of optoelectronic cables include the equivalent thermal resistance approach and numerical solution methods. Among these, the finite element method (FEM) discretizes the complex cable structure into finite elements, formulates the governing equations, and solves them to simulate temperature variations under actual operating conditions with high accuracy. This provides an efficient and robust framework for the thermal analysis of cables. Numerous researchers have employed FEM in related studies. For example, Karahan et al. performed a thermal analysis of cables by considering not only conventional thermal conditions but also electrical parameters. Their study incorporated the current density and electric field into the heat conduction equation to account for electrical losses, and further examined the impact of environmental conditions on the current-carrying ampacity [6]. Trufanova et al. employed the finite element method to calculate thermal losses, fluid velocity, and temperature fields, analyzing the temperature distribution of the cable under various operating conditions. They determined the maximum operation time during overload and short-circuit scenarios, providing theoretical support for thermal management strategies [7]. Demirol et al. conducted electrical and thermal analyses of cable systems based on different design parameters to evaluate the performance of various configurations, thereby offering a theoretical foundation for cable system optimization [8]. Li et al. established a heat transfer model for insulated cables and analyzed the relationships among the current, insulation thickness, and the temperature field of PVC cables. Their multi-parameter coupled analysis framework provides a valuable technical reference for studying the temperature rise characteristics of cables [9]. Bustamante et al. combined finite element modeling with experimental methods to examine the current-carrying ampacity variations of medium-voltage underground cables. Their multi-scenario comparative approach offers experimental design insights for investigating the correlation between current-carrying ampacity and temperature rise in complex deep-sea environments [10]. Krieger et al. applied the finite element method to analyze the temperature rise characteristics of partially submerged umbilical cables, focusing on the effects of the heat dissipation rate, air temperature, and solar radiation. They found that the temperature rise in dry sections is primarily caused by internal heat generation and solar radiation, whereas wet sections are mainly cooled by seawater; the environmental wind speed also significantly influences the cable temperature [11]. Vedachalam et al. investigated the influence of ambient temperature, medium flow velocity, and burial conditions on the current-carrying ampacity of Kevlar-armored submarine optoelectronic cables. Their study also addressed the thermal field distribution under overload and short-circuit conditions, as well as the time required to reach the maximum safe temperature under varying current amplitudes [12,13]. Although existing studies have extensively applied the finite element method to explore the cable temperature rise under diverse factors, research focused specifically on NAOCs remains limited. Given that the excellent thermal insulation properties of non-metallic armor may exacerbate temperature rise issues and significantly increase operational safety risks, it is essential to conduct an in-depth investigation into the temperature rise characteristics of NAOCs.
In practical ocean operations, the frequent deployment and retrieval of underwater exploration equipment at varying water depths often lead to the multi-layer winding of optoelectronic cables on the drum. This winding configuration promotes heat accumulation, resulting in a rapid temperature rise that can significantly impair the cable’s performance and shorten its service life. Xiong et al. investigated the temperature distribution and current-carrying ampacity of cables under various laying methods and found that multi-layer laying significantly reduces heat dissipation efficiency. This condition shares a similar physical mechanism with the multi-layer winding of optoelectronic cables on the drum, offering relevant analytical references for temperature rise studies under such configurations [14]. Chen et al. developed a multi-physics field coupling model for cable-drum systems to analyze the cable temperature rise and drum heat dissipation, and proposed structural optimization strategies that effectively enhanced thermal performance and improved drum design [15]. Vedachalam et al. conducted the electro-thermal modeling and simulation of Kevlar-armored optoelectronic cables designed for ROVs operating at water depths of 6000 m, analyzing derating factors under different winding layers to ensure safe and stable long-term operation within the saturation temperature. They performed a current-carrying ampacity derating analysis based on a 23-layer winding model, providing important references for thermal safety evaluation under multi-layer winding conditions [16]. Li et al. further investigated the influence of current amplitude and the number of winding layers on the temperature distribution of multi-layer winding optoelectronic cables through numerical studies; however, the coupling effects between these two parameters were not quantitatively analyzed [1]. Ravichandran et al. conducted electromagnetic thermal simulations of optoelectronic cables used in subsea mining machines under multi-layer winding conditions and derived current-carrying ampacity derating factors. They embedded temperature sensors between layers to measure surface temperature, but these measurements only reflected external temperatures and failed to capture internal thermal hotspots accurately [17]. Yang et al. deployed thermocouples at different radial positions of a 110 kV XLPE cable to measure surface temperatures and found that the air gap thermal resistance limited measurement accuracy, further highlighting the limitations of single-point temperature sensing [18]. Therefore, the introduction of distributed temperature sensing systems is essential. Zhang et al. has validated that advanced distributed temperature sensing systems utilizing Raman scattering can achieve a temperature accuracy within 0.5 °C for cable monitoring, confirming the reliability of this method. Distributed temperature sensing enables continuous temperature monitoring along the entire cable length without damaging the cable body, allowing the accurate acquisition of internal temperatures and providing a more reliable solution for temperature monitoring under complex operating conditions [19]. Becker et al. developed a deep-sea distributed temperature sensing observatory, enabling continuous, high-spatiotemporal-resolution temperature monitoring along optical fibers, with deployments validating its effectiveness in capturing thermal data in complex marine environments. This supports our use of distributed temperature sensing for temperature monitoring in multi-layer winding optoelectronic cables [20]. Moreover, existing studies have not systematically quantified the combined influence of current amplitude and the number of winding layers on the temperature rise in multi-layer winding optoelectronic cables. Thus, a quantitative investigation of their coupled effects is necessary, and the application of distributed temperature sensing systems is critical for accurately characterizing internal temperature variations under multi-layer winding conditions.
This paper aims to investigate the temperature rise characteristics of multi-layer winding NAOCs. A series of temperature rise experiments under various winding layers and current amplitude conditions were conducted using a distributed temperature sensing system. Based on the experimental results, an electromagnetic thermal multi-physics field coupling simulation model of multi-layer winding NAOCs was established using finite element analysis to further explore the relationship between operating conditions and maximum operation time. Furthermore, a multi-variable prediction model for the maximum operation time was proposed, incorporating the number of winding layers, current amplitude, and ambient temperature. This model enables the early identification of potential thermal risks in NAOCs and provides both theoretical and technical support for engineering applications.
2. Experimental Work
2.1. Experimental Setup
The experimental work was carried out at HMN Technologies Group Co., Ltd., Suzhou, China, using a newly developed multi-layer winding test rig specifically designed for this study. The test rig primarily consists of a multi-layer winding structure for the optoelectronic cable (HMN Technologies Group Co., Ltd., Suzhou, China), distributed temperature sensing system (Wuxi Brillouin Electronics Technology Co., Ltd., Wuxi, China), and power supply (ITECH Electronics Co., Ltd., Nanjing, China) and load system (Shenzhen Skonda Electronic Co., Ltd., Shenzhen, China). A schematic diagram of the overall layout is presented in Figure 1.
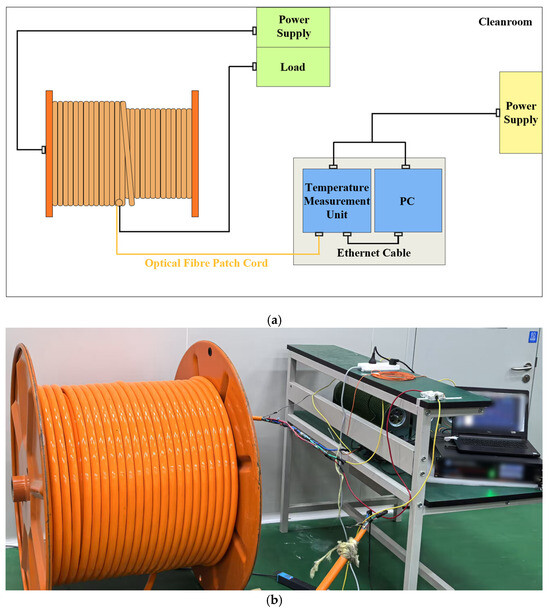
Figure 1.
Schematic diagram of the overall layout of the test rig: (a) schematic of the designed connection architecture; (b) physical layout photograph of the experimental setup.
The experiment utilized a drum made of alloy steel, with an outer diameter of 500 mm and a length of 800 mm. To accelerate the temperature rise and thus reduce the experimental duration, the number of winding layers of the NAOC was maximized. A 405 m section of NAOC was selected as the test sample. This cable was fully wound onto the experimental drum, forming a total of eight winding layers, with each layer comprising approximately 21 to 22 turns. The experimental cable sample and drum are shown in Figure 2.

Figure 2.
Structure of the experimental cable sample and drum.
Based on Equation (1), the cable storage length corresponding to each winding layer can be calculated, which enables the accurate identification of the cable’s layer position at any given point. The specific storage length for each layer is listed in Table 1.
where ∆L is the incremental cable length wound in one layer on the drum; c is the number of turns per layer. For the test drum, odd-numbered layers contain 22 turns, while even-numbered layers contain 21 turns. D is the winding diameter, which increases with the number of layers. Dout is the inner diameter of the drum, which is 500 mm, and ∆D is the incremental increase in winding diameter. Based on the relationship expressed in Equation (2), detailed calculations can be performed [21]:
where ∆h is the increase in layer height for each additional winding layer. b and a represent the minor and major semi-axe, respectively, of the cable’s cross-section when compressed into an elliptical shape. However, as no tensile force was applied during the experiment, deformation is not considered, and the condition a = b = r applies, where r is the cable radius, specified as 16.5 mm. e is the pitch, defined as the spacing between adjacent turns within the same winding layer, and can be calculated using Equation (3), where l is the length of the drum, given as 800 mm.

Table 1.
Cable storage capacity of the drum.
The distributed temperature sensing system exhibits a temperature resolution of 0.1 °C, a spatial resolution of 0.5 m, and a signal transmission time to the controller within 30 s. The temperature measurement unit is connected to a PC via an ethernet cable and linked to one end of the optical fiber patch cord. The other end of the patch cord is fusion-spliced to the optical fiber embedded within the cable under test, thereby enabling real-time temperature data transmission and monitoring. The connection schematic is illustrated in Figure 3.

Figure 3.
Schematic diagram of temperature measurement system connection.
The experiments were conducted in a temperature-controlled cleanroom to ensure a stable thermal environment. Prior to testing, the multi-layer winding structure of the optoelectronic cable was left undisturbed for 48 h to achieve thermal equilibrium between the cable sample and the ambient environment, thereby minimizing the influence of initial temperature gradients on the experimental results. To improve experimental efficiency, the number of winding layers and current amplitude were maximized within safe operating limits. Two winding configurations—eight-layer and six-layer windings—were adopted, and the current conditions were categorized into three levels: high, medium, and low. The high current level was set at 15 A, which was the upper limit allowed by circuit safety constraints, while the medium and low levels were set at 10 A and 6 A, respectively. Each test group was subjected to continuous current loading for 48 h. However, to mitigate the risk of overheating and ensure operational safety, the power supply was shut off if the monitored maximum temperature approached 75 °C before the scheduled end of the test. After each test cycle, the cable sample was allowed to cool naturally to ambient temperature before the subsequent experiment.
2.2. Experimental Result
Figure 4a,b depict the time–position temperature distribution of the optoelectronic cable under a 15 A current for the eight-layer and six-layer winding configurations, respectively. These figures illustrate the temporal evolution of temperature along the longitudinal direction of the multi-layer winding optoelectronic cable, with temperature values represented by a color gradient. The results reveal a periodic temperature pattern along the cable length at various time points, where the number of thermal peaks corresponds to the number of winding layers. This observation confirms that the number of winding layers directly influences the longitudinal temperature distribution. Additionally, although the temperature increases over time in all regions, the rate of the temperature rise varies significantly along different segments of the cable. This variation reflects spatial differences in heat generation and dissipation. Accordingly, further analysis is warranted to examine the temperature distribution at specific time points and to evaluate the temperature rise at critical locations.
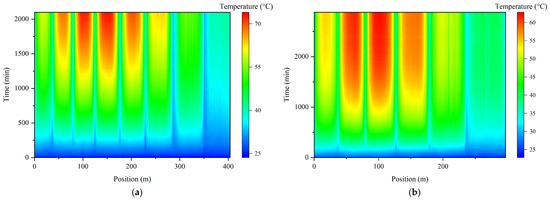
Figure 4.
Time–position temperature distribution of the optoelectronic cable under 15 A current: (a) eight-layer winding; (b) six-layer winding.
Figure 5 presents the full-length temperature distribution of the NAOC wound in eight layers under three current conditions, captured at the same time point. Since the 15 A condition reached the preset threshold temperature earlier, the comparison is made at 2100 min—the end of the 15 A experiment. The results show that the sequence of temperature gradients remains consistent across current conditions, indicating that current amplitude primarily influences the gradient magnitude rather than the distribution pattern. The outermost layer consistently exhibits the lowest temperature, underscoring the dominant role of convective heat transfer between the cable and the ambient air in overall cooling. The highest temperature is consistently observed in the fourth layer, with adjacent layers displaying similar temperatures, forming a distinct high-temperature zone. This region is of particular concern due to potential thermal risks. As the current increases, the temperature gradient becomes more pronounced, with the maximum temperature in the hottest layer exceeding three times that of the coolest layer. Figure 6 shows the temperature rise curves of the hottest layer under the same three current conditions. The results clearly demonstrate significant differences in the rate of temperature increase. Over the same time interval, the average temperature rise rate under the 15 A condition is approximately twice that under 10 A and about five times that under 6 A.
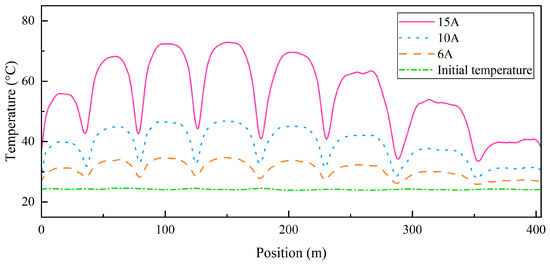
Figure 5.
Full-length temperature distribution of the eight-layer winding optoelectronic cable under different current conditions.
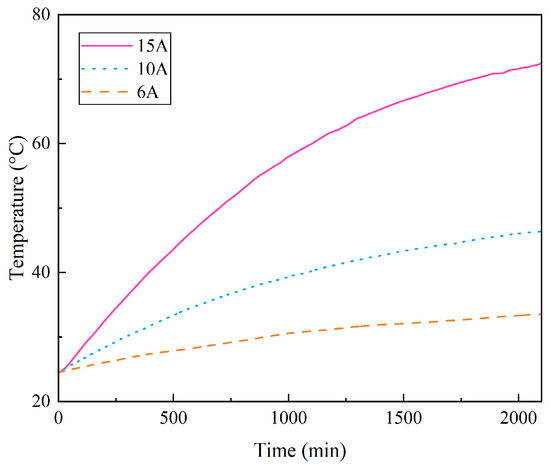
Figure 6.
Temperature rise of the eight-layer winding optoelectronic cable under different current.
The above results demonstrate that the number of winding layers has a direct impact on the temperature gradient distribution. The full-length temperature distribution maps allow the identification of the hottest layer: in the eight-layer winding configuration, the fourth layer exhibits the highest temperature, whereas in the six-layer winding, the hottest layer is the third. Under identical current conditions, a comparative analysis was conducted on the temperature distribution of the hottest layer in multi-layer winding NAOCs with different winding configurations. Figure 7 presents the temperature distribution of the hottest layer at 2100 min under 15 A and 10 A current conditions. Under the 15 A condition, the peak temperature of the hottest layer in the eight-layer configuration is 11 °C higher than that in the six-layer configuration. Similarly, under the 10 A condition, the peak temperature difference is 9 °C. In both scenarios, an increase of two winding layers results in a temperature rise approaching 20% at the hottest location.
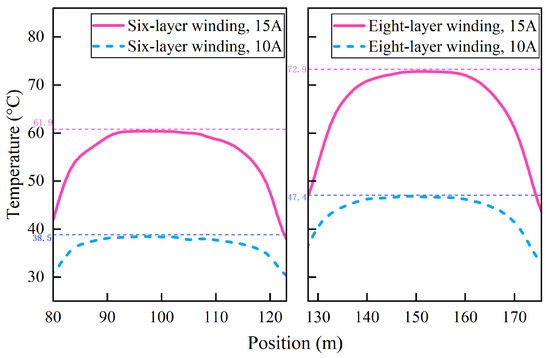
Figure 7.
Temperature distribution of the highest temperature layer of the optoelectronic cable under different working conditions.
Figure 8 shows the temperature rise curves up to 60 °C at the hottest location of the optoelectronic cable under different winding layer configurations with a current of 15 A. During the initial 300 min, the curves corresponding to the six-layer and eight-layer windings nearly overlap, both exhibiting a linear growth trend. This indicates that the number of winding layers has a negligible influence on the initial temperature rise rate. However, beyond 300 min, the curves begin to diverge significantly. Although the temperature rise rate decreases for both configurations, the reduction is markedly more pronounced in the six-layer winding. The time required to reach 60 °C is nearly twice as long for the six-layer configuration compared to the eight-layer configuration. These observations suggest that, in the later stages of heating—when the cable approaches thermal equilibrium—the number of winding layers becomes a dominant factor influencing the temperature rise.
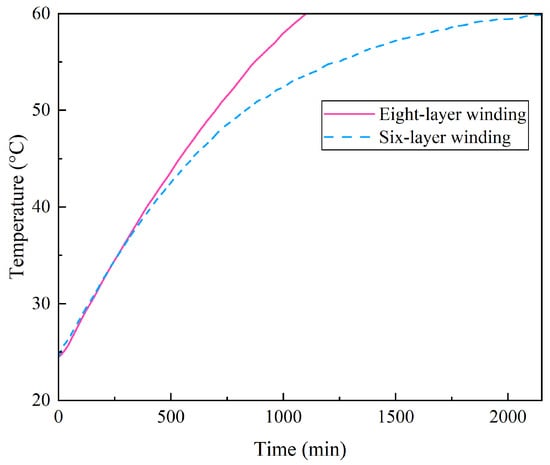
Figure 8.
Temperature rise of the optoelectronic cable with different winding layers under the 15 A current.
The experimental results have shown that both the number of winding layers and the current amplitude have a decisive influence on the temperature rise characteristics of the optoelectronic cable, thereby significantly impacting its maximum operation time. Given that the maximum operation time is directly related to the stability and reliability of system performance, further investigation is necessary. In the subsequent work, a multi-physics field coupling model based on electromagnetic thermal analysis will be developed using finite element software to explore the underlying mechanisms through which the number of winding layers and current amplitude affect the temperature rise characteristics of multi-layer winding NAOCs. This model will also be used to determine the maximum operation time under various operating conditions.
3. Finite Element Model Development and Validation
3.1. Geometric Modeling
The geometric model of the NAOC was constructed based on the structural dimensions provided in Table 2. A corresponding multi-layer winding configuration was then developed. Both the multi-layer winding NAOC and the drum exhibit strict symmetry about the drum axis, resulting in two-dimensional characteristics in the plane perpendicular to the axis, with negligible variation along the axial direction. The internal physical fields and boundary conditions are distributed in an axisymmetric manner. Within the studied temperature range, conventional two-dimensional models lack sufficient accuracy, whereas two-dimensional axisymmetric models yield results comparable to those of three-dimensional models. Therefore, to reduce computational complexity, a two-dimensional axisymmetric model was adopted [1]. The model structure is illustrated in the accompanying Figure 9.

Table 2.
Geometrical dimensions of the NAOC.
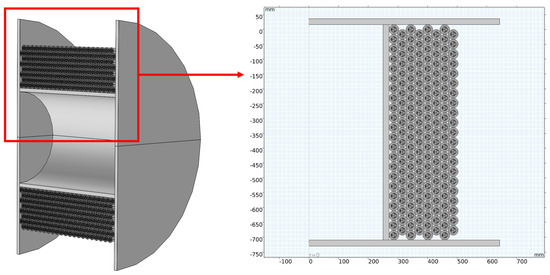
Figure 9.
Geometric model of the multi−layer winding NAOC.
The finite element model integrates both electromagnetic and thermal fields, with material properties assigned according to the specific requirements of each field. The selected parameters for the materials used are summarized in Table 3. The simulation design ignores ambient wind speed, as the optoelectronic cables are practically installed in containers where the enclosed space eliminates wind effects and maintains a constant temperature.

Table 3.
Specification for materials.
3.2. Electromagnetic Thermal Modeling
When the optoelectronic cable is energized, a complex electromagnetic field is generated both within and around the cable. The distribution of this electromagnetic field is governed by Maxwell’s equations [22], which are expressed in differential form as follows:
where is the vector differential operator, is the magnetic field intensity, is the electric field intensity, is the magnetic flux density, is the electric displacement vector, is the current density, and is the volume charge density. These equations describe the fundamental characteristics of the electromagnetic field and its variation over time.
During electrical power transmission, the cable incurs power losses, which constitute the primary cause of temperature rise. The main sources of these losses include current losses in the copper conductor, losses in the metallic shielding, and dielectric losses in the insulation layer. The power loss per unit length of the copper conductor can be expressed as follows [23]:
where W1 is the power loss of the copper conductor per unit length, I is the current flowing through the conductor, r is the DC resistance of the conductor, respectively, ys is the skin effect coefficient, and yp is the proximity effect coefficient. For the optoelectronic cable core composed of fine copper wires, both skin and proximity effects can be neglected under certain conditions, thereby simplifying the resistance calculation.
For NAOCs, the losses in the metallic shielding layer include circulating current loss and eddy current loss. When the metallic shielding layer is grounded, the circulating current loss can be neglected, and only the eddy current loss needs to be considered. The eddy current loss factor can be calculated as follows:
where Rs is the resistance of the metallic shielding layer at the operating temperature, X is the reactance per unit length of the shielding layer, s is the distance between the conductor axes, and d is the average diameter of the metallic shielding layer. Since the sheath loss factor represents the ratio of the shielding layer loss to the conductor loss in the optoelectronic cable, the power loss per unit length of the shielding layer W2 can be expressed as follows:
Dielectric loss is primarily caused by the polarization effects of the electric field within the dielectric material, and its calculation formula is given as follows [24]:
where , is the current frequency, C0 is the capacitance per unit length of the dielectric, U is the phase voltage of the cable, tan δ is the loss tangent of the insulation layer, D1 is the diameter of the insulation layer, and d1 is the diameter of the conductor. Based on the above formula, the dielectric loss of the insulation layer can be accurately calculated. The total power loss density Wtotal is the sum of the three components of loss and serves as the primary heat source in the thermal field:
3.3. Heat Transfer Modeling
Heat is transferred through conduction, convection, and radiation, with conduction and convection being the dominant mechanisms. The transient heat conduction equation is given by the following [25]:
where ρ represents the material density, cp is the specific heat capacity, denotes the partial derivative of temperature with respect to time, and k is the thermal conductivity. This equation describes the variation in temperature within the cable over time and space, considering the thermal properties of the materials and the influence of internal heat sources. In addition, natural convection heat dissipation is applied as the boundary condition, as shown in Equations (11) and (12):
where h is the convective heat transfer coefficient, which characterizes the intensity of convective heat exchange, TS is the surface temperature of the optoelectronic cable, and Ta is the ambient temperature. In the two-dimensional axisymmetric model, the temperature gradient at the axis of symmetry satisfies the following condition:
where is the radial gradient of the temperature field, and r is the radial coordinate.
3.4. Mesh Independence Verification
Prior to numerical computation, the computational domain of the multi-layer winding NAOCs and the drum model must be appropriately meshed, as mesh quality directly influences the accuracy of simulated results. A transient study under a 30 A current condition was selected to perform mesh independence verification. The computational domain was divided into two regions: the conductor and insulation region inside the cable, and the protective layer of the cable together with the drum region. Mesh densities were independently adjusted in these two regions to determine an appropriate number of mesh elements. First, the mesh density of the conductor and insulation region was varied while maintaining a constant mesh density in the protective layer and drum region. Four mesh density levels were applied to the conductor and insulation region: low, medium-low, medium-high, and high, corresponding to 2.48 × 10⁷, 2.74 × 10⁷, 2.88 × 10⁷, and 2.95 × 10⁷ elements, respectively. Three sample points were selected in the model for temperature comparison at the same time: point A (372, −93), point B (372, −186), and point C (372, −279). The comparison results are presented in Table 4.

Table 4.
Temperature at each location under different mesh densities of the conductor and insulation region inside the cable.
It can be observed that when the mesh density of the conductor and insulation region inside the cable is set to medium-high or high, the temperatures at all sampled points are similar. Considering the computational cost, the medium-high mesh density, which involves fewer elements, is selected for this region. On this basis, the mesh density of the protective layer of the cable along with the drum region is further examined. Four levels of mesh density—low, medium-low, medium-high, and high are applied, corresponding to 1.03 × 10⁷, 1.84 × 10⁷, 2.88 × 10⁷, and 5.95 × 10⁷ elements, respectively. The temperatures at points A, B, and C under different numbers of mesh elements are compared, in to determine the appropriate mesh density for the model.
It can be observed that when the mesh density of the conductor and insulation region inside the cable is set to medium-high or high, the temperatures at all sample points are nearly identical. Considering computational efficiency, the medium-high mesh density was selected for this region due to its lower number of elements. Based on this configuration, the mesh density of the protective layer of the cable together with the drum region is further examined. Four mesh density levels were applied: low, medium-low, medium-high, and high, corresponding to 1.03 × 10⁷, 1.84 × 10⁷, 2.88 × 10⁷, and 5.95 × 10⁷ elements, respectively. The temperatures at points A, B, and C under different mesh densities are compared, as shown in Table 5, to determine the optimal mesh configuration for the model.

Table 5.
Temperature at each location under different mesh densities of the protective layer of the cable together with the drum region.
Based on the comparison, the calculated results for the protective layer of the cable together with the drum region are similar when using medium-high and high mesh densities. Given the significantly reduced computation time, the medium-high mesh density is selected for this region. Accordingly, the final simulation model adopts a medium-high mesh density for both the conductor and insulation region and the protective layer of the cable together with the drum region. The mesh division is illustrated in Figure 10, comprising a total of 2.88 × 10⁷ elements with an average element quality of 0.75.
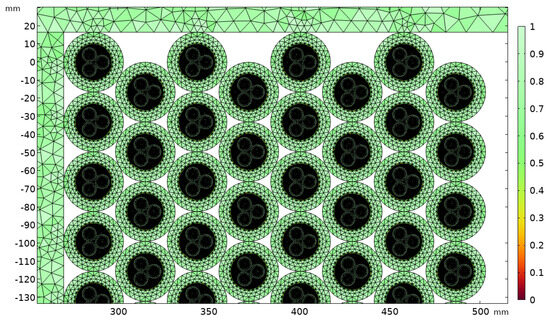
Figure 10.
Mesh division of multi−layer winding NAOC.
3.5. Model Verification
To validate the simulated results, a comparative analysis was conducted between the experimental and simulated temperature distributions. The eight-layer winding and six-layer winding configurations under a 15 A current were selected as representative cases. The numerical analysis was performed with the same end time as the corresponding experiments. Figure 11 presents the simulated temperature distributions of the multi-layer winding NAOCs under these two conditions.
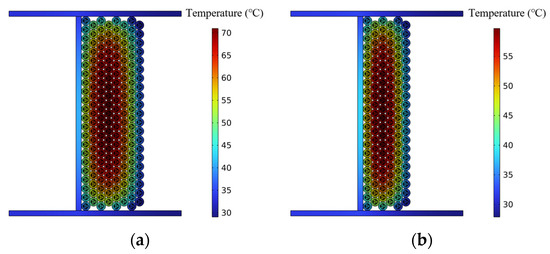
Figure 11.
Simulated results of the temperature distribution in multi-layer winding NAOCs: (a) eight-layer winding, 15 A current; (b) six-layer winding, 15 A current.
Based on the temperature data corresponding to the coordinates of each layer and turn of the optoelectronic cable in Figure 11, and applying Equations (1)–(3), the full-length temperature distribution of the cable under multi-layer winding conditions was calculated. A comparison between the experimental and simulated results for the two operating conditions is presented in Figure 12.
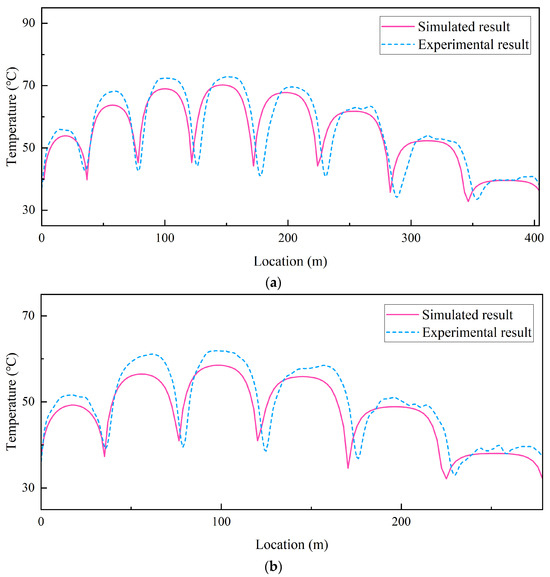
Figure 12.
Comparison of full-length temperature distribution in multi-layer winding NAOCs: (a) eight-layer winding, 15 A current; (b) six-layer winding, 15 A current.
The analysis of the full-length temperature distribution comparison figures shows that both the experimental and simulated results exhibit temperature fluctuations along the length of the optoelectronic cable. The fluctuation patterns are similar, with consistent temperature gradients and comparable amplitudes between peaks and valleys. The winding layers corresponding to the highest and lowest temperatures under different winding configurations are summarized in Table 6, demonstrating strong consistency between the simulated and experimental results in this regard.

Table 6.
Distribution of temperature extreme layers in multi-layer winding NAOCs.
To enable a more in-depth comparative analysis of the temperature distribution, the investigation focuses on two aspects: intra-layer temperature difference and inter-layer temperature difference. For the eight-layer winding configuration, the innermost layer (first layer), the outermost layer (eighth layer), and the highest temperature layer (fourth layer) are selected for analysis. For the six-layer winding configuration, the first layer, sixth layer, and third layer are selected accordingly. Figure 13 and Figure 14 present the single-layer temperature distribution under the two conditions, based on both simulated and experimental results.
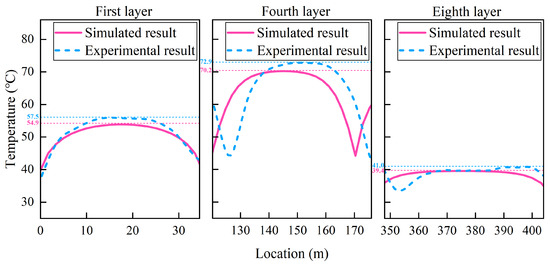
Figure 13.
Comparison of single-layer temperature distribution in NAOCs under the eight-layer 15 A condition.
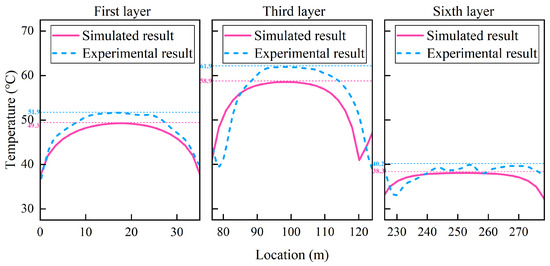
Figure 14.
Comparison of single-layer temperature distribution in NAOCs under the six-layer 15 A condition.
The single-layer temperature distribution results exhibit an arched profile in each layer, with lower temperatures at both ends and relatively higher local temperatures near the center. The extent of intra-layer temperature differences differs among layers, reflecting the degree of temperature non-uniformity within each layer. The dashed lines in the figures mark the maximum temperature within each layer, while the minimum temperature typically appears near the flange. Based on the temperature distribution data, the extreme values of intra-layer temperature differences are extracted to compare experimental and simulated results, as presented in Table 7.

Table 7.
Extreme values of intra-layer temperature differences in NAOCs.
As observed from the single-layer temperature distribution plots, NAOCs with different numbers of winding layers exhibit similar patterns. The minimum temperature points in each layer are located near the flanges, resulting in comparable temperatures at both ends. Variations in intra-layer temperature differences are primarily concentrated in the high-temperature regions. The analysis of the data in Table 7 shows that the maximum deviation in intra-layer temperature differences between the simulated and experimental results for the innermost layer, outermost layer, and highest temperature layer remains within 20%.
Subsequently, a further validation of the simulation model is conducted by analyzing inter-layer temperature differences. By comparing the temperature differences between the highest temperature and lowest temperature layers, as well as between the innermost and outermost layers, the inter-layer temperature difference results for the NAOCs are obtained, as presented in Table 8. The data indicate that the deviations between the simulated and experimental results for inter-layer temperature differences are all within 10%.

Table 8.
Inter-layer temperature differences in NAOCs.
The preceding sections systematically compared the temperature distribution results of NAOCs obtained through simulation and experiment, providing an initial validation of the simulation model. The following analysis focuses on comparing the temperature rise at specific locations between the simulated and experimental results. Two working conditions with a current of 15 A were selected. For each case, the highest temperature layer and the lowest temperature layer were identified, and three sampling points were chosen from the high-temperature region near the center of each selected layer. The average values of these samples were used to plot the temperature rise curves. Figure 15 and Figure 16 present the temperature rise comparison results for the eight-layer and six-layer winding configurations, respectively. As shown in the figures, the simulated and experimental results exhibit a generally consistent trend, indicating good agreement in the temperature rise variation over time. The maximum deviation between the two curves remains within 10%. These results further demonstrate that the simulation model can reliably capture the temperature rise at specific locations within the NAOCs.
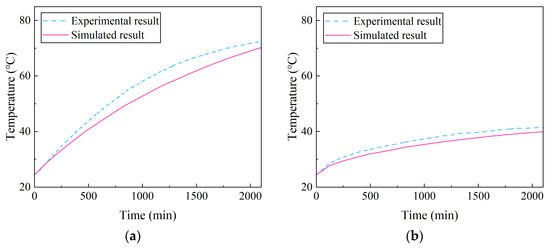
Figure 15.
Comparison of temperature rise in NAOCs under the eight-layer 15 A current: (a) fourth layer; (b) eighth layer.
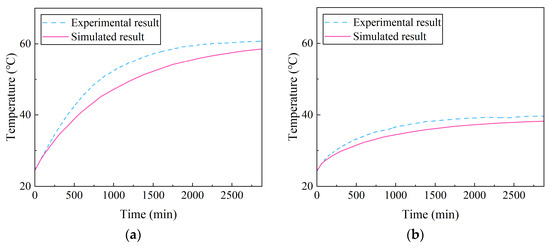
Figure 16.
Comparison of temperature rise in NAOCs under the six-layer 15 A current: (a) third layer; (b) sixth layer.
In summary, the reliability of the electromagnetic thermal multi-physics field coupling model for multi-layer winding NAOCs has been validated from both the temperature distribution and temperature rise. Therefore, this model can serve as a foundation for subsequent research.
4. Results and Discussion
During the operation of multi-layer winding NAOCs, the temperature limit is a critical parameter. For the optoelectronic cable studied, the time required for the initial temperature to rise to the temperature limit of 90 °C is defined as the maximum operation time. In this section, numerical calculations are performed based on the electromagnetic thermal multi-physics field coupling model of multi-layer winding NAOCs. The model is configured with an ambient temperature of 20 °C and 15 winding turns per layer. The effects of the number of winding layers and current amplitude on the maximum operation time are investigated, and the quantitative relationships between these factors and the multi-layer winding are determined through simulation.
4.1. Influence of Winding Layers on the Maximum Operation Time
In practical applications, variations in operating water depth result in different numbers of winding layers on the drum. In this study, transient numerical simulations were performed by applying a 30 A current to models featuring one-layer, five-layer, and nine-layer winding configurations. These configurations were selected as three groups from the range of one to ten layers. At 400 min, prior to reaching the temperature limit, temperature data were extracted along the drum axis within the highest temperature layer. The corresponding temperature distributions in the highest temperature layer for the one-layer, five-layer, and nine-layer winding configurations are presented in Figure 17.
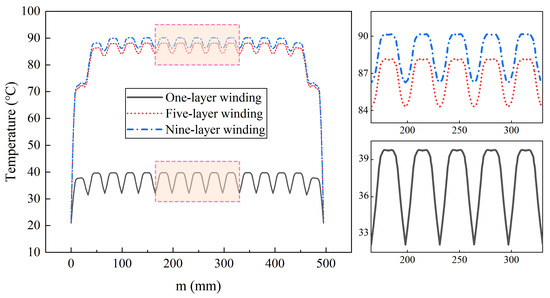
Figure 17.
Temperature distribution of the highest temperature layer in multi-layer winding NAOCs.
The results indicate that, within the same layer, the highest temperature point is located in the central high-temperature region, which lies at a certain distance from the flanges on both sides. This region exhibits similar characteristics under different operating conditions, with differences primarily in magnitude. These findings suggest that the temperature distribution in multi-layer winding NAOCs follows consistent patterns across different winding layer configurations. Since the peak temperature occurs within this high-temperature region, particular attention should be given to the temperature rise in this area.
To further investigate the influence of the number of winding layers on the temperature rise of multi-layer winding NAOCs, simulations were conducted under a current of 30 A for configurations with two-layer, four-layer, six-layer, eight-layer, and ten-layer winding configurations. The temperature rise at the maximum temperature point for each case is shown in Figure 18, which clearly illustrates the significant effect of the number of winding layers on the temperature rise. Based on a quantitative analysis of the curves in the figure, the corresponding maximum operation times under each winding configuration at 30 A are presented in Table 9. It can be observed that when the number of winding layers exceeds eight, the maximum operation time tends to stabilize, whereas a substantial increase in the operation time is observed as the number of winding layers decreases.
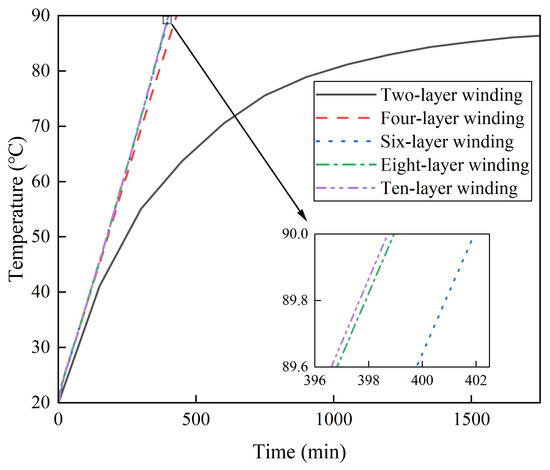
Figure 18.
Temperature rise of multi-layer winding NAOCs under the 30 A current.

Table 9.
Maximum operation time of multi-layer winding NAOCs under the 30 A current.
4.2. Influence of Current Amplitude on the Maximum Operation Time
Taking the ten-layer winding configuration as an example, numerical simulations were performed to further investigate the influence of current (15 A, 20 A, 25 A, 30 A, 35 A, and 40 A) on the maximum operation time of the multi-layer winding NAOCs.
The temperature rise curves of the ten-layer winding NAOC under different current conditions until reaching the maximum operating temperature are shown in Figure 19, clearly demonstrating the significant influence of the current amplitude on the temperature rise. Based on these results, the maximum operation times corresponding to each current amplitude were determined. A nonlinear curve fitting was then performed to establish the relationship between the current amplitude and maximum operation time under this winding configuration, as expressed in Equation (13). The fitted curve is presented in Figure 20.
where t is the maximum operation time and I is the current amplitude. To further explore the quantitative relationship between the current amplitude and maximum operation time under different numbers of winding layer configurations, a predictive model for the maximum operation time was established. Numerical simulations were conducted for multi-layer winding NAOCs with one-layer to nine-layer winding configurations under various current conditions. The corresponding temperature rise curves up to the limit temperature of 90 °C are presented in Figure 21.
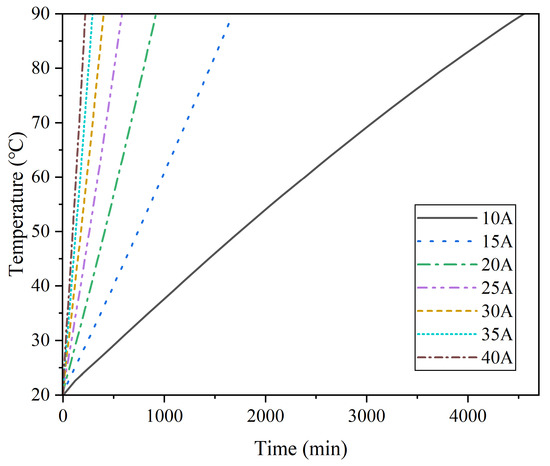
Figure 19.
Temperature rise of the ten-layer winding NAOC.
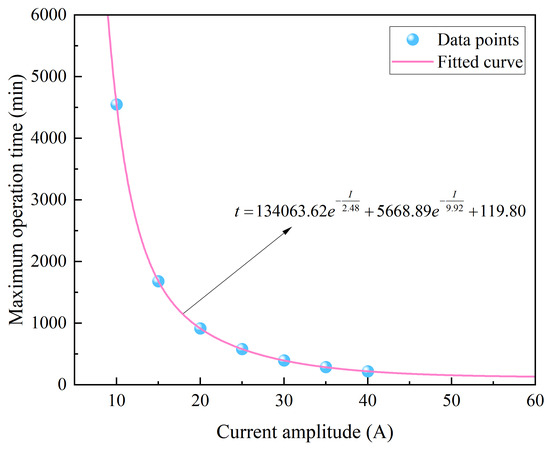
Figure 20.
Fitted curve of the maximum operation time for ten-layer winding NAOC.
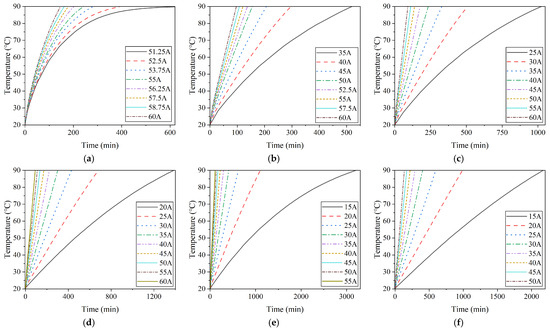

Figure 21.
Temperature rise of multi-layer winding NAOCs under different current conditions: (a) one-layer winding; (b) two-layer winding (c) three-layer winding; (d) four-layer winding; (e) five-layer winding; (f) six-layer winding; (g) seven-layer winding; (h) eight-layer winding; (i) nine-layer winding.
Based on the temperature rise curves, data were extracted and fitted individually for the one-layer to nine-layer winding configurations. Independent fitting equations were derived for each winding configuration, as shown in Equation (14), where t represents the maximum operation time, I is the current amplitude, and a, b, c, d, and e are the corresponding fitting parameters. The specific values of these parameters are provided in Table 10.

Table 10.
Fitting parameters.
4.3. Development of a Comprehensive Multi-Factor Prediction Model
The preceding numerical analysis, which examined the relationship between a single variable (either the number of winding layers or the current amplitude) and the maximum operation time, revealed distinct influence patterns and corresponding quantitative results. Building upon these findings, a multi-variable prediction model is developed to simultaneously account for both the number of winding layers and the current amplitude, thereby offering greater applicability under complex and practical operating conditions. This requires the construction of an appropriate functional relationship and the derivation of a unified predictive equation to replace Equation (14). The new model characterizes the nonlinear relationship between the maximum operation time of multi-layer winding NAOCs under natural convection and the two key variables: the number of winding layers and current amplitude. According to Joule’s law, the heat generated in a conductor is proportional to the square of the current. In practical systems, heat accumulation and dissipation are closely related to the maximum operation time. For multi-layer winding structures, a thermal resistance correction factor associated with the number of layers must be introduced to account for the reduced heat dissipation efficiency as the layer number increases, thus influencing the maximum operation time. Based on these considerations, the proposed functional model is expressed in Equation (15):
where t is the maximum operation time, L is the number of winding layers, I is the current amplitude, and k, m, and n are fitting parameters. Among the variables, m represents the accumulation of thermal resistance associated with the increasing number of layers, while n characterizes the nonlinear attenuation effect of current amplitude on the maximum operation time.
Based on the functional model and multiple sets of simulated results, a nonlinear regression analysis was performed, yielding the predictive model presented in Equation (16). The adjusted R-squared value of the fitted model is 0.9792, indicating that 97.92% of the variance in the maximum operation time is explained by the model, which is close to the ideal value of 1. The Akaike Information Criterion (AIC) and Bayesian Information Criterion (BIC) are 943.6853 and 953.1127, respectively, both indicating relatively low model complexity. These results demonstrate that the developed model provides a good fit to the data, effectively balances model accuracy and complexity, and reliably captures the relationship among the number of winding layers, current amplitude, and maximum operation time. Therefore, it can serve as a robust predictive tool for both research and engineering applications.
In practical engineering applications, ambient temperature may vary across different scenarios. To further improve the applicability of the model under real-world conditions, this study incorporates ambient temperature as a factor influencing the operation of the optoelectronic cable. Additional numerical simulations were conducted under two representative ambient temperatures, 10 °C and 30 °C, to obtain a set of representative data samples. Based on these results, the existing model was optimized by introducing an ambient temperature correction factor kT as an independent variable into the predictive equation, yielding Equation (17):
Taking the result calculated by Equation (16) at 20 °C as the reference value t, and the results under other ambient temperatures as t′, the correction factor kT and t′ satisfy the relationship expressed in Equation (18):
Based on the simulated results, a multiple linear regression analysis was conducted to derive the linear regression equation of the ambient temperature correction factor kT as a function of the winding layer number L, current amplitude I, and ambient temperature T, as presented in Equation (19):
By combining Equations (17) and (19), the final predictive model for the maximum operation time is derived, as shown in Equation (20):
5. Conclusions
This paper focused on multi-layer winding NAOCs and systematically investigated the effects of the number of winding layers and current amplitude on their temperature rise characteristics using both experimental and numerical approaches. The relationships between these key factors and the maximum operation time were quantitatively analyzed, and a predictive model for maximum operation time was established. The main conclusions are as follows:
The temperature distribution along the full length of multi-layer winding NAOCs exhibits a gradient pattern, with the number of temperature gradients corresponding to the number of winding layers. The highest temperature layer and its two adjacent layers form a high-temperature region. Within each layer, the temperature distribution can be divided into three zones: a high-temperature region, a transition region, and a flange contact region. The maximum temperature point is located near the center of the high-temperature region, positioned within a certain distance from both flanges. This characteristic remains consistent under different operating conditions, with variations occurring only in magnitude. Since the highest temperature point lies within the high-temperature region, variations in temperature rise within this area warrant particular attention.
The temperature rise and maximum operation time of multi-layer winding NAOCs are significantly influenced by the number of winding layers and the current amplitude. When the number of winding layers increases from six to eight, the maximum cable temperature rises by more than 20%. Under a 15 A current, the average temperature rise rate is approximately twice that under 10 A and about five times that under 6 A. As the current increases, the temperature rise in the highest-temperature layer exceeds three times that in the lowest temperature layer. A higher current significantly shortens the maximum operation time, whereas reducing the current enhances thermal stability and substantially prolongs the operation time. Considering power transmission requirements, a trade-off between current amplitude and maximum operation time is necessary in practical applications to optimize system efficiency.
The prediction model proposed in this paper achieves a fitting accuracy of 97.92% for the maximum operation time data, with an AIC value of 943.6853 and a BIC value of 953.1127, both at relatively low levels. The model quantitatively reveals the coupled effects of the number of winding layers, current amplitude, and ambient temperature on the maximum operation time of multi-layer winding NAOCs. It provides technical support for predicting the maximum operation time under various operating conditions.
The experimental study presented in this paper was conducted in a controlled cleanroom environment, without accounting for ambient wind speed. In future work, it is essential to introduce external convective airflow as a variable and perform experiments under various wind speeds and directions. This will further enhance the experimental system for investigating the temperature rise characteristics of multi-layer winding NAOCs and enable a more comprehensive understanding of the additional effects of ambient wind conditions in practical operating scenarios.
Author Contributions
Conceptualization, S.L., X.K., Y.Z. and W.L.; methodology, S.L., X.K., Y.Z. and G.L.; software, S.L., X.K. and Y.Z.; validation, S.L., X.K., Y.Z. and G.L.; formal analysis, S.L., X.K. and Y.Z.; investigation, S.L., W.L. and W.S.; resources, S.L., W.L. and W.S.; data curation, S.L., X.K., Y.Z. and G.L.; writing—original draft preparation, S.L. and X.K.; writing—review and editing, S.L., X.K., Y.Z. and G.L.; visualization, S.L., X.K., Y.Z. and G.L.; supervision, S.L. and W.S.; project administration, W.L. and W.S.; funding acquisition, W.L. All authors have read and agreed to the published version of the manuscript.
Funding
This research was funded by the National Key Research and Development Program of China (2023YFC2809602, 2023YFC2809601, 2023YFC2809603), LiaoNing Revitalization Talents Program (XLYC2402020), Dalian Science and Technology Innovation Fund Plan (2024JJ11PTOO4), the Excellent Teaching Achievement Cultivation Project of Dalian Maritime University (YCG-Z2024001), 111 Project (B18009), and the Fundamental Research Funds for the Central Universities (3132023510).
Data Availability Statement
The data presented in this study are available on request from the corresponding author. The data are not publicly available due to privacy and confidentiality considerations.
Conflicts of Interest
Author Weiwei Shen was employed by the company HMN Technologies Group Co., Ltd. The remaining authors declare that the research was conducted in the absence of any commercial or financial relationships that could be construed as a potential conflict of interest.
References
- Li, W.; Wu, H.; Lin, S.; Shen, W.; Lv, Q. Numerical Study on Electromagnetic Thermal Performance of Non-Metallic Armoured Optoelectronic Cable Winch System. J. Mar. Sci. Eng. 2024, 12, 895. [Google Scholar] [CrossRef]
- Suo, Y.; Chen, Y.; Liu, Z. Design and Optimization of Power Supply System with Umbilical Cables for Deep-Sea Underwater Equipment. In Proceedings of the Frontier Academic Forum of Electrical Engineering, Chongqing, China, 21–23 June 2024; Springer: Singapore, 2025; pp. 322–335. [Google Scholar]
- Li, G.; Li, W.; Lin, S.; Li, H.; Ge, Y.; Sun, Y. Dynamic stiffness of braided HMPE ropes under long-term cyclic loads: A full-scale experimental investigation. Ocean Eng. 2021, 230, 109076. [Google Scholar] [CrossRef]
- Foster, G.P. Advantages of fiber rope over wire rope. J. Ind. Text. 2002, 32, 67–75. [Google Scholar] [CrossRef]
- Liu, Z.; Soares, C.G. Numerical study of rope materials of the mooring system for gravity cages. Ocean Eng. 2024, 298, 117135. [Google Scholar] [CrossRef]
- Karahan, M. Coupled electrical and thermal analysis of power cables using finite element method. In Heat Transfer—Engineering Applications; IntechOpen: Vienna, Austria, 2011; pp. 205–230. [Google Scholar]
- Trufanova, N.M.; Navalikhina, E.Y.; Gataulin, T.V. Mathematical modeling of nonstationary processes of heat and mass transfer in a rectangular cable channel. Russ. Electr. Eng. 2015, 86, 656–660. [Google Scholar] [CrossRef]
- Demirol, Y.B.; Kalenderli, Ö. Investigation of effect of laying and bonding parameters of high-voltage underground cables on thermal and electrical performances by multiphysics FEM analysis. Electr. Power Syst. Res. 2024, 227, 109987. [Google Scholar] [CrossRef]
- Li, X.; Yang, J.; Yan, B.; Zheng, X. Insulated Cable Temperature Calculation and Numerical Simulation. MATEC Web Conf. 2018, 175, 03014. [Google Scholar] [CrossRef][Green Version]
- Bustamante, S.; Mínguez, R.; Arroyo, A.; Manana, M.; Laso, A.; Castro, P.; Martinez, R. Thermal behaviour of medium-voltage underground cables under high-load operating conditions. Appl. Therm. Eng. 2019, 156, 444–452. [Google Scholar] [CrossRef]
- Krieger, G.C.; Yanagihara, J.I. Prediction of the temperature distribution of partially submersed umbilical cables. J. Braz. Soc. Mech. Sci. 2012, 34, 205–212. [Google Scholar] [CrossRef]
- Vedachalam, N.; Umapathy, A.; Ramadass, G.A.; Atmanand, M.A. Analysis of the influence of ambient conditions on the ampacity of Kevlar-armoured subsea power cables. Underw. Technol. 2017, 34, 75–82. [Google Scholar] [CrossRef]
- Vedachalam, N.; Umapathy, A.; Ramadass, G.A. Finite element analysis on the overload and short circuit ampacities of Kevlar armored subsea power cable. Mar. Technol. Soc. J. 2017, 51, 36–42. [Google Scholar] [CrossRef]
- Xiong, L.; Chen, Y.; Jiao, Y.; Wang, J.; Hu, X. Study on the Effect of Cable Group Laying Mode on Temperature Field Distribution and Cable Ampacity. Energies 2019, 12, 3397. [Google Scholar] [CrossRef]
- Chen, W.; Zhou, M.; Yan, X.; Li, Z.; Lin, X. Study on electromagnetic-fluid-temperature multiphysics field coupling model for drum of mine cable winding truck. CES Trans. Electr. Mach. Syst. 2021, 5, 133–142. [Google Scholar] [CrossRef]
- Vedachalam, N.; Umapathy, A.; Ramesh, R.; Babu, S.M.; Atmanand, M.A. Ampacity derating analysis of winch-wound power cables: A study based on deep-water ROV umbilical. IEEE J. Ocean. Eng. 2016, 41, 462–470. [Google Scholar]
- Ravichandran, R.; Umapathy, A.; Babu, S.M.; Vedhachalam, N.; Atmanand, M.A. Heat dissipation studies on sub- sea cables wound on winches. In Proceedings of the 2015 IEEE Underwater Technology (UT), Chennai, India, 23–25 February 2015; IEEE: New York, NY, USA, 2015. [Google Scholar]
- Yang, L.; Qiu, W.; Huang, J.; Hao, Y.; Fu, M.; Hou, S.; Li, L. Comparison of Conductor-Temperature Calculations Based on Different Radial-Position-Temperature Detections for High-Voltage Power Cable. Energies 2018, 11, 117. [Google Scholar] [CrossRef]
- Zhang, Y.; Yu, F.; Ma, Z.; Li, J.; Qian, J.; Liang, X.; Zhang, J.; Zhang, M. Conductor temperature monitoring of high-voltage cables on electromagnetic-thermal coupling temperature analysis. Energies 2022, 15, 525. [Google Scholar] [CrossRef]
- Becker, J.S. Development and Deployment of In Situ Fiber Optic Distributed Temperature Sensing Systems and Data Processing Workflows for Oceanographic Observatories in Coastal and Deep-Sea Environments. Ph.D. Thesis, University of Rhode Island, Kingston, RI, USA, 2025. [Google Scholar]
- Ye, H.; Li, W.; Zhang, H.; Lin, S.; Zhang, D.; Ge, Y.; Li, Z. Experimental evaluation of dimension-stable synthetic fibre rope under investigation of spooling test on the multilayer winch drum. Ocean Eng. 2023, 279, 114585. [Google Scholar] [CrossRef]
- Ghoneim, S.S.M.; Ahmed, M.; Sabiha, N.A. Transient thermal performance of power cable ascertained using finite element analysis. Processes 2021, 9, 438. [Google Scholar] [CrossRef]
- Dubitsky, S.; Greshnyakov, G.; Korovkin, N. Comparison of finite element analysis to IEC-60287 for predicting underground cable ampacity. In Proceedings of the International Energy Conference (ENERGYCON), Leuven, Belgium, 4–8 April 2016; IEEE: New York, NY, USA, 2016; pp. 1–6. [Google Scholar]
- Che, C.; Yan, B.; Fu, C.; Li, G.; Qin, C.; Liu, L. Improvement of cable current carrying capacity using COMSOL software. Energy Rep. 2022, 8, 931–942. [Google Scholar] [CrossRef]
- Xu, X.; Yuan, Q.; Sun, X.; Hu, D.; Wang, J. Simulation analysis of carrying capacity of tunnel cable in different laying ways. Int. J. Heat Mass Transf. 2019, 130, 455–459. [Google Scholar] [CrossRef]
Disclaimer/Publisher’s Note: The statements, opinions and data contained in all publications are solely those of the individual author(s) and contributor(s) and not of MDPI and/or the editor(s). MDPI and/or the editor(s) disclaim responsibility for any injury to people or property resulting from any ideas, methods, instructions or products referred to in the content. |
© 2025 by the authors. Licensee MDPI, Basel, Switzerland. This article is an open access article distributed under the terms and conditions of the Creative Commons Attribution (CC BY) license (https://creativecommons.org/licenses/by/4.0/).