1. Introduction
Marine pollution has long been a focal point of human concern [
1], as it poses a serious threat to ecosystems [
2]. With the increasing frequency of oil drilling and shipping activities, concerns about oil-related accidents have continued to grow [
3]. Once the leaked oil reaches the coastline or nearshore areas, the situation becomes more complex and worsens [
4].
To date, satellite remote-sensing technology has developed into a mainstream approach for marine oil spill monitoring [
5]. Synthetic Aperture Radar (SAR), with its unique cloud-penetrating imaging capability and all-weather monitoring features [
6], has demonstrated significant technical advantages in oil spill identification [
7].
Its imaging mechanism is a radar that actively emits an electromagnetic signal to the ground at a certain angle of incidence and receives and processes the backward-scatter signal from the ground to generate images. When an oil spill occurs, the oil film covering the sea will change its surface roughness, resulting in a weakening of the back-ray signal, thus presenting obvious “dark speckle” features on the radar image [
8]. However, other phenomena such as a ship’s stern marks and low-wind-speed zones also show lower rear-scattering characteristics on the image. Therefore, how to effectively distinguish the oil spill area from the suspected oil spill is the key to oil spill detection [
9].
Aiming to mitigate the shortcomings of traditional unipolar SAR, such as providing limited information and vulnerability to background noise interference, multipolar SAR has emerged. Zhang et al. proposed an adaptive mechanism based on the Otsu method, which combines region growing with edge detection and threshold segmentation to extract oil spills [
10]. While the threshold segmentation methodology demonstrates notable advantages in marine oil spill detection, its practical application reveals substantial limitations. The technique exhibits heightened sensitivity to the signal-to-noise ratio in remote-sensing imagery, and is particularly susceptible to sea surface clutter interference.
With the development of machine learning and neural networks, decision trees [
11], fuzzy logic [
12], and multi-layer perceptual neural networks [
13] have been applied to oil spill detection, and the accuracy of the oil spill detection has been improved to a certain extent. However, these methods are prone to fragmentation during the detection process, which leads to the detection results of the oil spill area presenting a scattered or fragmented pattern, and misclassification of the oil spill as seawater or other features. To its credit, deep learning exhibits a powerful capability for learning representations, which can automatically extract information from a large amount of data [
14]. Ma et al. proposed a deep convolutional neural network (DCNN) with up to 12 weighted layers [
15]. The increase in weighted layers enables the network to better extract multi-level oil spill characteristics from SAR images. However, the training and updating of the deep learning network rely heavily on a large number of training samples, while oil spill accidents are characterized by high pollution, requiring rapid emergency response, and occur by chance, making it difficult to obtain a large amount of oil spill sample data in practical monitoring. In addition, due to the high cost of conducting oil spill experiments, this also leads to difficulty in obtaining oil spill sample data. Fortunately, the emergence of few-shot learning methods provides new ideas to address this problem.
As of now, methodologically speaking, there are currently three main several shot learning methods: model fine-tuning [
16], data enhancement [
17], and migration learning [
18]. Among them, the meta-learning method in migration learning is widely used because it can quickly adapt to new classification tasks. Meta-learning has achieved excellent research results in many fields; its core idea is to let machines ‘learn to learn’, so that they have the ability to analyze and solve problems, similar to the human brain. At present, the use of meta-learning to detect oil spills with few-shot is rare; however, meta-learning methods are commonly used in the field of SAR image classification. For instance, Yuan Tai et al. proposed a complex CNN-based source network using few-shot learning to extract rich sample features, which are then processed by a disconnected attention module to generate output features [
19]. These features are selectively transferred to the target network for classifying target domain data. Experimental results on three real SAR datasets demonstrate that the proposed method exhibits significant superiority in ground object classification tasks. Haorun Li et al. proposed an innovative hybrid network for target classification in SAR imagery, designed to independently extract spatial and frequency-domain information [
20]. Experimental results demonstrate that the network exhibits excellent classification performance across various few-shot scenarios.
However, convolutional neural networks are limited to capturing only local feature information from images and struggle to model long-range dependencies in oil spill imagery, thereby neglecting global contextual information. This limitation results in insufficient feature extraction for SAR target classification, consequently constraining further improvements in classification accuracy. In addition, in few-shot learning paradigms, upon completion of feature extraction, both support set features and query set samples are projected into a category metric space. Within this space, the classification of unknown samples is achieved by comparing the distances between the features of the samples to be classified in the query set and those of the known categories in the support set. Subsequently, this classification capability is transferred to the target domain through transfer learning, enabling the classification of target domain samples.
Based on this, a series of few-shot learning-based methods have been successively proposed. Dalal Alajaji et al. introduced a deep few-shot learning method for remote-sensing scene classification. This method is based on a prototypical deep neural network framework, combined with a pre-trained SqueezeNet convolutional neural network for image features embedding, and achieves classification by computing the distance between the support set samples and unlabeled samples for each category in the embedding space [
21]. Liu et al. proposed a metric-based deep few-shot learning (DFSL) method [
22]. This approach leverages the source domain dataset to learn a category metric space, in which the classification of query samples is achieved by measuring the distance between the samples to be classified and the support set samples. Subsequently, the learned category metric space is generalized to the target domain dataset, thereby achieving effective classification performance on the target domain. However, existing few-shot learning networks primarily focus on the distance between query set samples and support set samples, while neglecting the inter-class distances among samples of different categories within the support set. When samples from different categories in the support set are closely distributed in the feature space, the network struggles to accurately determine the categorical affiliation of query samples relative to the support set samples during classification, thereby compromising classification performance. In the feature extraction of SAR oil spill images, due to the similarity in backscattering characteristics between suspected oil films and actual oil spills, when the features of the support set and query set are mapped into the metric space, the features of suspected oil films and actual oil spills in the support set often exhibit close proximity in distance metrics. This similarity can interfere with distance-based classification decisions, leading to misclassification of query samples with true seawater labels as oil spills. Therefore, there is an urgent need for an effective method to address the challenge of distinguishing between similar samples that are too close in the metric space.
In summary, the existing SAR oil spill image detection method still faces problems of too few oil spill samples and insufficient training, and the feature extraction network fails to effectively excavate the global and local feature information of the oil spill image at the same time. Furthermore, the close proximity of oil films and suspected oil films in the few-shot metric space makes it difficult to distinguish between them effectively. To address these challenges, this paper proposes a hybrid attention feature extraction block that integrates both global and local feature mining capabilities. A category-aware loss function is designed to enhance the distinguishability of feature distances, and a high-precision SAR oil spill detection framework is developed under few-shot conditions based on meta-learning strategies. The main contributions of this article are as follows:
(1) This study innovatively applies meta-learning techniques to the field of oil spill detection, aiming to address the critical issue of sample scarcity. Through systematic training of oil spill data from the source domain, the model acquires in-depth knowledge of characteristic features across various categories in oil spill imagery. This knowledge is then effectively transferred to the target domain, enabling accurate classification with limited samples, thereby significantly enhancing the accuracy of oil spill detection in the target domain.
(2) A hybrid attention feature extraction block is constructed to comprehensively explore both global and local features in oil spill imagery. The block consists of three key components: the coordinate attention module enables the network to obtain long-distance relationships in one direction and retain spatial location information in the other direction at the same time, thus enhancing the network’s ability to capture spatial location and channel information. Secondly, the global self-attention transformer module effectively captures global dependencies by modeling self-correlation among pixels. Finally, the multi-scale self-attention module employs diverse window partitioning strategies, allowing the network to precisely focus on local oil spill characteristics, thus substantially improving the accuracy of oil spill detection.
(3) A novel loss function, termed category-perception distance loss, which introduces a groundbreaking approach to feature space optimization. By minimizing the objective function value—specifically, the discrepancy in category-aware distances between output and input feature vectors—the model achieves dual optimization in the feature space: it significantly reduces intra-class distances (e.g., oil spill–oil spill, seawater–seawater) while effectively expanding inter-class distances (e.g., oil spill–non oil spill, seawater–ship). This dual optimization mechanism ensures tight clustering of similar samples and effective separation of dissimilar samples in the feature space, thereby substantially enhancing the accuracy of oil spill detection.
The rest of this article is organized as follows. The second section introduces the data used and the research area. The third section introduces the framework of the proposed model. The fourth section introduces the results and discussions. The fifth section summarizes.
3. Proposed Method
In addressing the few-shot scenario, where distinguishing between oil films and suspected oil films proves difficult, this is primarily due to two factors: their close proximity in metric spaces and the insufficient extraction of discriminative features from oil spill images. This paper proposes a cross-domain few-shot SAR oil spill detection network that incorporates hybrid attention and category-perception mechanisms. In the realm of feature extraction, a hybrid attention block is constructed to thoroughly explore the deep-level characteristics of oil spill imagery. The proposed method initially augments the network’s capacity to capture spatial location and channel information through the integration of the coordinate attention module. Subsequently, it leverages the global self-attention module alongside the multi-scale self-attention module to thoroughly extract both global contextual and local details from the imagery, thereby bolstering the efficacy of oil spill detection. Furthermore, a category-perception loss function is proposed to enhance the network’s capability in distinguishing between oil spills and non-oil spill regions.
Based on the aforementioned improvements in both feature extraction and classification decision-making, the proposed detection network in this study significantly enhances the accuracy of oil spill detection across various scenarios.
3.1. Framework
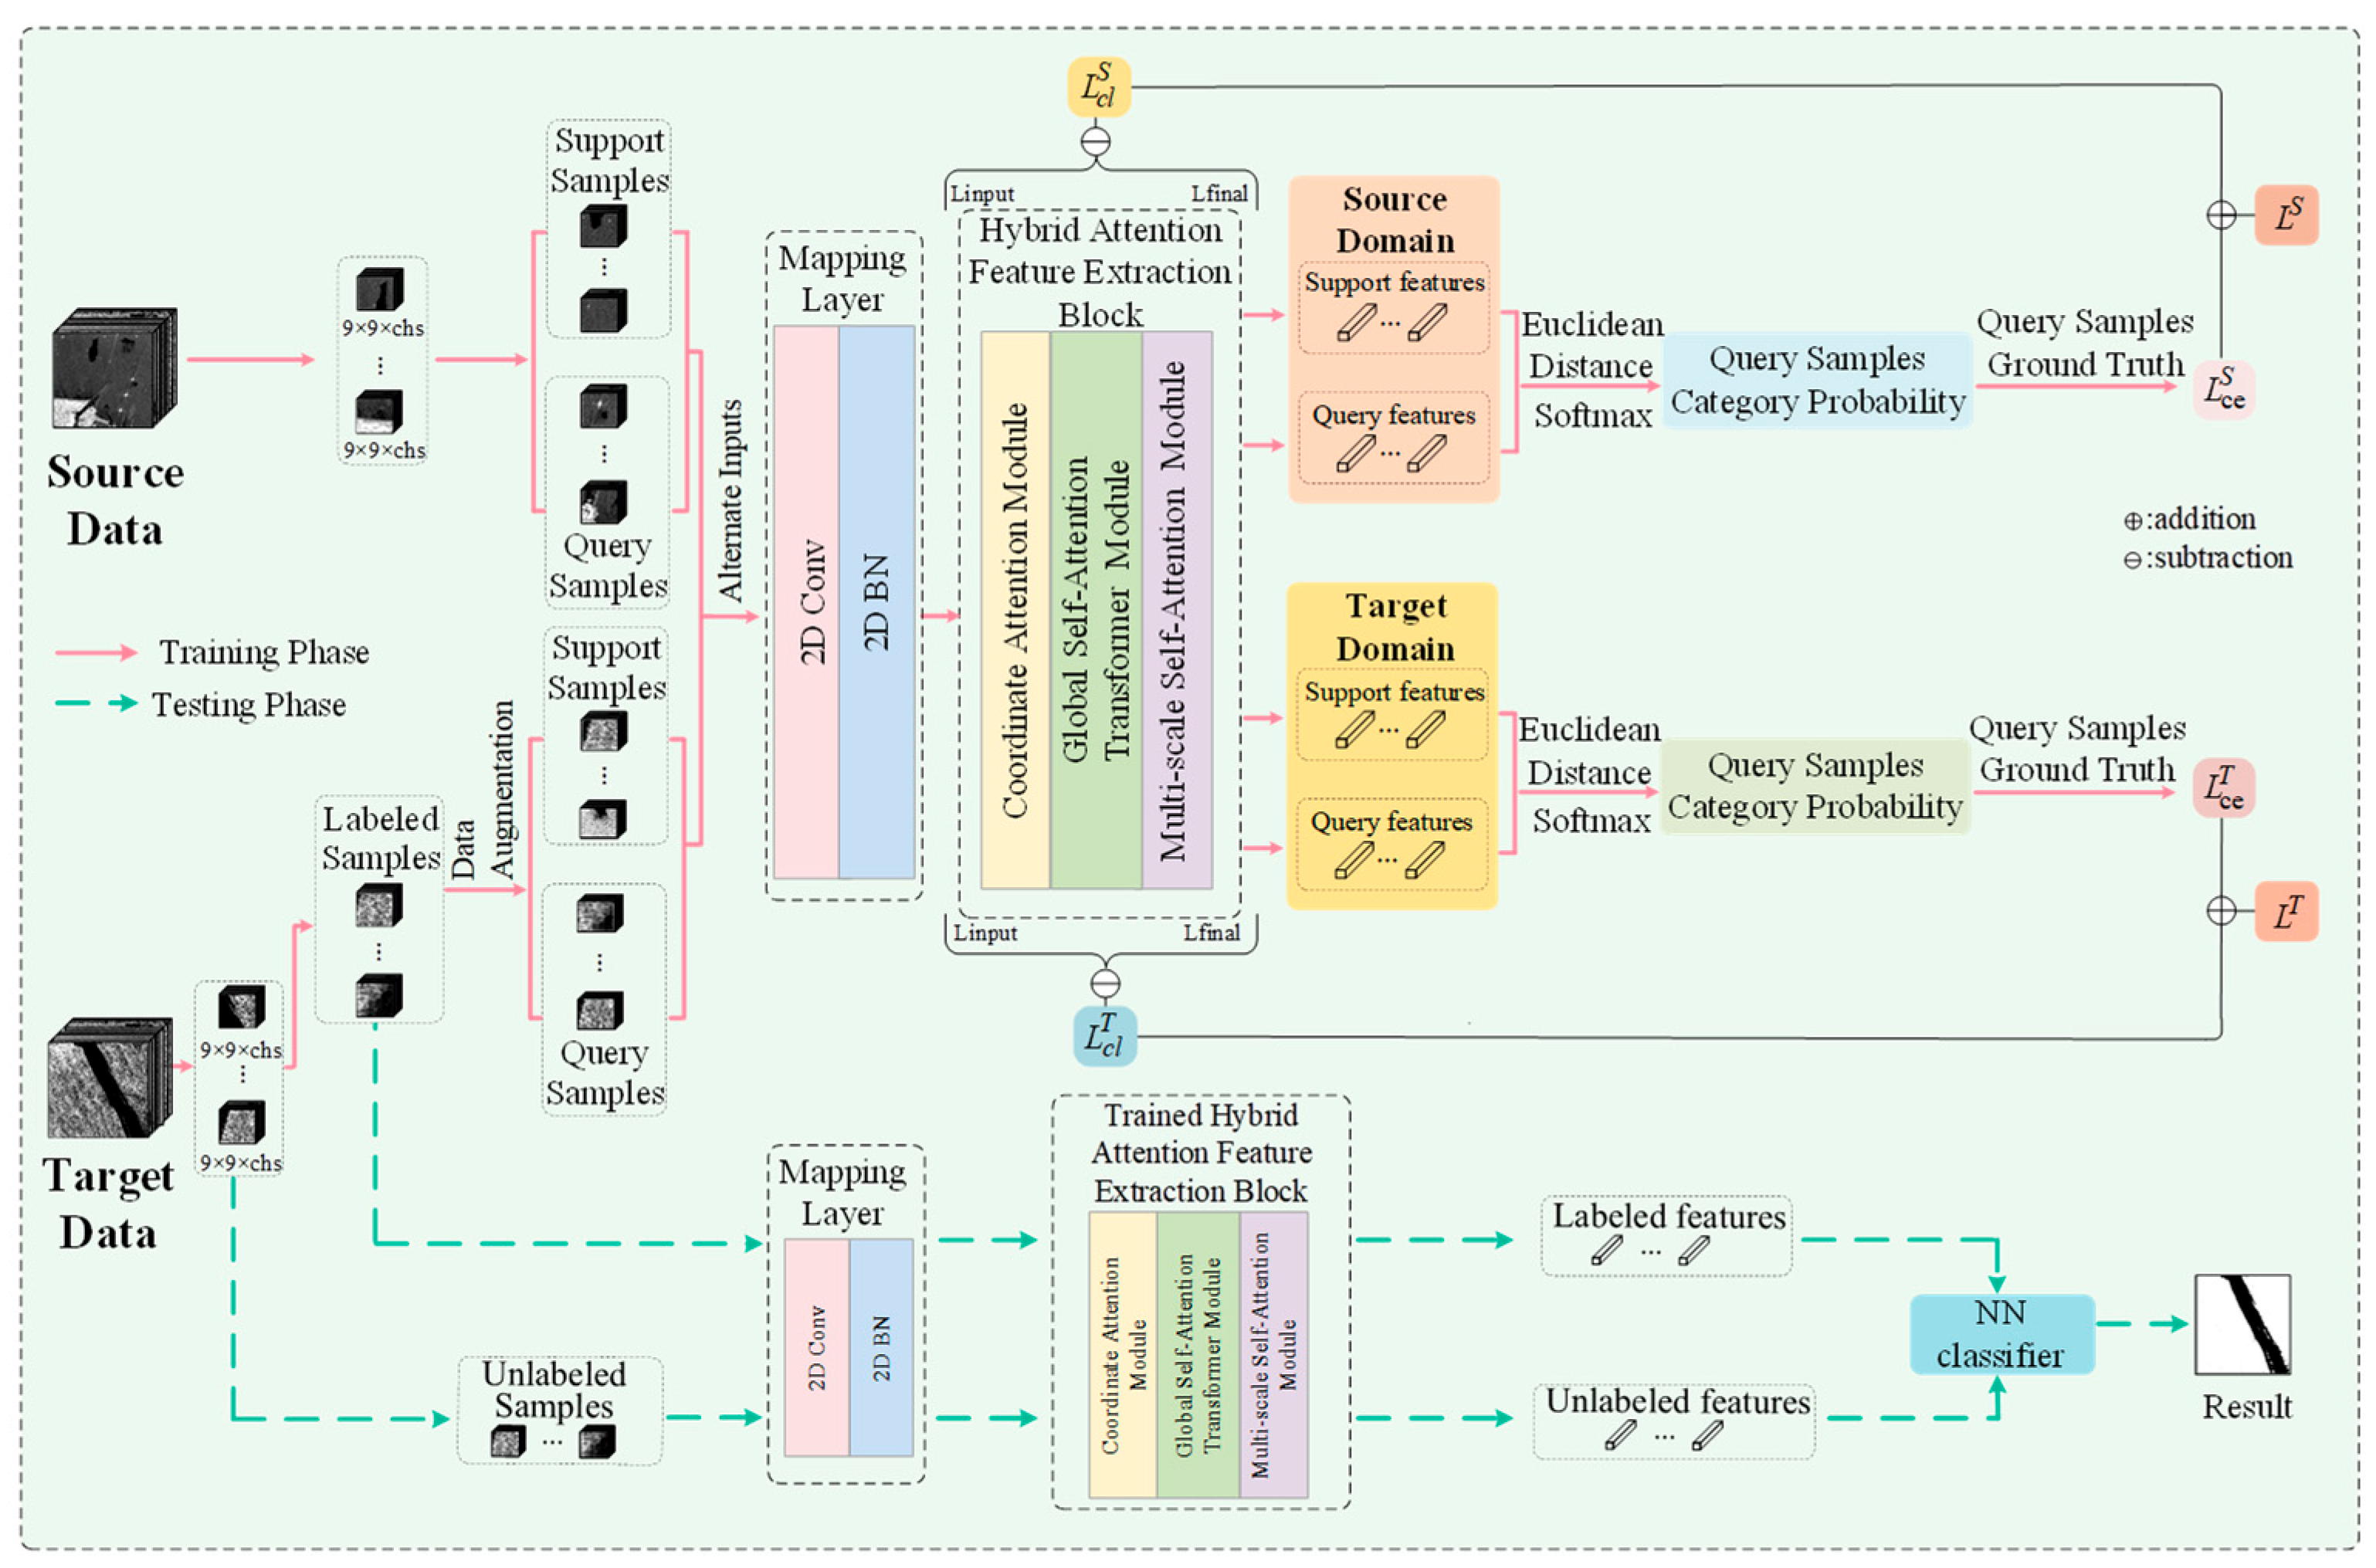
As shown in
Figure 2, the specific process of HA-CP-Net mainly includes two stages: (a) the alternate training stage of the source domain data and the training data in the target domain, and (b) the classification stage of the target domain test data. In the first stage, the network initially employs the mapping layer to standardize the channel count of both source and target domain data. Subsequently, it utilizes the hybrid attention feature extraction block to derive global and local features from the two domains. These features are then projected into a metric space defined by category-perception distance. Within this space, samples belonging to the same category are drawn closer together, while those from different categories are pushed further apart, thereby augmenting the model’s classification capacity. During the training process of labeled samples in the target domain, Gaussian noise is strategically incorporated for data augmentation to meet the model’s training requirements. In the second stage, the pre-trained mapping layer and hybrid attention feature extraction block are employed to extract distinctive features from both labeled and unlabeled datasets. These extracted features are then fed into the NN classifier for sample classification, ultimately yielding a comprehensive classification result map that facilitates a thorough evaluation of the model’s performance.
In this study, to facilitate the effective transfer of knowledge acquired from the source domain to the target domain by the network, a strategy involving the alternate training of source domain and target domain data is implemented. Specifically,
category is randomly selected from the source domain data,
and
samples are selected successively from each category to form a support set
and query set
of the source domain. Among them,
and
, respectively, represent the
sample in the support set and the corresponding label and the
sample in the query set and the corresponding label. Then, the selected support set and query set will be reorganized for the training task of the source domain. In the target domain data training, divide the target domain dataset into the training set
and the test set
firstly [
25].
To meet the needs of few-shot learning tasks, the data is enhanced for
by adding Gaussian noise. Similarly, in the target domain training,
samples of the target domain dataset are randomly sampled to form a support set
and a query set
, and reorganize it. The learning process is the same as the source domain data training process. Taking the sample
in the query set
as an example, its probability distribution in the characteristic space is:
From these,
refers to the European distance function,
is the real label of the query sample
,
refers to the feature extracted by the optimization parameter
,
is the feature of the
class in the support set, and
is the number of each category in each scenario training task. To achieve channel dimension consistency between the source and target domain data when feeding into the feature extraction network, a 2D convolutional layer is first applied to process the input data, unifying the channel dimensions of both domains to a standardized size of 18. The output of the mapping layer can be mathematically represented as:
From these, is the input data, is the converted data, and is the conversion matrix.
3.2. Hybrid Attention Feature Extraction Block
For enhanced extraction of both global and localized fine-grained features in oil spill imagery, this paper builds a hybrid attention feature extraction block, which includes three parts: coordinate attention module and global self-attention transformer module, and multi-scale self-attention module. The detailed explanation is as follows.
3.2.1. Coordinate Attention Module [26]
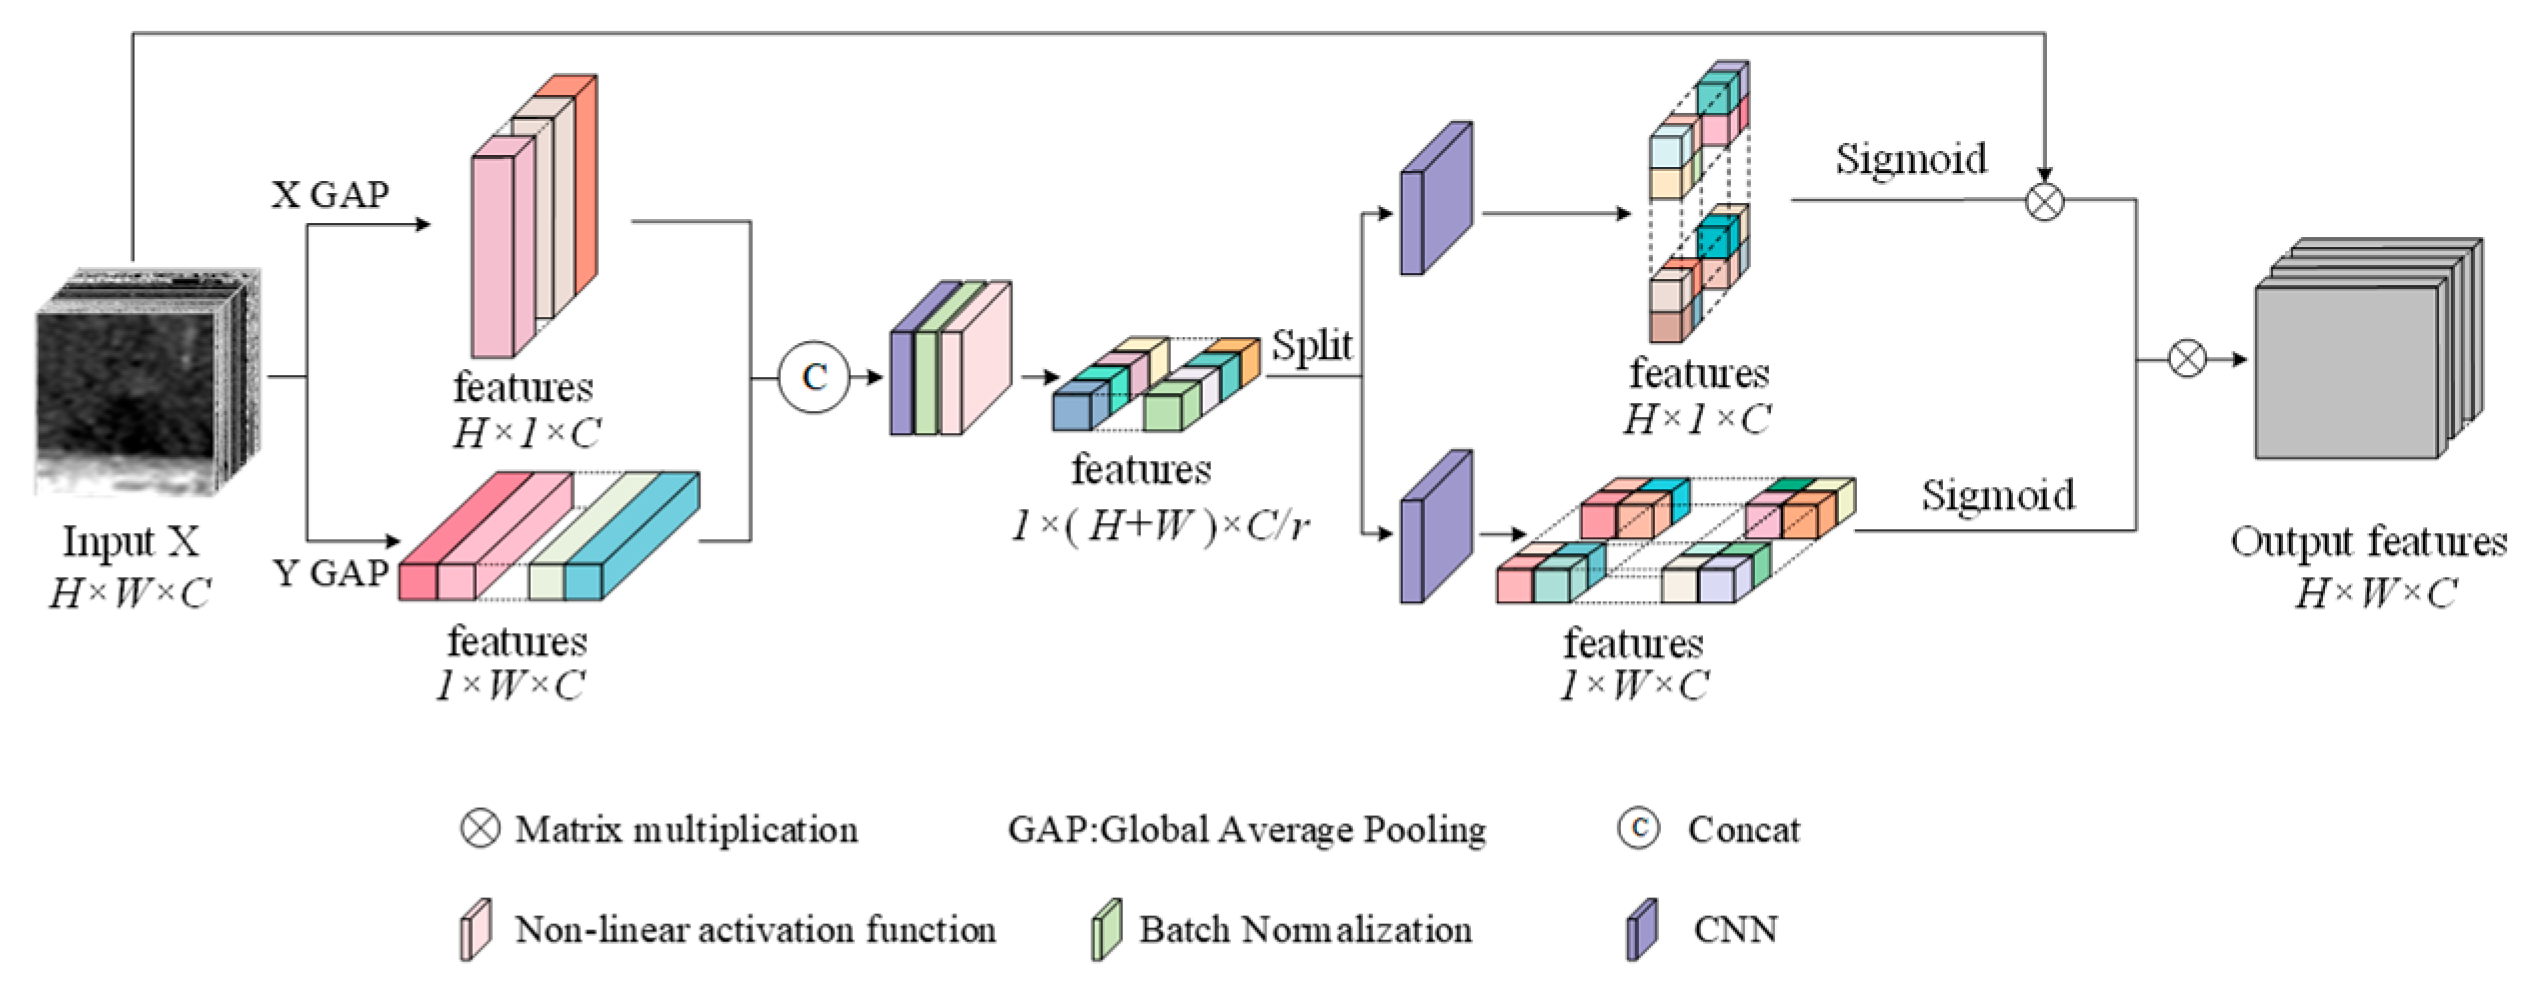
This paper incorporates coordinated attention to perform global positional encoding on SAR imagery, thereby capturing both spatial and channel information of the images. Notably, coordinate attention is capable of capturing long-range dependencies along one spatial dimension while retaining precise positional information along the other, thereby aiding the network in more accurately localizing the target of interest. Subsequently, the captured positional information is integrated through channel-wise weighting, which adaptively modulates the network’s attention to each pixel in SAR oil spill imagery, thereby enhancing the network’s feature representation capability.
The structure of coordinated attention is shown in
Figure 3. Specifically, given the input image
, the global average pooling is used in two spatial ranges
or
, and each channel is coded along the direction
and
, respectively, to obtain the characteristics of the two directions. These two characteristics can be expressed as
In the formula, is the output characteristic of the height of the channel , is the index of the width, and is the total width; is the output characteristic of the width of the channel , is the index of the height, and is the total height.
Then the two transformed feature maps obtained above are concatenated and then fed into a shared 1 × 1 convolutional
to generate the new feature
.
In the formula, is the splicing operation along the spatial dimension, is a nonlinear activation function.
Next, split
into two separate tensors
and
along the spatial dimension. Use the other two
convolutional transformations
and
to convert
and
into characteristics with the same number of channels as the input
, respectively, and obtain
and
;
and
can be expressed as
Then the output
and
are used as attention weights. The final output of the coordinate attention-processed feature maps
can be represented as
In the formula, represents the input original figure, is the weight of the channel height , and is the weight of the channel width .
3.2.2. Global Self-Attention Transformer Module
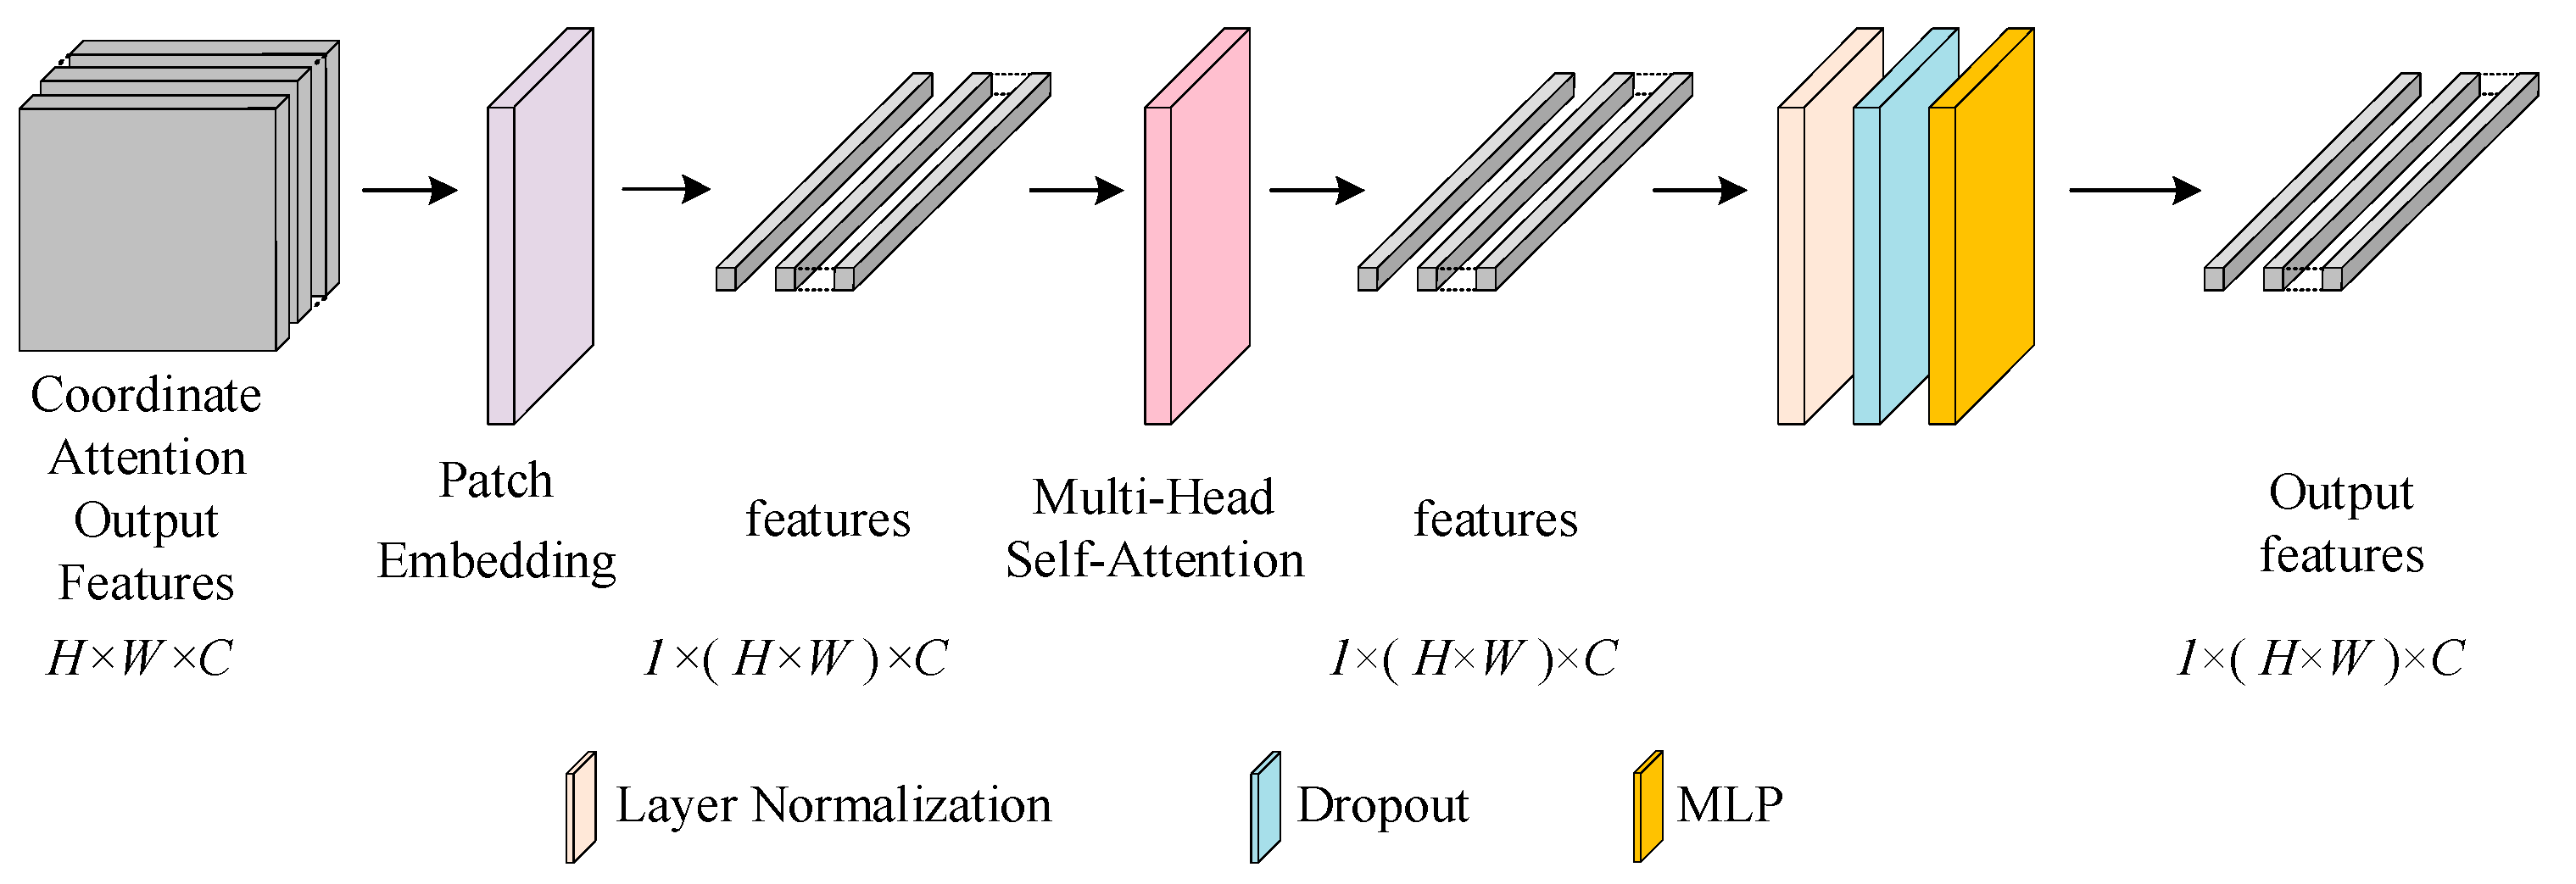
To extract the global feature representation of oil spill imagery, the inter-pixel self-correlations are meticulously modeled utilizing the global self-attention module. This module is composed of patch embedding, multi-head self-attention, normalization layer, dropout, and MLP, as illustrated in
Figure 4 below.
Initially, the feature map derived from coordinated attention is transformed into vectors via patch embedding. Subsequently, to acquire the similarity among the input vectors, thereby establishing global dependencies and bolstering the network’s capacity to capture contextual information within the image, the multi-head self-attention mechanism is employed to extract global features. Following this, the features undergo normalization, dropout, and processing through MLP to expedite the model’s convergence, augment its nonlinear expressive power, and further refine its generalization capability.
In particular, the “multi-head” component in multi-head attention architecture implements parallel self-attention mechanisms that operate independently. This design principle enables concurrent extraction of heterogeneous feature representations from multiple representation subspaces. The mathematical formulation of the multi-head self-attention mechanism is presented below [
27]:
Among them, represents the number of attention heads, is the input vector, represents the query vector, represents the key vector, and represents the value vector. is the scale scaling factor, and is the relative position coding.
The term computes the query-key similarity matrix, which is scaled by to prevent gradient anomalies. The SoftMax normalization then generates attention weights, which are finally weighted and summed with the value matrix. The positional bias term explicitly introduces spatial constraints. The design of self-attention breaks through the limited receptive field of traditional convolutional operations. This enables adaptive focus on salient features of oil spills while suppressing background interference in oil spill detection.
3.2.3. Multi-Scale Self-Attention Module
For enhanced extraction of localized features in SAR oil spill images, this module utilizes windows with varying segmentation strategies, which facilitate focused attention on window-specific information. This design significantly improves the network’s capability to capture subtle oil spill patterns, consequently boosting detection accuracy.
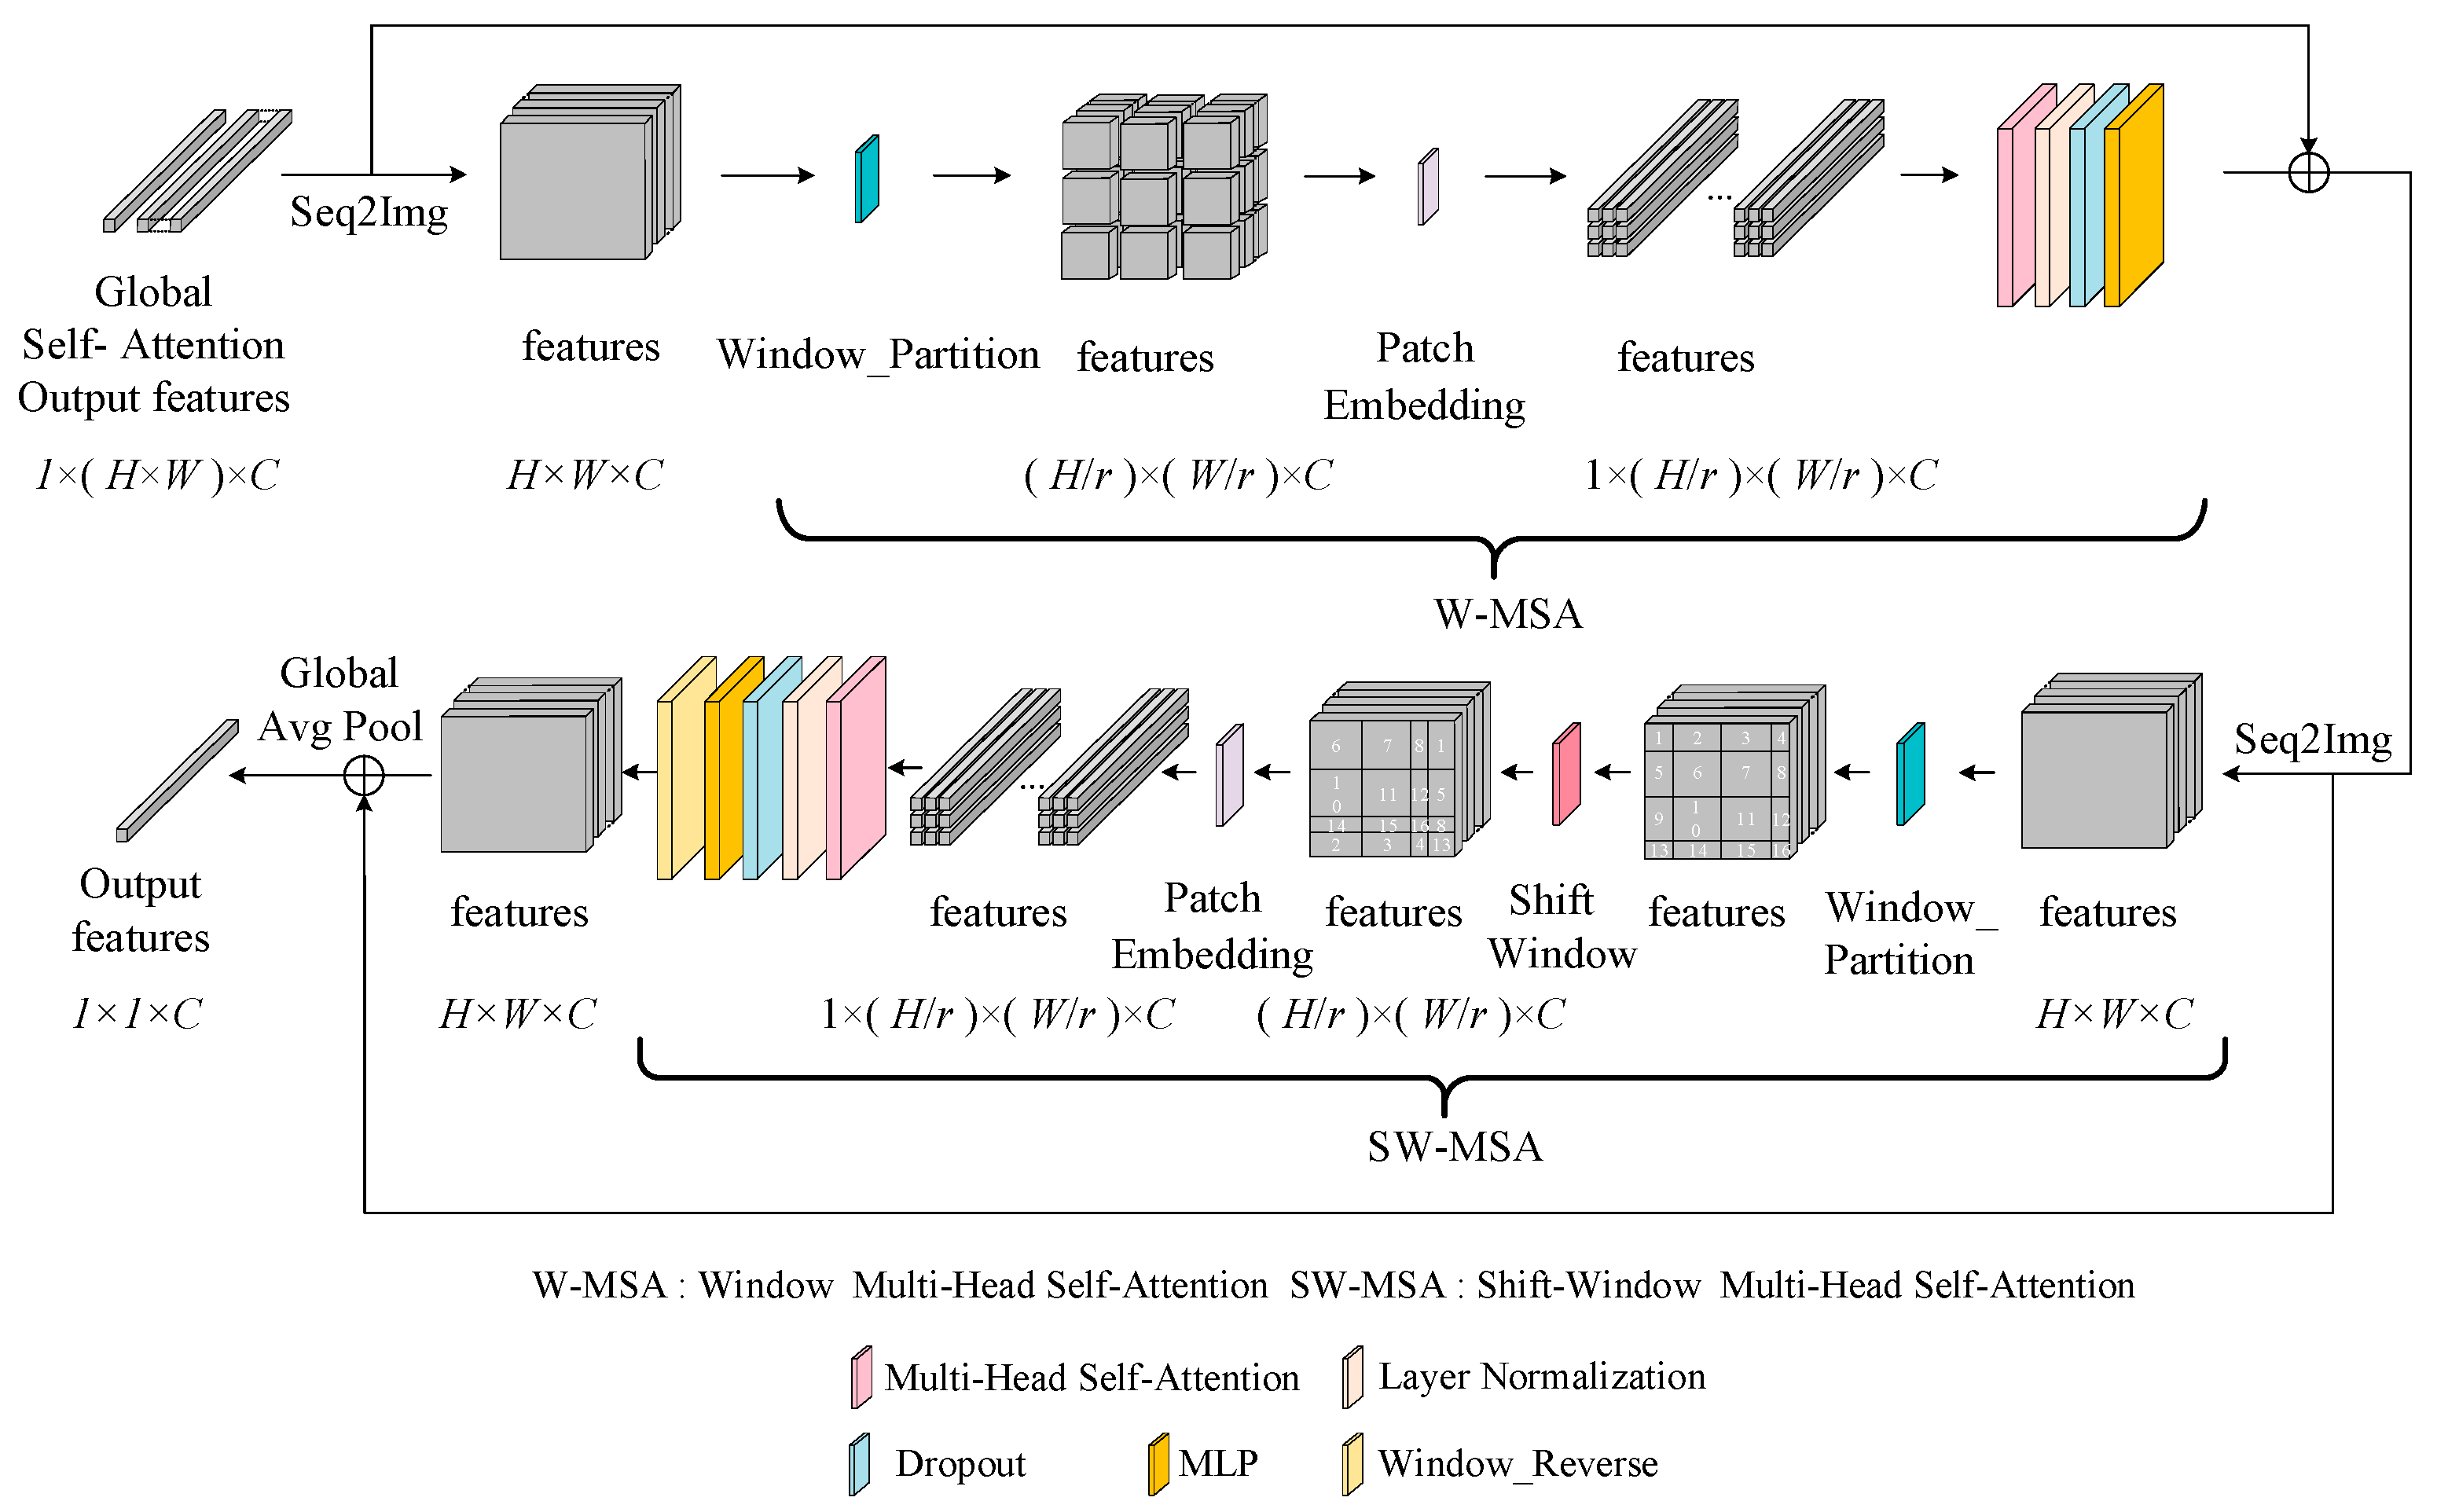
To this end, a multi-scale self-attention module (as shown in
Figure 5) is designed, which mainly includes the W-MSA (Window-Multi Head Self-Attention) mechanism and the SW-MSA (Shift Window-Multi Head Self-Attention) mechanism [
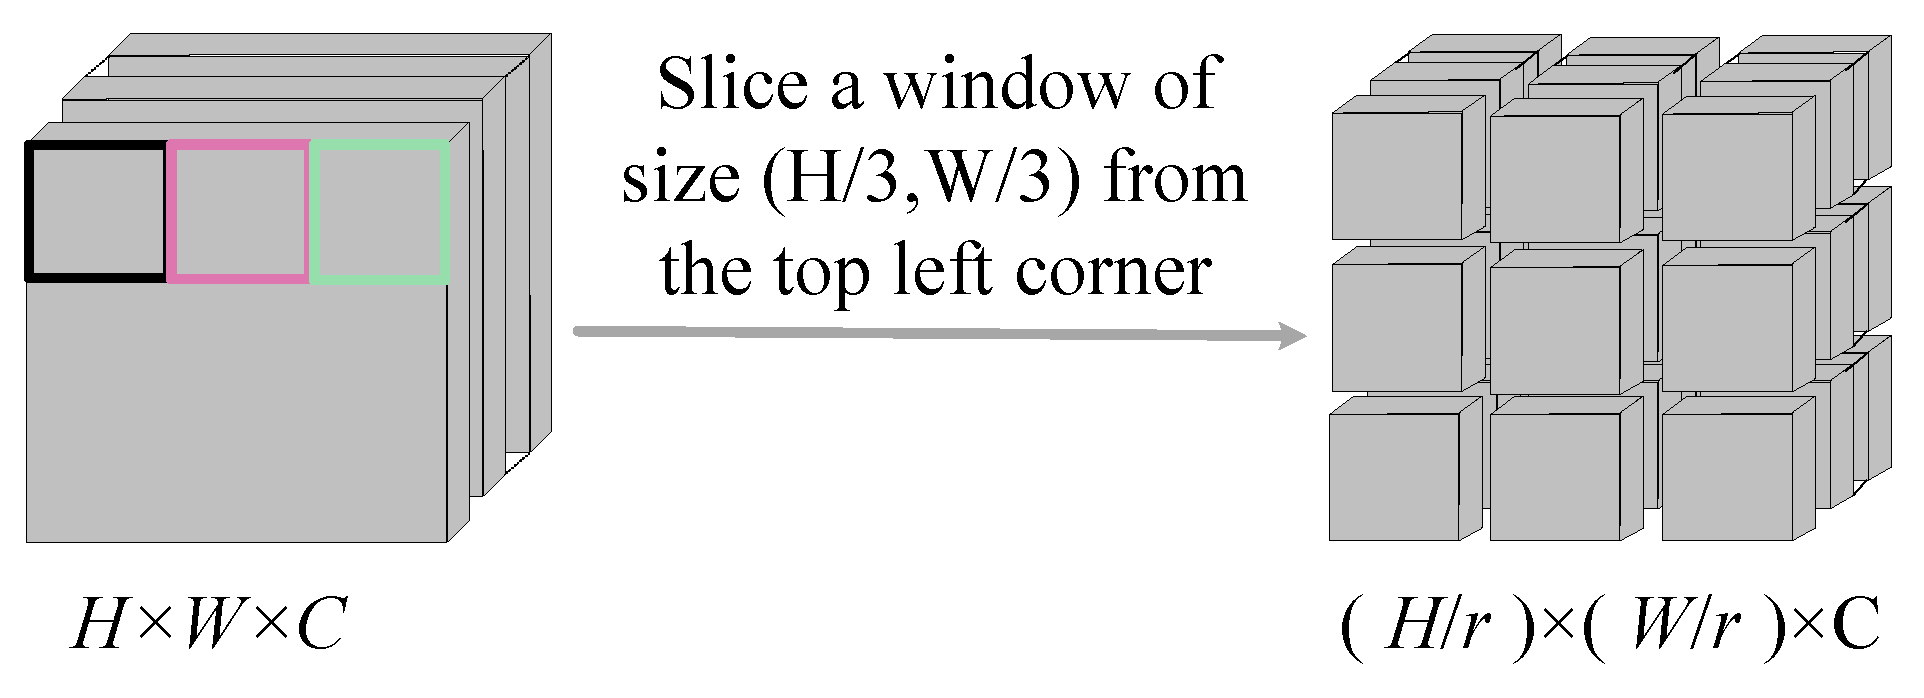
28]. The specific details now follow. W-MSA mechanism: To facilitate image segmentation, the Seq2Img operation is utilized to reshape the input feature vectors into feature images. Subsequently, through the segmentation operation depicted in
Figure 6, the large feature map is partitioned into multiple non-overlapping small feature maps. Self-attention is then computed within each small feature map to acquire the similarity of pixels within the local window, thereby yielding the weighted feature map.
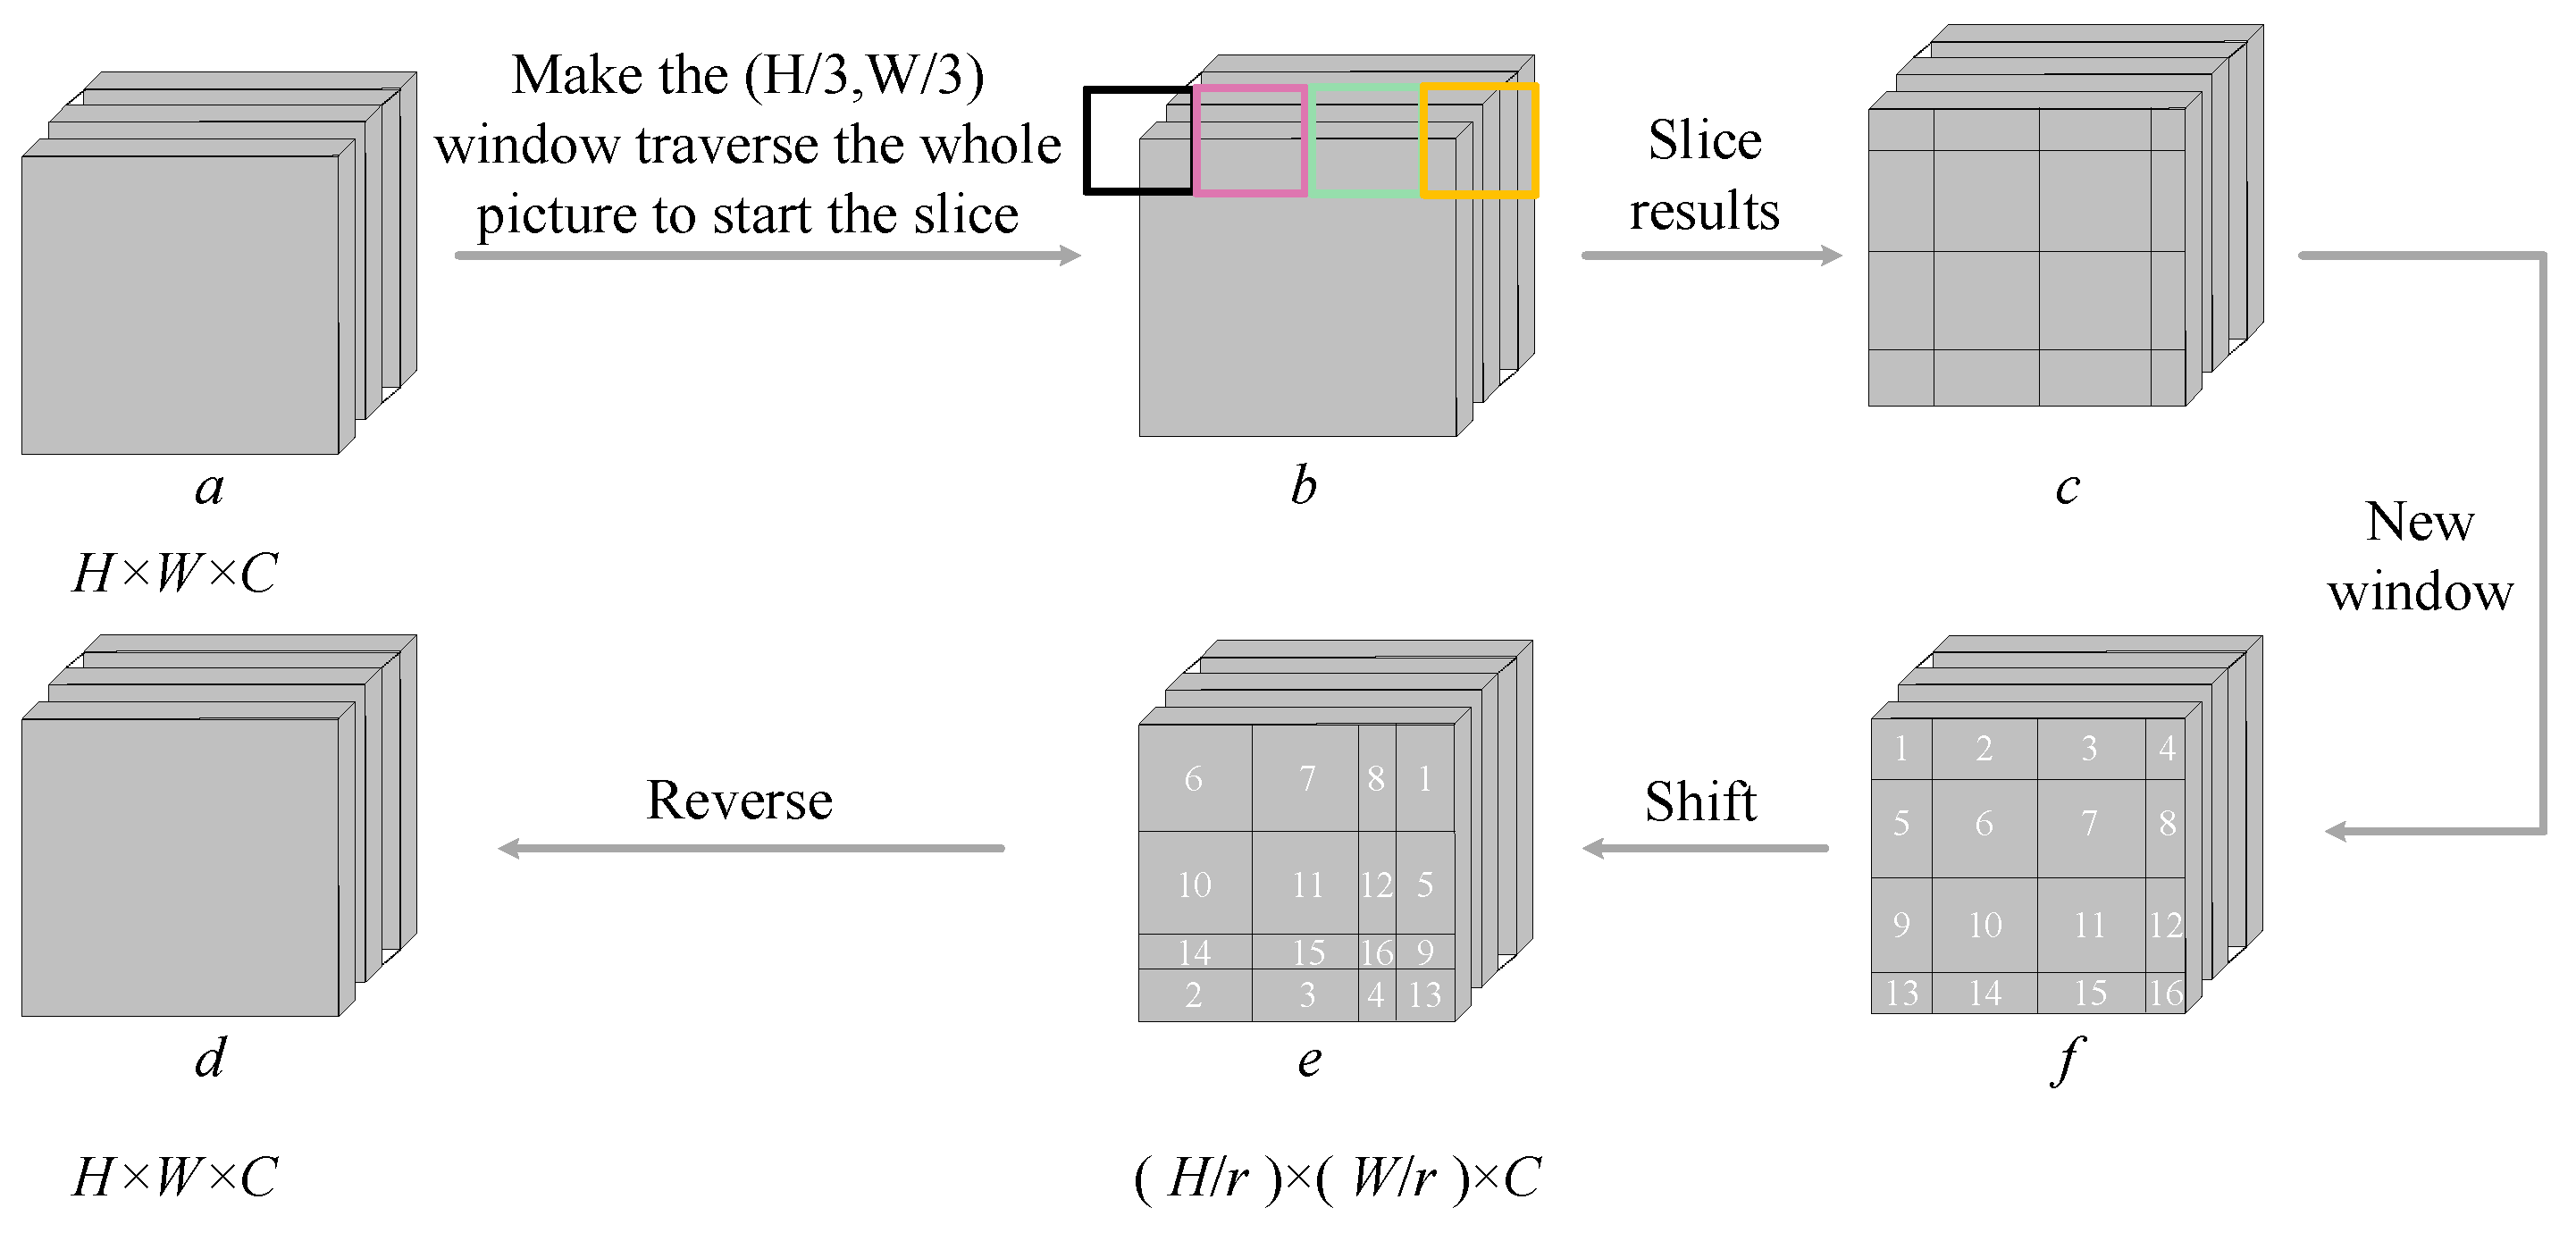
SW-MSA mechanism: In the W-MSA mechanism, the direct communication between pixels across different windows is impeded, which imposes certain limitations on the extraction of neighborhood feature information. To address this, the SW-MSA mechanism re-partitions the image windows as illustrated in
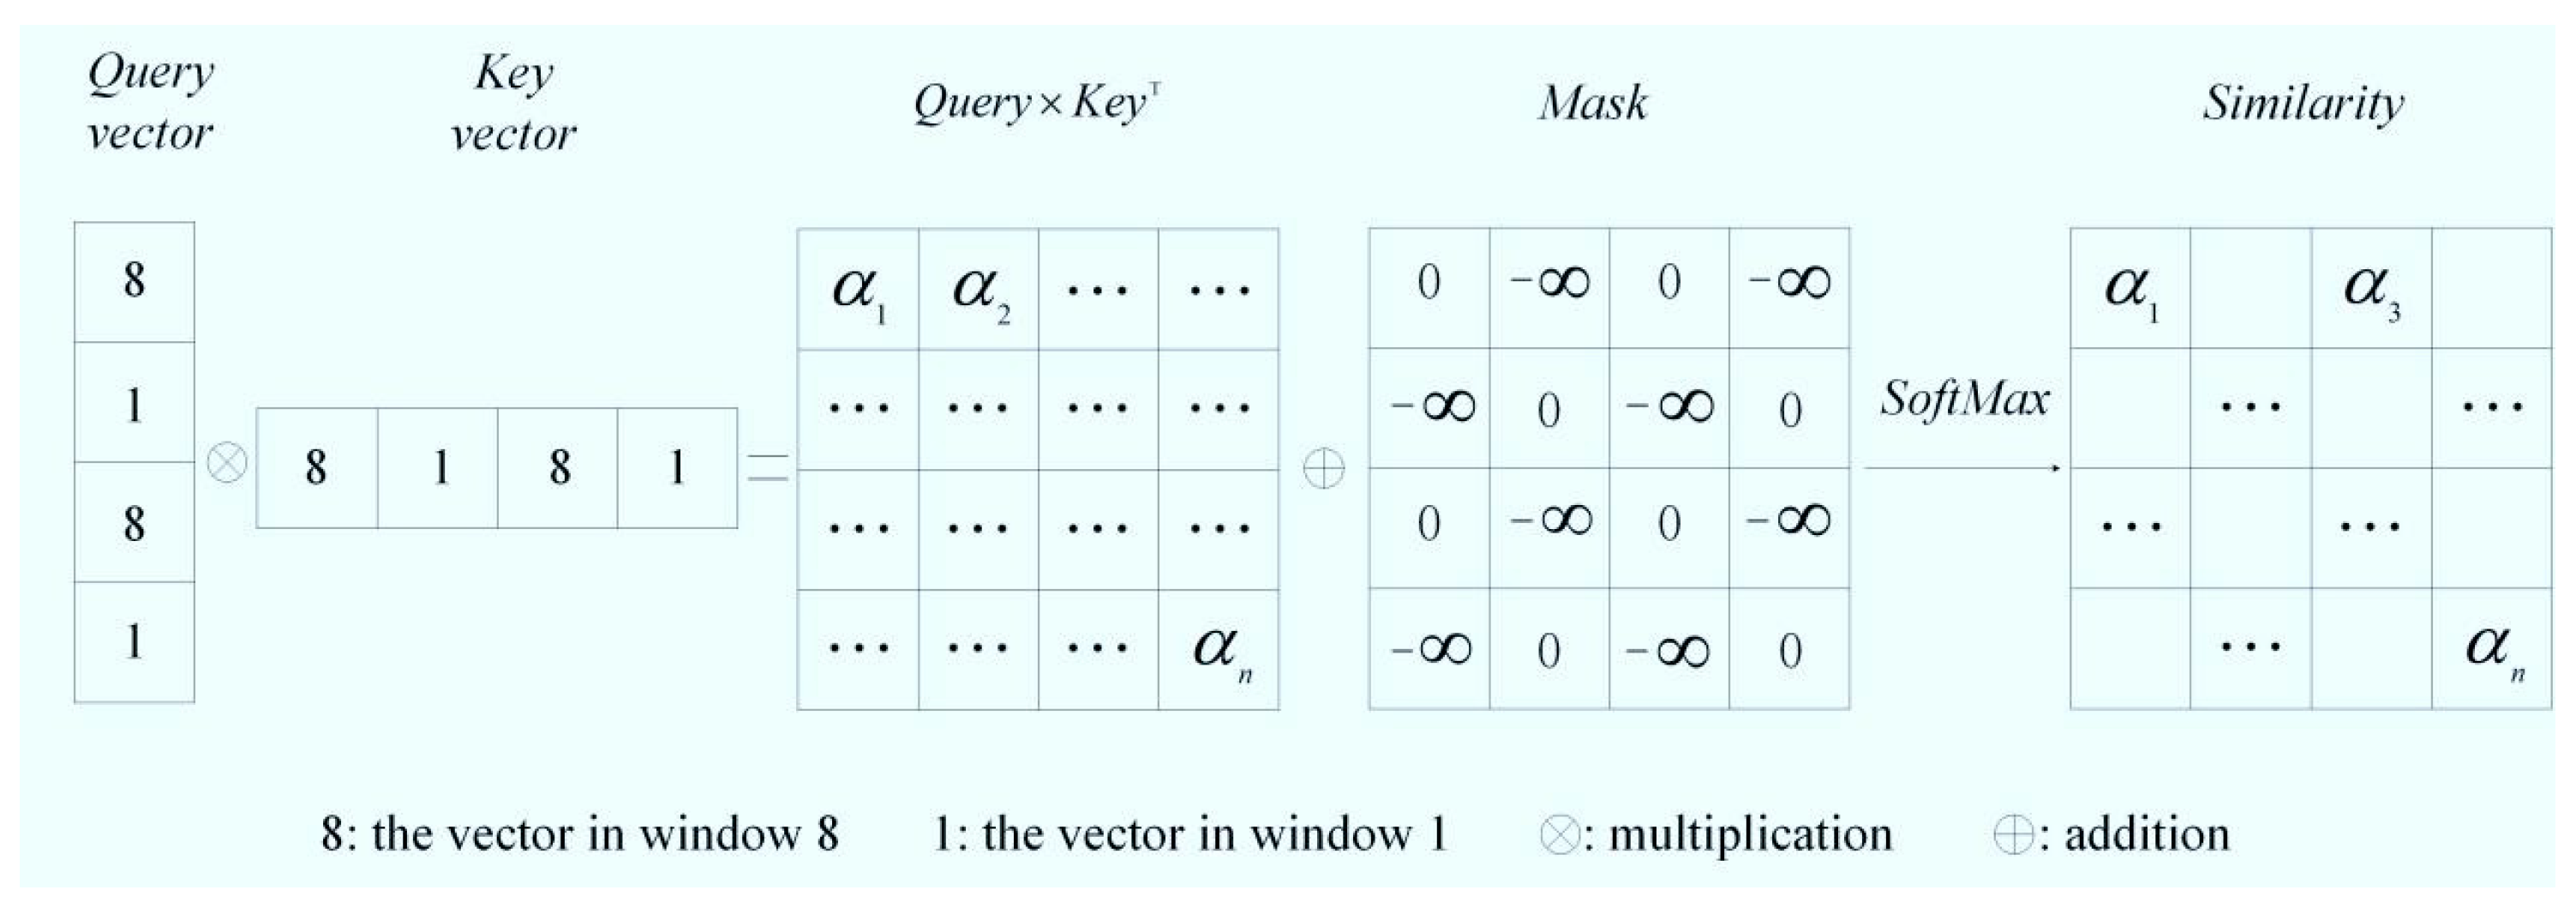
Figure 7b. The new windows retain some pixels from the old windows, and self-attention is then computed within these new windows to facilitate information exchange, thereby enabling a more comprehensive extraction of feature information. Notably, to alleviate computational complexity, the shift splicing operation is strategically implemented on the partitioned windows, as illustrated in
Figure 7e. Given the discontinuity of internal pixels within the spliced window, it is imperative to design an appropriate mask during the self-attention computation to exclude extraneous values and ensure that similarity is not calculated between discontinuous pixels, thereby achieving an accurate feature representation. The detailed computational process of the spliced window is depicted in
Figure 8. Following the self-attention computation, the shifted windows are restored to their original positions, whereby the network’s final output features are generated through a global average pooling operation.
3.3. Implementation Procedures
The features of the support set samples and the query set samples are extracted by the hybrid attention feature extraction block. These features are projected into an embedding space that is predicated on a category-perception distance metric. Based on the sample features within the support set, the cumulative distances among intra-class samples and those among inter-class samples are computed. The category-perception distance is subsequently defined by the differential between these two summed distances. Then, calculate the difference between the category-perception distance of the output feature vector and the category-perception distance of the input feature vector. Then, according to the European distance between the query set sample and the feature vector of the support set sample, classify the query set feature into the nearest support set category, and convert the distance into a category probability. The classification of query set samples is assessed in conjunction with their true labels. Through continuous updating and refinement of the objective function, the feature distance among samples of the same class is progressively minimized, while the distance between samples of different classes is maximized, thereby enhancing the model’s classification capacity.
(1) Category-Perception Distance Loss Function
To address the challenge of classifying oil spill regions within oil spill imagery, a category-perception loss function is introduced. This function aims to enhance the separability of categories in the few-shot learning metric space of the model. Specifically, this method first calculates the sum of feature distances between query samples and same-class support samples (e.g., oil spill to oil spill), as well as the sum of feature distances between query samples and different-class support samples (e.g., oil spill to seawater). The difference between these two values is then used as the core optimization objective. During model training, network parameters are continuously adjusted through gradient backpropagation, causing the feature distance between same-class samples to progressively decrease while the distance between different-class samples consistently increases.
The category-perception loss function can be defined as:
Among them, is the difference in the perceived distance of the input characteristic vector category, and is the difference in the perceived distance of the output characteristic vector category. refers to the European distance function, is the sample characteristic of the query set, is the sample feature of the same kind of the support set, is the characteristic of the sample of different classes of the support set, and represent the total amount of samples of different and similar samples, respectively.
(2) Category-Perception Distance Loss Function [
29]
The quantitative relationship between the distance between the features and the actual label is updated through
, which is defined as:
Among them, is the mathematical expectation, is the conditional probability function, is the real label, and is the negative logarithmic probability of the query sample.
Table 1 provides example-based explanations of the cross-entropy loss function.
Category-perception distance loss function
and cross-entropy loss function
together constitute the loss function of this paper, and the total loss can be expressed as:
4. Experimental Environment and Pre-Processing
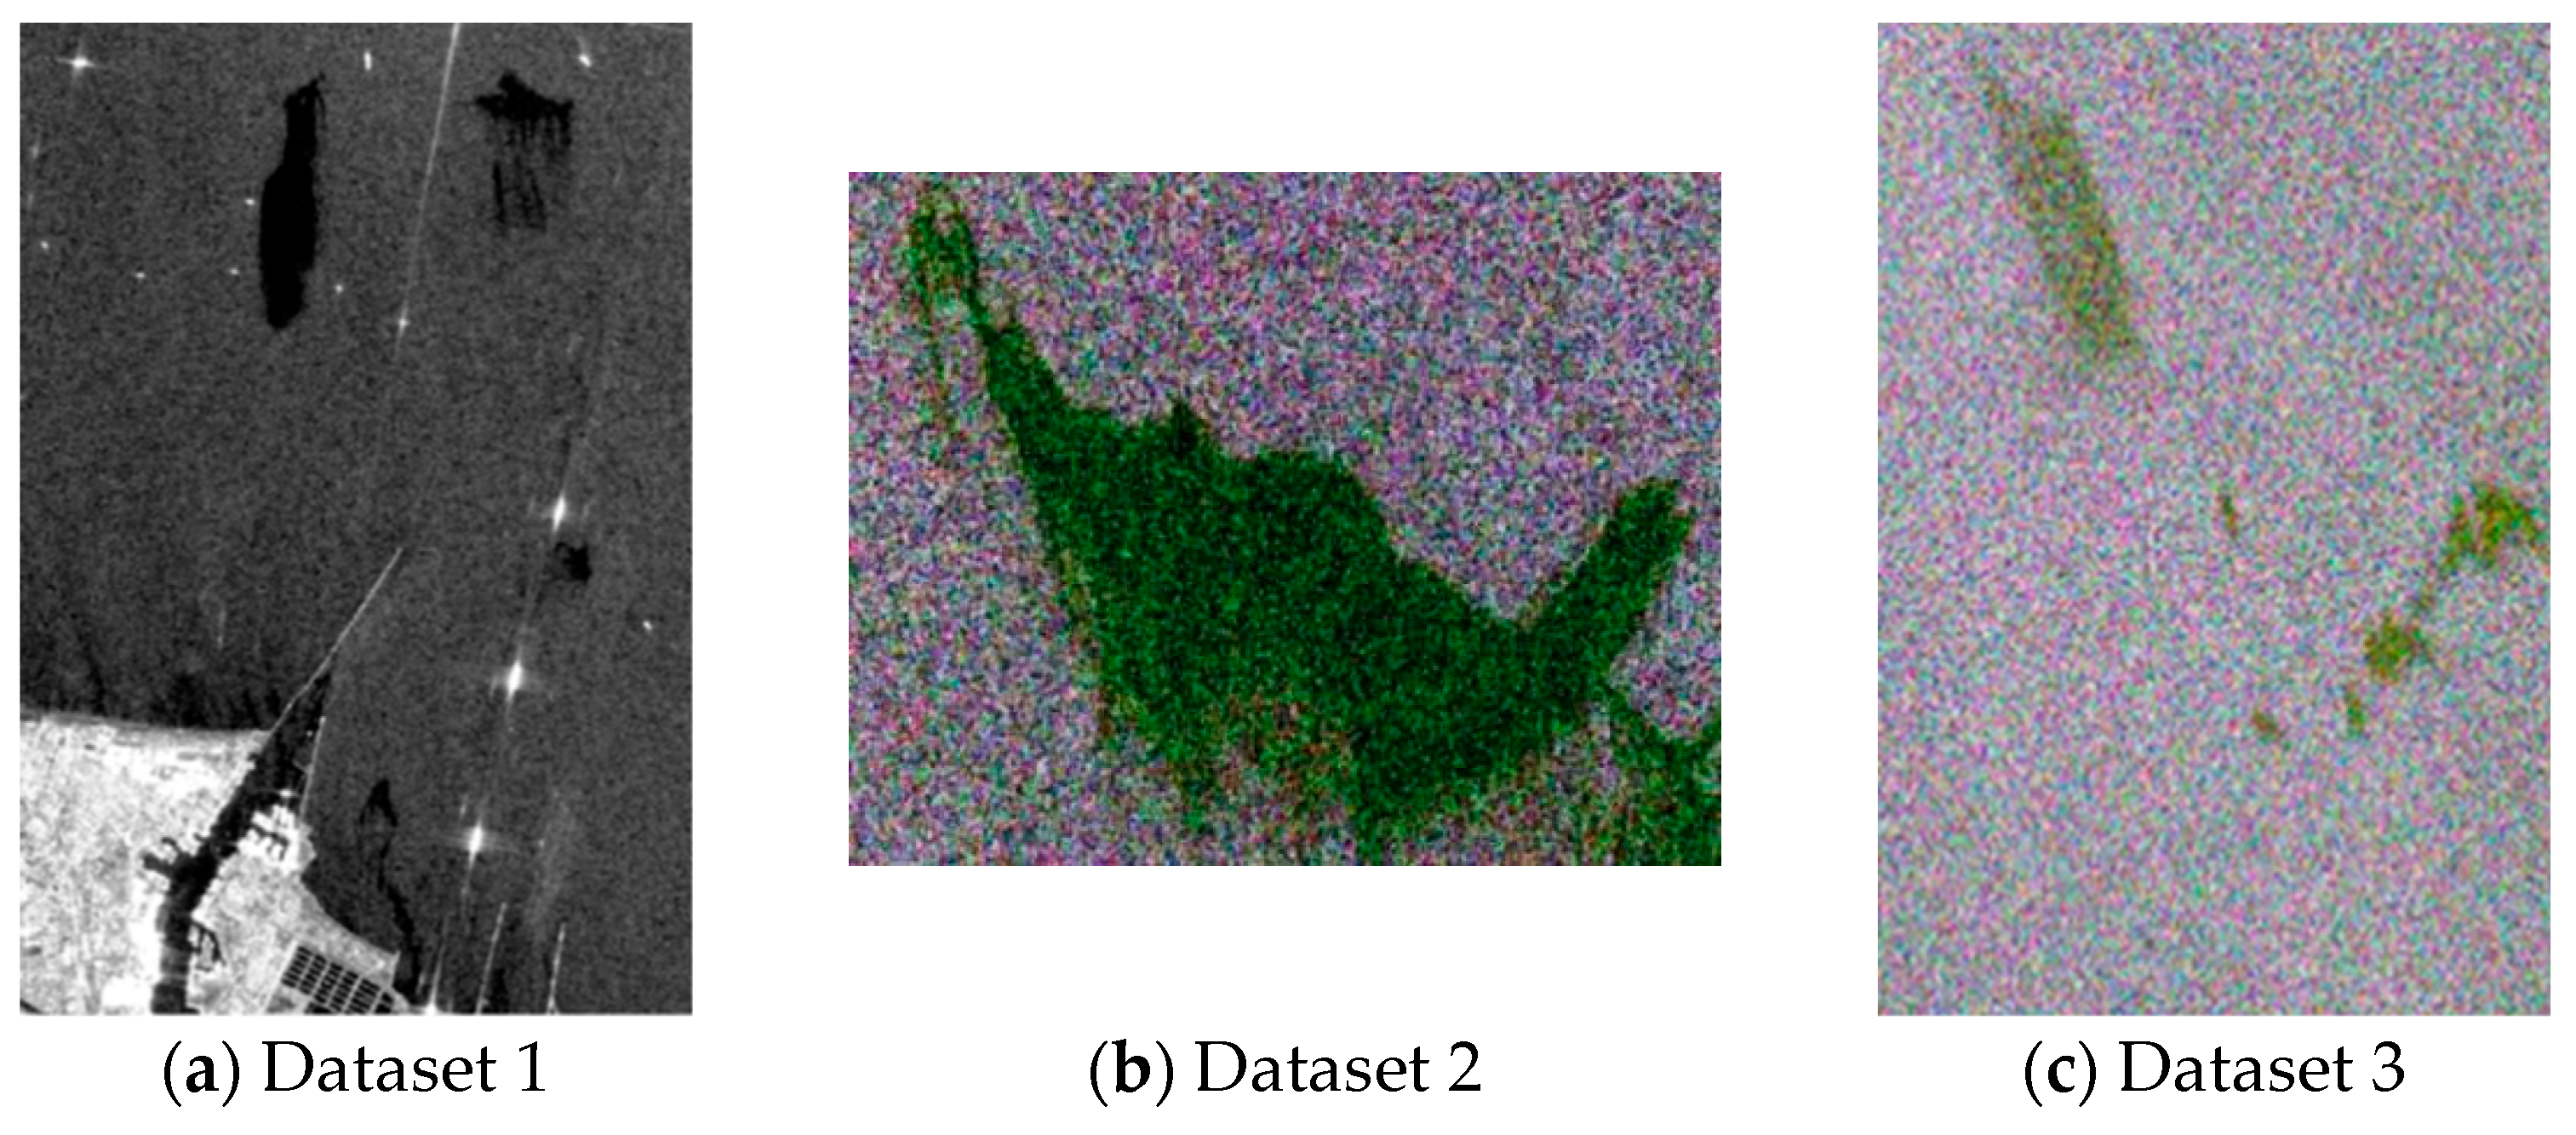
In the data preprocessing stage, the two-scene Radarsat-2 quad-polarization SAR oil spill data and the one-scene Sentinel-1 dual-polarization SAR oil spill data were selected for the experiment. From these, the Sentinel-1 one-scene image with category number 5 is used as the source domain dataset, and the remaining two-scene images are used as the target domain dataset. The SAR image is cropped using SNAP 7.0 software and the modified Lee filtering method is used to denoise the image. The next step involves extracting the following 30 polarimetric features from fully polarimetric SAR images: Span, Geometric intensity, VV intensity, Co-polarization phase difference, Co-polarization power ratio, Co-polarization correlation coefficient, Real part of the co-polarization cross product, Muller polarization feature M_33, Consistency coefficient, Polarimetric entropy, Polarimetric scattering anisotropy, Mean scattering angle, Anisotropy, Maximum eigenvalue, Pedestal height, Average intensity, Single bounce eigenvalue relative difference, Polarimetric feature P, Bragg scattering ratio, Self-similarity parameter, Scattering diversity, Surface scattering fraction, Combined features, H_A_12 Combined parameters, H_A Combined, Oil spill detection indicator CT, Correlation coefficient, Cross-polarization ratio, Degree of polarization, and Gini. Additionally, the following 10 textural features are extracted: Angular second moment, Contrast, Dissimilarity, Energy, Entropy, Correlation, Mean, Variance, Homogeneity, and Maximum probability. Using different extraction window sizes (5 × 5, 7 × 7, 9 × 9) yields a total of 30 features. Due to polarization mode limitations, only 30 textural features are extracted for dual-polarization imagery.
Among them, the polarization features are extracted by MATLAB R2021a software and the texture features are extracted by SNAP 7.0 software. Subsequently, feature selection is performed on the extracted features. To mitigate the subjectivity inherent in feature selection and to automate the identification of the optimal feature subset, a recursive feature elimination approach integrated with cross-validation within random forests is employed for the purpose of feature optimization [
30]. Then, the extracted features are selected. To reduce the subjectivity of feature selection, the optimal subset of features is automatically selected, and the recursive feature elimination method combined with cross-verification of random forests is used for feature selection. The methodology entails partitioning the dataset into K distinct subsets, ensuring that each subset encompasses samples representative of all features. The process involves randomly selecting K-1 subsets to train the random forest model, with validation conducted on the remaining subset. Features that contribute minimally to the model are subsequently eliminated. This iterative training procedure is employed to identify the optimal feature subset. As shown in
Table 2,
Table 3 and
Table 4, in this article, Dataset 1, Dataset 2, and Dataset 3 select 16, 18, and 16 characteristics, respectively, and the figure below also marks the proportion of each feature.
In addition, to meet the requirements of model input, the source domain and target domain data are sliced respectively, cut into small patch form and entered into the feature extraction block. The small patch is a 3D cube of 9 × 9 × chs obtained with a width of 4 in the upper, lower, left and right, and a single pixel as the center. The category of the central pixel is the corresponding label. To accommodate the training requirements, the query set and the support set are delineated from the source domain and target domain datasets, respectively. The query set consists of pixels with unknown category attributes during the training session, while the support set consists of pixels with known category attributes. Regarding sample selection, the source domain dataset randomly selects 200 samples per category for training, whereas the target domain is configured with only 5 samples per category for training purposes. All remaining samples are allocated to the test set to validate the accuracy of the network model. In the target domain training, Gaussian noise is employed for data augmentation to fulfill the training requirements, resulting in 200 augmented samples per category. In the training procedure, the hyper parameters of the network are set as follows: the learning rate is 0.0001, the batch size is set to 100, the number of iterations is 20,000, and the Adam optimizer is used to optimize the network. The version of the framework used in this study and the hardware and software configurations including the computing platform are shown in
Table 5.
5. Results and Discussions
To demonstrate the superiority of the proposed network methodology, comparative experiments are conducted on two distinct datasets, evaluating the proposed method against other algorithms. Meanwhile, to validate the efficacy of each enhancement approach, corresponding ablation experiments are conducted. Furthermore, experiments involving feature subset optimization are conducted to investigate the impact of feature redundancy on model performance. Specifically, the five evaluation indicators of overall accuracy (OA), average accuracy (AA), Kappa coefficient, Precision, and F1-score are used to evaluate the classification effect of the model and comprehensively evaluate the effect of oil spill detection.
5.1. Comparative Experiments
To assess the efficacy of the proposed model, four methodologies are chosen for comparative experiments against our HA-CP-Net. These include the machine learning algorithm SVM, the deep learning algorithm DeepLabV3 [
31], and the few-shot learning algorithms Gia-CFSL and DCFSL [
32]. To ensure the integrity of the experiment, five labeled samples from each category were selected for training, with the learning rate uniformly established at 0.0001 and the number of episodes set at 20,000.
(1) Analysis of results for Dataset 2
Figure 9 presents the visual outcomes of oil spill detection on the oil spill data, utilizing both the proposed algorithm and the comparative algorithms, alongside the corresponding ground truth label maps. In
Figure 9a, dark green areas represent oil spills or suspected oil spills, while dark purple regions indicate seawater.
As illustrated in
Figure 9, the proposed method demonstrates superior visual performance with optimal classification results. In contrast, the SVM-based machine learning approach exhibits significant misclassification artifacts and substantial noise in its output map.
This phenomenon primarily stems from model underfitting due to insufficient training samples, which restricts the model’s capacity to fully extract discriminative features. When generalizing to new datasets, SVM’s performance is particularly susceptible to suboptimal kernel function selection and inappropriate regularization parameters, potentially leading to significant misclassification errors. The DeepLabV3 algorithm demonstrates reduced noise in its classification results; however, it exhibits significant fragmentation in oil spill regions. This limitation stems from its reliance on atrous convolutions and atrous spatial pyramid pooling, which restrict the model’s ability to capture global contextual information. The inherent “gridding” effect in the receptive field during feature extraction leads to discontinuous sampling and incomplete detail capture, ultimately resulting in insufficient feature learning. The classification efficacy of the few-shot learning algorithm DCFSL has shown some improvement, yet it still presents a significant number of artifacts. This is attributed to the DCFSL algorithm’s reliance solely on distance metrics within the feature space to differentiate categories. Similar samples may be distributed in close proximity within the feature space, and distance information alone may not suffice for reliable category decision-making, thereby resulting in misclassification. The classification performance of Gia-CFSL is relatively commendable, yet it still exhibits some artifacts. This is due to the Gia-CFSL algorithm’s reliance on graph structures, which inadequately separates the feature distances between classes, leading to suboptimal category decision-making by the model. In comparison with the previously mentioned methods, the network proposed in this study exhibits optimal performance in oil spill detection. The sea surface is nearly free of speckle noise, and the detected oil spill areas show remarkable integrity. These results demonstrate that the network successfully captures comprehensive global and local image features, while demonstrating robust classification accuracy in distinguishing between oil spill and non-oil spill regions.
Table 6 delineates the oil spill detection accuracy of the proposed algorithm alongside comparative methods. The proposed method in this paper achieves a significantly higher OA of 97.11%, outperforming other algorithms by 0.9% compared to the suboptimal Gia-CFSL and by 6.51% over the traditional SVM. This demonstrates that the proposed method exhibits superior reliability in global classification tasks. The leading AA further indicates its more balanced classification capability across different categories. The Kappa coefficient is substantially higher than those of other methods, confirming that its classification results align closely with ground truth labels and are minimally affected by random factors. With a 97.21% precision rate—2.65% higher than Gia-CFSL—and an F1-score of 97.33%, the proposed method exhibits low false detection rates, highlighting its robustness in classification performance.
(2) Analysis of results for Dataset 2
Figure 10 presents the visualization results of oil spill detection on the oil spill dataset using both the proposed algorithm and the comparative algorithms, alongside the corresponding ground truth label maps.
Figure 10 shows the visualization results of the oil spill detection of the oil spill dataset using the algorithm of this paper and the comparison algorithm respectively, as well as the corresponding real label map of the ground. In
Figure 10a, dark green areas represent oil spills or suspected oil spills, while dark purple regions indicate seawater.
As illustrated in
Figure 10, a significant number of false detections are observed with the machine learning algorithm SVM and the deep learning algorithm DeepLabV3. This is attributed to the inability of SVM and DeepLabV3 algorithms to acquire sufficient features to underpin the network’s classification decisions. Consequently, the network struggles to make accurate judgments during decision-making, leading to the erroneous classification of some non-oil spill areas as oil spills, thereby resulting in a high false alarm rate. The classification efficacy of the few-shot learning algorithms DCFSL and Gia-CFSL has shown some advancement, yet instances of misclassification persist. In contrast, the oil spill detection performance of the proposed network in this study demonstrates a more complete delineation of oil spill regions overall, with classification results that most closely approximate the actual ground truth. The quantitative comparison of oil spill detection accuracy between the proposed algorithm and state-of-the-art methods is summarized in
Table 7. The proposed method in this paper achieves the best performance in OA, reaching
98.49%, significantly outperforming other methods. Similarly, it leads in AA with
94.54%, slightly higher than Gia-CFSL’s
93.31% and far exceeding other methods. This metric reflects the model’s average performance across different categories, indicating that the proposed method performs well in all categories. The Kappa coefficient is
0.8810, markedly higher than that of other methods. The Kappa coefficient measures the agreement between model predictions and random predictions, with higher values indicating more reliable model performance. The precision ranks first at
96.88%, followed by Gia-CFSL’s
94.89%. The F1-score is
95.83%, which is the harmonic mean of precision and recall. A high F1-score indicates a good balance between precision and recall.
5.2. Ablation Experiments
To assess the contribution of each enhancement to the network’s performance, this study integrates various improvement methodologies into the baseline network and evaluates their respective contributions. The methodology proposed in this study has attained the highest precision across the three metrics of OA, AA, and Kappa, thereby demonstrating the efficacy of the three enhancement strategies.
Table 8 shows the evaluation index results of the improved method, respectively. The analysis shows that compared with the baseline network, after adding various parts of the improvement, Dataset 2 increased by 3.28% overall, AA increased by 6.61%, and Kappa improved by 0.4057; Dataset 3 increased by 9.75% overall, AA increased by 5.69%, and Kappa increased by 0.3101. Only the coordinate attention module is added. Compared with the baseline network, Dataset 2 is generally improved by 1.64%, AA is increased by 4.53%, and Kappa is increased by 0.1389; Dataset 3 is generally improved by 1.63%, AA increased by 1.07%, and Kappa increased by 0.0677. Only the multi-scale self-attention module is added. Compared with the baseline network, Dataset 2 is generally improved by 2.02%, AA is improved by 5.11%, and Kappa is improved by 0.2999; Dataset 3 is overall increased by 1.73%, AA increased by 0.86%, and Kappa increased by 0.1405. Only the category-perception distance loss function is added. Compared with the baseline network, Dataset 2 is generally increased by 3%, AA is increased by 6%, and Kappa is increased by 0.2001; Dataset 3 is generally increased by 6.69%, AA is increased by 2.36%, and Kappa is increased by 0.192. It can be seen that the method proposed in this paper has significantly improved the accuracy of oil spill detection.
5.3. Feature Optimization Experiments
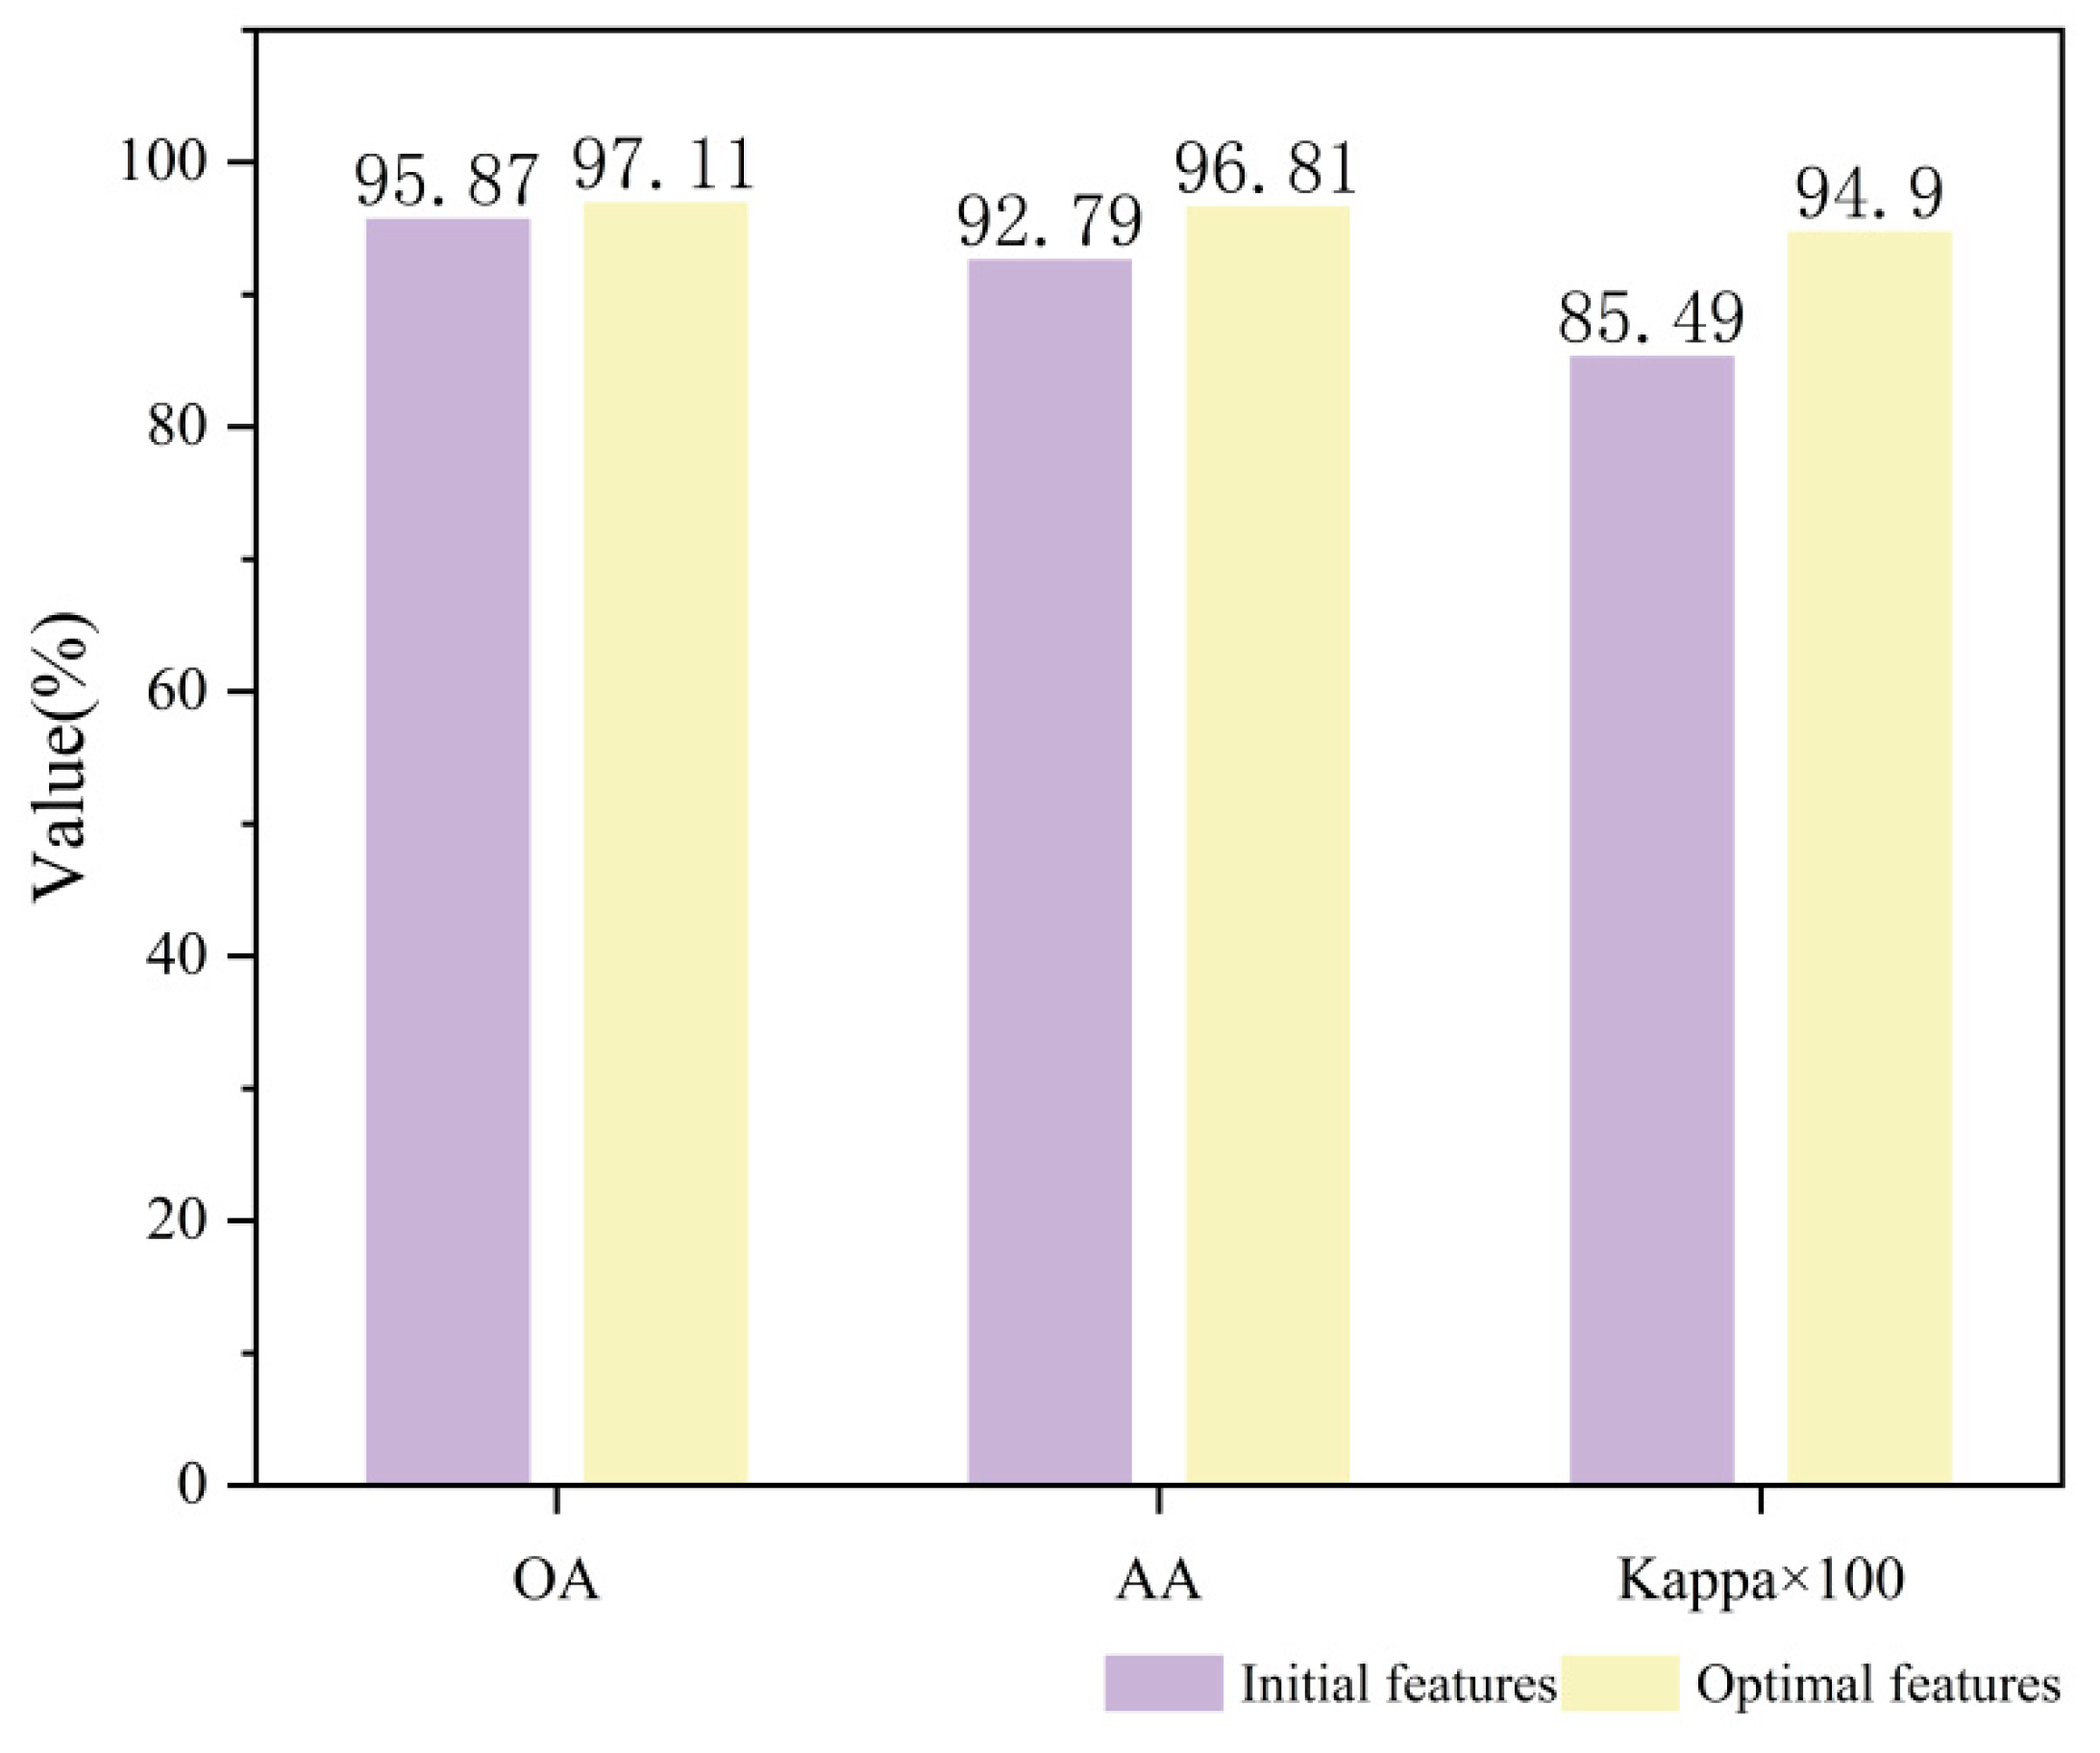
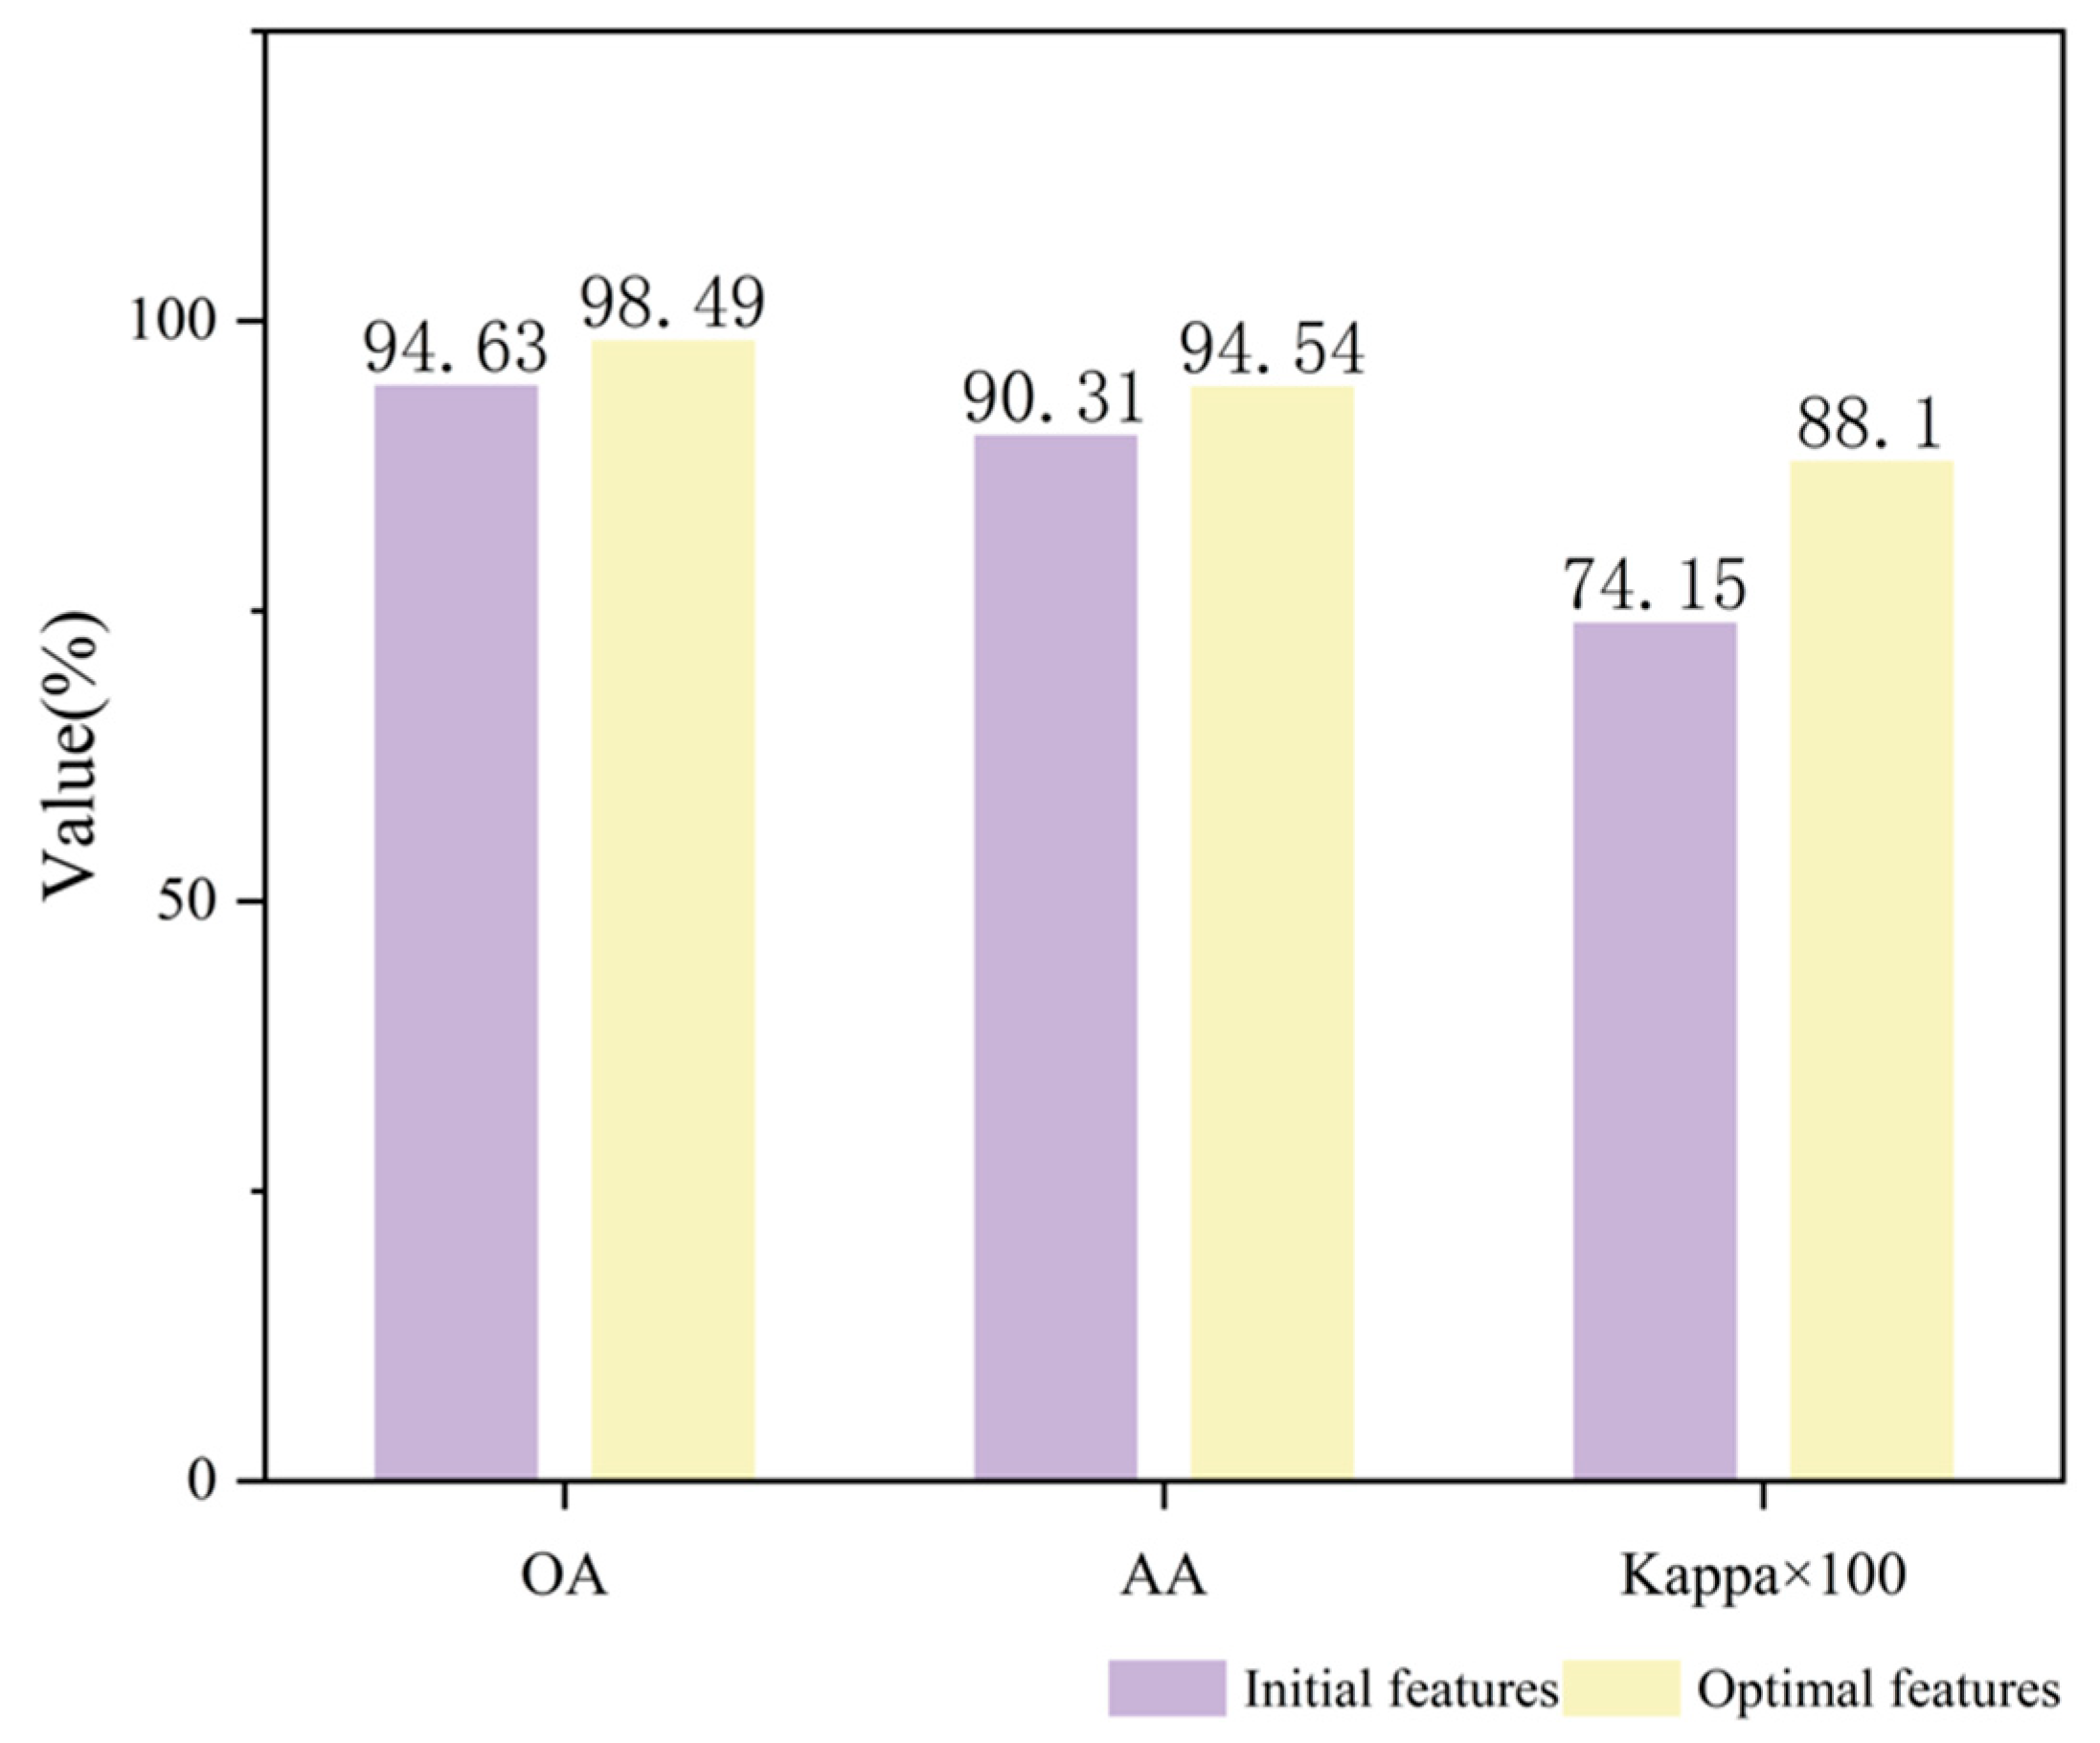
This section will explore the influence of the amount of feature optimization on the efficacy of oil spill detection. Insufficient oil spill features fail to capture critical information from the imagery, limiting the network’s expressive capability. Conversely, an excessive number of features not only introduces data redundancy and increases model complexity but also degrades the accuracy of oil spill detection. Therefore, selecting an optimal feature subset to enhance oil spill classification accuracy is of paramount importance. Among these, the source domain dataset has been refined to 16 selected features from an initial set of 60, while the target domain Datasets 2 and 3 have been optimized to 18 and 16 features, respectively, from an original pool of 30.
As shown in
Figure 11 and
Figure 12, both areas use the optimal feature set to obtain the best detection effect. Dataset 2’s OA, AA and Kappa increased by 1.24%, 4.02%, and 0.0941, respectively, while Dataset 3’s OA, AA, and Kappa increased by 3.86%, 4.23%, and 0.1395, respectively.
6. Conclusions
This study proposes a cross-domain few-shot SAR oil spill detection network that integrates hybrid attention and category-perception learning, achieving high-precision oil spill detection with limited sample availability. The conclusions are as follows:
(1) A hybrid attention feature extraction block is proposed to thoroughly extract both global and local information from the images. This module incorporates a coordinate attention mechanism, which adeptly captures long-range dependencies along one spatial dimension while meticulously preserving spatial location information along the other. This sophisticated approach facilitates the effective integration of channel-wise and spatial features. Subsequently, the global self-attention module is designed to capture the global contextual relationships between pixels, thereby enabling a comprehensive representation of feature dependencies at a global scale. The multi-scale self-attention module utilizes windows with diverse partitioning strategies to concentrate on local information, thereby enabling the accurate extraction of fine-grained oil spill features, which significantly enhances detection accuracy.
(2) Furthermore, to address the challenge of distinguishing between oil spill and suspected oil spill samples due to their close proximity in the metric space, a category perception distance loss function is designed. This function is formulated to reduce the intra-class distance while increasing the inter-class distance in the feature space, thereby enhancing the network’s capability for oil spill detection.
(3) Experimental results demonstrate that the proposed method exhibits significant advantages over other algorithms in few-shot oil spill detection, achieving high detection accuracy. Moreover, the effectiveness of various improvements and feature selection strategies is validated through ablation experiments and feature selection analysis. The proposed network demonstrates outstanding oil spill detection capability and serves as an effective solution for few-shot oil spill detection.
(4) However, HA-CP-Net has disadvantages such as long model training time. In future research, we will further explore how to obtain a more lightweight model while accelerating the model training speed and ensuring oil spill detection.


