
Effect of Nonlinear Constitutive Models on Seismic Site Response of Soft Reclaimed Soil Deposits


Abstract
1. Introduction
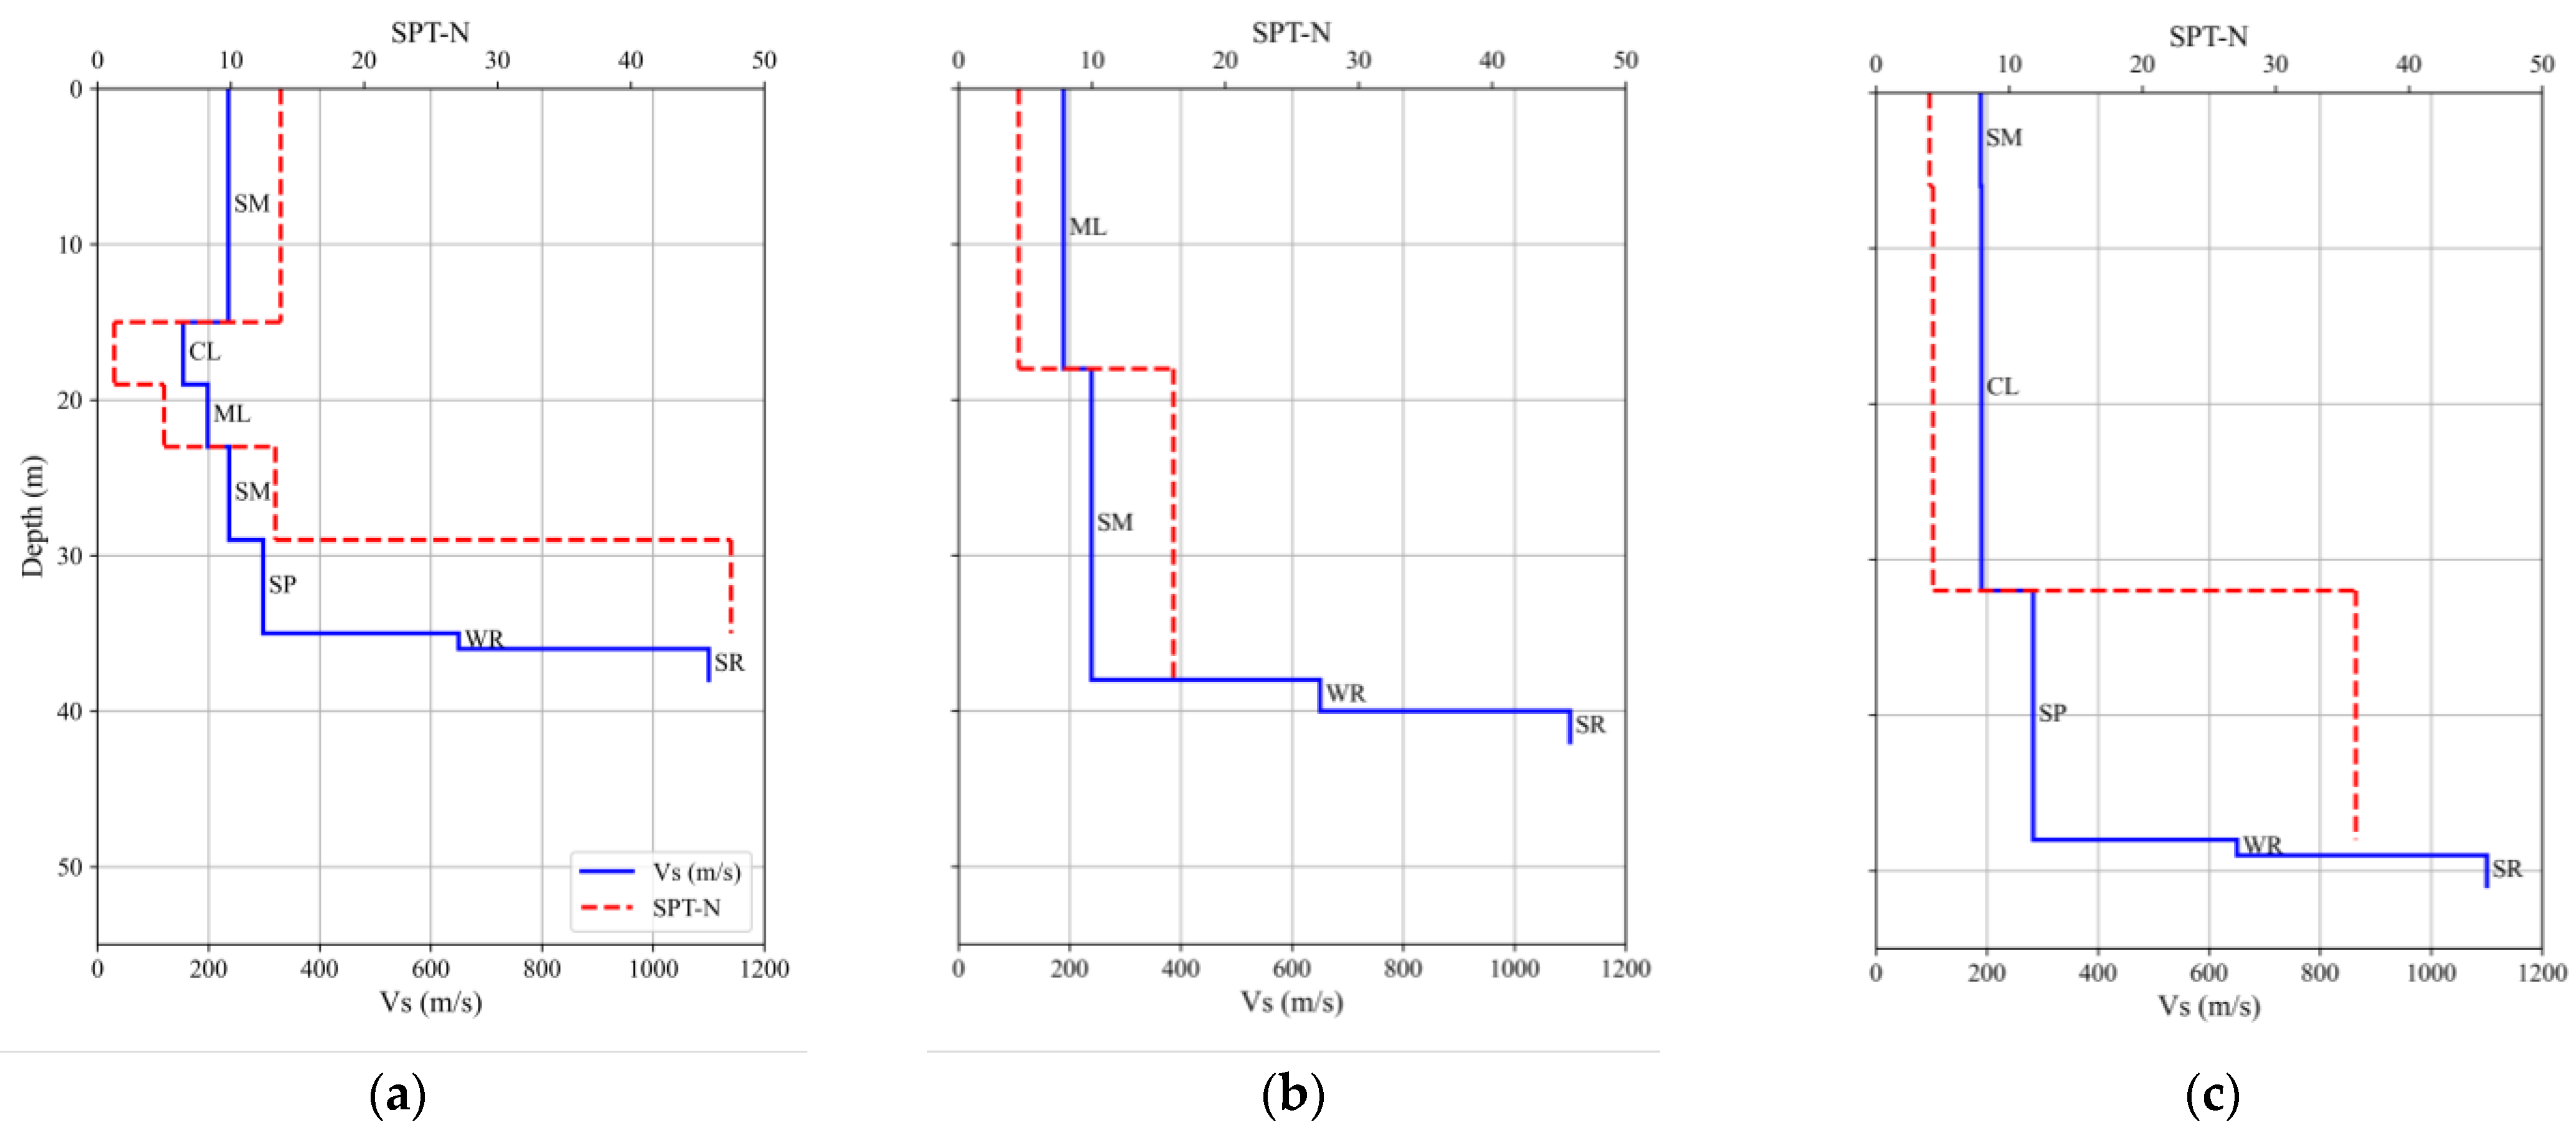
2. Soil Profiles
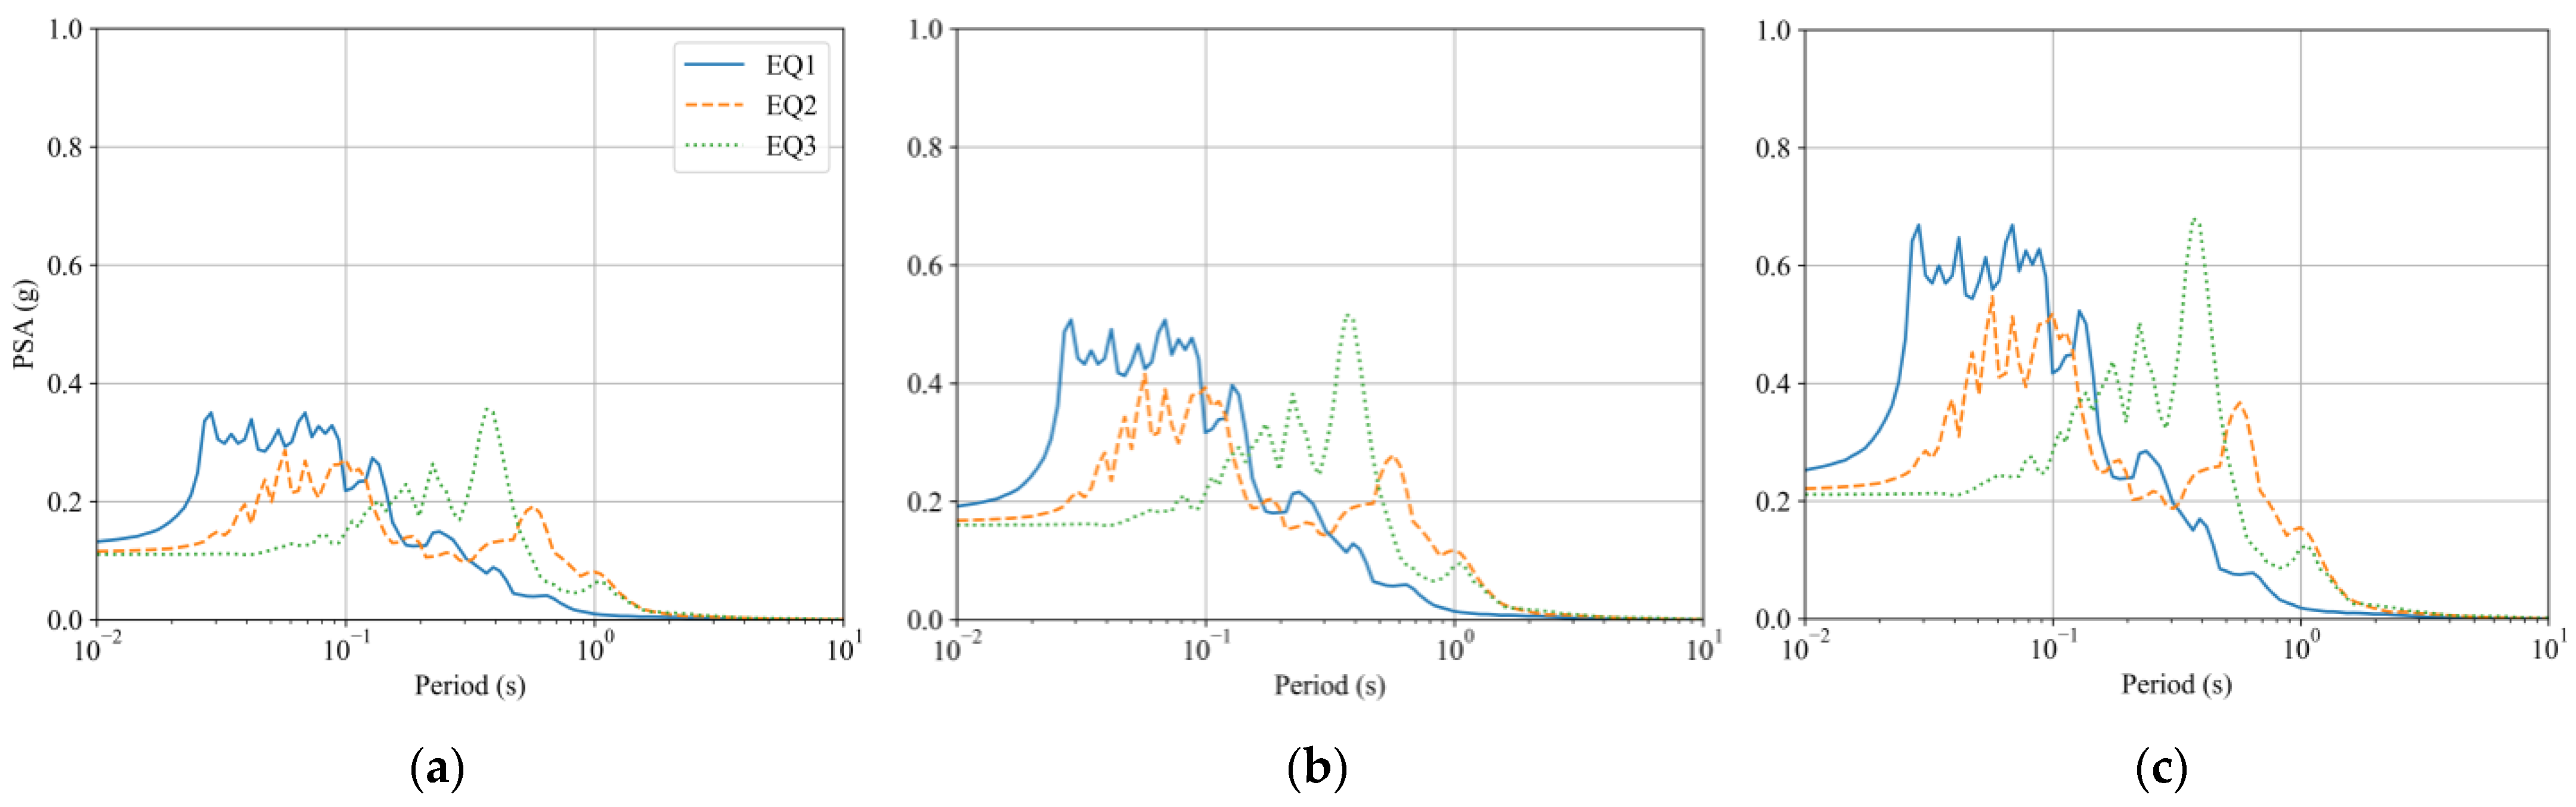
3. Input Ground Motions
4. One-Dimensional (1D) Site Response Analysis
5. Background of Nonlinear Constitutive Models
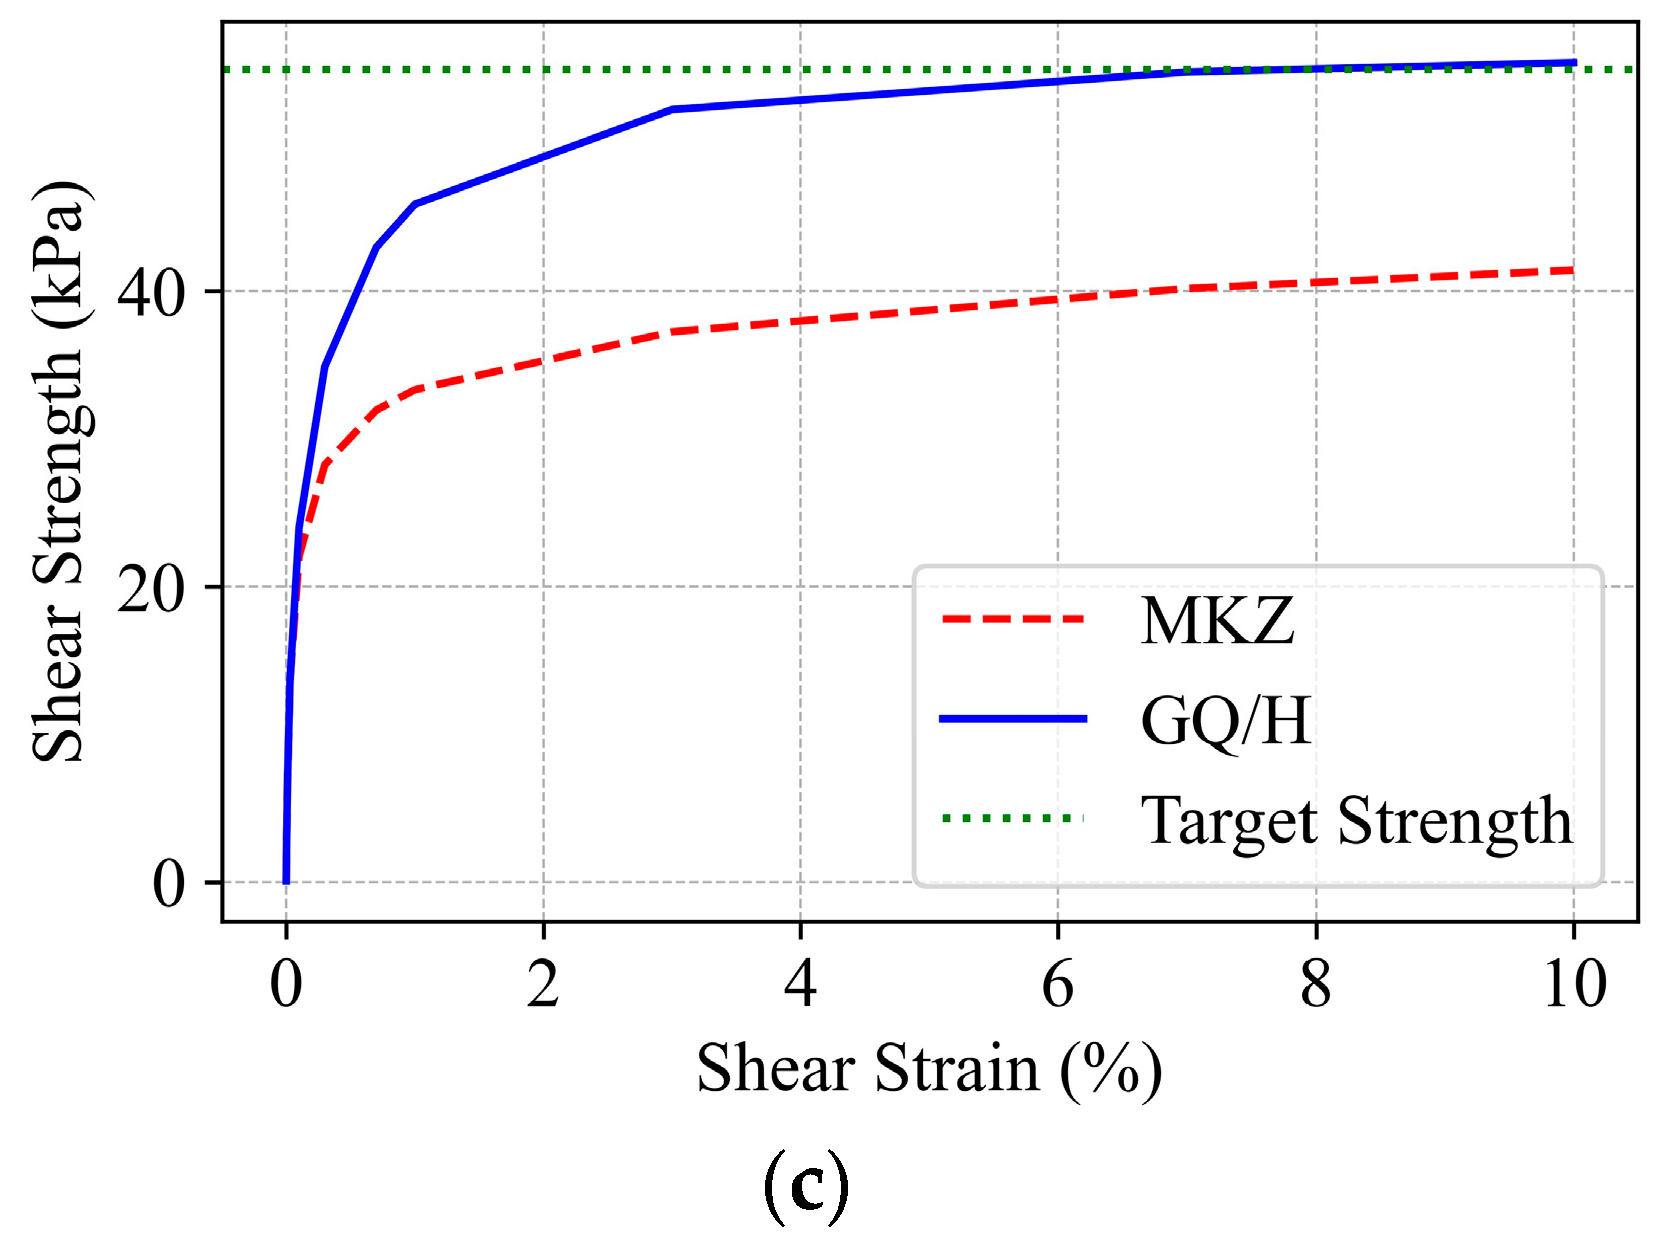
5.1. MKZ Model
5.2. GQ/H Model
5.3. Hysteresis and Reversal Behavior
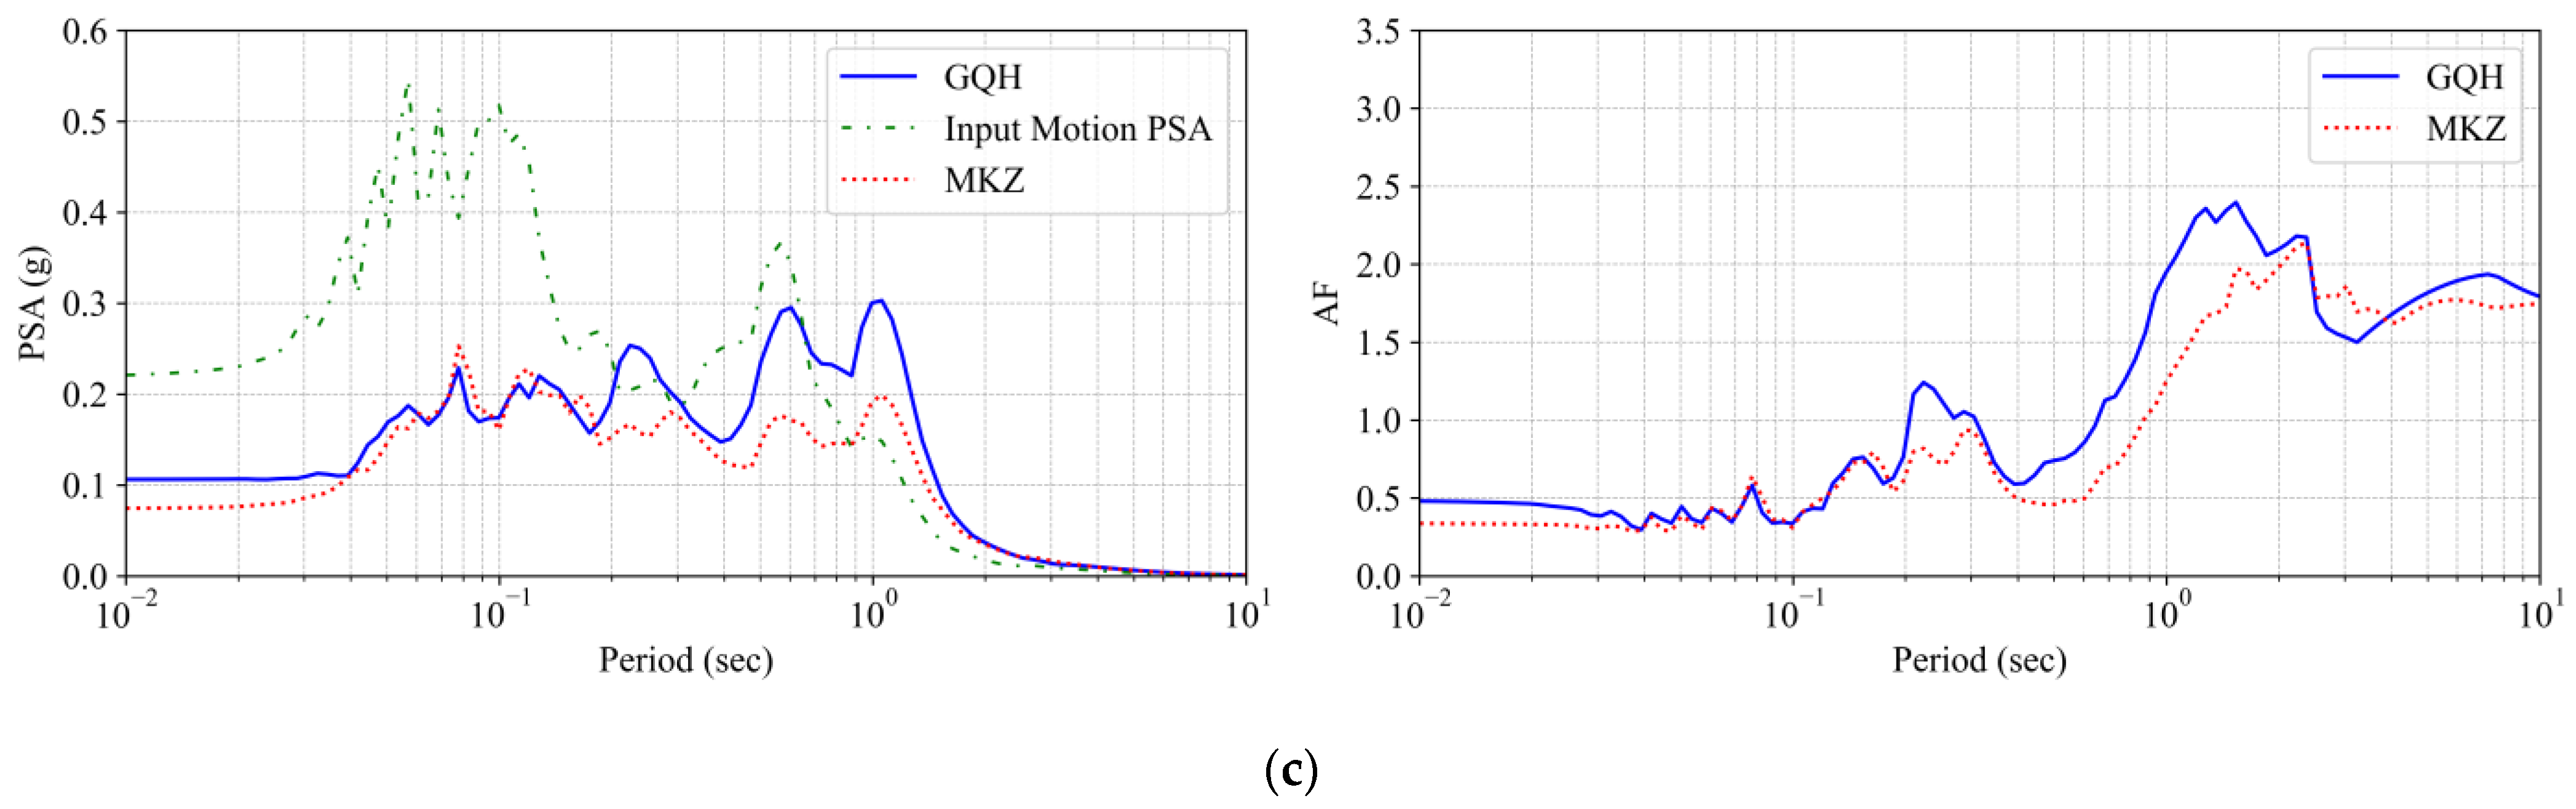
6. Results and Discussion
7. Conclusions
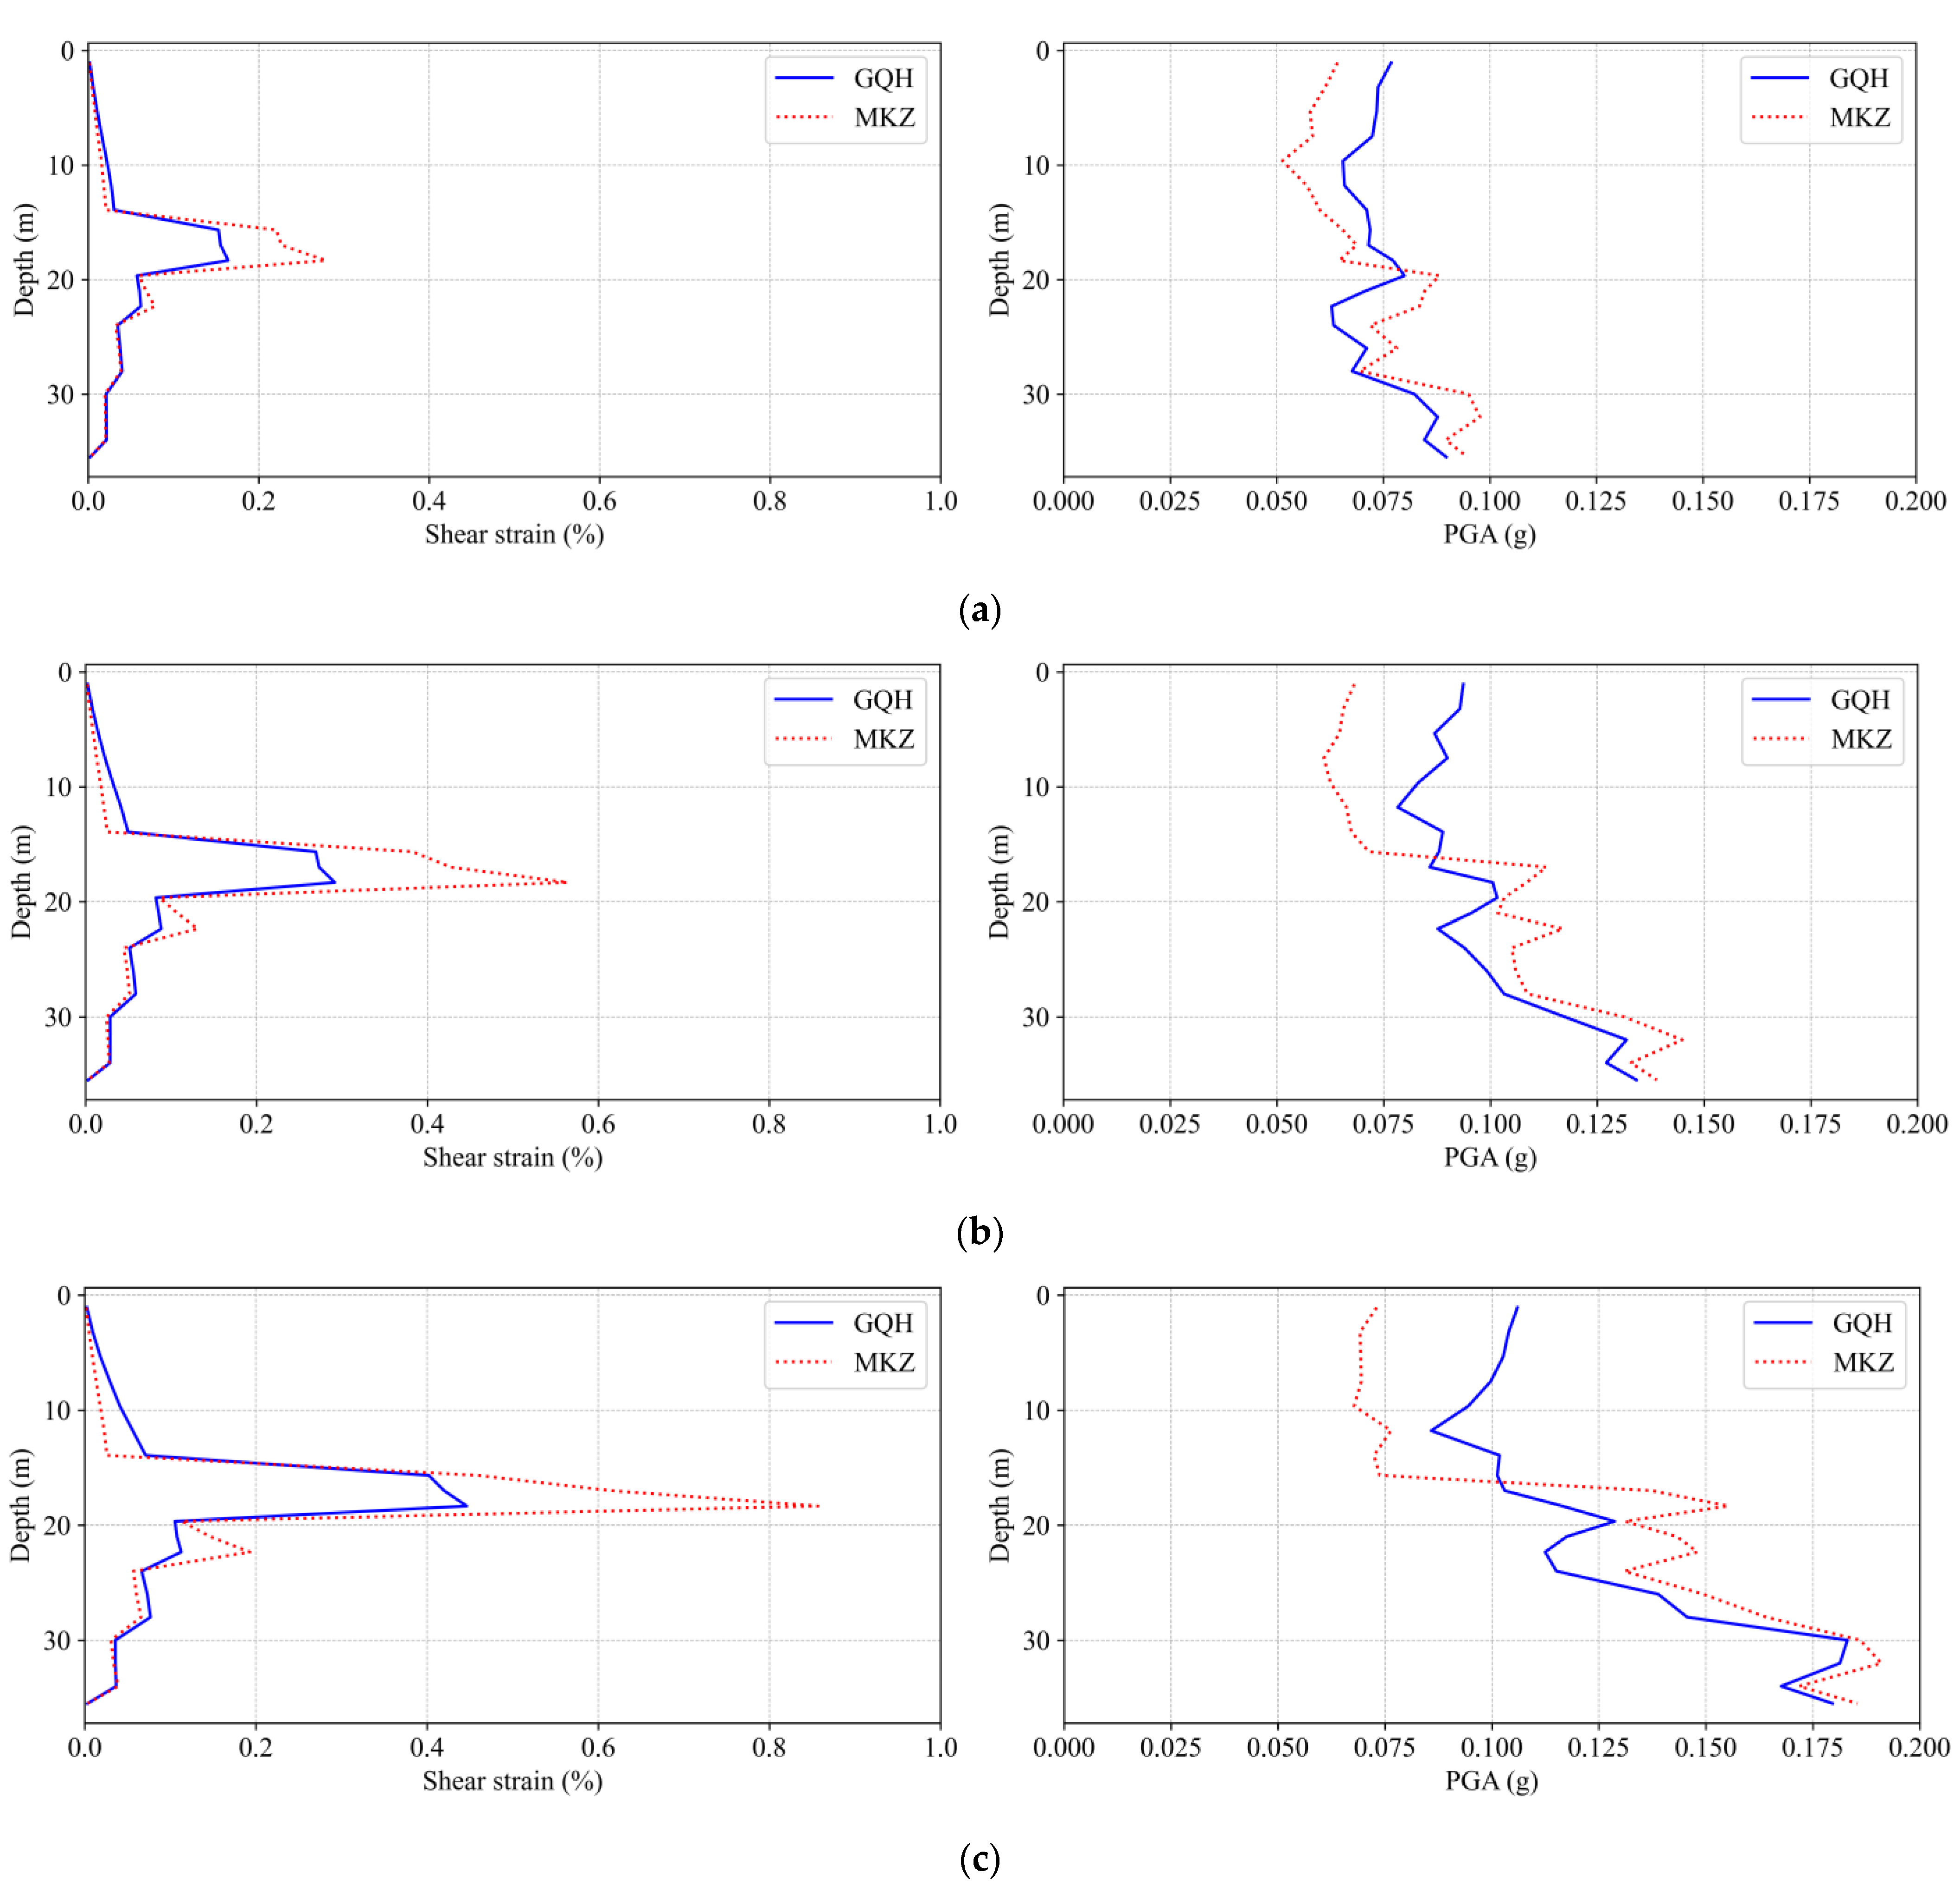
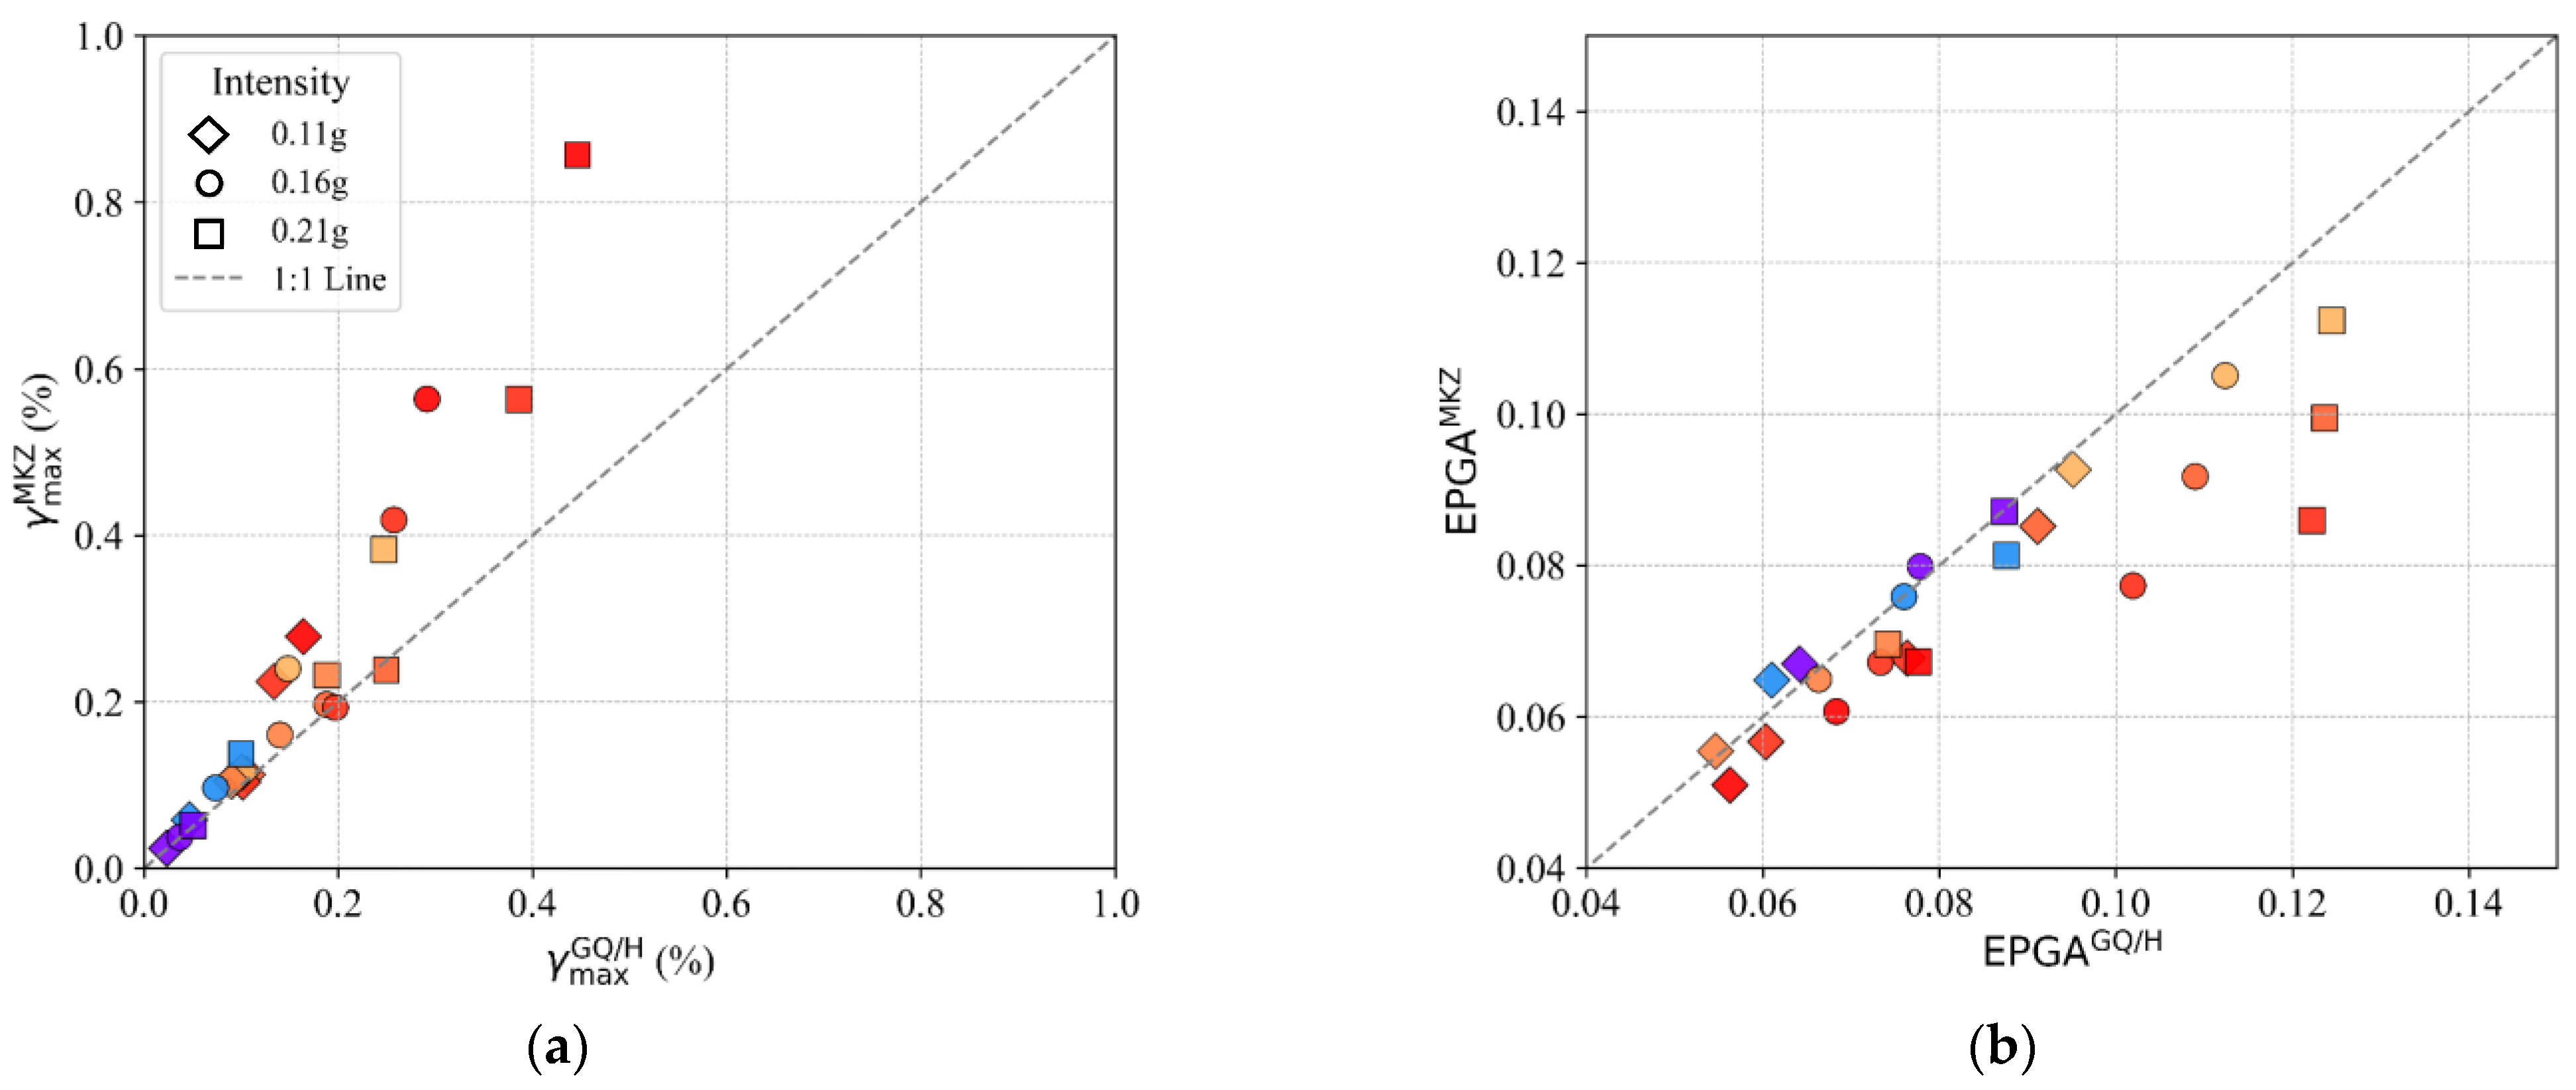
- The GQ/H model, which incorporates site-specific shear strength correction, offers a more accurate representation of stiffness degradation and nonlinear behavior. In contrast, the MKZ model, lacking strength calibration, consistently over-predicts shear strain and underestimates stiffness under strong shaking.
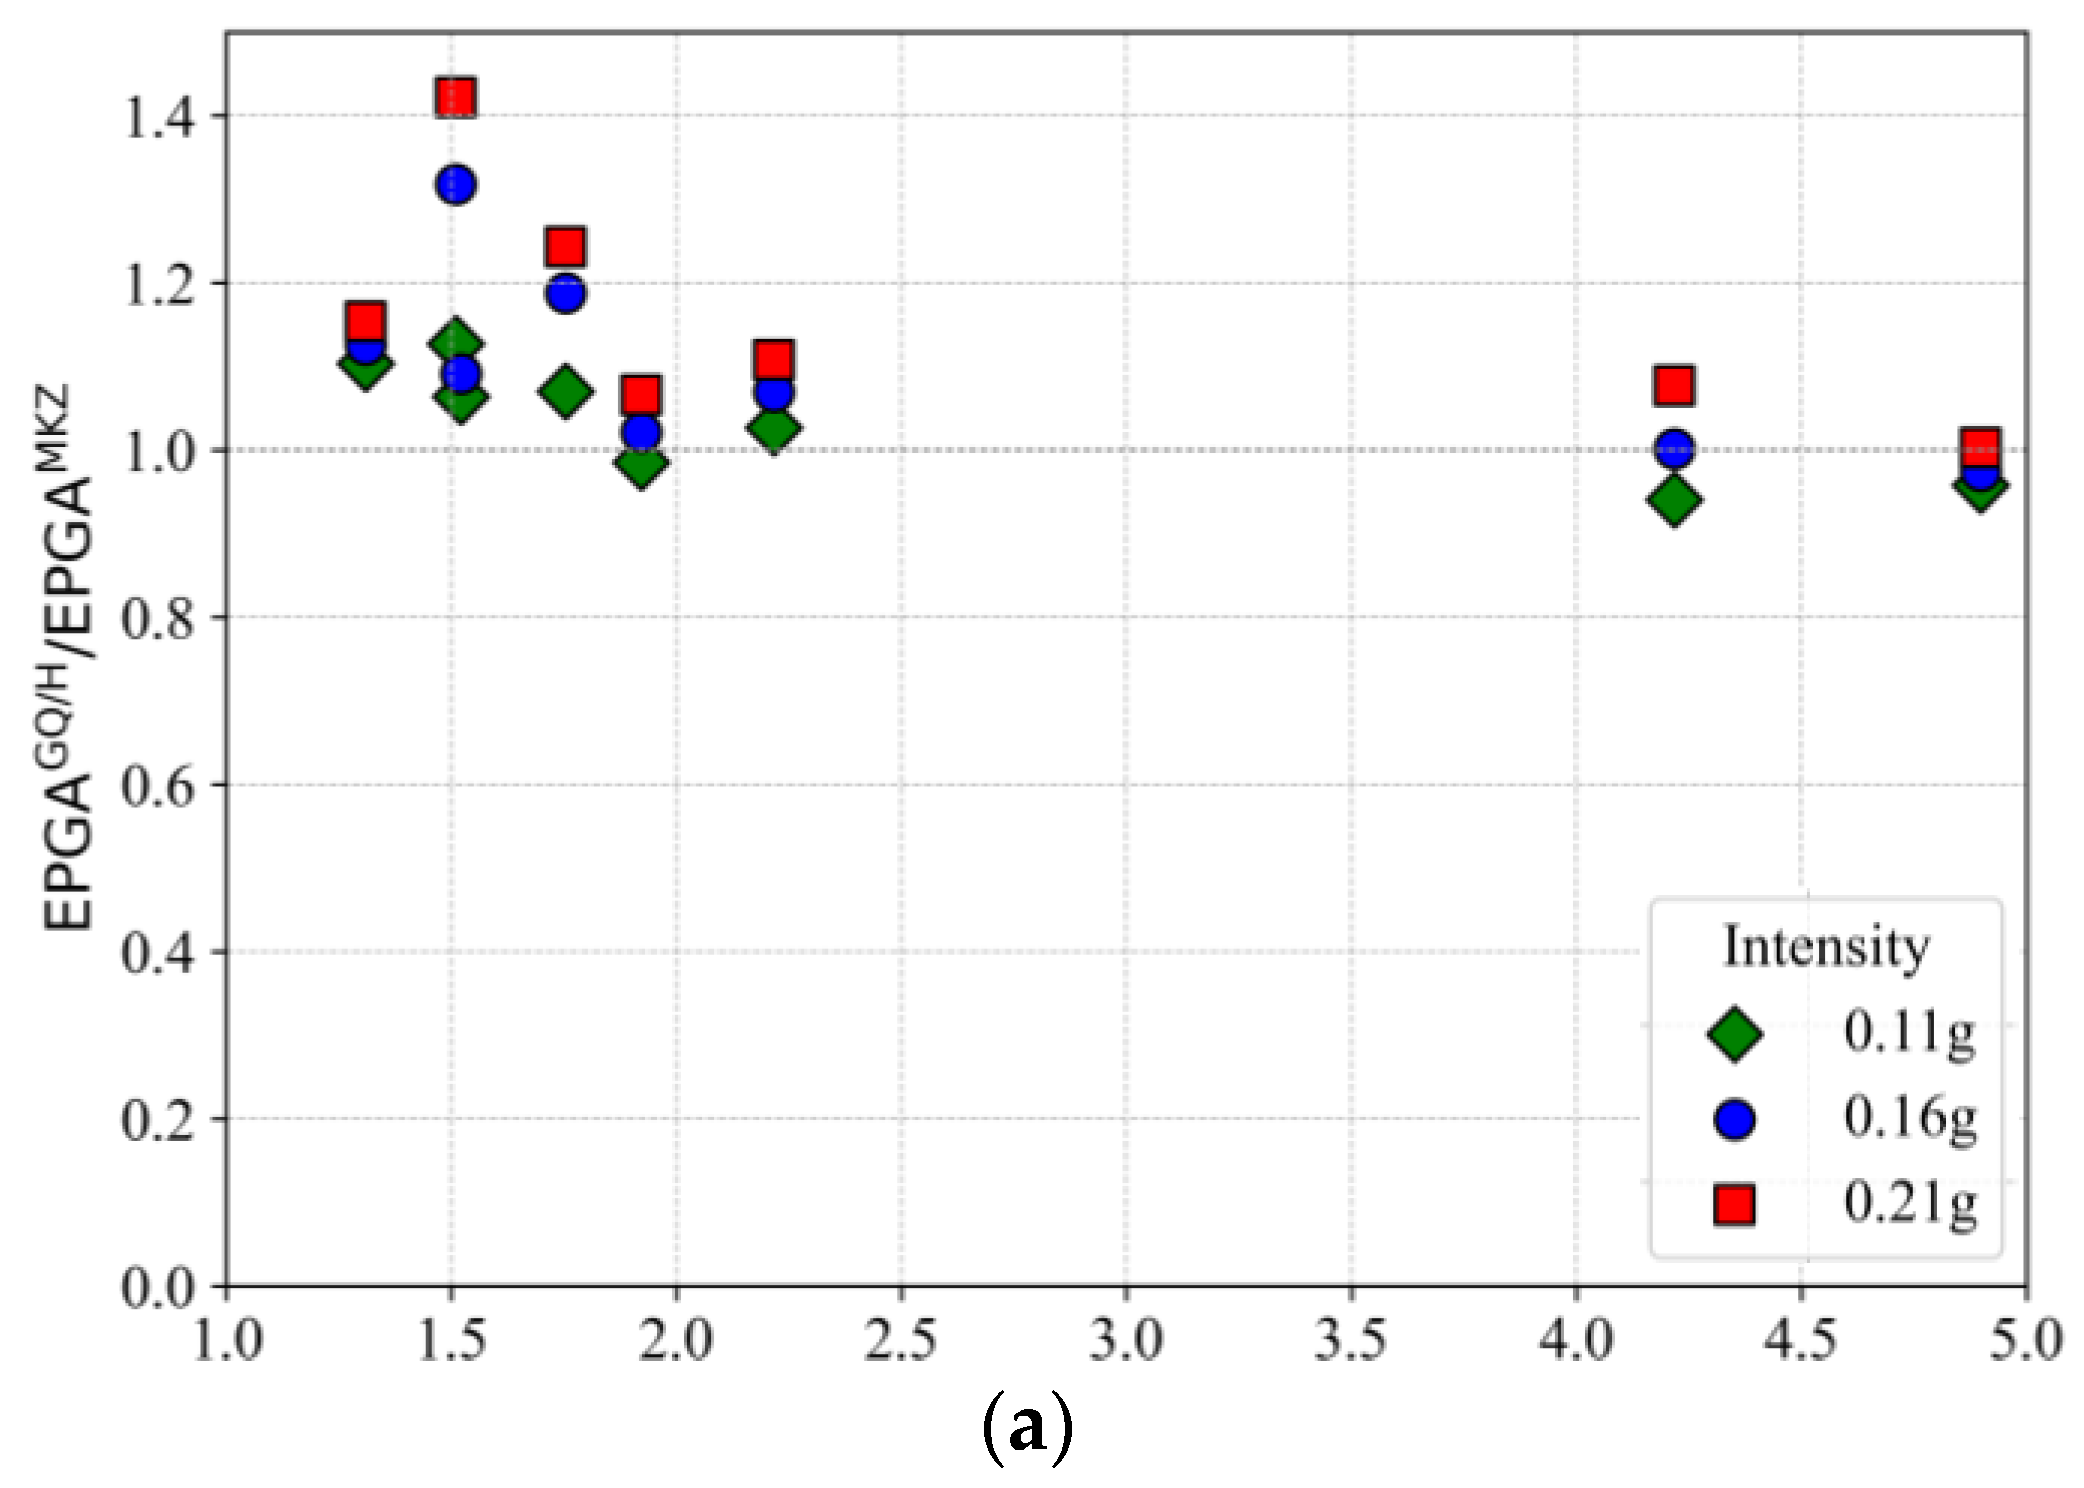
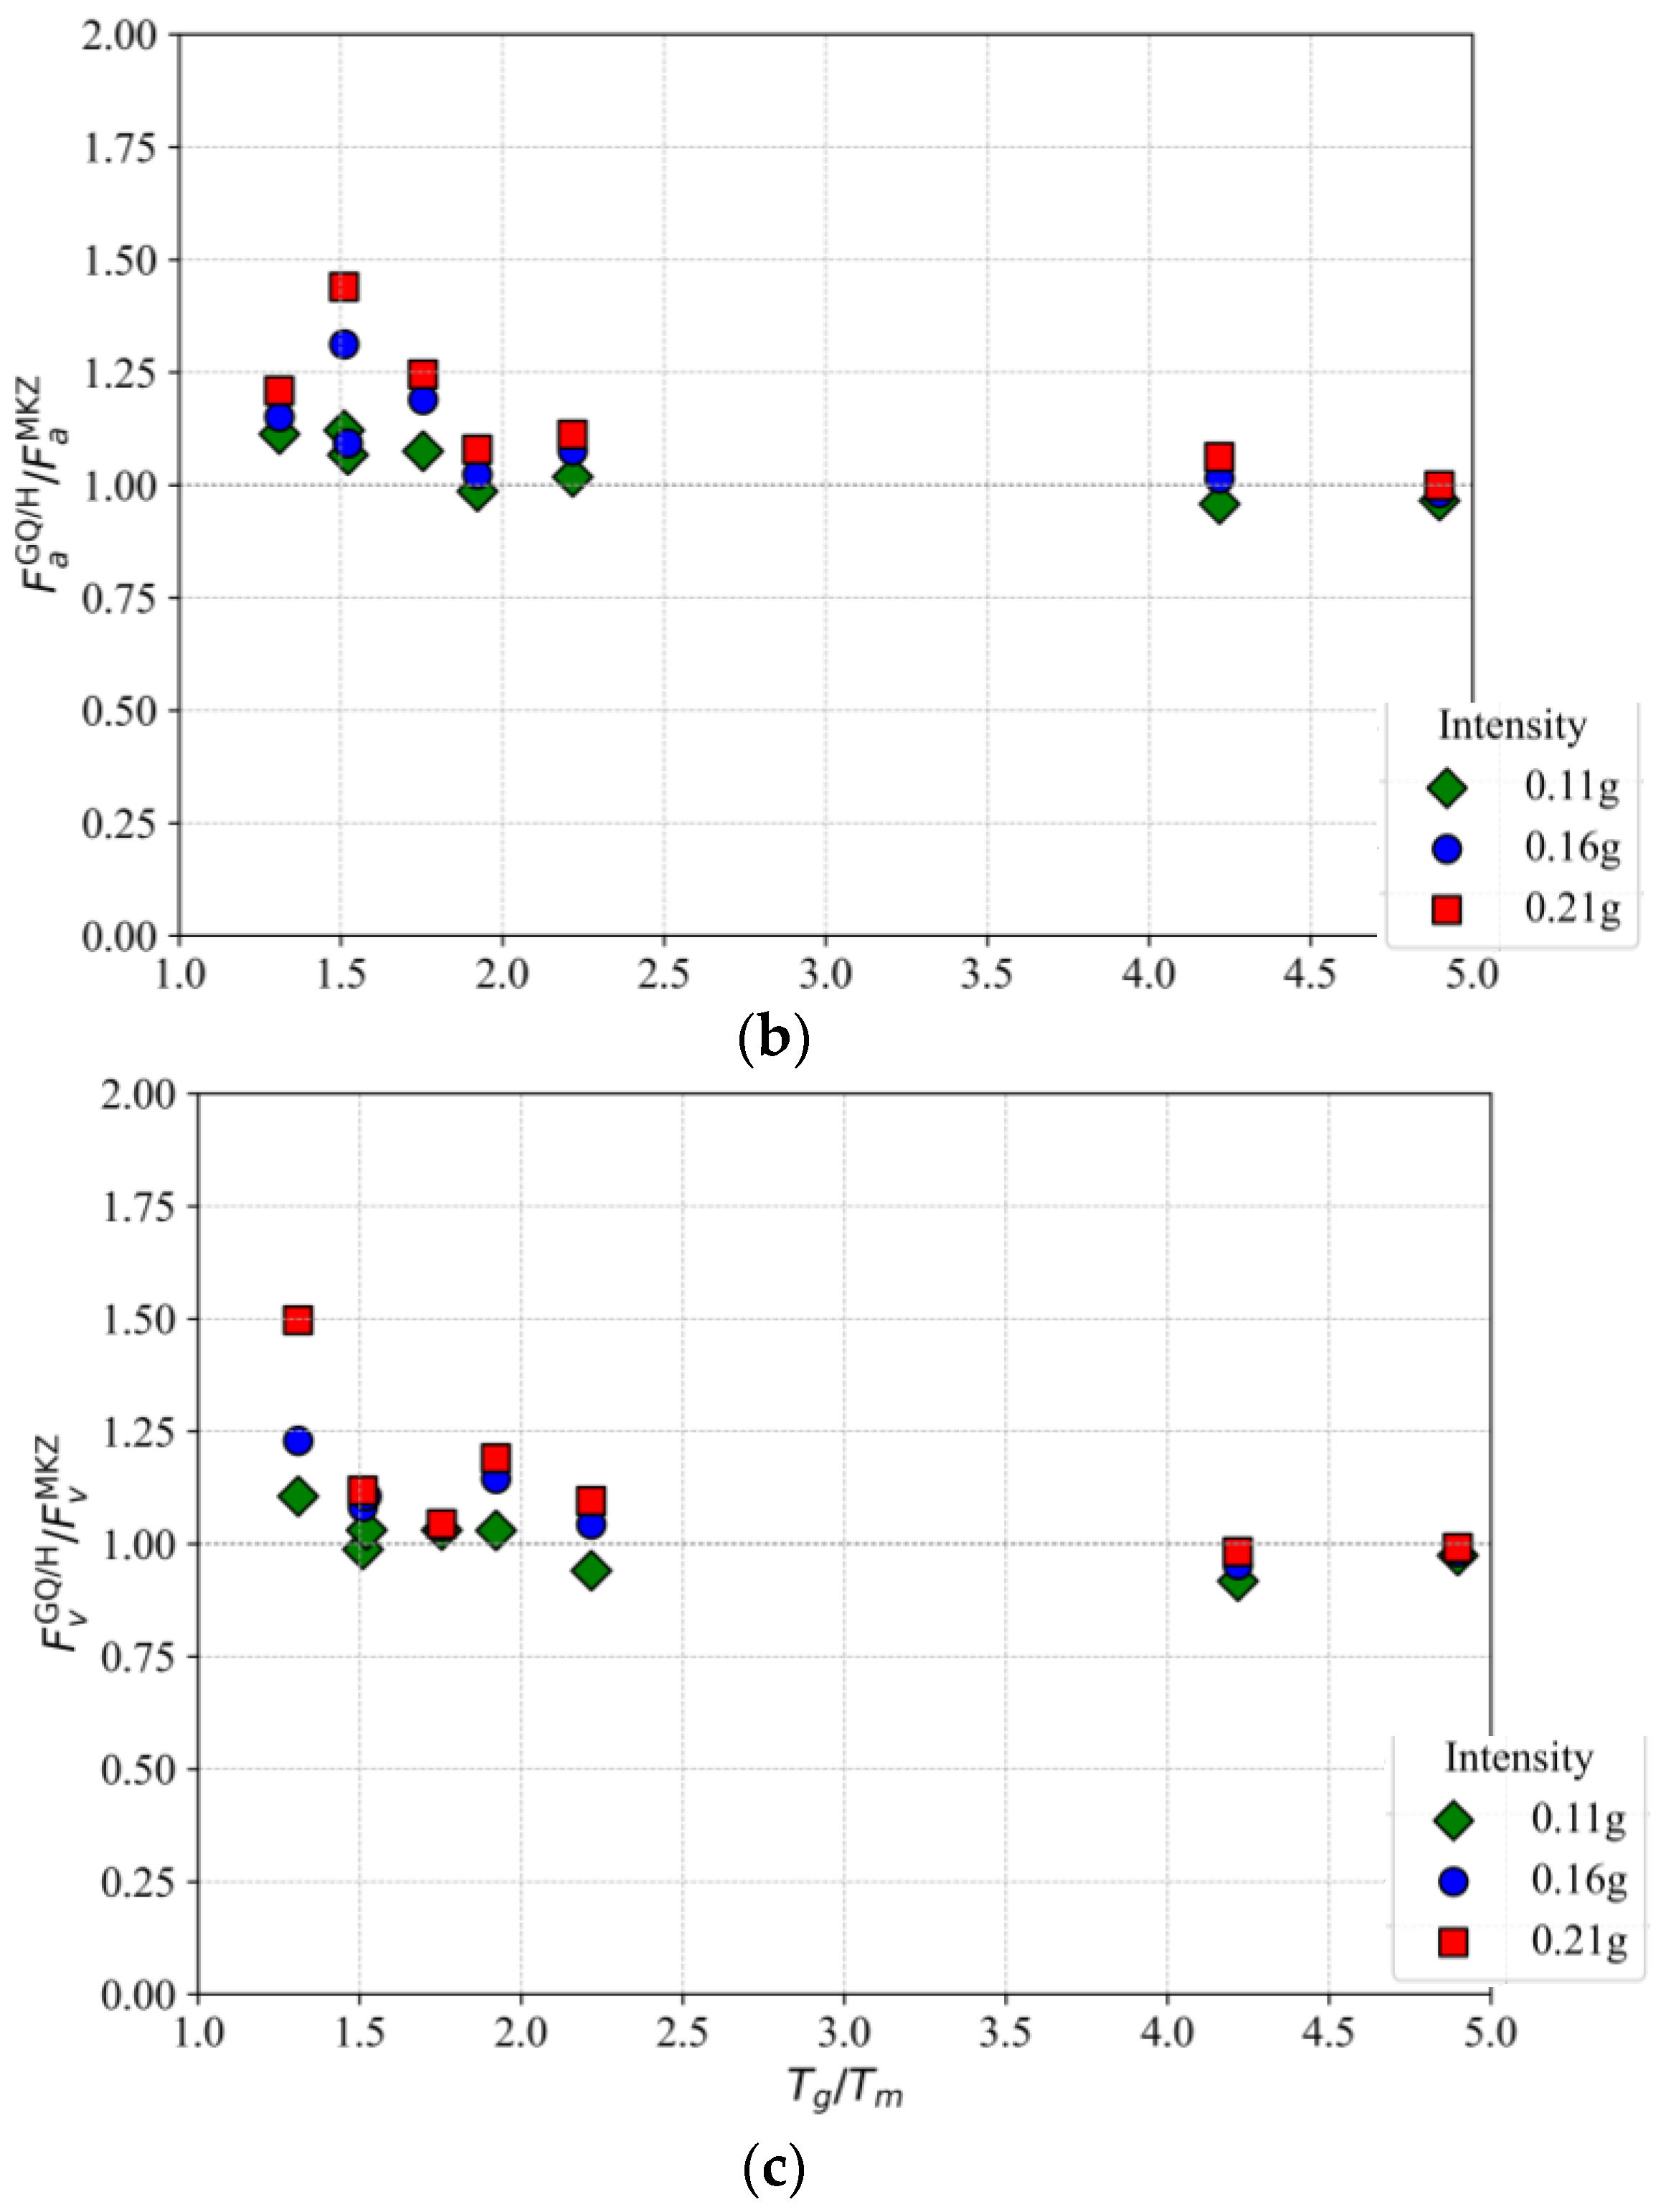
- The Tg/Tm ratio (site period to ground motion period) plays a critical role in amplifying model differences. At low Tg/Tm, the MKZ model significantly underestimates spectral amplification and overestimates deformation, highlighting the need for strength-adjusted modeling in shallow, soft profiles.
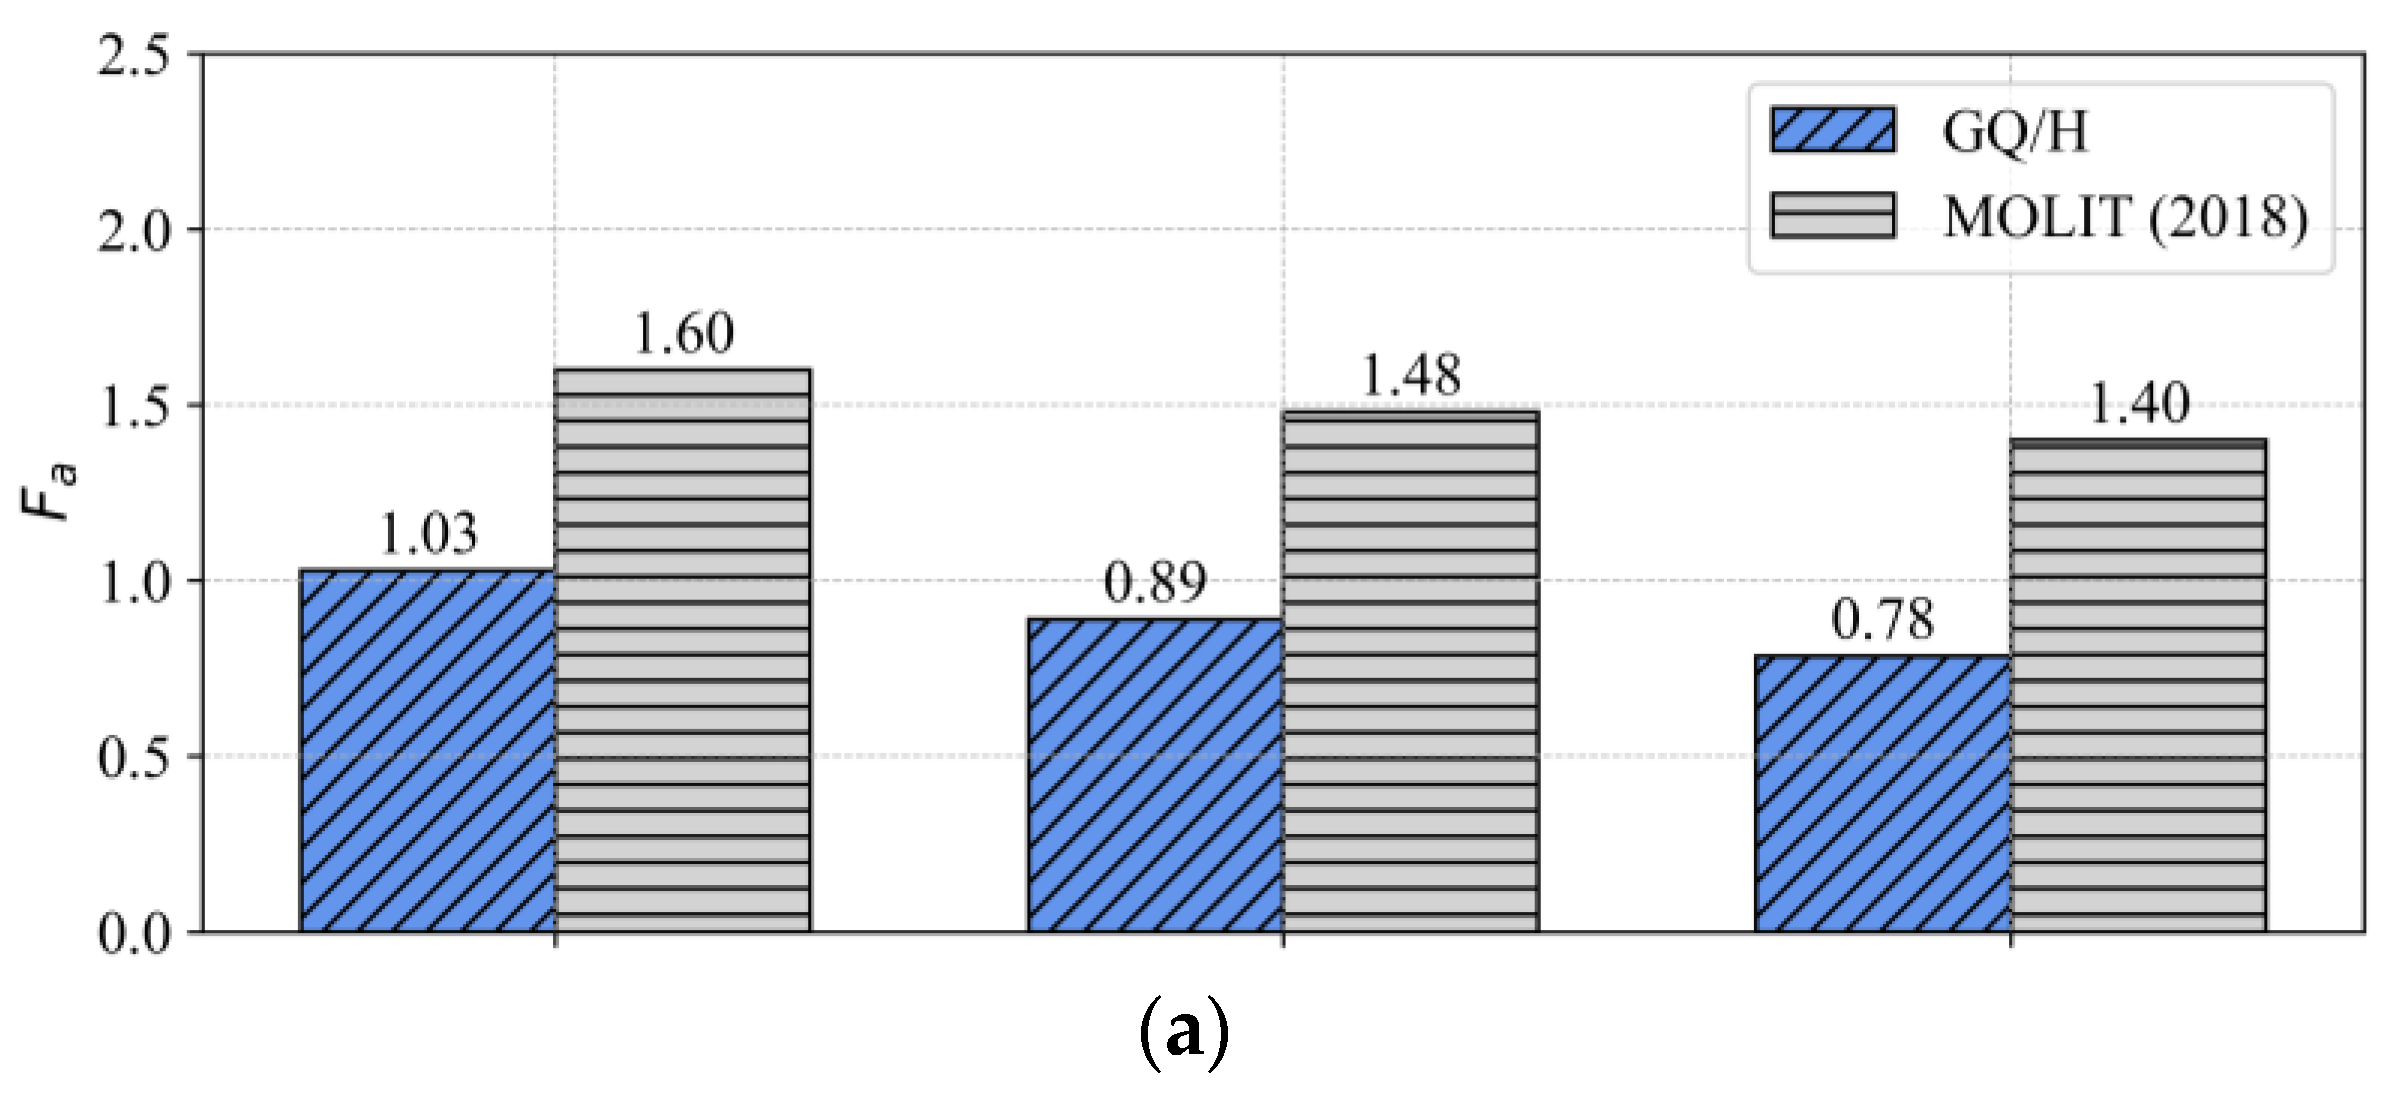
- Across varying input intensities, the GQ/H model consistently predicts higher short-term amplification factors (Fa) and effective peak ground accelerations (EPGAs) than the MKZ model. This suggests that traditional models, such as MKZ, may non-conservatively underestimate seismic demand, particularly under strong motions.
- When compared with amplification factors from the MOLIT (2018) [35] seismic code, the GQ/H model predicts significantly lower Fa values, by approximately 35.7% at 0.11 g, 39.8% at 0.16 g, and up to 43.9% at 0.21 g. These reductions are most evident in the short-term range, reflecting the limitations of code values derived from stiff inland soil profiles when applied to soft, reclaimed ground.
Author Contributions
Funding
Data Availability Statement
Conflicts of Interest
References
- Tallini, M.; Morana, E.; Guerriero, V.; Di Giulio, G.; Vassallo, M. Seismic Microzonation Mapping for Urban and Land Sustainable Planning in High Seismicity Areas (L’Aquila Municipality, Central Italy): The Contribution of 2D Modeling for the Evaluation of the Amplification Factors. Sustainability 2024, 16, 8401. [Google Scholar] [CrossRef]
- Güler, E.; Afacan, K.B. Investigation the Effects of Different Earthquake Scaling Methods on Nonlinear Site-Amplification Analyzes. Appl. Sci. 2025, 15, 3566. [Google Scholar] [CrossRef]
- Kramer, S.L.; Stewart, J.P. Geotechnical Earthquake Engineering; CRC Press: Boca Raton, FL, USA, 2024. [Google Scholar]
- Boudghene Stambouli, A.; Guizani, L. Neural network-based prediction of amplification factors for nonlinear soil behaviour: Insights into site proxies. Appl. Sci. 2025, 15, 3618. [Google Scholar] [CrossRef]
- Hossain, A.F.; Saeidi, A.; Salsabili, M.; Nastev, M.; Suescun, J.R.; Bayati, Z. A Review of Parameters and Methods for Seismic Site Response. Geosciences 2025, 15, 128. [Google Scholar] [CrossRef]
- Sadiq, S.; Muhammad, A.; Mandokhail, S.-u.J.; Rehman, M.-U.; Mehtab, A.; Muhammad, N.; Adeel, M.B. Evaluation of site amplification factors for shallow rock sites of Islamabad, Pakistan. Kuwait J. Sci. 2021, 48, 1–45. [Google Scholar] [CrossRef]
- Totani, F. Two-Dimensional Seismic Response Analysis to Evaluate the Site Effects of the New Belvedere Bridge (L’Aquila, Central Italy). Geotechnics 2023, 3, 1104–1116. [Google Scholar] [CrossRef]
- Pavel, F.; Vacareanu, R.; Aldea, A.; Arion, C. Vertical Elastic Acceleration Response Spectra for Vrancea Intermediate-Depth Earthquakes. Buildings 2024, 14, 906. [Google Scholar] [CrossRef]
- Noda, T.; Asaoka, A.; Nakai, K. Modeling and seismic response analysis of a reclaimed artificial ground. In Soil Dynamics and Earthquake Engineering; American Society of Civil Engineers: Reston, VA, USA, 2010; pp. 294–299. [Google Scholar]
- Yang, J.; Sato, T.; Li, X.-S. Nonlinear site effects on strong ground motion at a reclaimed island. Can. Geotech. J. 2000, 37, 26–39. [Google Scholar] [CrossRef]
- Pehlivan, M.; Park, D.; Sadiq, S.; Hashash, Y.M. Seismic site response of shallow sites in moderate seismicity regions. In Proceedings of the 19th International Conference on Soil Mechanics and Geotechnical Engineering, ICSMGE 2017, Seoul, Republic of Korea, 17–21 September 2017; pp. 1569–1572. [Google Scholar]
- Aaqib, M.; Sadiq, S.; Park, D.; Hashash, Y.M.; Pehlivan, M. Importance of implied strength correction for 1D site response at shallow sites at a moderate to low seismicity region. In Geotechnical Earthquake Engineering and Soil Dynamics V; American Society of Civil Engineers: Reston, VA, USA, 2018; pp. 445–453. [Google Scholar]
- Kim, Y.; Rhie, J.; Kang, T.-S.; Kim, K.-H.; Kim, M.; Lee, S.-J. The 12 September 2016 Gyeongju earthquakes: 1. Observation and remaining questions. Geosci. J. 2016, 20, 747–752. [Google Scholar] [CrossRef]
- Woo, J.U.; Kim, M.; Sheen, D.H.; Kang, T.S.; Rhie, J.; Grigoli, F.; Ellsworth, W.L.; Giardini, D. An in-depth seismological analysis revealing a causal link between the 2017 MW 5.5 Pohang earthquake and EGS project. J. Geophys. Res. Solid Earth 2019, 124, 13060–13078. [Google Scholar] [CrossRef]
- Lee, Y.-G.; Kim, S.-J.; Achmet, Z.; Kwon, O.-S.; Park, D.; Di Sarno, L. Site amplification prediction model of shallow bedrock sites based on machine learning models. Soil Dyn. Earthq. Eng. 2023, 166, 107772. [Google Scholar] [CrossRef]
- Lee, S.-H.; Sun, C.-G.; Yoon, J.-K.; Kim, D.-S. Development and verification of a new site classification system and site coefficients for regions of shallow bedrock in Korea. J. Earthq. Eng. 2012, 16, 795–819. [Google Scholar] [CrossRef]
- Aaqib, M.; Park, D.; Lee, Y.-G.; Pervaiz, U. Development of site classification system and seismic site coefficients for Korea. J. Earthq. Eng. 2022, 26, 8257–8279. [Google Scholar] [CrossRef]
- Choi, J.-S. A case study on the seismic stability evaluation of reclaimed land for road. J. Korean Asph. Inst. 2021, 11, 100–110. [Google Scholar]
- Adewoyin, O.; Joshua, E.; Akinyemi, M.; Omeje, M.; Adagunodo, T. Evaluation of geotechnical parameters of reclaimed land from near-surface seismic refraction method. Heliyon 2021, 7, e06765. [Google Scholar] [CrossRef]
- Seo, J.; Won, D. Characteristics of site-specific response using the measured data from seismic accelerometers in Pohang Yeongil New Port under 9.12 and Pohang earthquakes. Sci. Rep. 2022, 12, 19249. [Google Scholar] [CrossRef]
- Antonopoulos, I.; Park, A.; Maxwell, G. Seismic performance assessment of port reclaimed land incorporating liquefaction and cyclic softening. In Proceedings of the Conference on Performance-based Design in Earthquake Geotechnical Engineering, Beijing, China, 15–17 July 2022; pp. 1434–1445. [Google Scholar]
- Won, M.-S.; Sadiq, S.; Kim, H.J.; Choi, J. Analysis of site-specific ground amplification in Saemangeum Reclaimed Area, South Korea. Nat. Hazards 2025, 1–22. [Google Scholar] [CrossRef]
- He, K.; Ye, J.; Ma, L.; Fang, B. Seismic performance of revetment breakwater and nearby frame structure on reclaimed coral sand foundation in the SCS: Centrifuge shaking table test. Appl. Ocean Res. 2025, 157, 104512. [Google Scholar] [CrossRef]
- Ding, X.; Zhang, Y.; Wu, Q.; Cao, G.; Chen, Z. Effects of groundwater level on the seismic responses of coral sand ground and superstructure by shaking table tests. Acta Geotech. 2022, 17, 3047–3066. [Google Scholar] [CrossRef]
- Bao, X.; Ye, B.; Ye, G.; Zhang, F. Co-seismic and post-seismic behavior of a wall type breakwater on a natural ground composed of liquefiable layer. Nat. Hazards 2016, 83, 1799–1819. [Google Scholar] [CrossRef]
- Zhang, Y.; Ye, J. Physical modelling of the stability of a revetment breakwater built on reclaimed coral calcareous sand foundation in the South China sea—Random waves and dense foundation. Ocean Eng. 2021, 219, 108384. [Google Scholar] [CrossRef]
- Zhang, Y.; Ye, J. Seismic dynamics of revetment breakwater built on reclaimed coral sand foundation in the SCS: Insight from 1 g shaking table tests. Bull. Eng. Geol. Environ. 2023, 82, 134. [Google Scholar] [CrossRef]
- Griffiths, S.C.; Cox, B.R.; Rathje, E.M. Challenges associated with site response analyses for soft soils subjected to high-intensity input ground motions. Soil Dyn. Earthq. Eng. 2016, 85, 1–10. [Google Scholar] [CrossRef]
- Hashash, Y.M.; Musgrove, M.; Harmon, J. DEEPSOIL User Manual V 7.1—Nonlinear and Equivalent Linear Seismic Site Response of One-Dimensional Soil Columns; University of Illinois: Urbana, IL, USA, 2018; p. 12. [Google Scholar]
- Kondner, R.L.; Zelasko, J.S. Void Ratio Effects on the Hyperbolic Stress-Strain Response of a Sand; ASTM International: West Conshohocken, PA, USA, 1964. [Google Scholar]
- Groholski, D.R.; Hashash, Y.; Musgrove, M.; Harmon, J.; Kim, B. Evaluation of 1-D non-linear site response analysis using a general quadratic/hyperbolic strength-controlled constitutive model. In Proceedings of the 6ICEGE: 6th International Conference on Earthquake Geotechnical Engineering, Christchurch, New Zealand, 1–4 November 2015. [Google Scholar]
- Kim, H.-J.; Won, M.-S.; Sadiq, S.; Park, T.-W.; Kim, H.-S.; Jeong, Y.-S.; Park, J.-Y.; Kim, T.-E. Introduction to a novel geotextile tube connection construction method: A case study of test site and field application. Geotext. Geomembr. 2024, 52, 626–634. [Google Scholar] [CrossRef]
- Kim, H.-J.; Won, M.-S.; Sadiq, S.; Park, T.-W.; Kim, H.-S.; Ryu, Y.-T.; Park, Y.-C.; Gwak, J.-H.; Kim, T.-E.; Choi, J.-H. Observations from opening of a novel geotextile tube connection in field test site. Geotext. Geomembr. 2025, 53, 311–317. [Google Scholar] [CrossRef]
- Won, M.-S.; Kim, H.J.; Sadiq, S.; Gwak, J.-H. A Study on the Long-Term Tensile Strength Properties of the Geotextile Tubes. J. Mar. Sci. Eng. 2025, 13, 985. [Google Scholar] [CrossRef]
- KDS 17 10 00: 2018; Korean Design Standard. The Ministry of Land, Infrastructure and Transport: Sejong City, Republic of Korea, 2018.
- Mohr, O. Welche Umstände bedingen die Elastizitätsgrenze und den Bruch eines Materials. Z. Des Ver. Dtsch. Ingenieure 1900, 46, 1572–1577. [Google Scholar]
- Wolff, T.F. Pile capacity prediction using parameter functions. In Proceedings of the Predicted and Observed Axial Behavior of Piles: Results of a Pile Prediction Symposium, Evanston, IL, USA, 25 June 1989; pp. 96–106. [Google Scholar]
- KIGAM. Korea Institute of Geoscience and Mineral Resources. 2016. Available online: http://www.kigam.re.kr/ (accessed on 15 March 2025).
- Campbell, K.W.; Bozorgnia, Y. NGA-West2 ground motion model for the average horizontal components of PGA, PGV, and 5% damped linear acceleration response spectra. Earthq. Spectra 2014, 30, 1087–1115. [Google Scholar] [CrossRef]
- NEMA. Public Announcement of National Seismic Hazard Map. 2013. Available online: https://www.mois.go.kr/mpss/safe/open/0014/0005/?boardId=bbs_0000000000000041&mode=view&cntId=8606&category=%EC%9E%AC%EB%82%9C%EA%B4%80%EB%A6%AC%EC%8B%A4&pageIdx= (accessed on 15 March 2025).
- Darendeli, M.B. Development of a New Family of Normalized Modulus Reduction and Material Damping Curves; The University of Texas at Austin: Austin, TX, USA, 2001. [Google Scholar]
- Vucetic, M.; Dobry, R. Effect of soil plasticity on cyclic response. J. Geotech. Eng. 1991, 117, 89–107. [Google Scholar] [CrossRef]
- Menq, F.-Y. Dynamic Properties of Sandy and Gravelly Soils; The University of Texas at Austin: Austin, TX, USA, 2003. [Google Scholar]
- Phillips, C.; Hashash, Y.M. Damping formulation for nonlinear 1D site response analyses. Soil Dyn. Earthq. Eng. 2009, 29, 1143–1158. [Google Scholar] [CrossRef]
- Kwok, A.O.; Stewart, J.P.; Hashash, Y.M.; Matasovic, N.; Pyke, R.; Wang, Z.; Yang, Z. Use of exact solutions of wave propagation problems to guide implementation of nonlinear seismic ground response analysis procedures. J. Geotech. Geoenvironmental Eng. 2007, 133, 1385–1398. [Google Scholar] [CrossRef]
- Shamekhi, S.; Ansal, A.; Kurtuluş, A. A comparison study between 1D and 2D site response analyses based on observed earthquake acceleration records. In Proceedings of the International Conference on New Developments in Soil Mechanics and Geotechnical Engineering, San Francisco, CA, USA, 12–16 August 1985; pp. 393–401. [Google Scholar]
- Volpini, C.; Douglas, J. An accessible approach for the site response analysis of quasi-horizontal layered deposits. Bull. Earthq. Eng. 2019, 17, 1163–1183. [Google Scholar] [CrossRef]
- Stamati, O.; Klimis, N.; Lazaridis, T. Evidence of complex site effects and soil non-linearity numerically estimated by 2D vs 1D seismic response analyses in the city of Xanthi. Soil Dyn. Earthq. Eng. 2016, 87, 101–115. [Google Scholar] [CrossRef]
- Flores Lopez, F.A.; Ayes Zamudio, J.C.; Vargas Moreno, C.O.; Vázquez Vázquez, A. Site response analysis (SRA): A practical comparison among different dimensional approaches. In From Fundamentals to Applications in Geotechnics; IOS Press: Amsterdam, The Netherlands, 2015; pp. 1041–1048. [Google Scholar]
- Nautiyal, P.; Raj, D.; Bharathi, M.; Dubey, R. Ground response analysis: Comparison of 1D, 2D and 3D approach. In Proceedings of the Indian Geotechnical Conference 2019: IGC-2019 Volume IV; Springer: Singapore, 2021; pp. 607–619. [Google Scholar]
- Hashemi, K.; Smerzini, C. Comparison of 1D vs 2D vs 3D numerical approaches for prediction of seismic ground motion and site effects in thessaloniki urban area. In Proceedings of the 16th European Conference on Earthquake Engineering, Thessaloniki, Greece, 18–21 June 2018; pp. 1–12. [Google Scholar]
- Pretell, R.; Ziotopoulou, K.; Abrahamson, N.A. Conducting 1D site response analyses to capture 2D VS spatial variability effects. Earthq. Spectra 2022, 38, 2235–2259. [Google Scholar] [CrossRef]


| Profile | H (m) | Vs,soil (m/s) | Tg (s) | Vs30 (m/s) | MOLIT (2018) [35] |
|---|---|---|---|---|---|
| P1 | 35 | 232 | 0.60 | 215 | S4 |
| P2 | 39 | 215 | 0.70 | 199 | |
| P3 | 48.5 | 220 | 0.87 | 186 |
| Sr No. | Name | Magnitude | Mechanism | Rrup (km) | Tm (s) |
|---|---|---|---|---|---|
| EQ1 | Gyeongju | 5.54 | Strike slip | 13 | 0.146 |
| EQ2 | Pohang | 5.4 | Strike slip | 30 | 0.473 |
| EQ3 | Park field | 6.2 | Reverse | 42 | 0.411 |
Disclaimer/Publisher’s Note: The statements, opinions and data contained in all publications are solely those of the individual author(s) and contributor(s) and not of MDPI and/or the editor(s). MDPI and/or the editor(s) disclaim responsibility for any injury to people or property resulting from any ideas, methods, instructions or products referred to in the content. |
© 2025 by the authors. Licensee MDPI, Basel, Switzerland. This article is an open access article distributed under the terms and conditions of the Creative Commons Attribution (CC BY) license (https://creativecommons.org/licenses/by/4.0/).
Share and Cite
Shamsher, S.; Won, M.-S.; Park, Y.-C.; Park, Y.-H.; Sayed, M.A. Effect of Nonlinear Constitutive Models on Seismic Site Response of Soft Reclaimed Soil Deposits. J. Mar. Sci. Eng. 2025, 13, 1333. https://doi.org/10.3390/jmse13071333
Shamsher S, Won M-S, Park Y-C, Park Y-H, Sayed MA. Effect of Nonlinear Constitutive Models on Seismic Site Response of Soft Reclaimed Soil Deposits. Journal of Marine Science and Engineering. 2025; 13(7):1333. https://doi.org/10.3390/jmse13071333
Chicago/Turabian StyleShamsher, Sadiq, Myoung-Soo Won, Young-Chul Park, Yoon-Ho Park, and Mohamed A. Sayed. 2025. "Effect of Nonlinear Constitutive Models on Seismic Site Response of Soft Reclaimed Soil Deposits" Journal of Marine Science and Engineering 13, no. 7: 1333. https://doi.org/10.3390/jmse13071333
APA StyleShamsher, S., Won, M.-S., Park, Y.-C., Park, Y.-H., & Sayed, M. A. (2025). Effect of Nonlinear Constitutive Models on Seismic Site Response of Soft Reclaimed Soil Deposits. Journal of Marine Science and Engineering, 13(7), 1333. https://doi.org/10.3390/jmse13071333