1. Introduction
Designing a motor yacht involves several key considerations, including the yacht’s size, intended use, materials, propulsion system, interior layout, and aesthetic features. It is essential to identify the primary purpose of the vessel at the beginning of the project—whether for cruising, entertaining, fishing, or a combination of these—to evaluate the operational profile of the yacht. This evaluation includes estimating the required crew and guest numbers and providing a preliminary definition of the internal spaces (such as the number of cabins and living areas).
The critical aspect of the design process is determining the vessel’s size and style. This sizing focuses on selecting the main dimensions of the yacht, including length, breadth, draught, and an initial estimate of displacement. The style relates to the yacht’s design theme, such as whether it features a conventional bow, a vertical bow, a sports yacht design, or an explorer model [
1]. Following this, decisions must be made regarding the propulsion system (whether conventional, podded, or hybrid electric solutions) and the final hull design before settling on the definitive interior layout and aesthetic features of both the exterior and interior [
2,
3]. Actually, there is a lack of studies concerning the feasibility study of a yacht, as the principal research is centered on more advanced stages of the process, focusing in specific aspects of the design such as structural issues [
4], power systems [
5,
6], alternative fuels [
7], or acoustic emissions [
8].
In concept design, determining the sizing of the vessel is the most crucial element. This involves selecting the best combination of hull dimensions to achieve a specific displacement and meet performance criteria concerning relevant attributes of the vessel [
9,
10]. The design process typically relies on the designers’ confidence in their knowledge gained from designing units with similar hull form characteristics. While this approach is valuable for building sister units, it is less advisable for developing an entirely new concept. Therefore, general guidelines are necessary to create a new successful design efficiently. The standard [
11,
12,
13] and holistic or Multi-Attribute Decision Method design strategies and methodologies [
14,
15,
16,
17] are all centered in the development of surrogate models, and therefore the proposed study is fully in line with these requirements.
Designing a motor yacht requires addressing various aspects of ship hydrodynamics: resistance, propulsion, seakeeping, and maneuverability. While these factors have been extensively discussed individually in the context of different kinds of ships [
18], a comprehensive joint investigation into smaller hulls like motor yachts is lacking in the existing literature. Available guidelines primarily focus on vertical motions in waves [
19,
20,
21] or specific studies on hybrid-electric propulsion [
22,
23,
24,
25] and dynamic positioning of such vessels [
26]. There is currently no comprehensive analysis of how different hull forms affect the overall hydrodynamic performance of motor yachts, given that the relationships between hull form parameters and hydrodynamic performance can lead to conflicting solutions, particularly concerning propulsion or seakeeping characteristics.
To bridge the gap between designers’ needs and the current literature, this work presents a preliminary investigation into how main dimensions affect the hydrodynamic performance of a motor yacht. This study encompasses estimating several unique hydrodynamic attributes related to resistance, seakeeping, and maneuvering characteristics. To achieve this, a design space was created, starting from a reference hull and parametrically modifying the main dimensions while keeping the hull form coefficients constant. This approach resulted in a design space created using design of experiments techniques and applying a central composite design. From this process, 15 hulls were derived from the initial hull form by systematically varying the length, breadth, and draught. For all hulls, calculations concerning resistance, seakeeping, and maneuvering were conducted for speed and heading conditions based on ISO 22834:2022 [
27] guidelines. Specifically, resistance parameters were calculated using viscous flow CFD calculations, seakeeping performances were assessed using a linear 2D strip theory code, and maneuvering performance was evaluated with rigid-body time-domain simulations. The results generated a database of hydrodynamic attributes that can be analyzed using multiple linear regression techniques. Subsequently, regressions of these attributes were performed as exclusive functions of the vessel’s main dimensions.
The paper consists of several sections. The first section defines the design space, the second details the hydrodynamic calculations performed on the 15 hulls contained within the design space, the third presents the multiple linear regression analysis, and the fourth illustrates how the obtained regression can be applied to identify the relationship between hull forms and the hydrodynamic performance of motor yachts. The results discussed in this paper are promising for future developments in yacht design.
2. The Initial Design Space
This study examines the hydrodynamic performance of motor yachts to determine optimal dimensions during the concept design phase of a new vessel. To achieve this, it is essential to develop mathematical tools, such as response surfaces, that capture how relevant hydrodynamic quantities vary with the main dimensions of the yachts. To facilitate this, a reference vessel is selected, and a set of geometrical transformations is applied to the primary parameters using design of experiments. This approach helps to create a design space suitable for regression analysis. The following sections will describe the reference hull form and the parametric variations that define the 15 hull forms included in the database.
2.1. The Parent Hull
The reference hull form has been specifically designed for this study. The main dimensions of the parent hull have been established based on a preliminary analysis of the yacht database at MARIN.
Table 1 lists the primary specifications of the hull, while
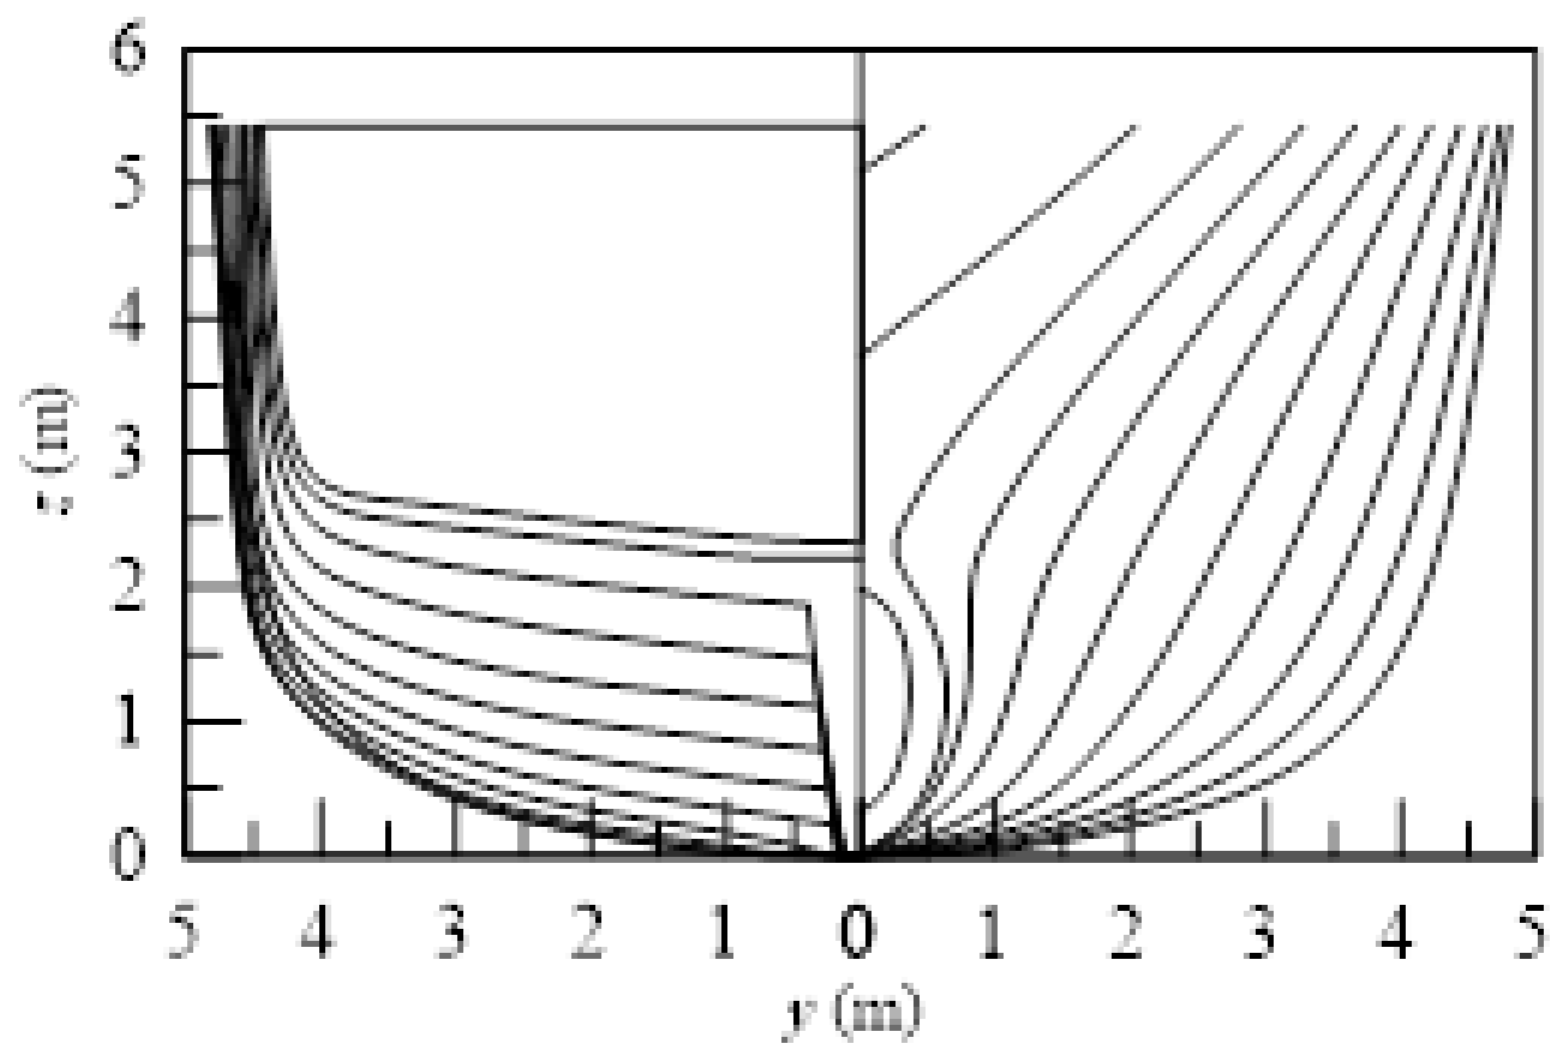
Figure 1 provides the transversal sections of the vessel.
The initial hull serves as an example of a yacht designed to study parametric variations in the main dimensions, with lengths ranging from 20 to 40 m. The following section provides more details about the specific ranges and transformations applied to the reference hull form.
2.2. Hull Form Variations
Starting with the original parent hull form, we developed a set of 15 different hull designs by systematically altering the main dimensions. To simplify the process, we maintained the hull form coefficients at the same values as the parent hull, as shown in
Table 1. Then, using design of experiments (DoE) techniques [
28,
29], we chose a central composite design (CCD) to represent the 15 design variations [
30,
31]. A central composite design is a type of experimental design used in response surface methodology to build a second-order model for a response variable. It is a versatile design that combines factorial or fractional factorial points with center points and axial points (also called star points) to estimate the coefficients of a second-degree polynomial. This allows for efficient exploration of the design space and optimization of the response. The main dimensions of the resulting hull forms are detailed in
Table 2, illustrated in
Figure 2 with the body sections and in
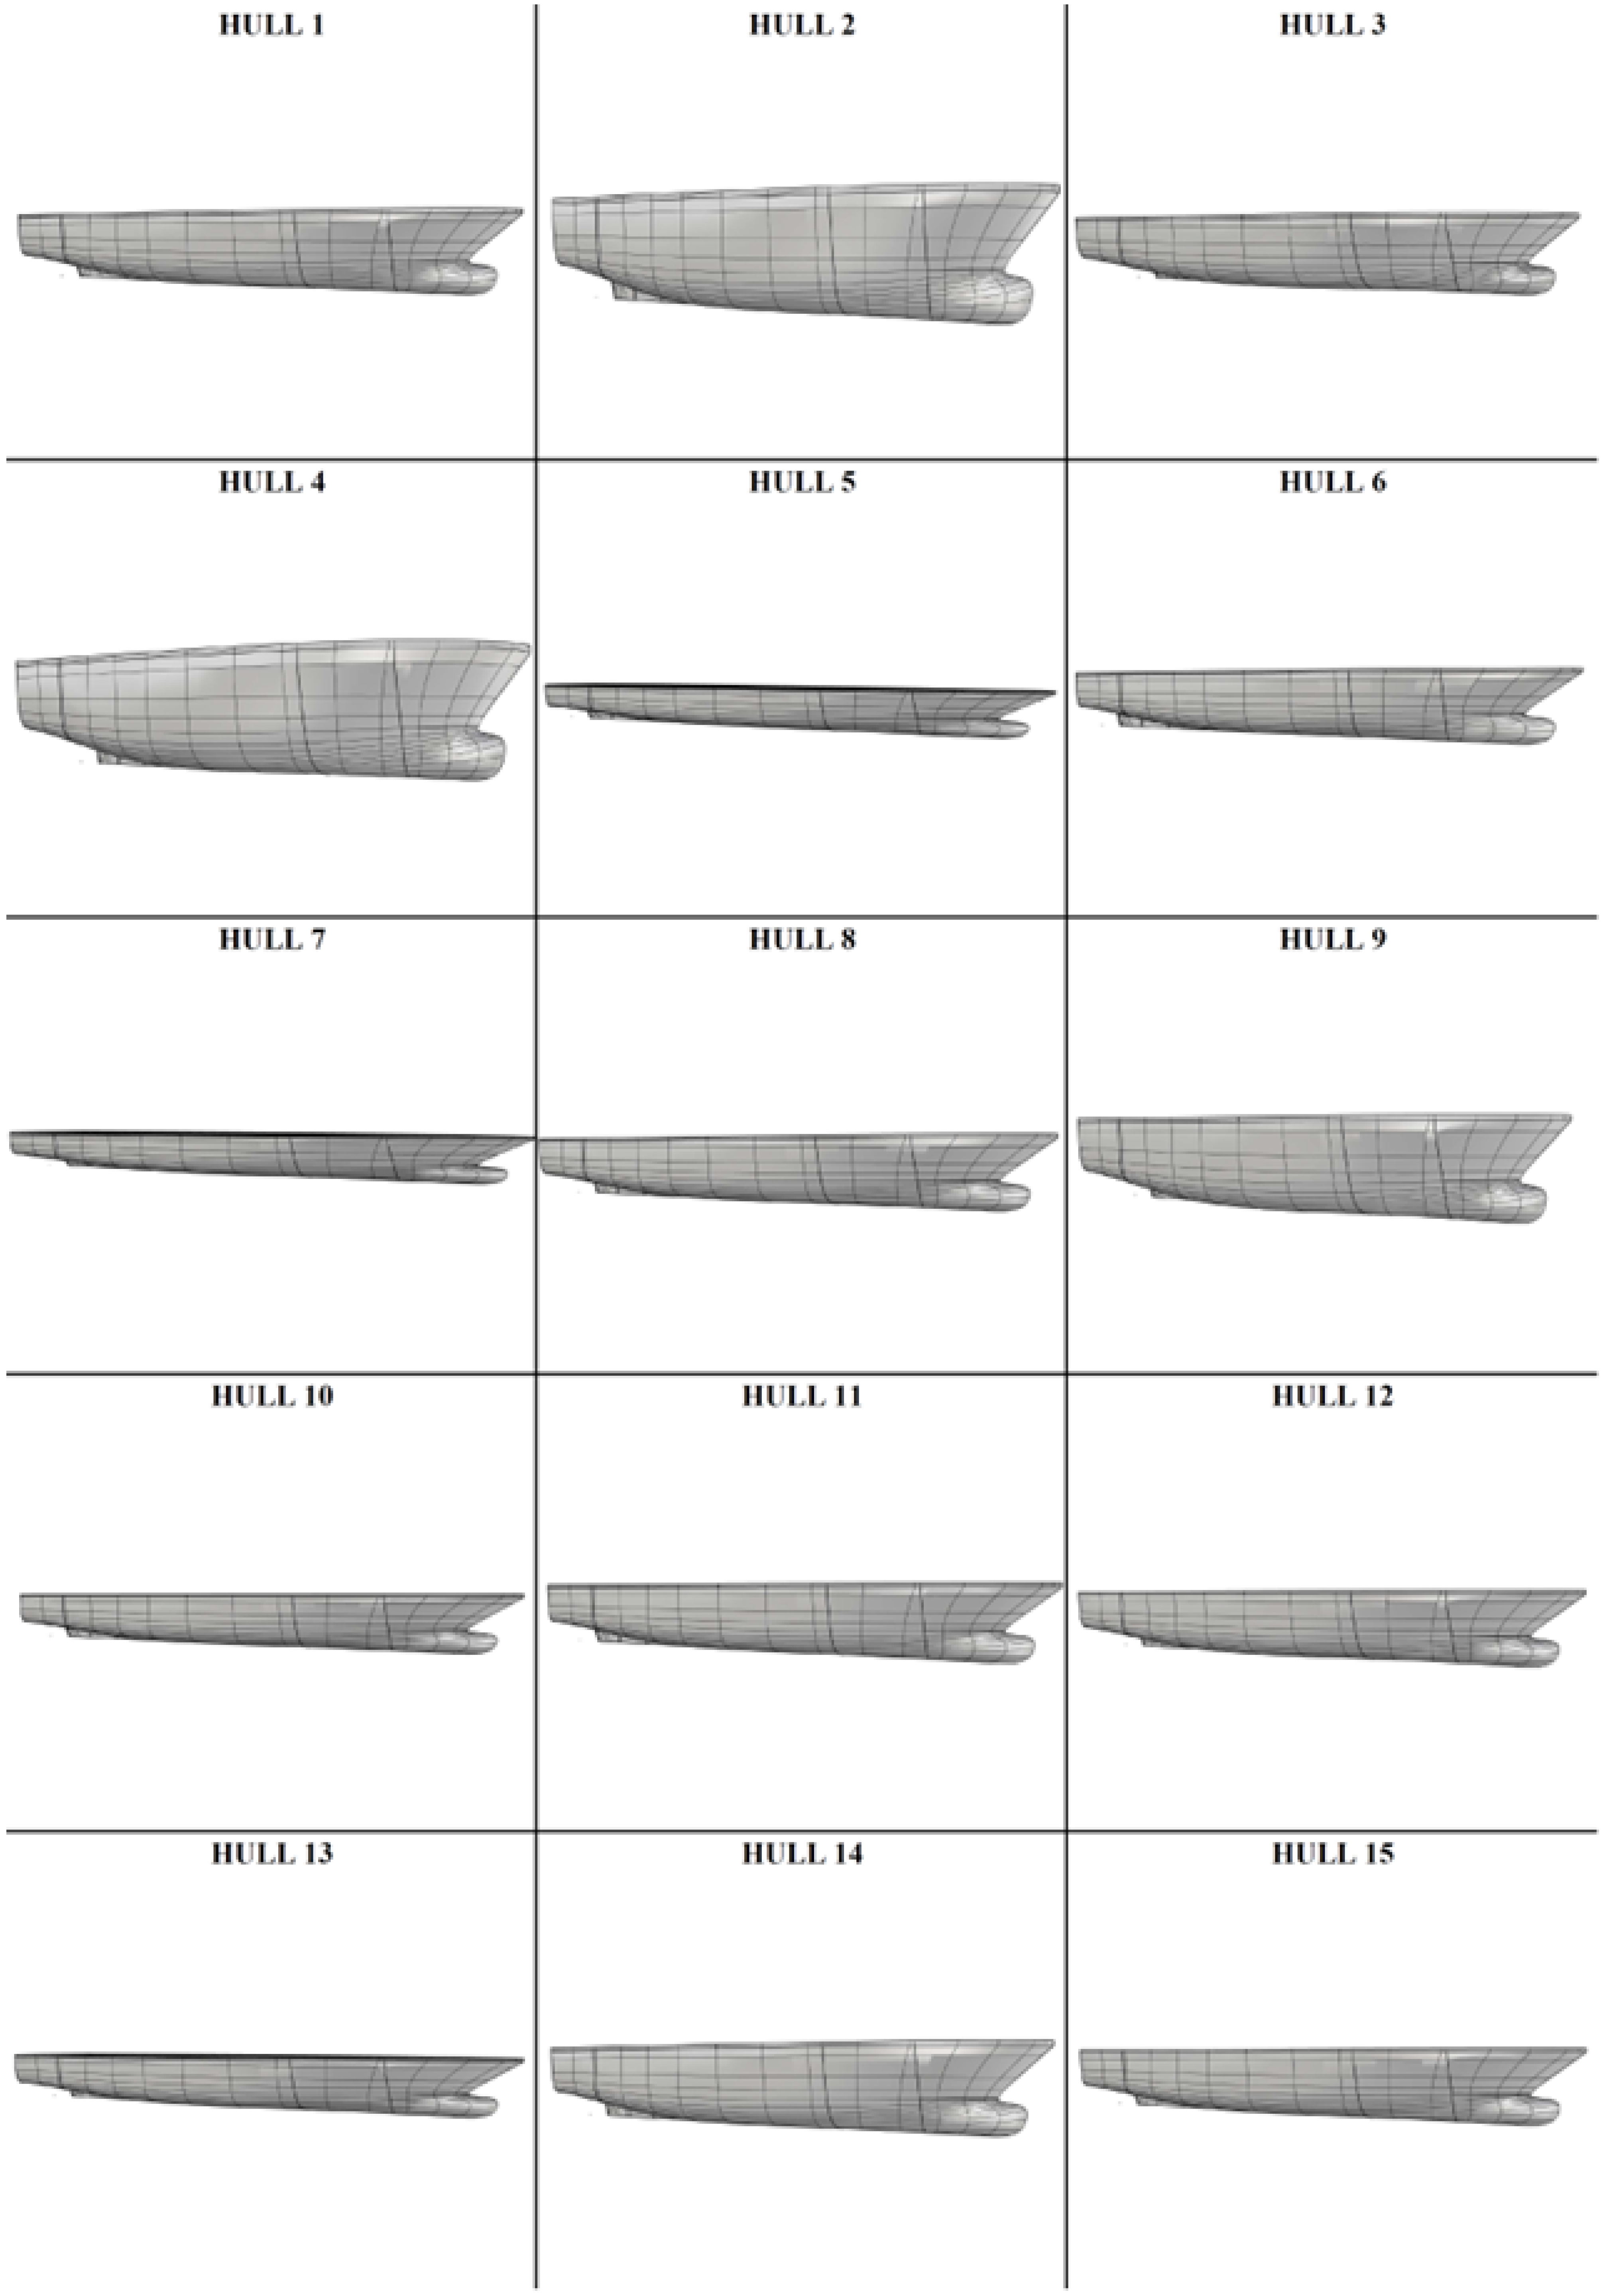
Figure 3 in three-dimensional form. The variations made to the original hull forms resulted in a range of main dimensions, which are as follows:
This approximation may impact the final results, as the coefficients can influence hydrodynamic performance. From a maneuvering perspective, the decision to keep the coefficients constant aligns with typical preliminary studies, such as Clarke’s diagram [
32], which illustrates the dynamic stability boundaries based on block coefficients in relation to the length-to-breadth (
) and breadth-to-draught (
) ratios. However, this serves as a starting point for developing a methodology for the feasibility study of new designs. Over time, this methodology can be refined by incorporating additional hull form variations and adjustments to the hull form coefficients. In the meantime, the developed model will be really effective only for hulls having the same characteristics of the reference hull. However, this is not a really important issue for the feasibility study of a new hull, as the uncertainties at this design stage are extremely high and small differences in the hull form coefficients most likely lay inside this uncertainty range.
The choice of a CCD affects the types of analyses that can be performed on the resulting hull series. Specifically, any attribute relevant to a single hull can be described using a maximum of a full quadratic model. Therefore, when planning to derive multiple linear regressions from the resulting datasets, it is important to take this limitation into consideration as a constraint for the research.
3. Hydrodynamics Database Creation
The key aspect of developing design tools for the preliminary design of a new vessel is ensuring the reliability of the initial dataset used to create these tools. Modern methodologies for numerical estimation of hydrodynamic performance allow for a high level of reliability, thereby enhancing the accuracy of initial predictions. However, it is uncommon in the existing literature to find methods for preliminary design that rely on first-principle calculations.
This study will primarily focus on the hydrodynamics of motor yachts, specifically their behavior while sailing in calm water, in waves, and during maneuvers. Various tools have been employed to assess the hydrodynamic performance required to describe the vessel’s behavior effectively. For calm water conditions—analyzing resistance and dynamic trim—viscous flow Computational Fluid Dynamics (CFD) calculations have been conducted. The vessel’s behavior in waves has been evaluated using strip-theory calculations, emphasizing the yacht’s comfort characteristics. Regarding maneuverability, time-domain simulations have been executed to assess yaw and the vessel’s turning ability.
In the following sections, a more detailed description of the calculations performed will be provided, along with the key parameters selected as primary attributes for the hydrodynamic characterization of a yacht.
3.1. Hull Resistance
Resistance calculations were conducted using MARIN’s in-house CFD software, ReFRESCO [
33]. ReFRESCO is an open-access, community-based CFD code tailored for the maritime sector. It addresses multiphase, unsteady, incompressible viscous flows by employing the Navier–Stokes equations, which are further enhanced with turbulence models and volume-fraction transport equations for various phases. The equations are discretized using a finite-volume approach with cell-centered collocated variables. A pressure-correction equation based on the SIMPLE algorithm is implemented to ensure mass conservation. Time integration is carried out implicitly using second-order backward schemes. Currently, ReFRESCO is under development and verification, with several applications being validated at MARIN in collaboration with various globally recognized non-profit organizations.
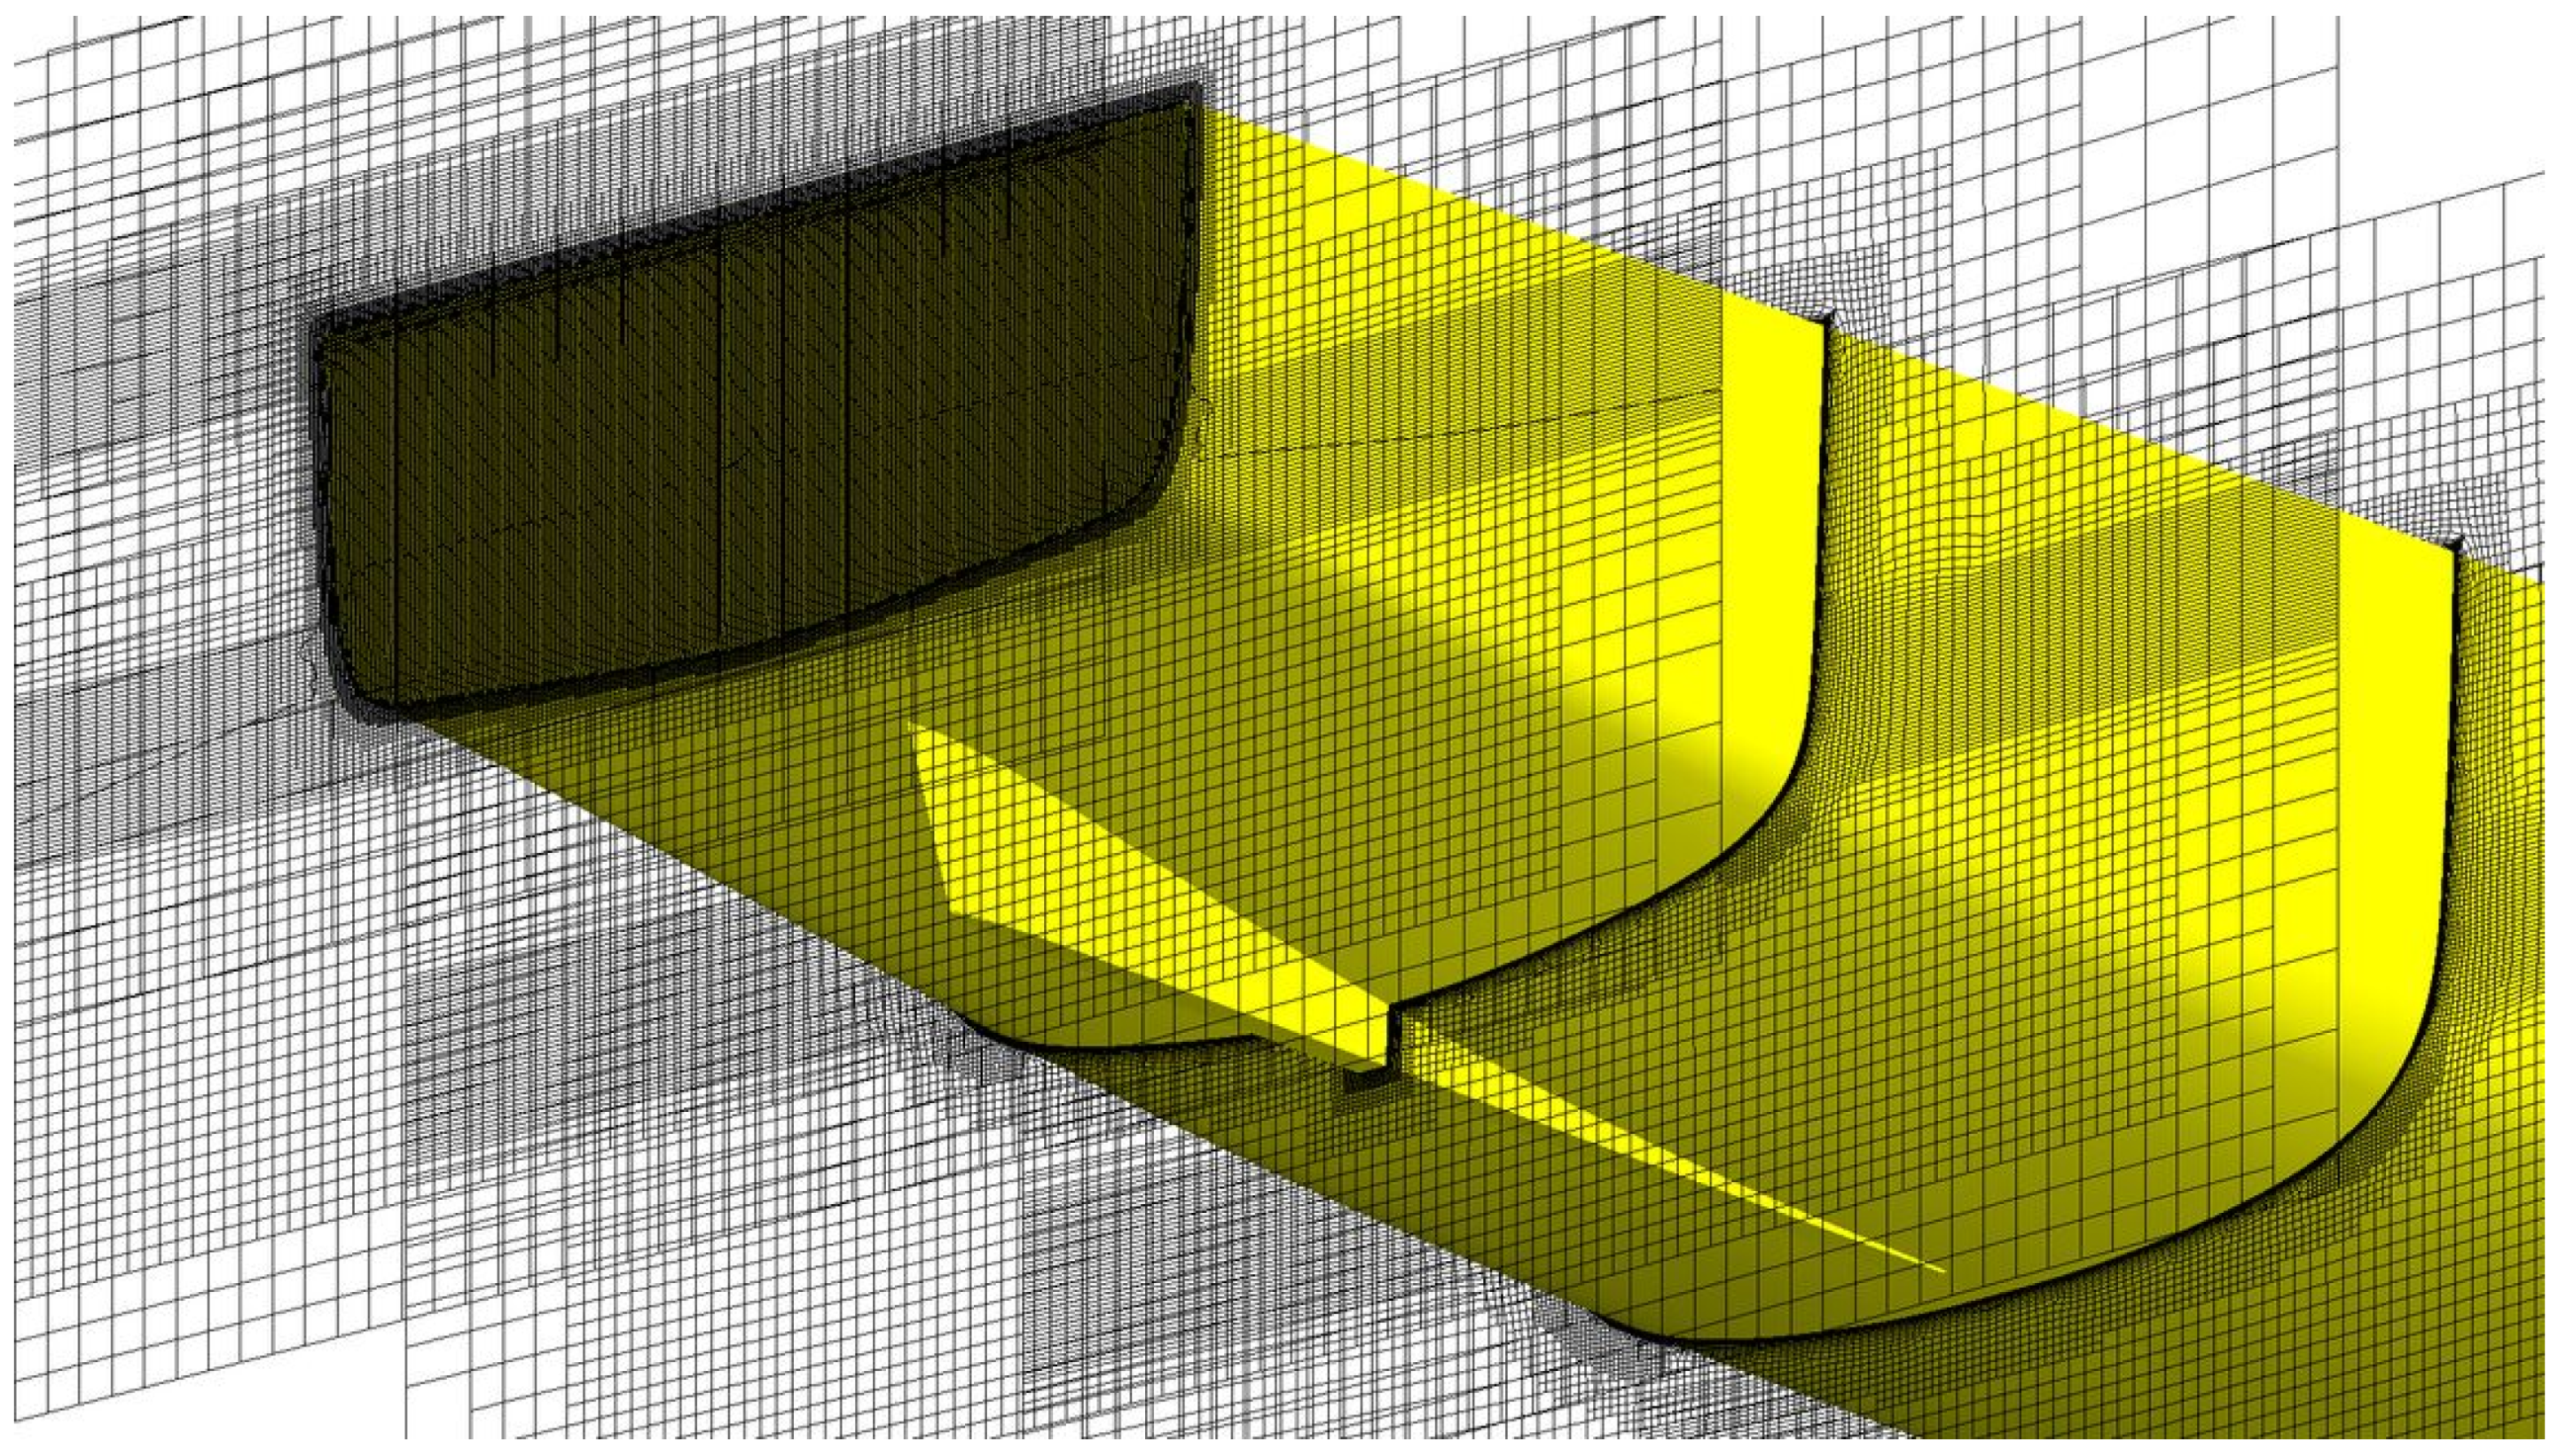
The computational grids utilized in this study were created with the software Hexpress. Surface refinements were applied to the ship hull to enhance spatial resolution and accurately capture the near-wall flow. This refinement was supplemented by three groups of boxes designed to further improve space resolution in both the near and far-field flow regions. The computations were conducted at full scale, and the size of the computational domain was sufficiently large to guarantee that the boundary conditions had a negligible impact on the flow solution. Such settings are the standard employed at MARIN to perform resistance and propulsion calculations as a result of validation and sensitivity studies performed in the past [
34,
35,
36]. More precisely, the domain dimensions are parameterized as a function of the vessel length, resulting in a length of 6
L, a breadth of 2
L and a depth of 4
L. The domain is symmetric, therefore only half of the hull/domain is modeled. An overview of the total grid size employed for each hull is given in
Table 3. As an example,
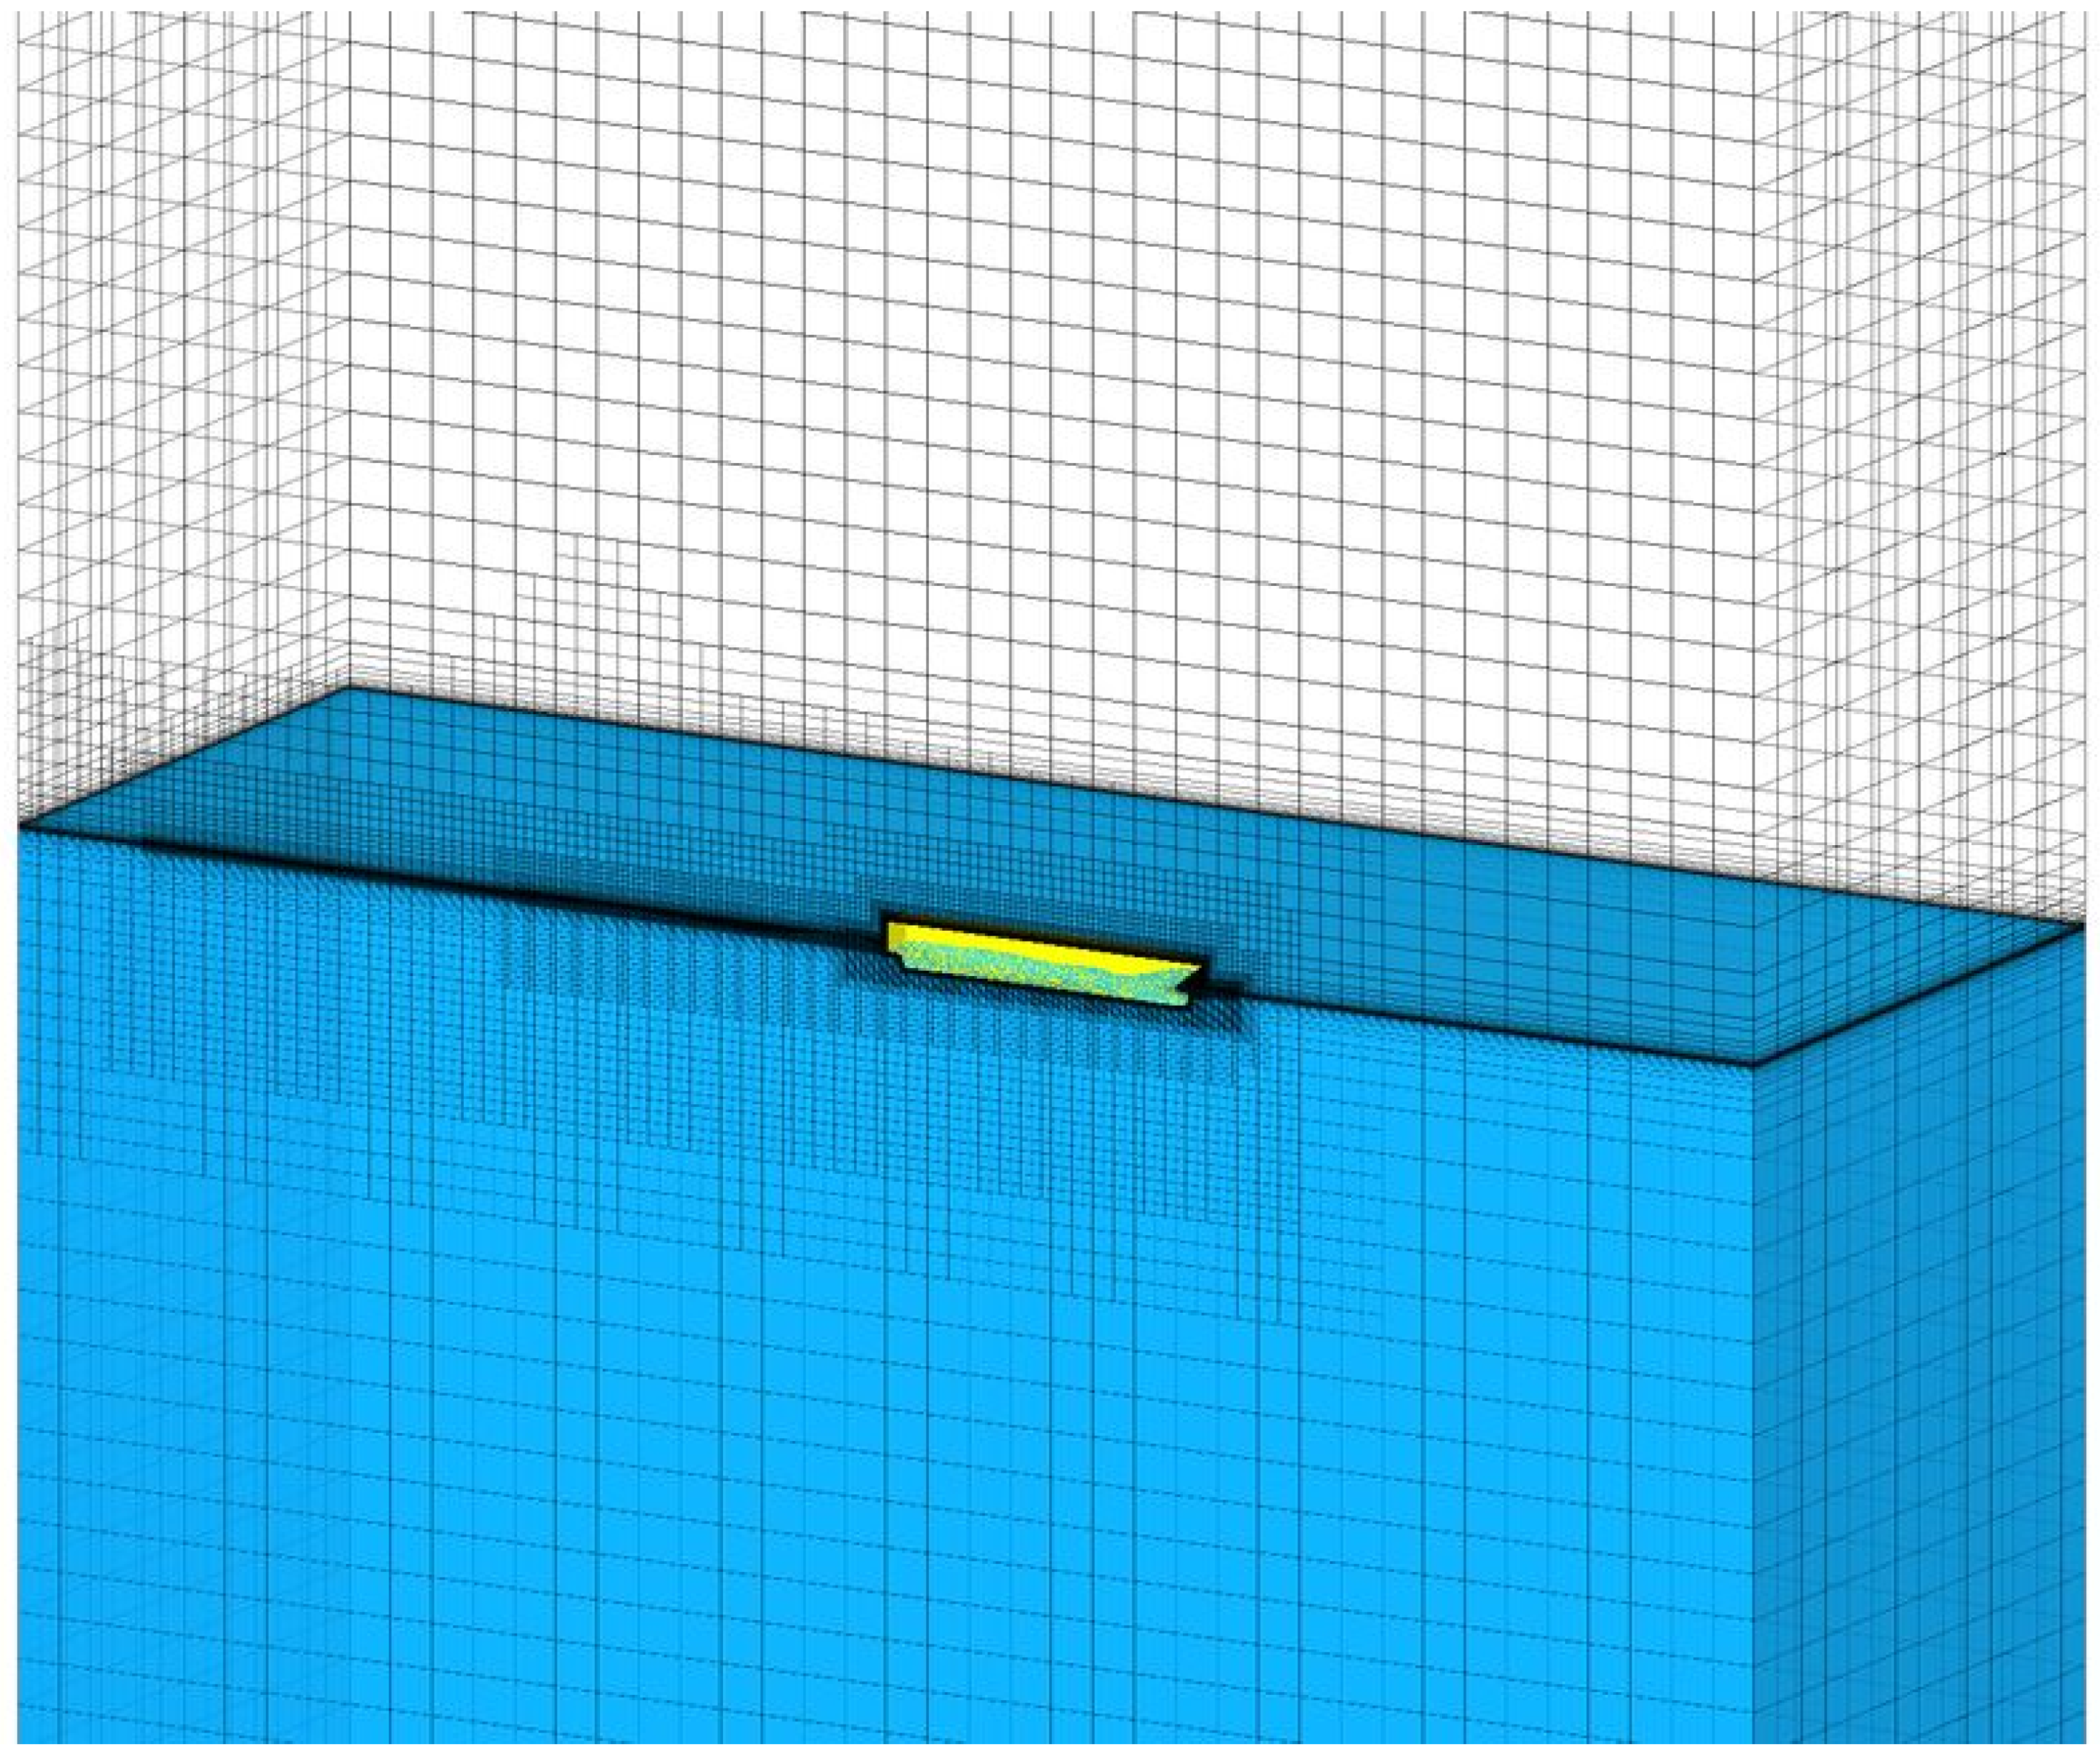
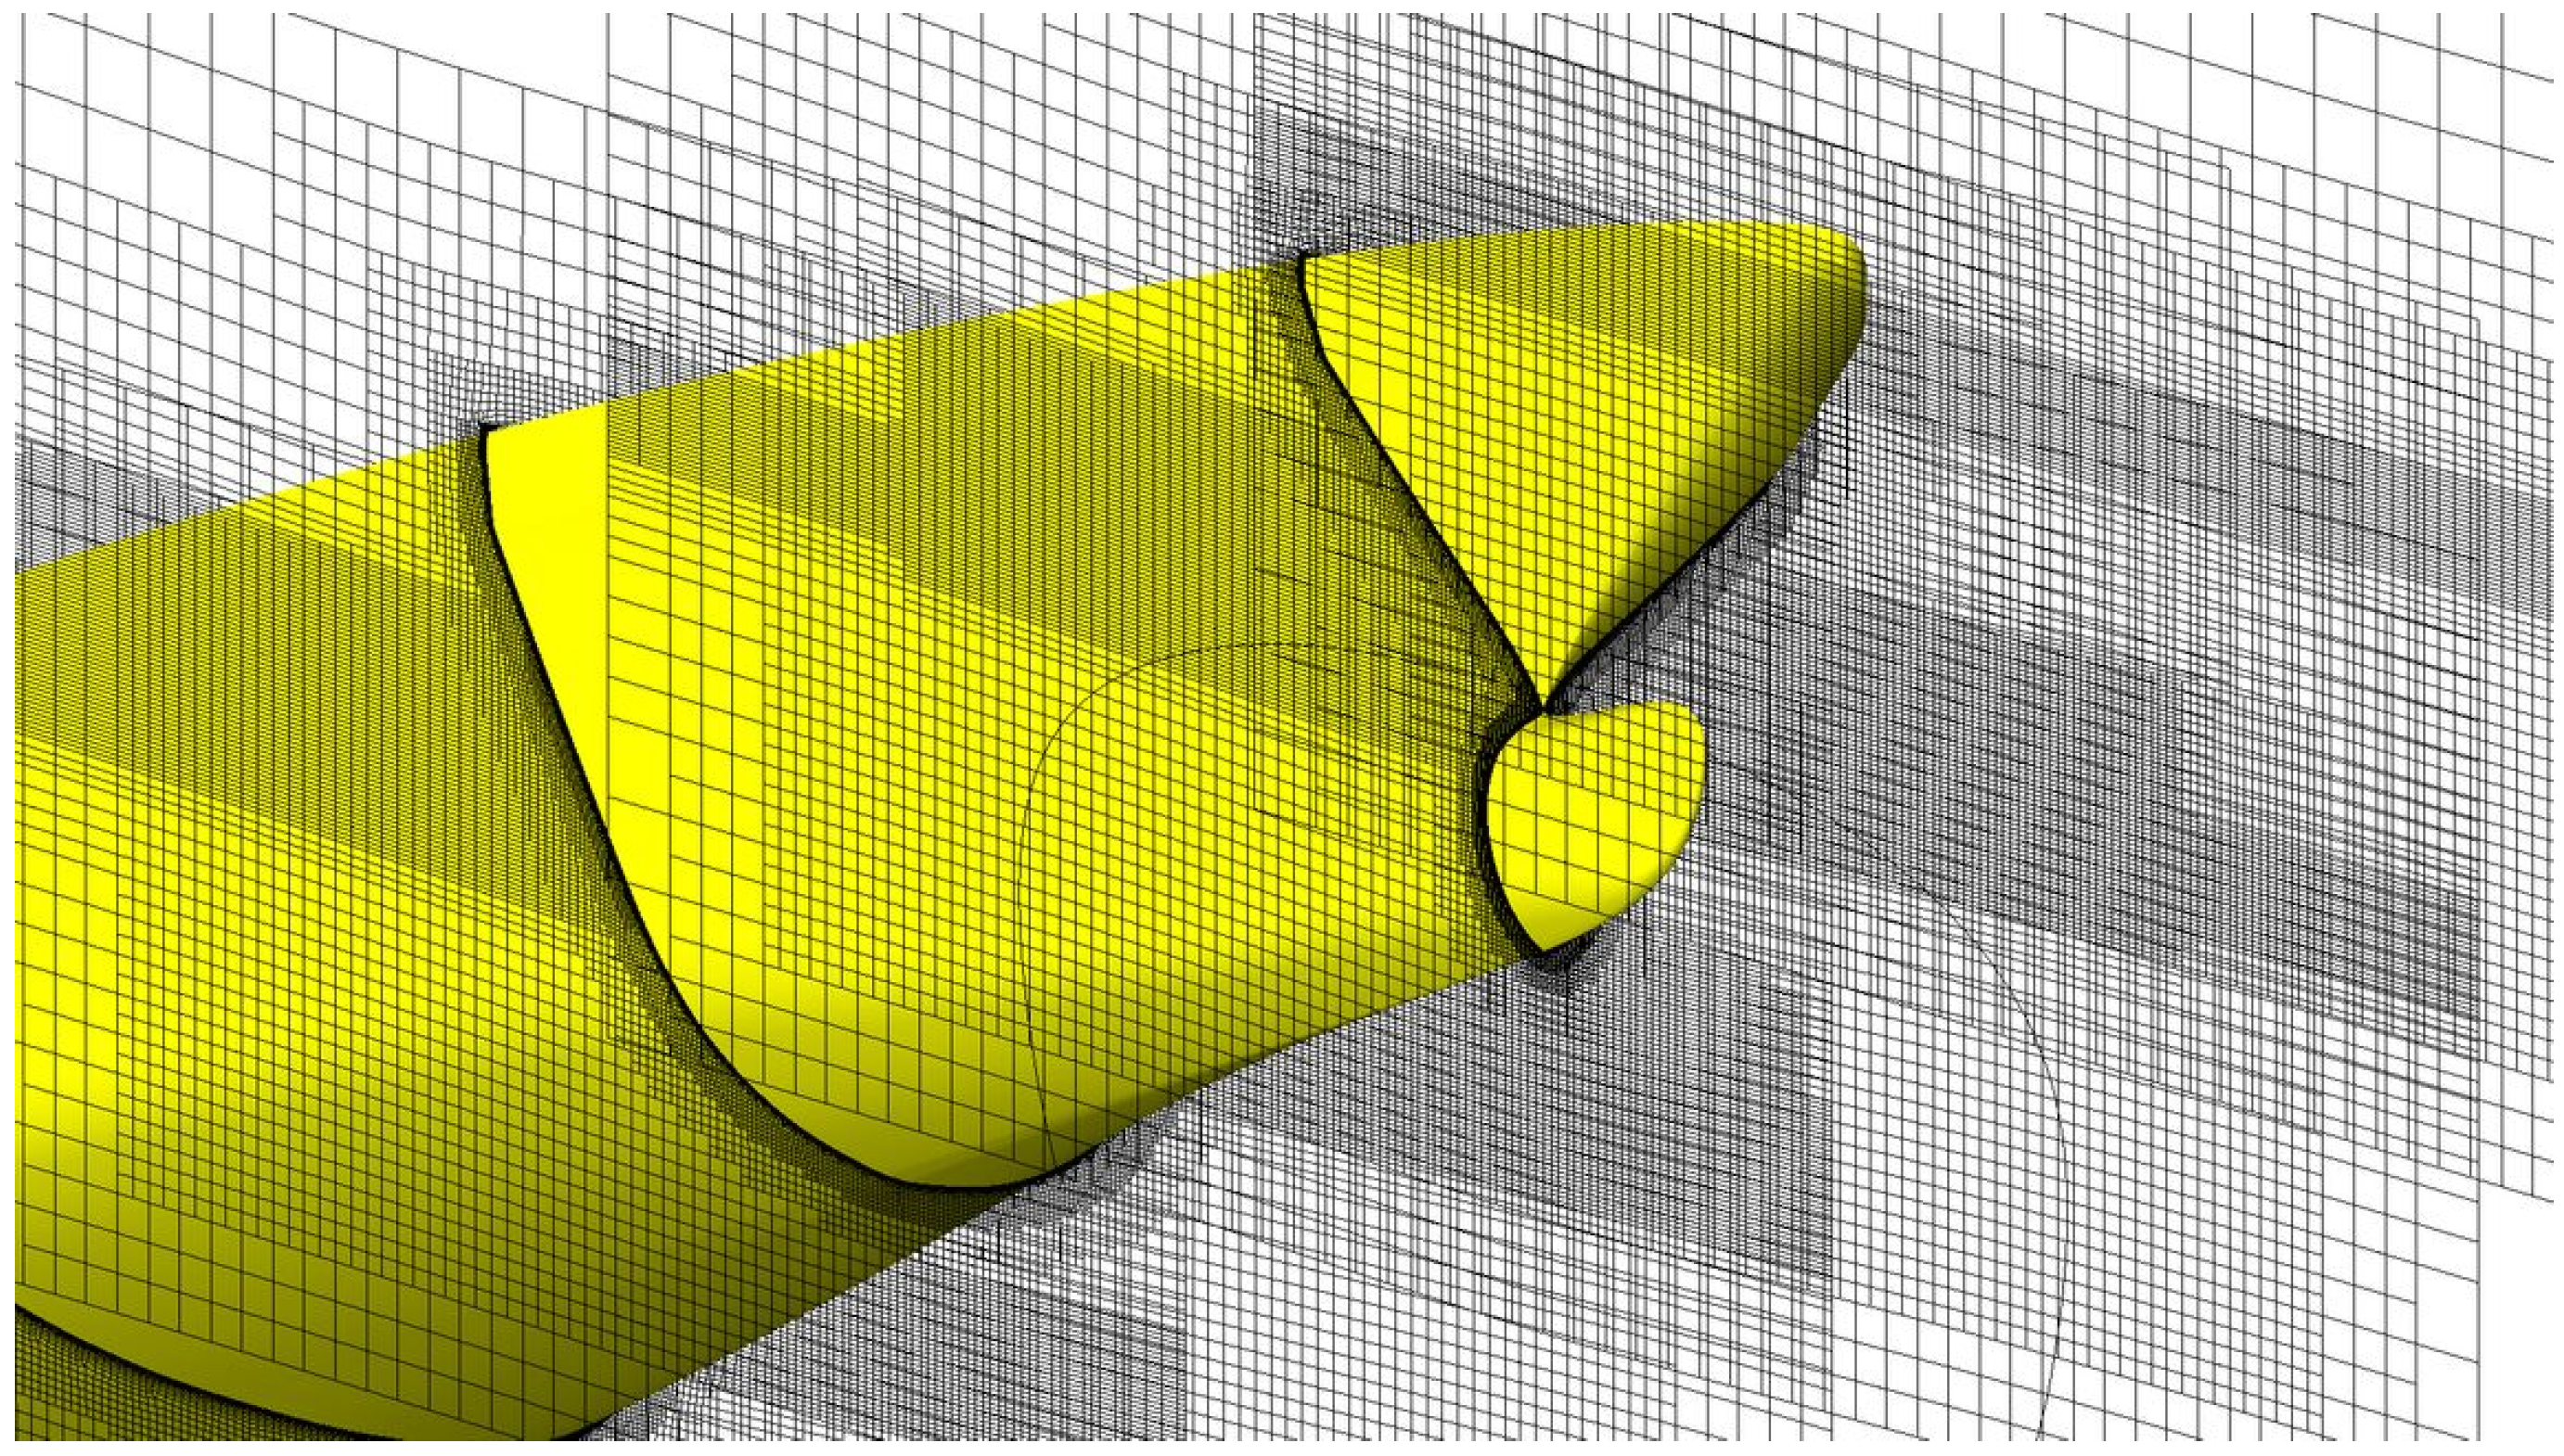
Figure 4 reports an overview of the calculation mesh for the case of Hull 15.
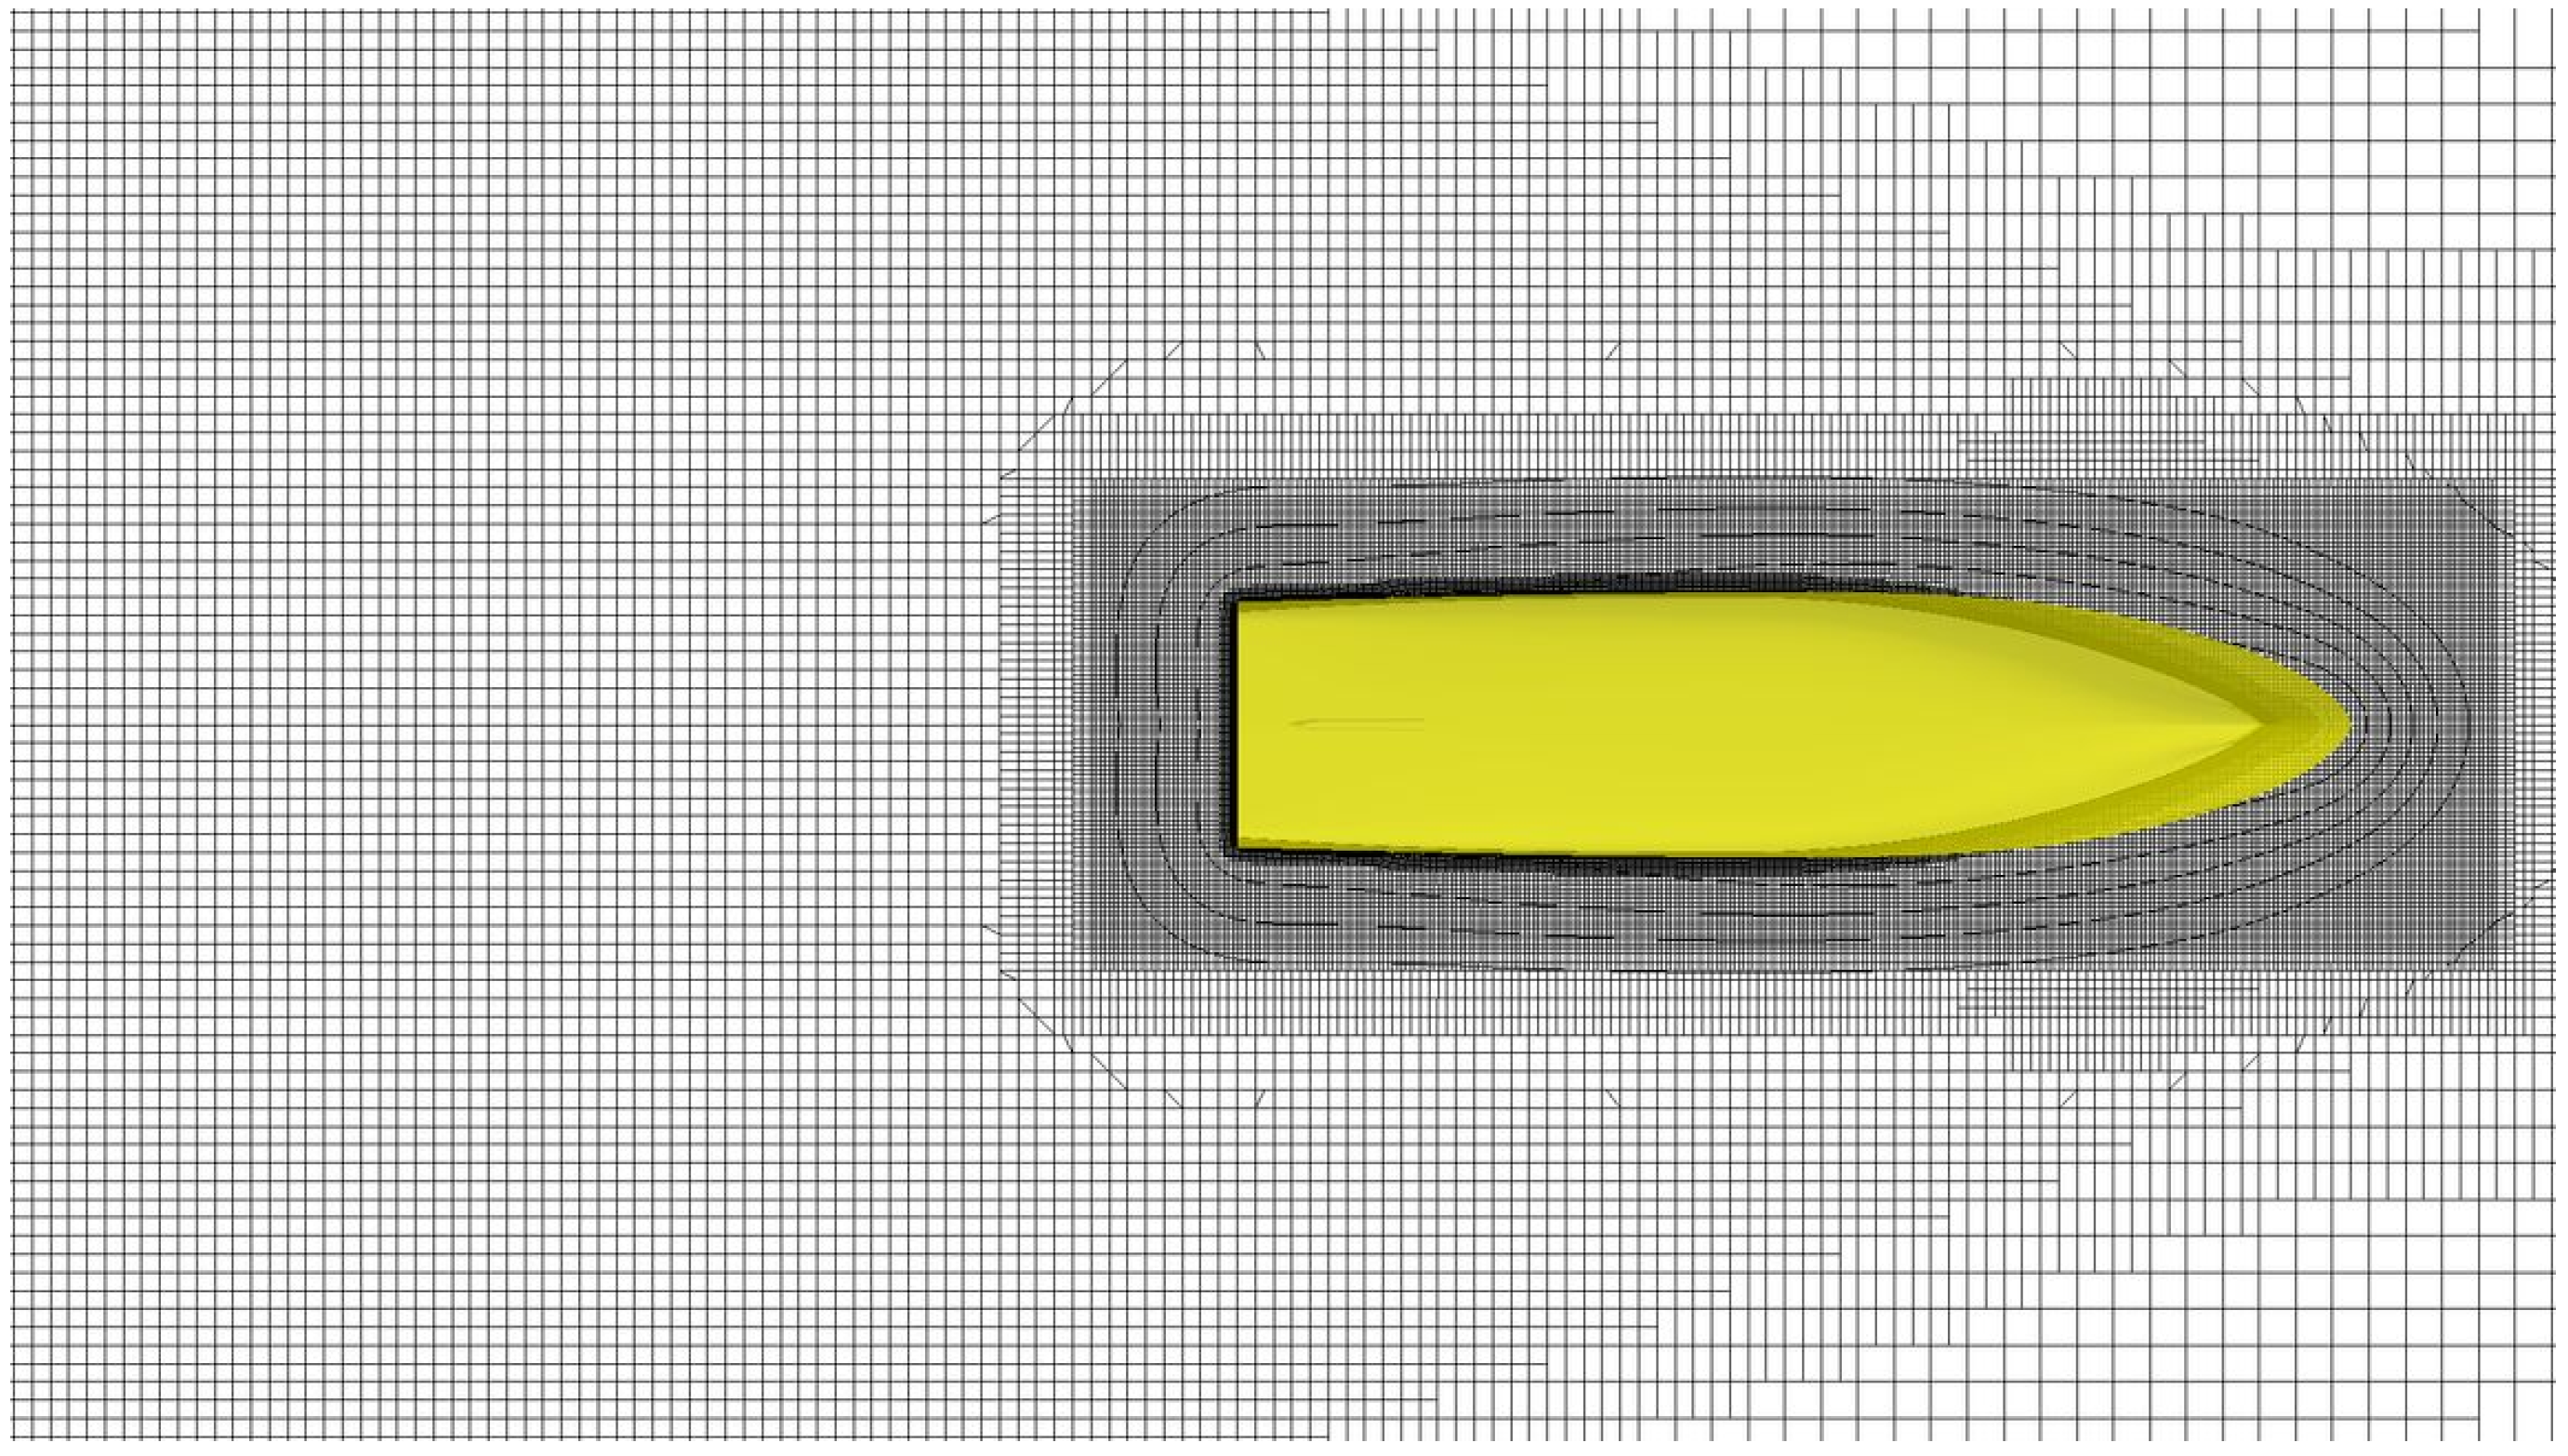
Figure 5 provides a top view of the mesh, while
Figure 6 and
Figure 7 show some mesh details in the bow and stern areas.
For this specific case study, CFD simulations were performed in calm water at a speed of 12 knots. This speed has been selected as it is the most relevant speed for actual yacht operations. The results are presented in terms of total resistance (as described by Larson and Raven [
37]) and dynamic trim. The resistance results include a correlation allowance (CA), which accounts for drag due to hull roughness as well as still-air drag from the hull and superstructures. In terms of dynamic trim, positive values indicate a bow-down trim, whereas negative values signify a stern-down trim.
3.2. Seakeeping Performances
To evaluate the seakeeping characteristics of the developed series of yachts, the new regulation ISO 22834:2022 has been applied to estimate the overall comfort level. This regulation considers the Effective Gravity Angle (EGA) and the Motion Sickness Incidence (MSI) as key performance indicators for global comfort, which are then translated into a star rating system ranging from one star (poor) to five stars (excellent).
The assessment involves evaluating the EGA and MSI at a reference heading of 135 degrees and for speeds of 0 and 12 knots. This is performed across five locations on the yacht: the beach club (BC), the crew area (CA), the dining area (DA), the owner’s cabin (OC), and the wheelhouse (WH).
The coordinates for these locations onboard the 15 vessels have been derived based on the reference used by the authors in previous publications [
20,
26].
Table 4 presents the coordinates used for the calculations in non-dimensional form, based on the length between perpendiculars (
), the breadth (
B), and the draught (
T).
For all the hulls, the longitudinal position of the center of gravity has been set to ensure a zero-trim condition at rest. The vertical position of the center of gravity has been calculated by assuming the transverse metacentric height is equal to 10% of the breadth at the waterline. This approach guarantees a consistent application of seakeeping calculations.
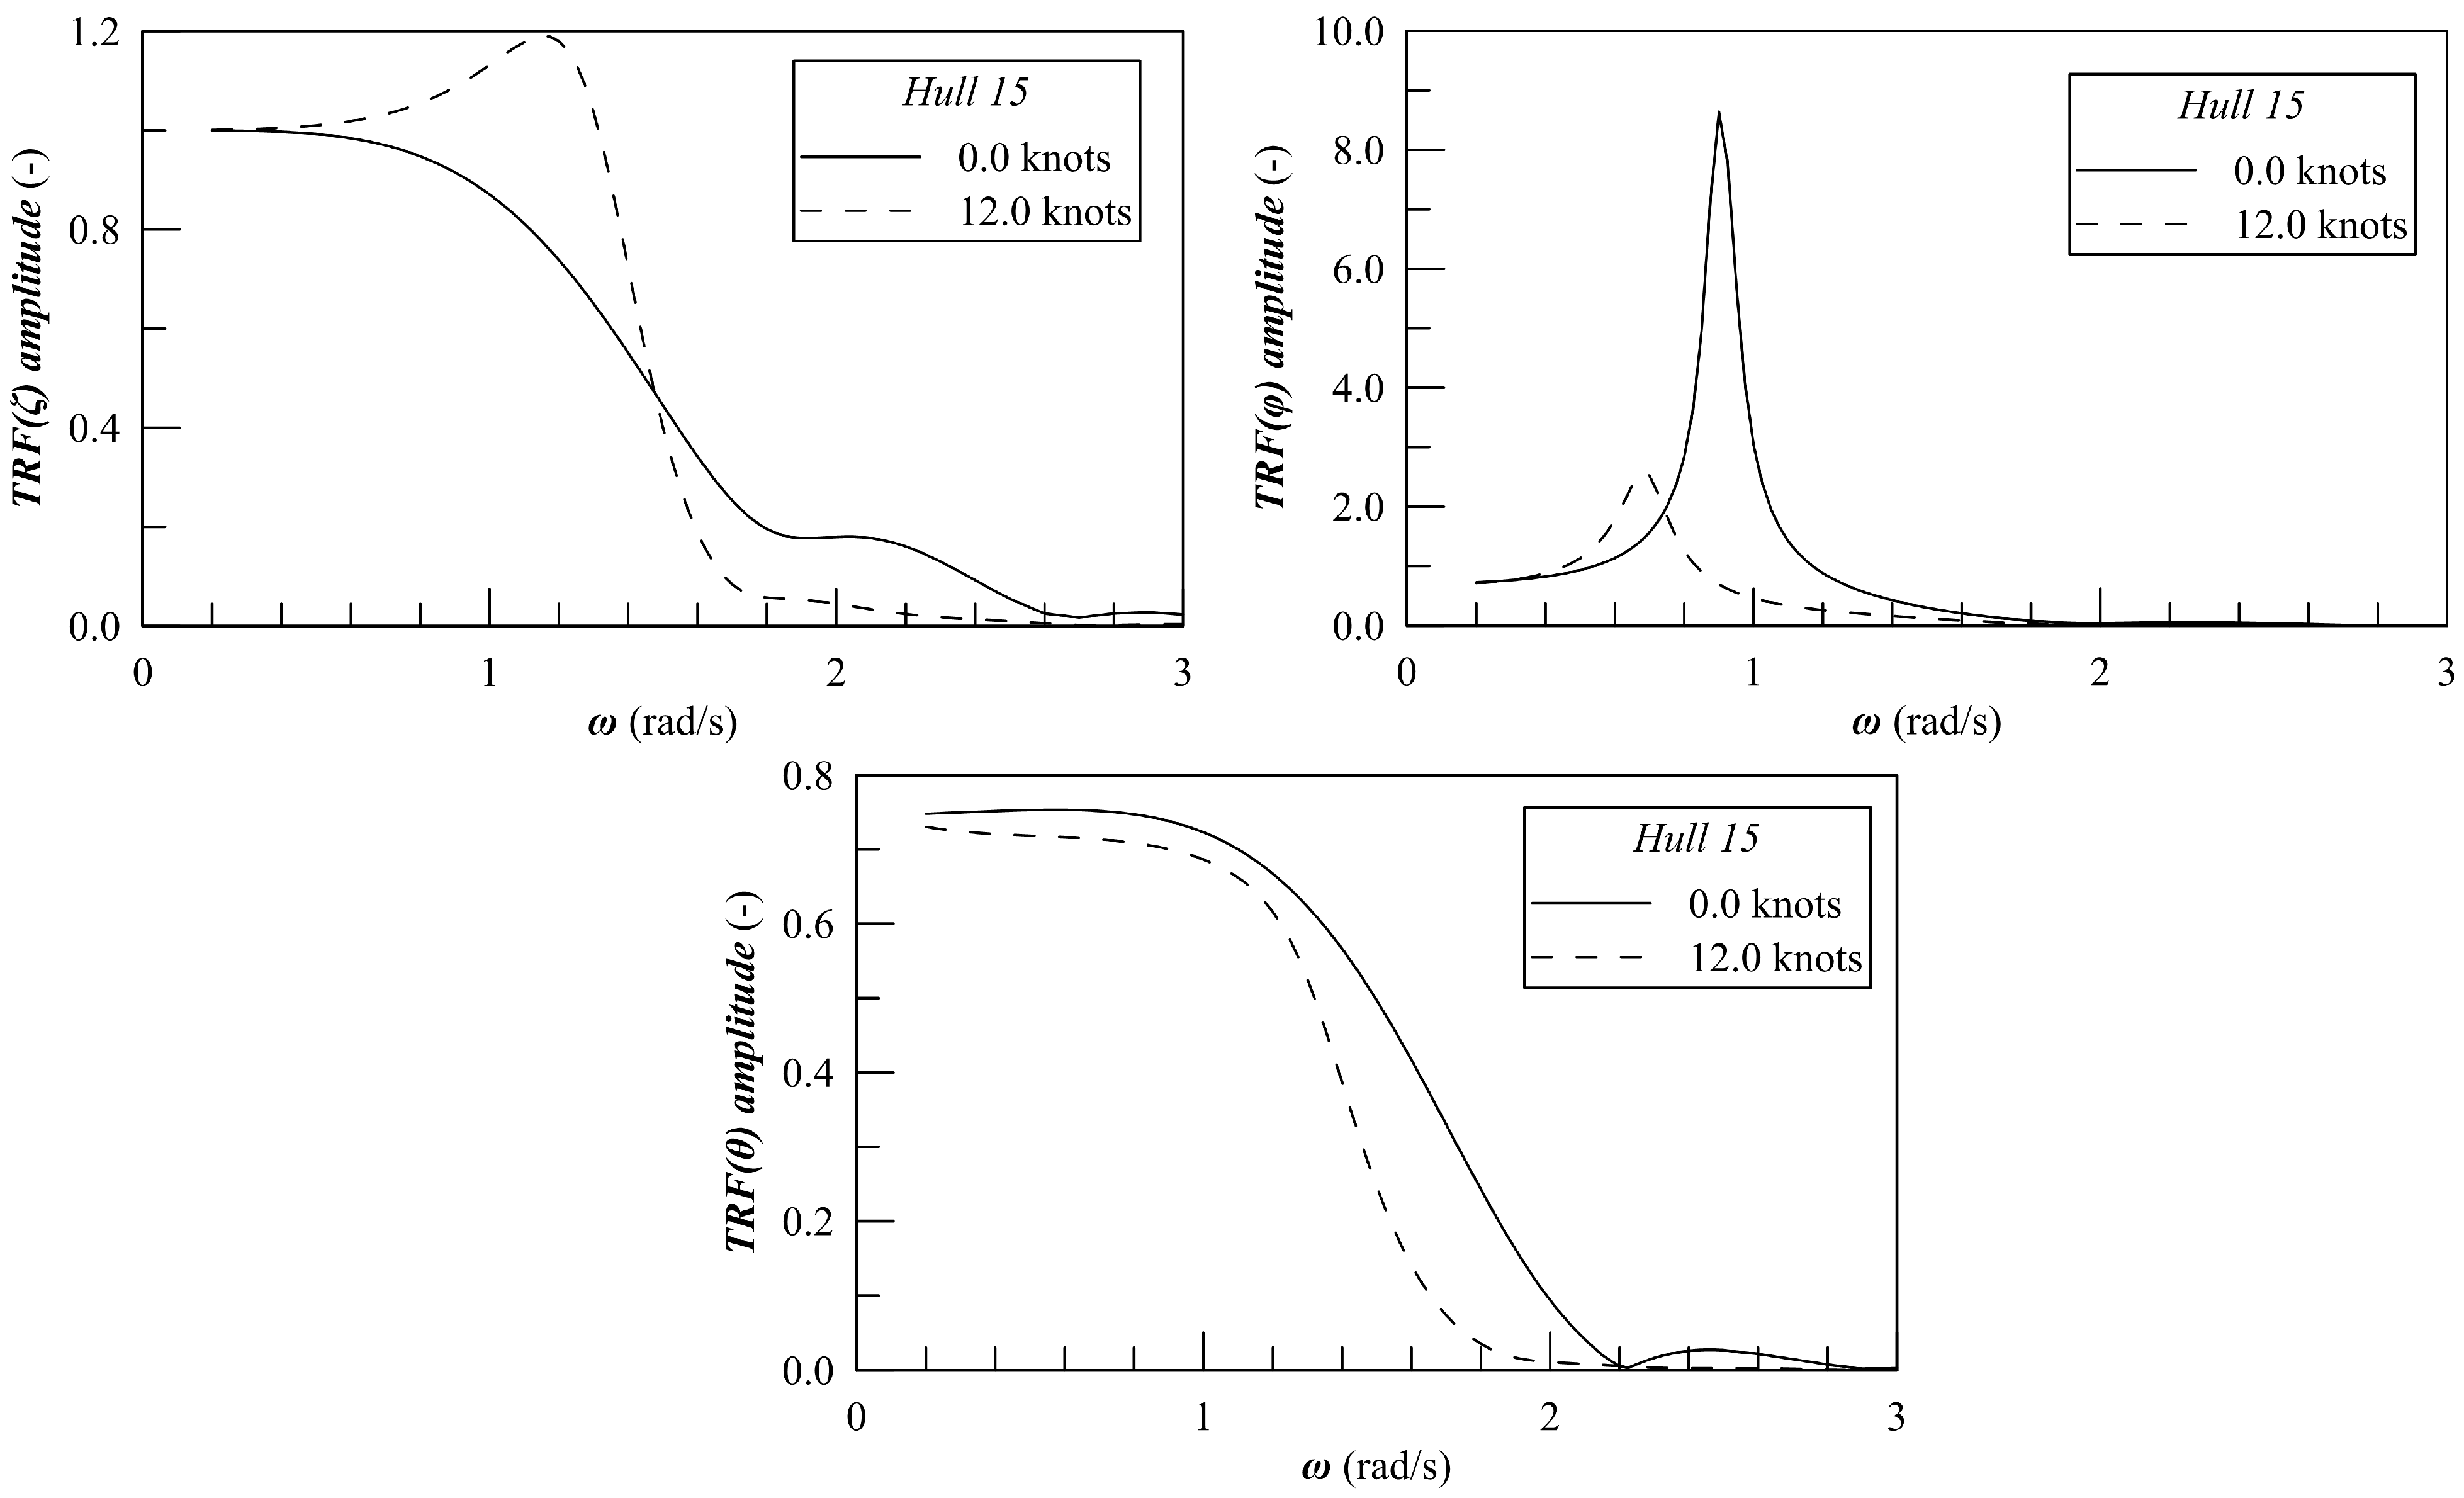
To evaluate the Effective Gravity Angle and Motion Sickness Incidence for each location and speed, it is necessary to determine the Response Amplitude Operators (RAOs) or the transfer functions (TRFs) for ship motions at five locations, with a heading of 135 degrees and speeds of 0 and 12 knots. ShipX software, based on the strip theory developed by Salvesen et al. [
38], has been utilized for this purpose. The code has been validated through several studies [
39,
40,
41]; therefore, the confidence on the obtained results is quite high, even though a validation of the results is here not possible due to the lack of experimental data on these hulls. As an example, the transfer functions for heave
, roll
and pitch
for Hull 15 are shown in
Figure 8. The conditions refer to 0 and 12 knots for an encounter angle of 135 degrees, meaning the conditions that should be assessed following ISO guidelines.
The comfort level of each vessel has been assessed using a scale from 0 to 100, reflecting the percentage system expressed in the ISO guidelines. The final comfort level is calculated using a weighted sum as follows:
In this context, , , and represent the weights assigned to speed, locations, and wave periods, respectively. The functional I reflects the satisfaction of the criteria set by ISO 22834:2022. It is equal to 1 when both the Effective Gravity Angle and the Motion Sickness Incidence are below the specified thresholds—2 degrees for EGA and 10% for MSI over one hour of exposure. I is equal to 0 if either criterion is not met.
To obtain a more detailed understanding of the EGA and MSI trends across different locations, assessments can also be conducted at a local level, considering each location individually and for each sea state. This approach simplifies Equation (
4) to a summation of weights for the relevant wave periods. Alternatively, comfort can be evaluated globally for each speed by summing the weights for various locations and wave periods.
In this study, a global evaluation of comfort using Equation (
4) has been utilized for the calculations.
3.3. Maneuvering Performance
To predict the dynamic variation in a ship’s motion, specific maneuvering simulations have been conducted using the software ANYSIM XMF. This software calculates a ship’s motion in response to non-linear hydrodynamic and mechanical loading. For modeling hydrodynamics, ship-specific results are derived from model tests, semi-empirical methods (such as slender body and cross-flow drag theory), and linear frequency domain tools. Additionally, components such as rudders, propellers, and thrusters are modeled in the time domain. The equations of motion are integrated using a fourth-order Runge–Kutta method, with a fixed time step of 0.1 s, which is adequate for achieving a converged solution in the case of a low frequency phenomenon such as maneuvering. The software accommodates the use of both propellers and rudders or pods for the vessel’s maneuvering.
The simulations require defining a linearized stiffness matrix, which is composed of terms derived from the hydrostatics of each of the 15 hull forms. Furthermore, a resistance curve or, in general, a resistance value for the target speed of interest must be defined. In this study, the target speed for the simulation is set at 12 knots, and the resistance value used comes directly from the ReFRESCO simulations described in earlier sections. Hydrodynamic forces, including damping and added mass, are then calculated according to the sectional approach employed in the slender body and cross-flow drag theories [
42,
43].
The propeller model is based on the B-series, using the same wake fraction (w = 0.05) and thrust deduction (t = 0.15) for all hulls. This provides a reasonable approximation for determining general guidelines during the preliminary design phase.
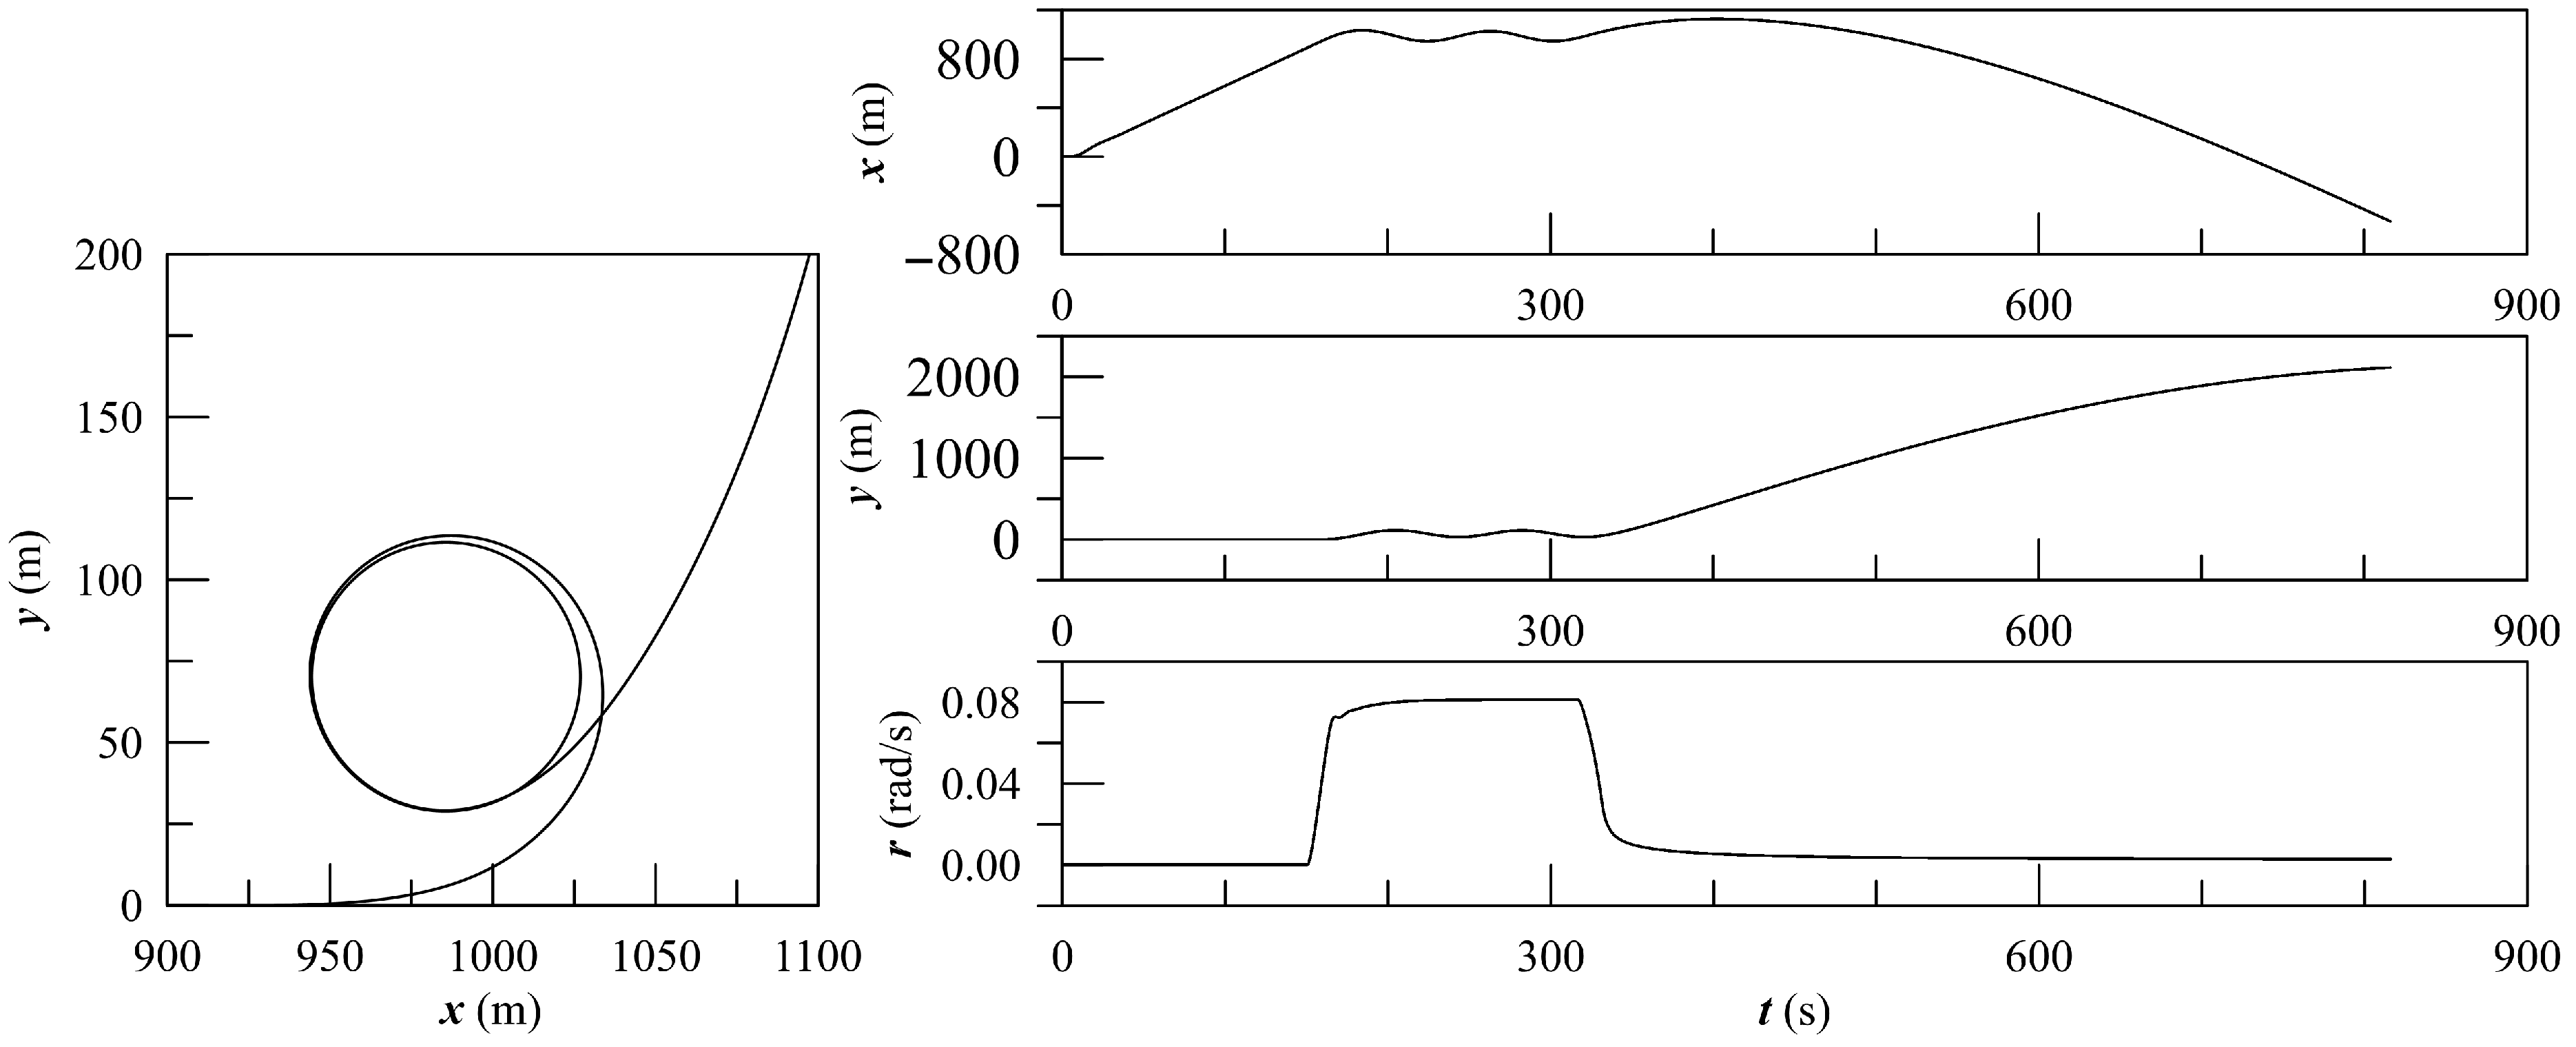
The simulations performed include speed runs, zig-zag maneuvers (including both 10-10 and 20-20 steering–yaw checking angles), and turning circles. The simulation process is carried out in two stages, with a tuning process applied to the yaw moment calculated using slender body theory. This tuning process applies empirical coefficients derived from the correlation between simulations, model tests, and sea trials available at MARIN. As an example, the turning circle simulation for Hull 15 is reported in
Figure 9 representing the trajectory and the time traces of
x,
y positions and the turning speed
r.
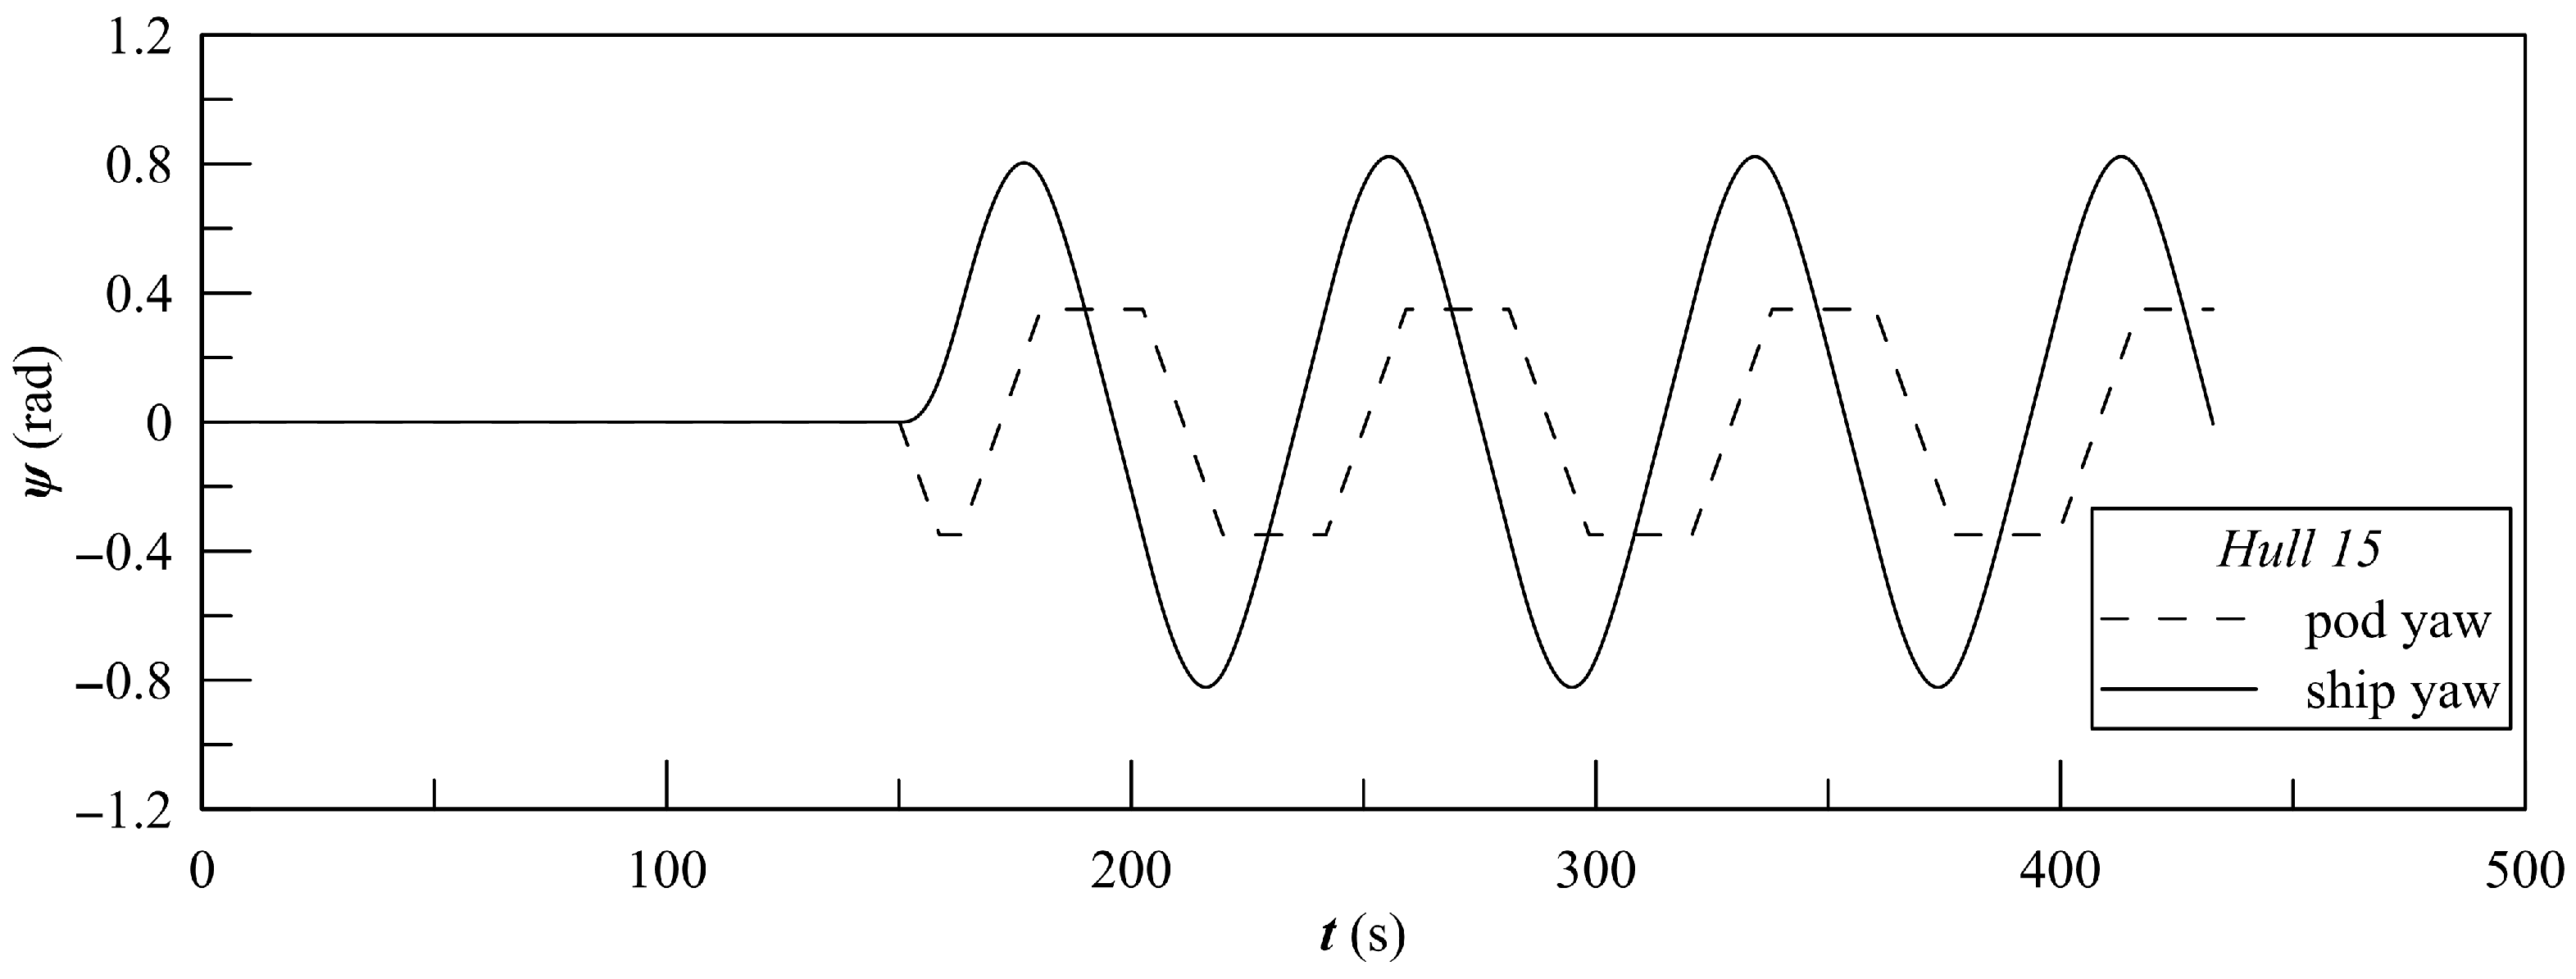
Figure 10 shows the results of the 20-20 zig-zag simulation, showing the time traces of the ship and pod yaw angle.
From the maneuvering simulations, several parameters can serve as key attributes for ship design purposes. Significant emphasis should be placed on the initial turning ability and the yaw-checking ability. The initial turning ability, also known as course-changing ability, describes how responsive the ship is to initiate a turn with a moderate helm. The yaw-checking ability measures the ship’s response to counter-steering, characterized by the delay in response when reversing the helm angle of a turning ship. The most relevant maneuvering characteristics related to these abilities include the overshoot angles and the initial turning distance. The overshoot angle refers to the heading deviation occurring from the moment the steering device is reversed until the heading rate of turn reaches zero. The initial turning distance is defined as the distance traveled in the direction of the original course from the moment the first steering order (e.g., 20°) is given until the ship’s heading has changed by 20° from its original course.
The results of the maneuvering study are a result of simulations performed on a validated code [
44,
45,
46]; therefore, the confidence on the obtained results is high. Furthermore, the simulations performed according to the MARIN standards are fully compliant with IMO standards for maneuvering.
3.4. Hydrodynamic Attributes for the Analysis
The simulations conducted to determine the hydrodynamic characteristics of the hulls yield multiple outputs. However, to establish design guidelines for a motor yacht during the preliminary design stage, we have decided to focus on a limited number of attributes. This approach allows us to provide a clearer overview of the global attributes essential for the preliminary design phase, rather than delving into intricate details when many final project specifications are still undefined. Nevertheless, the procedure outlined in the following section can be applied to all potential attributes derived from hydrodynamic analyses.
The selected attributes for the multiple linear regression analysis are as follows:
Resistance at 12 knots (kN);
Trim at 12 knots (degrees);
Global index for comfort (non-dimensional);
Initial turning ability (assessed through a 20-20 zig-zag maneuver) (non-dimensional);
Yaw-checking ability (assessed through a 20-20 zig-zag maneuver) (non-dimensional).
This set of preliminary attributes provides a comprehensive understanding of the operational profile of a motor yacht, addressing concerns related to resistance, comfort, and maneuverability. Consequently, the regression analysis has been performed using datasets that describe these attributes, employing a process that will be elaborated on in the following section.
It should be noticed that the attributes selected for the development of surrogate models are coming from validated software in the three abovementioned fields of hydrodynamics. Therefore, even though an effective validation on this dataset is not possible because of the lack of experimental results, the confidence in the results remains high, providing data with a reliability level which is much higher that what is normally requested for a feasibility study.
4. Multiple Linear Regression Analysis
In the field of engineering, the design of experiments (DoE) is commonly used to analyze the response of a particular variable in relation to others, thereby reducing the number of observations needed to understand variations. This approach leads to a lower effort required for experimentation and calculations. Concurrently, response surface methodology (RSM) quantifies the relationship between controllable input parameters and the response variables obtained. To achieve this, the following steps should be followed:
Design a set of experiments to ensure accurate and reliable measurement of the response being analyzed.
Develop a mathematical model of the response surface using a best-fitting technique.
Represent the direct and interactive effects of the processed parameters through multidimensional plots.
The first step has already been addressed by defining the design space for the motor yachts, specifically by choosing a Central Composite Design for the 15 hulls developed in this study. Therefore, it is essential to further refine the mathematical models used to identify the response surface for the selected parameters related to the hydrodynamic properties of the yachts.
A response surface of a generally measurable variable can be identified using the following equation:
In this context, let
y represent the output of the process, while
denotes the
n independent variables involved in the problem being addressed. Assuming that these independent variables are continuous and aligned with experimental conditions that involve negligible errors, it is essential to identify an appropriate approximation for the relationship between the independent variables and the output. By adopting a CCD, we can utilize a complete second-order model to describe the surface response, following the general regression model outlined below:
In this equation,
represents the unknown parameters, while
denotes the regression error. The literature provides several methods for evaluating these unknown parameters. However, in the case of relatively simple models, it is often convenient to use the least squares method. Therefore, Equation (
6) can be expressed in the following matrix form:
Let
represent the matrix of measured values, while
denotes the matrix of independent variables. The independent variables matrix includes not just the variables themselves but also their combinations up to the second order. The matrices
and
correspond to the regression coefficients and the errors, respectively. By adopting this matrix formulation, we can determine the coefficients matrix using the least squares method, leading to the following expression:
where
is the transpose matrix of
and
is the inverse matrix of
.
To perform multiple linear regression analysis on the selected dataset of hydrodynamic parameters, a stepwise selection process was utilized [
47]. In the initial step, all variables are included in a complete second-order model. Subsequently, at each step, one variable is removed from the equation, changing its status from included to excluded, and vice versa. For each variable whose status changes, the change in the sum of squared errors (SSE) is evaluated to determine whether the variable should be removed or added to the final model. This process continues automatically until no variable affects the SSE beyond a specified threshold.
To ensure consistency, all dependent and independent variables are normalized to a range of
before starting the regression procedure. The threshold for variable inclusion or exclusion is set at 0.06. This value results from previous studies on MLR analysis already published by the authors [
48,
49,
50]. To assess the quality of the regression, a key performance indicator is selected: the coefficient of determination (
) and the adjusted coefficient of determination (
). These coefficients are defined as follows:
where
n is the number of points to fit,
p is the number of variables included in the model (after executing the stepwise procedure) and
In this context, let represent the data point to be fitted, denotes the mean value of the data points, and signify the fitted values obtained from applying regression analysis.
The following section presents both graphical and tabular representations of the regression conducted on the hydrodynamic attributes, in accordance with the methodology described above.
Response Surfaces
The procedure for determining multiple linear regression and the associated surface responses, as described in the previous section, has been applied to the data processing of the main attributes defined earlier.
Table 5 and
Table 6 present the results of the regression analysis, which includes the coefficients and the quality of the regression assessed through performance indicators detailed in Equations (
9) and (
10). The results indicate a high overall quality of the regression, with all
values above 0.9. The unbiased estimator of
, known as
, is also high, except for the dynamic trim regression. Notably, none of the final regression models include all the estimators typical of a full quadratic model. This is a result of the stepwise iterative procedure used to develop the regression models, which automatically excludes non-significant terms. For the specific case of the dynamic trim, the lower value of the
estimator may indicate that, except for
L, the dependency on high-order terms in
B and
T is necessary. However, to accomplish this, a wider database is needed in order to increase the polynomial order. The fact that
remains high has to be searched in the number of regressors. Except for the length
L, the regression process tries to consider all the cross-terms between the variables to increase
, resulting in a form of overfitting.
A detailed analysis of the individual regressions reveals that for the resistance, the dependency on vessel length is purely linear, with no significant higher-order or coupled terms present. Such a phenomenon can be associated with the quadratic behaviour of the vessel resistance with the Froude number. Being this relation quadratic because of the speed, the relation with length is linear. Higher-order dependencies are observed only for the breadth and draught. These relationships are less evident to relate with the phenomenon of resistance as the B and T are strongly influencing both the wave component and the viscous one. In any case this implicates that small variations in these variables may strongly affect the final resistance. For the dynamic trim, coupled terms become significant when considering length, but higher-order terms are still absent. When examining hydrodynamic quantities related to comfort, the regression for ISO comfort incorporates all coupled terms but lacks higher-order terms for both length and breadth. In this case the linear dependence can be associated at the low values of significant wave height considered by the ISO framework, a matter that validates and justify the employment of linear strip theory. A similar situation occurs for the initial turning ability. However, for yawing ability, the coupled term between breadth and draught is absent, as are all higher-order terms. These considerations have to be searched in the manoeuvring modelling of the software employed for the calculations. The fact that all the relations are linear, means that probably also in this case the derivatives employed for the calculations have linear descriptions too.
This trend in significant coefficients lacks a direct explanation regarding the resulting hydrodynamic properties, as the selection of coefficients is solely tied to the automatic selection procedure mentioned previously. It is possible that using a different dataset as input could lead to different coefficients and conclusions. Although multiple linear regression analysis is generally considered a white-box model, understanding the direct effects of the main dimensions on hydrodynamic properties remains complex.
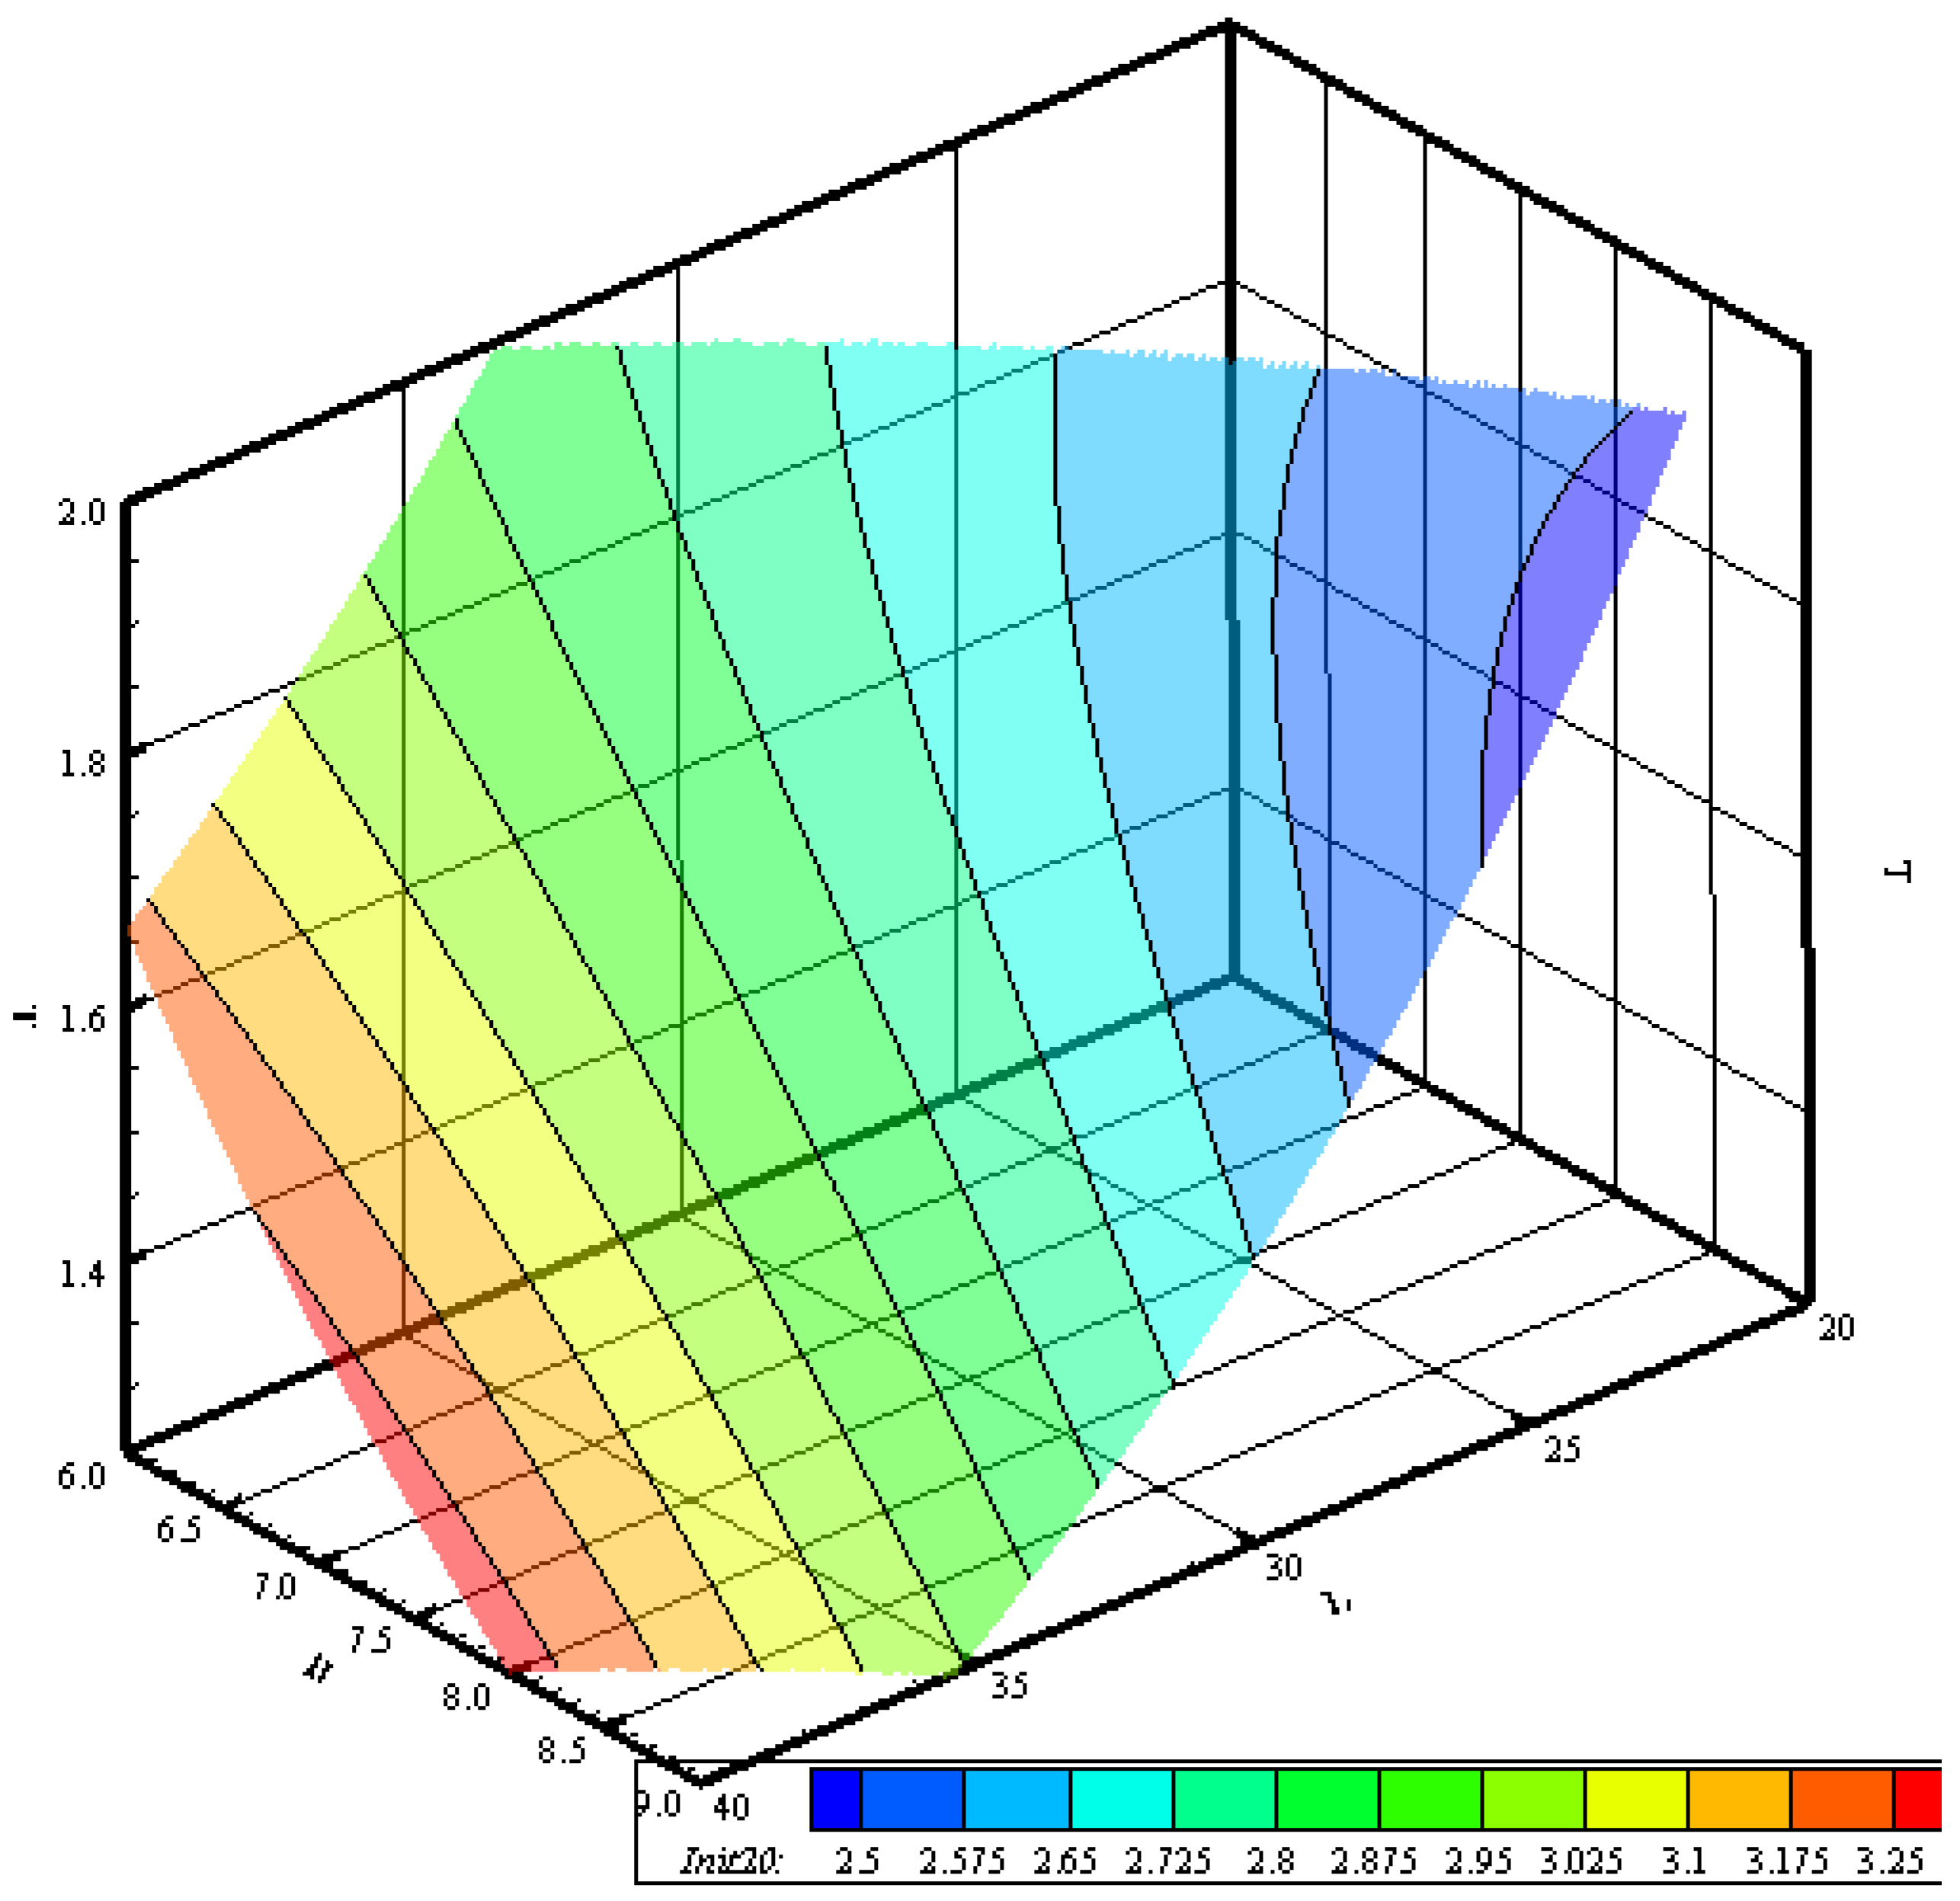
On the other hand, using instruments like regressions allows for visualizing the behavior of dependent variables (i.e., the attributes) as a function of independent variables (i.e., the ship’s main dimensions). This enables the creation of specific diagrams to observe how the attributes vary for a given set of hull forms. The design space considers hull form variations that maintain constant coefficients. Consequently, all hulls with the same volume can be represented as a single surface in a diagram with length (L), breadth (B), and draught (T) as the primary axes. Within this surface, contour plots can illustrate the value of a single attribute, highlighting areas where the main dimensions provide favorable results for the reference attribute.
In this analysis, graphs have been created for the five main hydrodynamic attributes, using a project constraint that specifies a reference volume of 225 m
3. This volume selection is arbitrary and serves as a means for effectively visualizing variations in hydrodynamic properties relative to the vessel’s main dimensions. The response surfaces are presented in
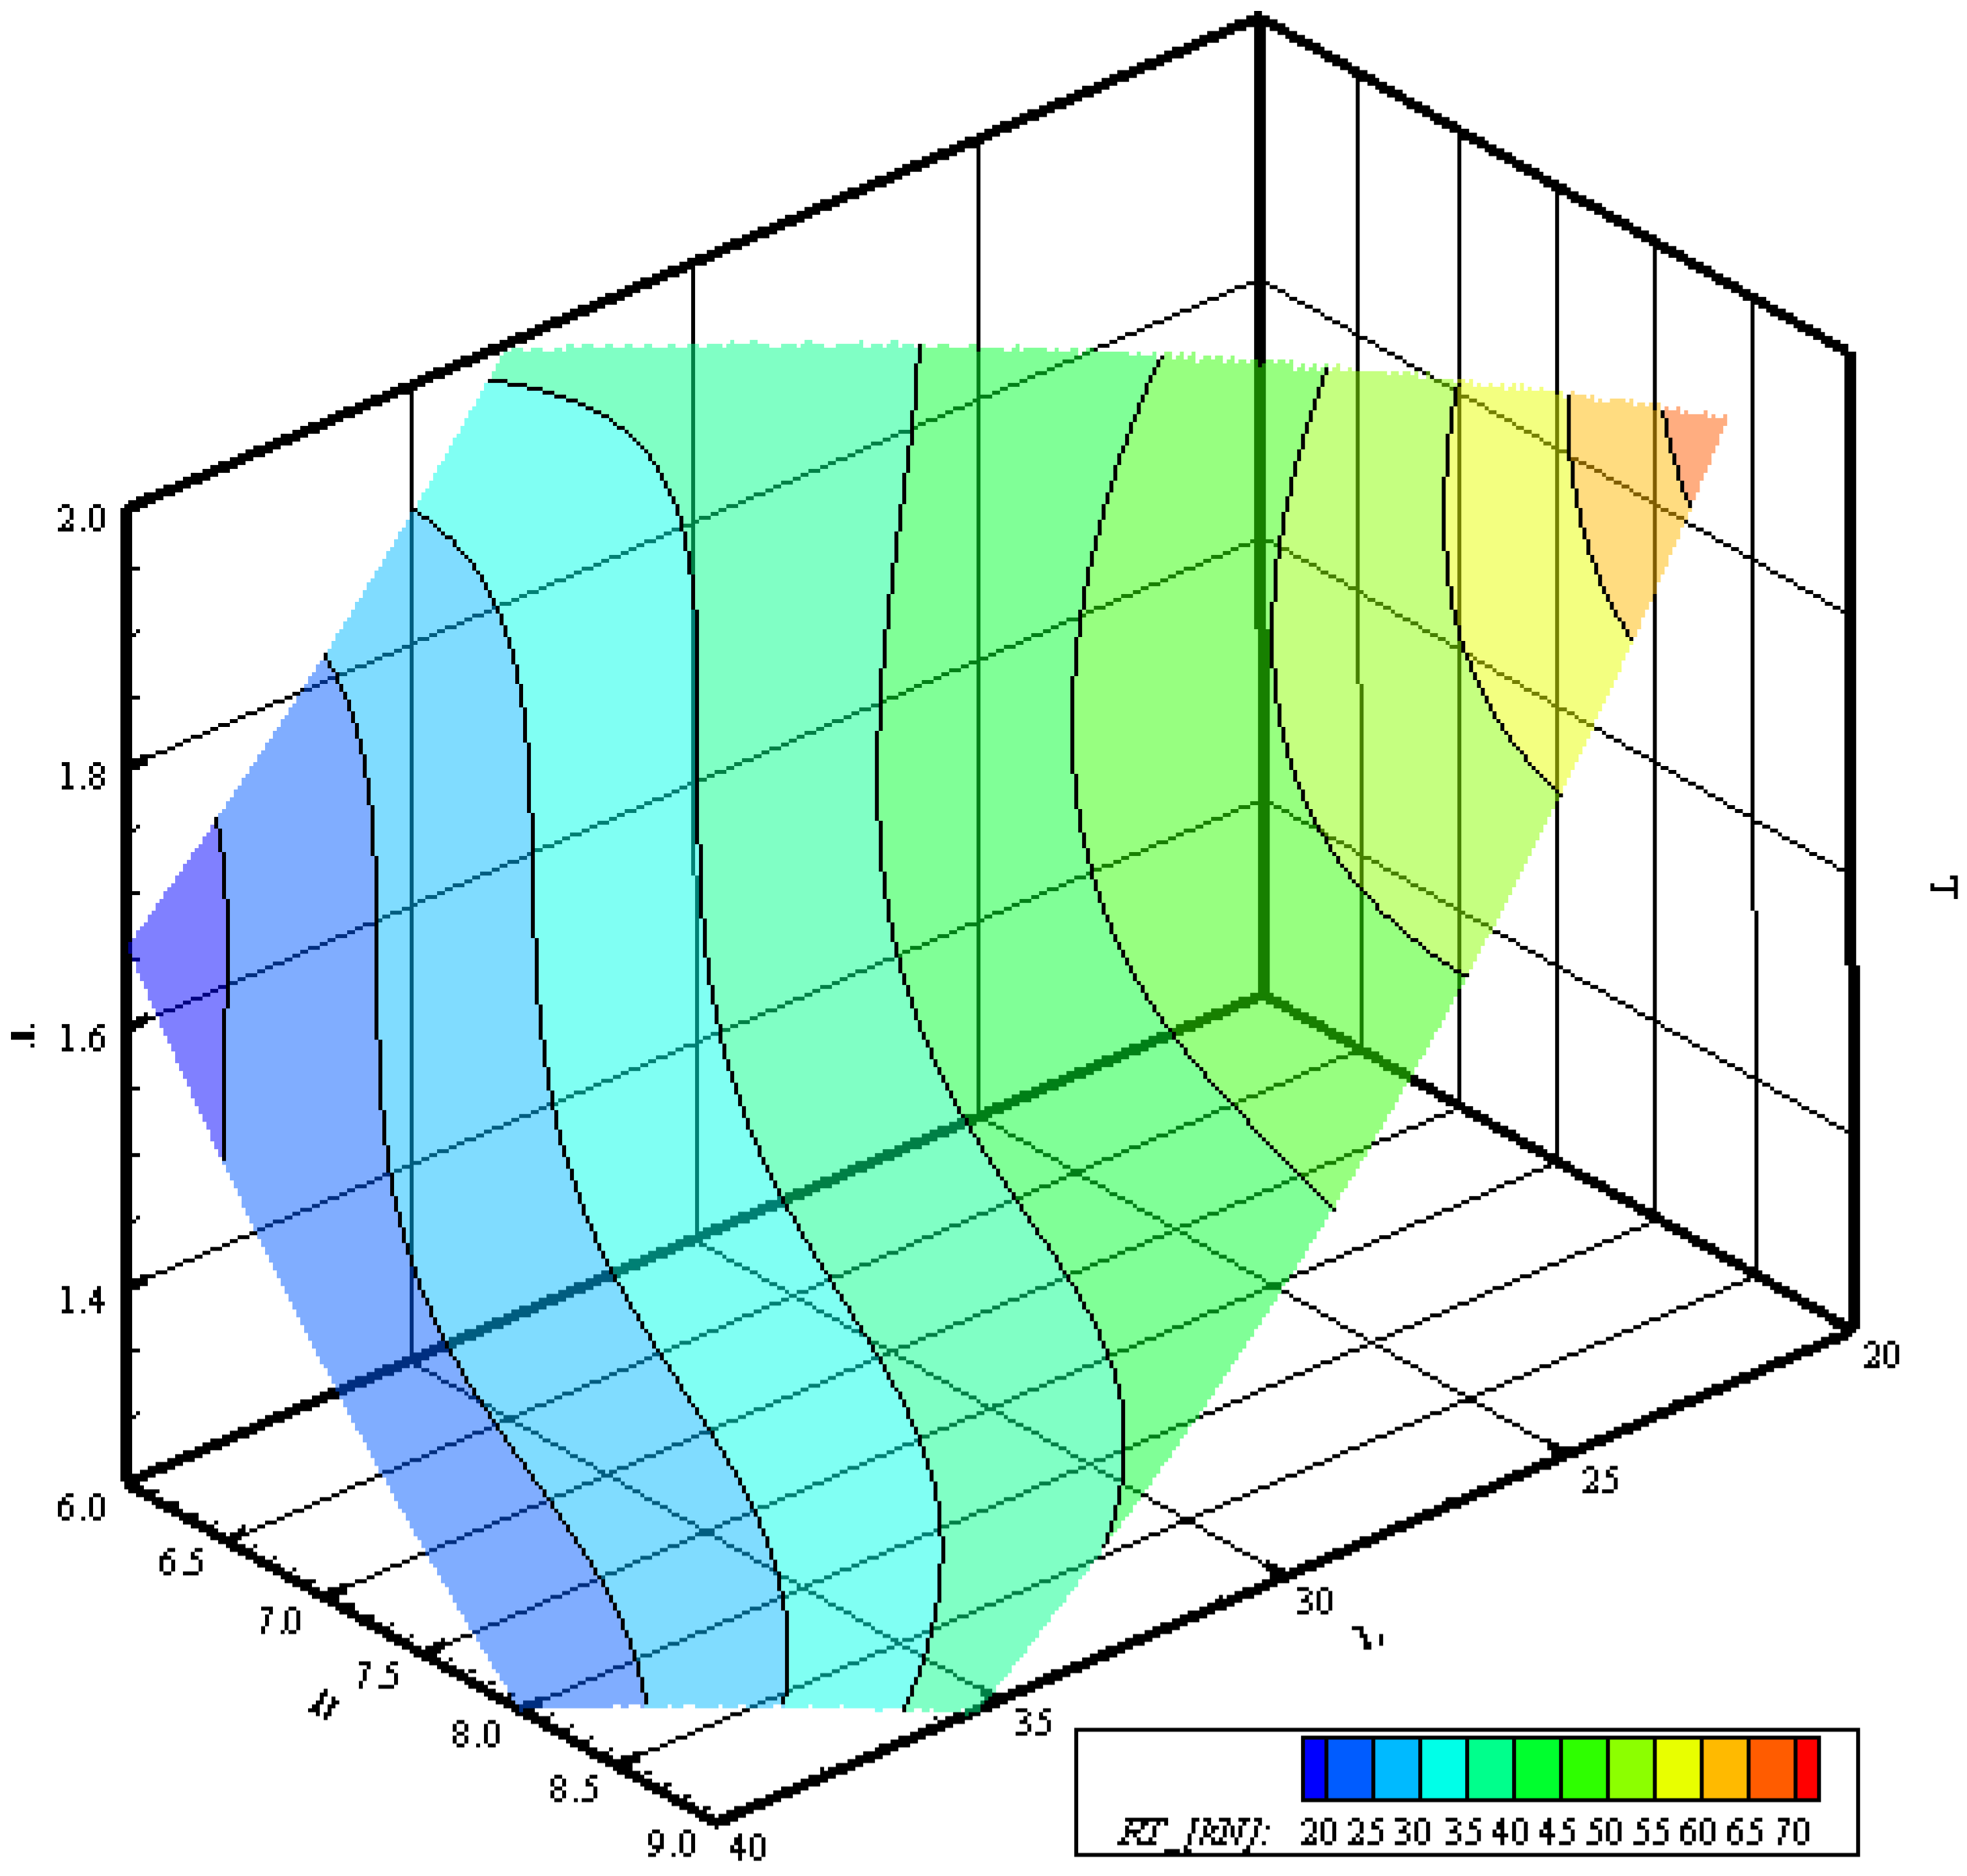
Figure 11,
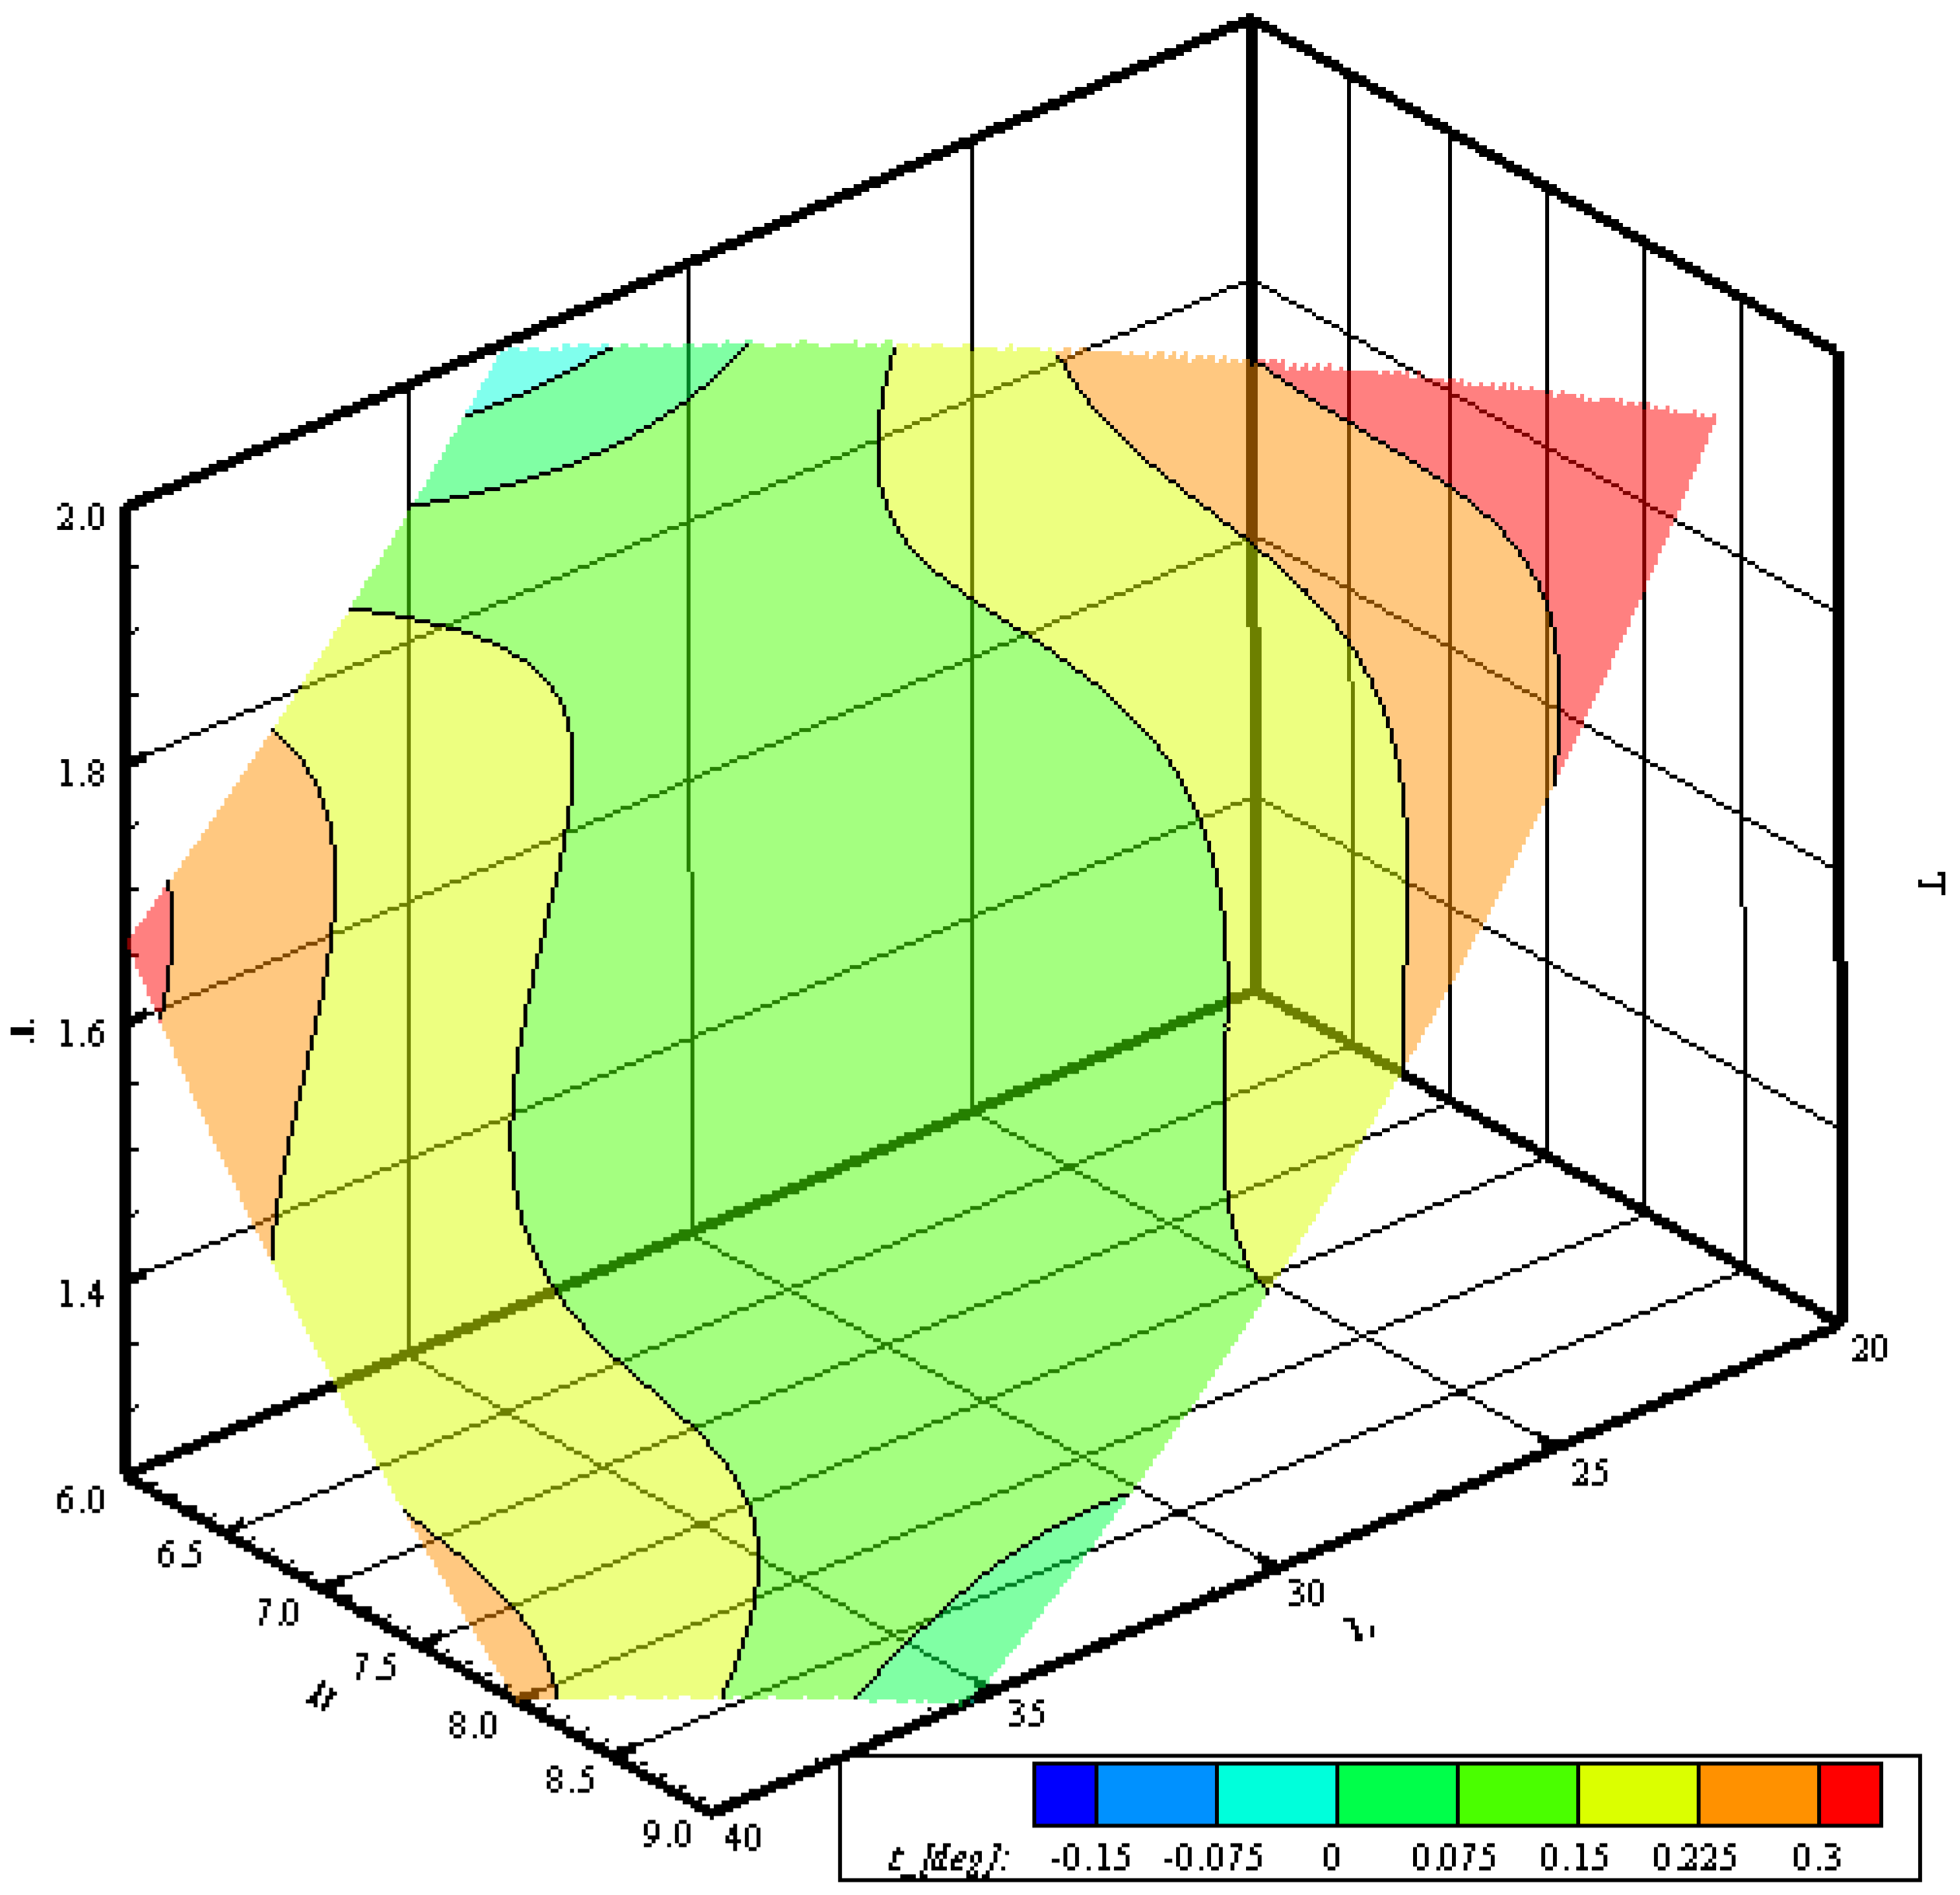
Figure 12,
Figure 13,
Figure 14 and
Figure 15.
Figure 11 displays the response surface for resistance, pinpointing the most favorable area for hulls with main dimensions of approximately 40 m in length, 6.0 m in breadth, and draughts ranging between 1.6 and 1.8 m. This combination is expected, as a slender ship typically experiences lower resistance. The surface clearly highlights the non-linear behaviour observed with the MLR already discussed. As a result, the contour lines are not straight but follow a non-linear path which is not purely quadratic. In any case, the distinction between the maximum and minimum of the surface is clear, as the values monotonically increase from the
B-
T edge to the
L-
T one.
Figure 12 illustrates the behavior of dynamic trim. Unlike resistance, the data here shows multiple minima and maxima. For trim, the optimal value for designers is achieving a neutral trim; therefore, the preferred combinations correspond to saddle points in the central part of the surface. Concerning the general behavior of the surface, the contour highlights a totally different trend compared to the resistance case. Here we have a saddle of the trim level in the middle of the surface, with two areas of minimum and two of maximum in opposite corners. This behavior has to be searched in the high number of cross-terms present in the regression model, which complicate the structure of the solution.
Figure 13 presents the response surface for the
comfort index. In this case, a maximum is clearly identifiable for combinations of
L,
B, and
T around 30–35 m, 8.5–9.0 m, and 1.2–1.5 m, respectively. This area differs from that of the resistance minimum, confirming that hydrodynamic attributes can often be contradictory. The general behavior of the response surface highlights the small non-linearity of the regression model. The contour lines are less non-linear than the previous cases. Specifically, the trend of the curves is again monotone, clearly identifying the minimum and maximum areas.
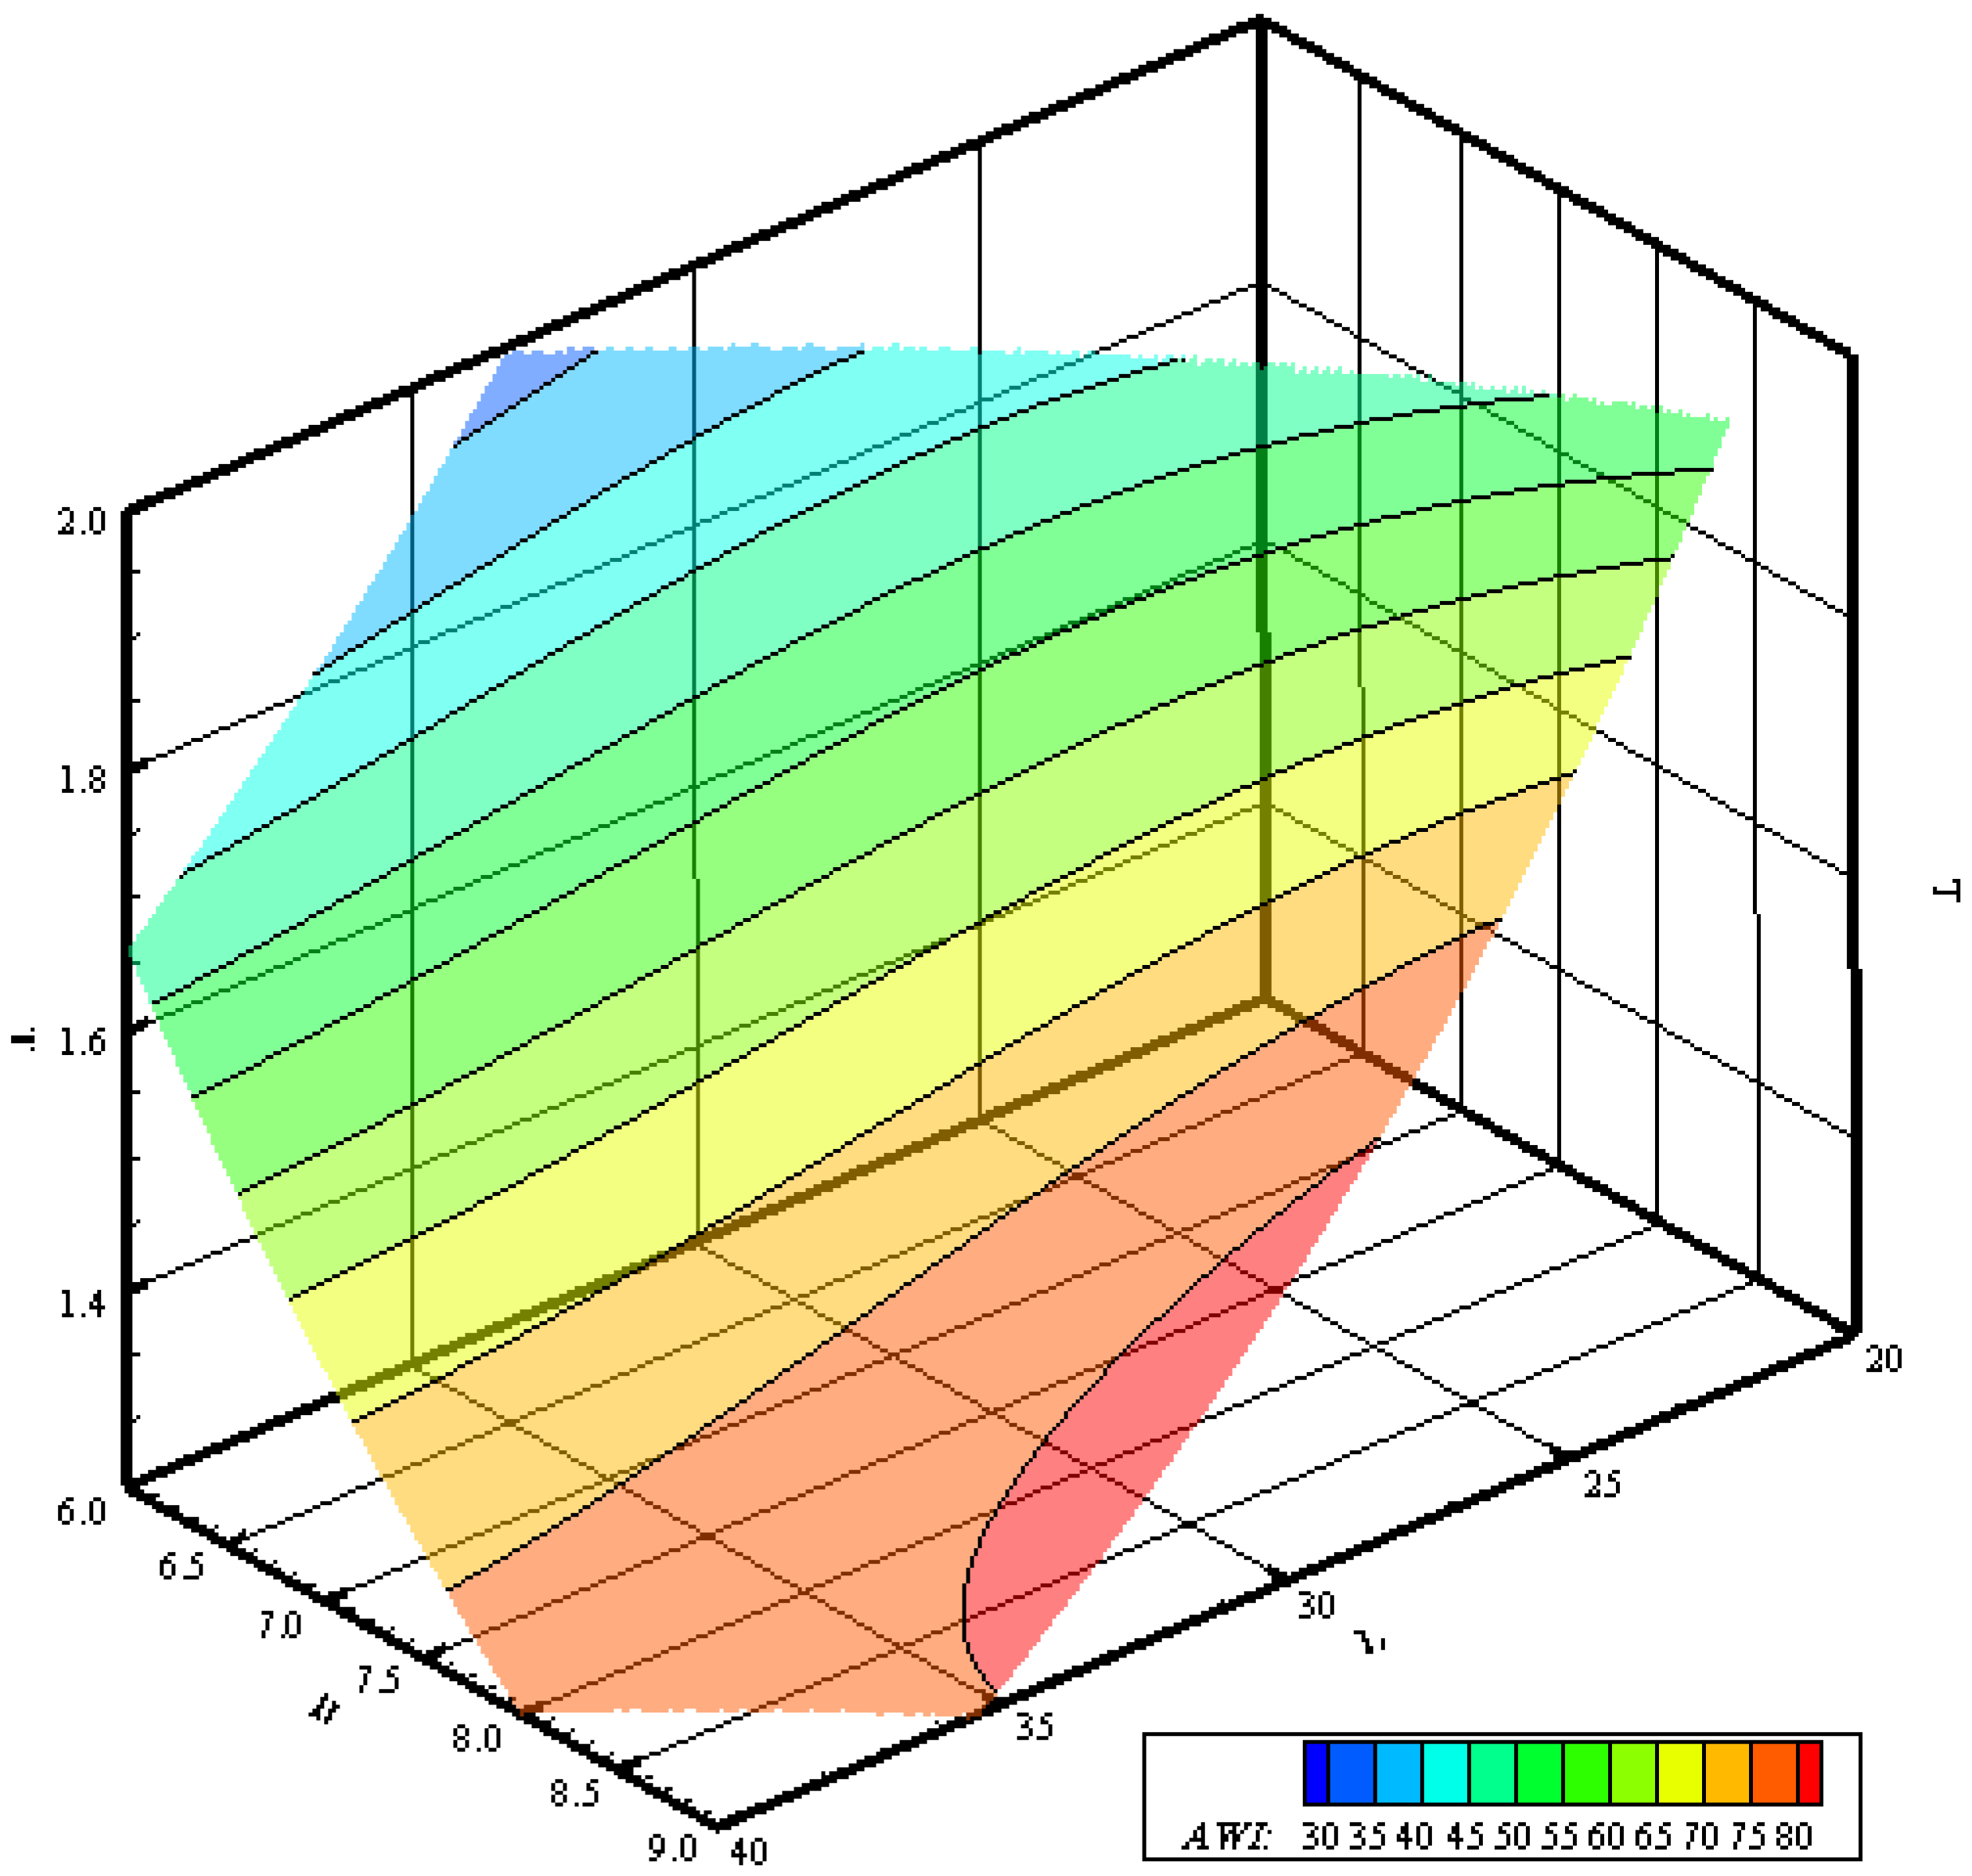
Figure 14 highlights variations in initial turning ability. Here, a maximum is evident for long and slender ships, while a minimum is observed for shorter, slender vessels. The response surface show small non-linearities in the contour lines, reflecting the nature of the obtained regression. Also, in this case the level lines increase monotonically, clearly identifying minima and maxima of the dependent variable in the space. This behavior contrasts with the yaw-checking ability shown in
Figure 15. The response surface is really different from the one of the initial turning ability, resulting in one more similar to the one observed for the resistance at 12 knots. The contour lines highlight more non-linearities than for the previous case but still are increasing monotonically from minimum to maximum. In this case, the minimum value is identified in two corners (
L-
T and
L-
B), while the maximum is only in the
L-
T corner of the surface. It is noteworthy that the two maneuvering-related attributes exhibit opposite behavior, with no overlap between the optimal regions for resistance or comfort. This antithetical relationship also applies to turning ability as determined from turning circle tests versus yaw-checking ability from zig-zag maneuvers.
From this qualitative analysis, it is clear that designers can make informed decisions simply by interpreting the graphs and associated surfaces. However, employing more advanced mathematical techniques can provide additional quantitative support for designers. The resulting surfaces can be utilized to inform a Multi-Attribute Decision Method (MADM), aiding in the search for the best compromise solution among the given attributes and providing weightings according to the designer’s preferences. The following section describes and applies this technique to a reference yacht size.
5. Application for a Feasibility Study
The concept design of a new vessel involves the integration of various knowledge areas in Naval Architecture and Marine Engineering, including powering determination and the estimation of structural loads on a ship. Consequently, designers must navigate a multi-criteria environment to identify an optimal design solution. Given the complexity of this task, it is crucial to apply a proper methodology during the early stages of design. In this context, the MADM can serve as a valuable tool for decision-makers facing complex and multifaceted choices [
51,
52]. By systematically considering multiple criteria and utilizing rigorous analytical techniques, the MADM enhances the decision-making process, leading to more informed and effective choices in the challenging environment of vessel design.
Various methodologies can be employed to select weighting attributes, develop decision matrices, and evaluate the best solutions. The Technique for Order of Preference by Similarity to Ideal Solution (TOPSIS) is one such methodology that can be effectively applied in the early design of ships. It is recognized for its simplicity and effectiveness in addressing such problems [
53].
TOPSIS is based on the idea that the best alternative is the one closest to the positive ideal solution and farthest from the negative ideal solution, where the maximum positive represents the highest quality for all criteria, and the negative signifies the lowest quality. By calculating the proximity of alternatives to these ideal solutions, TOPSIS assigns a score to each option, providing a ranking among different solutions. To function effectively, the TOPSIS procedure must follow several steps:
Attribute Definition: Identify the project attributes that are relevant to the design process.
Weight Assignment: Assign relative weights to each attribute based on the designer’s preferences.
Determination of Decision Matrix: Normalize all the attributes and multiply them by the assigned weights.
Determine the Positive and Negative Ideals: Identify the best and worst cases based on the assigned weights.
Rank the Solutions: Use Euclidean distance to assess how closely each solution aligns with the ideal and rank the solutions accordingly.
The process is straightforward and allows for easy determination of the rank among different solutions, with enough flexibility to incorporate the desiderata weights for each attribute in complex scenarios.
The MADM provides valuable insights into complex decision scenarios, but it also faces several challenges. These challenges include data uncertainties, susceptibility in criteria weighting, and difficulties in capturing the dynamic nature of decision environments. Therefore, applying these techniques requires an iterative approach and training before defining and refining the optimal decision model.
The use of first-principle tools to define the main hydrodynamic attributes aims to reduce uncertainties associated with the methods used to create the initial database. Despite the high accuracy of the regression models, the resulting responses are still approximations of the underlying processes; thus, designers should interpret these results with caution. However, automating the calculation process and providing a graphical representation of the output can help streamline decision-making and enhance efficiency.
In this section, the TOPSIS (Technique for Order Preference by Similarity to Ideal Solution) process is applied to the example of motor yachts, using the response surfaces described earlier as inputs to generate multiple design solutions within a specified design space. For demonstration purposes, the design target is a motor yacht with a displacement of 225 m
3. According to the TOPSIS methodology, it is necessary to assign weights to the different attributes to reflect the designers’ preferences. For this initial calculation, the weights have been evenly distributed among the attributes and later adjusted arbitrarily to represent different design strategies.
Table 6 shows the weights utilized and the results for the main dimensions obtained by applying the TOPSIS procedure to a dataset of 10,000 randomly generated projects.
Table 7 clearly illustrates how different weightings can identify various main dimensions for the same target displacement of a yacht. It is important to emphasize that these weights are arbitrary and do not represent any specific design strategies used by yacht designers. Instead, they serve to reflect possible design strategies that prioritize attributes related to resistance, comfort, or maneuverability. Of course, the results of the feasibility study performed with the MADM technique inherits the uncertainties of the developed surrogate models. First of all, the results are highly feasible if the final hull form has the same hull form coefficients of the initial hull. However, this is not a main issue as the variations in coefficients will have a second-order effect on the results compared to the main dimensions. Secondly, the methods and tools employed are still not fully validated on the specific geometries employed in this study. However, also in this case, thanks to the adoption of software already validated on ship geometries makes confident in the solutions. In conclusion, even though it is not directly possible to estimate uncertainties to the solution, it can be stated that the results are in the confidence level of a feasibility study.
While the current method focuses solely on the main dimensions of the yacht, the proposed methodology allows prospective designers to make informed decisions about the main dimensions of a new project by considering attributes related to resistance, comfort, and maneuverability. By incorporating additional hull form variations into the initial dataset, we can enhance the flexibility of the current regression set by including variations in hull form parameters.
In the areas of maneuverability and seakeeping, only the main dimensions are typically analyzed, often overlooking significant variations and considering local modifications to the hull as negligible. However, local adjustments to the hull lines, particularly in the stern, can lead to different maneuvering performance. Future studies, as described in this paper, could provide deeper insights into these aspects.
6. Conclusions
The present study explores the generation of response surfaces for ship design, specifically focusing on a set of motor-yacht hulls. An initial database comprising 15 hulls was created by parametrically altering the main dimensions within a specified range while keeping the hull form coefficients constant. These modifications were carried out using a central composite design approach. For the resulting set of hull forms, Computational Fluid Dynamics resistance calculations, strip-theory seakeeping calculations, and time-domain maneuvering simulations were conducted to assess the hydrodynamic performance of the yachts. The reliability of the proposed calculation is higher than the required level of accuracy of a feasibility study, highlighting the goodness of the embrional model developed in this first study.
Subsequently, multiple linear regression analyses were performed to derive the response surfaces for all hydrodynamic characteristics obtained from first-principles calculations. This process has enabled the resulting responses to be utilized in a Multi-Attribute Decision Making approach, aimed at identifying the optimal combination of main dimensions for a yacht with a predetermined target displacement, factoring in the weighting of various attributes.
The response surfaces generated from the first-principles calculations illustrate the behavior of hydrodynamic attributes in relation to changes in the main dimensions, emphasizing the conflicting nature of certain attributes. The developed graphs, which depict variations in hull form parameters for specific hull displacements, can assist designers in pinpointing the areas where the best solutions for each attribute can be found. Moreover, the creation of these response surfaces facilitates the application of instruments for selecting main parameters through MADM approaches, allowing for the identification of the most suitable dimensions while considering differing weights among the attributes.
It is important to note that the process established in this study serves as a foundation for future developments. Simply modifying the main dimensions is insufficient to fully understand how changes in hull forms affect hydrodynamic performance. The hull form coefficients significantly impact hydrodynamic performance, and in this study, they were kept constant as a preliminary assumption. This is a limitation of the study that will be be integrated with future investigations on increased design space. In any case, the adoption of simple dimension variations reflects the variable at the disposal of designers in a feasibility study, thus allowing the usage of this model for preliminary investigations. Additionally, advancements can be made in the methodologies used to determine hydrodynamic coefficients, particularly by applying CFD for maneuvering assessments and employing 3D diffraction codes for seakeeping. Furthermore, the presented model intentionally considers environmental and design conditions typical of ISO comfort recommendations. However, future developments of the model can also include different and more comprehensive calculation conditions, either for resistance, propulsion, seakeeping, and maneuvering. This, together with the database increase, will allow a more robust model, applicable not only in the feasibility study but also in the concept design phase.
Nonetheless, the methodology developed in this study can be readily applied to larger datasets that may become available through increased hull form modifications. In any case, the findings of this study represent the initial step toward a series of investigations aimed at identifying response surfaces for the hydrodynamic performance of motor yachts. This will ultimately consider all aspects of ship hydrodynamics, including resistance, propulsion, seakeeping, and maneuvering, as well as additional attributes not currently included in the preliminary design of yachts, such as dynamic positioning. The present work demonstrates that this path can be pursued using the tools and methods outlined in the paper, offering promising prospects for future research.
Author Contributions
Conceptualization, F.M.; methodology, F.M.; software, F.M., E.B., G.R., A.d., and R.T.; validation, F.M., E.B., A.d., and R.T.; formal analysis, F.M., E.B., G.R., and B.R.; investigation, F.M., E.B., G.R., B.R., A.d., E.D.V., and R.T.; data curation, F.M.; writing—original draft preparation, F.M.; writing—review and editing, F.M., E.B., G.R., B.R., A.d., E.D.V., and R.T.; visualization, F.M.; supervision, F.M. and E.D.V. All authors have read and agreed to the published version of the manuscript.
Funding
This research at the University of Trieste was supported by FRA-Fondi Ricerca di Ateneo, FRA 2025. The work at MARIN was partially funded by the Ministry of Economic Affairs.
Data Availability Statement
The data presented in this study are available on request from the corresponding author.
Conflicts of Interest
The authors declare no conflicts of interest. The funders had no role in the design of the study; in the collection, analyses, or interpretation of data; in the writing of the manuscript; or in the decision to publish the results.
References
- Ansaloni, G.M.M.; Bionda, A.; Ratti, A. The Evolution of Yacht: From Status-Symbol to Values. In Multidisciplinary Aspects of Design; Zanella, F., Bosoni, G., Stefano, E.D., Iannilli, G.L., Matteucci, G., Messori, R., Trocchianesi, R., Eds.; Springer: Cham, Switzerland, 2024; Volume 37. [Google Scholar]
- Mancuso, A.; Tumino, D. Advanced Techniques for Design and Manufacturing in Marine Engineering. J. Mar. Sci. Eng. 2022, 10, 122. [Google Scholar]
- Mauro, F.; Ghigliossi, E.; Bucci, V.; Marinó, A. Design of Hybrid-Electric Megayachts: The Impact of Operative Profile and Smart Berthing Infrastructures. J. Mar. Sci. Eng. 2021, 9, 186. [Google Scholar]
- Wium, D.; Lataire, E.; Belis, J. Structural integration of glass in yacht superstructures through adhesive bonding—A numerical analysis. Mar. Struct. 2025, 103, 103834. [Google Scholar]
- Zhu, J.; Chen, L.; Miao, R. Optimization of sail-hybrid electric power system for ships considering correlated environmental uncertainties. Appl. Energy 2025, 391, 125862. [Google Scholar]
- Di Bernardo, R.; Di Cecca, B.; Coppola, T.; Spazzafumo, G.; Speranza, D. Preliminary design of a 75 m Mega Yacht with diesel—Electric hybrid propulsion powered with hydrogen FCs. Int. J. Hydrogen Energy 2025, 137, 917–924. [Google Scholar]
- Akman, M. A benchmark study on the energy efficiency and environmental impacts of alternative fuels in gulet-type sailing yachts. Proc. Inst. Mech. Eng. Part J. Eng. Marit. Environ. 2025, 239, 271–283. [Google Scholar]
- Rocca, M.; Di Puccio, F.; Forte, P.; Kanka, S.; Leccese, F. Acoustic Measurements and Simulations on Yachts: An Evaluation of Airborne Sound Insulation. J. Mar. Sci. Eng. 2025, 13, 988. [Google Scholar]
- Papanikolaou, A. Ship Design-Methodologies of Preliminary Design, 1st ed.; Springer: Dordrecht, The Netherlands, 2014. [Google Scholar]
- Papanikolaou, A.; Harries, S.; Hooijmans, P.; Marzi, J.; Nena, R.; Torben, S.; Yrjan, A.; Boden, B. A Holistic approach to ship design: Tools and applications. J. Ship Res. 2022, 66, 25–63. [Google Scholar]
- Taggart, R. Ship Design and Construction; SNAME Publications: New York, NY, USA, 1980. [Google Scholar]
- Nowacki, H.; Brusis, F.; Swift, P.M. Tanker Preliminary Design—An Optimization Problem with Constraints. Trans. SNAME 1970, 78, 357–390. [Google Scholar]
- Evans, J.H. Basic Design Concepts; American Society of Naval Engineers: Alexandria, VA, USA, 1959. [Google Scholar]
- Papanikolaou, A. Holistic Approach to Ship Design. J. Mar. Sci. Eng. 2022, 10, 1717. [Google Scholar]
- Sullivan, B.; Shantanoo, D.; Sole, J.; Rossi, M.; Ramundo, L.; Terzi, S. Maritime 4.0—Opportunities in Digitalization and Advanced Manufacturing for Vessel Development. Procedia Manuf. 2020, 42, 246–253. [Google Scholar]
- Le Néna, R.; Alan Guégan, A.; Rafine, B. Systemic Approach to Ship Design. In A Holistic Approach to Ship Design, Volume 1: Optimisation of Ship Design and Operation for Life Cycle; Papanikolaou, A., Ed.; Springer: Berlin/Heidelberg, Germany, 2019; Chapter 5. [Google Scholar]
- Nowacki, H. Five decades of Computer-Aided Ship Design. J. Comput. Aided Des. 2010, 42, 956–969. [Google Scholar]
- Tonelli, R.; Della Valentina, E.; Quadvlieg, F. Prediction tool for preliminary design assessment of manoeuvring characteristics of a twin screw displacement yacht. In Proceedings of the 18th International Conference on Ships and Shipping Research, Lecco, Italy, 24–26 June 2015. [Google Scholar]
- Ivanova, G.; Gyurov, V. Assessment of energy efficiency of a motor yacht depending on routes and sailing area. IOP Conf. Ser. Mater. Sci. Eng 2022, 1216, 012004. [Google Scholar]
- Begovic, E.; Della Valentina, E.; Mauro, F.; Nabergoj, R.; Rinauro, B. The impact of different bow shapes on large yacht comfort. J. Mar. Sci. Eng. 2023, 11, 495. [Google Scholar]
- Begovic, E.; Bertorello, C.; Cakici, F.; Kahramanoglu, E.; Rinauro, B. Vertical motions prediction in irregular waves using a time domain approach for hard chine displacement hull. J. Mar. Sci. Eng. 2020, 8, 33. [Google Scholar]
- Geertsma, R.D.; Negenborn, R.R.; Visser, K.; Hopman, J.J. Design and control of hybrid power and propulsion systems for smart ships. A review of developments. Appl. Energy 2017, 194, 30–54. [Google Scholar]
- Bucci, V.; Mauro, F.; Vicenzutti, A.; Bosich, D.; Sulligoi, G. Hybrid-electric solutions for the propulsion of a luxury sailing yacht. In Proceedings of the 2nd IEEE International Conference on Industrial Electronics for Sustainable Energy Systems (IESES), Cagliari, Italy, 1–3 September 2020. [Google Scholar]
- Coppola, T.; Micoli, L.; Russo, R. Concept design and feasibility study of propulsion system for yacht: Innovative hybrid propulsion system fuelled by methanol. In Proceedings of the International Symposium on Power Electronics, Electrical Drives, Automation and Motion (SPEEDAM), Sorrento, Italy, 22–24 June 2022; pp. 683–688. [Google Scholar]
- Begovic, E.; Bertorello, C.; De Luca, F.; Rinauro, B. KISS (Keep It Sustainable and Smart): A Research and Development Program for a Zero-Emission Small Crafts. J. Mar. Sci. Eng. 2022, 10, 16. [Google Scholar]
- Mauro, F.; Benci, A.; Ferrari, V.; Della Valentina, E. Dynamic Positioning analysis and comfort assessment for the early design stage of large yachts. Int. Shipbuild. Prog. 2021, 68, 33–60. [Google Scholar]
- Della Valentina, E. AWI-ISO 22834-Conmfort Assessement of Large Yachts; Technical Report; MARIN: Wageningen, The Netherlands, 2021. [Google Scholar]
- Chang, H. A data mining approach to dynamic multiple responses in Taguchi experimental design. Expert Syst. Appl. 2008, 35, 1095–1103. [Google Scholar]
- Myers, R.; Montgomery, D.; Anderson-Cook, C. Response Surface Methodology-Process and Product Optimisation Using Designed Experiments, 3rd ed.; Wiley & Sons: Hoboken, NJ, USA, 2008. [Google Scholar]
- Beaver, R.; Montgomery, D. Design and Analysis of experiments. Biometrics 1977, 33, 273–283. [Google Scholar][Green Version]
- Montgomery, D. Design and Analysis of Experiments, 7th ed.; Wiley & Sons: Hoboken, NJ, USA, 2009. [Google Scholar]
- Clark, D. Consideration of shiphandling in hull design. In Proceedings of the Conference on Shiphandling, Plymouth, UK, 24–25 November 1977. [Google Scholar]
- ReFRESCO. Available online: https://www.marin.nl/en/facilities-and-tools/software/refresco (accessed on 6 June 2025).
- Crepier, P. Ship resistance prediction: Verification and validation exercise on unstructured grids. In Proceedings of the 7th International Conference on Computational Methods in Marine Engineering, MARINE, Nantes, France, 15–17 May 2017; pp. 365–376. [Google Scholar]
- Rocha, A.L.; Eça, L.; Vaz, G. On the numerical convergence properties of the calculation of the flow around the KVLCC2 tanker in unstructured grids. In Proceedings of the 7th International Conference on Computational Methods in Marine Engineering, MARINE, Nantes, France, 15–17 May 2017; pp. 336–352. [Google Scholar]
- Crepier, P.; Rapuc, S.; Dallinga, R. CFD Investigation into the Wave Added Resistance of Two Ships. In Practical Design of Ships and Other Floating Structures; Springer: Singapore, 2019; pp. 95–114. [Google Scholar]
- Larson, L.; Raven, H. Ship Resistance and Flow; Principles of Naval Architecture; Transactions SNAME: Jersey City, NJ, USA, 2010. [Google Scholar]
- Salvesen, N.; Tuck, N.O.; Faltinsen, O. Ship Motions and Sea Loads. Trans. Soc. Nav. Archit. Mar. Eng. 1970, 78, 250–287. [Google Scholar][Green Version]
- Ildstad, J.B.; Kolstad, T.M.; Halse, K.H. Comparison of a simplified vessel response estimation with a state of the art vessel response prediction computer tool. In Proceedings of the International Conference on Offshore Mechanics and Arctic Engineering OMAE, Trondheim, Norway, 25 June–1 July 2017. [Google Scholar]
- Xu, J.; Ren, Z.; Li, Y.; Skjetne, R.; Halse, K.H. Dynamic simulation and control of an active roll reduction system using free-flooding tanks with vacuum pumps. J. Offshore Mech. Artic Eng. 2018, 140, 061302. [Google Scholar][Green Version]
- Swider, A.; Langseth, H.; Pedersen, E. Application of data-driven models in the analysis of marine power systems. Appl. Ocean. Res. 2019, 92, 101934. [Google Scholar][Green Version]
- Toxopeus, S.L. Validation of slender-body method for prediction of linear manoeuvring coefficients using experiments and viscous flow calculations. In Proceedings of the 7th ICHD International Conference of Hydrodynamics, Ischia, Italy, 4–8 September 2006; pp. 589–598. [Google Scholar]
- Hooft, J.P. The cross flow drag on a manoeuvring ship. Ocean. Eng. 1994, 21, 329–342. [Google Scholar][Green Version]
- Ferrari, V.; Quadvlieg, F.H.H.A. Preliminary Considerations on a Unified Model for Hydrodynamic Forces. In Proceedings of the International Conference on Maritime Technology and Engineering (MARTECH), Lisbon, Portugal, 4–6 July 2016. [Google Scholar]
- Moulijn, J.; Tonelli, R.; Shipurkar, U. Propeller load variations for maneuvering ships in waves. In Proceedings of the 8th International Symposium on Marine Propulsors, SMP 2024, Berlin, Germany, 17–20 March 2024. [Google Scholar]
- Ferrari, V.; Tonelli, R.; Kisjes, R.; Hallmann, R. Manoeuvring Experiments, Mathematical Model and Sensitivity Analysis for Test-Case Ferry. In Proceedings of the 2nd International Conference on Maritime Engineering and Technology (MARTECH 2022), Lisbon, Portugal, 24–26 May 2022. [Google Scholar]
- Harrel, F. Regression Modelling Strategies with Application to Linear Models, Logistic Regression and Survival Analyses, 1st ed.; Springer: New York, NY, USA, 2009. [Google Scholar]
- Mauro, F.; Braidotti, L.; Trincas, G. A model for intact and damage stability evaluation of CNG ships during the concept design stage. J. Mar. Sci. Eng. 2019, 7, 450. [Google Scholar][Green Version]
- Rinauro, B.; Begovic, E.; Mauro, F.; Rosano, G. Regression analysis for container ships in the early design stage. Ocean. Eng. 2024, 292, 116499. [Google Scholar][Green Version]
- Mauro, F.; Salem, A. Development of regression models for estimating main particulars of RoPax vessels in the conceptual design stage. Ocean. Eng. 2025, 333, 121407. [Google Scholar][Green Version]
- Trincas, G. Survey of design methods and illustration of multiattributes decision making system for concept ship design. In Proceedings of the MARIND 2001, Varna, Bulgaria, 4–8 June 2001. [Google Scholar]
- Kumar, D.N. Multicriterion Analysis in Engineering and Management; PHI Learning Pvt. Ltd.: Delhi, India, 2010. [Google Scholar]
- Behzadian, M.; Otaghsara, S.K.; Yazdani, M.; Ignatius, J. A state-of-the-art survey of TOPSIS applications. Expert Syst. Appl. 2012, 39, 13051–13069. [Google Scholar][Green Version]
Figure 1.
Transversal sections of the parent hull.
Figure 1.
Transversal sections of the parent hull.
Figure 2.
Transversal sections of the 15 hulls.
Figure 2.
Transversal sections of the 15 hulls.
Figure 3.
Three-dimensional representation of the 15 hulls.
Figure 3.
Three-dimensional representation of the 15 hulls.
Figure 4.
Global overview of the calculation mesh for Hull 15.
Figure 4.
Global overview of the calculation mesh for Hull 15.
Figure 5.
Top overview of the calculation mesh for Hull 15.
Figure 5.
Top overview of the calculation mesh for Hull 15.
Figure 6.
Bow detail of the calculation mesh for Hull 15.
Figure 6.
Bow detail of the calculation mesh for Hull 15.
Figure 7.
Stern detail of the calculation mesh for Hull 15.
Figure 7.
Stern detail of the calculation mesh for Hull 15.
Figure 8.
Baricentric heave, roll, and pitch transfer functions for Hull 15.
Figure 8.
Baricentric heave, roll, and pitch transfer functions for Hull 15.
Figure 9.
Turning circle simulation for Hull 15.
Figure 9.
Turning circle simulation for Hull 15.
Figure 10.
Zig-zag 20-20 simulation for Hull 15.
Figure 10.
Zig-zag 20-20 simulation for Hull 15.
Figure 11.
Response surface for the resistance at 12 knots for a family of hulls having a volume of 225 m3.
Figure 11.
Response surface for the resistance at 12 knots for a family of hulls having a volume of 225 m3.
Figure 12.
Response surface for the dynamic trim at 12 knots for a family of hulls having a volume of 225 m3.
Figure 12.
Response surface for the dynamic trim at 12 knots for a family of hulls having a volume of 225 m3.
Figure 13.
Response surface for the comfort index for a family of hulls having a volume of 225 m3.
Figure 13.
Response surface for the comfort index for a family of hulls having a volume of 225 m3.
Figure 14.
Response surface for the initial turning ability for a family of hulls having a volume of 225 m3.
Figure 14.
Response surface for the initial turning ability for a family of hulls having a volume of 225 m3.
Figure 15.
Response surface for the yaw ability for a family of hulls having a volume of 225 m3.
Figure 15.
Response surface for the yaw ability for a family of hulls having a volume of 225 m3.
Table 1.
Parent hull main particulars.
Table 1.
Parent hull main particulars.
| Quantity | Symbol | Value | Unit |
|---|
| Length between perpendiculars | | 30.00 | m |
| Length on waterline | | 29.99 | m |
| Breadth | B | 7.50 | m |
| Draught | T | 1.625 | m |
| Volume of displacement | ∇ | 205.768 | m3 |
| Block coefficient | | 0.563 | - |
| Midship coefficient | | 0.846 | - |
| Prismatic coefficient | | 0.665 | - |
| Waterline coefficient | | 0.817 | - |
| Vertical prismatic coefficient | | 0.689 | - |
Table 2.
Hull form variations forming the database.
Table 2.
Hull form variations forming the database.
| Hull | (m) | B (m) | T (m) | ∇ (m3) |
|---|
| Hull 1 | 20.0 | 6.0 | 1.250 | 84.418 |
| Hull 2 | 20.0 | 6.0 | 2.000 | 135.068 |
| Hull 3 | 20.0 | 9.0 | 1.250 | 126.626 |
| Hull 4 | 20.0 | 9.0 | 2.000 | 202.602 |
| Hull 5 | 40.0 | 6.0 | 1.250 | 168.835 |
| Hull 6 | 40.0 | 6.0 | 2.000 | 270.137 |
| Hull 7 | 40.0 | 9.0 | 1.250 | 253.253 |
| Hull 8 | 40.0 | 9.0 | 2.000 | 405.205 |
| Hull 9 | 20.0 | 7.5 | 1.625 | 137.179 |
| Hull 10 | 40.0 | 7.5 | 1.625 | 274.357 |
| Hull 11 | 30.0 | 6.0 | 1.625 | 164.614 |
| Hull 12 | 30.0 | 9.0 | 1.625 | 246.922 |
| Hull 13 | 30.0 | 7.5 | 1.250 | 158.283 |
| Hull 14 | 30.0 | 7.5 | 2.000 | 253.253 |
| Hull 15 (parent) | 30.0 | 7.5 | 1.625 | 205.768 |
Table 3.
Grid size for each hull form.
Table 3.
Grid size for each hull form.
| Hull | Grid Size |
|---|
| Hull 1 | 6,785,295 |
| Hull 2 | 8,297,596 |
| Hull 3 | 8,429,088 |
| Hull 4 | 10,739,844 |
| Hull 5 | 6,778,955 |
| Hull 6 | 7,627,746 |
| Hull 7 | 5,986,541 |
| Hull 8 | 7,202,397 |
| Hull 9 | 4,411,076 |
| Hull 10 | 4,017,514 |
| Hull 11 | 4,699,109 |
| Hull 12 | 6,599,215 |
| Hull 13 | 7,088,406 |
| Hull 14 | 8,466,164 |
| Hull 15 (parent) | 7,757,387 |
Table 4.
Non-dimensional locations of the calculation points for comfort analysis.
Table 4.
Non-dimensional locations of the calculation points for comfort analysis.
| Dimension | Locations 1 |
|---|
| BC | CA | DA | OC | WH |
|---|
| 0.06 | 0.90 | 0.43 | 0.83 | 0.73 |
| 0.00 | 0.00 | 0.00 | 0.00 | −0.23 |
| 1.81 | 1.09 | 2.54 | 3.26 | 3.99 |
Table 5.
Regression coefficients for the resistance and comfort hydrodynamic attributes.
Table 5.
Regression coefficients for the resistance and comfort hydrodynamic attributes.
| | (kN) | Trim (Deg) | (-) |
|---|
| | Coeff. | p-Value | Coeff. | p-Value | Coeff. | p-Value |
|---|
| intercept | 5.702 × 10³ | 0.0430 | −1.588 × 10² | 0.0629 | 5.006 × 10² | 0.0404 |
| L | −1.193 | 1.904 × 10⁻⁴ | 1.061 × 10⁻¹ | 0.0206 | 5.241 | 0.0412 |
| B | −1.541 × 10³ | 0.0435 | 4.122 × 10 | 0.0697 | −5.793 × 10 | 0.0608 |
| T | −7.175 × 10³ | 0.0430 | 1.943 × 10² | 0.0672 | −6.244 × 10² | 0.0384 |
| - | - | −7.850 × 10⁻³ | 0.0448 | −7.461 × 10⁻¹ | 0.0310 |
| - | - | −2.293 × 10⁻² | 0.0935 | −3.747 | 0.0226 |
| 1.954 × 10³ | 0.0424 | −5.101 × 10 | 0.0723 | 8.821 × 10 | 0.0306 |
| - | - | - | - | - | - |
| 1.030 × 10² | 0.0428 | −2.667 | 0.0744 | - | - |
| 2.223 × 10³ | 0.0417 | −5.932 × 10 | 0.0680 | 1.998 × 10² | 0.0322 |
| 0.9526 | 0.9353 | 0.9669 |
| 0.9052 | 0.8189 | 0.9228 |
Table 6.
Regression coefficients for the maneuvering hydrodynamic attributes.
Table 6.
Regression coefficients for the maneuvering hydrodynamic attributes.
| | Init_20 (-) | Yaw_20 (-) |
|---|
| | Coeff. | p-Value | Coeff. | p-Value |
|---|
| intercept | 2.718 | 0.0415 | 5.551 | 0.0395 |
| L | 1.112 × 10⁻¹ | 0.0408 | −1.183 × 10⁻¹ | 0.0421 |
| B | −1.194 × 10⁻¹ | 0.0512 | −2.756 × 10⁻¹ | 0.0497 |
| T | −1.327 | 0.0352 | 1.341 | 0.0349 |
| −3.208 × 10⁻³ | 0.0295 | 7.975 × 10⁻³ | 0.0298 |
| −3.443 × 10⁻² | 0.0436 | −2.157 × 10⁻² | 0.0416 |
| 7.889 × 10⁻² | 0.0451 | - | - |
| - | - | - | - |
| - | - | - | - |
| 4.459 × 10⁻¹ | 0.0389 | - | - |
| 0.9687 | 0.9661 |
| 0.9269 | 0.9407 |
Table 7.
Output of TOPSIS procedures for different weighting factors.
Table 7.
Output of TOPSIS procedures for different weighting factors.
| Project | Weights | L (m) | B (m) | T (m) |
|---|
| | [, , , Init, Yaw] | | | |
|---|
| P1 | | 39.446 | 7.857 | 1.303 |
| P2 | | 32.107 | 7.609 | 1.678 |
| P3 | | 30.161 | 7.645 | 1.725 |
| P4 | | 37.053 | 7.007 | 1.503 |
| P5 | | 33.595 | 6.003 | 1.968 |
| Disclaimer/Publisher’s Note: The statements, opinions and data contained in all publications are solely those of the individual author(s) and contributor(s) and not of MDPI and/or the editor(s). MDPI and/or the editor(s) disclaim responsibility for any injury to people or property resulting from any ideas, methods, instructions or products referred to in the content. |
© 2025 by the authors. Licensee MDPI, Basel, Switzerland. This article is an open access article distributed under the terms and conditions of the Creative Commons Attribution (CC BY) license (https://creativecommons.org/licenses/by/4.0/).
