Article

Dynamic Response of a Floating Dual Vertical-Axis Tidal Turbine System with Taut and Catenary Mooring Under Extreme Environmental Conditions in Non-Operating Mode

1
Division of Mechanical Engineering, National Korea Maritime & Ocean University, Busan 49112, Republic of Korea
2
Korea Institute of Ocean Science and Technology, Busan 49111, Republic of Korea
*
Author to whom correspondence should be addressed.
J. Mar. Sci. Eng. 2025, 13(7), 1315; https://doi.org/10.3390/jmse13071315
Submission received: 28 May 2025 / Revised: 3 July 2025 / Accepted: 6 July 2025 / Published: 8 July 2025
(This article belongs to the Special Issue Numerical Analysis and Modeling of Floating Structures)

Abstract

This study analyzes the dynamic response of a floating dual vertical-axis tidal turbine platform under extreme environmental loads, focusing on two different mooring systems as follows: taut and catenary. The analysis assumes a non-operational turbine state where power generation is stopped, and the vertical turbines are lifted for structural protection. Using time-domain simulations via OrcaFlex 11.4, the floating platform’s motion and mooring line effective tensions are evaluated under high waves, strong wind, and current loads. The results reveal that sway and heave motions are significantly influenced by wave excitation, with the catenary system exhibiting larger responses due to mooring system features, while the taut system experiences higher mooring effective tension but shows more restrained motion. Notably, in the roll direction, both systems exhibit peak frequencies unrelated to the wave spectrum, attributed instead to resonance with the system’s natural frequencies—0.12438 Hz for taut and 0.07332 Hz for catenary. Additionally, the failure scenario of ML02 (Mooring Line 02) and the application of dynamic power cables to the floating platform are analyzed. The results demonstrate that under non-operational and extreme load conditions, mooring system type plays a main role in determining platform stability and structural safety. This comparative analysis offers valuable insights for selecting and designing mooring configurations optimized for reliability in extreme environmental conditions.

1. Introduction

The EU recognized the risk of greenhouse gas problems due to rapid industrialization and announced a climate policy. This climate policy aims to reduce greenhouse gas emissions by 90% by 2040 compared to 1990 levels [1]. Accordingly, many experts started research on greenhouse gas reduction in their respective fields. Among them, tidal current energy is one of the best energy sources considering high efficiency, production stability, and predictability. The difference in tidal range, caused by the gravitational pull of the moon and the sun, can be converted into energy. The kinetic energy of the fluid particles in the tide as the seawater flows in turns the turbines to produce electricity. The turbines transmit the generated electrical energy to the land through power cables. Usually, seawater is about 832 times denser than air and a relatively small turbine can produce a lot of electricity. Also, tidal current energy can be produced both during the day and at night.
Recently, floating tidal energy systems have attracted attention because they have overcome the limitations of onshore tidal energy platforms. The floating tidal platform can be installed with all equipment inside and is easy to maintain [2,3,4,5,6,7,8,9]. Therefore, many previous studies have been conducted. Jo, C. et al. analyzed the mooring system of a floating tidal power plant (TCP) using a commercial analysis program (OrcaFlex) and designed an optimal design to obtain a safe dynamic response [10]. Arini, N. R. et al. performed a dynamic response analysis on vertical and horizontal modular tidal energy platforms, and the effective tension of the mooring line under different environmental loads was analyzed [11].
In addition to tidal energy, research on floating platforms to obtain various energy sources has been conducted. Song, J. et al. analyzed the dynamic response of floating solar panels under various environmental loads and when the mooring line was broken [12]. Yang, R. Y. et al. analyzed the dynamic response of floating photovoltaics (FPV) under normal and extreme environmental conditions through experiments and numerical analysis. The commercial analysis program ANSYS AQWA 2020 was used for numerical analysis, and ANSYS FLUENT was used for wave pressure analysis [13]. Li, L. et al. designed a novel offshore floating renewable energy system combining an offshore floating wind turbine (OFWT), a wave energy converter (WEC), and a tidal turbine [14]. Muliawan, M. J. et al. performed numerical analysis in the time domain using SIMO/TDHMILL3D and calculated the wind power generation of Spar under operating conditions [15].
Furthermore, many studies related to the structure monitoring approach of floating system have also been carried out thus far. Chung, W. C. et al. created an algorithm to analyze the status of mooring lines and risers. The results of numerical analysis using Orcaflex were compared with the results derived through the algorithm, and it can be confirmed that the results are in good agreement [16,17,18].
Also, effective tension applied to mooring chains were analyzed using multiple approaches [19]. Guo, X. et al. investigated the effects of thrust and torque on the dynamic response of a floating tidal turbine [20]. Du, J. et al. compared the dynamic responses of six mooring systems, including those combining different buoys with mooring lines [21]. Tang, Y. et al. presented a methodology to overcome the limits of Orcaflex and obtain more accurate results by using additional software [22]. Thomsen, J. B. et al. compared the results obtained from Open FAST and Orcaflex, and the reason for this was analyzed [23]. Sobhaniasl, M. et al. evaluated axial forces and fatigue in dynamic power cables connected to a 5 MW floating offshore wind turbine using ANSYS AQWA and FAST NREL (National Renewable Energy Laboratory) codes [24]. Taninoki, R. et al. conducted behavior simulation tests on a dynamic power cable system, measuring strain on wire armor under tensile and bending loads. Forced oscillation tests confirmed that tensile-induced strain remained within safe limits, validating the cable’s ability to endure stress in floating platforms [25]. Okpokparoro, S. et al. presented effective tension as a main parameter for failure risk assessment in floating platforms, linking effective tension to long-term reliability [26]. Abrahamsen, A. B. et al. presented a reference dynamic power cable design, assessing maximum cable effective tension as a key failure mode [27]. Yang, R. Y. et al. simulated two mooring system failure scenarios. The effective tension distribution range of the floating platform and anchor chain after the mooring system failure was analyzed [28].
However, previous studies have primarily focused on the structural analysis of simple floating tidal power systems under normal sea conditions. While numerous papers have addressed the feasibility and static stability of single tidal power generators, studies analyzing the dynamic response of floating platforms and the effective tension in mooring lines under extreme environmental conditions remain limited. In particular, although mooring line failure scenarios have been extensively studied for floating offshore wind platforms, such analyses are scarce for tidal power floating platforms.
This study goes beyond a basic global analysis by conducting a comprehensive simulation that encompasses reliability assessments under extreme environmental conditions, considerations of mooring line failure scenarios, and integrated system analysis including dynamic power cables with dual vertical-axis turbines. By applying traditional analysis methodologies, this study offers a valuable reference for validating the applicability of floating dual vertical-axis tidal turbine systems and provides a foundation for an initial conceptual design.

2. Theoretical Background

In this chapter, this study’s theoretical background is explained briefly.

2.1. Governing Equations [29,30]

In the fluid area, the fluid flow is assumed to be inviscid, incompressible, and irrotational. If the flow is assumed to be inviscid, then it is simplified to the Euler equation; if potential flow is assumed, then it is derived to the Laplace Equation (1). In addition, since the kinetic energy and pressure change transmitted during wave oscillation are not greatly attenuated by viscosity, ignoring viscosity does not have a significant effect on the accuracy of wave analysis.
2 Φ = 0
where velocity potential is Φ, respectively. By inputting the (1) into the Navier–Stokes equation and integrating it, the Bernoulli equation for the fluid pressure over the wetted surface, as in (2), is obtained.
p = ρ Φ t + 1 2 Φ 2 + g Z
Bottom BC (Boundary Condition) at z = −∞, the vertical velocity of fluid particles at the sea bottom is zero.
Φ t = 0
Free surface at z = η(x, y, t), the pressure at sea is equal to atmospheric pressures.
ρ Φ t + 1 2 Φ x 2 + Φ y 2 + Φ z 2 + ρ g z = 0
Kinematic BC on the surface of a rigid body moving at z = η(x, y, t), fluid particles at the sea surface are at the sea surface.
η t + u η x + V η y Φ t = 0
This condition applies at the instantaneous free surface at z = η(x, y, t), which is defined by (2).
η X , Y , t = 1 g Φ t + 1 2 Φ 2
However, the exact solution of the governing equation is hard to obtain precisely due to the non-linearity of BC. So, the approximate solution is obtained based on the perturbation approach and used to calculate the wave load acting on the floating body. The approximate solution obtained using the perturbation approach is as follows [31]:
Φ = Φ 1 + Φ 2 + p = p 1 + p 2 +

2.2. Hydrodynamic Coefficients [32,33,34]

Hydrodynamic coefficients are numerical values that describe how a body behaves when moving through a fluid, such as seawater. The coefficients represent the relationship between the fluid forces and the motion of the body (such as velocity or acceleration). They are essential in predicting and analyzing the performance of floating structures.
Continuously, floating platforms take on additional fluid loads as they move due to pressure changes in the surrounding fluid called added mass/moment of inertia. Also, when a floating body moves, energy is dissipated as waves are generated on the surface. The following is Equation (8) related to the added mass/moment and radiation damping:
M a i j i w C i j = ρ s n i Φ j d s
where M a is added mass, C i j is radiation damping, n i , Φ j is normal velocity and fluid potential.

2.3. Wave Excitation Force

Wave excitation forces are split into two components such as Froude–Kriloff and diffraction forces as below. Froude–Kriloff forces, derived from pressure on the body due to undisturbed incident waves:
F f k = S B p d n d S
Diffraction forces result from wave field disturbance by the structure. For example, the vertical component is:
F d , 3 = M a , 33 · a 3
where M a , 33 , a 3 are vertical added mass and wave acceleration, respectively.
The complete wave excitation force, accounting for both effects in complex form, is:
F w a v e 1 s t   o r d e r = i ω ρ S B n i 0 + S d S
Here, ϕ 0 and ϕ s represent the incident and scattered wave potentials. Due to the geometrical complexity of the platform, this must be evaluated numerically.

2.4. Time Domain Analysis in Orcaflex

The floating platform has generally six degrees of freedom, including three translational and three rotational motions. The equations describing this motion are expressed based on Newton’s law or Lagrange’s equations. The equations can be expressed as follows:
M + M a u ¨ + C u ˙ + K u = F e x t e r a l   f o r c e
F e x t e r a l   f o r c e = F w a v e + F c u r r e n t + F w i n d
where M , M a , C , K is structure mass, added mass, damping, restoring load, respectively. F e x t e r a l   f o r c e is external load including wave, current, wind load. This equation includes mass, damping and restoring force, evaluated in time steps, and considers instantaneous and time-varying geometry. F w a v e consists of the first and second-order wave excitation force. Continuously, in random waves, wave load can be expressed using the Volterra series expansion.
F w a v e 1 s t   o r d e r = R e i = 1 N A i L ω i e i w i t
F w a v e 2 n d   o r d e r = R e j = 1 N k = 1 N A j A k * D ω j , ω k · e i ω j ω k t + j = 1 N k = 1 N A j A k S ω j , ω k · e i ω j + ω k t
(*) represent the complex conjugate. Also, L , D , S mean linear transfer function (LTF), the difference D ( ω j , ω k ) and sum S ω j , ω k , frequency quadratic transfer function (QTF), accordingly.

2.5. Lumped Mass Method for Mooring Line [34,35]

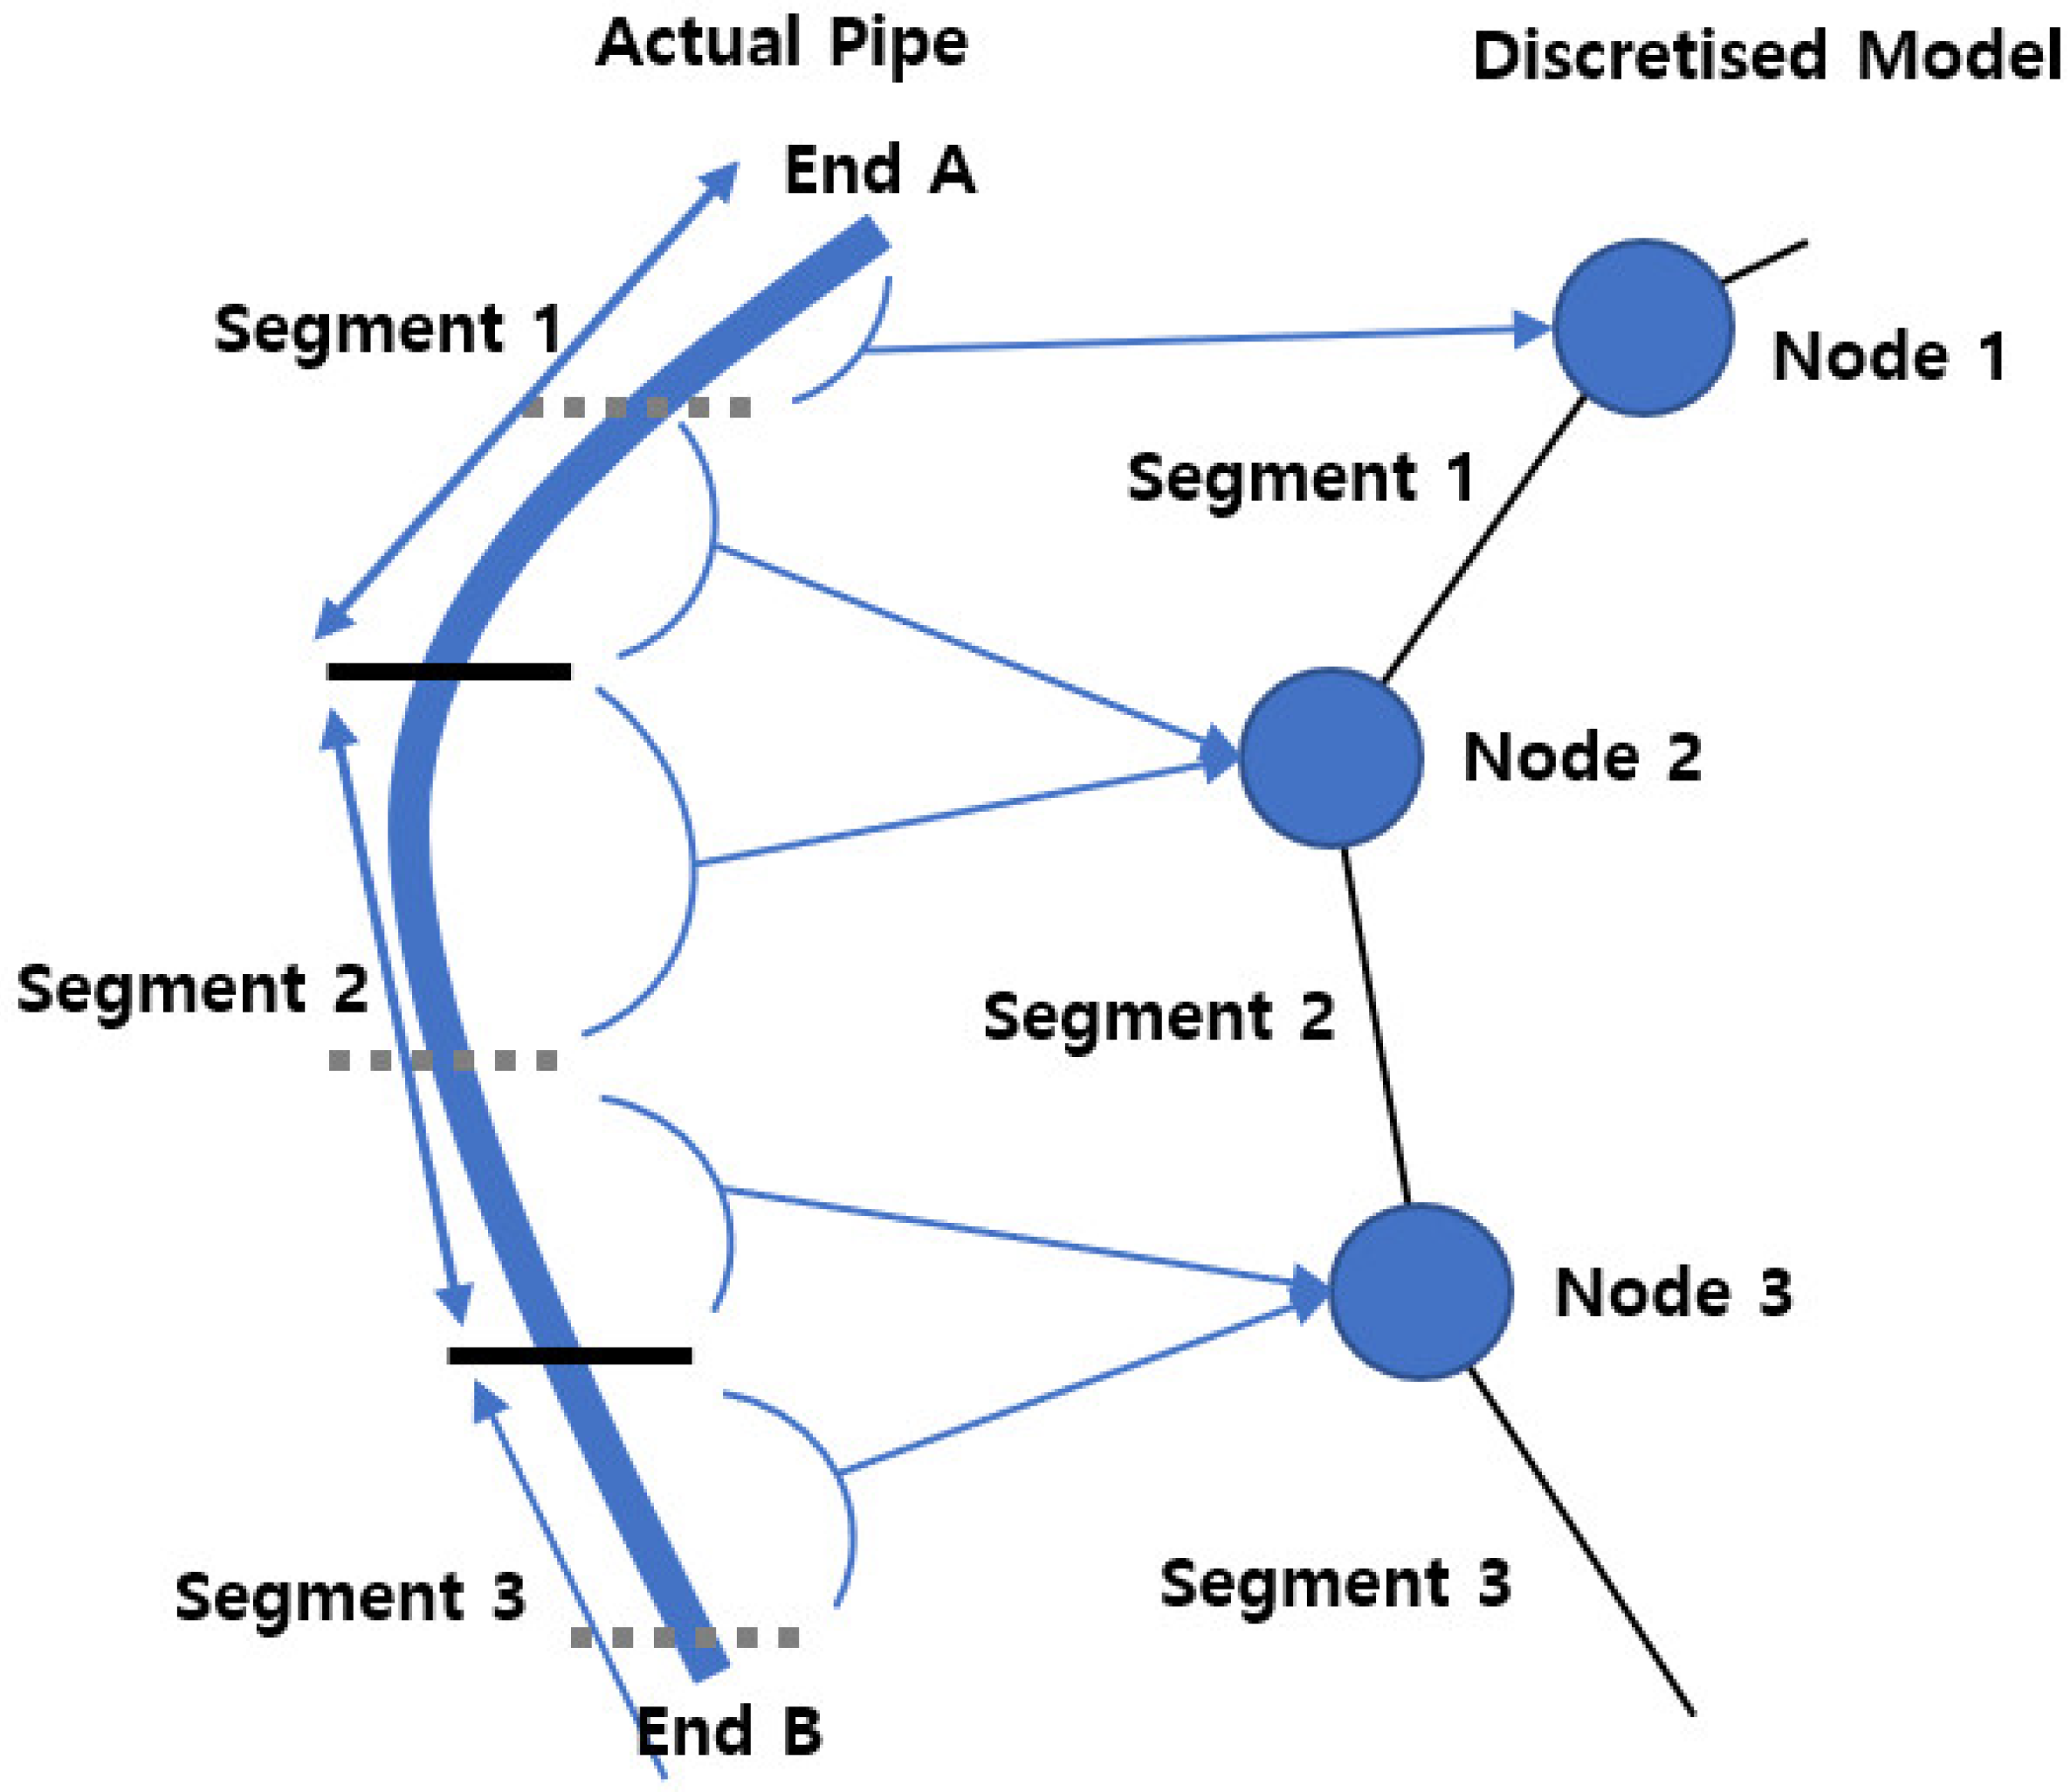
The lumped mass method, which is implemented in OrcaFlex, is used to model the mooring line as a series of beam elements. In this approach, each mooring line—assumed to behave like a beam—is divided into nodes and segments, as illustrated in Figure 1. Forces such as weight, buoyancy, and drag are concentrated at each node (mass point), while massless springs are used to simulate the dynamic behavior of the mooring line. The Morison equation is applied to calculate the hydrodynamic forces acting on the line. Furthermore, ρ V u ˙ is Froude–Krylov force, ρ V C a u ˙ v ˙ is hydrodynamic mass force, and 1 2 ρ C d A u v u v is drag force, respectively.
F = ρ V u ˙ + ρ V C a u ˙ v ˙ + 1 2 ρ C d A u v u v

3. Target Model

3.1. Floating Platform

Figure 2 shows the front view and top view of the floating platform model. In the figure, two pontoons are colored red and are located 4 m deep in the water on both sides. It is assumed that the pontoons are equipped with a large-capacity battery inside. Also, the shape of the pontoons is streamlined to reduce resistance at high fluid speeds. Additionally, the yellow block connecting these two pontoons on both sides holds the system controllers, which act as generators for the turbines. In addition, Figure 3 plotted a mesh configuration for the floating platform which is used in Orcawave. Red and gray meshes represent wet and dry surfaces, respectively. The mesh size is set to 0.4 m by default, and the number of total nodes is 3944. In this numerical analysis, it is assumed the power generation is stopped and the vertical turbines are lifted to prevent failure under the extreme environments. For this reason, the gyroscopic moments generated when the turbine motor rotates, which could affect the floating platform, are not also considered. Additionally, it is assumed that the moment generated by lifting the vertical turbines is quite small compared to the entire system. As can be seen in Table 1, the mass of vertical turbines is extremely low among the total mass. In fact, the mass of the vertical turbines is only 0.39% of the total mass. This can be the basis for the insignificant effect of the turbine moment on the entire floating platform. So, it is excluded from numerical analysis. Table 1 lists the specification of the base model of the floating platform and Table 2 tabulates hydrostatic restoring stiffness. To analyze the dynamic response of the floating platform in time domain, hydrodynamic coefficients (added mass/inertia, radiation damping, load and displacement RAOs (response amplitude operator) are needed. To obtain the coefficients, Oracwave software 11.4 is used to obtain the hydrodynamic coefficients by incident regular waves from various directions. A wave period of 2.5–30.0 s and to 90° of wave heading is considered during the hydrodynamic coefficients analysis. In addition, it is assumed that the seawater density is 1025 kg/m3 and water depth is 50 m. Also, added mass/inertia, radiation damping, load RAOs, and displacement RAOs under 90 ° are shown in Figure 4, Figure 5, Figure 6 and Figure 7, respectively.

3.2. Mooring System

Figure 8 plotted the configuration of four mooring lines which were attached to enhance the station keeping capability of floating platform. The wave, current, and wind heading is also indicated in Figure 8. Details of the mooring properties are listed in Table 3 [11]. Also, the mooring system’s fairlead and anchor location is tabulated in Table 4. The fixed point is the location where there is a mooring line connected to the floating platform, whereas the anchor point is the location where there is a mooring line connected to the seabed. In addition, section length means how far each point mass is along the mooring lines based on the lumped mass method. Moreover, Table 5 listed the natural frequencies of the floating structure. Modal analysis in Orcaflex can be used to calculate the natural frequencies and mode shapes of the system. In addition, Figure 9 plotted the two different mooring types (taut and catenary) that are used in this numerical analysis as a design parameter. The taut mooring line length is 76 m and is a type that mooring line is kept tighter than loose. The mooring line’s shape is close to a straight-line type rather than curve shape. It effectively distributes and reduces the vertical load using high elastic materials like synthetic fiber ropes (polyethylene, aramid fiber). Therefore, the anchor installation area (footprint) is smaller compared to catenary mooring systems. But, in shallow water, a taut leg system can be too stiff and increase line tension excessively.
However, in catenary type, the mooring line’s shape is a catenary curve and partially touches the seabed. Thus, effective tension is not tight and when a horizontal load is received, the curve is tight and the restoring force acts [36]. As shown in Figure 9, the catenary’s mooring line length is 115 m.

3.3. Describing of Environmental Loads

Environmental loads are listed in Table 6. The wave, current, and wind load are referenced by [11] and [18], respectively. Since environmental heading is 90°, the area that has received load in horizontal direction is only sway area. Also, this study presents an initial conceptual design of a floating dual vertical-axis tidal turbine system. Due to the nature of tidal energy generation, such systems are typically installed and operated in areas with relatively high current velocities, such as narrow straits or between islands. Given the system’s geometrical configuration, it is assumed that the environmental load angle that yields the highest power generation efficiency is 90 degrees and the dynamic performance under parked conditions (non-operating) can be evaluated even in extreme environmental conditions. Therefore, additional analyses at other headings such as 0 and 45 degrees, are planned in future system design optimization stages.
Figure 10 plotted wave elevation in time domain, frequency domain of wave, respectively. It can be seen that the peak frequency of wave is 0.05806 Hz. To confirm wave energy input correctly, it is important to match the wave-theoretical and wave-regenerated spectral density. It is well matched as shown in Figure 10. Also, JONSWAP (Joint North Sea Wave Project) spectrum is used as the wave model. The spectral density’s fundamental frequency is controlled to match the theoretical and generated wave. It is set at 0.0012 Hz in this numerical analysis. Moreover, the JONSWAP spectrum can be defined as follows:
S f = α g 2 2 π 4 f 5 e x p 5 4 f p f 4 · γ b
b = e x p f f p 2 2 σ 2 f p 2
where f , f p are present frequency and wave peak frequency, respectively. α is spectrum energy factor. g is gravity acceleration. σ is spectral width factor. γ is peak enhancement factor.
Figure 11 plotted the wind and current profile at 90°. For wind, the API (American Petroleum Institute) spectrum is used as spectrum model. The API spectrum can be defined as follows:
S f , z = U z 2 I z 2 f p 1 + 1.5 f f p 5 3
I z = σ u U z
where U z is mean wind speed at z, I z means turbulence intensity. In this study, it is set to 0.08 [37]. σ u is standard deviation of wind speed. This value is 3.44 m/s. And f , f p are present frequency and wind peak frequency, respectively.
Also, the current profile can be defined by the power law method and expressed as follows:
C = C b + C f C b · Z Z b Z f Z b 1 p
where C is current speed at Z and C f , and C b are the current speeds at the surface and seabed, respectively. 1 / P is the power law exponent. In this numerical analysis, it is set to 1/7. It means that the current is gradually reduced from surface to seabed with 1/7 law. Z b and Z f are Z-coordinates of the surface and seabed, respectively.

4. Results and Discussion

4.1. Taut vs. Catenary Mooring System Comparison

In this section, the results of the dynamic responses of the platform under two different mooring systems (taut and catenary) are explained. In Figure 12, (a) the dynamic response in time domain is plotted, whereas (b) presents the frequency domain results. The total simulation duration is set to 10,800 s, and taut is represented by the red line and catenary by the blue line, respectively. Since the environmental load heading is 90 degrees, surge, pitch, and yaw are converged to zero (no dynamic response). In sway and heave direction, it is observed that a large dynamic response is captured in catenary type rather than taut. This is because the taut mooring lines are subjected to a larger effective tension than the catenary mooring lines. In this study, the maximum margin of rotational freedom is set to 40°. As can be seen from the roll results, it is confirmed that the angle does not exceed 40° in both mooring systems. Also, this can be confirmed in Figure 13. However, since fairlead point boundary condition is hinged, significant difference cannot be captured in roll direction between taut and catenary.
In the frequency domain, peak frequencies around 0.058 Hz are observed in sway and heave. This matches the peak frequency of the wave spectrum which is plotted in Figure 10. Therefore, it can be confirmed that the influence of wave load is dominant in the sway and heave dynamic responses. However, in roll, unexpected peak frequencies are confirmed at 0.07332 Hz for catenary and 0.12438 Hz for taut, which are not same with the peak frequencies of wave load. This cannot be explained by the influence of wave load. Therefore, the natural frequencies of the system can be checked through the modal analysis of Orcaflex.
The results can be seen in Figure 14. The mode shapes are directed in the roll direction are mainly confirmed at 0.12438 Hz and 0.07332 Hz for taut and catenary, respectively. Therefore, it is confirmed that the unexpected peak frequencies of 0.12438 Hz and 0.07732 Hz in governed roll mode are more influenced by the resonance due to the natural frequencies.
Additionally, Figure 13 plotted the effective tension applied to each mooring line. Since the wave heading is 90°, the effective tensions of ML01 and ML04 are the same and ML02 and ML03 are also the same. As expected, the effective tensions applied to the taut system are confirmed to be greater than that of the catenary system. This is supported by the fact that the dynamic responses of taut in sway and heave are relatively small compared to those of the catenary system. As shown in Table 2, the MBL (minimum breaking load) of the mooring line used in this study is 3835.5 kN, so it can be confirmed that the applied mooring system can resist even in extreme environmental conditions. As a result of checking the PSD of the effective tension, the peak frequency of the effective tension can be confirmed at 0.058 Hz, which is the wave peak frequency. Also, it can be confirmed that the effective tension of the mooring line is also dominated by the wave load. Statistical characteristic mooring system type is listed in Appendix A.

4.2. Mooring Failure

The failure of one mooring line’s results will be discussed in this section. When designing a floating platform, mooring system failure scenarios when exposed to extreme environmental loads must be considered [11]. In the event of a mooring line failure case, ML02 will be disconnected intentionally during the simulation at 5400 s. Other conditions are the same as the previous Section 4.1.
Figure 15a,b plotted time-domain results before and after ML02 failure, respectively. In the figure, (a) presents the dynamic response of the floating platform before ML02 failure whereas (b) presents the dynamic behavior after ML02 failure. Figure 16a presents the dynamic response of the floating platform before ML02 failure in PSD whereas Figure 16b presents the dynamic response after ML failure in PSD. Likewise, in the intact case, before ML02 failure, surge, pitch, and yaw exhibit very little dynamic motion (almost close to zero), but relatively large dynamic responses are observed interestingly after the ML02 failure. This can be judged to be due to the imbalance of the effective tensions of the mooring lines and the application of the slow-varying drift load caused by the ML02 failure. As evidence for this, it can be confirmed that the dynamic variation in the yaw direction is the largest after ML02 failure rather than other directions. In sway, it can be confirmed that the stationkeeping capability decreases significance in both taut and catenary due to ML02 failure and the offset caused by ML02 failure cannot be recovered. However, no significant change is confirmed in heave. Furthermore, after the ML02 failure, unexpected peak frequencies occurred in all degrees of freedom except heave in the frequency domain. The slow-varying drift load due to the ML02 failure is caused by the unexpected peak frequency.
In addition, Figure 17 plotted the time and frequency domain of the effective tension before the ML02 failure. As discussed in the previous section, before the ML02 failure, the effective tension of ML01 and ML04 are the same and ML02 and ML03 are also the same. Also, Figure 18 plotted the time and frequency domain of the effective tension after the ML02 failure. As expected, each mooring line receives a different effective tension. It is confirmed that the maximum mooring load exceeded the minimum breaking load (MBL) in both mooring systems following the failure. This phenomenon is attributed to the unbalanced distribution of effective tension, which became concentrated on the mooring line ML03. This is due to the slow-varying drift load and imbalance of the effective tension of mooring lines. Since ML02 is separated, it is not shown in Figure 18. For both the taut and catenary systems, it can be confirmed that ML01 and ML03 receive a larger effective tension than before the ML02 failure, whereas ML04 receives a relatively small effective tension. Also, it can be confirmed that the wave load is dominant in the frequency domain of the effective tension for both mooring systems. The statistical characteristics of mooring failure scenario is summarized in Appendix B.

4.3. Power Cable with Lazy-Wave Type

Usually, dynamic power cables are connected to an offshore renewable energy system to transmit electricity. They typically experience large load variations at the hang-off location and touch-down point due to the dynamic response of the floating platform [38]. To prevent damage caused by floater motion especially at the touch down point, several buoyancy modules can be attached to make a lazy-wave shape [39]. Thus, in this section, to prevent potential damage, the lazy-wave type power cable is applied here. Figure 19 plotted a configuration of two different mooring systems (taut and catenary) with a lazy-wave power cable in numerical analysis. The red and blue lines represent the Decline section and Buoyancy section, respectively. Additionally, dynamic power cable properties, which are used in this numerical analysis, are tabulated in Table 7 [40]. Also, Figure 20 shows the time and frequency domain of the effective tension applied to the dynamic power cable. The midpoint is set to an arclength 120 m along the dynamic power cable.
As shown in Figure 20a, it can be confirmed that a larger effective tension is applied as it goes from End B (anchor) to End A (hang-off). Apart from the self-weight effect, it can be judged that a large effective tension is applied because End B is fixed to the seabed and far from the hang-off location, which received little dynamic response during the simulation, whereas End A is connected to the floating platform directly which was affected by a repetitive and dynamic response. In the frequency domain, the peak frequency of the midpoint is around 0.058 Hz, and it can be confirmed that the wave excitation load is dominated. However, an unexpected peak frequency of the catenary can be confirmed at End A and End B, respectively. In order to identify the cause of the unexpected peak, the natural frequency of the dynamic power cable should be computed using Orcaflex modal analysis. As shown in Figure 21, the natural frequencies can be captured at 0.13209 Hz and 0.18589 Hz, respectively. Thus, it can be confirmed that the peak frequency of the catenary at End A and B is more dominant due to resonance rather than the wave excitation load. To confirm the dynamic power cable integrity, it is assumed that allowable MBR of the dynamic power cable is 2.3 m and 4.3 m (=10 OD) in buoyancy and decline section, respectively. It can be confirmed that the minimum value of bend radius (MBR) during the simulation is 17 m in the taut system and 19 m in the catenary system. Thus, structure integrity of the dynamic power cable can be confirmed in initial design. Similarly, the statistical characteristics of dynamic power cable with the lazy-wave case is listed in Appendix C.

5. Conclusions

Numerical analysis is performed to analyze the dynamic response of the floating dual vertical-axis tidal turbine platform under extreme environmental pressure. The floating platform is applied to the two different mooring systems, taut and catenary. JONSWAP and API are used as wave and wind spectra, respectively. The environmental heading is 90° and total simulation duration is 10,800 s. Also, the mooring system failure scenario is also checked. It assumes that ML02 is disconnected to the floating platform at 5400 s intentionally. Finally, the floating platform is equipped with dynamic power cable and the dynamic response of power cable under extreme environment conditions is also analyzed.
  • In comparing the taut and catenary mooring systems with a 90° environmental heading, the catenary system shows larger sway responses due to lower effective tension in its mooring lines, while taut lines, with higher effective tension, show smaller heave responses. Roll responses are similar for both systems due to hinged BC. The sway and heave frequencies align with the wave spectrum (0.058 Hz), while roll exhibits unexpected peaks due to resonance, not wave loading. Taut mooring lines experience higher tension, which is reflected in the system’s dynamic response and the peak frequency of effective tension, confirming wave load dominance.
  • When a mooring line fails, the dynamic responses of surge, pitch, and yaw increase significantly, especially yaw. The slow-varying drift load on the floating platform further contributes to the peak frequencies of the dynamic responses. However, the effective tensions remain primarily influenced by the wave load.
  • In dynamic power cable analysis, the effective tension increases from End B (anchor) to End A (hang-off) due to End A being connected to the floating platform, which moves dynamically, applying a larger tensile load. In the frequency domain, the catenary at End A peaks around 0.19 Hz, and at End B, it peaks around 0.13 Hz, aligning with the natural frequencies of the dynamic power cables. The peaks are influenced by resonance, and the wave load is confirmed to still dominate, as other frequencies coincide with the wave load’s peak frequency.

6. Future Works

In this analysis, the moment induced by the lifting of the dual vertical-axis turbine is not considered, as it pertains to a non-operational condition. This additional moment could result in relatively high initial effective tensions in mooring lines ML01 and ML04. More accurate results may be obtained in future studies by incorporating this factor. Furthermore, response amplitude operators (RAOs) calculations that account for various mooring system configurations should be explored during the design optimization phase. Additionally, slackness in the mooring lines has been consistently observed, which may contribute to increased fatigue loading.

Author Contributions

Conceptualization, J.P.; methodology, Y.L., J.P. and W.C.C.; software, Y.L. and W.C.C., validation, Y.L., J.P. and W.C.C.; formal analysis, Y.L. and W.C.C.; investigation, Y.L., J.P. and W.C.C.; re-sources, Y.L., J.P. and W.C.C.; data curation, Y.L., J.P. and W.C.C.; writing—original draft preparation, Y.L.; writing—review and editing, J.P. and W.C.C.; visualization, Y.L. and W.C.C.; supervision, J.P. and W.C.C.; project administration, J.P. and W.C.C.; funding acquisition, J.P. and W.C.C. All authors have read and agreed to the published version of the manuscript.

Funding

This research is a part of the project titled “Development of Advanced Technology for Ocean Energy, and Harbor and Offshore Structures (PEA0321)”, funded by the Korea Institute of Ocean Science and Technology (KIOST), Korea.

Data Availability Statement

Data are contained within the article.

Conflicts of Interest

The authors declare no conflicts of interest.

Appendix A

Appendix A is plotted with the summary results of dynamic response and effective tension.
Table A1. Mooring types effect, time domain, 90°.
FreedomSurgeSwayHeaveRollPitchYaw
Unitmmmdegdegdeg
TautMean0−0.449−0.4290.0400
STD01.0981.456.865 00
Max03.0332.45924.171 00
Min0−8.624−8.842−30.92100
CatenaryMean0−0.74−0.0342.313 00
STD03.616 2.057 7.640 00
Max06.532 7.923 30.487 00
Min0−16.281−8.225−26.71500
Table A2. Mooring types effect, effective tension, 90°.
TypeTautCatenary
UnitkNkN
ML14Mean153.21260.689
STD113.5516.115
Max1289.896274.215
Min−38.74−26.887
ML23Mean190.42197.183
STD145.4661.827
Max1511.166833.312
Min−79.261−158.054

Appendix B

Table A3. Before ML2 failure, time domain, 90°.
FreedomSurgeSwayHeaveRollPitchYaw
Unitmmmdegdegdeg
TautMean0−0.464−0.5050.096 00
STD01.058 1.358 6.6500
Max02.608 1.015 21.275 00
Min0−7.482−8.075−26.70700
CatenaryMean0−0.717−0.0362.301 00
STD03.578 2.045 7.686 00
Max06.532 7.923 30.487 00
Min0−14.162−7.388−25.31400
Table A4. After ML2 failure, time domain, 90°.
FreedomSurgeSwayHeaveRollPitchYaw
Unitmmmdegdegdeg
TautMean−6.1365.468−0.352−6.033−2.31123.537
STD2.4353.1641.53418.9715.5658.961
Max1.95412.8182.48159.03819.97755.238
Min−13.357−7.941−8.355−68.329−31.484−6.862
CatenaryMean−21.26318.167−0.299−10.374−3.32830.962
STD2.1854.7462.05114.6534.338.597
Max026.6758.15653.18824.90961.782
Min−27.257−3.612−9.47−69.247−26.290
Table A5. Before mooring failure, TSN, 90°.
TypeTautCatenary
UnitkNkN
ML14Mean174.08260.574
STD123.18816.219
Max1501.423238.638
Min26.052−26.887
ML23Mean197.67796.865
STD154.2661.498
Max1295.865791.48
Min−442.319−153.867
Table A6. After mooring failure, TSN, 90°.
TypeTautCatenary
UnitkNkN
ML01Mean254.422114.046
STD250.14679.71
Max3098.3511467.488
Min−207.825−102.775
ML03Mean297.397151.748
STD342.295184.918
Max4380.6414945.962
Min−449.497−327.033
ML04Mean57.96831.103
STD32.4335.451
Max732.878400.337
Min−127.078−76.501

Appendix C

Table A7. Dynamic power cable with lazy wave, TSN, 90°.
TypeTautCatenary
UnitkNkN
End AMean24.58425.385
STD3.9493.488
Max81.5170.868
Min−22.49−7.729
MidMean10.911.438
STD1.7212.013
Max21.09546.807
Min4.9913.868
End BMean11.1611.621
STD0.9281.149
Max18.41234.615
Min7.3204.091

References

  1. Edenhofer, O.; Jacobsen, J.B.; Díaz Anadón, L.; van Aalst, M.; Cartalis, C.; Dessai, S.; Vera, E.; Hertwich, E.G.; Lena, K.; Soussana, J.F.; et al. Scientific Advice for the Determination of an EU-Wide 2040 Climate Target and a Greenhouse Gas Budget for 2030–2050; European Scientific Advisory Board on Climate Change: Copenhagen, Denmark, 2023. [Google Scholar]
  2. Shetty, C.; Priyam, A. A review on tidal energy technologies. Mater. Today Proc. 2022, 56, 2774–2779. [Google Scholar]
  3. Sahu, A.; Yadav, N.; Sudhakar, K. Floating photovoltaic power plant: A review. Renew. Sustain. Energy Rev. 2016, 66, 815–824. [Google Scholar]
  4. O’Rourke, F.; Boyle, F.; Reynolds, A. Tidal energy update 2009. In Renewable Energy; Routledge: Oxfordshire, UK, 2018; pp. Vol3_451–Vol3_476. [Google Scholar]
  5. Chowdhury, M.S.; Rahman, K.S.; Selvanathan, V.; Nuthammachot, N.; Suklueng, M.; Mostafaeipour, A.; Amin, N.; Techato, K. Current trends and prospects of tidal energy technology. Environ. Dev. Sustain. 2021, 23, 8179–8194. [Google Scholar]
  6. Denny, E. The economics of tidal energy. Energy Policy 2009, 37, 1914–1924. [Google Scholar]
  7. Ashuri, A.; Medawaty, I. Eco-Friendly Wastewater Treatment Technology in Tidal Area; KnE Social Sciences: Dubai, United Arab Emirates, 2019; pp. 55–66. [Google Scholar]
  8. Park, E.S.; Lee, T.S. The rebirth and eco-friendly energy production of an artificial lake: A case study on the tidal power in South Korea. Energy Rep. 2021, 7, 4681–4696. [Google Scholar]
  9. Priyanka, D. Eco-Friendly Energy Resources. Environ. Conserv. Chall. Threat. Conserv. Biodivers. 2022, 4, 87–98. [Google Scholar]
  10. Jo, C.H.; Hwang, S.J.; Park, H.J. Mooring System Design for an Underwater Floating Tidal Current Power Device; Inha University: Incheon, Republic of Korea, 2018. [Google Scholar]
  11. Arini, N.R.; Thies, P.R.; Johanning, L.; Ransley, E.; Brown, S.; Xie, N.; Greaves, D. Feasibility Study of Mooring Lines Design for a Floating Tidal Turbine Platform Using Double Hull Structure. In Proceedings of the International Conference on Offshore Mechanics and Arctic Engineering, Glasgow, UK, 9–14 June 2019; Volume 58899, p. V010T09A007. [Google Scholar]
  12. Song, J.; Kim, J.; Lee, J.; Kim, S.; Chung, W. Dynamic response of multiconnected floating solar panel systems with vertical cylinders. J. Mar. Sci. Eng. 2022, 10, 189. [Google Scholar]
  13. Yang, R.Y.; Yu, S.H. A study on a floating solar energy system applied in an intertidal zone. Energies 2021, 14, 7789. [Google Scholar] [CrossRef]
  14. Li, L.; Gao, Y.; Yuan, Z.; Day, S.; Hu, Z. Dynamic response and power production of a floating integrated wind, wave and tidal energy system. Renew. Energy 2018, 116, 412–422. [Google Scholar]
  15. Muliawan, M.J.; Karimirad, M.; Moan, T. Dynamic response and power performance of a combined spar-type floating wind turbine and coaxial floating wave energy converter. Renew. Energy 2013, 50, 47–57. [Google Scholar]
  16. Chung, W.C.; Kang, H.Y.; Kim, M.H. Multi-scale approach for chain-mooring OPB-induced failure considering time-varying interlink bending stiffness and fairlead condition. Appl. Ocean Res. 2020, 98, 102128. [Google Scholar]
  17. Chung, W.C.; Kang, H.Y.; Kim, M.H.; Pestana, R.G. Riser Structural Health Monitoring with Numerical Sensors. In Proceedings of the ISOPE International Ocean and Polar Engineering Conference, Honolulu, HI, USA, 16–21 June 2019; p. ISOPE–I. [Google Scholar]
  18. Chung, W.C.; Kim, M.; Jin, C. Real-time trace of riser profile and stress with numerical inclinometers. Ocean Eng. 2021, 234, 109292. [Google Scholar]
  19. Chung, W.C.; Jin, C.; Kim, M. Dual-algorithm hybrid method for riser structural health monitoring using the fewest sensors. J. Mar. Sci. Eng. 2022, 10, 1994. [Google Scholar]
  20. Guo, X.; Yang, J.; Lu, W.; Li, X. Dynamic responses of a floating tidal turbine with 6-DOF prescribed floater motions. Ocean. Eng. 2018, 165, 426–437. [Google Scholar]
  21. Du, J.; Zhang, D.; Zhang, Y.; Xu, K.; Chang, A.; Zhao, S. Design and comparative analysis of alternative mooring systems for offshore floating photovoltaics arrays in ultra-shallow water with significant tidal range. Ocean Eng. 2024, 302, 117649. [Google Scholar]
  22. Tang, Y.; Chen, X.; Huang, G.; Chen, M.; Zhang, K.; Jiang, Y.; Li, T.; Tao, T.; Yang, Y. Dynamic analysis of multi-module floating photovoltaic platforms with composite mooring system by considering tidal variation and platform configuration. Ocean Eng. 2024, 312, 119243. [Google Scholar]
  23. Thomsen, J.B.; Bergua, R.; Jonkman, J.; Robertson, A.; Mendoza, N.; Brown, C.; Galinos, C.; Stiesdal, H. Modeling the TetraSpar floating offshore wind turbine foundation as a flexible structure in OrcaFlex and OpenFAST. Energies 2021, 14, 7866. [Google Scholar]
  24. Sobhaniasl, M.; Petrini, F.; Karimirad, M.; Bontempi, F. Fatigue life assessment for power cables in floating offshore wind turbines. Energies 2020, 13, 3096. [Google Scholar] [CrossRef]
  25. Taninoki, R.; Abe, K.; Sukegawa, T.; Azuma, D.; Nishikawa, M. Dynamic cable system for floating offshore wind power generation. SEI Tech. Rev. 2017, 84, 146. [Google Scholar]
  26. Okpokparoro, S.; Sriramula, S. Reliability analysis of floating wind turbine dynamic cables under realistic environmental loads. Ocean Eng. 2023, 278, 114594. [Google Scholar]
  27. Abrahamsen, A.B.; Faria, B.R.; Lund, R.S.; Verelst, D.R.; Roques, J.; Hochet, M.; Dykes, K. Reference dynamic power cable of floating offshore wind turbine for thermal and simple fatigue evaluation. In Journal of Physics: Conference Series; IOP Publishing: Bristol, UK, 2024; Volume 2767, p. 062036. [Google Scholar]
  28. Yang, R.Y.; Chiang, W.C. Dynamic motion response of an oil tanker moored with a single buoy under different mooring system failure scenarios. Ships Offshore Struct. 2023, 18, 923–936. [Google Scholar]
  29. Faltinsen, O. Sea Loads on Ships and Offshore Structures; Cambridge University Press: Cambridge, UK, 1993; Volume 1. [Google Scholar]
  30. Salvesen, N.; Tuck, E.O.; Faltinsen, O. Ship Motions and Sea Loads; The National Academies of Sciences, Engineering, and Medicine: Washington, DC, USA, 1970. [Google Scholar]
  31. He, J.H. A simple perturbation approach to Blasius equation. Appl. Math. Comput. 2003, 140, 217–222. [Google Scholar]
  32. Newman, J.N. Marine Hydrodynamics; The MIT Press: Cambridge, MA, USA, 2018; p. 448. [Google Scholar]
  33. González, M.; Uriarte, A.; Fontán, A.; Mader, J.; Gyssels, P. Marine dynamics. In Elsevier Oceanography Series; Elsevier: Amsterdam, The Netherlands, 2004; Volume 70, pp. 133–157. [Google Scholar]
  34. Oricina. Orcawave User Manual; Orcina: Ulverston, UK, 2021. [Google Scholar]
  35. Oricina. Orcaflex User Manual; Orcina: Ulverston, UK, 2024. [Google Scholar]
  36. Zhang, S.X.; Tang, Y.G.; Liu, X.J. Experimental investigation of nonlinear dynamic tension in mooring lines. J. Mar. Sci. Technol. 2012, 17, 181–186. [Google Scholar]
  37. Somoano, M.; Battistella, T.; Rodríguez-Luis, A.; Fernández-Ruano, S.; Guanche, R. Influence of turbulence models on the dynamic response of a semi-submersible floating offshore wind platform. Ocean Eng. 2021, 237, 109629. [Google Scholar]
  38. Holcombe, A.; Hann, M.; Brown, S.; Cheng, S.; Rawlinson-Smith, R.; Nicholls-Lee, R.; Tosdevin, T.; Edwards, E.; Monk, K. Experimental–numerical model comparison of a dynamic power cable for a floating offshore wind turbine. Ocean Eng. 2025, 321, 120384. [Google Scholar]
  39. Beier, D. Dynamic and Fatigue Analyses of Suspended Power Cables for Multiple Floating Offshore Wind Turbines. Master’s Thesis, Universiti Islam Selangor, Kajang, Malaysia, 2023. [Google Scholar]
  40. Zhang, D.; Zhao, B.; Zhu, K.; Jiang, H. Dynamic analysis of the subsea production system with lazy-wave risers attached to FPSO. PLoS ONE 2023, 18, e0291603. [Google Scholar]
Figure 1. Lumped mass method in Orcaflex.
Jmse 13 01315 g001
Figure 2. Floating dual vertical-axis tidal turbine system on extreme load (without turbine).
Jmse 13 01315 g002
Figure 3. Mesh configuration for the floating dual vertical-axis tidal turbine system.
Jmse 13 01315 g003
Figure 4. Added mass and moment.
Jmse 13 01315 g004
Figure 5. Radiation damping.
Jmse 13 01315 g005
Figure 6. Load RAOs, 90 ° .
Jmse 13 01315 g006
Figure 7. Displacement RAOs, 90 ° .
Jmse 13 01315 g007
Figure 8. Mooring system configuration and environmental heading.
Jmse 13 01315 g008
Figure 9. Configuration of the two different mooring types.
Jmse 13 01315 g009
Figure 10. Wave elevation and spectrum, 90 ° .
Jmse 13 01315 g010
Figure 11. Wind and current profile, 90 ° .
Jmse 13 01315 g011
Figure 12. Floating platform motion, (a) time domain, (b) frequency domain, 90°.
Jmse 13 01315 g012
Figure 13. ML Effective Tension (TSN), (a) ML01&04, (b) ML02&03, 90°.
Jmse 13 01315 g013
Figure 14. Natural frequencies and mode shape.
Jmse 13 01315 g014
Figure 15. Floating platform motion time domain, (a) before failure, (b) after failure, 90°.
Jmse 13 01315 g015
Figure 16. Floating platform motion frequency domain, (a) before failure, (b) after failure, 90°.
Jmse 13 01315 g016
Figure 17. Before failure, effective tension (a) ML01 and ML04, (b) ML02 and ML03, 90°.
Jmse 13 01315 g017
Figure 18. After failure, effective tension (a) ML01, (b) ML03, (c) ML04, 90°.
Jmse 13 01315 g018
Figure 19. Two different mooring systems with lazy-wave power cable.
Jmse 13 01315 g019
Figure 20. Effective tension of dynamic power cable (a) TSN (b) TSN-PSD.
Jmse 13 01315 g020
Figure 21. Natural frequencies and mode shapes of dynamic power cable.
Jmse 13 01315 g021
Table 1. Specification of floating dual vertical-axis tidal turbine system.
NameUnitValue
Pontoonskg60,000
Vertical current turbineskg500
System Controlkg48,000
Appurtenancekg20,000
Total mass kg128,500
Center of gravityXm0
Ym0
Zm−0.4454
Moment of inertiaRx k g · m 2 3,738,050
Ry k g · m 2 112,730
Rz k g · m 2 1,076,700
Center of buoyancyXm0
Ym0
Zm−2
Turbine power generationUnitValue
Turbine powerkW50
Max thrust per turbine (Rated current)kN116
Table 2. Hydrostatic restoring stiffness.
Heave (kN) Roll   ( k N m / r a d ) Pitch   ( k N m / r a d )
315.4400
01.19 0
0023,660
Table 3. Mooring properties.
Type- 6 × 19 Wire with Fiber Core
Nominal diameterm0.15
Mass/unit lengthkg/m81.30
Displaced masskg/m13.4
Axial StiffnessMN825.80
Bending stiffnessMN0
MBL (Minimum Breaking Load)kN3835.50
Table 4. Mooring system’s fairlead and anchor location.
TypeAxis and UnitML1ML2ML3ML4
(a) Taut
Fixed PointX1010−10−10
Y3−3−33
Z−3−3−3−3
Anchor PointX5050−50−50
Y50−50−5050
Z−50−50−50−50
Section Lengthm1111
Number of Segment 76767676
(b) Catenary
Fixed PointX1010−10−10
Y3−3−33
Z−3−3−3−3
Anchor PointX7575−75−75
Y75−75−7575
Z−50−50−50−50
Section Lengthm1111
Number of Segment-115115115115
Table 5. Natural frequencies.
Type1st (Surge Governed)2nd (Pitch Governed)
UnitHzHz
(a) Taut
Value0.124380.16179
(b) Catenary
Value0.034060.04085
Table 6. Environmental Conditions.
TypeParameterUnitExtreme
WaveSpectrum-JONSWAP
Gamma-2.2
Direction from Xdeg90
Significant Wave Height (Hs)m8.7
Peak Period (Tp)s17.2
CurrentSurface Velocity
(1/7 law is used)
m/s1.0
Direction from Xdeg90
WindSpectrum-API
Mean Velocitym/s34
Direction from Xdeg90
Table 7. Dynamic power cable properties.
PropertyBuoyancy SectionDecline Section
Submerged weight (N/m)−463.83516.16
Length (m)40200
Out diameter (m)0.430.23
Axial stiffness (kN)316.80 × 103331.20 × 103
Disclaimer/Publisher’s Note: The statements, opinions and data contained in all publications are solely those of the individual author(s) and contributor(s) and not of MDPI and/or the editor(s). MDPI and/or the editor(s) disclaim responsibility for any injury to people or property resulting from any ideas, methods, instructions or products referred to in the content.

