1. Introduction
Hub location problems arise when large volumes of traffic—whether goods, postal and parcel services, telecommunications, or passengers—must be transported from origin to destination. In such contexts, establishing a direct connection for every origin–destination (O–D) pair is rarely feasible due to cost, operational, and environmental constraints. Logistics hubs offer a structural solution: they act as spatial and functional anchors, where flows are consolidated, redirected, and in many cases transferred between modes. Their core function is not simply transshipment but the orchestration of freight movements to enable economies of scale, reduce duplication, and support modal shift. In intermodal systems, this involves configuring the network so that long-haul segments—ideally rail or maritime—are maximally utilized while last-mile access is managed through flexible road services. This logic is particularly critical in port–hinterland systems, where maritime gateways and inland hubs must operate as a coherent logistics unit to absorb increasing demand, facilitate modal rebalancing, and reduce congestion at seaports. The spatial configuration and operational performance of these hubs—rather than their mere presence—ultimately determine the system’s efficiency and sustainability.
The Hub Location Problem (HLP) has evolved from its early theoretical formulation by [
1] into a cornerstone of transportation network design. Over the last two decades, a new wave of the literature has extended its scope by incorporating capacity constraints, multimodal allocation rules, and socio-environmental performance metrics. Recent works, such as [
2], reflect this shift from purely structural optimization toward more applied and sustainability-oriented approaches, particularly suited to intermodal and maritime–terrestrial systems.
In this article, we develop and test an enhanced Capacitated Multiple-Allocation Hub Location Problem (CMAHLP) model to determine the optimal positioning of inland consolidation mega-hubs within Spain’s intermodal logistics network. The model captures both road and rail connectivity from four key maritime ports—Barcelona, Valencia, Málaga, and Algeciras—which act as gateways for inland freight distribution. Compared to previous CMAHLP approaches, our formulation introduces nonlinear congestion penalties, dynamic operating cost functions, and a feasibility constraint based on the Social Net Present Value (NPVsocial), ensuring long-term viability and consistency with EU Green Deal objectives. To achieve this, the model integrates structural innovations in cost representation, intermodal assignment logic, and sustainability evaluation.
While the transportation cost component in our model draws on the general structure of classical hub location formulations [
3,
4], this work introduces several novel elements that have not been integrated into previous CMAHLP approaches. First, the model incorporates an intermodal transport cost function based on Janic’s framework, which evaluates both internal and external costs per unit of freight for road and rail transport. This enables a realistic assessment of road–rail competitiveness using a discrete mode selection mechanism for each O–D pair. Second, it integrates original functions for dynamic hub operating costs and investment penalties that depend on land footprint, flow volumes, and scale effects. Finally, a feasibility constraint based on the Social Net Present Value (NPVsocial) filters out configurations that do not deliver long-term socio-environmental returns. Together, these features define a hybrid CMAHLP formulation explicitly aligned with the goals of strategic and sustainable freight planning in intermodal networks.
The model allows each origin or destination node to connect to multiple hubs, distributing flows and reducing the risk of overload at any single node. This structure increases operational flexibility and network resilience. Crucially, the model incorporates the full cost structure of intermodal logistics. It includes (i) transport costs based on Janic’s method, accounting for internal and external costs of road and rail; (ii) investment costs for infrastructure deployment; (iii) operating and management costs associated with day-to-day terminal use; and (iv) a feasibility constraint based on NPVsocial > 0, which discards solutions that do not generate positive socio-environmental returns over time. These elements define the scope and logic of the CMAHLP model.
To ground the model in real conditions, we built an intermodal cost matrix using observed distances and calibrated mode-specific cost functions. This quantitative foundation supports hub assignment and enables the testing of plausible network scenarios under current and projected freight patterns.
Hub location models are fundamentally flow-based. Their goal is to optimize hub placement while determining O–D movements [
5], independently of vehicle routing or detailed operations. This focus allows for high-level strategic network design that minimizes global costs while maximizing infrastructure performance. In practical terms, the consolidation of shipments reduces partially loaded trips, lowers the number of direct O–D links required, and improves scale economies. It also enables route flexibility, as cargo can be dynamically rerouted in response to changing conditions—traffic, constraints, or resource availability. While intermediate hubs add a reorganization step, they often reduce total travel time by enabling more direct routing for the final leg. Furthermore, hubs facilitate intermodal transfers—especially among road, rail, and maritime modes—supporting operational efficiency and environmental benefits.
From a graph-theoretic standpoint, an HLP is modeled as a network of nodes (Ns) connected by arcs (As), where each spoke represents a demand or supply node, and arcs correspond to multimodal transport infrastructure. In our case, the network includes ports, inland cities, and provinces as nodes linked by road, rail, and maritime connections. This representation provides the spatial and functional basis for optimizing hub placement and flow assignments within the CMAHLP framework.
The analysis integrates hub allocation and network flow optimization. Hubs are selected not only to reduce the total number of required links but to structure consolidated flows along high-capacity corridors, under modal and capacity constraints. Our study builds on classical CMAHLP logic while addressing operational realism and sustainability gaps. While earlier efforts like [
4] incorporated capacity and infrastructure costs, recent works such as [
6] still fall short in balancing territorial equity, economic viability, and environmental performance.
The model employs a disaggregated and measurable cost structure. Intermodal transport costs are quantified using calibrated mode-specific functions for road and rail, incorporating both internal and external components. Infrastructure investment is derived from observed parameters such as land availability, existing land connectivity, and construction unit costs. Operating costs are driven by three factors: economies of scale, congestion penalties based on convex functions, and storage or inventory capacity. Feasibility is enforced through a Social Net Present Value constraint (NPVsocial > 0, which discards configurations lacking long-term socio-environmental returns based on monetized externalities and territorial performance.
Embedded in the CMAHLP framework, the model serves as a decision-support tool for infrastructure planning under real-world economic, spatial, and environmental constraints. A tailored genetic algorithm explores feasible configurations, combining guided mutation, adaptive elitism, and local search. Beyond cost minimization, it applies filters aligned with operational and policy criteria, eliminating scenarios that generate excessive hub concentration, modal imbalance, or inefficient land use. This ensures that only robust and spatially coherent solutions are retained—those consistent with long-term infrastructure viability and sustainable network development. The model supports a transition toward regionalized, proximity-based logistics systems, reinforcing Spain’s position as a core logistics hub in the EU and a strategic interface with North Africa within the evolving Euro–Maghreb corridor.
3. Advancing CMAHLP for Maritime–Terrestrial Logistics: A Multi-Criteria and Sustainability-Based Perspective
3.1. Methodological Enhancements to Classical CMAHLP Models
The methodology developed in this study expands upon classical CMAHLP formulations by introducing key improvements that address the complexity of real-world maritime–terrestrial logistics systems. Foundational contributions, such as those by [
8,
19] and subsequently [
4,
20], incorporated fixed infrastructure costs and basic capacity constraints, offering critical theoretical grounding. However, such approaches remain limited in their ability to account for spatial heterogeneity, dynamic operational behavior, and socio-environmental feasibility in national-scale planning. The model is specifically designed for port–hinterland systems, where freight flows are increasingly shaped by intermodal corridors, saturation risks, and policy-driven sustainability objectives.
To overcome these limitations, the proposed model adopts a multi-criteria framework that simultaneously optimizes economic efficiency, operational realism, and long-term sustainability. Specifically, it includes the following:
Door-to-door transport costs disaggregated into collection, transfer, and distribution stages, capturing the full logistics chain from unimodal to intermodal operations.
Variable operating costs per hub reflect congestion, scale effects, and inventory management.
Investment costs are adjusted by territorial factors such as land value, connectivity, and urban density.
A hard constraint based on the Social Net Present Value (NPVsocial), ensuring the socio-environmental viability of each hub alternative.
This formulation supports intermodal decision-making under regional asymmetries, emerging logistics corridors, and sustainability mandates, as found in European initiatives like the EU Green Deal and the TEN-T network.
In our case, we aim to spatially locate inland hubs that connect the main terrestrial corridors with four key maritime gateways—Algeciras, Málaga, Valencia, and Barcelona—which channel international freight flows into the hinterland. These port–interiors interactions are central to the model’s intermodal logic. Unlike traditional CMAHLP schemes, such as the center-of-mass approach used by [
4], which assume symmetric systems where the infrastructure cost depends primarily on centrality, our model reflects a more complex reality. Hub viability here is driven by factors such as land availability, multimodal connectivity, local economic context, environmental constraints, and territorial policy incentives.
Similarly, alternative cost structures based on flow-dependent infrastructure needs, while more flexible, still neglect economies of scale, nonlinear operating behaviors, and environmental impact. For instance, they fail to model phenomena such as hub saturation or the cost implications of managing large volumes of cargo over long timeframes.
To address these omissions, our model introduces a dynamic cost term in the objective function that reflects hub operations. At the same time, the classical fixed cost structure from [
4,
7,
21] is redefined through a territorial investment analysis structured around hub-specific land pricing, infrastructure complexity, and projected flow.
Most importantly, we embed a sustainability constraint based on the Social Net Present Value [
22], which evaluates the long-term balance of environmental, social, and economic returns associated with each hub configuration. This allows us to formally include sustainability as a viability condition—not merely as an external indicator.
Net Present Social Value of Hub Selection
The flow allocation constraint ensures that each hub “
l” receives traffic from at least one hub “
k” for every origin node “
I”.
Flow Capacity Constraint (Non-Saturation Condition)
Flow Balancing Constraint
Binary Variable Constraint for Hubs
Flow Positivity Constraint
Flow Conservation Constraint
This methodological proposal constitutes a significant advancement over traditional CMAHLP frameworks by bridging operational, territorial, and sustainability dimensions into a unified formulation. Its novelty lies not in discarding classical structures but in reinterpreting them through the lens of intermodal realism, regional diversity, and long-term feasibility. By embedding environmental and social constraints directly into the optimization logic and calibrating costs from real infrastructure, logistics, and territorial data, the model becomes a practical decision-support tool capable of guiding public and private investment strategies in complex maritime–terrestrial systems like Spain’s. Unlike in most applications, NPVsocial is not evaluated post-optimization but embedded as a feasibility constraint, acting as a hard filter within the solution space.
3.2. Intermodal Freight Cost Formulation for Inland and Port-Connected Nodes
The transport cost formulation implemented in this study builds on the classical three-leg decomposition typical of Capacitated Multiple-Allocation Hub Location Problems (CMAHLP), as defined by [
19] and extended by [
8]. In our case, however, the model is adapted to the operational conditions of a real-world maritime–terrestrial logistics system that spans both inland urban areas and coastal seaports, interconnected via road and rail infrastructure.
Freight Interaction Matrix and Node Typology. The system comprises 47 major nodes across Spain, including inland metropolitan areas, dry ports, and commercial seaports. It also includes strategic nodes like Algeciras, Málaga, Valencia, and Barcelona—ports directly connected to high-capacity rail freight motorways. Nonetheless, the system also includes other key maritime gateways (e.g., A Coruña, Bilbao, Santander, Tarragona, Almeria, Huelva, etc.), ensuring intermodal and territorial diversity. All nodes, however, are treated as logistically equivalent in terms of origin–destination flow potential, regardless of port status. This ensures that the model does not introduce structural biases favoring coastal over inland regions.
Three-Leg Decomposition of Generalized Transport Cost. The cost for freight flow from origin node “I” to destination node “j” through hubs “k” and “m” is decomposed into collection, inter-hub transfer, and distribution legs. This formulation maintains classical structure while enabling calibration under real territorial and modal conditions.
where
Cik, Ckm, Cmj: cost of each leg (collection, inter-hub transfer, and distribution).
χ, α, δ: Cost multipliers for collection, transfer, and distribution legs, respectively.
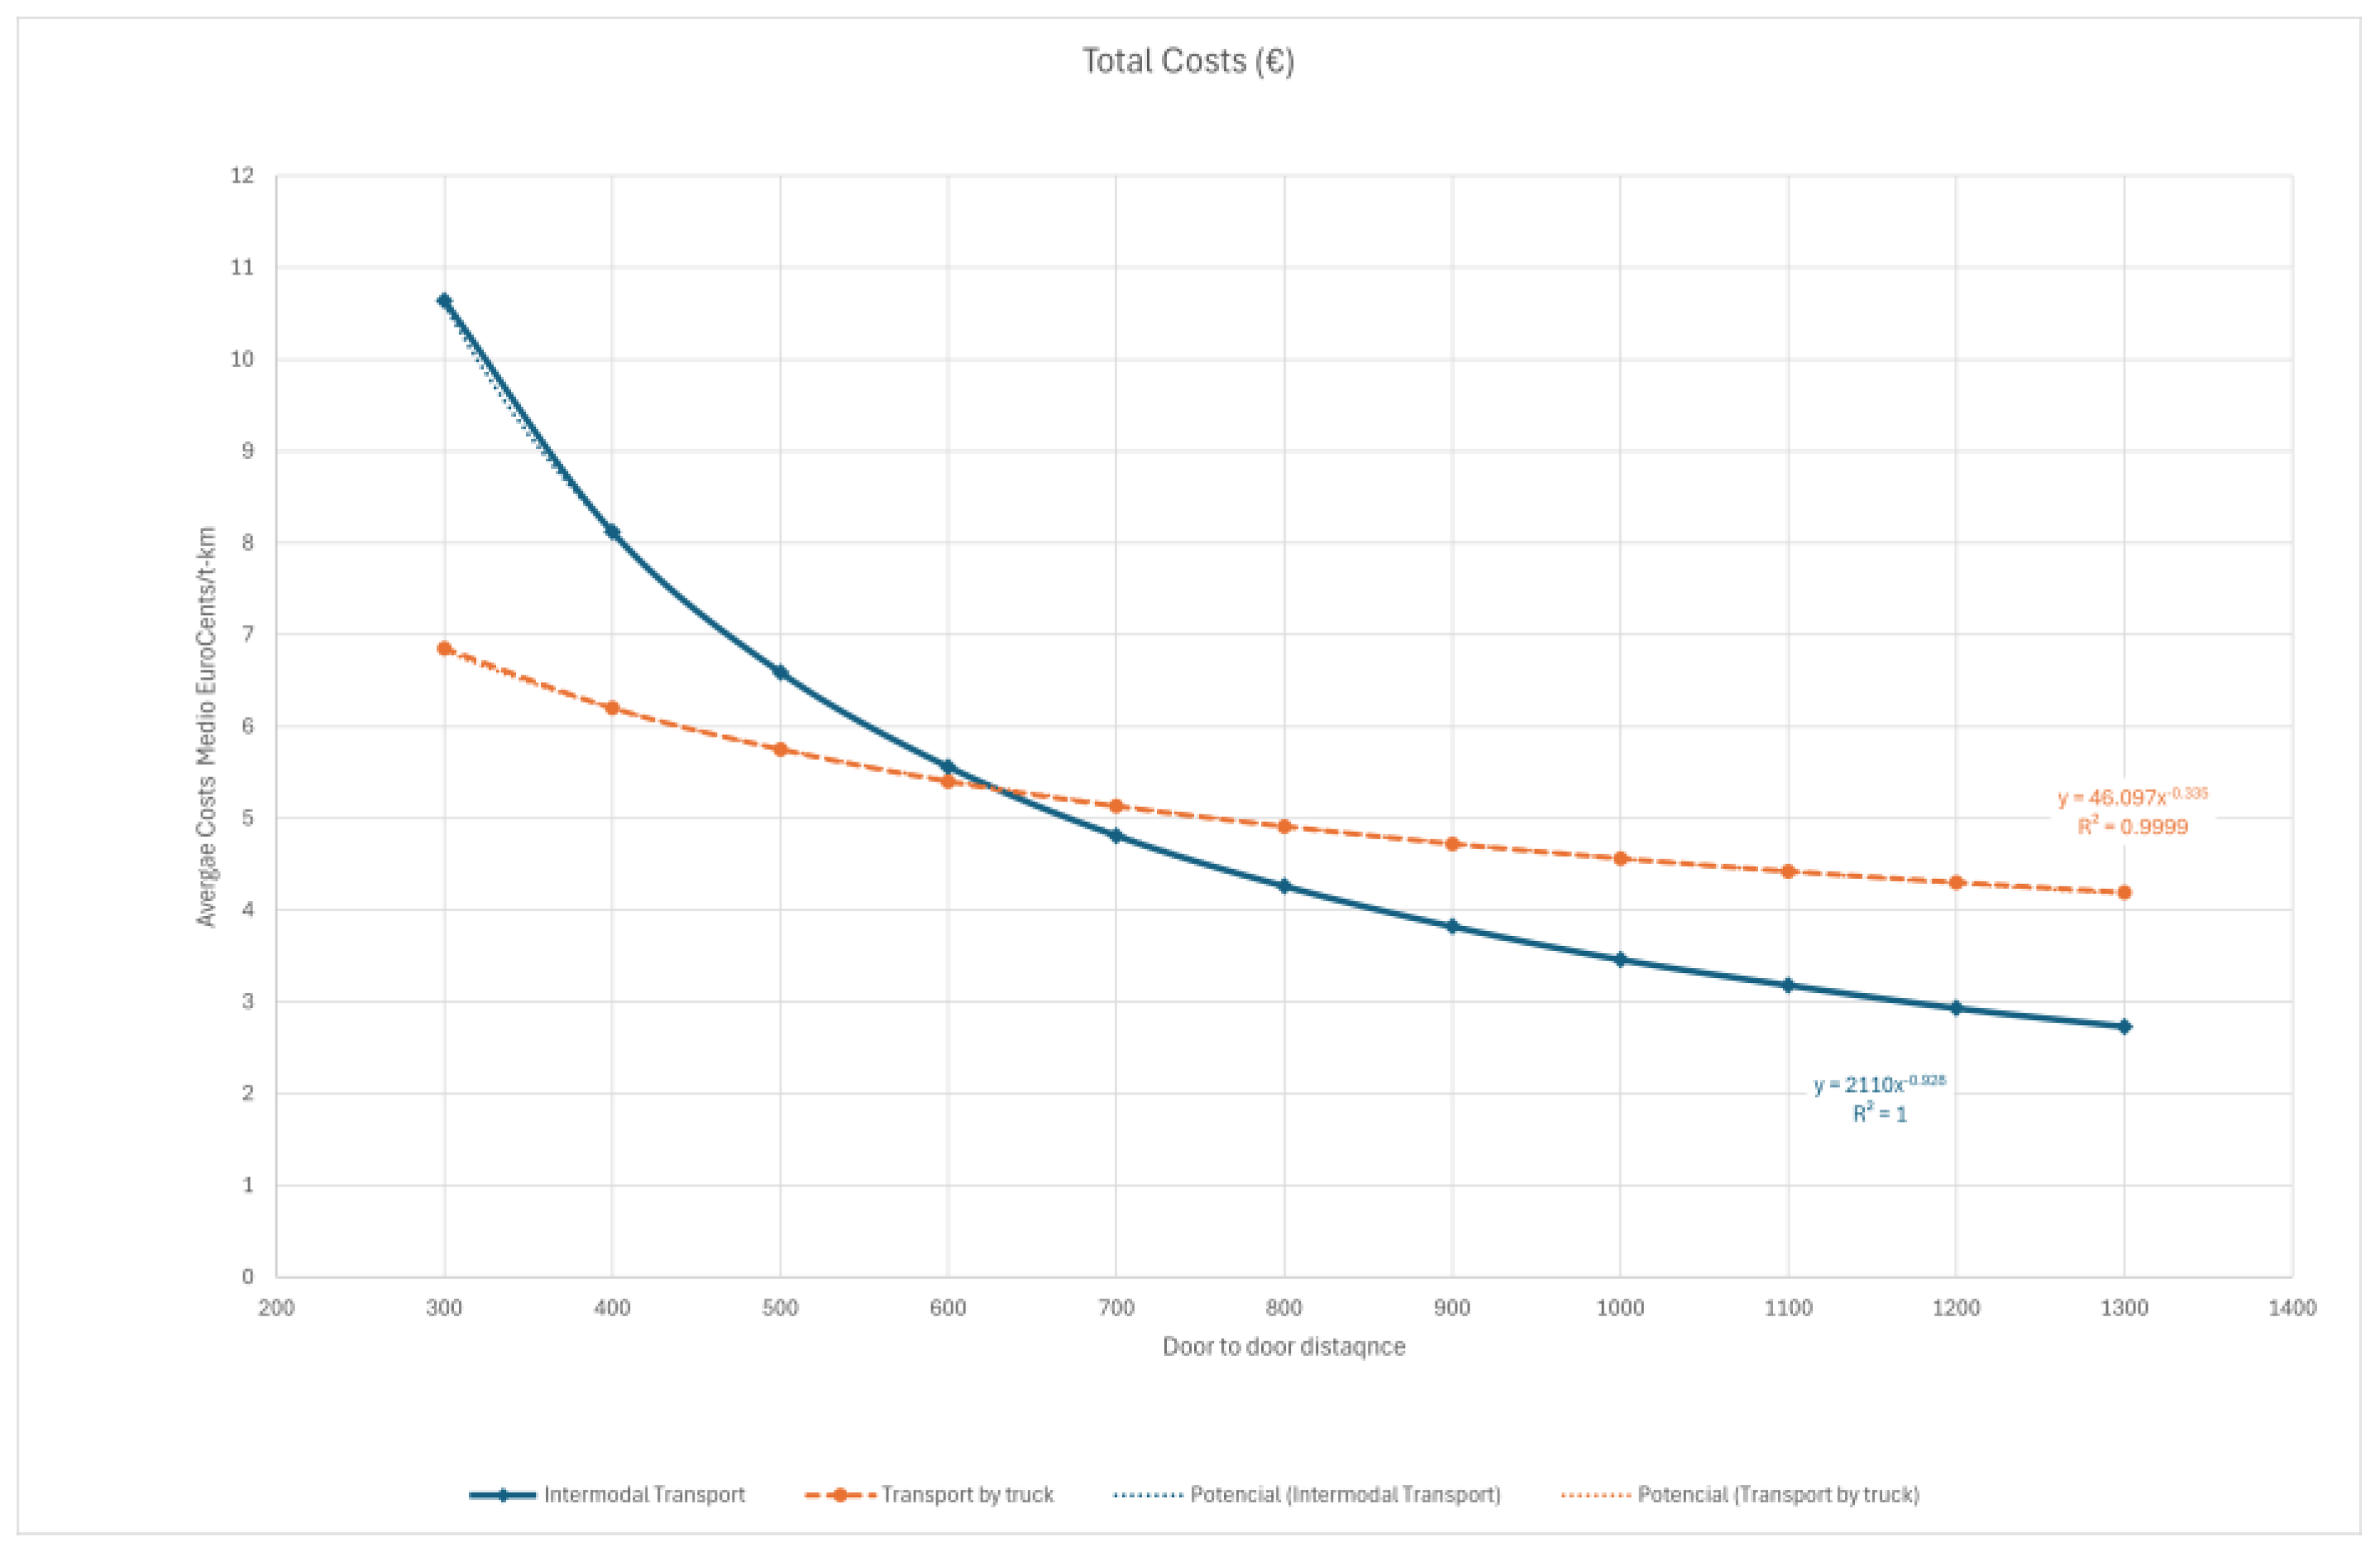
Mode Selection Logic for Road–Rail Competitiveness. To accurately represent inland mode competition, the model includes a binary selection mechanism that compares generalized costs of road and rail transport for each O–D pair. The transport cost C
ij between any two nodes is calculated as:
where
Costroad = Dij ∙cr.
Costrail = Dij ∙cra + rail terminal fee.
: accounts for port-side handling and pre-haulage, capturing operations such as container loading, storage, and administrative processing.
This formulation does not merely reflect cost differences; it reveals strategic corridors where rail may outperform the road, especially when connected to ports with dedicated freight infrastructure.
Figure 1 shows that beyond 550–600 km, intermodal transport becomes cost-competitive with full-road haulage, reinforcing the strategic role of long-distance corridors connected to rail-accessible ports. Parameter values and assumptions used in cost matrices are provided in
Appendix A.
This structure is based on the generalized intermodal cost models proposed by [
23,
24], both of which have been validated for capturing trade-offs in freight mode selection under cost-competitive conditions. The transport cost matrix is derived from:
Real intercity distances Dij for all node pairs.
Mode-specific cost coefficients Cr and Cra and port-specific terminal charges.
Fixed handling charges for each seaport node with multimodal infrastructure.
This cost formulation, while not explicitly modeling maritime legs, is particularly relevant for port authorities and logistics planners seeking to optimize inland freight distribution from coastal gateways under real intermodal conditions. By focusing on terrestrial transport costs—including both road and rail—from a full set of national logistics nodes (comprising cities and ports), the model captures the inland continuation of seaborne freight flows without distorting the relative accessibility of inland hubs. This is especially applicable in cases such as Algeciras, Málaga, Valencia, and Barcelona, which are connected to key hinterland hubs via dedicated rail corridors.
This transport cost structure enables a robust evaluation of inland and coastal hubs based on their multimodal performance rather than geographic centrality alone. It supports comparative scenario testing on modal shifts, intermodal competitiveness, and port–hinterland integration. In this way, it aligns with the key objectives of the EU Green Deal and TEN-T corridors, reinforcing the relevance of intermodal planning for Spain’s southern logistics arc.
While the model remains generalizable, its structure is particularly tailored for intermodal logistics systems with dense port–hinterland interactions—such as those found in Spain—where maritime gateways and inland hubs are increasingly integrated through rail corridors, pre-haulage services, and logistics activity zones. Its full calibration and national application, including port–hinterland dynamics, are described in the Results section.
3.3. Dynamic Operating Costs ()
A new term is introduced to incorporate operating costs for each hub in the network (), allowing for a more realistic representation of the relationship between hub capacity and its effective utilization. It is important to note that operating and maintenance costs can exceed the annual amortization of infrastructure in most dry ports or logistics activity zones. These costs depend on factors such as economies of scale, overcapacity analysis, and storage and inventory management costs, which vary according to the operational characteristics of each hub.
This dynamic formulation captures the nonlinear cost behavior arising from freight flows and their spatial concentration, improving the model’s accuracy compared to traditional cost models based on fixed infrastructure parameters [
4,
8,
13].
Economies of scale are represented by a logarithmic function that adjusts costs based on hub capacity and processed demand. As a hub manages a higher traffic volume, it benefits from lower unit costs due to operational efficiency and better infrastructure utilization. The relationship between hub capacity and managed demand introduces an adjustment coefficient, reflecting the accumulated experience of the node, ensuring that costs are lower for high-capacity hubs with a more extended operational history [
25].
where
is an adjustment coefficient,
ϵ is a stability parameter that prevents indeterminacies, and
dk represents the demand processed by hub “k”.
The overload penalty is introduced to capture the negative impact of hub saturation. In this sense, when demand is close to exceeding the assigned capacity, the system imposes an additional nonlinear cost, progressively increasing the penalty as congestion intensifies. This pattern reflects the rise in waiting times, resource congestion, etc., and reduced efficiency when a hub operates beyond its optimal capacity. The penalty function is convex, incorporating a sensitivity parameter that controls the severity of the penalty, allowing for calibration based on the actual impact of congestion on logistics performance. The effect of congestion on hubs has been extensively studied in optimization models, where it has been demonstrated that including nonlinear congestion costs improves system stability and efficiency, preventing the oversaturation of key nodes [
15].
This method penalizes already congested hubs and discourages the selection of hubs that are close to their capacity limit. Anticipating congestion issues before they occur enhances model stability and prevents network collapse due to congestion in future iterations [
26].
Storage, management, and inventory maintenance costs reflect the impact of accumulated flow in hubs and the necessity of efficiently managing logistics resources. These costs can represent a considerable proportion of total logistics expenses [
27]. Due to the operational nature of logistics hubs, storage costs increase with the volume of cargo processed. However, the relationship between these costs and demand is not linear, as hub infrastructure allows for the absorption of a specific volume without proportionally increasing expenses [
28]. To capture this dynamic, we propose an adjustment coefficient that models the impact of storage as a function of hub capacity and managed cargo volume.
where
is an adjustment coefficient that captures the effect of storage on operational costs.
Unlike the geographic centrality model of [
4], the proposed approach defines hub roles based on operational management principles, consistent with recent formulations that incorporate dynamic capacity management and load-balancing approaches [
6,
16]. The cost structure reflects capacity utilization, operational efficiency, economies of scale, and marginal cargo handling costs within the intermodal logistics network; but rather on the operational management of hubs, we redefine the concept to align it with the actual cost structure in a system based on capacity, operational efficiency, economies of scale, and the marginal costs of the cargo handled at each hub within the intermodal logistics network.
Where
represents the economic impact of hub allocation within the network and allows for the adjustment of logistics costs by considering transportation, storage, and efficient distribution.
I0 represents the average infrastructure-related cost per hub across the network. It aggregates total transport costs, inter-hub transfer penalties, and fixed storage investments, normalized by the number of active hubs (
Nh). This value adjusts operational costs at the hub level. The numerical values and calibration parameters used for the operating cost are listed in
Appendix A.
3.4. Investment Costs ()
A realistic analysis of investment costs is crucial when evaluating hub location alternatives within an intermodal transport network. Many decisions are influenced by logistical needs and budgetary constraints, land availability, environmental and social factors, and return on investment considerations.
In line with [
29], the model defines investment cost as a combination of two key components: the market value of land at each candidate location and the associated infrastructure construction costs. The base cost is then adjusted by a pricing structure that reflects both the hub’s projected capacity and its level of territorial accessibility, following the approaches of [
30,
31].
where
Land area required for hub k.
ase land price in the reference region where hub k is located.
Dk: Accessibility and urban development coefficient for hub k.
: Coefficient that adjusts the influence of location on land price.
: Scaling factor for hub size.
: Base infrastructure cost.
: Total expected flow at hub k.
: Capacity of hub k.
This structure reflects the dual nature of hub-related investment: it penalizes sites with poor accessibility or high land cost while also incorporating economies of scale in infrastructure construction, ensuring that cost estimations are adapted to real spatial conditions. The model enables both the technical assessment of candidate hubs and their economic prioritization for national infrastructure investment planning. This approach is particularly suited to contexts with significant regional asymmetries and multimodal transport constraints, such as Spain. The numerical values and calibration parameters used for the investment cost are listed in
Appendix A.
3.5. Analysis of Environmental and Social Aspects (NPVsocial)
Traditionally, hub location models have assumed fixed costs or simplified initial investment considerations, which may induce structural biases during the optimization process. Since hubs require significant initial investments and have long-term impacts, adopting a methodology that incorporates economic, social, and environmental factors into their evaluation is essential.
The Social Net Present Value (NPV
social), as proposed by [
22], is an essential tool for evaluating infrastructure and transportation projects. It differs from Financial NPV, as defined by [
32], in that it considers not only financial costs and revenues but also social, environmental, and economic costs and benefits, discounted over time. Its objective is to determine whether a project generates a net positive benefit for society, ensuring that decisions align with social welfare and sustainability.
This procedure allows for selecting hubs with greater long-term sustainability, integrating macroeconomic factors into optimizing logistics infrastructure. Since long-term social and economic benefits can offset operational and investment costs, we have not directly incorporated the Social Net Present Value into the cost minimization function (1). Instead, we introduce a constraint that ensures that the selected hubs have a net positive impact (2).
Thus, as a design criterion for evaluating each set of candidate hubs, we incorporate investment, operational, and transportation costs and environmental and social impacts. This allows for decision-making that aligns with market realities and public policies on sustainable development, ensuring that hub location and operation are optimized in terms of cost efficiency and their long-term impact on the population. Our approach treats sustainability not as a post hoc metric but as a binding criterion that guides the solution process, embedded directly into the optimization logic. It serves as a feasibility condition that shapes the solution space and redefines what is considered an admissible logistics network.
where
: Investment in hub k infrastructure, including land acquisition and construction costs.
: Time horizon in years.
: Expected annual benefits.
: Annual environmental and social costs of hub k.
: Annual operational costs of hub k.
: Discount rate, derived from Ramsey’s Rule.
In the analysis of environmental and social costs associated with hub management, several impact factors are considered, including greenhouse gas emissions, land use intensity, ecological conservation, and effects on population quality of life, the numerical values and calibration parameters used for the analysis of environmental and social aspects are listed in
Appendix A:
where
: CO2 emissions generated by the construction of hub k.
: Ecosystem impact and biodiversity loss in the area where hub k is located.
, : Environmental penalty coefficients.
: Population affected by the operations of hub k.
: Cost associated with the quality of life of the population affected by hub k.
Each hub candidate is required to achieve a positive social return, assessed through a net present value calculation that accounts for environmental penalties, operating expenses, and externalities over a 20-year horizon, as defined in Equation (17). In practice, each configuration is evaluated using independent indicators: unit logistics cost (EUR/t), environmental impact coefficients, NPVsocial, and flow distribution entropy. This approach supports comparative scenario testing under spatial and operational constraints rather than relying solely on aggregate cost minimization.
3.6. Genetic Algorithm for Solving the CMAHLP with Sustainability Constraints
Hub location problems involve optimizing the structure of transport and distribution networks to minimize cost and improve connectivity. Due to their combinatorial nature, these problems are NP-hard, and solving them exactly becomes unfeasible in real-world scenarios with many nodes and constraints. For this reason, heuristic and metaheuristic approaches are used to obtain good solutions within reasonable computation times.
The model applies a genetic algorithm (GA) to identify suitable hub locations, minimizing not only transport and infrastructure costs but also operating expenses. In parallel, it evaluates the social and environmental implications of each configuration over the long term. During the initial phase of this work, we evaluated alternative solution strategies, including Harmony Search and Tabu Search, to test the robustness and versatility of different metaheuristics. Harmony Search produced fast but repetitive and structurally limited outputs, while Tabu Search, although more flexible, showed high sensitivity to initialization and instability under capacity constraints. Based on these preliminary tests, the Genetic Algorithm was selected as the core optimization engine due to its consistent convergence behavior, structural diversity, and adaptability to capacity, intermodality, and sustainability constraints. This choice is further detailed in the extended thesis version, which includes a comparative analysis of all three methods.
The selection of K-Means clustering over alternatives such as Density-Based Spatial Clustering of Applications with Noise (DBSCAN) or hierarchical clustering was based on three critical factors. First, its computational scalability ensures efficient initialization even in medium-sized national networks like Spain’s 47-node topology, where hierarchical approaches show combinatorial growth. Second, K-Means enables reproducible centroid initialization using fixed random seeds—an essential feature for institutional benchmarking and auditability in EU impact assessments. Third, its explicit minimization of intra-cluster distances enhances topological coherence, a key determinant of early-stage algorithm stability and convergence efficiency. In test scenarios, this initialization strategy consistently reduced the number of generations required to reach viable configurations, validating its suitability for CMAHLP applications where spatial structure and policy alignment are equally relevant.
Complementarily, a random initialization procedure was implemented to diversify the initial population. This routine ensures that each individual contains exactly the predefined number of hubs by randomly selecting a subset of nodes and enforcing binary constraints. While less topologically refined than clustering-based initialization, this mechanism enhances structural diversity and avoids early convergence—particularly relevant when exploring large or multimodal solution spaces.
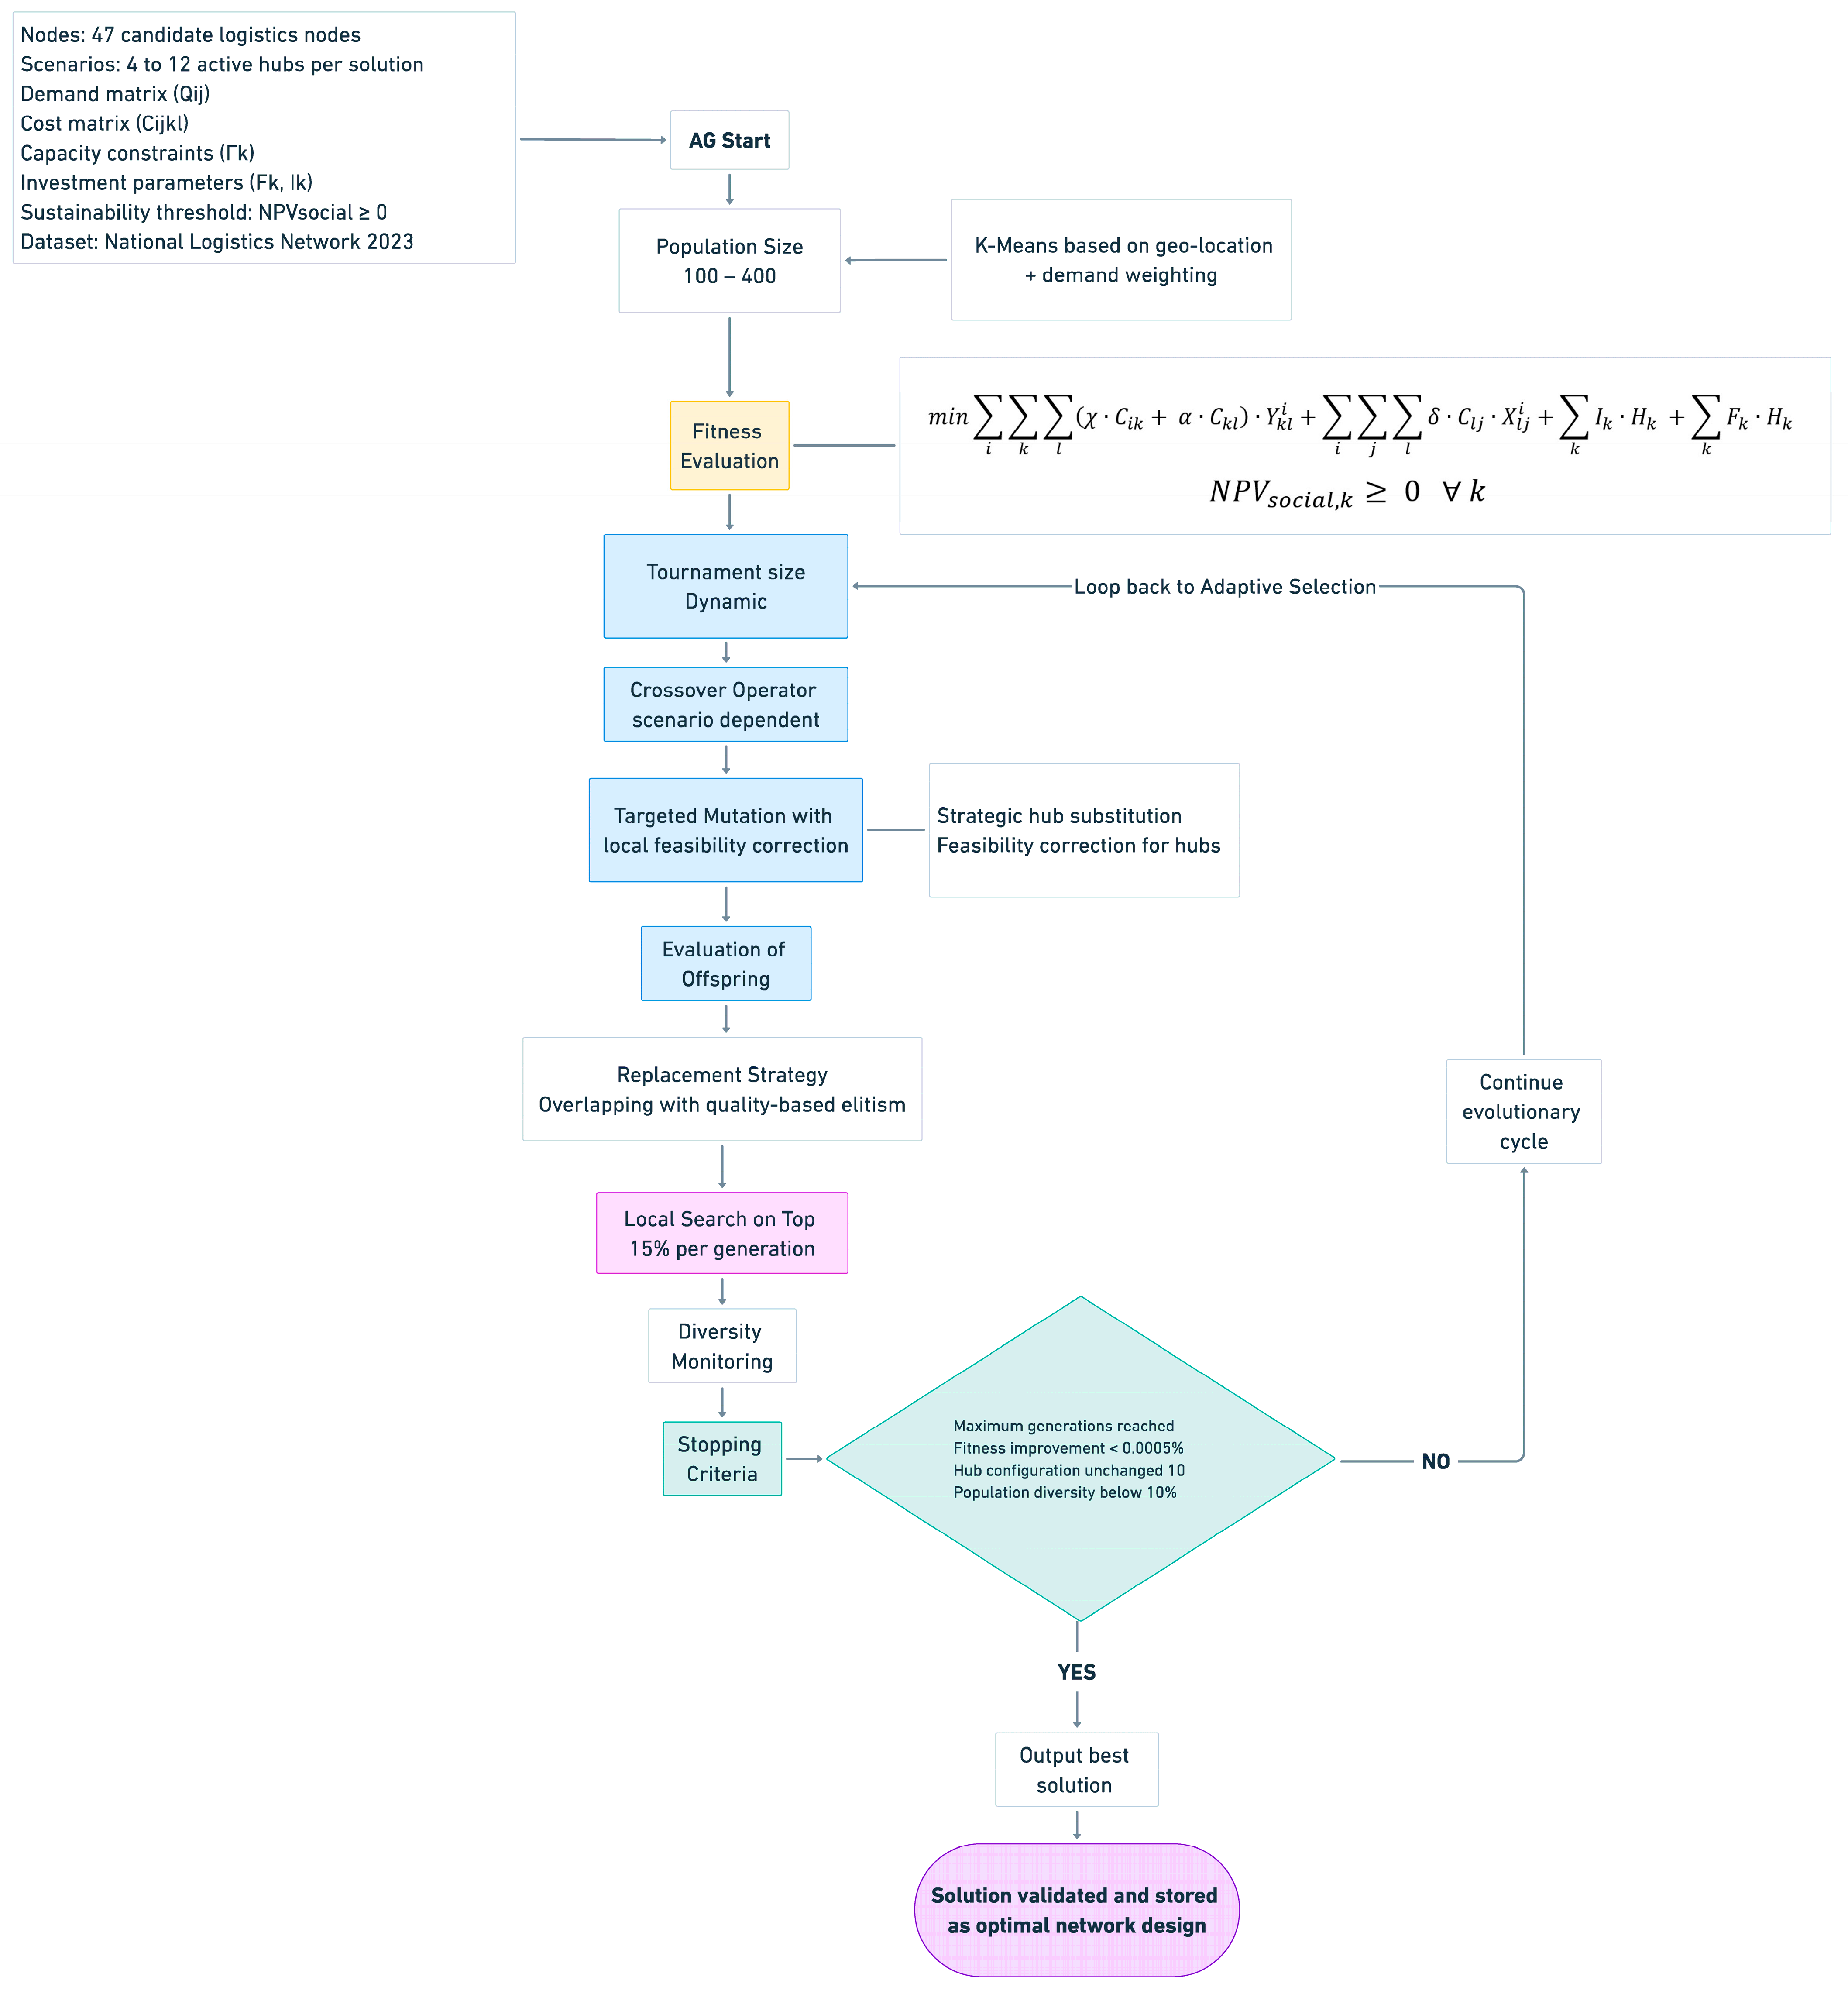
The evolutionary cycle begins with an initial population of hub configurations derived from K-Means clustering, ensuring spatial consistency. Each generation proceeds by evaluating solution fitness, selecting the best individuals, applying crossover and targeted mutation, and conducting a local search on the top-performing solutions. Feasibility corrections ensure that all configurations respect cost, capacity, and NPVsocial thresholds. Periodic reintroduction of diversity helps escape local optima. The cycle iterates until convergence criteria are met or the maximum number of generations is reached.
These techniques have been successfully applied to a wide range of problems, including combinatorial optimization for packing goods of different sizes into the fewest possible containers; task scheduling with limited resources over a time horizon; vehicle routing optimization to minimize transportation costs and delivery times; multi-criteria analysis for inventory classification; and logistics network design without capacity constraints, where transportation costs are based on the distance between customers and service centers [
33,
34,
35,
36,
37]. In this research, the genetic algorithm is adapted to the CMAHLP problem, integrating multiple objectives and logistical constraints that require complex solution structures and a high evolutionary exploration capacity.
According to [
38], a genetic algorithm consists of a series of key steps that enable its function as an iterative optimization mechanism. In this study, evolutionary configurations with a number of generations ranging from 100 to 800 were tested, adapting the population size to 50% of the total generations. This proportional relationship guarantees a balance between initial diversity and the convergence capacity. The most efficient configuration was identified at 300 generations and 150 individuals. The process begins with generating an initial population [
39], where each individual represents a specific hub configuration within the network. This initial selection is performed randomly, based either on clustering strategies (K-means) or prioritization according to the intensity of logistic flow [
40]. This initialization phase allows the population to be structured from the outset in a topologically coherent manner, avoiding the random dispersal of inefficient solutions.
Each individual is evaluated using a fitness function, which measures its quality as a solution. According to [
41], the fitness function indicates the suitability for deciding which individuals will be selected for reproduction and selection processes. This function integrates a multi-criteria objective, composed of operational costs (I
k); investment costs (F
k); transportation costs (C
i,j); and an analysis of Social Net Present Value (NPV
social), incorporating Ramsey’s Rule (1928) and the improvements of [
42] to reflect the intertemporal impact of environmental and social costs and benefits.
To initialize the population, the K-Means clustering algorithm, as formalized by [
43], was employed to pre-select initial hub locations. The K-Means algorithm was applied to the spatial coordinates of the nodes in two benchmark scenarios: the classical dataset of CAB [
4,
7] and the Spanish case with 47 nodes.
For both the reference dataset and the Spanish case, the number of clusters was fixed to match the number of hubs specified in each scenario. A constant random seed was applied to guarantee reproducibility in centroid initialization, and several independent K-Means runs were conducted to verify the consistency of node allocation across cluster partitions. This ensured a coherent and unbiased initialization of the population for the genetic algorithm. Beyond reproducibility, this spatial clustering approach allows the algorithm to start from a set of territorially consistent solutions, improving early-stage stability and reducing the number of generations required to reach competitive results, as noted by [
44].
Previous studies by [
45] have demonstrated that the appropriate selection of initial centers in K-Means improves algorithm stability and prevents convergence to suboptimal solutions. The initialization process begins with extracting the spatial coordinates of the network nodes. K-Means is then applied to cluster the nodes into a predefined number of groups, determined by the number of hubs to be selected. A fixed random seed and multiple replications are used to improve the stability of cluster assignments, following the methodology recommended by [
46].
Once the clusters are defined, each initial hub is selected as the node closest to the centroid of its corresponding group. This selection is carried out by computing the Euclidean distance between each node and its cluster centroid, choosing the one that minimizes the distance. This method, commonly used in clustering-based optimization, has been validated in previous works such as [
44]. This technique ensures that each initial hub occupies a geographically central position within its cluster—maximizing topological representativeness; its application has demonstrated stable and efficient results both in the Spanish national network and in Ebery’s theoretical model, validating its suitability for initializing logistics networks with a heterogeneous territorial distribution.
This way of selecting initial hubs based on cluster centroids makes the first solutions more consistent with the real structure of the network. In both models, it helped reduce the number of generations needed to reach stable configurations and kept computation times under control. This benefit, highlighted by [
45], reinforces the role of centroid-based initialization in accelerating convergence.
The evolutionary process begins with a dynamic tournament selection mechanism, in which solutions with lower objective function values are more likely to be retained. Tournament size varies across generations: large tournaments are used in the early stages to promote exploration, and progressively smaller tournaments are used to intensify exploitation in later stages [
47]. This scheme allows selective pressure to be controlled and has proven effective in the evolution of CMAHLP configurations with multiple hubs.
Next, a uniform crossover operator is applied, allowing the exchange of information between selected solutions. This operator assigns each offspring gene the value of one of the parents with equal probability, promoting a diverse combination of characteristics [
48]. The crossover probability has been calibrated in the range 0.75 and 0.85, selecting the 0.85 value as optimal due to its capacity to generate diversity without compromising the stability of solutions in intermediate phases of the evolutionary process.
To prevent a common issue in this type of crossover, where solutions might have too many or too few active hubs, a verification step ensures that each resulting solution has exactly the required number of active hubs. If there are too many, they are deactivated randomly; if there are too few, nodes with high connectivity are activated instead. This technique maintains the structural validity of the generated solutions [
49].
Subsequently, a directed mutation process is introduced, replacing hubs to evaluate alternative configurations (genetic diversity) while maintaining feasibility. This prevents premature convergence by maintaining variability within the population, enabling the exploration of previously uncovered regions in the search space and correcting missing hubs [
50]. During the calibration phase, mutation probabilities between 0.20 and 0.40 were analyzed, the 0.40 value showing the best performance in terms of topological diversity without compromising the quality or stability of the solutions.
After applying the selection, crossover, and mutation operators, the fittest individuals are chosen to form the next generation. This replacement phase is critical for the gradual improvement of the population, ensuring that solutions tend to improve over time [
51]. To improve the quality of solutions, an intensive local search is applied to the top 1% of performing individuals in each generation. This search consists of carrying out controlled exchanges of active hubs and analyzing their impact on the objective function, allowing promising configurations to be fine-tuned without altering the global population. This exploitation phase allows the algorithm to fine-tune promising configurations, improving their fitness without altering the population globally.
To mitigate premature convergence, a diversification mechanism is introduced; in this sense, every 50 generations, the bottom 10% of the population is discarded and replaced with entirely new individuals generated through random initialization. This mechanism has been useful for avoiding deadlocks in scenarios with a larger number of hubs. At the same time, it introduces additional evolutionary pressure without sacrificing structural diversity. Its periodic execution allows the algorithm to escape local optima. This injection of novel genetic material promotes structural diversity and helps the algorithm escape local optima, as suggested by the foundational principles of evolutionary computation [
38].
Some of the mechanisms, including directed mutation, local refinement, or hub correction, help the algorithm converge faster in most scenarios. The model keeps operational constraints under control while exploring better cost configurations step by step. If any hub gets close to capacity, the system shifts part of the flow to nearby nodes with room to absorb it. This prevents saturation and helps keep the network stable, especially when demand is not evenly distributed.
Finally, a stopping criterion is implemented [
39], where the process continues for a predetermined number of generations or until improvements in the objective function become marginal. The primary stopping criterion is set at 300 generations, although the algorithm considers an additional convergence condition when no changes in the selected hubs or significant cost improvements are detected over several iterations.
At the end of the process, the best solution represents the optimal hub configuration within the logistics network, ensuring a positive social net present value (NPV
social) while minimizing transportation, operational, and construction costs. Local search is applied to the top 15% of individuals in each generation, evaluating controlled swaps between active and inactive hubs to refine solutions without altering the overall population structure. To prevent premature convergence, every 30 generations, about a third of the population is replaced with new individuals generated at random. This refresh allows the algorithm to keep exploring alternative configurations and avoid falling into local optima, which contributes to generating more balanced and robust solutions, especially in scenarios with many hubs. Parameter values and assumptions used are provided in
Appendix A.
Figure 2 outlines the main evolutionary cycle of the proposed algorithm, including initialization, adaptive selection, scenario-based crossover, feasibility-enforcing mutation, local search, and stopping criteria.
3.7. Validation and Comparison of the Proposed Genetic Model Against the Ebery et al. Model
This section presents the implementation results of the proposed Genetic Algorithm (GA) applied to the Capacitated Multiple-Allocation Hub Location Problem (CMAHLP). To evaluate its performance under standard conditions, we developed a specific GA version calibrated to reproduce the cost logic and capacity rules of the formulation by [
4], as used in classical benchmarks such as the CAB dataset. Although this heuristic has become a widely cited reference, its structure presents notable limitations in terms of capacity realism, flow flexibility, and sustainability integration. As discussed in
Section 2, we do not adopt it as a theoretical foundation but rather as a comparative baseline. Our complete model presented in
Section 3 incorporates a more advanced GA design, including dynamic operating costs, guided mutation, flow redistribution, and a feasibility constraint based on the Social Net Present Value (NPV
social), aligning the hub selection process with broader public policy and territorial balance goals.
The dataset employed corresponds to the classical CAB model, originally proposed by [
7] based on intercity traffic data from the U.S. Civil Aeronautics Board. This benchmark is widely recognized for evaluating hub location formulations and remains valid for comparative purposes. In this study, we solved instances of n = 10, 15, 20, and 25 nodes, exploring different values of the transshipment discount factor α ∈ {0.2, 0.4, 1.0}. The GA was configured with a population of 150–400 individuals, 300–800 generations, 85% crossover, 40% mutation, and periodic diversity reintroduction (30% every 30 generations). A local search phase was also included for the top 15% of individuals per generation. Unlike exact methods, whose application becomes computationally limited at larger scales or when nonlinearities are introduced, this heuristic framework supports scalable, constraint-aware optimization under realistic operational behavior.
Table 2 summarizes the comparative results between the original heuristic proposed by [
4] and the Genetic Algorithm developed for this study, applied to the CAB dataset. For each instance (n = 10, 15, 20, 25), and under different values of the transshipment discount factor α, both the total cost and selected hubs are reported. The percentage variation column quantifies the cost deviation—or
gap— of the GA relative to Ebery’s results, calculated as:
Additionally, the table includes the elapsed computation time for each model. The GA shows a significant advantage, particularly in medium and large instances. For cases with 15, 20, or 25 nodes, the GA consistently reduces runtime by more than 70%, even when accounting for its increased complexity. For example, in case 25d2 (α = 0.2), the GA solves the problem in 7.27 s versus 493.77 s in the reference model—an improvement of over 98%. These results highlight the GA’s capacity to offer efficient, scalable optimization under real-world constraints.
Based on the results obtained, the Genetic Algorithm (GA) achieves solutions that are, in most cases, equivalent in terms of cost efficiency, with a deviation margin generally below ±4% compared to the values reported by [
4].
Beyond these quantitative comparisons, a structural analysis of the results is presented in
Figure 3, offering visual insights into hub location behavior, flow distribution, and solution robustness.
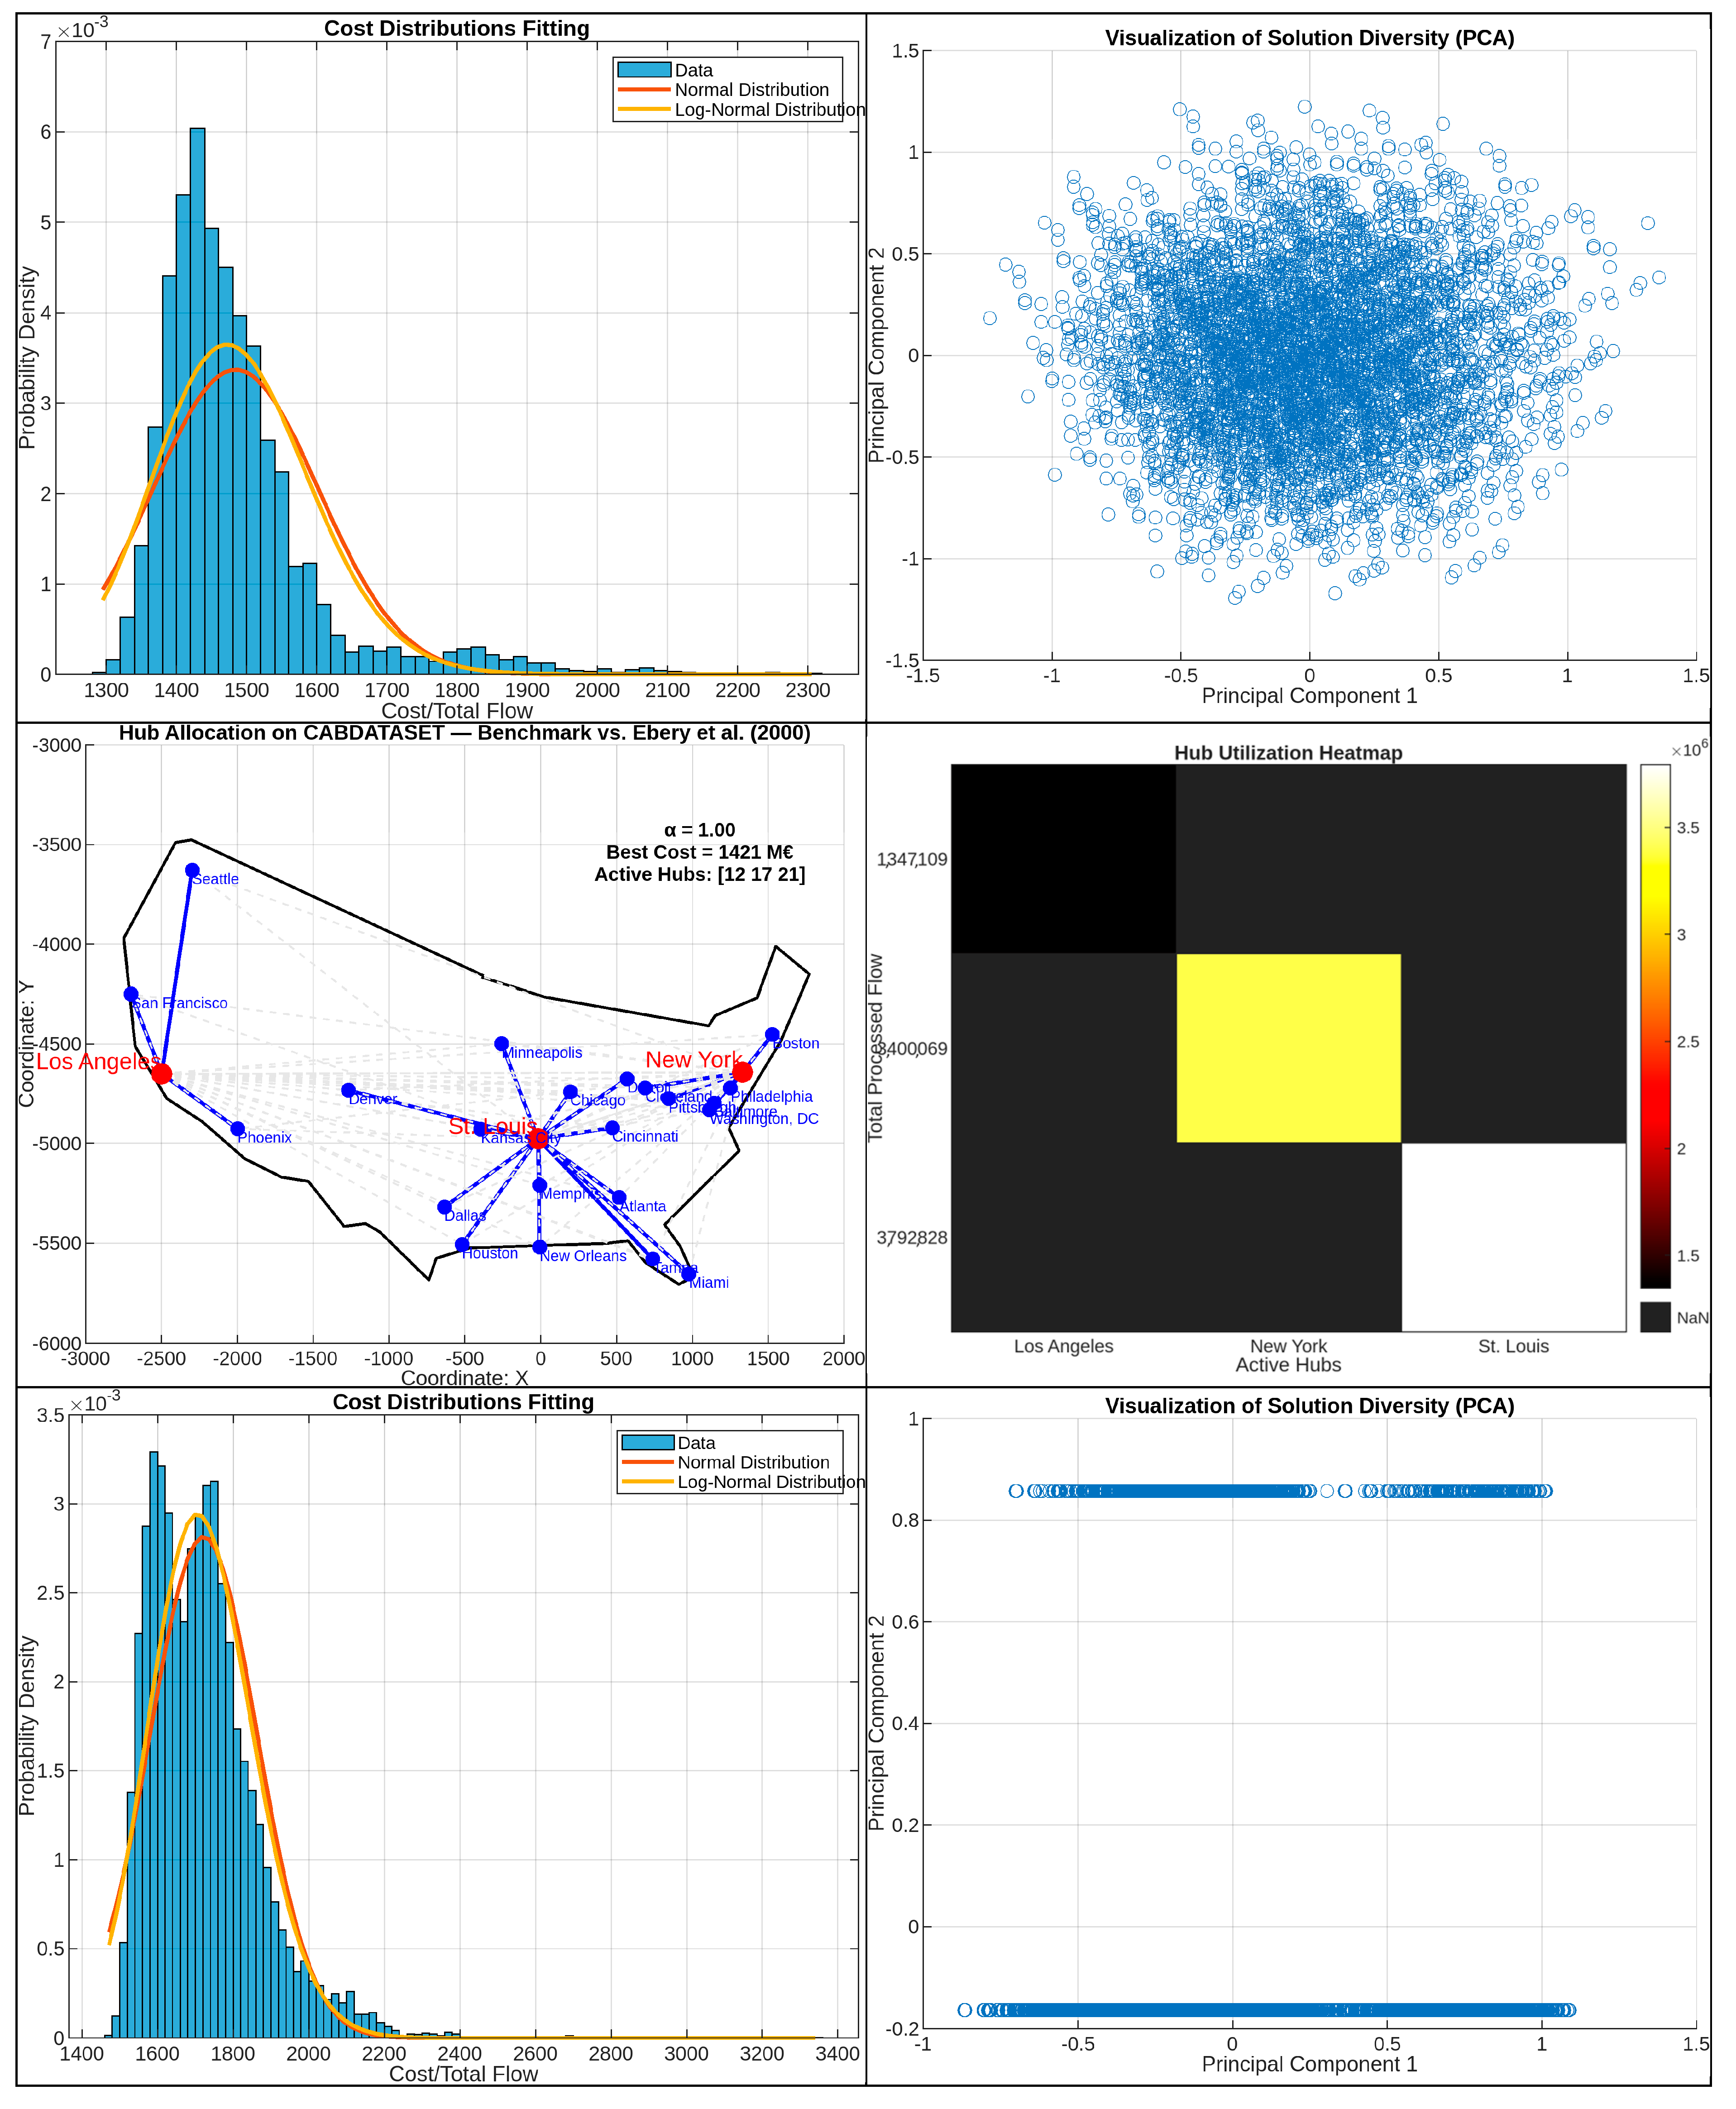
Figure 3 presents the structural analysis of the hub configurations derived by our Genetic Algorithm when solving the classical CAB dataset under different scenarios. Contrary to
Table 2—which offers a numerical comparison with the benchmark by [
4]—this figure focuses entirely on original results obtained through our model.
The figure includes multiple visual components to facilitate the interpretation of the behavior and outcomes of the proposed algorithm. The topological maps (left column) display the spatial distribution of active hubs (highlighted in red) and the dominant connections from each demand node (in blue). These connections correspond to the hub that receives the highest volume of flow from each spoke and thus allow us to identify nodes with High Local Centrality—an original concept introduced in this work. This represents an understanding of how logistical influence zones form and evolve under different scenarios.
Additionally, flow heatmaps (top right) visualize the transshipment volume processed by each hub, indicating their load and strategic relevance within the network. In parallel, the histograms (middle section) present the distribution of total cost values observed across generations, with fitted curves to capture the statistical behavior of convergence. Finally, diversity plots (bottom right) show the spread of top-performing solutions in the principal component space, highlighting the ability of the GA to maintain exploratory capacity and avoid local optima.
The graphical outputs in
Figure 3 serve as more than just visual complements to the numerical results—they provide direct insight into the algorithm’s behavior. By representing the most frequent node-to-hub assignments, the volume handled by each hub, the cost distribution across generations, and the diversity of top solutions, we can verify whether the model behaves consistently with the expected logic: balancing flows, adapting to capacity, and maintaining exploratory capacity throughout the process. This perspective is essential not just to assess efficiency but to evaluate the robustness and consistency of the proposed configurations.
The results discussed here complement the numerical outcomes summarized in
Table 2 and give structure to the discussion of how the Genetic Algorithm performs in benchmark settings under real-world conditions.
In most instances, both models arrive at very similar hub configurations. When differences do appear, they are usually linked to how the GA reallocates flows and manages capacity limits, which makes the system more flexible under uneven demand conditions.
Looking at the spatial distribution of hubs where the two models diverge, a clear pattern emerges. Ebery’s heuristic often selects nodes with high historical assignment frequencies, which reinforces positions previously considered dominant. This behavior corresponds with a selection process based on fixed costs and probability-driven prioritization.
In contrast, the GA determines hub locations through a territorially adaptive process that integrates cluster-based initialization and capacity-aware evaluation. Rather than favoring conventionally dominant hubs, the algorithm identifies alternative nodes that may yield superior performance in terms of both cost and flow distribution, particularly in less saturated areas.
The selection phase in the GA leverages K-Means clustering to partition the network space and assign hubs based on proximity to cluster centroids. This differs from Ebery’s approach, which builds hub assignments primarily through fixed-cost heuristics and capacity filtering, followed by a local exchange routine aimed at refining the solution quality through marginal cost improvements.
In case 20c4, the GA selects Baltimore, Memphis, and Phoenix instead of the more central hubs identified by [
4]. This configuration distributes flows more evenly across the network and avoids excessive concentration. In case 10d4, Ebery assigns node 4 as a hub, whereas the GA selects node 9. Since node 4 has a higher historical selection probability, this difference reflects Ebery’s tendency to favor statistically dominant nodes, while the GA emphasizes territorial balance. A similar pattern appears in case 15d2 (α = 0.2), where the GA includes node 5 (Denver), while Ebery again selects node 4. The proximity between both nodes confirms that the GA refines hub positioning within local ranges rather than proposing disruptive or inefficient alternatives.
The genetic algorithm reallocates flows based on available capacity, preventing overload at critical hubs. Unlike Ebery’s heuristic, which applies local exchange rules for incremental adjustments, this approach recalculates load distributions globally during the optimization process. In case 20d4, both models select the same hubs (4–12–17), but the GA shows slightly higher costs (+2.42%), indicating that in this particular instance, Ebery’s simpler rerouting approach may be more efficient under fixed conditions.
One of the strengths of the GA is its ability to adjust flow distribution across the network based on hub capacity. This helps prevent overloads and improves infrastructure efficiency, especially during high demand or significant transshipment penalties. These conditions are common in large-scale systems or in networks exposed to changes in flow patterns, where rigid assignment rules often fail to respond effectively.
The behavior of the model also changes depending on the value of the discount factor α. As α increases, the cost gap between the GA and the heuristic tends to widen in favor of the GA. This is consistent with what we observe in scenarios where transshipment costs become more influential. In high-demand scenarios, the genetic algorithm reallocates flows to minimize global costs and mitigate hub saturation. It achieves more balanced flow distributions without increasing operational costs, maintaining solution robustness under shifting conditions, as observed in large scale networks [
52,
53].
In summary, the GA represents a robust and scalable approach to hub location problems. Beyond reducing costs, it improves overall network efficiency by balancing flows, managing capacity adaptively, and reflecting real operational behavior [
40]. Compared to traditional heuristics, it offers similar or better results, with the added value of integrating flexible decision logic aligned with realistic logistics conditions.
3.8. Results of the Proposed Model
This section presents the results of applying the genetic algorithm to the Spanish freight transport network across a wide range of scenarios. Our model minimizes the total cost of the intermodal system by integrating three main components: transportation costs (covering collection, transfer, and distribution), dynamic hub operational costs (Iₖ), and fixed investment costs (Fₖ). In addition, a long-term sustainability constraint is introduced through the Social Net Present Value (NPVsocial), acting as a constraint (NPVsocial ≥ 0), ensuring that only those configurations with a structurally positive and long-term socioeconomic impact are considered valid.
Unlike traditional approaches focused solely on cost, this model introduces a set of strategic performance indicators—such as economic efficiency, territorial coverage, and intermodal connectivity. These indicators address a critical gap in hub network design literature, which traditionally prioritizes cost minimization over systemic resilience and territorial balance. They are applied ex post to assess and rank feasible configurations from a strategic, economic, and social perspective.
The analysis is based on the core optimization objective (1) and the sustainability framework NPV
social (2) from
Section 3, and utilizes data from the 2023 freight statistics published by the Spanish Ministry of Transport, specifically, from the Observatorio del Transporte y la Logística en España (OTLE), which provides official multimodal flow data at the national scale. The dataset includes maritime, rail, and road modes, encompassing both national flows (intra- and inter-regional) and international trade. Key port terminals and border crossings are explicitly incorporated as origin–destination nodes in the intermodal network.
The simulated logistics network consists of 47 candidate nodes spread across the Spanish mainland, including the provincial capitals and four key maritime ports—Algeciras, Valencia, Barcelona, and Málaga—that serve as critical gateways for international freight, particularly along the southern and eastern coasts (see
Table S1 in Supplementary Materials for spoke ID mapping). This configuration guarantees comprehensive territorial coverage and captures both inland and maritime dimensions of the national logistics system (
Figure 4).
The demand matrix was constructed from the OTLE dataset, and a 47×47 cost matrix was developed using the methodologies of [
23,
24], incorporating a mode-sensitive function that distinguishes between unimodal (road-only) and intermodal (road–rail) transport, where adequate infrastructure exists. This formulation captures all internal logistics costs—collection, main haulage, transshipment, and distribution—as well as externalities such as congestion, emissions, noise, and accident risk. To represent the real freight dynamics of Spain, the model explicitly includes key rail freight corridors such as Valencia–Madrid, Zaragoza–Barcelona, and Algeciras–Zaragoza. These high-density corridors serve as strategic levers for modal shift, directly supporting Spain’s sustainable infrastructure goals.
As introduced in
Section 3, the evolution of average door-to-door costs (
Figure 1) confirms the structural advantage of intermodal transport—understood here as the integration of road and rail—over long distances. This pattern is consistently reflected in the model’s outputs: scenarios that activate a greater number of hubs and apply lower values of the transshipment discount factor α achieve lower per-ton costs while significantly expanding territorial coverage and enhancing intermodal connectivity across the network.
To examine the trade-offs between network structure and system performance, 120 optimization scenarios were defined using the previously calibrated genetic algorithm. Each combines a number of active hubs (4, 6, 8, 10, or 12) with a specific value of the transshipment discount factor (α = 0.2 or 1.0), simulating the presence or absence of inter-hub economies of scale. Notably, α = 0.2 aligns with current EU policies promoting rail consolidation along priority corridors (e.g., TEN-T). These combinations enable comparative testing between highly centralized systems and territorially distributed configurations. Sustainability is evaluated across its three strategic dimensions—economic, social, and environmental—under a long-term infrastructure planning lens.
The design space was explored using a structured matrix of 120 scenarios, defined by variations in key genetic algorithm settings: number of hubs, α values, generations (100–800), population sizes (50–400), crossover probabilities (0.75–0.85), and mutation rates (0.20–0.40). An elitist selection mechanism retained the top 30% of individuals per generation, complemented by a 15% local search intensification to refine high-quality solutions. This experimental design overcomes a key limitation in freight GA literature: the neglect of structured diversity for policy-transferable solutions. It ensures balanced exploration of distinct configurations while avoiding premature convergence and reinforcing solution robustness.
The discount factor α (0 ≤ α ≤ 1) reflects the extent to which economies of scale apply to inter-hub freight flows. Lower values simulate consolidated, cost-efficient intermodal corridors—such as those involving rail—while α = 1.0 represents purely road-based logistics without inter-hub cost savings. These two extremes define the system’s behavioral boundaries and support robust comparisons between highly centralized networks and territorially distributed models.
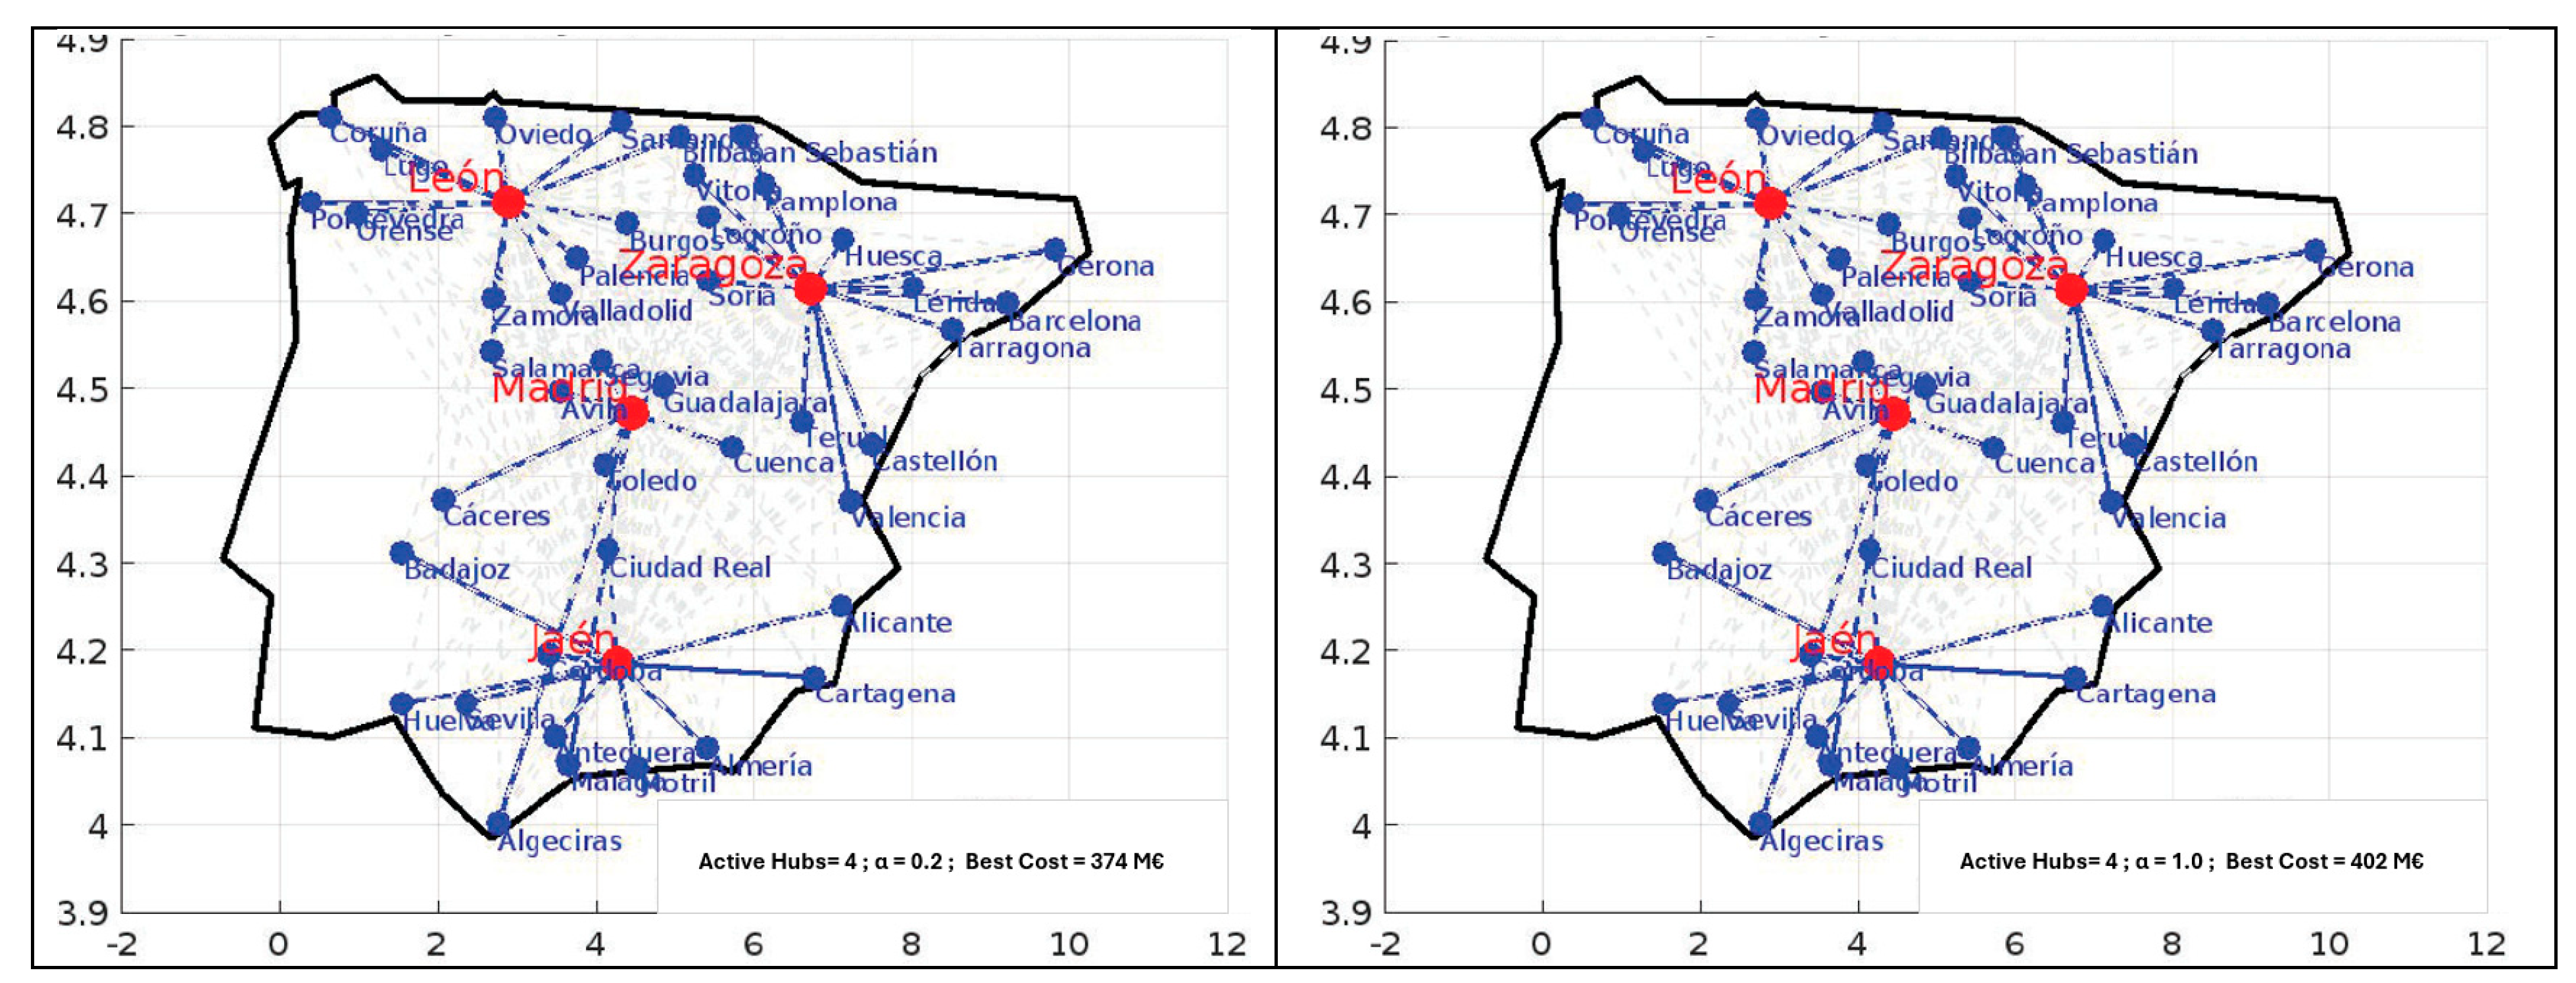
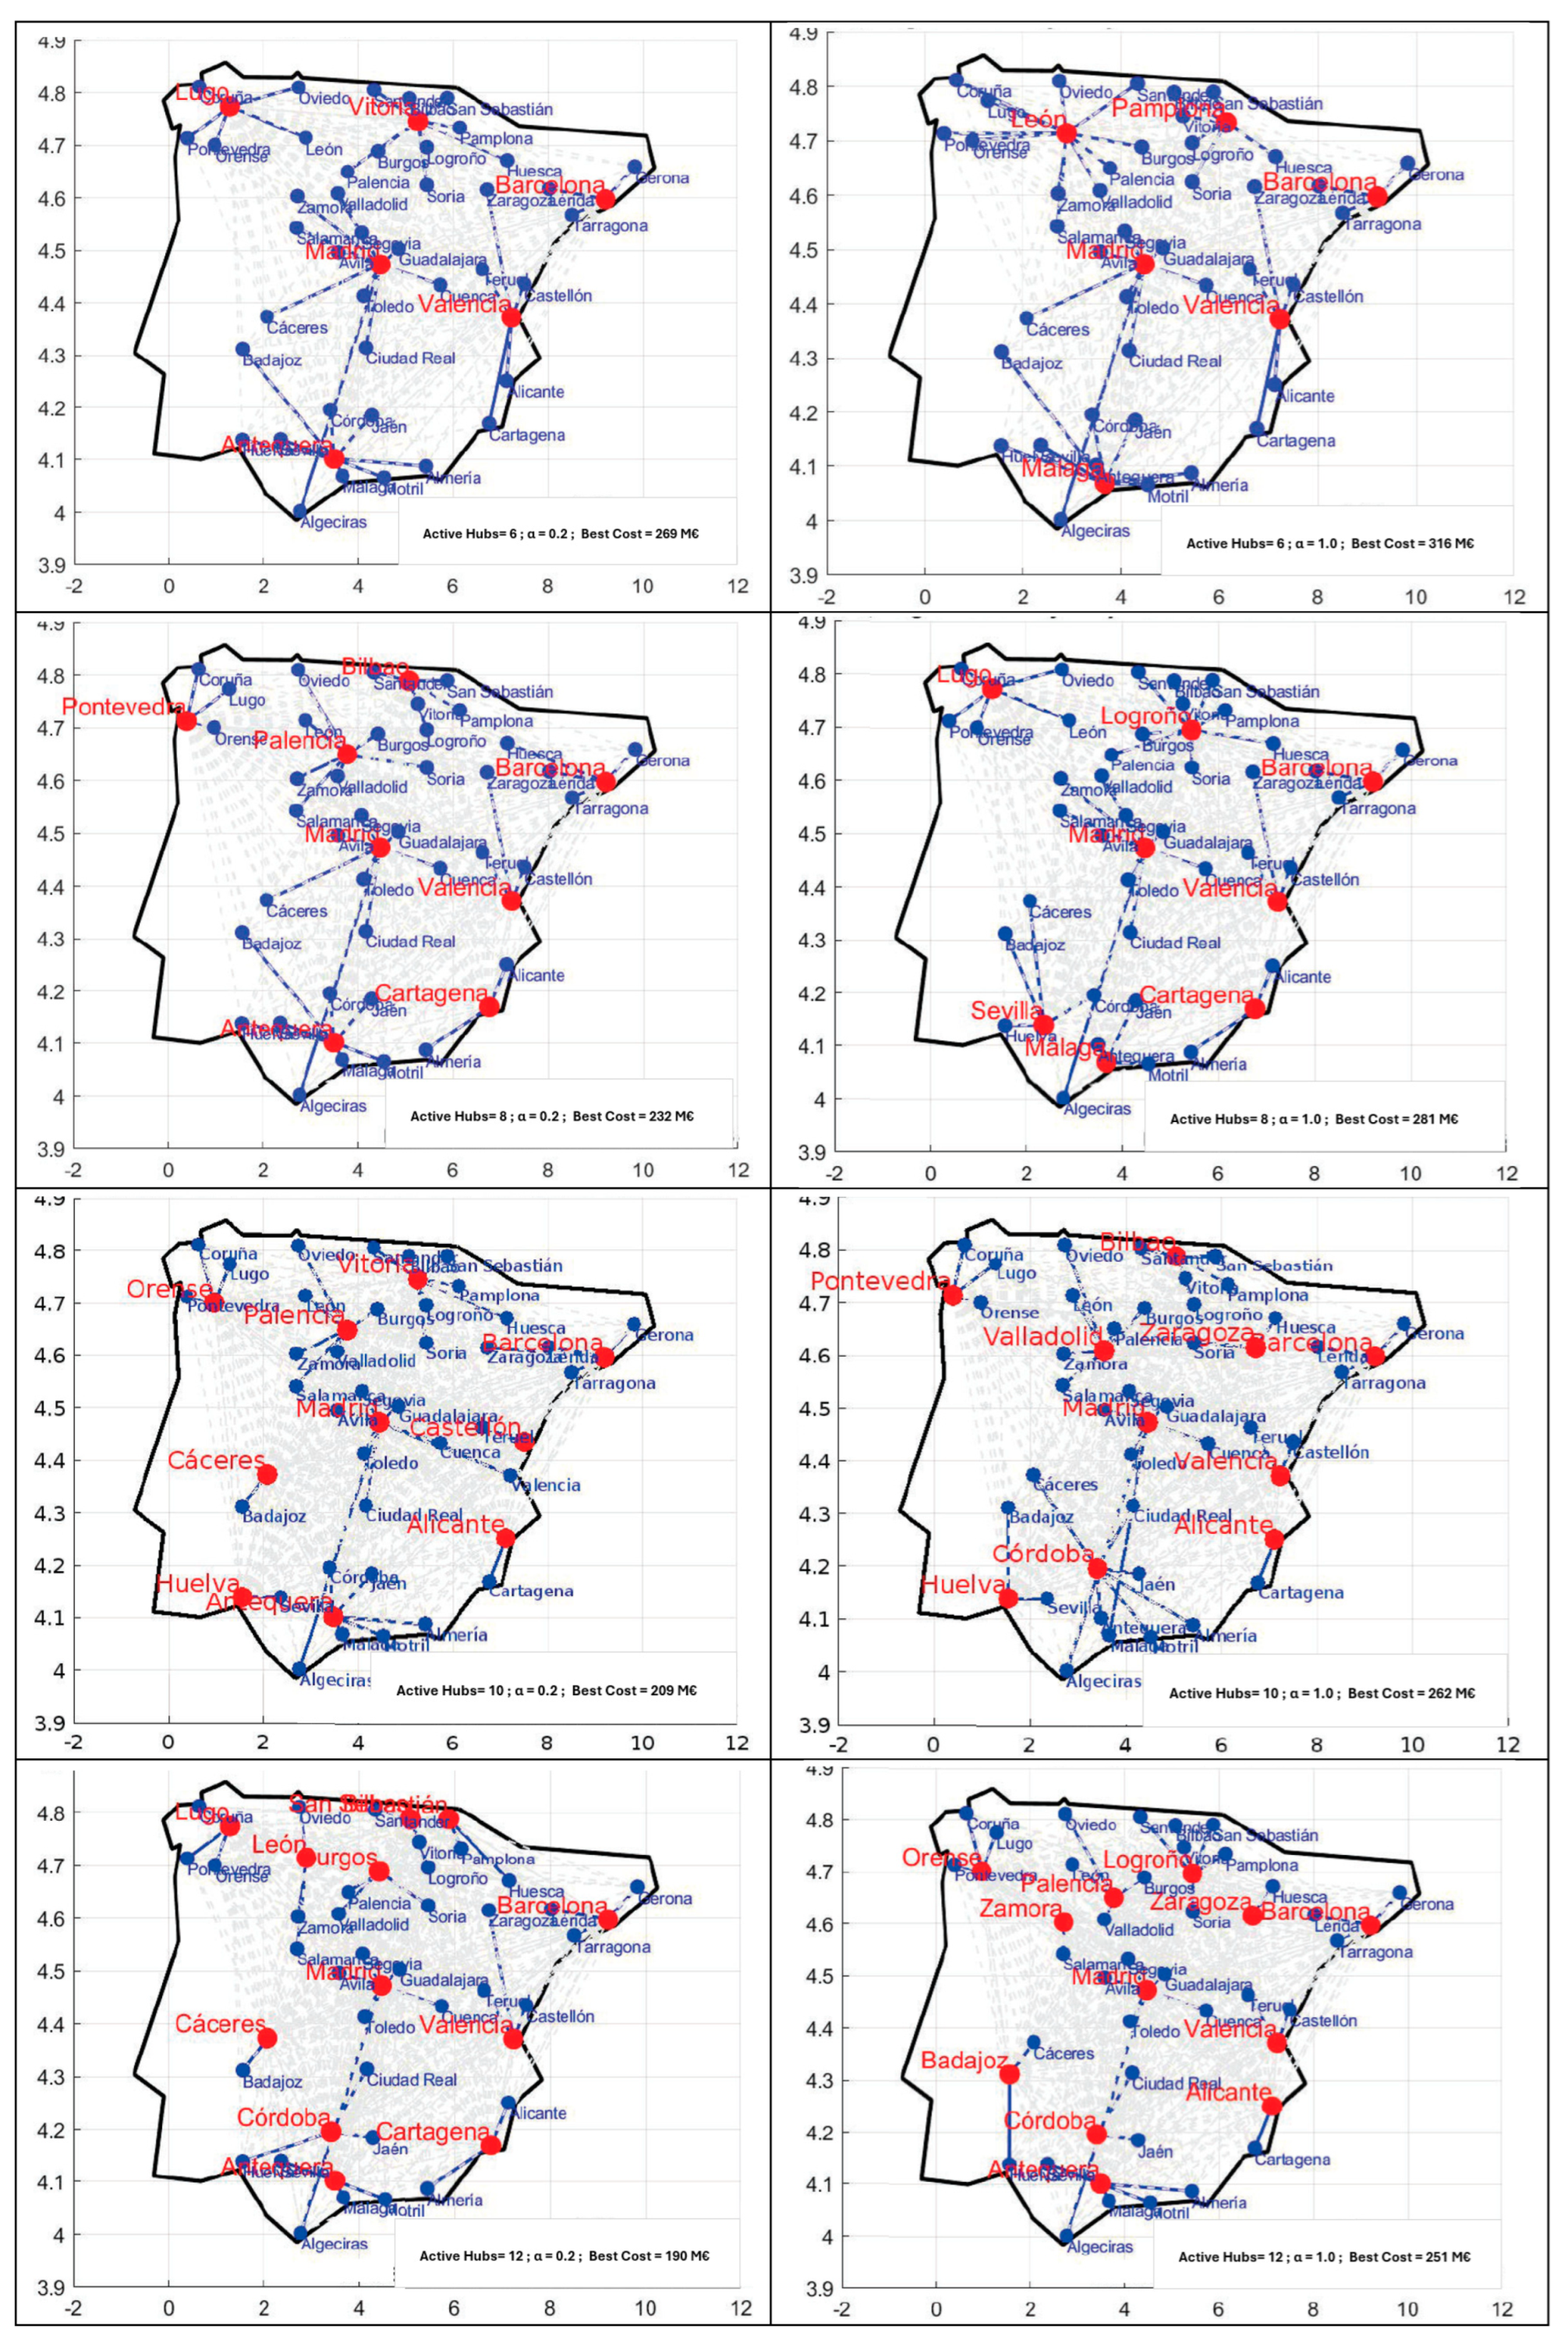
The cartographic outputs—especially the flow maps showing optimal hub locations and their assigned zones—offer a crucial spatial interpretation. The blue assignment lines do not depict physical routes but illustrate each hub’s sphere of influence, its “logistical gravity”, over the nodes it consolidates. This visualization enables the detection of consistent regional patterns, enhancing the territorial interpretation of each configuration. Madrid consistently anchors the central structure; Zaragoza and Valencia extend their influence along east–west axes, while Córdoba, Jaén, and Málaga gain prominence in socially weighted or equity-driven solutions.
These spatial maps reflect the distribution logic of the most cost-efficient solutions (subject to NPVsocial ≥ 0) and lay the foundation for the next phase of analysis based on economic efficiency and structural diversity indicators.
Rather than repeating identical runs, each hub–α configuration was executed under variable genetic settings. This induces structured stochasticity into the optimization process, generating diverse convergence dynamics, solution topologies, and evolutionary paths. As empirically validated in section “Results of the model” (
Figure 5), this strategy prevents premature convergence and enables the identification of robust, transferable configurations suitable for long-term strategic freight planning.
The following section presents the output obtained by the model, integrating total transport costs with the construction and operational expenses of the activated hubs. Only configurations meeting the sustainability constraint (NPVsocial ≥ 0) are retained, ensuring that the resulting networks are not only cost-efficient but also socially and environmentally viable in the long term.
To clarify the analytical scope of this section, it is important to note that the configurations shown correspond to the most cost-efficient solutions—subject to the constraint NPVsocial ≥ 0. These results do not represent the full range of high-performing scenarios in terms of social or territorial return, nor do they reflect the highest-scoring layouts under composite indicators. Rather, they form the first analytical layer—benchmarking network performance under strict economic rationality and sustainability viability, which sets the baseline for deeper multi-criteria comparisons presented in later sections. These results are summarized in
Table 3, which lists the most cost-efficient hub configurations that satisfy the NPVₛₒcᵢₐₗ ≥ 0 constraint.
The results show a clear trend: as the number of hubs increases, the network evolves from a compact, centralized configuration to a more spatially distributed architecture. With only four hubs, flows concentrate around central high-capacity nodes such as Madrid, Valencia, and Zaragoza. These locations consistently appear in cost-efficient solutions due to their robust infrastructure, modal connectivity, and topological centrality.
When the transshipment discount factor α is set to 0.2, the model simulates consolidated, cost-efficient corridors (e.g., rail), reducing the penalty for inter-hub distances and encouraging the inclusion of peripheral nodes. These scenarios tend to achieve greater spatial reach without significantly increasing total costs. In contrast, when α = 1.0, the absence of economies of scale leads the model to favor centralized solutions, concentrating flows through a small set of dominant hubs—a behavior typical of dense, unimodal logistics systems.
Comparing both α values reveals a key planning trade-off: α = 0.2 supports territorial equity and decentralization, while α = 1.0 maximizes cost efficiency under centralization. This balance is particularly relevant in intermodal systems where inland and maritime hubs coexist, and long-term resilience depends on avoiding excessive concentration.
In scenarios with 8, 10, or 12 hubs, the model activates additional nodes such as Lugo, Palencia, Córdoba, Cartagena, and Málaga—each selected for their geographic positioning, connectivity, or role in balancing hinterland access. Meanwhile, cities like Barcelona and Zaragoza, although structurally advantageous, occasionally show lower utilization, especially when peripheral hubs absorb regional flows. This confirms that optimal hub selection is context-dependent and evolves with the network’s spatial and operational parameters.
Beyond identifying cost-optimal configurations, the model incorporates a second analytical layer that explores the structural logic and strategic potential of each solution. This perspective shifts the focus from pure economic cost to broader indicators of resilience, spatial equity, and adaptive capacity—allowing for a more nuanced interpretation of the algorithm’s outputs. Rather than evaluating networks solely based on total expenditure, this approach examines how different configurations perform under complexity, identifying those that offer stronger trade-offs between efficiency, territorial coverage, and long-term viability.
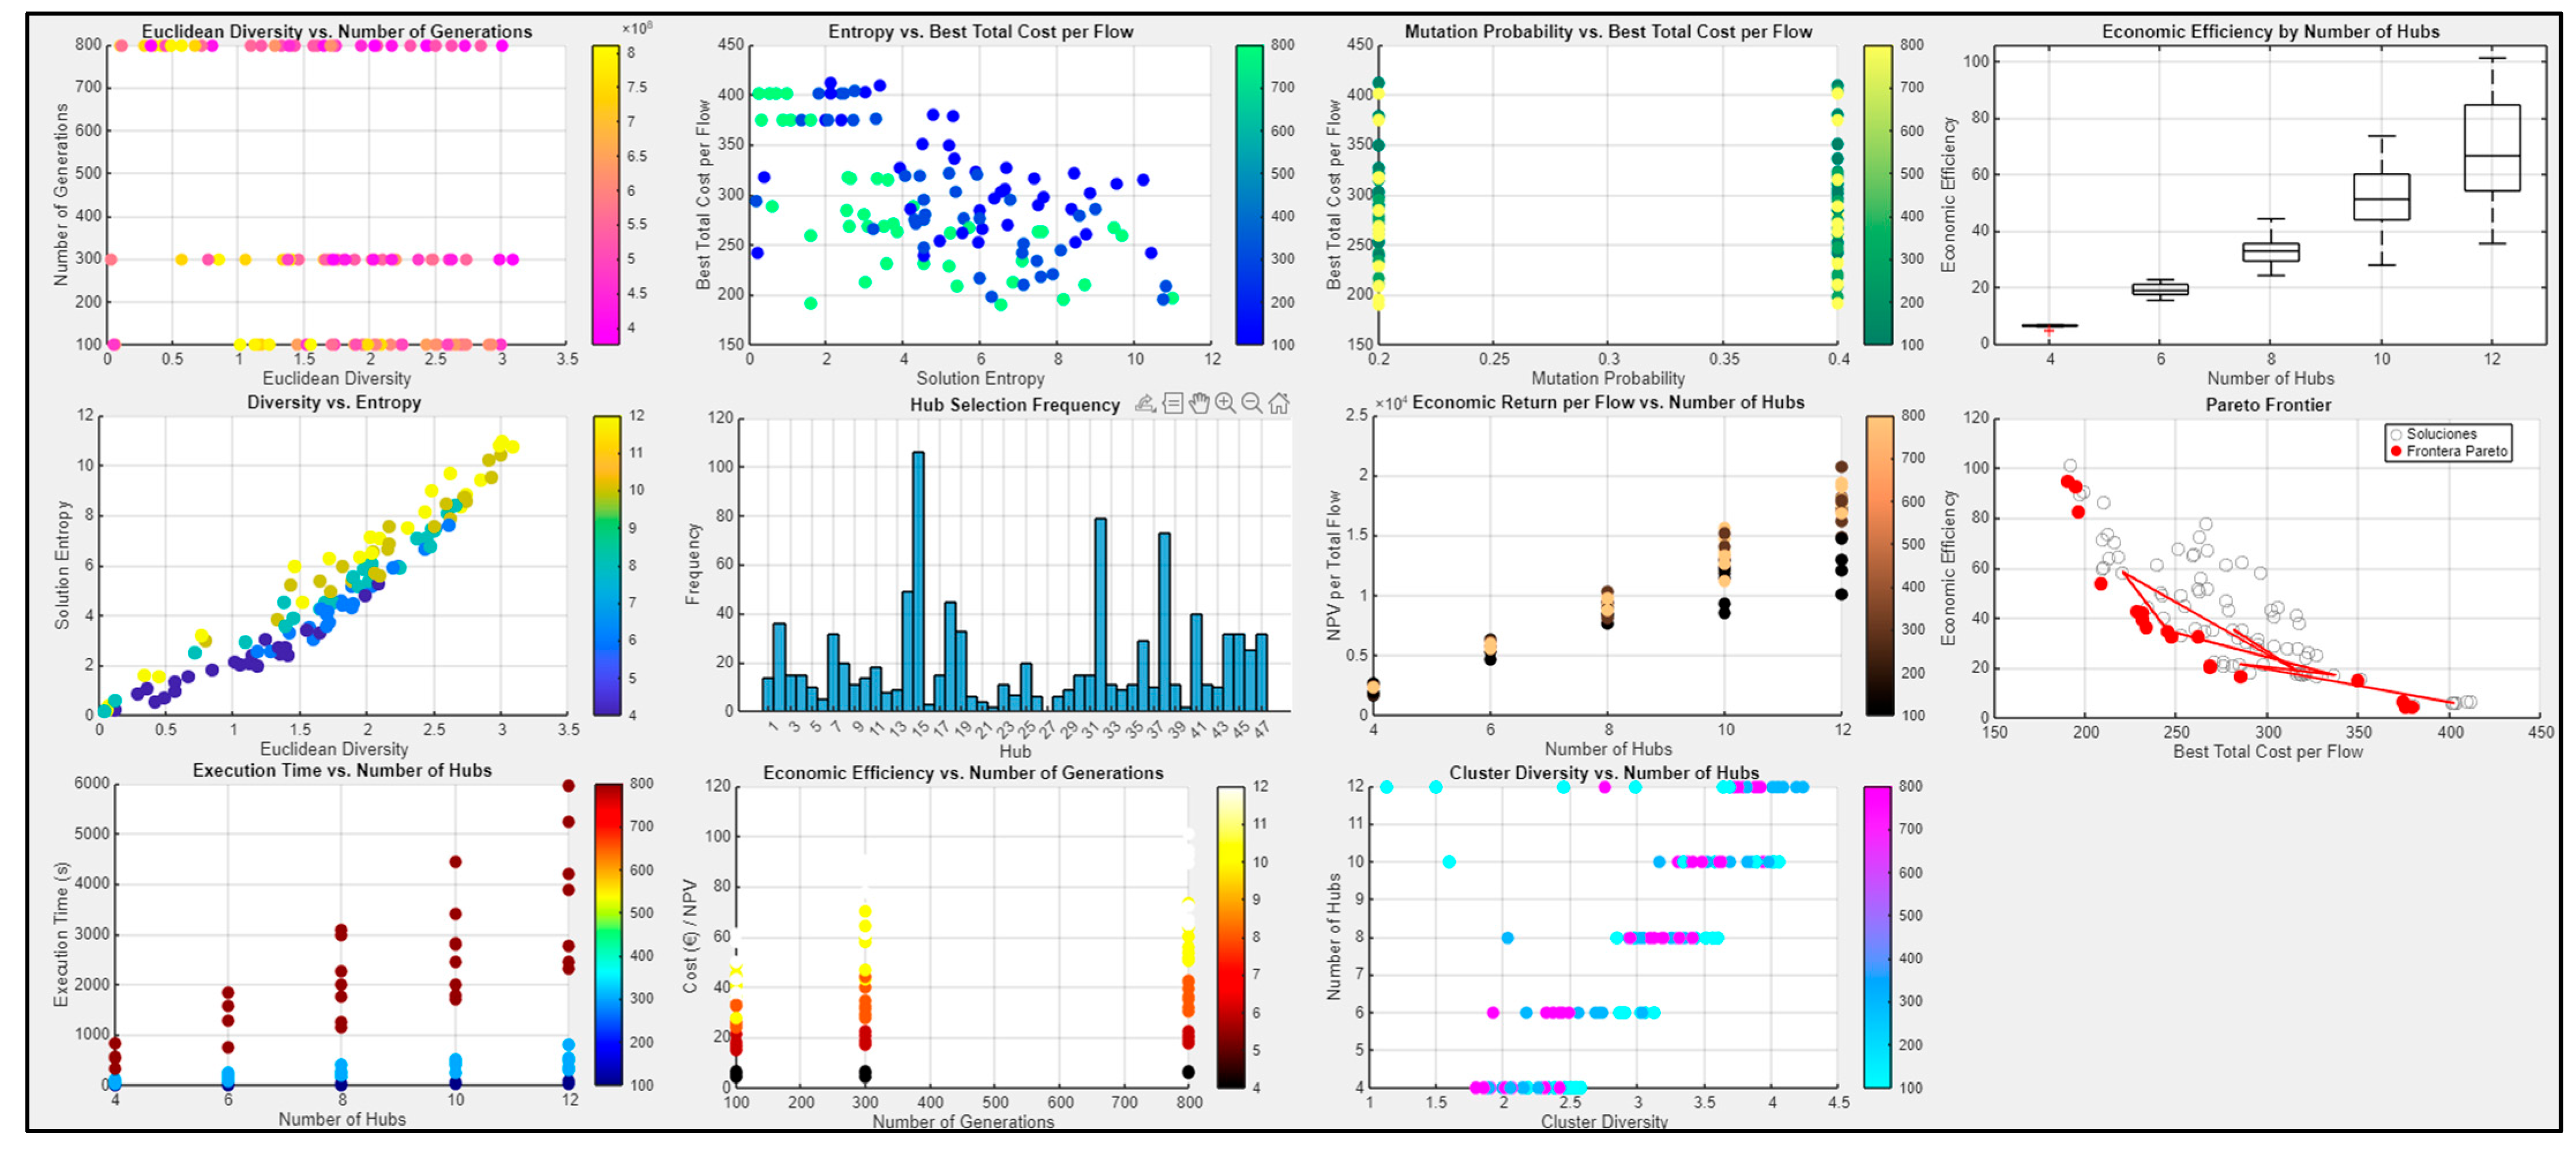
To operationalize this perspective, the model integrates a set of structural and behavioral indicators:
Economic Efficiency: Ratio of NPVsocial to total system cost.
Solution Entropy: Measures structural diversity and resistance to convergence.
Euclidean Diversity: Captures dispersion of solutions within the search space.
Cluster Diversity: Assesses whether hubs form coherent territorial groupings.
Pareto Frontier: Identifies non-dominated trade-offs between cost, sustainability, and geographic equity.
These indicators populate the Strategic Solution Space Explorer (
Figure 5), which provides an interactive dashboard to compare evolutionary behaviors across scenarios. This framework reveals how mutation rates, hub counts, or flow structures influence convergence dynamics, making it a powerful tool for strategic logistics planning.
Graphical outputs confirm a progressive decline in total cost per ton as the number of hubs increases (
Figure 5), driven by better flow allocation and inter-hub accessibility—especially under α = 0.2, where spatial decentralization becomes more viable.
In parallel, NPV
social increases consistently with the number of hubs (
Figure 6), reflecting social returns from emissions reduction, accident avoidance, noise mitigation, and time savings. This increase becomes markedly steeper beyond the 8-hub threshold, where each additional hub starts to generate broader territorial benefits, beyond logistics alone.
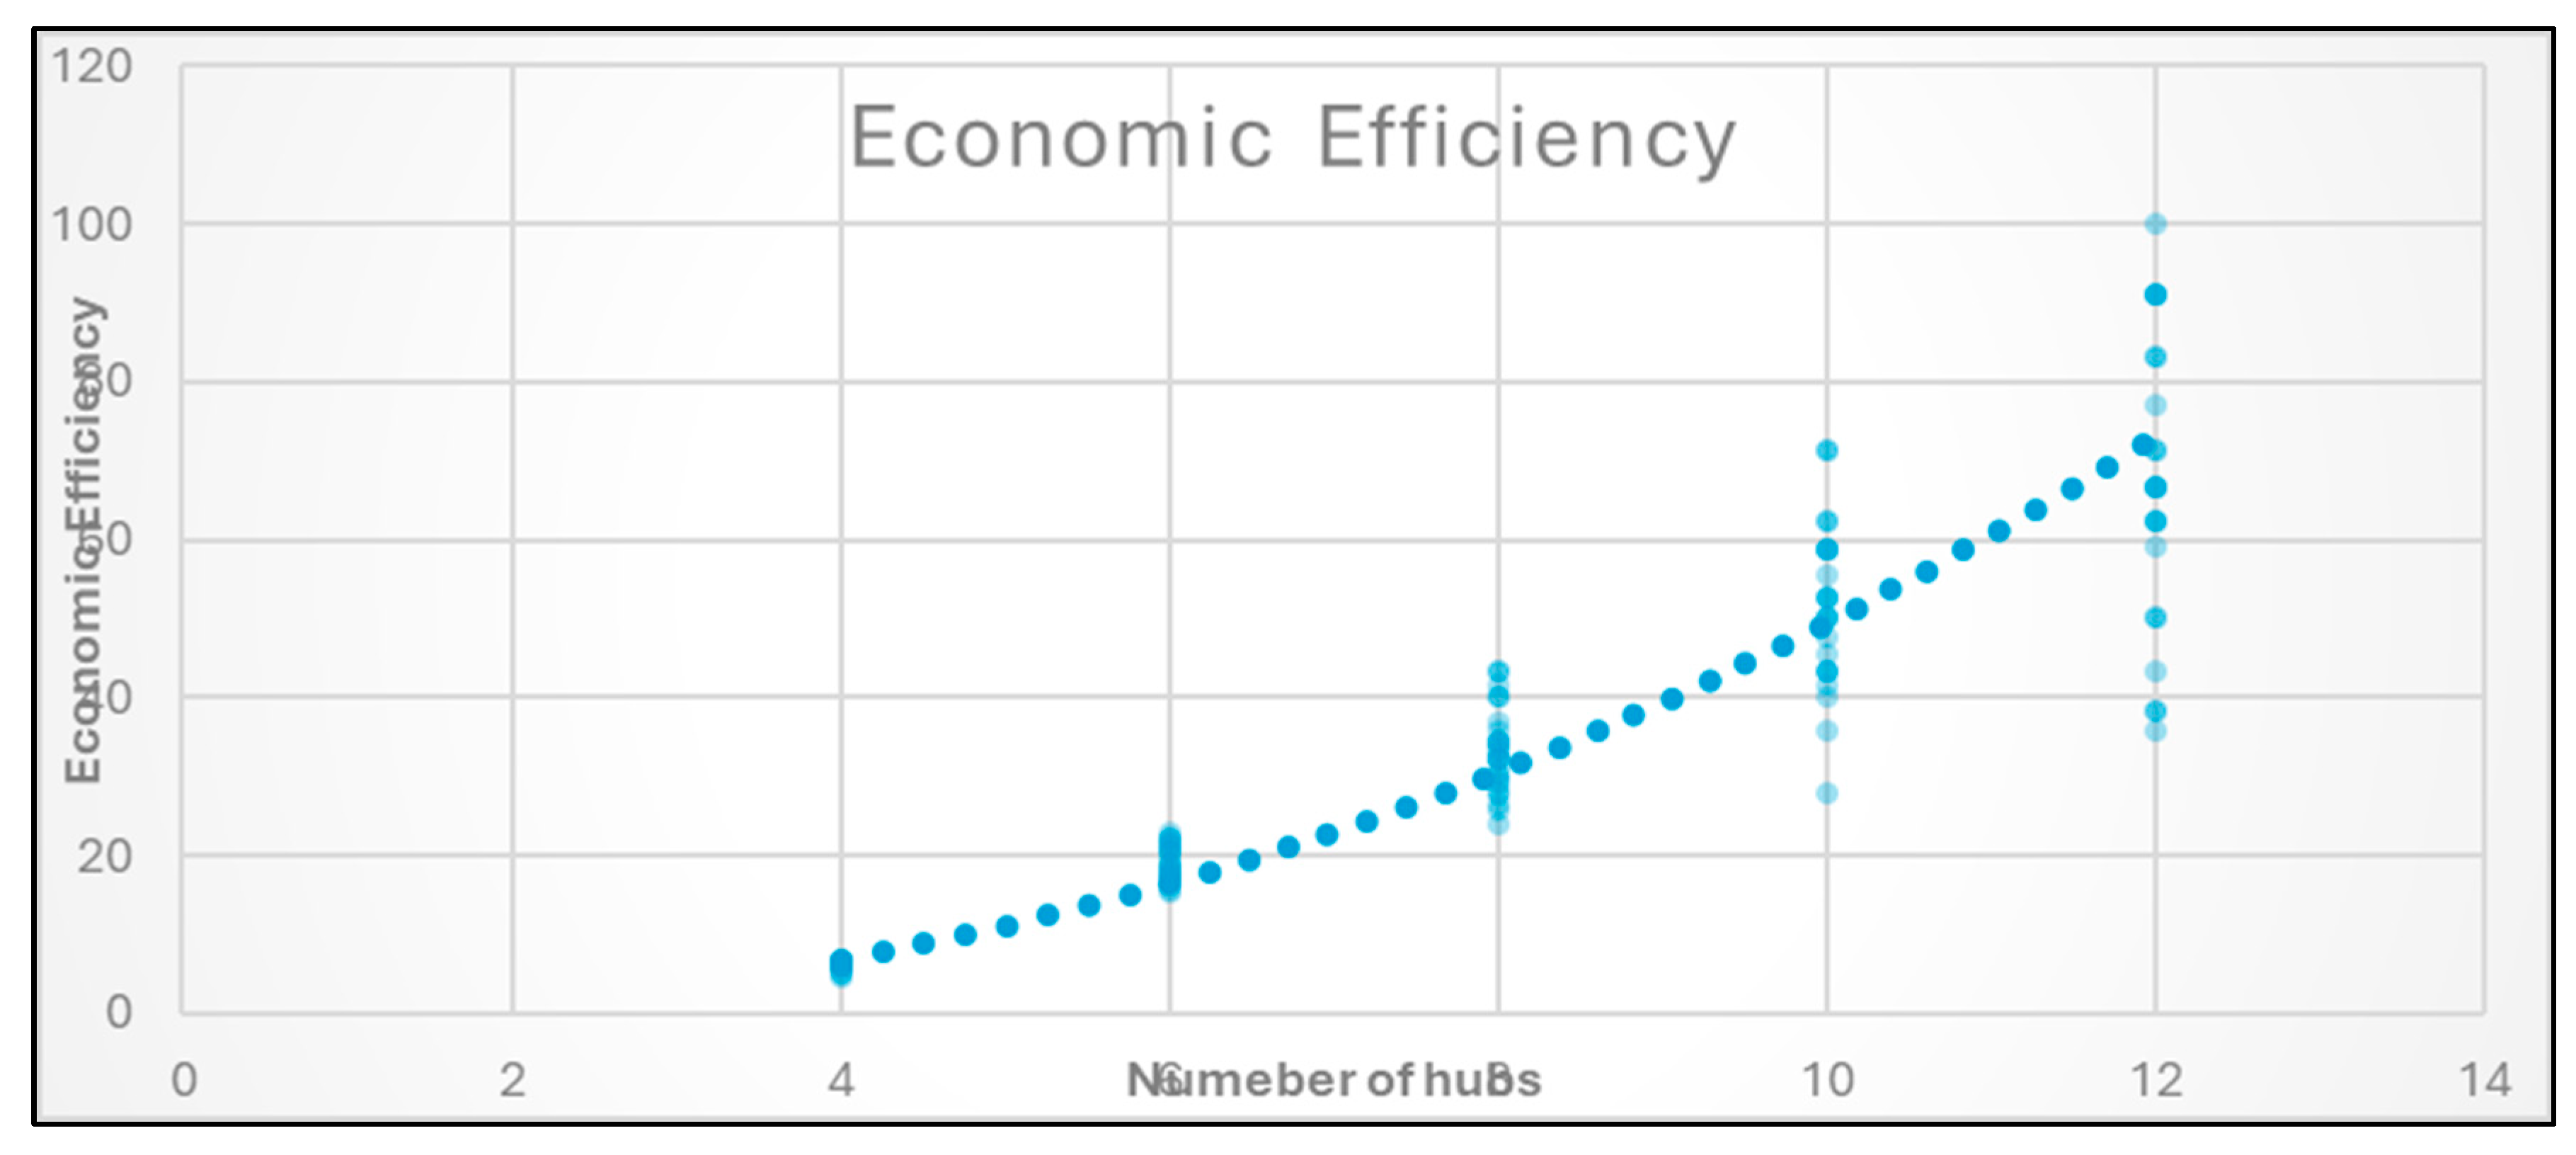
This dual behavior—declining cost and increasing social return—defines the Pareto frontier, where optimal configurations align along a convex curve. Economic efficiency (
Figure 7), defined as NPVsocial per unit cost, captures this trade-off: although each hub adds investment, the network gains in social and operational performance—up to a limit. Beyond 12 hubs, the marginal returns diminish, and the model transitions from efficiency-seeking to resilience-building—an inflection point where additional hubs reflect policy priorities rather than strict economic logic (
Figure 8).
Computational metrics—entropy, cluster diversity, and Pareto dominance—validate the model’s robustness. Networks with six and eight hubs exhibit optimal trade-offs between cost-efficiency and structural diversity, ensuring adaptability under uncertainty. Configurations with 10 and 12 hubs extend geographic reach and improve access in peripheral regions, bolstering system resilience against congestion—albeit with a slight deterioration in aggregate efficiency metrics.
Overall, the model highlights a core triad—Madrid, Valencia, and Barcelona—emerging across all configurations as strategic backbones. Other cities like Málaga, Córdoba, Jaén, Palencia, León, and Zaragoza exhibit strong territorial performance and operational balance.
Under distributed configurations (α = 0.2), the model prioritizes nodes like Lugo, Cartagena, Pontevedra, Huelva, and Seville—locations with modal versatility and strategic geography, despite lacking fully developed logistics infrastructure.
Rather than proposing a single optimal blueprint, the model offers a curated spectrum of viable designs—flexible, scalable, and aligned with different policy agendas. These scenarios serve as a prelude to the concluding strategic insights that follow.
4. Conclusions
This work presents an advanced formulation of the Capacitated Multiple-Allocation Hub Location Problem (CMAHLP), tailored to support strategic intermodal logistics planning in Spain. The model integrates mode-sensitive transport costs, variable operational expenditures, investment requirements, hub capacity constraints, and a mandatory feasibility condition based on the Social Net Present Value (NPVsocial). These components allow the model to represent the real constraints of national freight infrastructure while informing public policy design for the development of intermodality.
Unlike previous approaches reviewed in
Section 3, the objective function has been broadened to include modal economies of scale, congestion penalties, storage-related costs, and infrastructure investment linked to land availability and terrestrial connectivity. Additionally, a temporal dimension is incorporated using a discount rate adapted from Ramsey’s Rule, which allows present-day investments to be weighed against long-term social and environmental returns.
Results from over 120 optimization scenarios confirm the model’s consistent performance across varying structural and cost conditions. As the number of hubs increases, the average cost per ton shows a steady downward trend. This reduction is driven not by increased investment but by more balanced distribution of flows and a more efficient use of available capacity—particularly in network structures that avoid over centralization.
The model consistently selects core logistics hubs such as Madrid, Valencia, and Barcelona across scenarios with 6, 8, 10, or 12 hubs, especially when the transshipment discount factor is high (α = 1). These nodes appear in nearly all high-performing configurations. They are frequently accompanied by inland hubs like Málaga, Córdoba, Palencia, Jaén, and León, which help redistribute flows and improve territorial balance thanks to their relative efficiency and intermodal access.
When the number of hubs is limited or the discount factor is low (α = 0.2), the model leans toward more distributed layouts. Under these conditions, nodes such as Lugo, Cartagena, Huelva, Pontevedra, or Ourense appear more frequently. While their infrastructure is more limited, they present intermodal potential that makes them strategically viable. This reflects the model’s flexibility in adapting to different spatial configurations and identifying high-performing alternatives beyond the traditional corridors.
Across all simulations, the algorithm produced a wide range of valid network designs. This diversity—measured through entropy and Euclidean dispersion—shows that the model avoids early convergence and explores alternatives with different balances between cost and coverage. For planners, this is useful: it provides a robust set of options adaptable to different future conditions. Pareto analysis confirms that some slightly more expensive layouts outperform others in terms of social return and territorial balance, reminding us that cost alone is not enough when designing intermodal networks.
The variation in genetic algorithm parameters—across 120 cases combining population size (50–400), crossover rates (0.75–0.85), mutation rates (0.20–0.40), and generations (100–800)—reinforced solution diversity. This controlled randomness introduces flexibility, enabling the model to adapt to a wide range of planning scenarios.
The scenarios with six and eight hubs deliver a balanced outcome between cost performance and network structure. They moderate logistics costs while offering a range of viable configurations, making them well suited to short- and medium-term planning. In contrast, networks with 10 or 12 hubs extend the system’s coverage by incorporating peripheral nodes—currently less active but with strong potential under evolving North Africa trade flows. These larger networks merit consideration for long-term strategies aimed at strengthening cohesion and resilience.
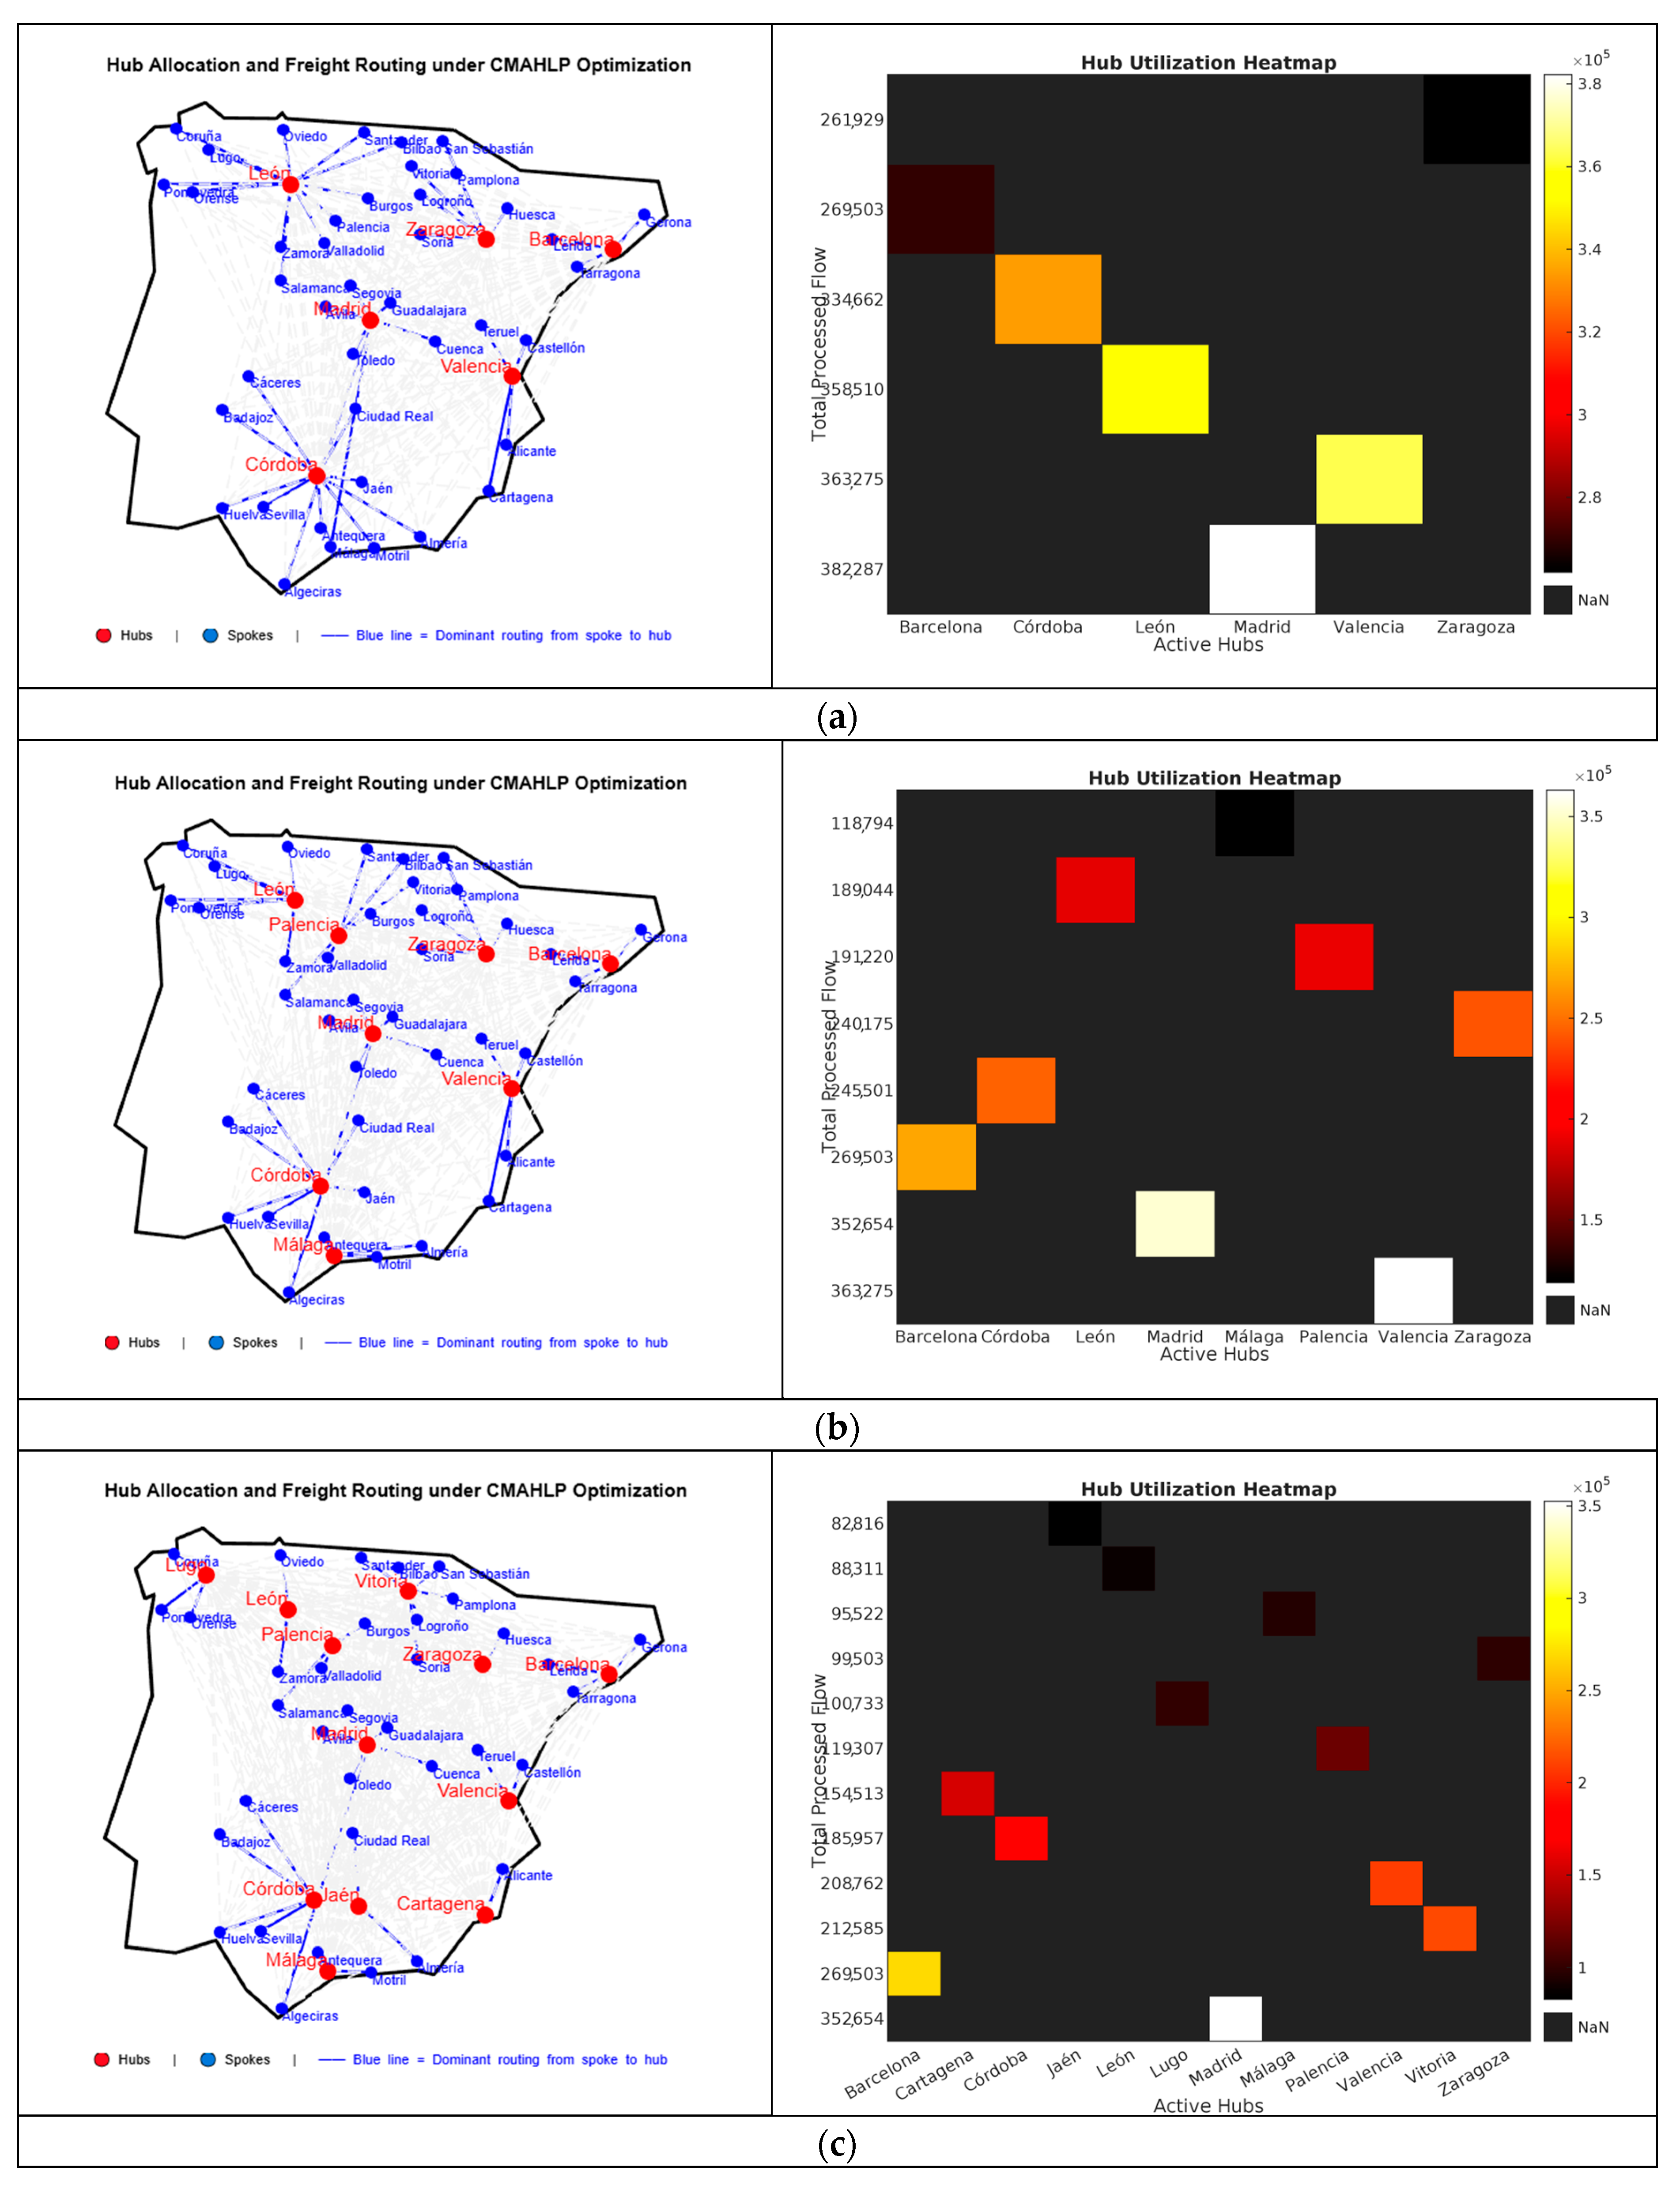
Figure 9 shows the spatial distribution of selected hubs and the freight flows they consolidate in three representative configurations. The red dots mark the hubs chosen by the model, while the blue lines indicate the catchment links—routes from each origin to its assigned hub. The heatmaps on the right reflect the total volume handled by each hub: darker shades indicate higher activity levels.
Six Hubs Scenario: The configuration strikes a solid balance between cost efficiency and national coverage. With six hubs well distributed across the territory, it offers a compact yet effective backbone—particularly suitable for medium-range planning under stable demand.
Eight Hubs Scenario: Introducing two additional hubs allows the network to reach into less connected areas, especially in the north and southeast. This improves accessibility and intermodal integration in regions traditionally underserved.
Twelve Hubs Scenario: With twelve active hubs, the system extends into peripheral zones with high latent potential. This layout aligns well with long-term strategies, particularly in the context of trade realignments and growing connectivity with North Africa.
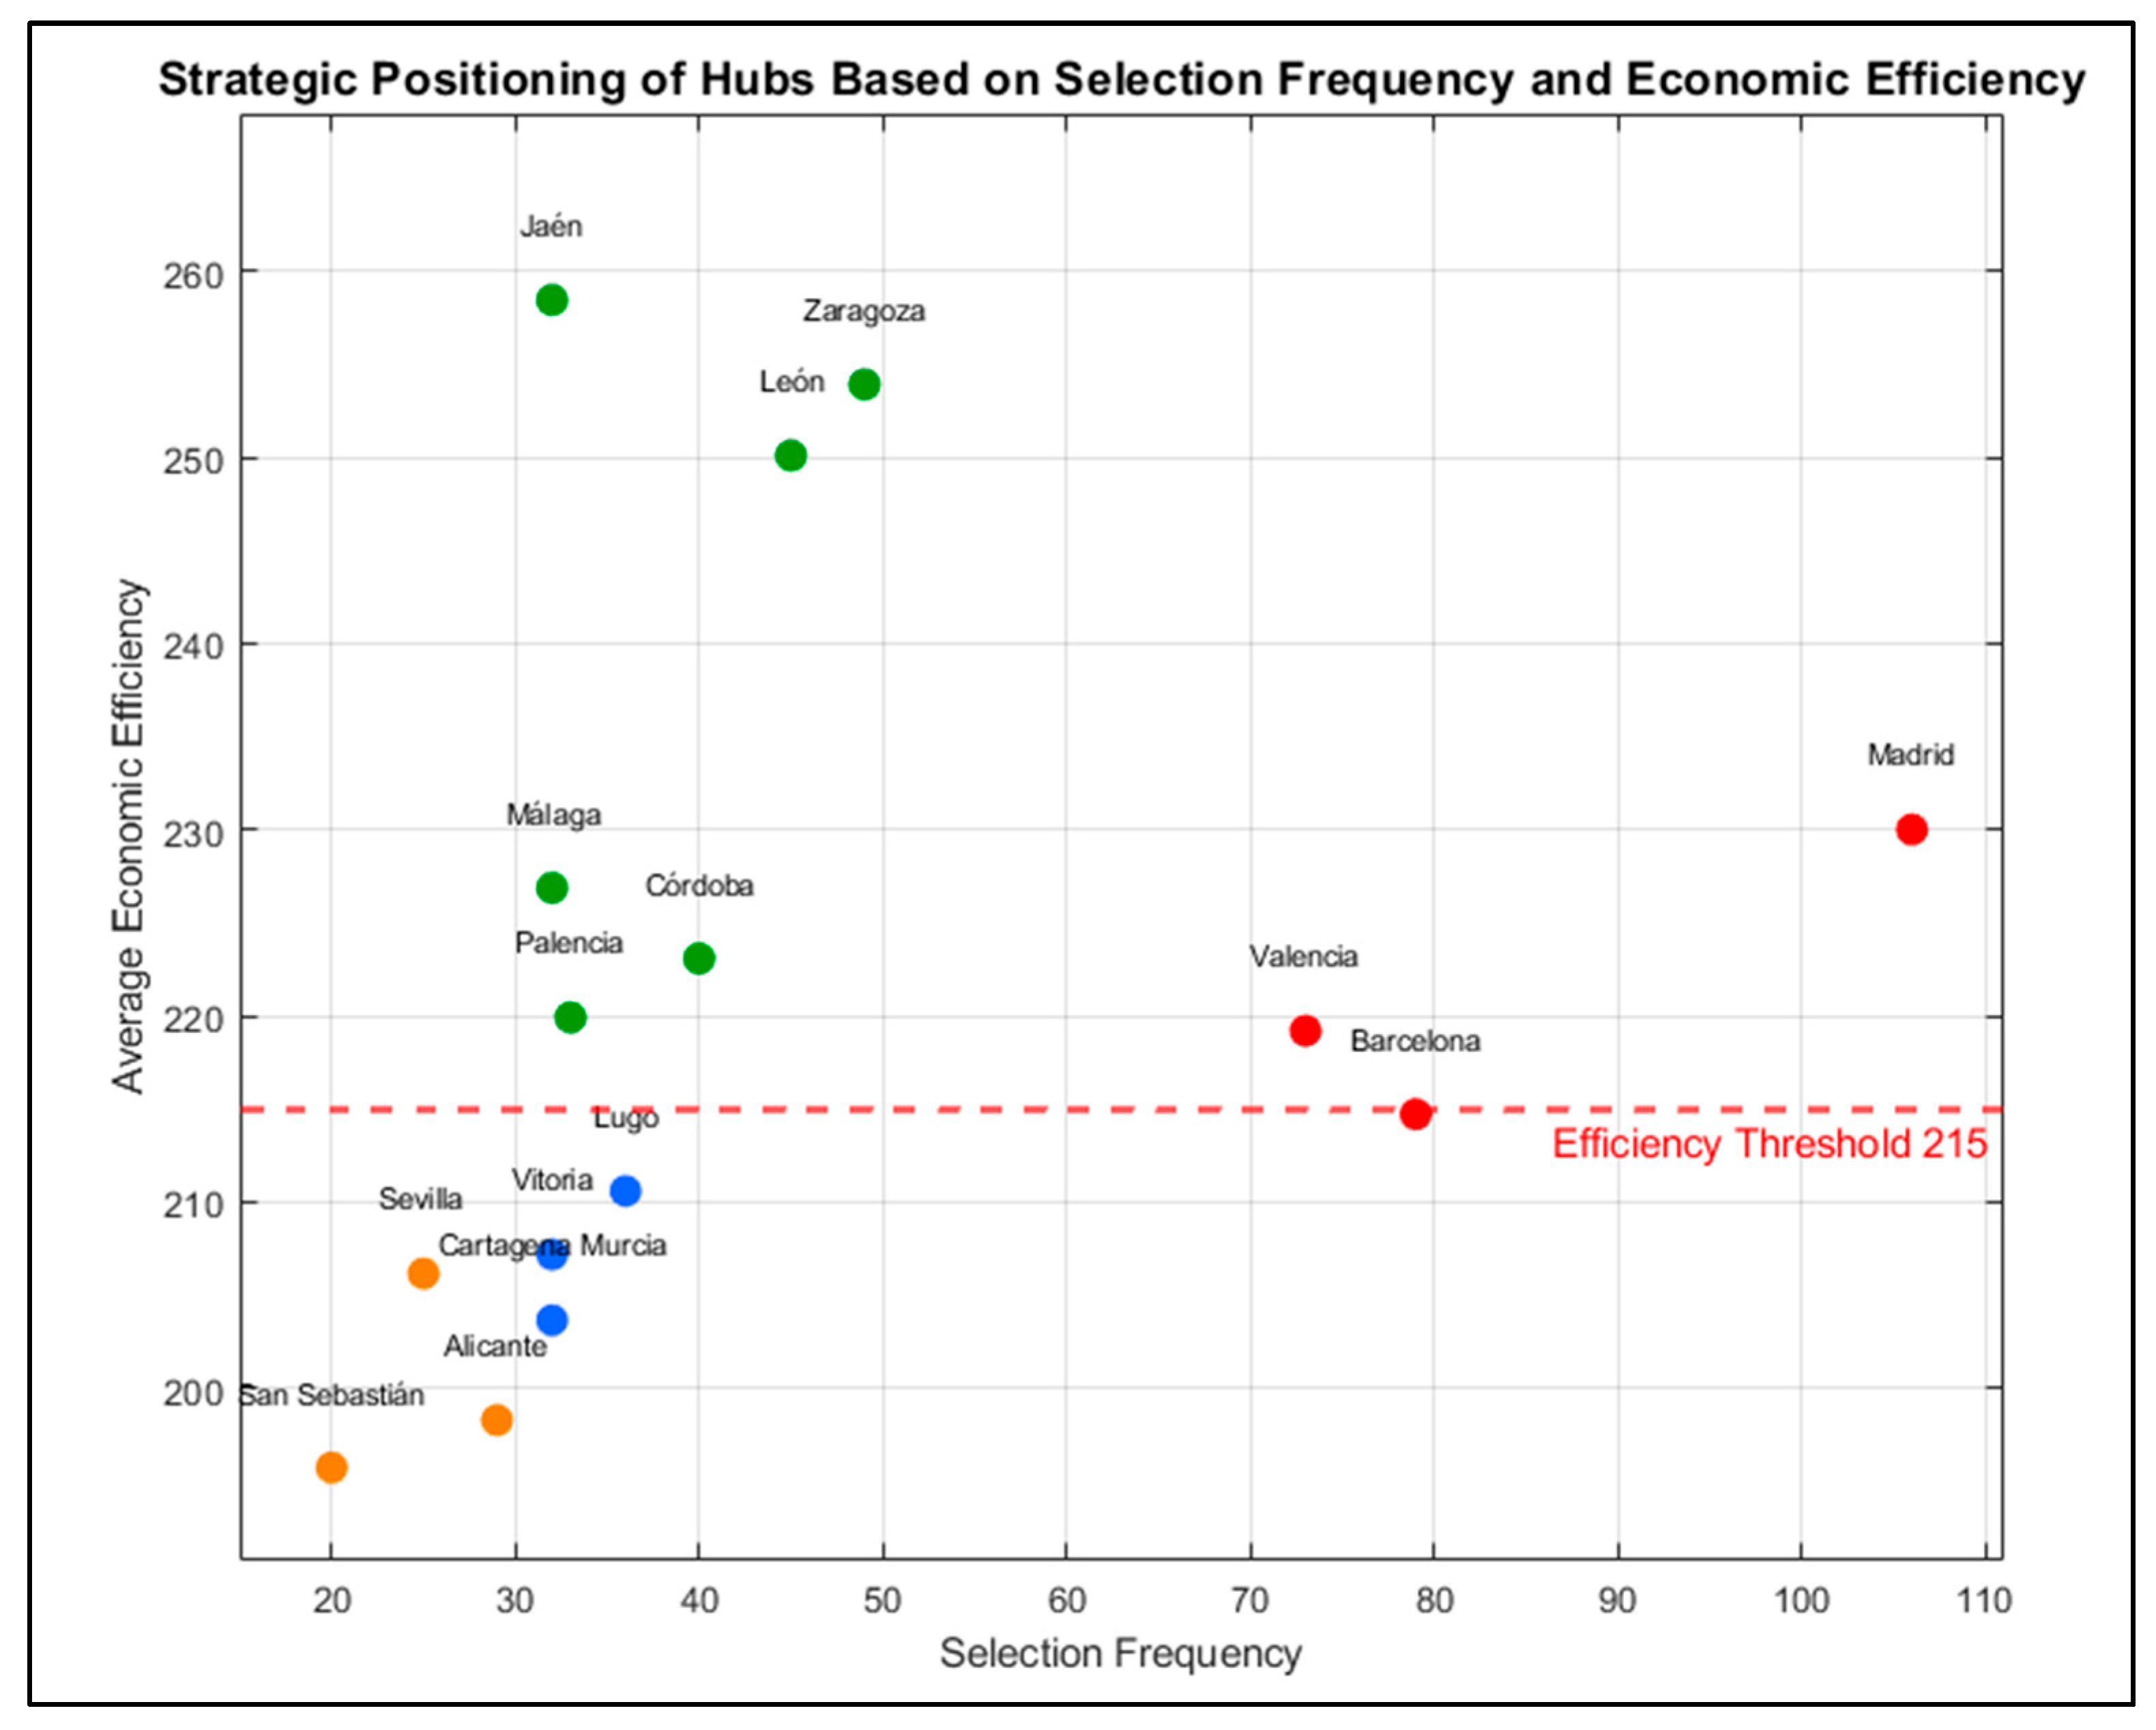
The cross-analysis of hub selection frequency, economic efficiency, and flow performance supports a clear functional typology of nodes. This classification reveals not only which hubs are consistently active but also their strategic role—as structural backbones, tactical enhancers, or regional balancers. The following categories summarize the distinctive contribution each group makes within the optimized network configurations (
Figure 10).
Essential hubs: Madrid, Barcelona and Valencia form the system’s core structure. They appear in virtually all high-efficiency scenarios, reflecting not only their existing capacity but also their established role in coordinating maritime and inland freight. As high-connectivity nodes, they absorb large volumes without diminishing network-wide efficiency.
High-performance tactical hubs: Córdoba, Málaga, Jaén, Palencia, León, and Zaragoza act as tactical enhancers with strong operational value. Though not present in every configuration, they often provide critical support—either by reinforcing key freight corridors or by relieving pressure from overloaded hubs. Their role is especially prominent in distributed or resilient layouts. Notably, Córdoba and Zaragoza consistently balance central positioning with territorial coverage, making them compelling candidates for investment within national infrastructure agendas.
Support hubs. Lugo, Vitoria, and Cartagena operate as secondary hubs with moderate but consistent involvement across scenarios. They feature most often in configurations designed to expand territorial coverage while keeping logistics costs under control. Their strategic value lies in strengthening regional capillarity, especially in underserved areas of the northwest and southeast. With adequate policy support—such as intermodal incentives or selective infrastructure investments—these nodes could fully realize their logistics potential and overcome existing constraints. Public policy interventions—such as targeted incentives for intermodal services or selective infrastructure upgrades—could help unlock their full logistics potential and address current structural limitations.
Territorially balanced hubs. Finally, nodes like Seville, Alicante, and San Sebastián fulfill a compensatory territorial function. Although their average economic efficiency is somewhat lower, their value lies in the geographic coverage and modal balance they introduce. These hubs are more often included in network designs that emphasize sustainability, regional cohesion, and congestion relief, particularly in southern regions and along the Mediterranean arc.
The model offers strong empirical support for the idea that an intermodal logistics network can be both efficient and geographically equitable. Instead of relying solely on cost as the guiding criterion, the model brings in key planning factors—public investment returns, environmental impact, and long-term system coherence. This shift moves the model beyond a technical optimizer and into the realm of practical planning, closely aligned with policy objectives and based on observed patterns.
Rather than prescribing a single optimal layout, the model generates a structured set of tailored solutions. Each configuration reflects a different set of planning priorities—economic, social, or territorial—and includes enough detail to support strategic decisions about where and how to allocate infrastructure resources. This versatility makes the model particularly valuable for national infrastructure planning, especially in the current context of evolving trade flows and reconfigured corridors across the Mediterranean and North Africa.
The methodology developed in this study aligns with both technical optimization goals and the strategic imperatives of the European Green Deal and EU cohesion policy. By integrating intermodal nodes—especially maritime terminals connected to inland logistics platforms—the model can support targeted investment priorities aimed at promoting modal shift and reducing carbon dependency in long-haul freight corridors. Incorporating the Social Net Present Value (NPVsocial) criterion ensures that operational feasibility is assessed in conjunction with environmental impacts and spatial equity, establishing a planning framework that goes beyond simple cost minimization.
This approach is particularly relevant for Spain, given its marked regional disparities, strong port dependency, and the limited integration of rail freight—currently under 5% of modal share. Similar structural imbalances are observed in Portugal, Italy, and Greece, and even in France, where rail accounts for less than 10% of freight transport. In all these countries, multipolar logistics systems with major port regions must decarbonize and rebalance flows. By combining infrastructure configuration, flow dynamics, and socio-environmental metrics, the model provides a scientifically robust basis for integrated planning. This aligns directly with EU funding instruments such as CEF, FEDER, and the Recovery and Resilience Facility, which prioritizes sustainable, resilient, and intermodal corridor development.
This study supports a balanced and coherent model for Spain’s intermodal freight planning, demonstrating that ports are not just entry points but strategic territorial nodes. It offers concrete guidance for public policymakers to align infrastructure investment with core objective territorial cohesion, sustainable logistics, the Green Deal, and TEN-T integration. The model underpins actionable institutional proposals, including a National Intermodality Strategy (echoing the 2023 European Court of Auditors’ recommendation) and the creation of a national observatory for monitoring modal share and hub performance. It also enables the design of differentiated terminal charges, fiscal incentives for intermodal operations, and environmental clauses for funding approval. Rooted in CMAHLP outputs, these instruments bridge model-based diagnosis and policy action, fostering a logistics governance framework that is more coordinated, adaptive, and geographically equitable.
In summary, this study validates the use of the CMAHLP framework for maritime terrestrial logistics planning, enriched by sustainability-based feasibility constraints. The model aligns with EU strategic agendas—the Green Deal and TEN-T—as operationalized in
Table 4. This synthesis highlights three sources of European relevance: (1) consolidation of Spain-specific insights, (2) confirmation of policy alignment with CEF and the Fit for 55 package, and (3) presentation of transferable implementation templates, demonstrated through case examples in Italy, Portugal, Greece, and France.
Looking ahead, future work will explore dynamic network adjustments to better capture the evolution of freight flows and the impact of shifting cost structures and pricing regimes.


