Abstract
The lithofacies and pore structural characteristics of shale reservoirs directly affect the exploration and development of shale gas. To clarify the exploration and development potential of the Lower Cambrian Shuijingtuo Formation (SJT) shale in the Middle Yangtze region, China, this study employs integrated experimental approaches, including optical and scanning electron microscopy (SEM) observations, X-ray diffraction (XRD) mineralogical analysis, and low-pressure gas (N2/CO2) adsorption, to classify mudstone lithofacies within the SJT and elucidate pore structural characteristics and dominant geological control across different lithofacies. The research results show that (1) Six main types of shale lithofacies are found in the STJ, including low-TOC massive calcareous mudstone (LMCM), low-TOC laminated mixed mudstone (LLMM), medium-TOC massive mixed mudstone (MMMM), high-TOC massive mixed mudstone (HMMM), high-TOC laminated siliceous mudstone (HLSM), and laminated argillaceous mudstone (LAM). (2) The pore types of SJT mudstone primarily include organic pores, intragranular clay mineral pores, and microfractures. The pore structure of mudstone is mainly controlled by clay mineral content and TOC content. However, the controlling factors of pore structure vary among different mudstone lithofacies. LMCM and LLMM are dominated by intragranular clay mineral pores, with their pore structures mainly controlled by clay mineral content. The pore types of HLMM and HLSM are organic pores, with pore structures predominantly controlled by TOC content. (3) The SJT mudstone gas reservoir exhibits diverse types, including HLSM, LAM, and LLMM. HLSM is characterized by the highest brittleness index and elevated pore volume (PV) and it can be considered the optimum lithofacies in the study area. Additionally, LLMM has the highest PV and relatively high brittleness index, positioning it as another significant reservoir target in the study area. Therefore, the Lower Cambrian shale gas reservoirs in the Middle Yangtze region exhibit diverse reservoir types. These research findings provide a scientific basis for the next phase of shale gas exploration planning in the Lower Cambrian.
1. Introduction
The Lower Cambrian shale in South China has been considered as a critical target for shale gas exploration and development [1]. However, compared to the Lower Silurian shale, the Lower Cambrian shale exhibits relatively high degrees of thermal maturity, more complex structural conditions, stronger reservoir heterogeneity, and inferior reservoir properties [2,3,4,5]. Early exploration of Lower Cambrian shale gas, influenced by North American approaches, focused exclusively on organic-rich shale intervals [6]. Limited breakthroughs were later achieved in the Weiyuan area (SW Sichuan, Chengdu, China) and the Yichang area (W Hubei, Wuhan, China) [7,8]. The conventional paradigm that only organic-rich shales can form commercial shale gas has been challenged by marine shale gas discoveries in the Cretaceous Mancos Formation (San Juan Basin, NM, USA) and hydrocarbon accumulations via carrier-bed systems at the Pembina oil field in Canada since 2020 [9]. These examples demonstrate that shale with low organic carbon content may host significant hydrocarbon accumulations. In 2022, Sinopec achieved high-yield commercial gas flow from organic-bearing silty shale in the Lower Cambrian Qiongzhusi Formation at well JS103 in the Jingyan-Qianwei area. This advancement heralds a strategic transition in the energy sector, and the development target is shifting from the single Longmaxi Formation to multi-layered shale gas systems [7,10]. Subsequently, Sinopec and CNPC achieved high-yield shale gas flows from organic-rich shale zones in the Qiongzhusi Formation at wells ZY2 and Z201 within the Mianyang—Changning Paleotrough and its periphery in the Sichuan Basin. This represents a major breakthrough in Cambrian shale gas exploration [11,12,13]. This breakthrough inaugurated systematic shale gas exploration and development in the Lower Cambrian. Consequently, Lower Cambrian shale reservoirs exhibit diverse reservoir types, including organic-rich shales and organic-bearing silty shales [7].
While the Lower Cambrian shale gas exploration in the Sichuan Basin has yielded notable breakthroughs, advancements beyond the basin remain constrained. Commercial gas flows have been achieved only in the Middle Yangtze region [14,15]. The Middle Yangtze region (e.g., Yichang area) holds substantial marine shale gas resources and has been supposed to become China’s second major shale gas hub following the Sichuan Basin. Particularly, the Lower Cambrian shales demonstrate vast resource potential [16,17,18]. Recent breakthroughs in Lower Cambrian shale gas were achieved at wells EYY-1 and EYY-2 in the Yichang area. Test production rates reached 6.02 × 10⁴ m3/d (EYY-1) and 12.38 × 10⁴ m3/d (EYY-2) from organic-rich SJT shales [14,19]. Some researchers argue that the best shale gas reservoirs in the Middle Yangtze’s Lower Cambrian are mainly found in organic-rich mudstones (e.g., high-TOC laminated siliceous mudstones) [20,21]. Pore types are characterized by organic pores and intraparticle pores, and the pore structure is dominated by micropores and mesopores [22,23]. Other researchers found that the SJT medium-TOC mudstones exhibit superior pore development compared to high-TOC mudstones in the Yichang area. Porosity first increases and then decreases with rising TOC content [24]. It is widely accepted that the organic-rich shale is predominantly one of the Lower Cambrian shale reservoirs in the study area. However, there have been relatively few studies on the organic-bearing shale reservoirs.
Based on the multiple reservoir types within the Lower Cambrian shale, the pore characteristics and type remain poorly constrained, and the optimal shale reservoir types (or lithofacies) are yet to be definitively identified. This knowledge gap impedes shale gas exploration planning in the Middle Yangtze region. Therefore, this paper, focusing on the Lower Cambrian SJT shale in the Yichang area, uses an integrated analysis including petrographic and scanning electron microscopy (SEM) observations and low-pressure gas (N2/CO2) adsorption experiments to analyze pore system variations in different lithofacies, elucidate the influence factors of shale pore structure, and identify prospective exploration targets. The outcomes lend scientific weight to shale gas exploration endeavors in the Middle Yangtze region and supply valuable perspectives for exploring marine shales across South China.
2. Geological Setting
The Middle Yangtze region is situated in the central Yangtze Block, south of the Qinling—Dabie orogenic belt (Figure 1a). This region exhibits relative tectonic stability, situated as it is amidst four orogenic belts: the Xiangyang—Guangji Fault to the north, the Jiangnan—Xuefeng nappe uplift belt to the south, the Sichuan Basin to the west, and the Jingmen—Dangyang synclinorium to the east [25,26,27]. The study area has undergone multiple tectonic events, e.g., Indosinian (250–200 Ma), Yanshanian (160–90 Ma), and Himalayan (50–0 Ma) movements [28], resulting in complex geological structures. However, the Huangling and Shennongjia uplifts developed in the northern sector of the Middle Yangtze region. The sedimentary strata covering the Huangling paleo-uplift, including Proterozoic, Paleozoic, Mesozoic, and Cenozoic strata, are exposed [25,29]. Functioning as a rigid Proterozoic base, the Huangling paleo-uplift shields the overlying sediments. Thus, the presence of the Huangling Uplift considerably favors the preservation of Cambrian shale gas [30].
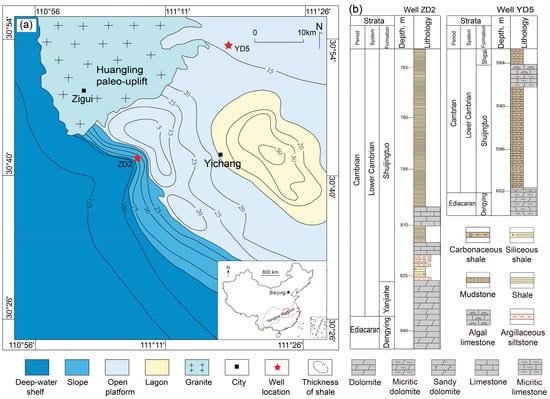
Figure 1.
(a) Early Cambrian sedimentary paleogeographic map of the Middle Yangtze region (modified according to Reference [31]). (b) Stratigraphic column of the studied wellss.
During the Late Sinian period, the subsidence of the Yichang area in western Hubei led to the formation of multiple depressions at varying scales. During the early Cambrian, they evolved into a tectonic paleogeography with alternating uplifts and depressions, and the central Sichuan and central Hubei areas transformed into paleo-lands due to continuous uplift. Subsequently, the paleotopographic pattern of the Middle Yangtze region is characterized by a decreasing height from north to south. This configuration established three major sedimentary facies, including shallow-water shelf, slope, and deep-water shelf environments from north to south [27]. The Lower Cambrian succession in the study area is primarily composed of the Yanjiahe (YJH) Formation, SJT, and the Shipai (SP) Formation, unconformably overlying the upper Ediacaran Dengying Formation dolomite [31]. The YJH Formation mainly consists of argillaceous dolostone and calcareous mudstone, which may be either absent due to non-deposition or eroded in shallow-water shelf settings. The SJT consists vertically of three lithological units, including black carbonaceous shale, calcareous shale, and argillaceous limestone from bottom to top. The SJT thickness ranges from 756.74 m to 826.25 m in well ZD2, and from 585.69 m to 603.16 m in well YD5. The SP Formation is dominated by mudstone, silty mudstone, and dolostone (Figure 1b).
3. Materials and Methods
A total of 28 shale samples were collected from the Lower Cambrian SJT in shallow shelf facies (well YD5) and slope facies (well ZD2) of the Middle Yangtze region, with 14 samples obtained from each well. All samples were divided into two parts. One part was used for making small blocks for petrographic thin sections and polished slabs. Another part was crushed to 200 meshes, and the powered samples were further analyzed by geochemical and X-ray diffraction (XRD) analysis; the other was used for gas adsorption testing.
Polished thin sections of the mudstone samples underwent optical examination using an OLYMPUS BX51 microscope, enabling mineral identification under both plane-polarized and cross-polarized light. For electron microscopy, the samples were first cut into approximately 2 cm × 2 cm × 1 cm blocks, after which the bedding-perpendicular surface was mechanically polished and subsequently refined to an ultra-smooth finish using an IM4000 argon-ion milling system. These prepared surfaces were then examined under a Hitachi S-8000 high-resolution cold-field emission scanning electron microscope equipped with an energy-dispersive spectrometer (EDS), with SEM images acquired in both secondary electron and backscattered electron modes, while unidentified minerals were characterized through EDS elemental analysis.
Total organic carbon (TOC) content was measured on a total carbon and sulfur LECO CS-230 analyzer after carbonate removal with dilute HCl. Analytical precision was better than 10%.
X-ray diffraction (XRD) measurements of powdered whole-rock samples employed a Bruker D8AA25 X-ray diffractometer (Germany) operating at 40 kV and 40 mA. Samples were step-scanned from −3° to 163° with a step size of 0.02° (2θ).
The total porosity of the investigated samples was derived from the difference between skeletal density and apparent density. Skeletal density measurements utilized helium pycnometry (Quantachrome Ultrapyc 1200e), whereas apparent density was quantified via the sealed-paraffin technique with a DAHO-120M hydrometer. Analytical protocols followed the established procedures in the work by Tian et al. (2013) [32] and Sun et al. (2020) [33].
Low-pressure CO2 and N2 adsorption analyses of mudstone powder samples were conducted on an ASAP 2460 automated gas sorption analyzer. Following IUPAC pore classification standards (micropores < 2 nm, mesopores 2–50 nm, macropores > 50 nm) [34], N2 adsorption characterized mesopore and macropore structures. Specific surface area (SSA) was calculated using the Brunauer—Emmett—Teller (BET) model, while PV and size distribution were derived from Barrett—Joyner—Halenda (BJH) analysis of N2 adsorption data [35,36]. Meanwhile, CO2 adsorption primarily quantified microporous networks, with pore size distribution modeled through Density Functional Theory (DFT) and PV/SSA determined via Dubinin—Astakhov (DA) equations [16].
4. Results
4.1. Mudstone Lithofacies Classification and Characteristics
4.1.1. Mudstone Lithofacies Types
The term “lithofacies” refers to the rock type and or its associations formed in certain depositional environments [37], representing the fundamental unit of shale reservoirs. The comprehensive characterization of mudstone lithofacies integrates mineralogical composition, geochemical properties, and hydrocarbon generation potential [38,39]. Mudstone facies have multiple classification schemes [40,41,42]. In this study, mudstone lithofacies are divided into different types according to TOC content, mineral composition, and bedding characteristics. Based on established TOC thresholds of 1% and 2%, mudstones are divided into low-TOC (TOC < 1%), medium-TOC (1% < TOC < 2%), and high-TOC (TOC > 2%) classifications. Based on bedding thickness, mudstones are classified as laminated (<10 mm), bedded (>1 cm), and massive (>50 cm). Based on the mineral ternary diagram (quartz + feldspar, clay minerals, carbonate minerals), mudstones are classified as calcareous mudstone (carbonate > 50%), siliceous mudstone (quartz + feldspar > 50%), argillaceous mudstone (clay minerals > 50%), and mixed mudstone (all components ≤ 50%) [43,44]. Therefore, Lower Cambrian mudstones in the study area are classified into eight lithofacies, including low-TOC massive calcareous mudstone, low-TOC laminated mixed mudstone, low-TOC laminated argillaceous mudstone, medium-TOC massive mixed mudstone, medium-TOC laminated argillaceous mudstone, high-TOC massive mixed mudstone, high-TOC laminated siliceous mudstone, and high-TOC laminated argillaceous mudstone (Figure 2). Due to the limited quantity of argillaceous mudstone, low-TOC, medium-TOC, and high-TOC laminated argillaceous mudstones are grouped together as laminated argillaceous mudstone for discussion. Consequently, this study will provide detailed descriptions of six mudstone lithofacies, including low-TOC massive calcareous mudstone (LMCM), low-TOC laminated mixed- mudstone (LLMM), medium-TOC massive mixed mudstone (MMMM), high-TOC massive mixed mudstone (HMMM), high-TOC laminated siliceous mudstone (HLSM), and laminated argillaceous mudstone (LAM).
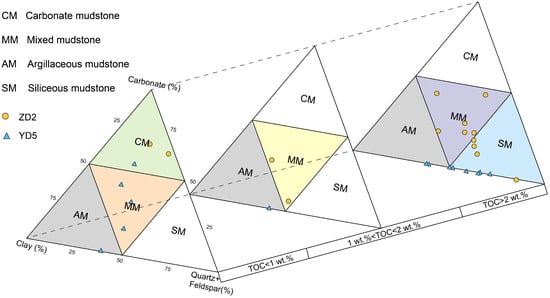
Figure 2.
Lithofacies classification of mudstones in the Lower Cambrian SJT, Middle Yangtze region (modified according to Reference [45]).
4.1.2. Characteristics of Mudstone Lithofacies
LMCM displays poorly developed bedding with a predominantly massive structure, showing light gray, and is characterized by relatively low TOC content (avg. 0.62%) (Figure 3a). The mineral composition of LMCM is dominated by carbonate minerals (avg. 60.8%), with dolomite predominating over minor calcite. The terrigenous clastic grains, including quartz and feldspar, are angular to subangular and scattered in the carbonate matrix (Figure 4a). Pores are poorly developed, with rarely observed intragranular clay mineral pores, intraparticle dissolution pores, and microfractures (Figure 4d).
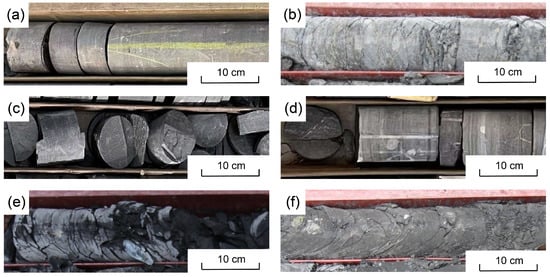
Figure 3.
Core photographs of the Lower Cambrian SJT mudstones in Middle Yangtze region. (a) LMCM, well ZD2, 810.19–810.49 m; (b) LLMM, well YD5, 588.0–588.3 m; (c) MMMM, well ZD2, 760.49–760.79 m; (d) HMMM, well ZD2, 816.79–817.09 m; (e) HLSM, well YD5, 601.55–601.75 m; (f) LAM, well YD5, 592.55–592.85 m.
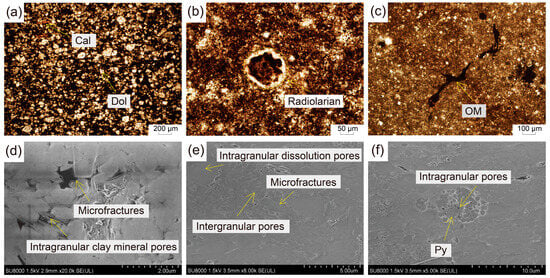
Figure 4.
Optical and SEM photographs of low-TOC massive calcareous mudstone and low-TOC laminated mixed mudstone. (a–c) Optical micrographs; (d–f) SEM images. (a) Low-TOC massive calcareous mudstone primarily composed of dolomite with subordinate calcite; (b,c) Low-TOC laminated mixed mudstone shows banded siliceous radiolarians and banded OM. The outer rim of radiolarians is filled with quartz, which forms quartz surrounding the edge; (d) Low-TOC massive calcareous mudstone displays microfractures and clay mineral intragranular pores; (e,f) Low-TOC laminated mixed mudstone exhibits intergranular pores, intragranular pores, and microfractures.
LLMM displays well-developed laminated bedding, shows light to dark gray coloration, and is characterized by relatively low TOC content (avg. 0.5%) (Figure 3b). Mineral composition is mainly composed of clay minerals and quartz + feldspar, with average contents of 35.47% and 30.2%, respectively. Quartz and feldspar grains exhibit point-line contacts, with sporadic organic debris dispersed among particles, while banded organic matter (OM) occurrences are also observed. Siliceous radiolarians are observed in the samples; the outer rim of radiolarians is filled with silica, which forms a quartz rim. Furthermore, the OM is present in the internal cavities of radiolarians (Figure 4b,c). Intergranular pores and intragranular dissolution pores are well developed in the mineral grains. Intragranular pores within framboidal pyrite are also observed; microfractures are also well developed (Figure 4e,f).
MMMM displays poorly developed bedding with a predominantly massive structure, showing dark gray, and is characterized by moderately higher TOC content (avg. 1.43%) (Figure 3c). The mineral composition is mainly composed of clay minerals, quartz–feldspar, and carbonate minerals (avg. 42.75, 32.55%, and 16.3%, respectively). OM primarily exists complexed with clay minerals, where quartz, feldspar, and carbonate minerals are embedded within these complexes. Sparsely scattered pyrite is observed (Figure 5a.b), and its intragranular pores are predominantly filled by OM. Scattered organic pores and locally occurring microfractures can be observed (Figure 5d,e).
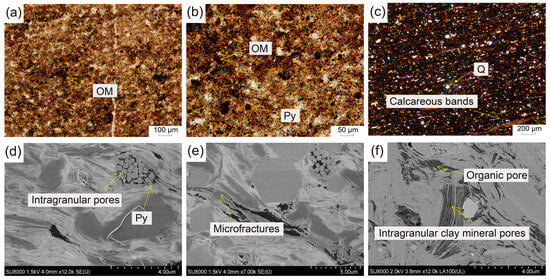
Figure 5.
Optical and SEM photographs of medium-TOC massive mixed mudstone and high-TOC massive mixed mudstone. (a–c) Optical micrographs; (d–f) SEM images. (a,b) Medium-TOC massive mixed mudstone shows granular minerals embedded within organic-clay complexes with dispersed OM; (c) High-TOC massive mixed mudstone exhibits oriented detrital grains and calcareous bands; (d,e) Medium-TOC massive mixed mudstone displays pyrite intragranular pores and microfractures; (f) High-TOC massive mixed mudstone is characterized by intragranular clay mineral pores filled with pyrobitumen, and abundant nanopores are observed in the pyrobitumen.
HMMM displays poorly developed bedding with a predominantly massive structure, showing dark gray to grayish black, and is characterized by relatively high TOC content (avg. 4.33%) (Figure 3d). The mineral composition is dominated by quartz—feldspar (avg. 34.18%), whereas clay minerals and carbonate minerals occur in lower proportions (avg. 31.47% and 28.35%, respectively). Carbonate minerals are dominated by calcite, with minor dolomite. Carbonate minerals, clay minerals, quartz, and feldspar clasts display homogeneous distribution with horizontal orientation. Furthermore, calcareous laminae can be observed in samples (Figure 5c). Well-developed organic pores are evident, coupled with abundant intragranular clay mineral pores (Figure 5f).
HLSM displays well-developed laminated bedding, showing black, and is characterized by relatively high TOC content (avg. 3.92%) (Figure 3e). The mineral composition is dominated by quartz and feldspar (avg. 55.84%). The laminated distribution of OM can be observed under microscopic observations (Figure 6a,b), and the laminar boundary between the silica-rich laminae of euhedral quartz and organic-rich laminae is very clear (Figure 6b). Siliceous concretions are observed, with their outer zones filled by silica, while their cores contain OM (Figure 6a). Multiple pore types are developed, primarily including organic pores and intragranular pores, with locally occurring microfractures (Figure 6d,e).
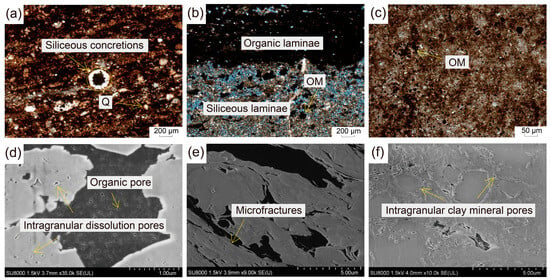
Figure 6.
Optical and SEM photographs of high-TOC laminated siliceous mudstone and laminated argillaceous mudstone. (a–c) Optical micrographs; (d–f) SEM images. (a) High-TOC laminated siliceous mudstone shows siliceous nodules; (b) High-TOC laminated siliceous mudstone exhibits siliceous laminae interbedded with organic-rich laminae; (c) Laminated argillaceous mudstone with dispersed dark OM; (d) High-TOC laminated siliceous mudstone displays abundant organic pores and intragranular pores; (e) High-TOC laminated siliceous mudstone features localized microfractures; (f) Laminated argillaceous mudstone shows abundant clay mineral intragranular pores.
LAM displays well-developed laminated bedding, shows light gray, and is characterized by variable but generally low TOC content (avg. 1.65%) (Figure 3f). The mineral composition is mainly composed of clay minerals (avg. 55.25%). Terrigenous clastic grains consist of quartz and feldspar, with sparsely scattered dark OM (Figure 6c). Abundant intragranular pores are developed in clay minerals (Figure 6f).
4.2. Pore Structure Characteristics of Different Mudstone Lithofacies
The key distinction between shale reservoirs and conventional reservoirs is sourced from their complex microscopic pore structure. Consequently, pore structure plays a crucial role in shale gas storage capacity [15,46,47,48,49]. The pore structure parameters for Lower Cambrian mudstone samples in this study are summarized in Table 1.

Table 1.
Pore structure parameters from N2 and CO2 adsorption experiments for mudstones in the SJT, Yichang area.
4.2.1. LMCM
Based on low-pressure N2 adsorption results, LMCM exhibits superimposed H3 and H4 hysteresis loops (Figure 7a), indicating that slit-shaped and narrow fracture pores dominate the pore system [34,50,51]. The CO2 adsorption isotherm displays a Type I curve, where CO2 adsorption exhibits a rapid initial rise followed by gradual stabilization with increasing P/P0, indicating significant microporosity within the samples (Figure 7b). LMCM exhibits average microporous and non-microporous volumes of 0.0003 cm3/g and 0.0073 cm3/g, respectively (Table 1), yielding an average total PV of 0.0076 cm3/g where mesopores dominate (81% of total volume, Figure 8). Average SSA comprises 1.1 m2/g (micropores) and 4.5 m2/g (non-micropores), resulting in an average total surface area of 5.6 m2/g with mesopores accounting for 79% of the total (Figure 8, Table 1). The CO2 pore size distribution curves of LMCM exhibit a bimodal pattern, with primary peaks at 0.5–0.6 nm and 0.7–0.9 nm. The N2 adsorption characterizes non-micropores within the 2–100 nm range, with the domination pore between 2 and 10 nm, while the mesopores ranging from 10 to 50 nm are rare (Figure 9).
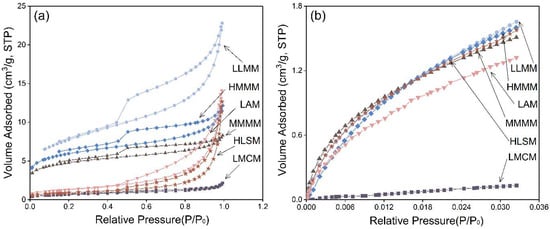
Figure 7.
N2 and CO2 adsorption—desorption curves for representative mudstone lithofacies in the Lower Cambrian SJT, Middle Yangtze region. (a) N2 adsorption–desorption curves; (b) CO2 adsorption—desorption curves.
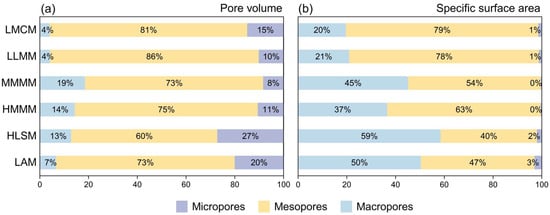
Figure 8.
Pore size distribution (micropores, mesopores, and macropores) across mudstone lithofacies in the Lower Cambrian SJT, Middle Yangtze region. (a) PV distribution; (b) SSA distribution.
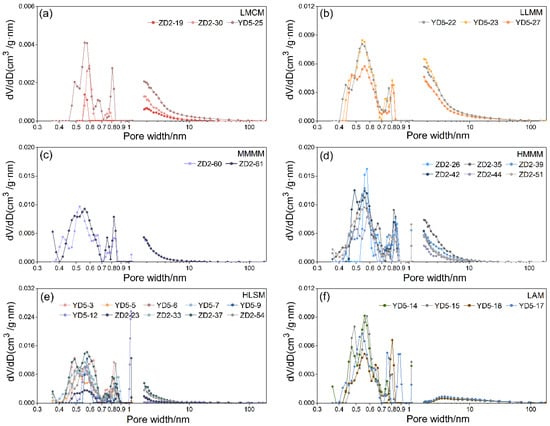
Figure 9.
Pore size distribution across lithofacies in the SJT mudstones (Yichang area) from CO2 and N2 adsorption experiments. (a) The pore size distribution of low-TOC massive calcareous mudstone; (b) The pore size distribution of low-TOC laminated mixed mudstone; (c) The pore size distribution of medium-TOC massive mixed mudstone; (d) The pore size distribution of high-TOC massive mixed mudstone; (e) The pore size distribution of high-TOC laminated siliceous mudstone; (f) The pore size distribution of laminated argillaceous mudstone.
4.2.2. LLMM
LLMM displays superimposed H2–H3 hysteresis loops (Figure 7a), indicating prevalent tetrahedrally open slit-shaped pores and ink-bottle pores with narrow necks. The CO2 adsorption isotherm exhibits a Type I curve, confirming substantial microporosity (Figure 7b). LLMM exhibits average microporous and non-microporous volumes of 0.00144 cm3/g and 0.0320 cm3/g, respectively (Table 1), yielding an average total PV of 0.0334 cm3/g where mesopores dominate (86% of total volume, Figure 8). Average SSA comprises 5.1 m2/g (micropores) and 19.0 m2/g (non-micropores), resulting in an average total surface area of 24.0 m2/g, with mesopores accounting for 78% of the total (Figure 8, Table 1). The CO2 adsorption pore size distribution curve exhibits a bimodal pattern with primary peaks in the 0.5–0.6 nm and 0.7–0.9 nm ranges. Concurrently, the N2 adsorption distribution demonstrates a dominance of 2–10 nm mesopores, while 10–50 nm mesopores are notably diminished and macropores remain scarce (Figure 9).
4.2.3. MMMM
MMMM displays superimposed H2–H3 hysteresis loops (Figure 7a), indicating prevalent tetrahedrally open slit-shaped pores and ink-bottle pores with narrow necks. The CO2 adsorption isotherm exhibits a Type I curve, confirming substantial microporosity (Figure 7b). MMMM exhibits average microporous and non-microporous volumes of 0.00204 cm3/g and 0.0085 cm3/g, respectively (Table 1), yielding an average total PV of 0.0105 cm3/g, where mesopores dominate (73% of total volume, Figure 8). Average SSA comprises 7.2 m2/g (micropores) and 8.7 m2/g (non-micropores), resulting in an average total surface area of 15.9 m2/g with mesopores accounting for 54% of the total (Figure 8, Table 1). The CO2 adsorption pore size distribution curve exhibits a trimodal pattern with primary peaks in the 0.50–0.70 nm, 0.70–0.80 nm, and 0.80–0.90 nm ranges. Concurrently, the N2 adsorption distribution demonstrates a dominance of 2–10 nm mesopores, while 10–50 nm mesopores are notably diminished and macropores remain scarce (Figure 9).
4.2.4. HMMM
HMMM displays superimposed H2–H3 hysteresis loops (Figure 7a), indicating prevalent tetrahedrally open slit-shaped pores and ink-bottle pores with narrow necks. The CO2 adsorption isotherm exhibits a Type I curve, confirming substantial microporosity (Figure 7b). HMMM exhibits average microporous and non-microporous volumes of 0.00234 cm3/g and 0.0122 cm3/g, respectively (Table 1), yielding an average total PV of 0.0144 cm3/g, where mesopores dominate (75% of total volume, Figure 8). Micropores contribute minimally to the total volume. Average SSA comprises 7.0 m2/g (micropores) and 12.2 m2/g (non-micropores), resulting in an average total surface area of 19.2 m2/g, with mesopores accounting for 63% of the total (Figure 8, Table 1). The CO2 adsorption pore size distribution curve exhibits a bimodal pattern with primary peaks in the 0.5–0.6 nm and 0.7–0.9 nm ranges. Concurrently, the N2 adsorption distribution demonstrates a dominance of 2–10 nm mesopores, while 10–50 nm mesopores are notably diminished and macropores remain scarce (Figure 9).
4.2.5. HLSM
HLSM primarily displays superimposed H3–H4 hysteresis loops (Figure 7a), indicating prevalent plate-like slits and narrow fracture pores. The CO2 adsorption isotherm exhibits a Type I curve, confirming substantial microporosity (Figure 7b). HLSM exhibits average microporous and non-microporous volumes of 0.00200 cm3/g and 0.0130 cm3/g, respectively (Table 1), yielding an average total PV of 0.0150 cm3/g, where mesopores dominate (60% of total volume, Figure 8). Micropores contribute minimally to the total volume. Average SSA comprises 6.4 m2/g (micropores) and 4.5 m2/g (non-micropores), resulting in an average total surface area of 10.9 m2/g, with mesopores accounting for 40% of the total (Figure 8, Table 1). The CO2 adsorption pore size distribution curve exhibits a trimodal pattern with primary peaks at 0.40–0.50 nm, 0.55–0.65 nm, and 0.75–0.85 nm. Concurrently, the N2 adsorption distribution demonstrates a dominance of 2–10 nm mesopores, while 10–50 nm mesopores are notably diminished and macropores remain scarce (Figure 9).
4.2.6. LAM
LAM primarily displays superimposed H3–H4 hysteresis loops (Figure 7a), indicating prevalent plate-like slits and narrow fracture pores. The CO2 adsorption isotherm exhibits a Type I curve, confirming substantial microporosity (Figure 7b). LAM exhibits average micropore and non-micropore volumes of 0.00137 cm3/g and 0.0190 cm3/g, respectively (Table 1), yielding an average total PV of 0.0203 cm3/g where mesopores dominate (73% of total volume, Figure 8), with micropores accounting for a relatively small proportion. The average SSA comprises 4.7 m2/g (micropores) and 4.5 m2/g (non-micropores), resulting in an average total surface area of 9.2 m2/g, with mesopores accounting for 47% of the total (Figure 8, Table 1). The CO2 adsorption pore size distribution curve exhibits a trimodal pattern with primary peaks in the 0.40–0.50 nm, 0.55–0.65 nm, and 0.75–0.85 nm ranges. Concurrently, the N2 adsorption distribution demonstrates a dominance of 2–10 nm mesopores, while 10–50 nm mesopores are notably diminished and macropores remain scarce (Figure 9).
Box plots of micropore, non-micropore, and total PV across lithofacies (Figure 10) reveal the following: LLMM possesses the highest non-micropore and total PV but the lowest micropore volume, LAM has the second highest in non-micropore and total PV, HMMM exhibits the highest micropore volume, MMMM follows with the second-highest micropore volume, and LMCM shows the lowest values in all three volume categories.

Figure 10.
Box plots showing (a) micropore volume, (b) non-micropore volume, and (c) total PV for different mudstone lithofacies in the Lower Cambrian SJT, Middle Yangtze region.
5. Discussion
5.1. Influencing Factors of Pore Development in Lower Cambrian Shale Reservoirs
Shale reservoir pores are controlled by multiple geological factors, especially TOC content and mineral composition, which critically govern pore development [52,53,54,55].
5.1.1. TOC
TOC content plays a key role in controlling pore development in shale reservoirs [56,57]. OM serves not only as the fundamental source for hydrocarbon generation but also develops abundant nanoscale pores during thermal maturation, thereby providing essential storage capacity for shale gas enrichment [22]. It is widely accepted that higher TOC content in shale reservoirs correlates with a greater abundance of nanoscale pores and organic-matter shrinkage fractures [58,59]. However, excessive TOC levels may induce organic pore collapse, reducing overall porosity [60]. Furthermore, organic acids generated during the thermal maturation of OM can dissolve chemically unstable minerals (e.g., feldspar and carbonates), forming dissolution pores [61,62]. Thus, the relationship between pore development and TOC in Lower Cambrian mudstones of different lithofacies is complex.
In this study, a positive correlation between TOC and micropore volume/surface area in SJT mudstones indicates the preferential development of micropores in OM (Figure 11a,b). Non-micropore volume and surface area exhibit bimodal distributions with TOC (Figure 11c,d): when the TOC content is low, interparticle and intraparticle pores from clay minerals in mixed/argillaceous mudstones increase non-micropore volume; when the TOC content increases to 3–5%, organic pores dominate in siliceous/mixed mudstones, sustaining elevated non-micropore volumes while surface area peaks within 4.5–6.5% TOC due to complex organic pore morphology; above 5% TOC, non-micropore volume declines in siliceous/mixed mudstones, likely from the collapse of larger organic pores.
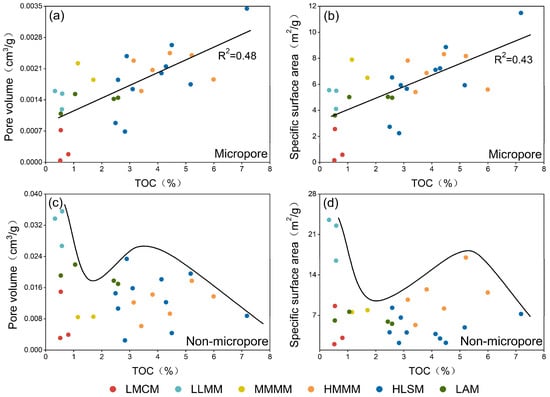
Figure 11.
Cross-plots of TOC content versus (a) micropore volume, (b) micropore SSA, (c) non-micropore volume, and (d) BET SSA for mudstones in the Lower Cambrian SJT, Middle Yangtze region (R2 denotes the correlation coefficient. The curves in Figure 11c and Figure 11d depict the overall trends of non-micropore PV and SSA versus TOC content, respectively).
5.1.2. Clay Minerals
Clay minerals significantly influence shale reservoir pore development due to their abundant micropores and substantial SSA [63,64]. Within clay minerals, illite and illite/smectite mixed-layer clays predominantly exhibit platy, laminated, and fibrous crystal habits, hosting abundant nanoscale inorganic intraparticle pores between mineral layers [65,66]. Furthermore, clay minerals can absorb and retain diverse geofluids (e.g., pore water, oil, and natural gas) due to their adsorption capacities. This molecular-scale adsorption alters the overall pore architecture and reduces the effective porosity in shale reservoirs [16].
In this study, micropore volume and SSA in the Lower Cambrian SJT mudstones generally follow a normal distribution relationship with clay mineral content (Figure 12a,b). A whole-rock XRD analysis reveals that calcite content remains nearly constant with increasing clay mineral content, while quartz and feldspar contents decrease [67]. Increased intragranular clay mineral pores’ storage capacity outweighs the loss from reduced interparticle pores and feldspar dissolution pores. Furthermore, when clay mineral content ranges between 30% and 50%, micropore volume and SSA reach their maxima. Non-micropore pore volume and SSA exhibit limited correlation with clay mineral content (Figure 12c,d). In LLMM and HLSM lithofacies, non-micropore volume correlates moderately with clay content, while micropore volume shows poor correlation, indicating that clay minerals contribute to non-micropore development.
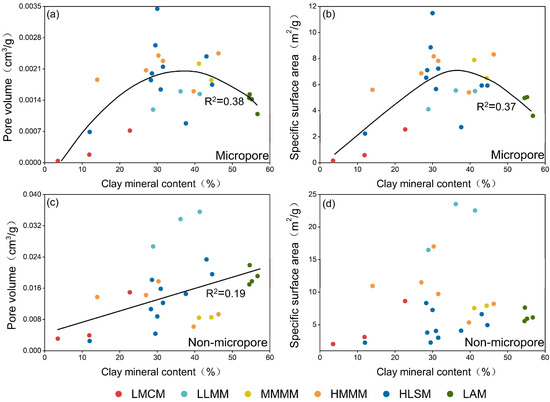
Figure 12.
Cross-plots of clay mineral content versus (a) micropore volume, (b) micropore SSA, (c) non-micropore volume, and (d) BET SSA for mudstones in the Lower Cambrian SJT, Middle Yangtze region (R2 denotes the correlation coefficient. The curves in Figure 12a and Figure 12b depict the overall trends of micropore PV and SSA versus clay mineral content, respectively).
5.1.3. Siliceous Minerals
Siliceous minerals (quartz and feldspar) significantly influence shale reservoir pore development. Quartz, with its rigid grains, shields organic pores from compaction, preserving interparticle pores between detrital grains [68,69]. These pores provide storage for migrated bitumen and organic pores. Extensive biogenic quartz further forms a rigid framework that protects primary interparticle pores and organic pores from compaction [70,71]. However, excessive biogenic quartz may cause intense silica cementation, deteriorating pore development [72]. Feldspar grains also contribute to primary interparticle pores. Additionally, feldspars are highly susceptible to dissolution in acidic fluids, creating secondary porosity that enhances reservoir quality [73,74,75].
In this study, both PV and SSA of the Lower Cambrian SJT mudstones exhibit normal distribution patterns with siliceous mineral content. (Figure 13). When siliceous mineral content drops below 30%, the mudstone lithofacies are dominated by LMCM, LLMM, and MMMM. In these three lithofacies, both organic and inorganic pores remain poorly developed, leading to lower total PV and SSA. When siliceous mineral content exceeds 60%, mudstone lithofacies are dominated by HLSM. Inorganic pores of HLSM remain underdeveloped, while elevated TOC levels may collapse larger organic pores into smaller apertures. Furthermore, high quartz content can trigger intense silica cementation, resulting in reduced total porosity [76]. Only when the siliceous mineral content is between 30 and 60% do both PV and SSA remain high. In this range, mudstone lithofacies are predominantly HMMM and HLSM. Pore types are likely diverse, including both inorganic pores (e.g., intraparticle clay mineral pores, feldspar intraparticle dissolution pores) and organic pores. Furthermore, a suitable siliceous mineral content is more conducive to preserving organic pores.
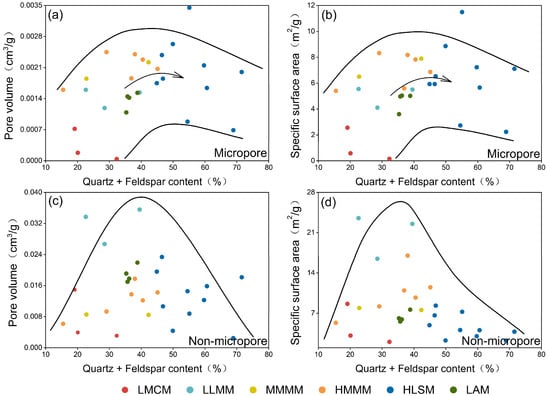
Figure 13.
Cross-plots of silica content versus (a) micropore volume, (b) micropore SSA, (c) non-micropore volume, and (d) BET SSA for mudstones in the Lower Cambrian SJT, Middle Yangtze region (R2 denotes the correlation coefficient. The curves in this figure depict the overall trends of PV and SSA for both micropore and non-micropore systems with respect to silica content variation. The arrows in Figure 13a and Figure 13b indicate the variation trend of micropore PV and SSA with silica content.).
5.2. Implications for Lower Cambrian Shale Gas Exploration
Significant variations in composition, TOC, and diagenetic pathways across mudstone lithofacies result in distinct microporous structures, gas-bearing characteristics, and fracability potentials, thereby impeding favorable reservoir predictions [77,78]. This study establishes an integrated evaluation framework based on TOC, pore structure, and brittleness proxy to identify optimal shale gas targets within the SJT lithofacies.
LLMM exhibits the largest total PV and SSA (Figure 14). Its pore space is dominated by inorganic pores (Figure 4), with a significant proportion of mesopores (Figure 8). It also features well-developed microfractures and good pore connectivity. Although this lithofacies has low TOC content and relatively weak self-sourcing hydrocarbon generation capacity, it can still form favorable shale gas reservoirs if hydrocarbons generated from adjacent high-quality source rocks undergo short-distance migration and accumulate within it. Additionally, this mudstone lithofacies has a brittleness index of 39.1% (Figure 14), indicating moderate fracability, which also restricts its exploration and development potential as the highest-quality shale gas target.
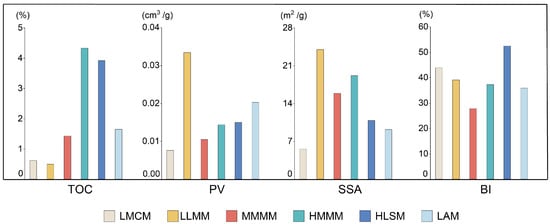
Figure 14.
Comparison of TOC, total PV, SSA, and brittleness index among different mudstone lithofacies in the Lower Cambrian SJT, Middle Yangtze region. Note: Brittleness Index = (Quartz + Dolomite + Pyrite)/(Quartz + Calcite + Dolomite + Clay Minerals) × 100% (modified from Reference [79]).
HLSM are characterized by high total PV and surface area (Figure 14), with well-developed macropores (Figure 8). Their pore types are diverse, including organic pores and intragranular dissolution pores (Figure 6). HLAM with high TOC content exhibits strong self-sourcing capacity. Furthermore, its brittleness index is 52.5% (Figure 14), the highest among mudstones, ensuring excellent hydraulic fracturing performance. These properties make it the top target for shale gas exploration.
LAM have high non-micropore volume (Figure 8), second only to low-TOC massive mixed mudstones. However, they show low total micropore volume and SSA. Their pores are mainly composed of intragranular clay mineral pores (Figure 6). With an average brittleness index of 35.9% (Figure 14), these mudstones exhibit poor fracability. HMMM have lower total PV and SSA than other lithofacies (Figure 14). However, these mudstones show more developed micropores (Figure 10). This lithofacies is characterized by well-developed intragranular clay mineral pores with good connectivity (Figure 6), has an average porosity of 2.34%, and has an average brittleness index of 37.3% (Figure 14), consequently exhibiting poor fracability. MMMM also display lower total PV and SSA (Figure 14), indicating poorer overall pore development. Pores consist primarily of intragranular pores and microfractures, but organic pores are poorly developed (Figure 5). The average porosity is 2.29% and the average brittleness index is 27.8% (Figure 14), leading to poor fracability. LMCM demonstrate the poorest pore development (Figure 14). This lithofacies has the lowest average porosity (1.2%), total PV, and SSA, resulting in inferior reservoir quality. Thus, all these lithofacies represent relatively poor reservoir rocks.
Shale gas exploration targeting diverse Lower Cambrian reservoir types in the Sichuan Basin (especially central Sichuan) has achieved a major breakthrough. Both high-TOC and low-TOC mudstones can form shale gas reservoirs [10,80,81], significantly shifting the exploration focus beyond solely targeting organic-rich shales. Currently, most scholars believe that high-quality shale gas reservoirs in the Lower Cambrian of the Middle Yangtze region are mainly found in organic-rich shales. However, a few studies have indicated that organic pores are better developed in medium-TOC shales than in high-TOC shales [24]. Based on the TOC, pore structure, and brittleness characteristics of the SJT mudstones, high-TOC laminated siliceous mudstones remain the most favorable target for shale gas exploration. LLMM and LAM also show potential. This indicates that Lower Cambrian shale gas exploration in the Middle Yangtze should extend beyond organic-rich siliceous intervals to include organic-bearing mudstones (TOC < 1%), thus advancing exploration and development in the region.
6. Conclusions
Twenty-eight shale samples from the Lower Cambrian Shuijingtuo Formation (SJT) in the Middle Yangtze region, China, were selected for lithofacies classification to characterize pore structures and identify favorable lithofacies. The key outcomes of this study are as follows:
(1) The Lower Cambrian SJT mudstones in the Middle Yangtze region are characterized by six dominant lithofacies, including low-TOC massive calcareous mudstone (LMCM), low-TOC laminated mixed mudstone (LLMM), medium-TOC massive mixed mudstone (MMMM), high-TOC massive mixed mudstone (HMMM), high-TOC laminated siliceous mudstone (HLSM), and laminated argillaceous mudstone (LAM). Notably, the LLMM facies exhibits optimal pore structure parameters (e.g., PV) with prevalent interparticle pores, intraparticle dissolution pores, and microfractures. Meanwhile, both HLSM and LAM demonstrate favorable pore characteristics. HLSM develops organic and intraparticle pores, whereas LAM primarily contains clay mineral intraparticle pores.
(2) The pore structure of the Lower Cambrian SJT in the Middle Yangtze region is mainly controlled by TOC, clay mineral content, and silica content. Specifically, TOC exerts the strongest influence on micropore development, while clay minerals demonstrate a greater impact on non-micropore volume. Silica content exhibits more complex relationships with pore systems, though maintaining optimal silica levels (>35%) effectively sustains shale reservoir porosity.
(3) Based on an integrated analysis of the TOC, pore structure, and brittleness index across shale lithofacies, the most promising exploration targets in the Middle Yangtze region are high-TOC laminated siliceous mudstone (HLSM) and low-TOC laminated mixed mudstone (LLMM). This finding provides strategic guidance for future Lower Cambrian shale gas exploration.
Author Contributions
J.F.: Conceptualization, Methodology, Writing—original draft. W.L.: Writing—review and editing, Visualization. Y.Q. Data curation, Visualization. J.L.: Investigation, Visualization. Q.Z.: Resources, Supervision. P.G.: Methodology, Resources, Writing—review and editing. All authors have read and agreed to the published version of the manuscript.
Funding
This work was supported by the CNPC Innovation Fund (2022DQ02-0107) and the National Natural Science Foundation of China (42272140). We also thank the Cores and Samples Center of Nature Resources, China Geological Survey for providing core samples.
Data Availability Statement
The original contributions presented in this study are included in the article. Further inquiries can be directed to the corresponding author.
Conflicts of Interest
The authors declare no conflicts of interest.
References
- Liu, W.; Gao, P.; Xiao, X.M.; Zhao, Y.M.; Xing, Y.J.; Li, J.K. Variable depositional environments and organic matter enrichment of Early Cambrian shales in the Middle Yangtze region, South China. J. Asian Earth Sci. 2024, 259, 105874. [Google Scholar] [CrossRef]
- Xiao, X.M.; Wang, M.L.; Wei, Q.; Tian, H.; Pan, L.; Li, T.F. Evaluation of Lower Paleozoic Shale with Shale Gas Prospect in South China. Nat. Gas Geosci. 2015, 26, 1433–1445. [Google Scholar]
- Zhao, W.Z.; Li, J.Z.; Yang, T.; Wang, S.F.; Huang, J.L. Geological difference and its significance of marine shale gases in South China. Pet. Explor. Dev. 2016, 43, 499–510. [Google Scholar] [CrossRef]
- Zhang, T.W.; Zhang, Y.J.; Jia, M.; Shao, D.Y.; Yan, J.P. Key Scientific Issues on Controlling the Variation of Gas Contents of Cambrian Marine Shales in, Southern China. Bull. Mineral. Petrol. Geochem. 2018, 37, 572–579. [Google Scholar]
- Wu, Y.; Fan, T.L.; Jiang, S.; Yang, X.Q. Lithofacies and sedimentary sequence of the lower Cambrian Niutitang shale in the upper Yangtze platform, South China. J. Nat. Gas Sci. Eng. 2017, 43, 124–136. [Google Scholar] [CrossRef]
- Dong, D.Z.; Zou, C.N.; Yang, H.; Wang, Y.M.; Li, X.J.; Chen, G.S.; Wang, S.Q.; Lü, Z.G.; Huang, Y.B. Progress and prospects of shale gas exploration and development in China. Acta Pet. Sin. 2012, 33, 107–114. [Google Scholar]
- Zhou, H.; Dong, X.X.; Wei, L.M.; Wang, T.; Zhang, N.X.; Luo, S.C. Characteristics on silty shale reservoirs of Qiongzhusi Formation, Jingyan-Qianwei area. Nat. Gas Technol. Econ. 2023, 17, 23–31. [Google Scholar]
- Xing, Y.J.; Xiao, X.M.; Cheng, P.; Zhao, Y.M.; Liu, W. Water adsorption performance of over-mature shale and its relationship with organic and inorganic nanopores: A case study of Lower Cambrian shale from the Sichuan Basin, China. Pet. Sci. 2025, 22, 977–997. [Google Scholar] [CrossRef]
- Guo, T.L.; Deng, H.C.; Zhao, S.; Wei, L.M.; He, J.H. Formation mechanisms and exploration breakthroughs of new type of shale gas in Cambrian Qiongzhusi Formation, Sichuan Basin, SW China. Pet. Explor. Dev. 2025, 52, 57–69. [Google Scholar] [CrossRef]
- Guo, T.L.; Xiong, L.; He, J.H.; Wei, L.M.; Yan, L. New Type Shale Gas Exploration Discovery and Enlightenment of the Lower Cambrian Qiongzhusi Formation in the Southern Sichuan Basin. J. Southwest Pet. Univ. (Sci. Technol. Ed.) 2024, 46, 1–14. [Google Scholar]
- Guo, T.L.; Xiong, L.; Ye, S.J.; Dong, X.X.; Wei, L.M.; Yang, Y.T. Theory and practice of unconventional gas exploration in carrier beds:Insight from the breakthrough of new type of shale gas and tight gas in Sichuan Basin, SW China. Pet. Explor. Dev. 2023, 50, 24–37. [Google Scholar] [CrossRef]
- Ma, X.H.; Zhang, X.W.; Xiong, W.; Liu, Y.Y.; Gao, J.L.; Yu, R.Z.; Sun, Y.P.; Wu, J.; Kang, L.X.; Zhao, S.P. Prospects and challenges of shale gas development in China. Pet. Sci. Bull. 2023, 8, 491–501. [Google Scholar]
- He, X.; Liang, F.; Li, H.; Zheng, M.J.; Zhao, Q.; Liu, Y.; Liu, W.P. Breakthrough and enrichment mode of marine shale gas in the Lower Cambrian Qiongzhusi Formation in high-yield wells in Sichuan Basin. China Pet. Explor. 2024, 29, 142–155. [Google Scholar]
- Chen, X.H.; Wang, C.S.; Liu, A.; Luo, S.Y.; Li, H.; Wei, K. The discovery of the shale gas in the Cambrian Shuijingtuo Formation of Yichang area, Hubei Province. Geol. China 2017, 44, 188–189. [Google Scholar]
- Gao, B.; Liu, Z.B.; Shu, Z.G.; Liu, H.T.; Wang, R.Y.; Jin, Z.G.; Wang, G.P. Reservoir characteristics and exploration of the Lower Cambrian shale gas in the Middle-Upper Yangtze area. Oil Gas Geol. 2020, 284–294. [Google Scholar]
- Li, G.; Xiao, X.M.; Gai, H.F.; Lu, C.G.; Feng, Y. Nanopore structures and controlling factors of the Early Cambrian shale reservoir in the Middle Yangtze Platform, South China. J. Asian Earth Sci. 2023, 254, 105738. [Google Scholar] [CrossRef]
- Zhao, Y.M.; Gao, P.; Xiao, X.M.; Zhou, Q. Organic petrological characteristics and comprehensive evaluation of maturity of the Lower Cambrian shale in Middle-Upper Yangtze region. Geochimica 2024, 53, 386–398. [Google Scholar]
- Li, J.K.; Gao, P.; Xiao, X.M.; Lash, G.G.; Li, S.J.; Liu, W. Widespread coastal upwelling along the marginal Yangtze Platform (South China) during the early Cambrian: Implications for hyper-enrichment of organic matter. Palaeogeogr. Palaeoclimatol. Palaeoecol. 2024, 656, 112569. [Google Scholar] [CrossRef]
- Zhang, J.F.; Xu, H.; Zhou, Z.; Ren, P.F.; Guo, J.Z.; Wang, Q. Geological characteristics of shale gas reservoir in Yichang area, western Hubei. Acta Pet. Sin. 2019, 40, 887–899. [Google Scholar]
- Dai, B. Characteristics of Shale Reservoirs of the Lower Cambrian Series Niutitang Formation in the Western Partof Hunan and Hubei in the Middle of Yangtze Area. Master’s Thesis, Yangtze University, Wuhan, China, 2019. [Google Scholar]
- Ma, Z.J.; Tang, X.; Deng, E.D.; Liu, Y.; Wang, Y.F.; Zhang, J.Z.; Liang, G.D.; Zhang, J.C.; Luo, H. Lithofacies and its controls on the organic matter-hosted pores in the Cambrian gas-rich Niutitang shale in upper Yangtze Plate, China. J. Pet. Sci. Eng. 2022, 218, 111052. [Google Scholar] [CrossRef]
- He, Q.; He, S.; Dong, T.; Zhai, G.Y.; Wang, Y.; Wan, K. Pore structure characteristics and controls of Lower Cambrian Niutitang Formation, western Hubei Province. Pet. Geol. Exp. 2019, 41, 530–539. [Google Scholar]
- Li, H.; Liu, A.; Luo, S.Y.; Chen, X.H.; Chen, L. Pore structure characteristics and development control factors of Cambrian shale in the Yichang area, western Hubei. Pet. Geol. Recovery Effic. 2018, 25, 16–23. [Google Scholar]
- Shao, D.Y.; Zhang, Y.; Song, H.; Meng, K.; Luo, H.; Li, Y.F.; Wu, C.J.; Tang, X.; Zhang, T.W. Discussion on reservoir characteristics and main controlling factors of the Cambrian shale in Middle-Upper Yangtze region. J. Northwest Univ. (Nat. Sci. Ed.) 2022, 52, 997–1012. [Google Scholar]
- Xu, L.L.; Wen, J.H.; Wen, Y.R.; Wang, Y.; Zhang, Y.L.; Xie, T.; Ren, Z.J.; Luo, F.; Hu, J.L. Geological Characteristics and Prospecting Results of Marine Shale Gas of Western Hubei, Middle Yangtze. Resour. Environ. Eng. 2021, 35, 611–624. [Google Scholar]
- Xu, L.L.; Liu, Z.X.; Wen, Y.R.; Zhou, X.H.; Luo, F. Shale Gas Reservoir and Gas-Bearing Properties of Middle Yangtze Niutitang Formation in Western Hubei. Spec. Oil Gas Reserv. 2020, 27, 1–9. [Google Scholar]
- Luo, F.; Wang, Y.; Xu, L.L.; Zhou, X.H.; Chen, W. Characteristics and Geological Significance of Rare Earth Elements in Organic-Rich Shale of Niutitang Formation in Yichang Area, Western Hubei. Resour. Environ. Eng. 2022, 36, 572–579. [Google Scholar]
- Zhang, Y.L.; Duan, K.; Liu, Z.X.; Jin, C.S.; Chen, K.; Luo, F. Characteristics of shale and main controlling factors of shale gas enrichment of Lower Cambrian Niutitang Formation in western Hubei. Pet. Geol. Exp. 2019, 41, 691–698. [Google Scholar]
- Luo, S.Y.; Chen, X.H.; Liu, A.; Li, H. Geochemical features and genesis of shale gas from the Lower Cambrian Shuijingtuo Formation shale in Yichang block, Middle Yangtze region. Oil Gas Geol. 2019, 40, 999–1000. [Google Scholar]
- Luo, S.Y.; Chen, X.H.; Li, P.J.; Tang, X.H. Characteristics of conventional and unconventional shale gas displays of the Cambrianstrata in Yichang area, Vest Hubei, and their exploration significance. Geol. Bull. China 2020, 39, 538–551. [Google Scholar]
- Li, G.; Xiao, X.M.; Cheng, B.W.; Lu, C.G.; Feng, Y.; Li, D.S. Main controlling factor and mechanism of gas-in-place content of the Lower Cambrian shale from different sedimentary facies in the western Hubei area, South China. Pet. Sci. 2024, 21, 1488–1507. [Google Scholar] [CrossRef]
- Tian, H.; Pan, L.; Xiao, X.M.; Wilkins, R.W.T.; Meng, Z.P.; Huang, B.J. A preliminary study on the pore characterization of Lower Silurian black shales in the Chuandong Thrust Fold Belt, southwestern China using low pressure N2 adsorption and FE-SEM methods. Mar. Pet. Geol. 2013, 48, 8–19. [Google Scholar] [CrossRef]
- Sun, J.; Xiao, X.; Wei, Q.; Cheng, P.; Tian, H.; Wu, Y. Gas in place and its controlling factors of the shallow Longmaxi shale in the Xishui area, Guizhou, China. J. Nat. Gas Sci. Eng. 2020, 77, 103272. [Google Scholar] [CrossRef]
- Sing, K.S.W. Reporting physisorption data for gas/solid systems with special reference to the determination of surface area and porosity (Recommendations 1984). Pure Appl. Chem. 1985, 57, 603–619. [Google Scholar] [CrossRef]
- Barrett, E.P.; Joyner, L.G.; Halenda, P.P. The Determination of Pore Volume and Area Distributions in Porous Substances. I. Computations from Nitrogen Isotherms. J. Am. Chem. Soc. 1951, 73, 373–380. [Google Scholar] [CrossRef]
- Liu, B.; Nakhaei-Kohani, R.; Bai, L.H.; Wen, Z.G.; Gao, Y.F.; Tian, W.C.; Yang, L.; Liu, K.Q.; Hemmati-Sarapardeh, A.; Ostadhassan, M. Integrating advanced soft computing techniques with experimental studies for pore structure analysis of Qingshankou shale in Southern Songliao Basin, NE China. Int. J. Coal Geol. 2022, 257, 103998. [Google Scholar] [CrossRef]
- Liu, B.; Bechtel, A.; Gross, D.; Fu, X.F.; Li, X.N.; Sachsenhofer, R. Middle Permian environmental changes and shale oil potential evidenced by high-resolution organic petrology, geochemistry and mineral composition of the sediments in the Santanghu Basin, Northwest China. Int. J. Coal Geol. 2018, 185, 119–137. [Google Scholar] [CrossRef]
- Slatt, R.M.; Rodriguez, N.D. Comparative sequence stratigraphy and organic geochemistry of gas shales: Commonality or coincidence? J. Nat. Gas Sci. Eng. 2012, 8, 68–84. [Google Scholar] [CrossRef]
- Li, T.W.; Jiang, Z.X.; Xu, C.L.; Yuan, Y.; Wang, P.F.; Liu, G.H.; Zhang, B.; Ning, C.X.; Wang, Z. Effect of sedimentary environment on shale lithofacies in the lower third member of the Shahejie formation, Zhanhua Sag, eastern China. Interpretation 2017, 5, T487–T501. [Google Scholar] [CrossRef]
- Li, T.W.; Jiang, Z.X.; Xu, C.L.; Yuan, Y.; Wang, P.F.; Liu, G.H.; Zhang, B.; Ning, C.X.; Wang, Z. Effect of pore structure on shale oil accumulation in the lower third member of the Shahejie formation, Zhanhua Sag, eastern China: Evidence from gas adsorption and nuclear magnetic resonance. Mar. Pet. Geol. 2017, 88, 932–949. [Google Scholar] [CrossRef]
- Ruppel, S.C.; Reed, R.M.; Loucks, R.G. Spectrum of pore types and networks in mudrocks and a descriptive classification for matrix-related mudrock pores. AAPG Bull. 2012, 96, 1071–1098. [Google Scholar]
- Tang, X.L.; Jiang, Z.X.; Huang, H.X.; Jiang, S.; Yang, L.; Xiong, F.Y.; Chen, L.; Feng, J. Lithofacies characteristics and its effect on gas storage of the Silurian Longmaxi marine shale in the southeast Sichuan Basin, China. J. Nat. Gas Sci. Eng. 2016, 28, 338–346. [Google Scholar] [CrossRef]
- Wang, Y.M.; Wang, S.F.; Dong, D.Z.; Li, X.J.; Huang, J.L.; Zhang, C.C.; Guan, Q.Z. Lithofacies characterization of Longmaxi Formation of the Lower Silurian, southern Sichuan. Earth Sci. Front. 2016, 23, 119–133. [Google Scholar]
- Ma, Z.J.; Tang, X.; Zhang, J.C.; Zhai, G.Y.; Wang, Y.F.; Liang, G.D.; Luo, H. Organic matter-hosted pores in the Cambrian Niutitang shales of the Upper Yangtze region: Pore development characteristics and main controlling factors. Earth Sci. Front. 2023, 30, 124–137. [Google Scholar]
- Li, Y.; Xu, L.F.; Wu, P.; Hu, W.Q.; Liu, C.; Li, M. Lithofacies characteristics and reservoir differences of marine-continental transitional shale in the eastern margin of the Ordos Basin. Nat. Gas Ind. 2023, 43, 38–54. [Google Scholar]
- Dong, X.X.; Xiong, L. Microscopic space types and its influencing factors of the lower Cambrian Qiongzhusi shale, southern Sichuan basin. Comput. Tech. Geophys. Geochem. Explor. 2016, 38, 415–422. [Google Scholar]
- Wang, C.H. The Lower Cambrain Marine Shale Porosity Evolution of Qiongzhusi Formation in JingYan—Qianwei Area. Master’s Thesis, Chengdu University of Technology, Chengdu, China, 2017. [Google Scholar]
- Liu, Z.B.; Gao, B.; Wu, Q.Z.; Wang, R.Y.; Nie, H.K.; Zhang, Y.Y. Organic-inorganic compound pore system and its gas-controlling significance: A case study of the Cambrian Qiongzhusi Formation in southwestern Sichuan Basin. Mar. Orig. Pet. Geol. 2018, 23, 42–50. [Google Scholar]
- Qian, Y.J.; Gao, P.; Fang, X.L.; Sun, F.R.; Cai, Y.D.; Zhou, Y.F. Microstructure Characterization Techniques for Shale Reservoirs: A Review. Front. Earth Sci. 2022, 10, 930474. [Google Scholar] [CrossRef]
- Thommes, M.; Kaneko, K.; Neimark, A.V.; Olivier, J.P.; Rodriguez-Reinoso, F.; Rouquerol, J.; Sing, K.S.W. Physisorption of gases, with special reference to the evaluation of surface area and pore size distribution (IUPAC Technical Report). Pure Appl. Chem. 2015, 87, 1051–1069. [Google Scholar] [CrossRef]
- Wang, Y.; Zhu, Y.M.; Chen, S.B.; Li, W. Characteristics of the Nanoscale Pore Structure in Northwestern Hunan Shale Gas Reservoirs Using Field Emission Scanning Electron Microscopy, High-Pressure Mercury Intrusion, and Gas Adsorption. Energy Fuels 2014, 28, 945–955. [Google Scholar] [CrossRef]
- Jarvie, D.M.; Hill, R.J.; Ruble, T.E. Unconventional shale-gas systems: The Mississippian Barnett Shale of north-central Texas as one model for thermogenic shale-gas assessment. AAPG Bull. 2007, 91, 475–499. [Google Scholar] [CrossRef]
- Mastalerz, M.; Drobniak, A.; Schimmelmann, A. Porosity of Devonian and Mississippian New Albany Shale across a maturation gradient: Insights from organic petrology’, gas adsorption, and mercury intrusion. AAPG Bull. 2013, 97, 1621–1643. [Google Scholar] [CrossRef]
- Tao, S.; Chen, S.D.; Tang, D.Z.; Zhao, X.; Xu, H.; Li, S. Material composition, pore structure and adsorption capacity of low-rank coals around the first coalification jump: A case of eastern Junggar Basin, China. Fuel 2018, 211, 804–815. [Google Scholar] [CrossRef]
- Wei, S.; He, S.; Pan, Z.; Zhai, G.; Dong, T.; Guo, X.; Yang, R.; Han, Y.; Yang, W. Characteristics and evolution of pyrobitumen-hosted pores of the overmature Lower Cambrian Shuijingtuo Shale in the south of Huangling anticline, Yichang area, China: Evidence from FE-SEM petrography. Mar. Pet. Geol. 2020, 116, 104303. [Google Scholar] [CrossRef]
- Ross, D.J.K.; Marc Bustin, R. The importance of shale composition and pore structure upon gas storage potential of shale gas reservoirs. Mar. Pet. Geol. 2009, 26, 916–927. [Google Scholar] [CrossRef]
- Valenza, J.J., II; Drenzek, N.; Marques, F.; Pagels, M.; Mastalerz, M. Geochemical controls on shale microstructure. Geology 2013, 41, 611–614. [Google Scholar] [CrossRef]
- Chen, L.; Jiang, Z.; Liu, K.; Wang, P.; Gao, F.; Hu, T. Application of low-pressure gas adsorption to nanopore structure characterisation of organic-rich lower Cambrian shale in the Upper Yangtze Platform, South China. Aust. J. Earth Sci. 2017, 64, 653–665. [Google Scholar] [CrossRef]
- Yang, J.L.; Wang, M.; Li, M.; Yan, Y.; Wang, X.; Shao, H.M.; Yu, C.Q.; Wu, Y.; Xiao, D.S. Shale lithology identification using stacking model combined with SMOTE from well logs. Unconv. Resour. 2022, 2, 108–115. [Google Scholar] [CrossRef]
- Li, J.; Zhou, S.X.; Li, Y.J.; Ma, Y.; Yang, Y.; Li, C.C. Effect of organic matter on pore structure of mature lacustrine organic-rich shale: A case study of the Triassic Yanchang shale, Ordos Basin, China. Fuel 2016, 185, 421–431. [Google Scholar] [CrossRef]
- Xue, L.H.; Yang, W.; Zhong, J.A.; Xu, Y.; Chen, G.J. Porous Evolution of the Organic-Rich Shale from Simulated Experiment with Geological Constrains, Samples from Yanchang Formation in Ordos Basin. Acta Geol. Sin. 2015, 89, 970–978. [Google Scholar]
- Ma, Y. Quantitative Characterization and Application of Organic Acidgeneration and Its Dissolution to Reservoir. Master’s Thesis, China University of Petroleum (East China), Qingdao, China, 2018. [Google Scholar]
- Cai, N.B.; Wang, L.L.; Bao, Y.Y.; Li, Y.P.; Wan, Z.X.; Kang, Z.M.; Luo, S.Y. Reservoir characteristics and natural gas accumulation of shales within the Cambrian Shuijingtuo Formation in the Yichang region, middle Yangtze Platform. Geol. China 2025, 52, 111–130. [Google Scholar]
- Li, C.C.; Zhou, S.X.; Li, J.; Yang, Y.N.; Fu, D.L.; Ma, Y.; Li, Y.J. Pore Characteristics and Controlling Factors of the Yanchang Formation Mudstone and Shale in the South of Ordos Basin. Acta Sedimentol. Sin. 2017, 35, 315–329. [Google Scholar]
- Jiang, T.; Jin, Z.J.; Liu, G.X.; Hu, Z.Q.; Liu, Q.Y.; Liu, Z.B.; Wang, P.W.; Wang, R.Y.; Yang, T.; Wang, G.P. Pore structure characteristics of shale reservoirs in the Ziliujing Formation in Yuanba area, Sichuan Basin. Oil Gas Geol. 2021, 42, 909–918. [Google Scholar]
- Li, X.X.; Gu, Y.T.; Wan, Q.; Yang, S.G. Micro-architecture, deformation and source-reservoir significance of organic-clay composites in shale. Oil Gas Geol. 2023, 44, 452–467. [Google Scholar]
- Chen, W.; Wang, X.Z.; Wei, M.Y.; Zeng, D.M.; Kang, J.H.; Li, Y.; Liu, K.M.; Li, Y.; Hong, H.T.; Zhou, H.F. Lithofacies types and reservoir characteristics of continental shale in the Dongyuemiao Member of Jurassic Ziliujing Formation, eastern Sichuan Basin. J. Palaeogeogr. (Chin. Ed.) 2025, 27, 696–713. [Google Scholar]
- Vaisblat, N.; Harris, N.B.; Ayranci, K.; Chalaturnyk, R.; Power, M.; Twemlow, C.; Minion, N. Petrophysical properties of a siltstone reservoir—An example from the Montney Formation, western Canada. Mar. Pet. Geol. 2022, 136, 105431. [Google Scholar] [CrossRef]
- Zhang, Z.N.; Lin, M.R.; Xi, K.L.; Li, J.M. Pore development characteristics and controlling factors of Lower Cambrian Qiongzhusi shale gas reservoir in Sichuan Basin, China. Unconv. Resour. 2024, 4, 100100. [Google Scholar] [CrossRef]
- Gao, P.; Xiao, X.M.; Hu, D.F.; Lash, G.G.; Liu, R.; Cai, Y.D.; Wang, Z.H.; Zhang, B.Y.; Yuan, T.; Liu, S.Y. Effect of silica diagenesis on porosity evolution of deep gas shale reservoir of the Lower Paleozoic Wufeng-Longmaxi formations, Sichuan Basin. Mar. Pet. Geol. 2022, 145, 105873. [Google Scholar] [CrossRef]
- Macht, F.; Eusterhues, K.; Pronk, G.J.; Totsche, K.U. Specific surface area of clay minerals: Comparison between atomic force microscopy measurements and bulk-gas (N2) and -liquid (EGME) adsorption methods. Appl. Clay Sci. 2011, 53, 20–26. [Google Scholar] [CrossRef]
- Gao, P.; Xiao, X.M.; Hu, D.F.; Lash, G.G.; Liu, R.B.; Zhang, B.Y.; Zhao, Y.M. Comparison of silica diagenesis between the lower Cambrian and lower Silurian shale reservoirs in the middle–upper Yangtze platform (southern China). AAPG Bull. 2024, 108, 971–1003. [Google Scholar] [CrossRef]
- Cao, Y.C.; Yuan, G.H.; Yang, H.J.; Wang, Y.Z.; Liu, K.Y.; Zan, N.M.; Xi, K.L.; Wang, J. Current situation of oil and gas exploration and research progress of the origin of high-quality reservoirs in deep-ultra-deep clastic reservoirs of petroliferous basins. Acta Pet. Sin. 2022, 43, 112–140. [Google Scholar]
- Milliken, K.L.; Curtis, M.E. Imaging pores in sedimentary rocks: Foundation of porosity prediction. Mar. Pet. Geol. 2016, 73, 590–608. [Google Scholar] [CrossRef]
- Li, B.Y.; Pang, X.Q.; Dong, Y.X.; Peng, J.W.; Gao, P.; Wu, H.; Huang, C.; Shao, X.H. Lithofacies and pore characterization in an argillaceous-siliceous-calcareous shale system: A case study of the Shahejie Formation in Nanpu Sag, Bohai Bay Basin, China. J. Pet. Sci. Eng. 2019, 173, 804–819. [Google Scholar] [CrossRef]
- Gao, P.; Xiao, X.M.; Meng, G.M.; Lash, G.G.; Li, S.J.; Han, Y.Q. Quartz types and origins of the Upper Permian Dalong Formation shale of the Sichuan Basin: Implications for pore preservation in deep shale reservoirs. Mar. Pet. Geol. 2023, 156, 106461. [Google Scholar] [CrossRef]
- Xu, L.F.; Deng, J.M.; Du, J.; Li, Y.; Wu, P.; Wu, X.; Hu, W.Q.; Zhao, F.; Zheng, W.; Jiang, Z.X. Lithofacies types and reservoir differences of marine continental transitional shale in Linxing area, eastern margin of Ordos Basin. J. China Coal Soc. 2021, 46, 862–876. [Google Scholar]
- Wang, R.Y.; Wang, G.P.; Zhao, G.; Qian, M.H.; Liu, Y.J.; He, W.L.; Li, Z.H. Geological characteristics and resources potential of shale oil in Chang 7 Member of Upper Triassic Yanchang Formation in Fuxian area, southern Ordos Basin, western China. Unconv. Resour. 2023, 3, 237–247. [Google Scholar] [CrossRef]
- Zhang, C.C.; Wang, Y.M.; Dong, D.Z.; Li, X.J.; Guan, Q.Z. Evaluation of the Wufeng–Longmaxi shale brittleness and prediction of “sweet spot layers” in the Sichuan Basin. Nat. Gas Ind. 2016, 36, 51–60. [Google Scholar]
- Xing, Y.J.; Xiao, X.M.; Zhao, Y.M.; Liu, W.; Fan, Q.Z.; Meng, G.M.; Qian, Y.J. Thermodynamic and kinetic behaviors of water vapor adsorption on the lower Cambrian over-mature shale and kerogen. Fuel 2025, 381, 133560. [Google Scholar] [CrossRef]
- Zhao, Y.M.; Gao, P.; Zhou, Q.; Meng, G.M.; Liu, W.; Xing, Y.J.; Xiao, X.M. Controls on Graphitization and Nanopore Characteristics of Organic Matter in Marine Overmature Shale. Nat. Resour. Res. 2025, 34, 1527–1556. [Google Scholar] [CrossRef]
Disclaimer/Publisher’s Note: The statements, opinions and data contained in all publications are solely those of the individual author(s) and contributor(s) and not of MDPI and/or the editor(s). MDPI and/or the editor(s) disclaim responsibility for any injury to people or property resulting from any ideas, methods, instructions or products referred to in the content. |
© 2025 by the authors. Licensee MDPI, Basel, Switzerland. This article is an open access article distributed under the terms and conditions of the Creative Commons Attribution (CC BY) license (https://creativecommons.org/licenses/by/4.0/).