Article

Vortex-Induced Vibration Analysis of FRP Composite Risers Using Multivariate Nonlinear Regression

1
School of Civil Engineering and Geomatics, Shandong University of Technology, Zibo 255049, China
2
Shandong Provincial Key Laboratory of Ocean Engineering, Qingdao 266100, China
3
College of Engineering, Ocean University of China, Qingdao 266100, China
4
School of Engineering, Lancaster University, Lancaster LA1 4YW, UK
5
Department of Construction Management, Global Banking School, Devonshire Street North, Manchester M12 6JH, UK
6
Institute of Energy Infrastructure, National Energy University, Kajang 43009, Malaysia
*
Author to whom correspondence should be addressed.
J. Mar. Sci. Eng. 2025, 13(7), 1281; https://doi.org/10.3390/jmse13071281
Submission received: 9 June 2025 / Revised: 27 June 2025 / Accepted: 28 June 2025 / Published: 30 June 2025
(This article belongs to the Section Ocean Engineering)

Abstract

Marine risers are essential for offshore resource extraction, yet traditional metal risers encounter limitations in deep-sea applications due to their substantial weight. Fiber-reinforced polymer (FRP) composites offer a promising alternative with advantages including low density and enhanced corrosion/fatigue resistance. However, FRP risers remain susceptible to fatigue damage from vortex-induced vibration (VIV). Therefore, this study investigated VIV behavior of FRP composite risers considering the coupled effect of tensile-flexural moduli, top tensions, slenderness ratios, and flow velocities. Through an orthogonal experimental design, eighteen cases were analyzed using multivariate nonlinear fitting. Results indicated that FRP composite risers exhibited larger vibration amplitudes than metal counterparts, with amplitudes increasing to both riser length and flow velocity. It was also found that the optimized FRP configuration demonstrated enhanced fiber strength utilization. Parameter coupling analysis revealed that the multivariate nonlinear fitting model achieved sufficient accuracy when incorporating two coupled parameters, with the most significant interaction occurring between flexural modulus and top tension.

1. Introduction

The rapid development of the global economy has led to an increasing demand for energy, and more and more countries are progressively shifting their focus from land-based to offshore oil and gas extraction, particularly in deep-sea environments. The marine riser serves as a crucial link between offshore platforms and subsea oil and gas production systems [1]. With the development of oil and gas exploration and extraction in deep-sea environments, traditional metal risers have experienced a significant increase in self-weight. This inherent limitation has hindered the industry’s progress. In contrast, fiber-reinforced polymer (FRP) composite marine risers possess a lower density and superior mechanical properties, allowing for a reduction in self-weight, which subsequently decreases the top tension requirements and operating costs of existing offshore platforms. Additionally, FRP composite marine risers exhibit excellent corrosion resistance, high vibration damping, and fatigue resistance [2,3], which contribute to lower maintenance and operational costs. Particularly in the last decade, the application of composites in marine engineering has expanded significantly, leading to more attempts aimed at developing FRP composite risers. With the rapid advancement of computer technology, the integrated methods of Computational Fluid Dynamics (CFD) and fluid–structure interaction (FSI) have gradually emerged [4].
As the more promising choice, comparative research between the FRP composite riser and the traditional metal riser has become one of the research hotspots. Tan et al. conducted a comprehensive analysis on both local and global scales to investigate the fluid–structure coupling response of both types of risers at a depth of 1500 m, which presented the greater margin of safety of the composite risers. For the performance of the liner for the composite riser [5], the titanium liner was proven to be a better choice than steel and aluminum liners. The power response models of metal and FRP composite risers were studied under various combinations of operational parameters [6]. Moreover, the distinct vortex-induced vibration (VIV) characteristics under identical flow conditions of metal and FRP composite risers were investigated [7], and the results showed that FRP composite risers led to greater deformation and a reduced stress response compared to traditional metal risers. The VIV performance, i.e., the intrinsic frequency, overall displacement, and overall stress of the FRP composite riser and the X80 steel riser, was obtained using CFD and FSI methods [8], and the impacts of various parameters were studied using Grey Theory. Similarly, Wang et al. examined the effects of surface roughness, inlet velocity, and other parameters on the VIV characteristics of the riser using a two-way FSI method. The study revealed that both the flow vibration frequency and the transverse vibration frequency of the riser increased significantly with higher inflow velocities and greater surface roughness [9]. The effects of top tension, flow resistance, and VIV responses of the metal and FRP composite risers were examined using finite element simulations [10]. The methods of numerical simulation in Computational Fluid Dynamics offer significant cost-saving advantages in experiments and reduce the experimental workload. By simulating real ocean flow fields through numerical techniques [11], these methods provide a new direction for research. A comparative study of eddy excitation vibrations of three models of metallic and FRP composite marine risers using both 2D and 3D finite element simulation was conducted, which found that the displacement of the FRP composite risers was significantly greater than that of the steel risers, while the stress responses were inversely correlated [12]. The weight-saving advantage of FRP composite risers for ultra-deep ocean application was also proven [13]; however, this reduction in weight might result in considerable deformation of the composite risers, leading to misalignment and instability [14]. A quasi-static analytical model was developed to forecast the fatigue damage of an FRP composite flexible riser under eddy-excited vibrations in a deep-sea environment [15], and a theoretical model based on the energy method was also proposed to predict the fatigue performance of unbonded flexible risers under axisymmetric loading [16]. Kang et al. studied the progressive damage process of composite risers with coupled numerical simulations, and the residual stresses generated during this process were predicted [17]. Edmans et al. proposed a multiscale approach for designing flexible risers with three models, i.e., a nonlinear beam cell, a nonlinear section response model, and a detailed finite element model, to effectively predict the stress values that contribute to fatigue damage in flexible risers [18].
Unlike traditional metal risers, the better performance of FRP composite risers could be achieved by optimizing the structural lay-ups due to the anisotropic properties of FRP composite layers. Wang et al. employed both manual customized design and the surrogate-assisted evolutionary algorithm (SAEA) method to optimize the structural geometries of FRP composite risers, and the weight savings from the optimization were up to 25% of the orthogonal lay-ups. Both tension and pressure conditions might lead to the failure of FRP composite risers; to address this problem [19], Zheng et al. conducted multi-objective optimization by manipulating the fiber angles and thicknesses of each composite layer to achieve maximum critical pressure and tensile strength [20]. A well-reasoned design of composite risers not only reduced weight but also enhanced performance, making it essential to evaluate their structural integrity [2,3,21]. In order to further investigate the damage mechanisms of composite marine risers in deep-sea environments, experimental studies and numerical analyses were conducted by Pham et al. [22]. It was also proven that the fatigue performance of composite risers under applied forces was significantly influenced by the layup configurations [23]. The frequency-locked resonance phenomenon of composite marine risers was investigated with various composite fiber orientation angles, and it found that the frequency-locked spacing of the risers gradually decreased with the increasing fiber orientations, while the amplitude of vibration correspondingly increased with the increasing fiber orientation angle [24].
More recently, advanced mathematical techniques were employed in research on risers’ performance. In a comparative study for predicting the VIV of marine risers with different mathematical techniques, the maximum a posteriori method was proven to be a most effective approach [25]. Similarly, the Grey Theory and multiple linear regression calculation were both employed in the study of the impact of various design parameters on the VIV response of metal and FRP composite risers. [5,22,26] developed an empirical model for prediction of the fatigue life of composite risers by integrating the critical stress values at the fatigue damage locations of the risers. Both scalable and non-scalable modeling methods were employed to study the response of composite risers, and it was found that non-scalable modeling produced spurious high-frequency vibrations under ambient loading conditions [27].
While prior research has examined factors influencing VIV in FRP composite risers, most studies focus on isolated parameters, with scant attention paid to coupled multi-parameter effects [28]. In practical engineering, the VIV of risers emerges from complex nonlinear interactions among multiple variables. Single-factor analyses were proven inadequate for predicting riser dynamics under realistic ocean conditions. To address this gap, a three-factor, three-level orthogonal experimental design coupled with multiple nonlinear regression was implemented to investigate interaction mechanisms among tensile modulus, flexural modulus, top tension, and flow velocity in metallic and FRP risers. The novelty of this work resided in its development of a VIV prediction model that quantified nonlinear coupling relationships through regression analysis. This approach elucidated synergistic parameter interactions, overcame limitations inherent in traditional single-factor analyses, and provided design optimization strategies for marine risers. Beyond its industrial contributions, including advancing understanding of multi-parameter VIV mechanics, this research could also serve as an engineering demonstration case for academic integration into curricula of Engineering Simulation Technology. By transforming industrial challenges into hands-on learning experiences, the study embodies research-driven pedagogy that bridges theoretical knowledge with practical application while cultivating competencies in the application of simulation tools, experimental design, and data analysis.

2. Design and Methodology

2.1. Riser Design

An optimized FRP composite riser, an orthogonal reinforced FRP composite riser, and a metal riser, which satisfied the same design requirements [16,29], were selected in this study. More specifically, the optimized FRP composite riser (Figure 1) was designed with 2 mm of titanium liner, 3 axial reinforced FRP composite layers (1.7 mm each), 10 alternately ±53° reinforced FRP composite layers (1.64 mm each), and 4 hoop reinforced FRP composite layers (1.75 mm each); the orthogonal reinforced FRP composite riser (Figure 2) was designed with 2 mm of titanium liner and 21 alternately axial and hoop reinforced FRP composite layers (1.385 mm each for axial layers and 2.15 mm each for hoop layers). The metal riser’s design was relatively simple compared to the composite riser’s design, and its inside and outside diameters were 250 mm and 300 mm, respectively.
The specific parameters of the three risers are shown in Table 1, from which it was found that the unit masses of the optimized FRP composite riser and the orthogonal reinforced FRP composite riser were only 27.0% and 35.3% that of the metal riser. Moreover, the unit mass of the optimized FRP composite riser was about 23.3% lighter than that of the orthogonal reinforced FRP composite riser. Therefore, it is evident that the different designs of FRP composite risers under same design requirement would affect the performance of the riser.

2.2. Material Properties

In this paper, AS4 carbon fiber was used as the reinforcing material and epoxy resin was used as the matrix. AS4 carbon fiber has high specific strength, as well as good corrosion, fatigue, and shock resistance, thereby significantly improving the performance and service life of the FRP risers [30,31,32]. Epoxy resin with excellent bonding properties can be combined well with AS4 carbon fiber to form a strong composite structure and to improve the overall strength and durability of the FRP composite riser [33,34]. In order to achieve the waterproof performance of FRP composite risers, titanium alloy with excellent corrosion resistance and high specific strength was selected as the material for the inner liner. The benchmark metal riser was made of high-grade X80 steel [35,36]. Table 2 presents the specific properties of the used materials in the study.

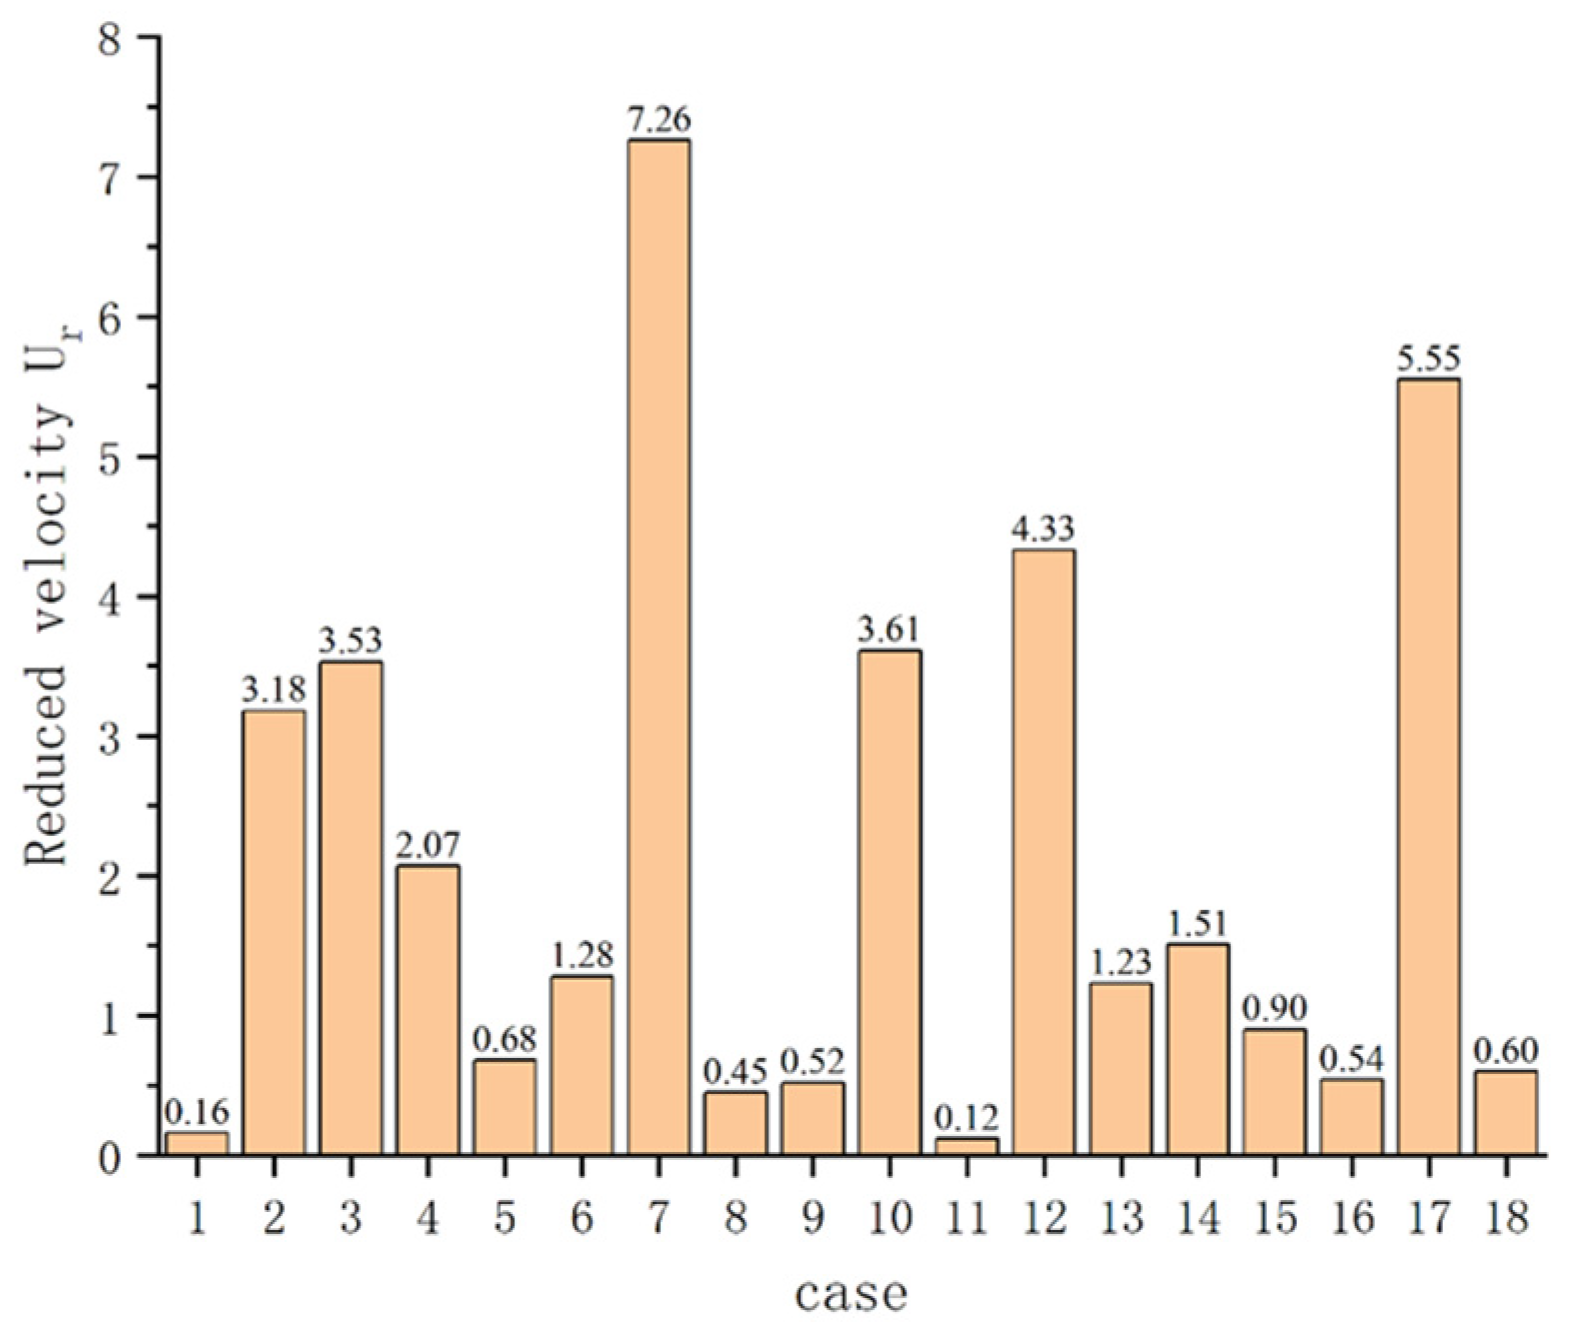
2.3. Experimental Matrix and Parameters

In addition to the different top tensions and outer diameters of the risers caused by the selected materials and design methods, the length of the riser and the flow velocity were considered, as well. More specifically, 12.5 m, 25 m, and 37.5 m for the riser length were studied and 0.36 m/s, 1.22 m/s, and 2.13 m/s [37,38] were selected as flow velocities.
A full design of a three-factor, three-level experiment would lead to 27 study cases. Considering the large workload and long time period of experiments through the finite element analysis (FEA), an experimental design method of orthogonal tests [39], which would ensure the rationality of the experiment with a relatively small number of tests, was employed and formed 18 study cases for this study. Table 3 shows the study cases with different design parameters.
More specifically, the tensile and flexural modulus were determined using two simple FEA models, as shown in Figure 3. From the displacements obtained with these two models (Table 4), the tensile and flexural modulus were calculated through Equations (1) and (2), respectively.
E t e n s i l e = N L A Δ 1
where N is the added axial force, L is the length, A is the riser cross-section area, and Δ1 is the axial displacement of the model.
E b e n d i n g P L 3 3 I Δ 2
where P is the added transverse force, L is the length, I is the moment of inertia I = π ( D 0 4 D i 4 ) 64 , and Δ2 is the transverse displacement of the model.
The slenderness ratio was defined as the ratio of the length of a riser model to its outer diameter, which was determined based on the riser types (different outer diameters) and the selected riser lengths.
The required top tension force was determined based on the riser types (different densities of materials, different thicknesses of structural layers) and the selected riser lengths (Table 3). Here, we have to note that the required top tension forces of the metal riser and the FRP composite riser were recommended for calculation using 2 times and 1.5 times their structural weights, respectively [25].
Based on the diameter of the riser and the flow rate, the relevant parameters for each condition were determined, as shown in Table 5.
The Reynolds number ( R e ) is the ratio of inertial and viscous forces in the fluid, which is defined as
R e = ρ U D μ = U D ν
where U is the velocity of incoming flow (m/s), D is the diameter of the cylinder (m), and ν is the kinematic viscosity coefficient of a fluid (m2/s).
The Strouhal number (St) is used to describe the effect of periodic oscillations in fluid flow, which is defined as
S t = f s D U
where D is diameter of the tube (m), U is the incoming velocity of the flow field (m/s), and f s is the vortex shedding frequency (Hz).
According to the relationship between R e and S t [40], when R e ranges from 300 to 300,000, S t is 0.2; when R e ranges from 300,000 to 3,500,000, S t is 0.2–0.3.
In the FEA simulation, turbulence intensity (I) is required, and it can be calculated through Equation (5).
I = 0.16 R e ( 1 / 8 )

2.4. Numerical Simulation

The numerical simulations of 18 study cases were carried out using Ansys workbench 2022 R1. For FRP composite risers, six modules, i.e., Geometry, ACP (Pre), Transient Structure, Fluid Flow (Fluent), ACP (Post), and System Coupling, were involved (Figure 4a). For the high-grade steel riser, only four modules, i.e., Geometry, Transient Structure, Fluid Flow (Fluent), and System Coupling, were needed.
In order to verify the feasibility and accuracy of the FEA model, an experiment using a Polymethyl Methacrylate (PMMA) riser (modulus of 3.5 GPa, length of 1.25 m, inner diameter of 16 mm, and outer diameter of 20 mm) under the conditions of 0.2 m/s flow velocity, a 5 cm wave height, a 1 s wave period, and a fixed–fixed boundary condition [41] (Figure 5) was conducted and compared with a FEA model using this proposed method. From the comparison of strain results at the location 0.6 m from the bottom of the riser model (upstream face), it was observed that 37.71 με was for experiment and 41.69 με was for the proposed FEA simulation, which proved the feasibility and accuracy of the proposed FEA method.

3. Results and Discussion

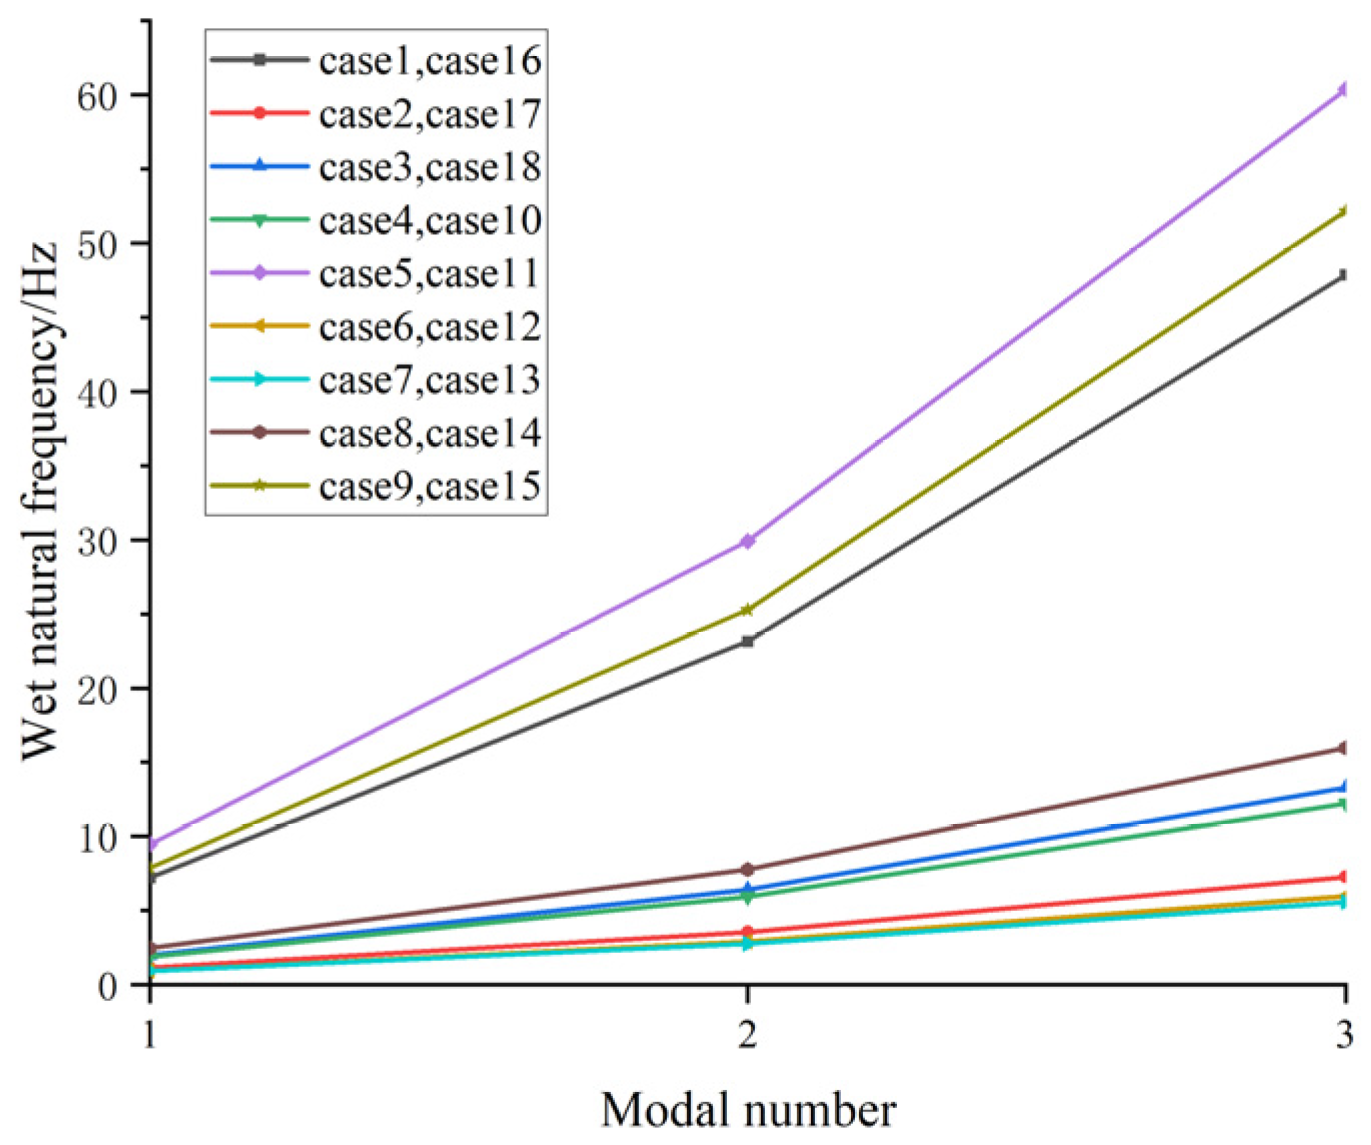
3.1. Natural Frequencies of Risers for the 18 Different Study Cases

The wet modal analysis of the risers under 18 different cases was conducted using ANSYS software 2022 R1 to determine the natural frequency of the riser in water. For the two composite risers, three modules, ACP (Pre), Static Structural, and Modal, were utilized to obtain the wet natural frequencies (Figure 4b). In contrast, only two modules, Static Structural and Modal, were needed to model the metallic riser for the same purpose. The wet natural frequencies for the 18 cases are presented in Figure 6.
From Figure 6, it is obvious that the length significantly affected the natural frequency of the riser with same material, i.e., the natural frequency of the riser with 12.5 m was approximately three to four times greater than that with 25 m and seven to eight times greater than that with 37.5 m. When the length of the riser was the same, it was found that the riser’s material affected the natural frequency, i.e., the natural frequency of the metal riser was the biggest, followed by those of the orthotropic FRP composite riser and the optimized FRP composite riser.
During the working condition, the frequency of vortex shedding might approach the wet natural frequency of the riser, leading to a phenomenon known as “lock-in”, which would lead to the resonance failure of the riser. In order to avoid this, the reduced velocity (Ur) was calculated to examine the possibility of the riser’s lock-in vibration phenomenon using Equation (6). These results are presented in Figure 7, where the natural frequencies from Figure 6 served as the required input parameter.
U r = U f n D
where U is the flow velocity, f n is the natural frequency of the riser, and D is the diameter of the riser.
Generally speaking, the longer length and bigger flow velocity would increase the possibility of the “lock-in” phenomenon. As illustrated in Figure 7, the reduced velocities for cases 7, 12, and 17 ranged from four to eight, which indicated the possibility of lock-in vibration [42]. However, it has to be noted that the reduced velocity did not include the materials’ difference and the effect of fluid–structure interaction.

3.2. Deformations of Risers for the 18 Different Study Cases

Three typical locations in each riser were selected to present the time–history curves of deformations in the downstream direction and the crossflow direction. More specifically, for the riser with 12.5 m, the three typical locations were 2.1 m, 6.3 m, and 10.5 m; for the riser with 25 m, 4.2 m, 12.5 m, and 20.8 m were chosen; for the riser with 37.5 m, they were 6.3 m, 18.8 m, and 31.3 m. In order to present the results more clearly, the deformation data were standardized using the ratio of displacement to the riser’s diameter.

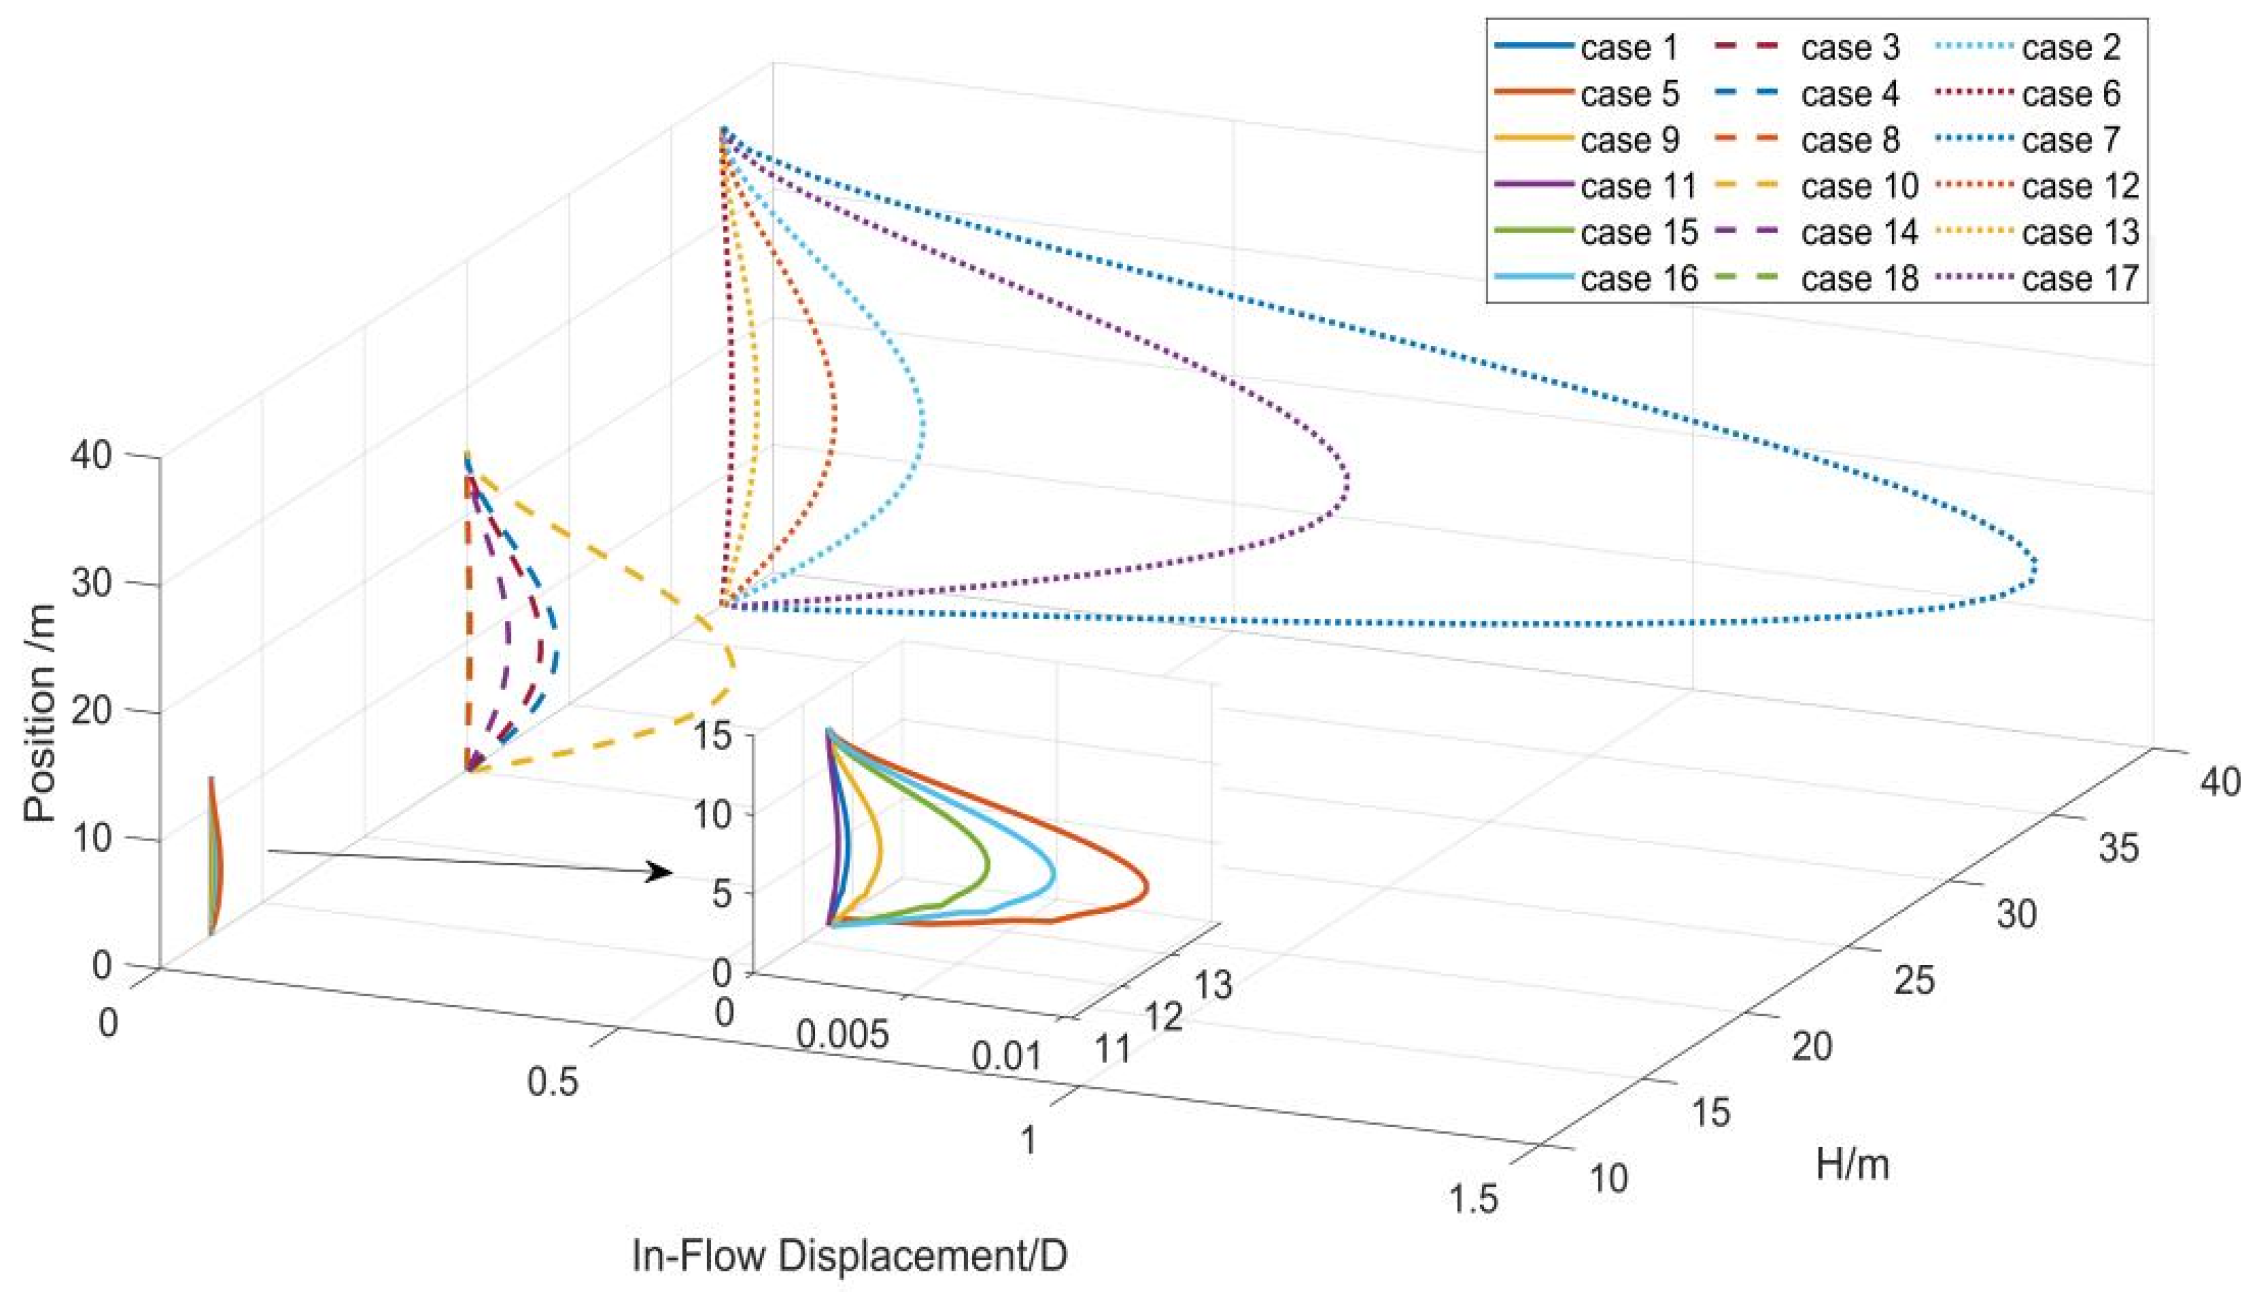
3.2.1. Deformations of Risers in the Downstream Direction

The time history of deformations in the downstream direction at each typical location is presented in Figure 8.
Figure 8a illustrates that the maximum standardized deformations were 6.99 × 10⁻³ (case 16), 9.89 × 10⁻³ (case 5), and 4.96 × 10⁻³ (case 15) for the optimized FRP composite riser, the orthogonal FRP composite riser, and the X80 steel riser with a length of 12.5 m. Figure 8b shows that the maximum standardized deformations were 2.81 × 10⁻¹ (case 10), 4.40 × 10⁻² (case 14), and 7.79 × 10⁻² (case 3) for the optimized FRP composite riser, the orthogonal FRP composite riser, and the X80 steel riser with a length of 25 m. Figure 8c shows that the maximum standardized deformations were 1.385 (case 7), 6.55 × 10⁻¹ (case 17), and 1.18 × 10⁻¹ (case 12) for the optimized FRP composite riser, the orthogonal FRP composite riser, and the X80 steel riser with a length of 37.5 m. We concluded that under the same condition, the downstream deformations of the two types of FRP composite risers were both larger than that of the metal riser, and the optimized FRP composite riser had the largest downstream deformation.
In addition, the maximum downstream deformations for the 18 study cases are illustrated in Figure 9 for the whole length of the risers.
As can be seen in Figure 9, the maximum amplitude downstream occurred in the middle part of the riser, and for the cases with same riser type and flow velocity, the maximum amplitude downstream increased with the increase in riser lengths.

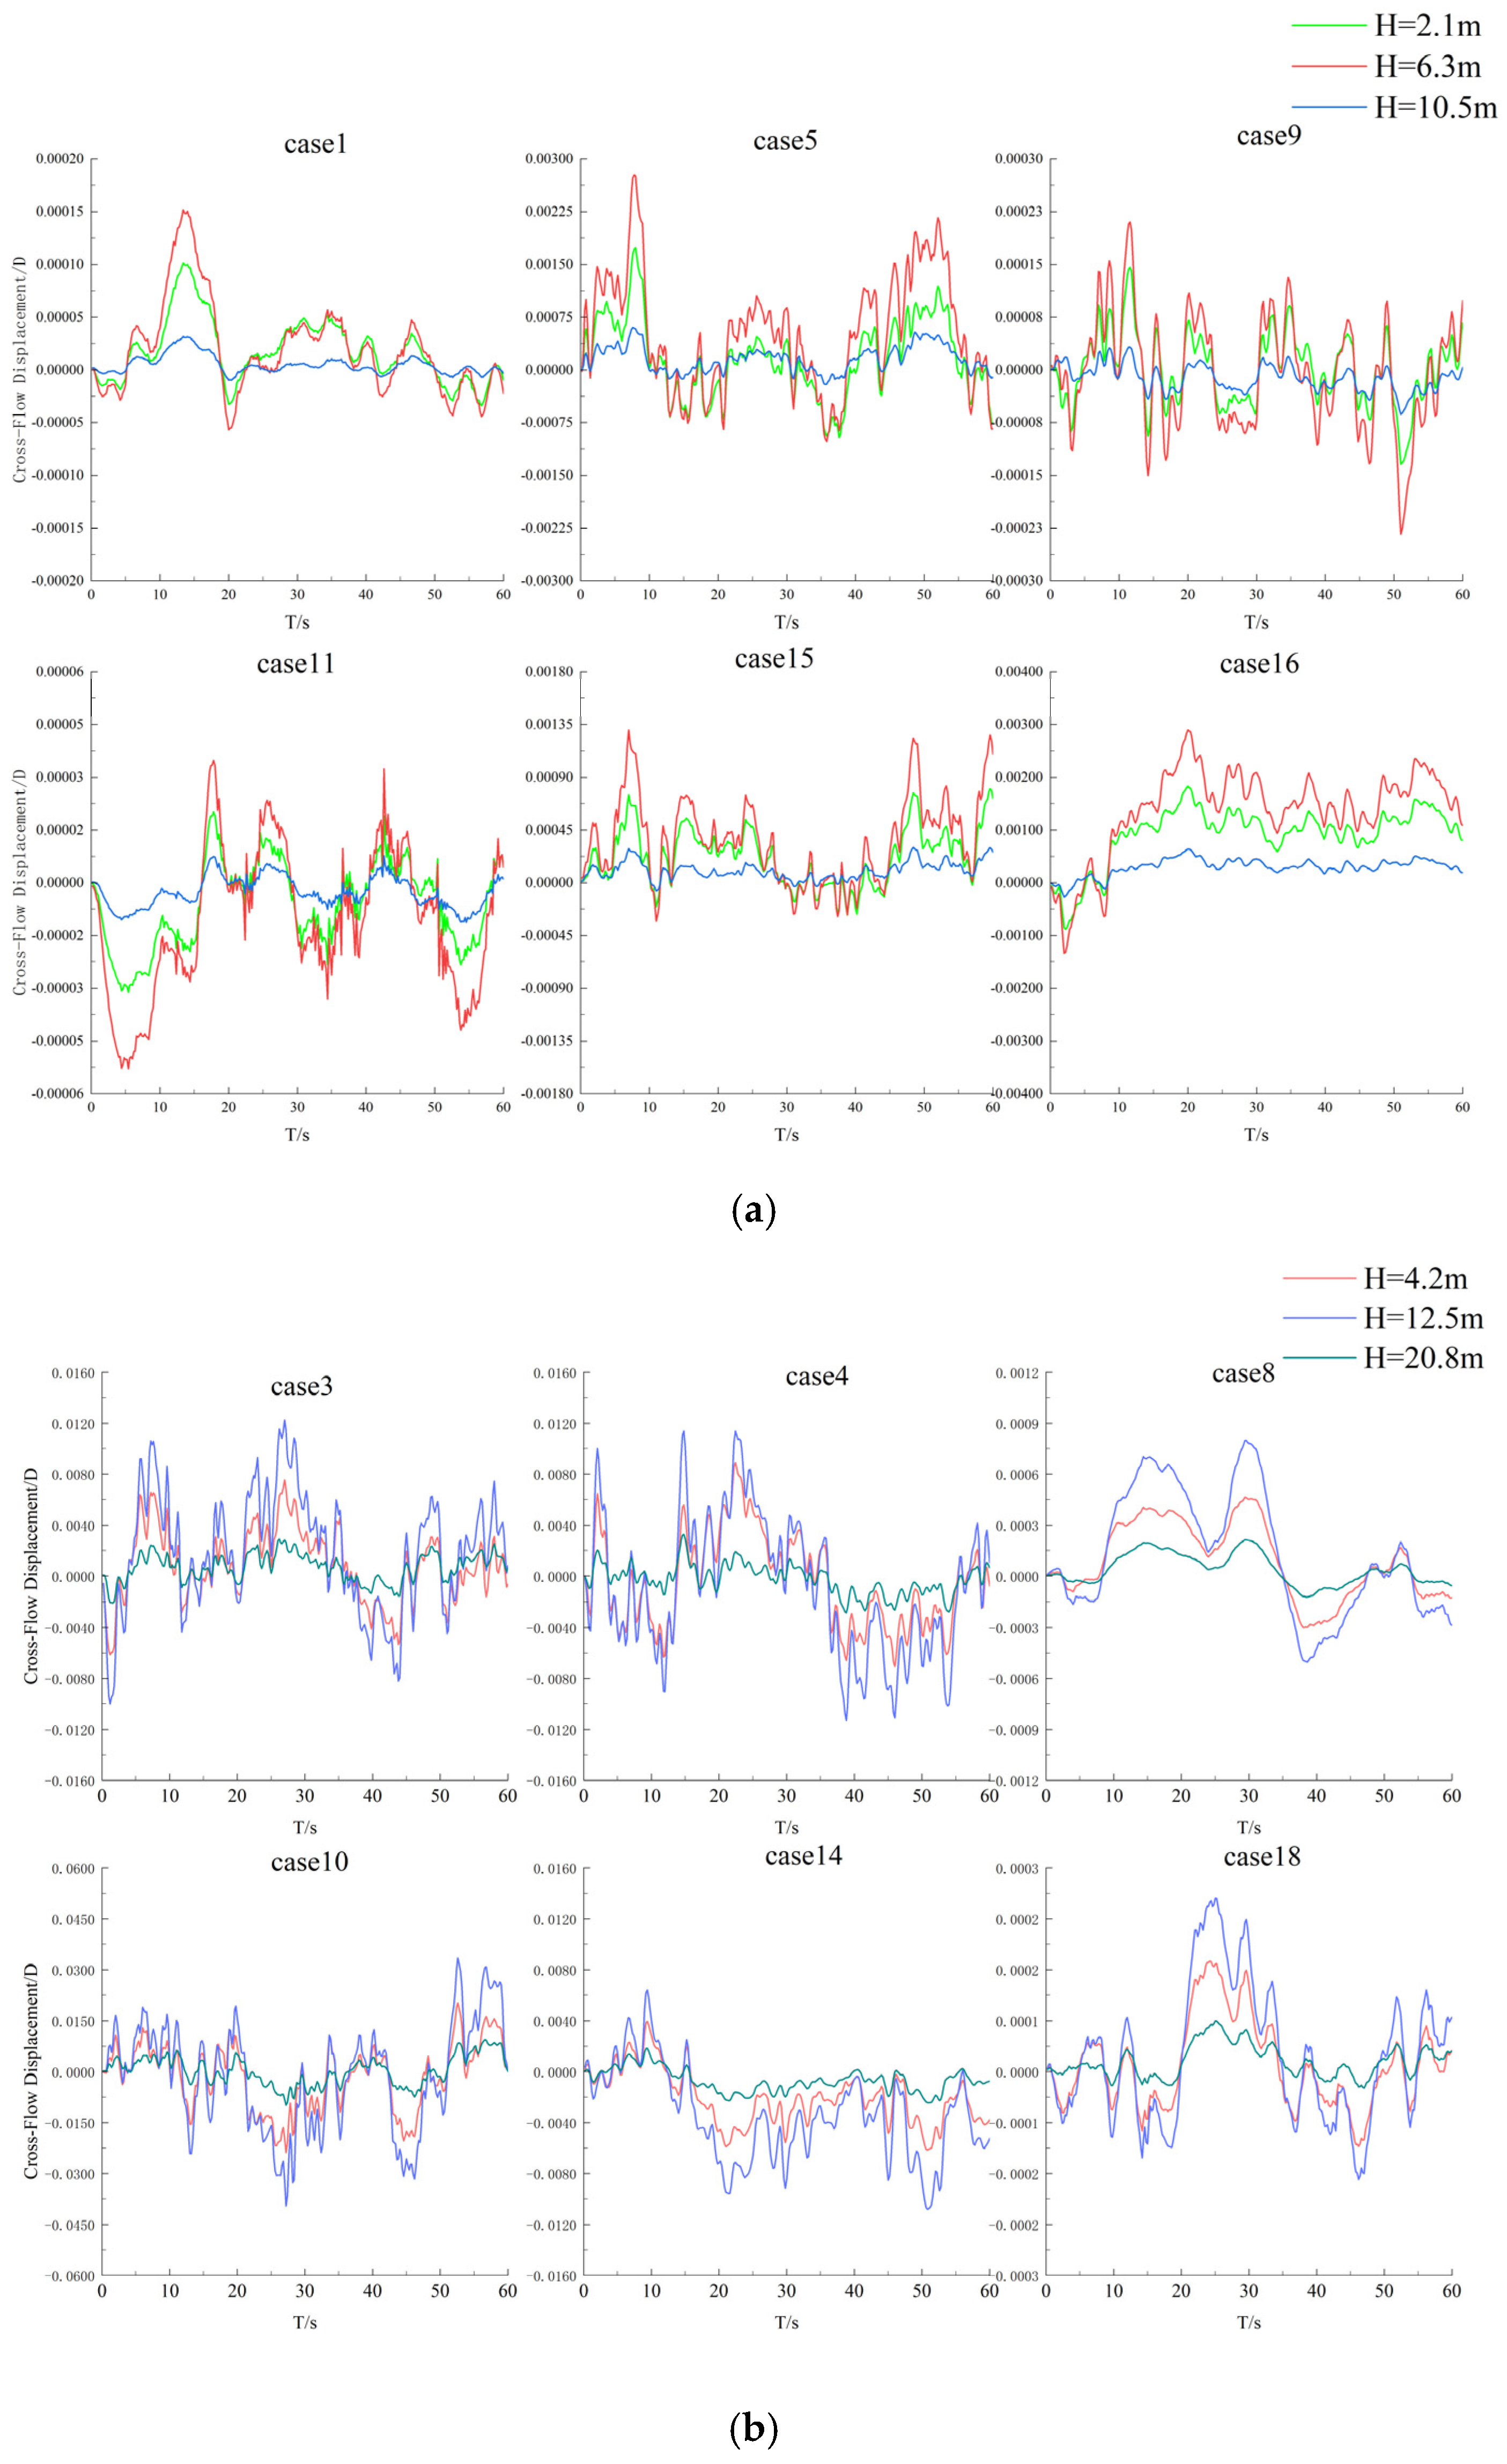
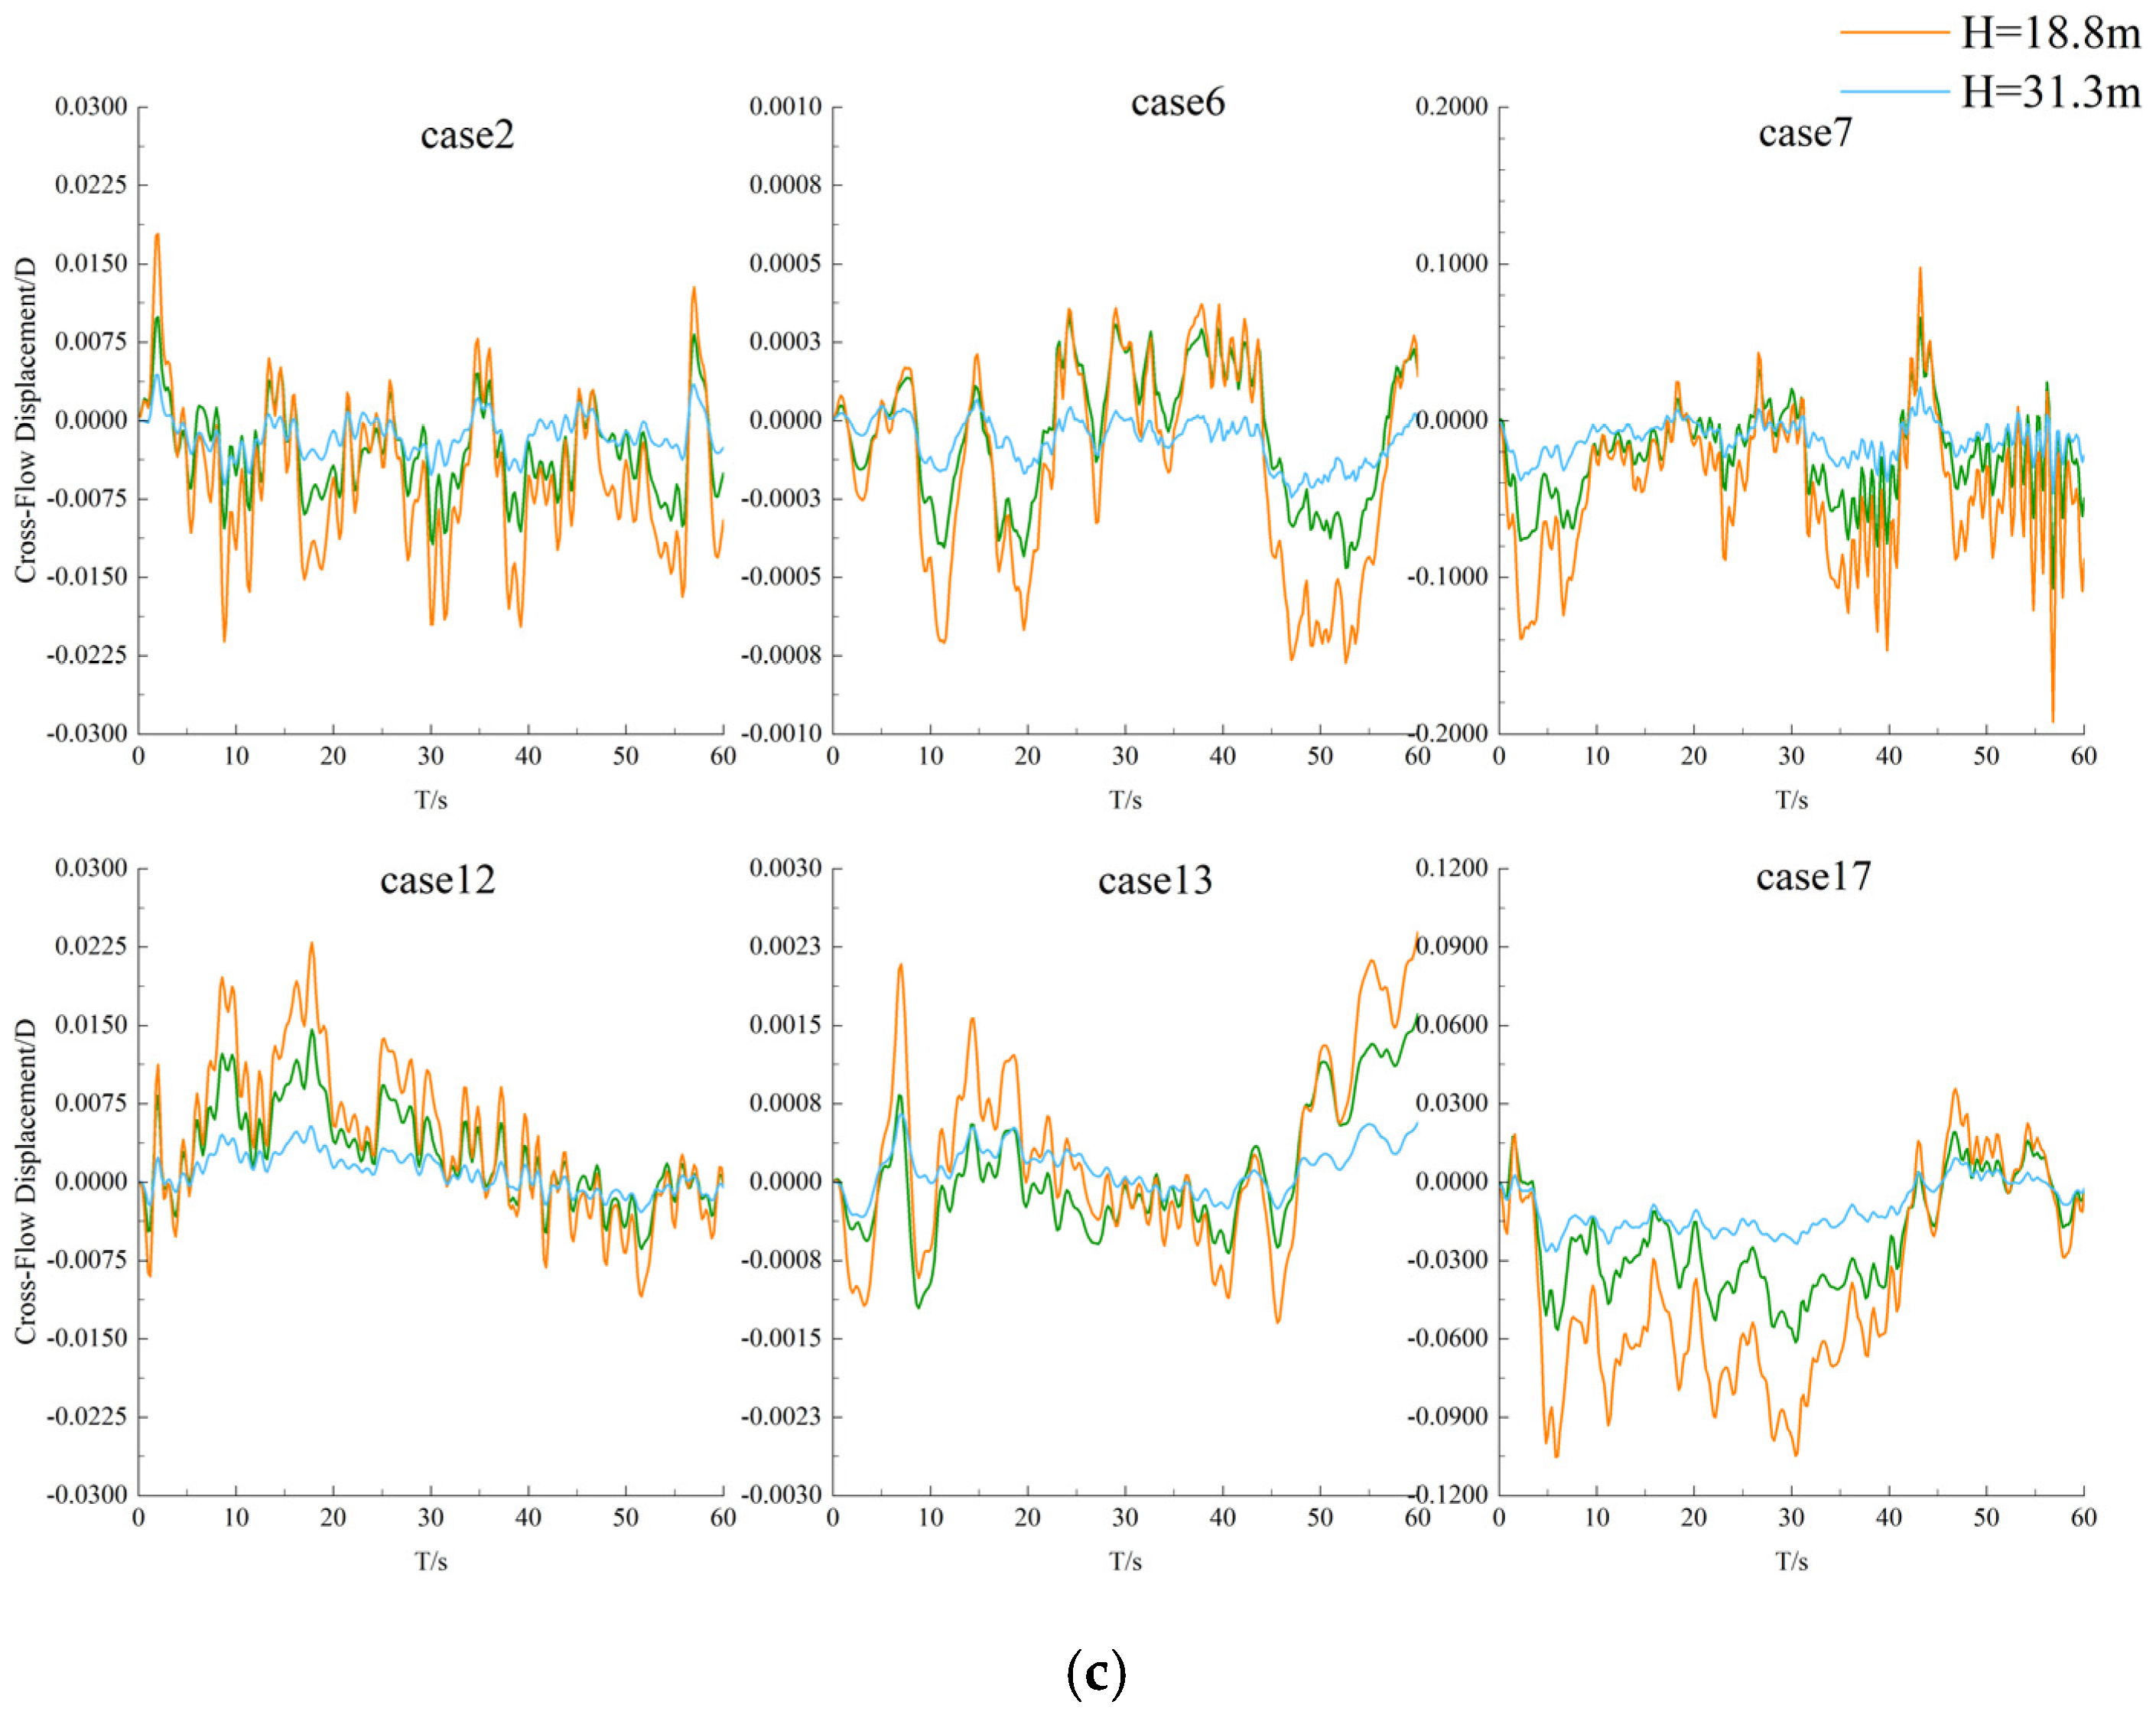
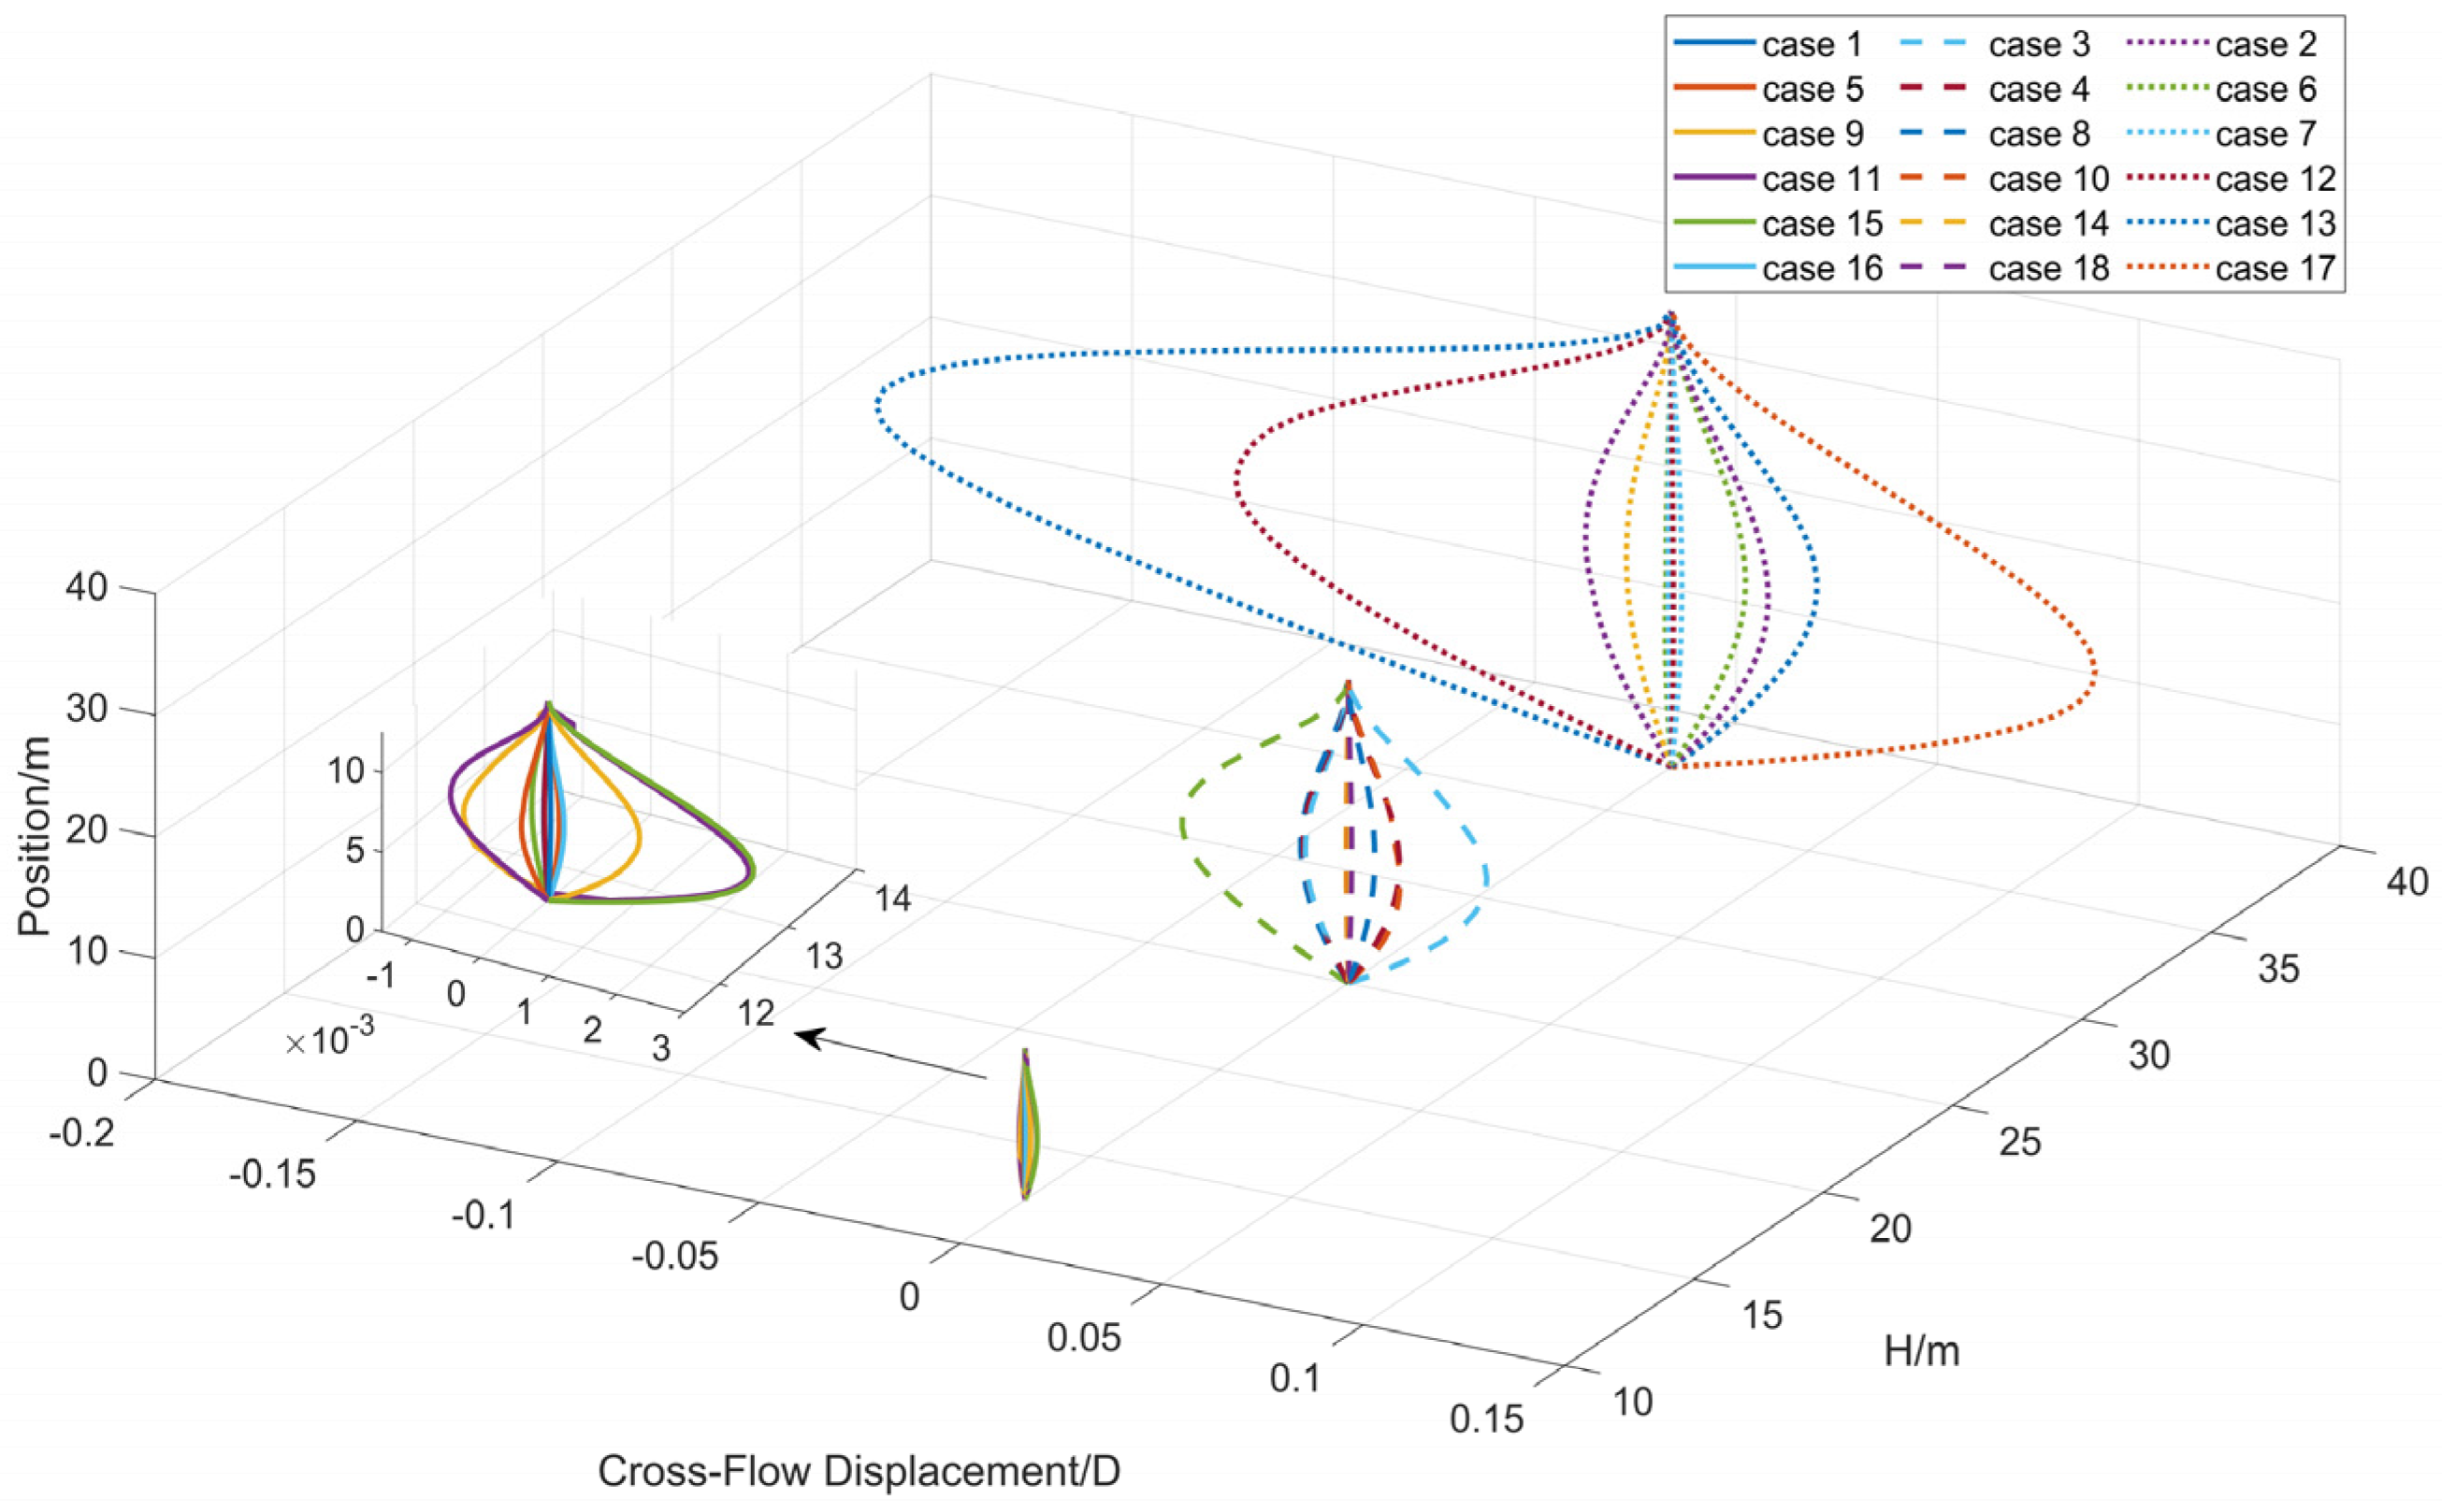
3.2.2. Deformations of Risers in the Crossflow Direction

The time history of deformations in the crossflow direction at each typical location is presented in Figure 10.
For the three typical locations of the same riser, the middle position of the riser had the largest amplitude and the most obvious vibration in the crossflow direction. Moreover, the vibration in the crossflow direction was more intense than that in the downstream direction. More specifically, for the riser with 12.5 m, the maximum standardized deformations were 2.90 × 10⁻³ (case 16), 2.77 × 10⁻³ (case 5), and 1.30 × 10⁻³ (case 15) for the optimized FRP composite riser, the orthogonal FRP composite riser, and the X80 steel riser (Figure 10a). For the riser with 25 m, the maximum standardized deformations were 4.12 × 10⁻² (case 10), 1.12 × 10⁻² (case 14), and 1.26 × 10⁻² (case 3) for the optimized FRP composite riser, the orthogonal FRP composite riser, and the X80 steel riser (Figure 10b). For the riser with 37.5 m, the maximum standardized deformations were 1.97 × 10⁻¹ (case 7), 1.08 × 10⁻¹ (case 17), and 2.39 × 10⁻² (case 12) for the optimized FRP composite riser, the orthogonal FRP composite riser, and the X80 steel riser (Figure 10c).
It can also be concluded that the vibration amplitudes in the crossflow direction of the two types of FRP composite risers were both larger than that of metal riser, and the vibration of the optimized FRP composite riser was the biggest.
In addition, the maximum cross deformations for the 18 cases are illustrated in Figure 11 for the whole length of the risers.
As can be seen in Figure 11, the maximum amplitude in the crossflow direction occurred in the middle part of the riser, and for the cases with same riser type and flow velocity, the maximum amplitude in the crossflow direction increased with the increase in riser lengths.

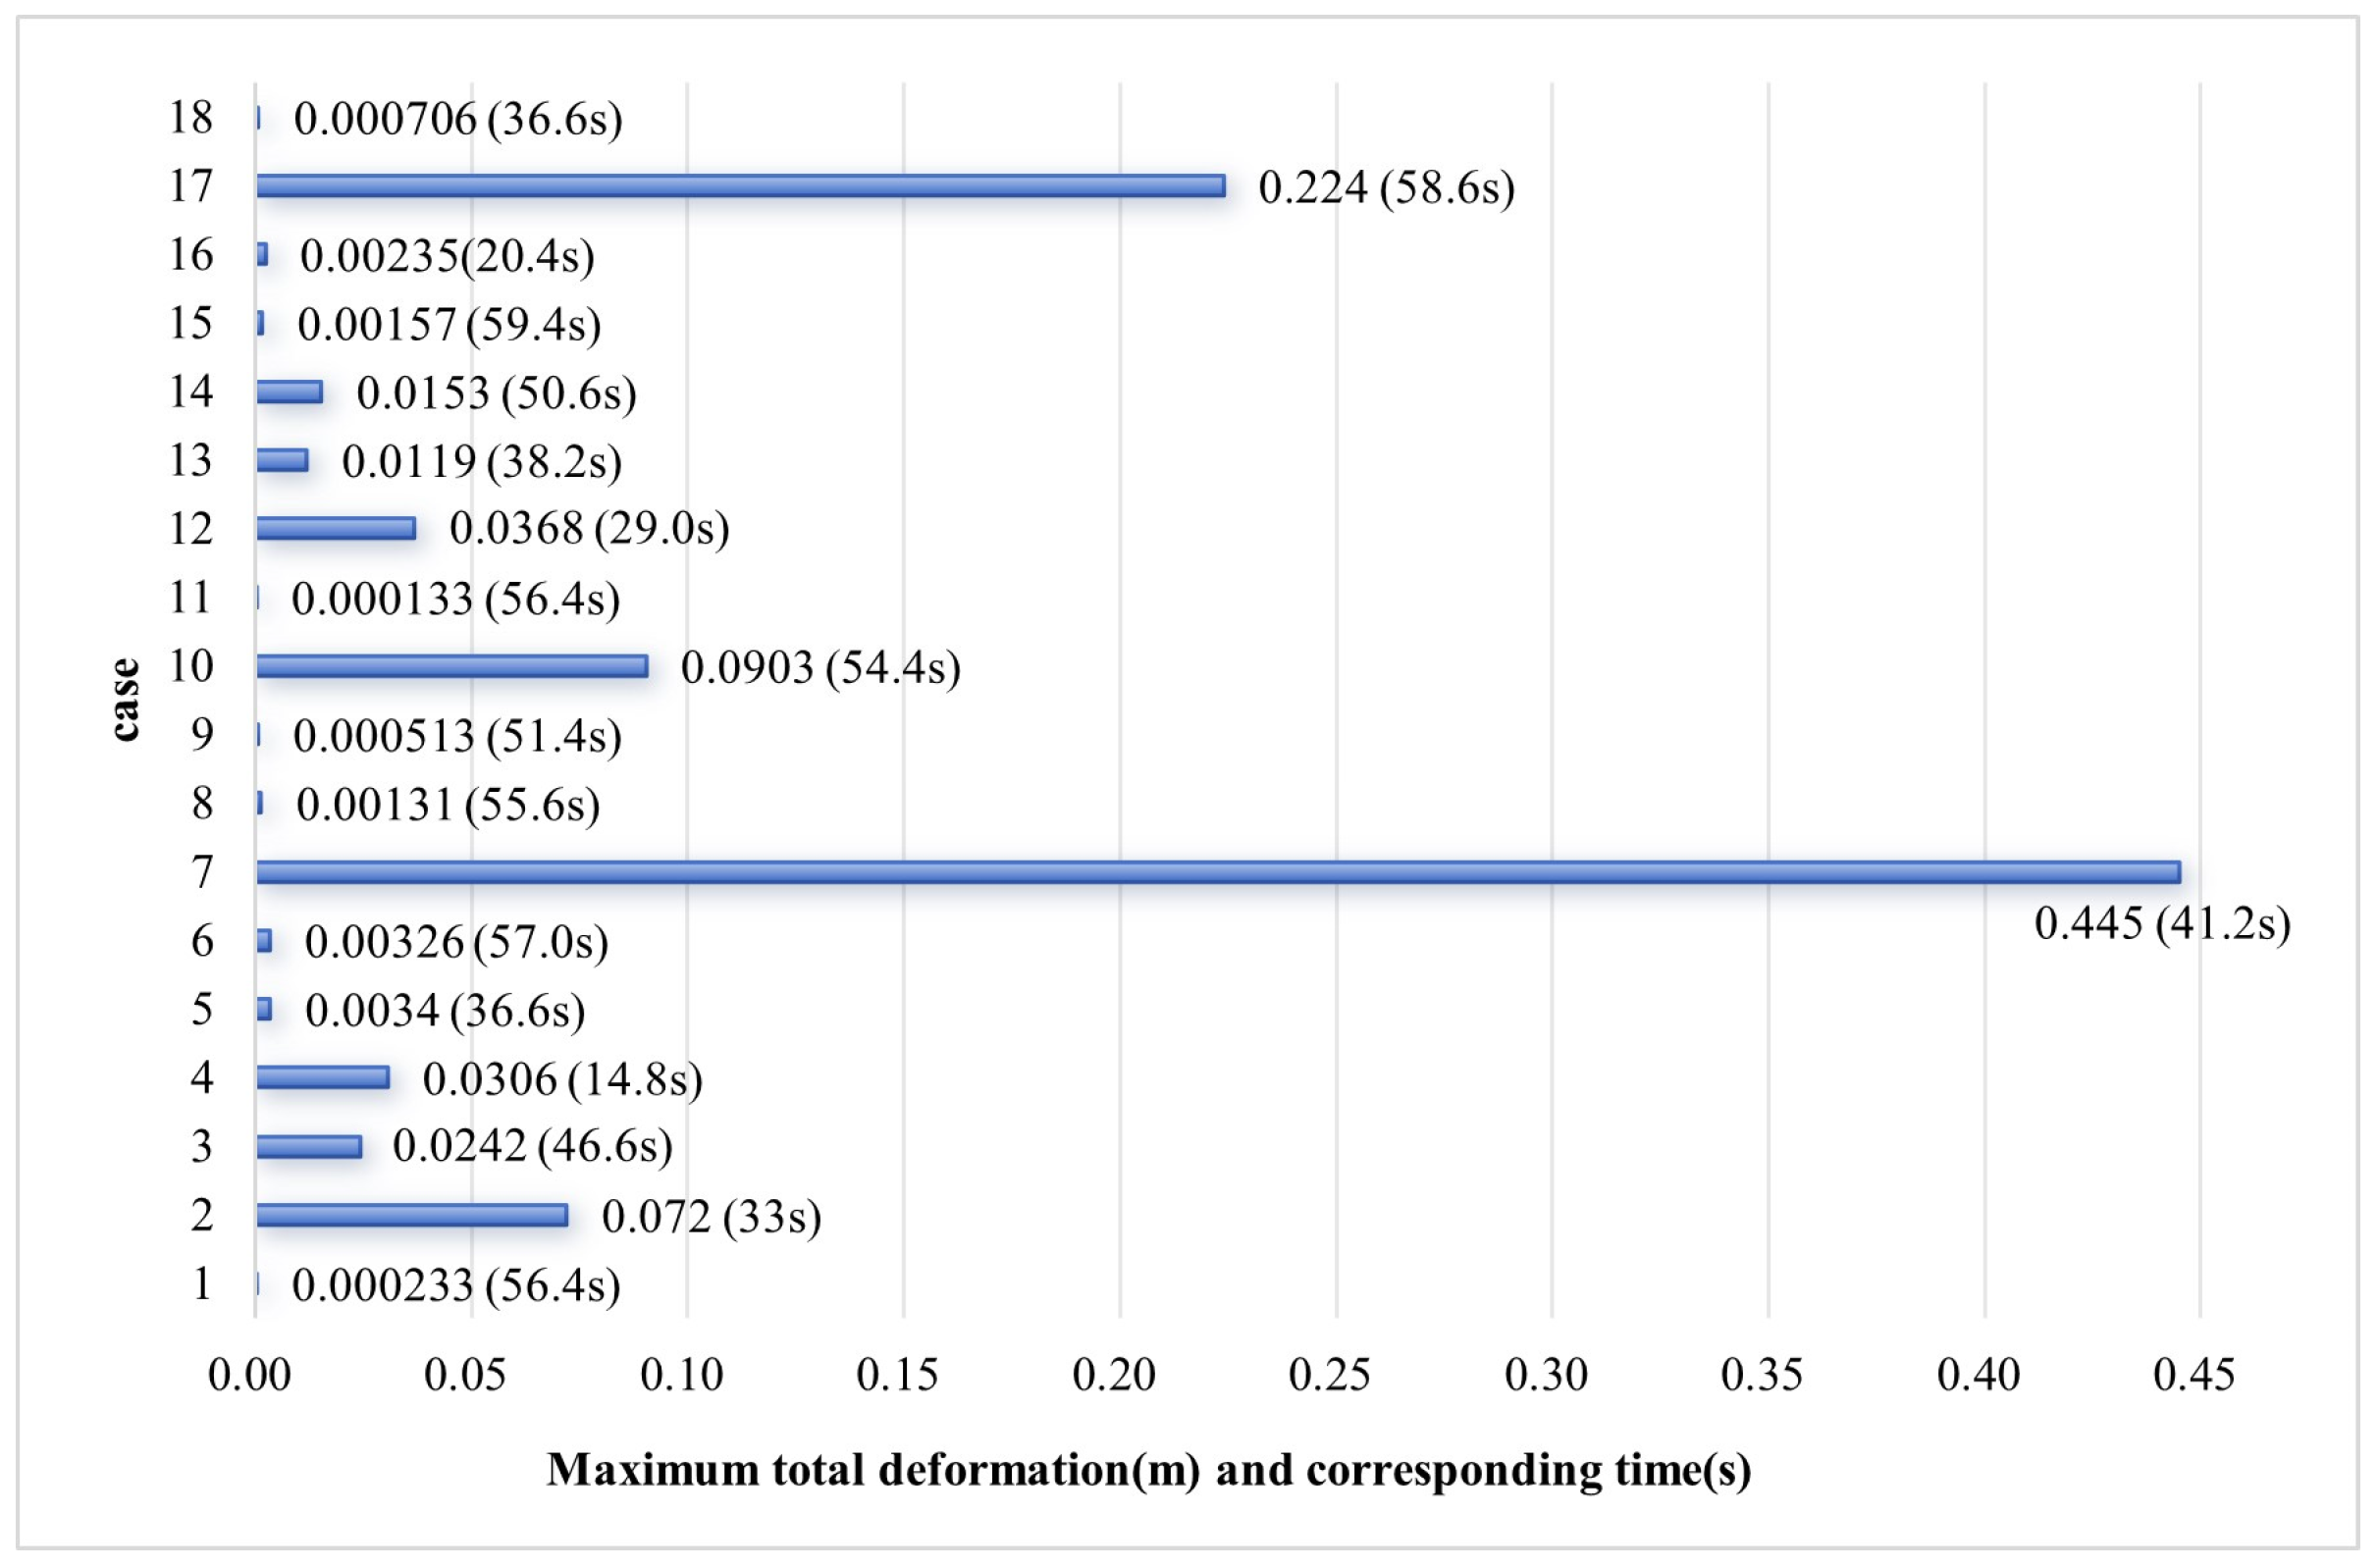
3.2.3. Total Deformations of Risers

Based on the results from Section 3.2.1 and Section 3.2.2, it was observed that the riser firstly produced a large displacement in the downstream direction and then vibrated in the crossflow direction cyclically. The maximum total deformations and the time duration for all 18 study cases are presented in Figure 12.
Based on the various types of marine risers, the 18 study cases were categorized into three groups for the analysis of the results. The maximum total deformation of the orthogonal FRP composite riser occurred in case 17 at 58.6 s, with a result of 0.224 m; the maximum total deformation of the optimized FRP composite riser was found in case 7 at 41.2 s, with a result of 0.445 m; and the maximum total deformation of the X80 steel riser was observed in case 12 at 29.0 s, with a result of 0.0368 m. From these, the importance of the riser’s material (modulus) has been proven. Similarly, the maximum total deformations for all three types of risers occurred with the length of 37.5 m, showing the significance of the riser’s length.

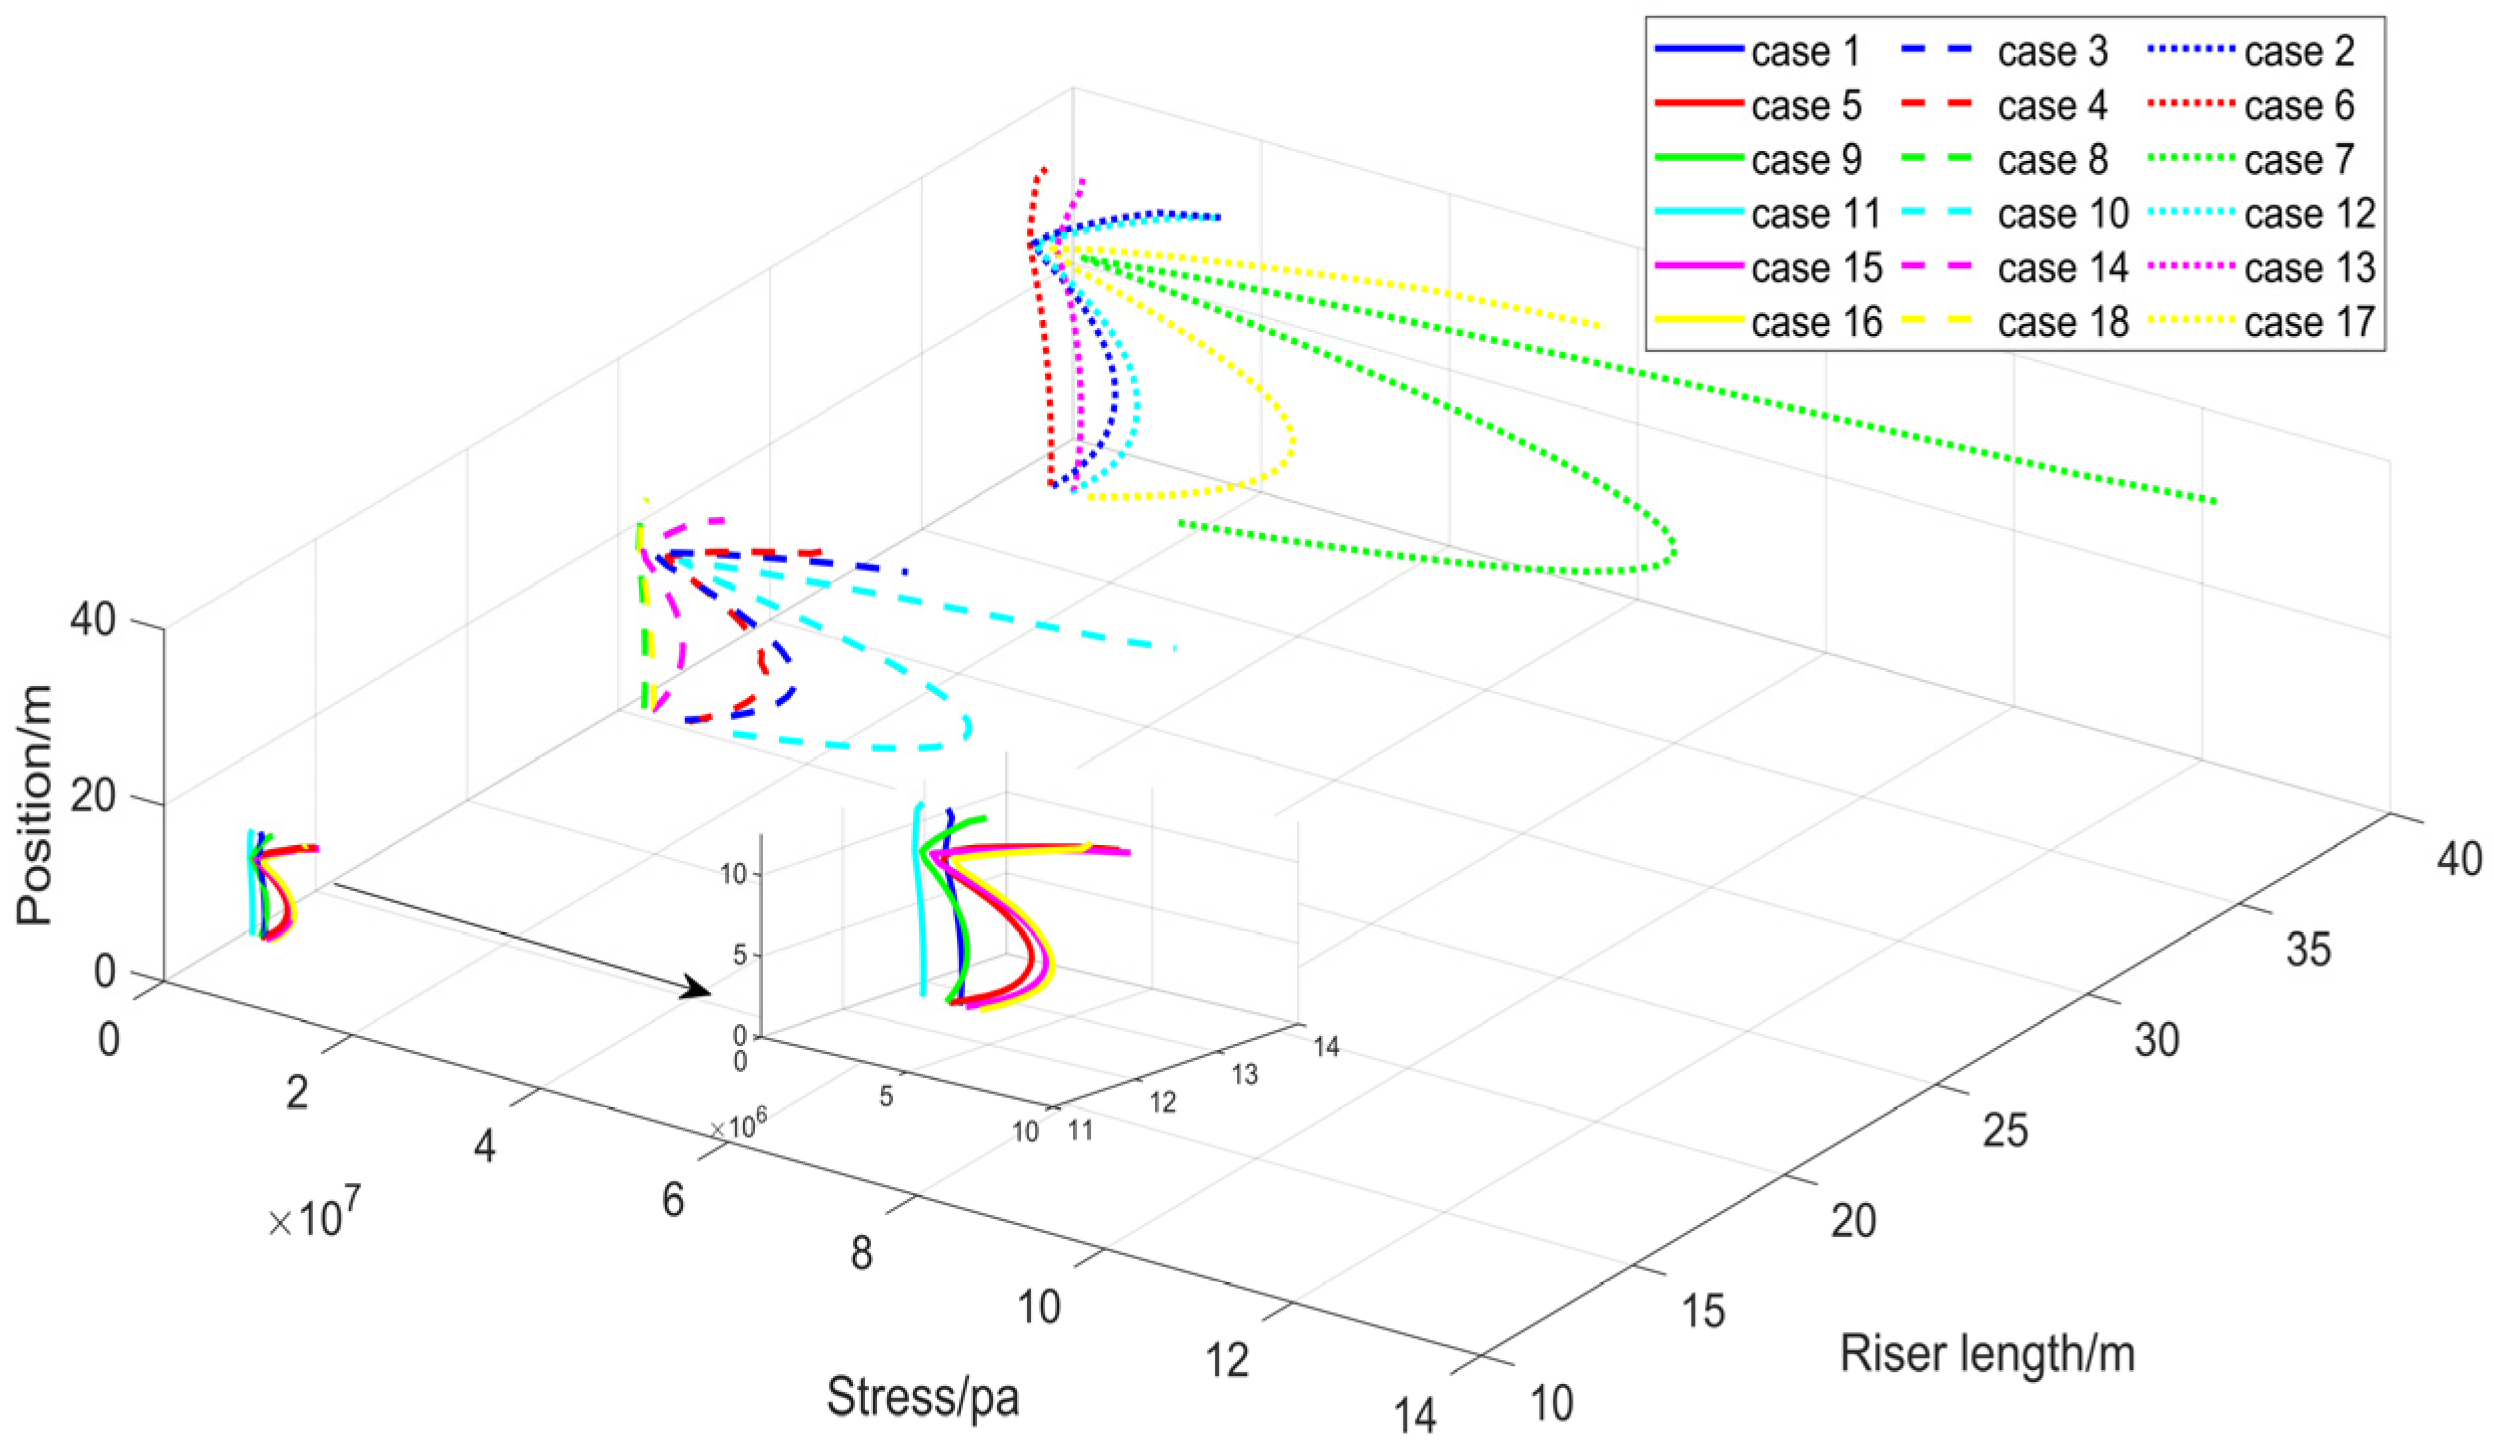
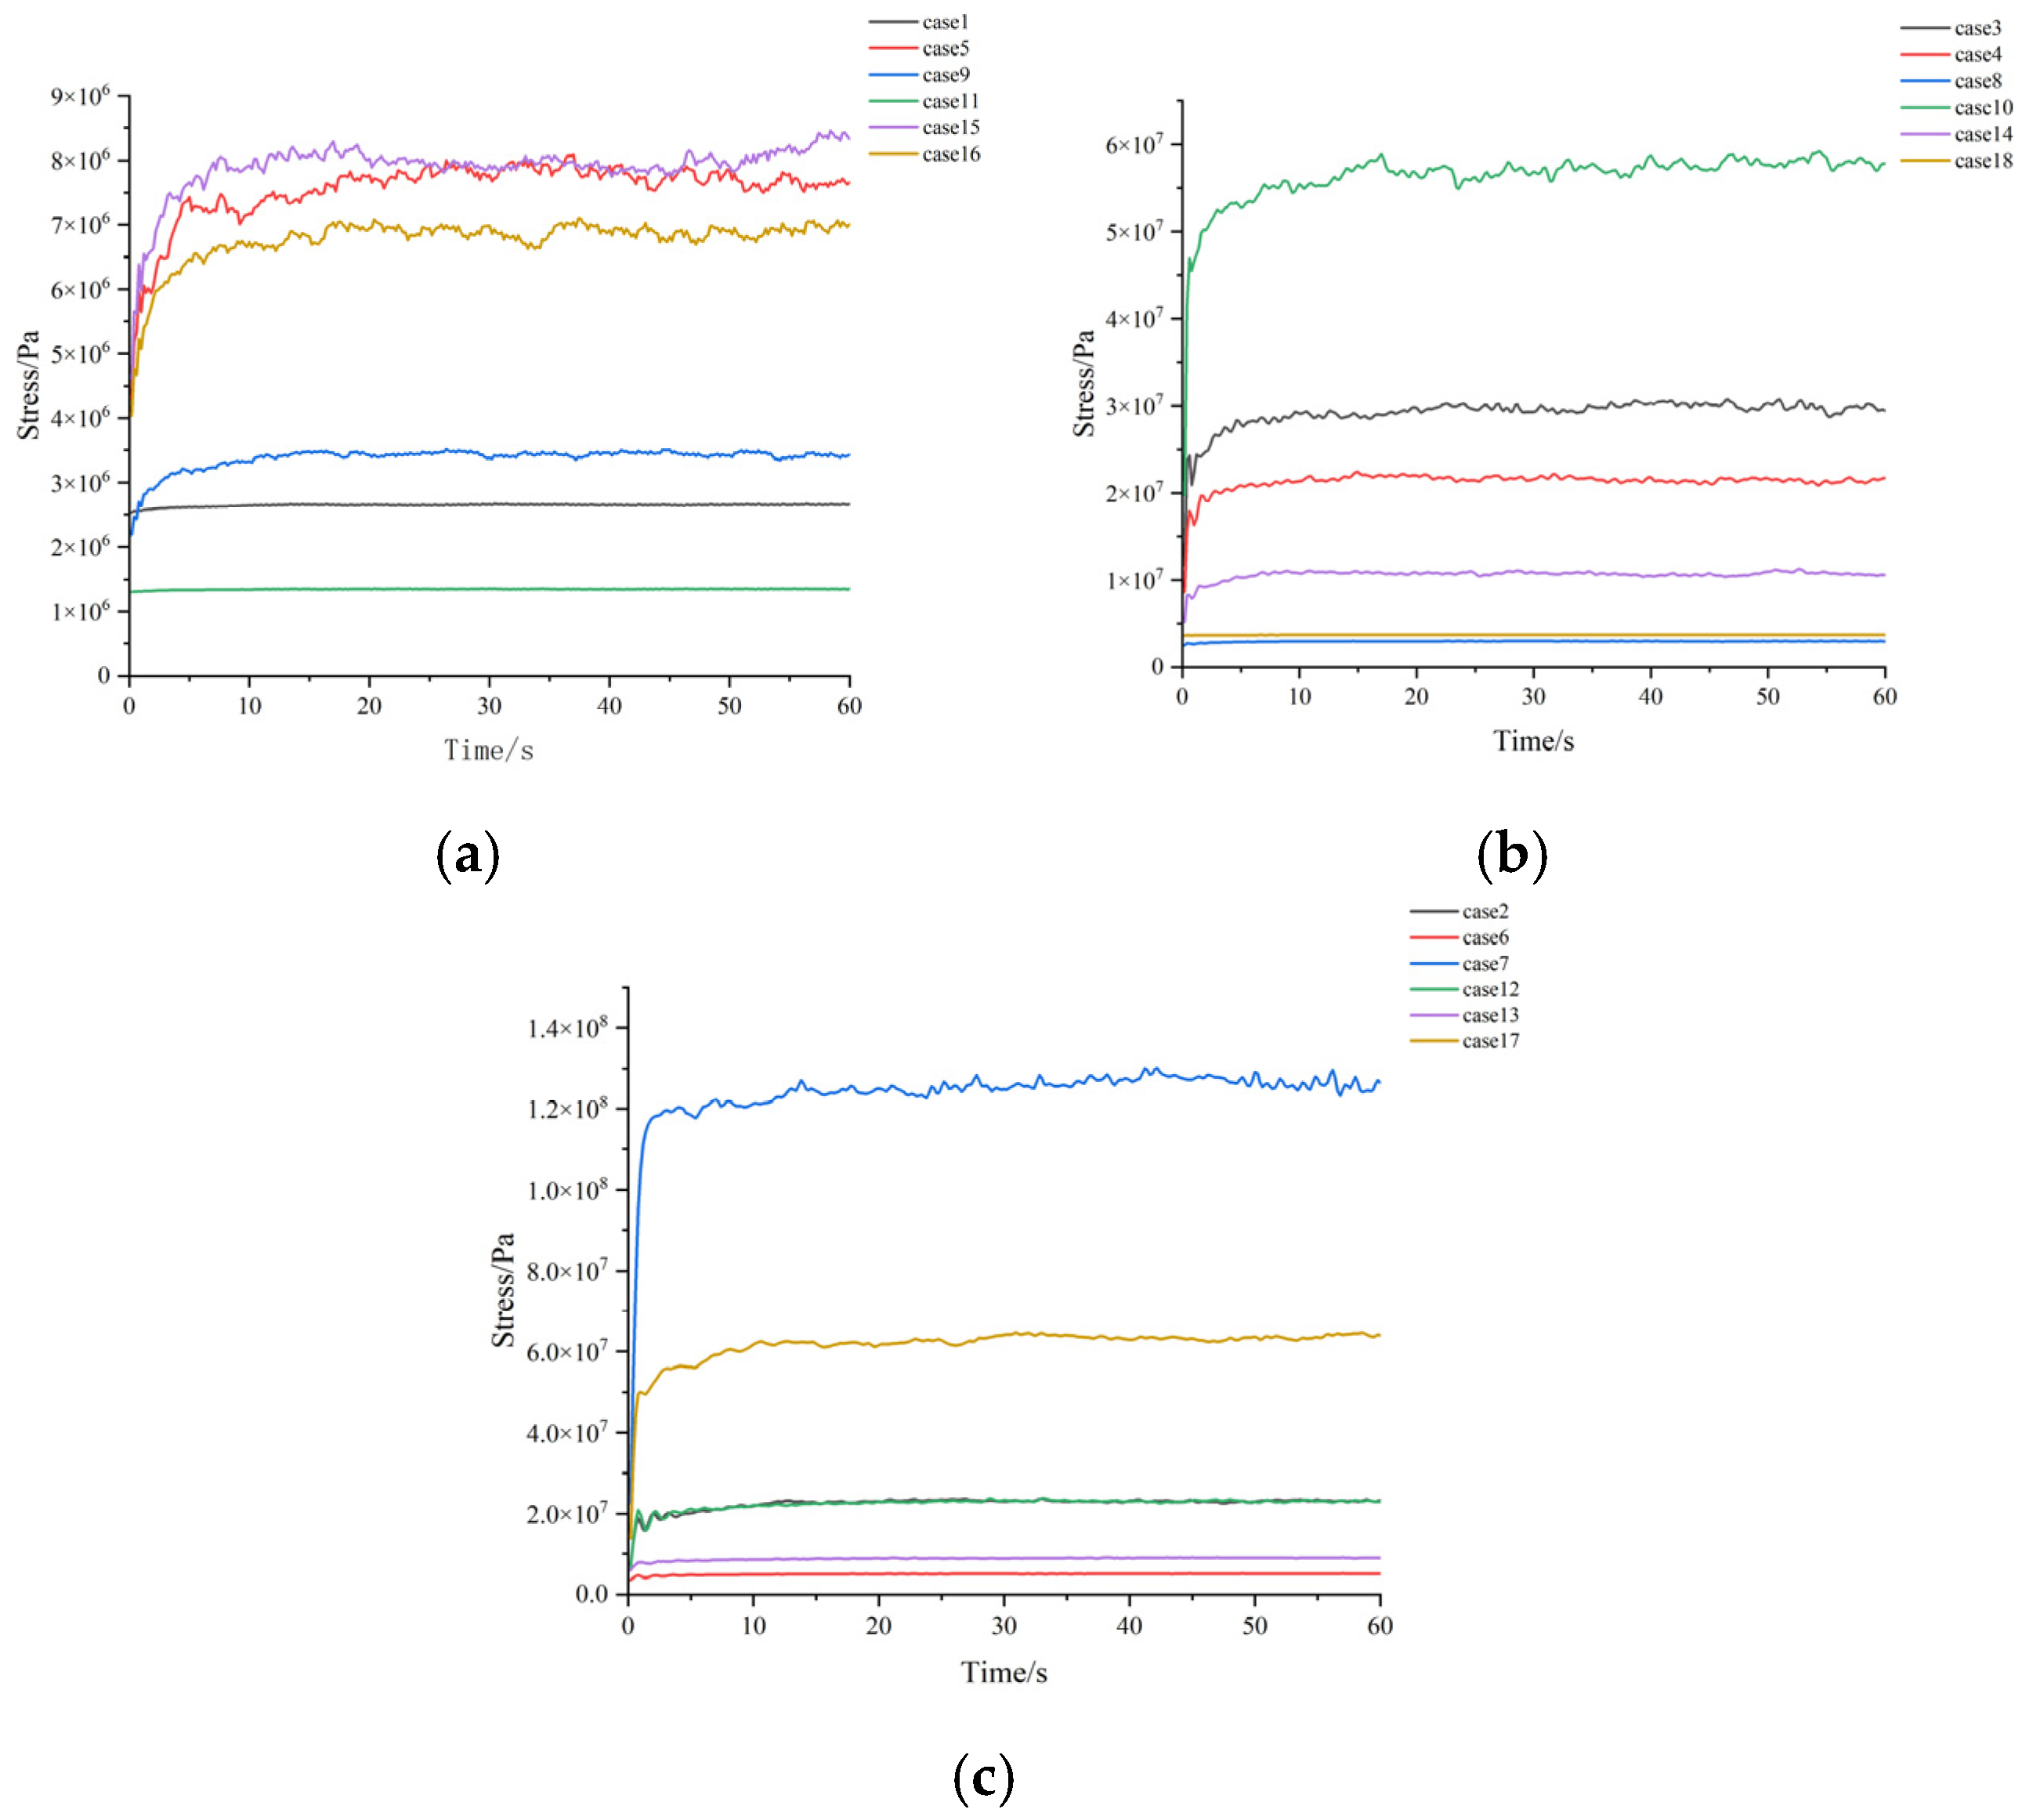
3.3. Stresses of Risers for the 18 Different Study Cases

The maximum stresses of 25 points in length were selected for each riser to present the stress distribution under the 18 study cases (Figure 13).
As can be seen from Figure 13, the stress distribution for each type of riser had a similar trend, i.e., the maximum stresses occurred at the bottom end of the riser due to the fixed support, while the minimum stresses occurred at the position of about 1/4 length of the riser from the bottom. Also, it was found that the second maximum stresses appeared at the position of about 1/3–1/2 length of the riser from the top end, where the maximum deformation occurred.
The time history of maximum stresses for 18 cases with different riser lengths is illustrated in Figure 14.
From Figure 14, it was found that the maximum stress for each case tended to stabilize after a rapid rise in a short period of time. This trend was similar to that of total deformation, and the time of the occurrence of maximum stress was similar to that of the occurrence of maximum downstream deformation, which indicated that the downstream deformation was more significant than the crossflow deformation for the riser’s stress.
According to the previous study [43], 67% of the yield stress was utilized as the allowance stress (371 MPa) for the X80 riser. For cases 3, 6, 9, 12, 15, and 18, which were X80 risers, the maximum stresses were 29.7 MPa (46.6 s), 6.02 MPa (35 s), 3.36 MPa (26.4 s), 22.2 MPa (33 s), 8.35 MPa (58.4 s), and 4.14 MPa (36.6 s), respectively. Therefore, in all of these cases, X80 risers were safe.
Correspondingly, the global stress distribution could not be used to examine the safety of the FRP composite risers directly. More specifically, the maximum global stresses would be used as the stress condition for the FRP composite risers, and then the allowance stresses (Table 2) would be divided by actual maximum stresses in the fiber direction (S1), the transverse direction (S2), and the shear direction (S12) as the safety factor (SF) [44].
For cases 1, 4, 7, 10, 13, and 16, which were optimized FRP composite risers, the minimum SFs in each composite layer were obtained and presented in Figure 15, using case 7 as an example.
From Figure 15, the minimum SFs for case 7 were 12.85 (layer 3), 4.44 (layer 17), and 10.65 (layer 4) in the fiber direction, the transverse direction, and the shear direction.
In terms of SF in the fiber direction, the axial reinforcement layers had the minimum SFs; the SFs in the ±53° reinforcement layers decreased gradually from inside to outside; and the SFs in the hoop reinforcement layers showed an increasing trend from inside to outside. This result indicated that the axial reinforcement layers undertook the main load in the fiber direction.
For the SF in the transverse direction, the hoop reinforcement layers had the minimum SFs; the SFs in the ±53° reinforcement layers decreased gradually from inside to outside; and the SFs in the axial reinforcement layers showed an increasing trend from inside to outside. This result indicated that the hoop reinforcement layers undertook the main load in the transverse direction.
It is obvious that the minimum SF in the shear direction occurred in the ±53° reinforcement layers, which indicated that the ±53° reinforcement layers undertook the main load in the shear direction.
By comparing the SFs in the fiber direction, the transverse direction, and the shear direction, it was found that the SFs in the transverse direction were far less than those in the other two directions. This showed that the stress in the transverse was the main factor for the failure of each fiber layer of the riser. At the same time, the moderate SFs in the fiber direction proved the effective use of the fiber’s strength with the optimized design.
For cases 2, 5, 8, 11, 14, and 17, which were the orthogonal FRP composite riser, the minimum safety factors in each composite layer were obtained and presented in Figure 16, using case 17 as an example.
From Figure 16, the minimum SFs for case 17 were 20.59 (layer 10), 28.31 (layer 21), and 128.22 (layer 1) in the fiber direction, the transverse direction, and the shear direction.
In terms of SF in the fiber direction, the axial reinforcement layers presented an increasing trend for the hoop reinforcement layers, while the trend for the axial reinforcement layers was the opposite and the values were much smaller. This result indicated that the axial reinforcement layers undertook the main load in the fiber direction.
For the SF in the transverse direction, the hoop reinforcement layers had the minimum SFs and showed a decreasing trend from inside to outside. This result indicated that the hoop reinforcement layers undertook the main load in the transverse direction.
It is also obvious that the SFs in the shear direction were comparatively large in all of the layers for the orthogonal FRP composite riser.
Based on a comparison of Figure 15 and Figure 16, the smaller SFs (without failure) in the optimized FRP composite riser proved that the optimized design can better utilize the performance of FRP composite materials than the traditional orthogonal design.

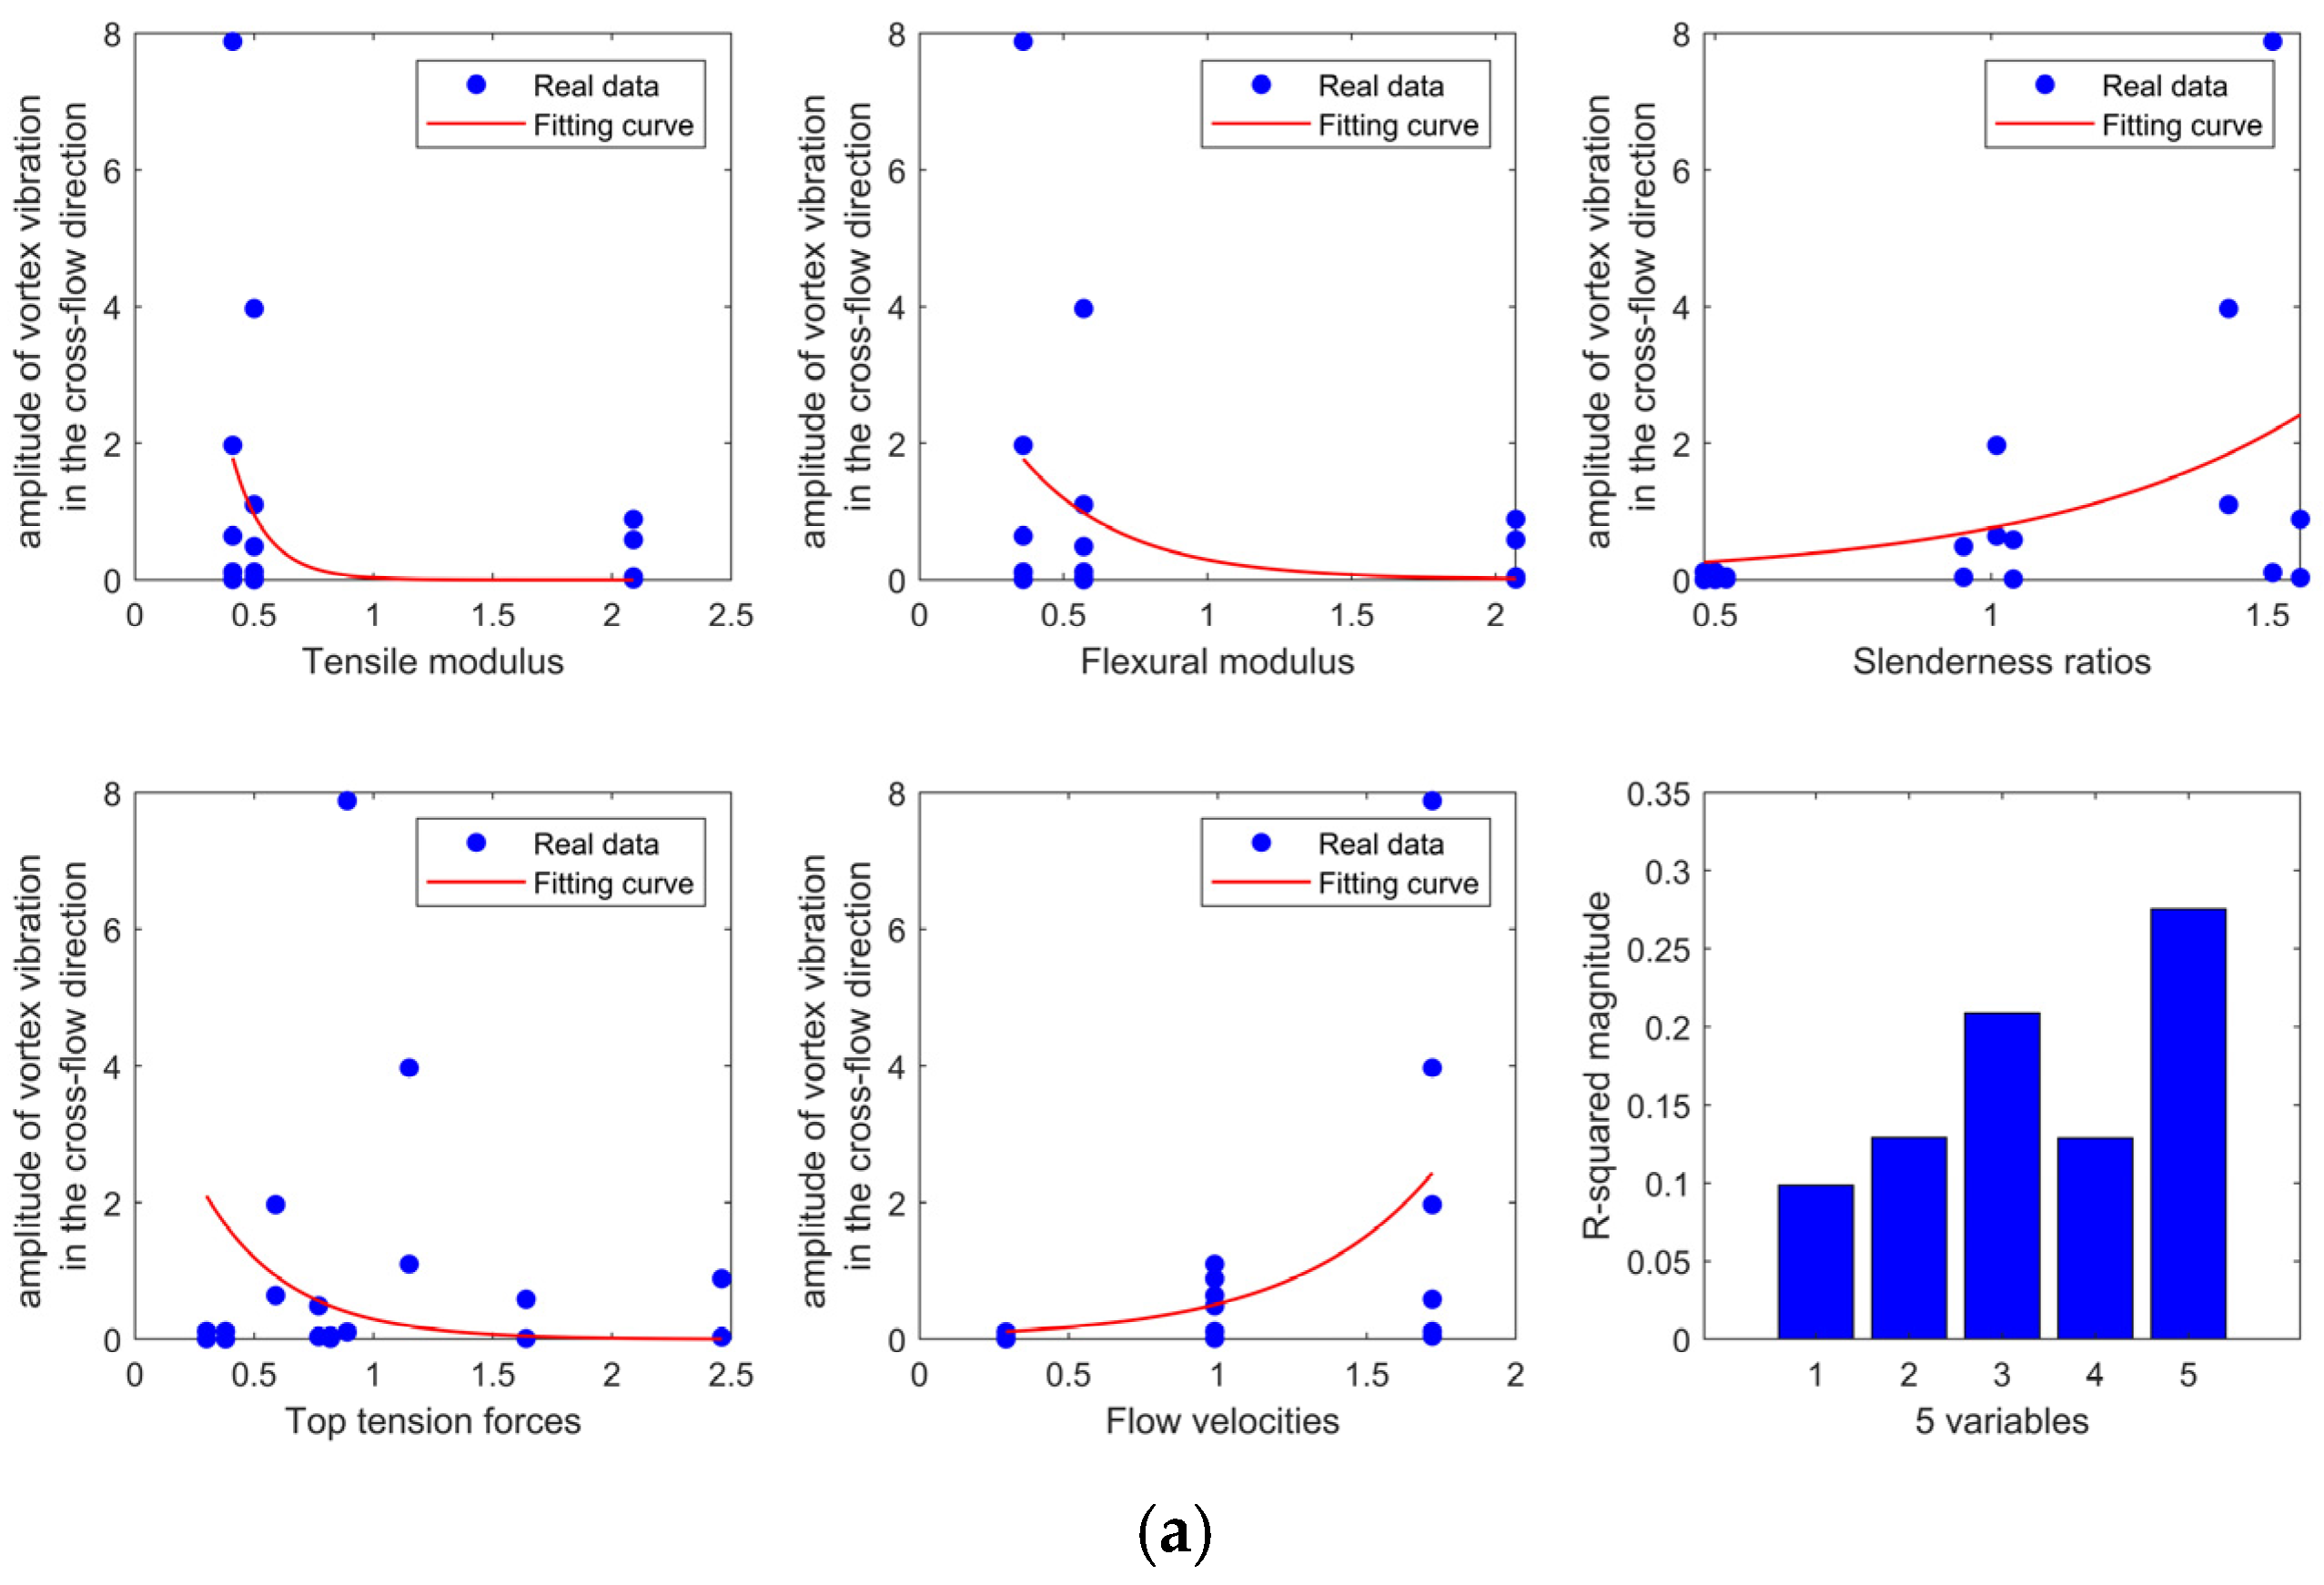
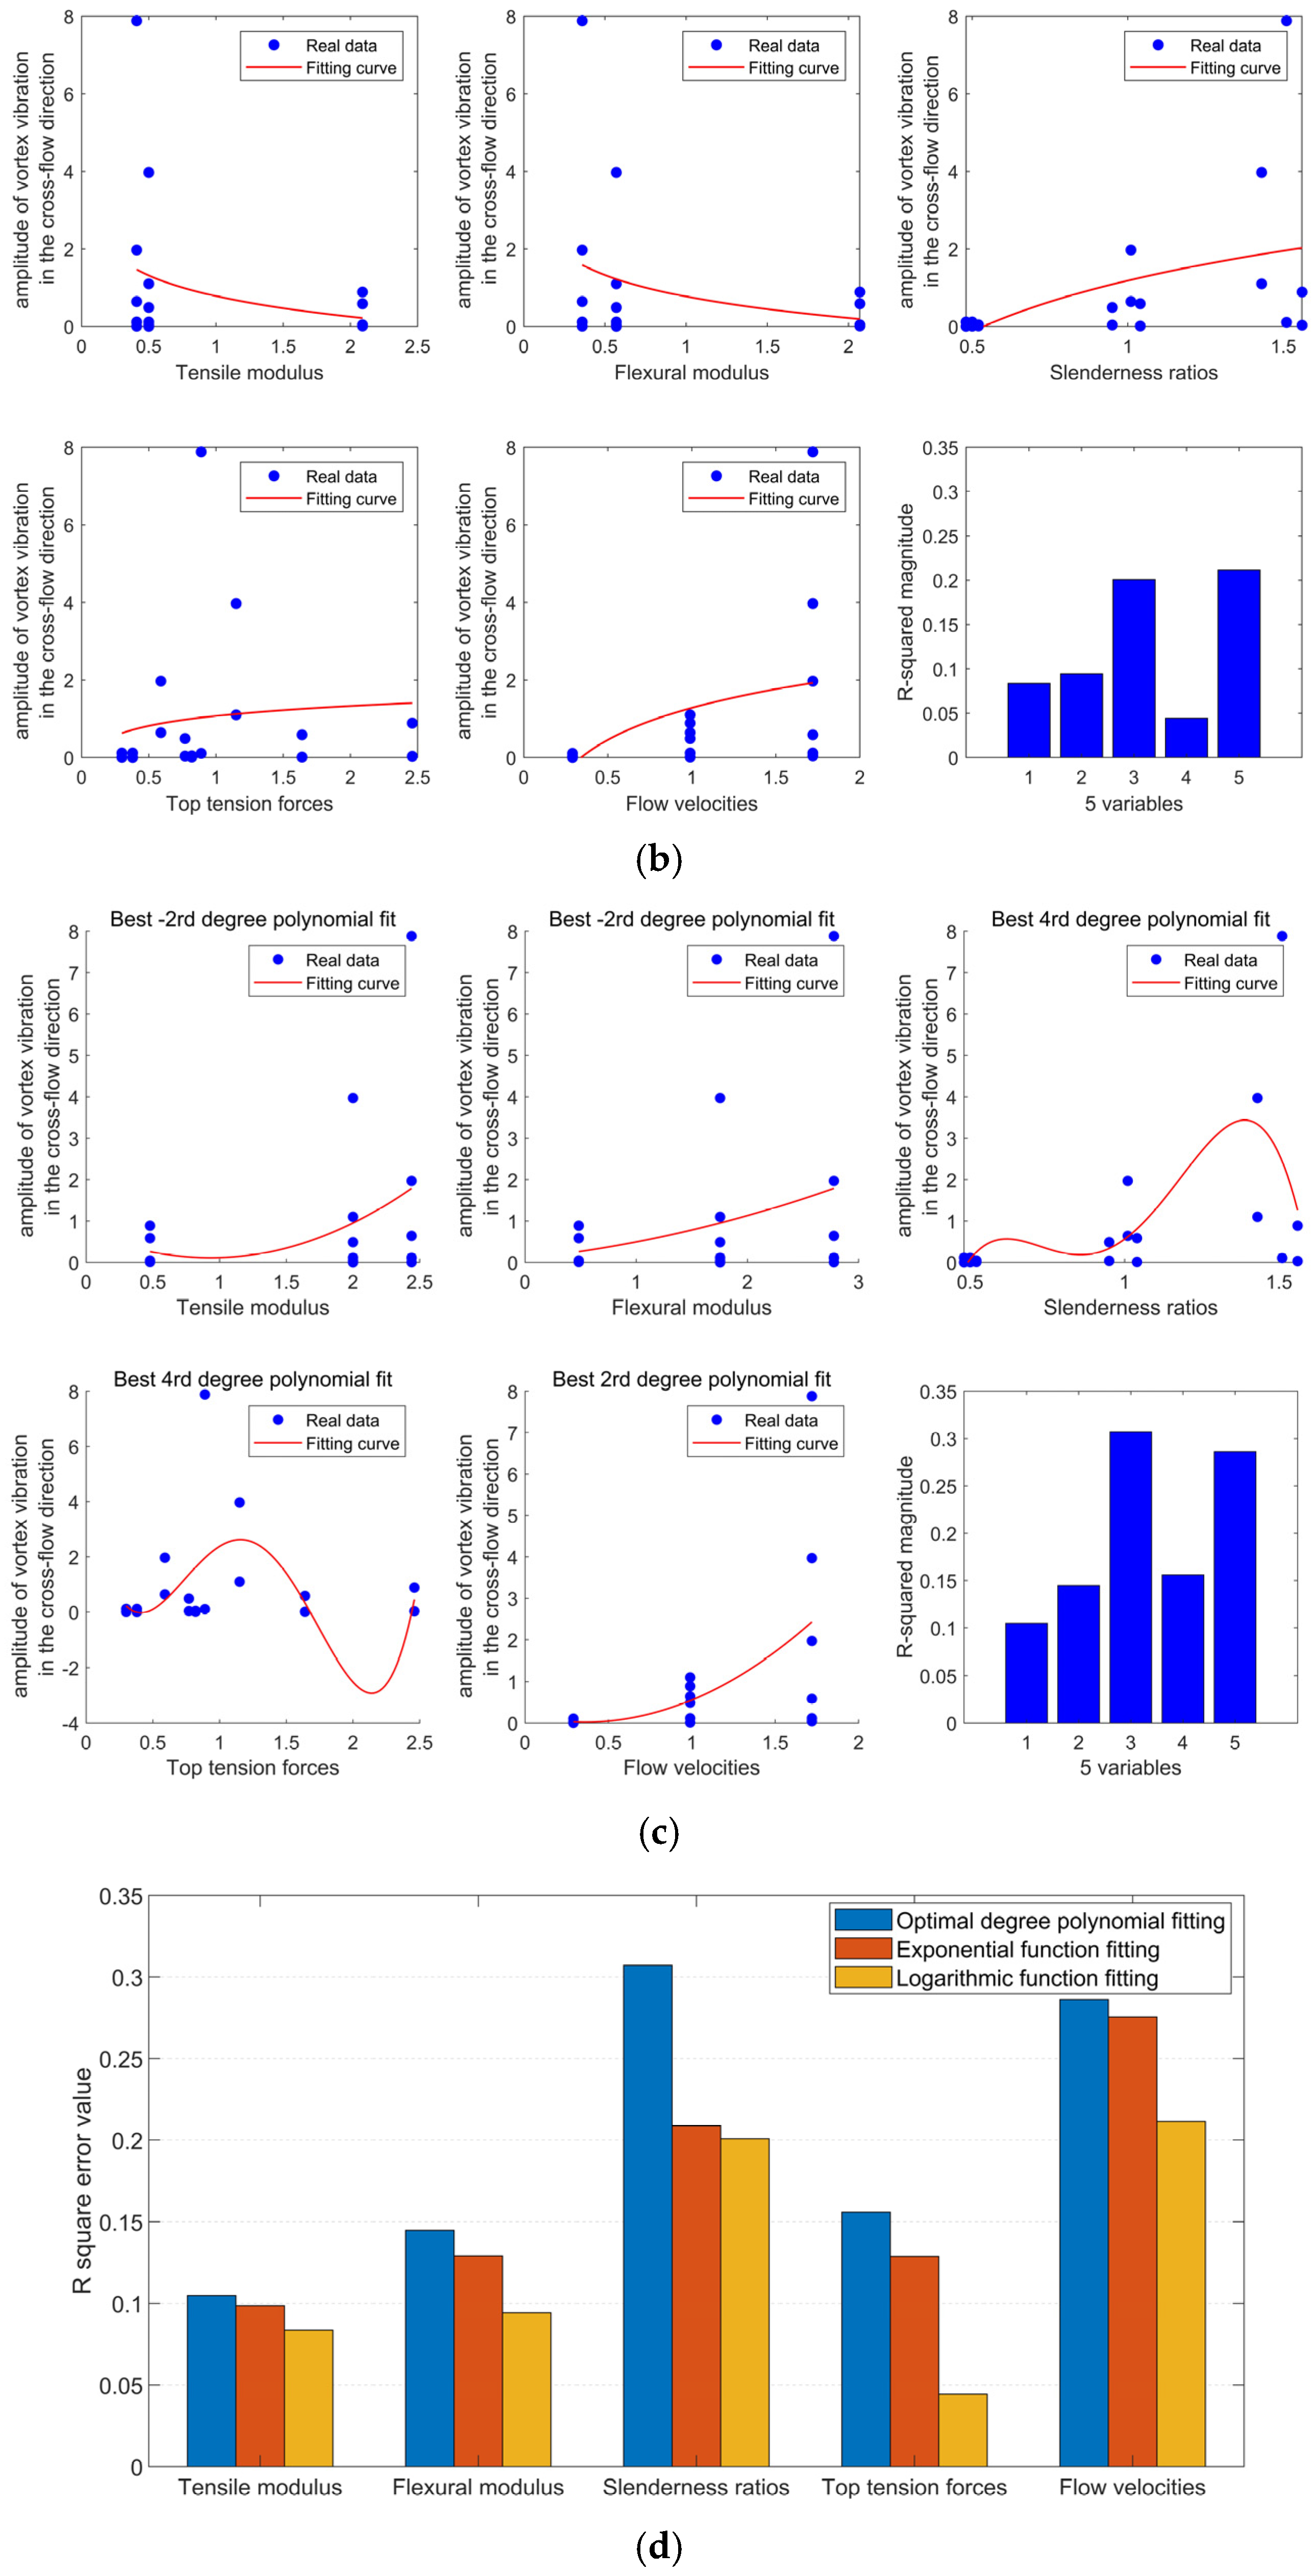
3.4. Fitting Analysis with Multiple Nonlinear Regression Model

The VIV of the studied risers involved multiple influencing factors, and the relationship between these factors was nonlinear. Unlike traditional marine risers composed of isotropic materials, FRP composite risers have a layered structure, with anisotropic constituents in each layer. Stress distribution within composite risers varies across individual layers due to reinforcement orientations and layup configurations, and directional stress heterogeneity exists within each fiber layer. Consequently, while equivalent stress is conventionally employed to evaluate the global stress state of FRP composite risers, it is infeasible to directly ascertain stress values within specific fiber layers. In contrast, vibration amplitude constitutes a direct measurable response under VIV and has been consistently utilized as a performance metric in related studies [45,46,47]. Therefore, the amplitude of vortex vibration was selected as the target variable in this study. From the analysis of the above sections, it was found that the tensile modulus (Etenile), flexural modulus (Eflexural), slenderness ratios (L/D), flow velocities (U), and top tension forces (F) affected the VIV of the studied risers significantly. More specifically, the design methods and materials determined Etensile and Eflexural, while the L/D and riser types jointly determined the top tension force.
Therefore, in order to study the coupled effect of these five factors, a fitting analysis with a multiple nonlinear regression model was conducted in this section. The multi-nonlinear regression model is a regression analysis method used to analyze the nonlinear relationship between the independent variables and the target variables. This nonlinear relationship could be modeled using polynomials to fit a predicted function within a reasonable range of the independent variables [48].

3.4.1. Data Handling

The multiple nonlinear regression model is expressed generally in Equation (7).
y = f ( x 1 , x 2 , x k ) + ε
where y is the target variable, x 1 , x 2 , x 3 x k is the independent variable, f ( x ) is a nonlinear function, and ε is the error term.
More specifically, y is the amplitude of vortex vibration in the crossflow direction (m), x 1 is the tensile modulus (GPa), x 2 is the flexural modulus (GPa), x 3 is the slenderness ratios, x 4 is the top tension forces (N), and x 5 is the flow velocities (m/s).
The original data for Equation (7) are presented in Equation (8).
y = 7 . 01 × 10 5 1 . 31 × 10 2 4 . 75 × 10 - 2 1 . 34 × 10 - 4 x = 40.5 50.1 207 40.5 50.1 207 37.5 56.8 207 37.5 56.8 207 40 114 83 40 114 83 11 , 200 43 , 774 62 , 309 11 , 200 43 , 774 62 , 309 0.36 1.22 2.13 1.22 2.13 0.36
In order to make the algorithm’s performance more stable and efficient during the model training process, the original data were standardized using Equation (9) and presented as in Equation (10).
y = 18 y ( n ) n = 1 18 y ( n ) x n = 18 x ( n ) n = 1 18 x ( n )
y = 5 . 86 × 10 3 1 . 10 × 10 0 3.97 × 10 0 1 . 12 × 10 - 2 x = 0.41 0.50 2.09 0.41 0.50 2.09 0.36 0.57 2.07 0.36 0.57 2.07 0.50 1.43 1.04 0.50 1.43 1.04 0.30 1.15 1.64 0.30 1.15 1.64 0.29 0.99 1.72 0.99 1.72 0.29

3.4.2. Modeling

In order to increase the accuracy of the fitting analysis, three functional relationships, i.e., exponential function, logarithmic function, and polynomial function, were utilized, and the accuracy of these functions was compared, as shown in Figure 17.
For polynomial function, the exponential order for each variable should be determined first. Table 6 shows the accuracy of polynomial function with different exponential orders for each variable.
From Table 6, the optimal exponential orders for x1, x2, x3, x4, and x5 were −2, −2, 4, 4, and 2, respectively.
As can be seen from Figure 17, the largest R2 for each variable was obtained using polynomial function, which will be used in the following part.

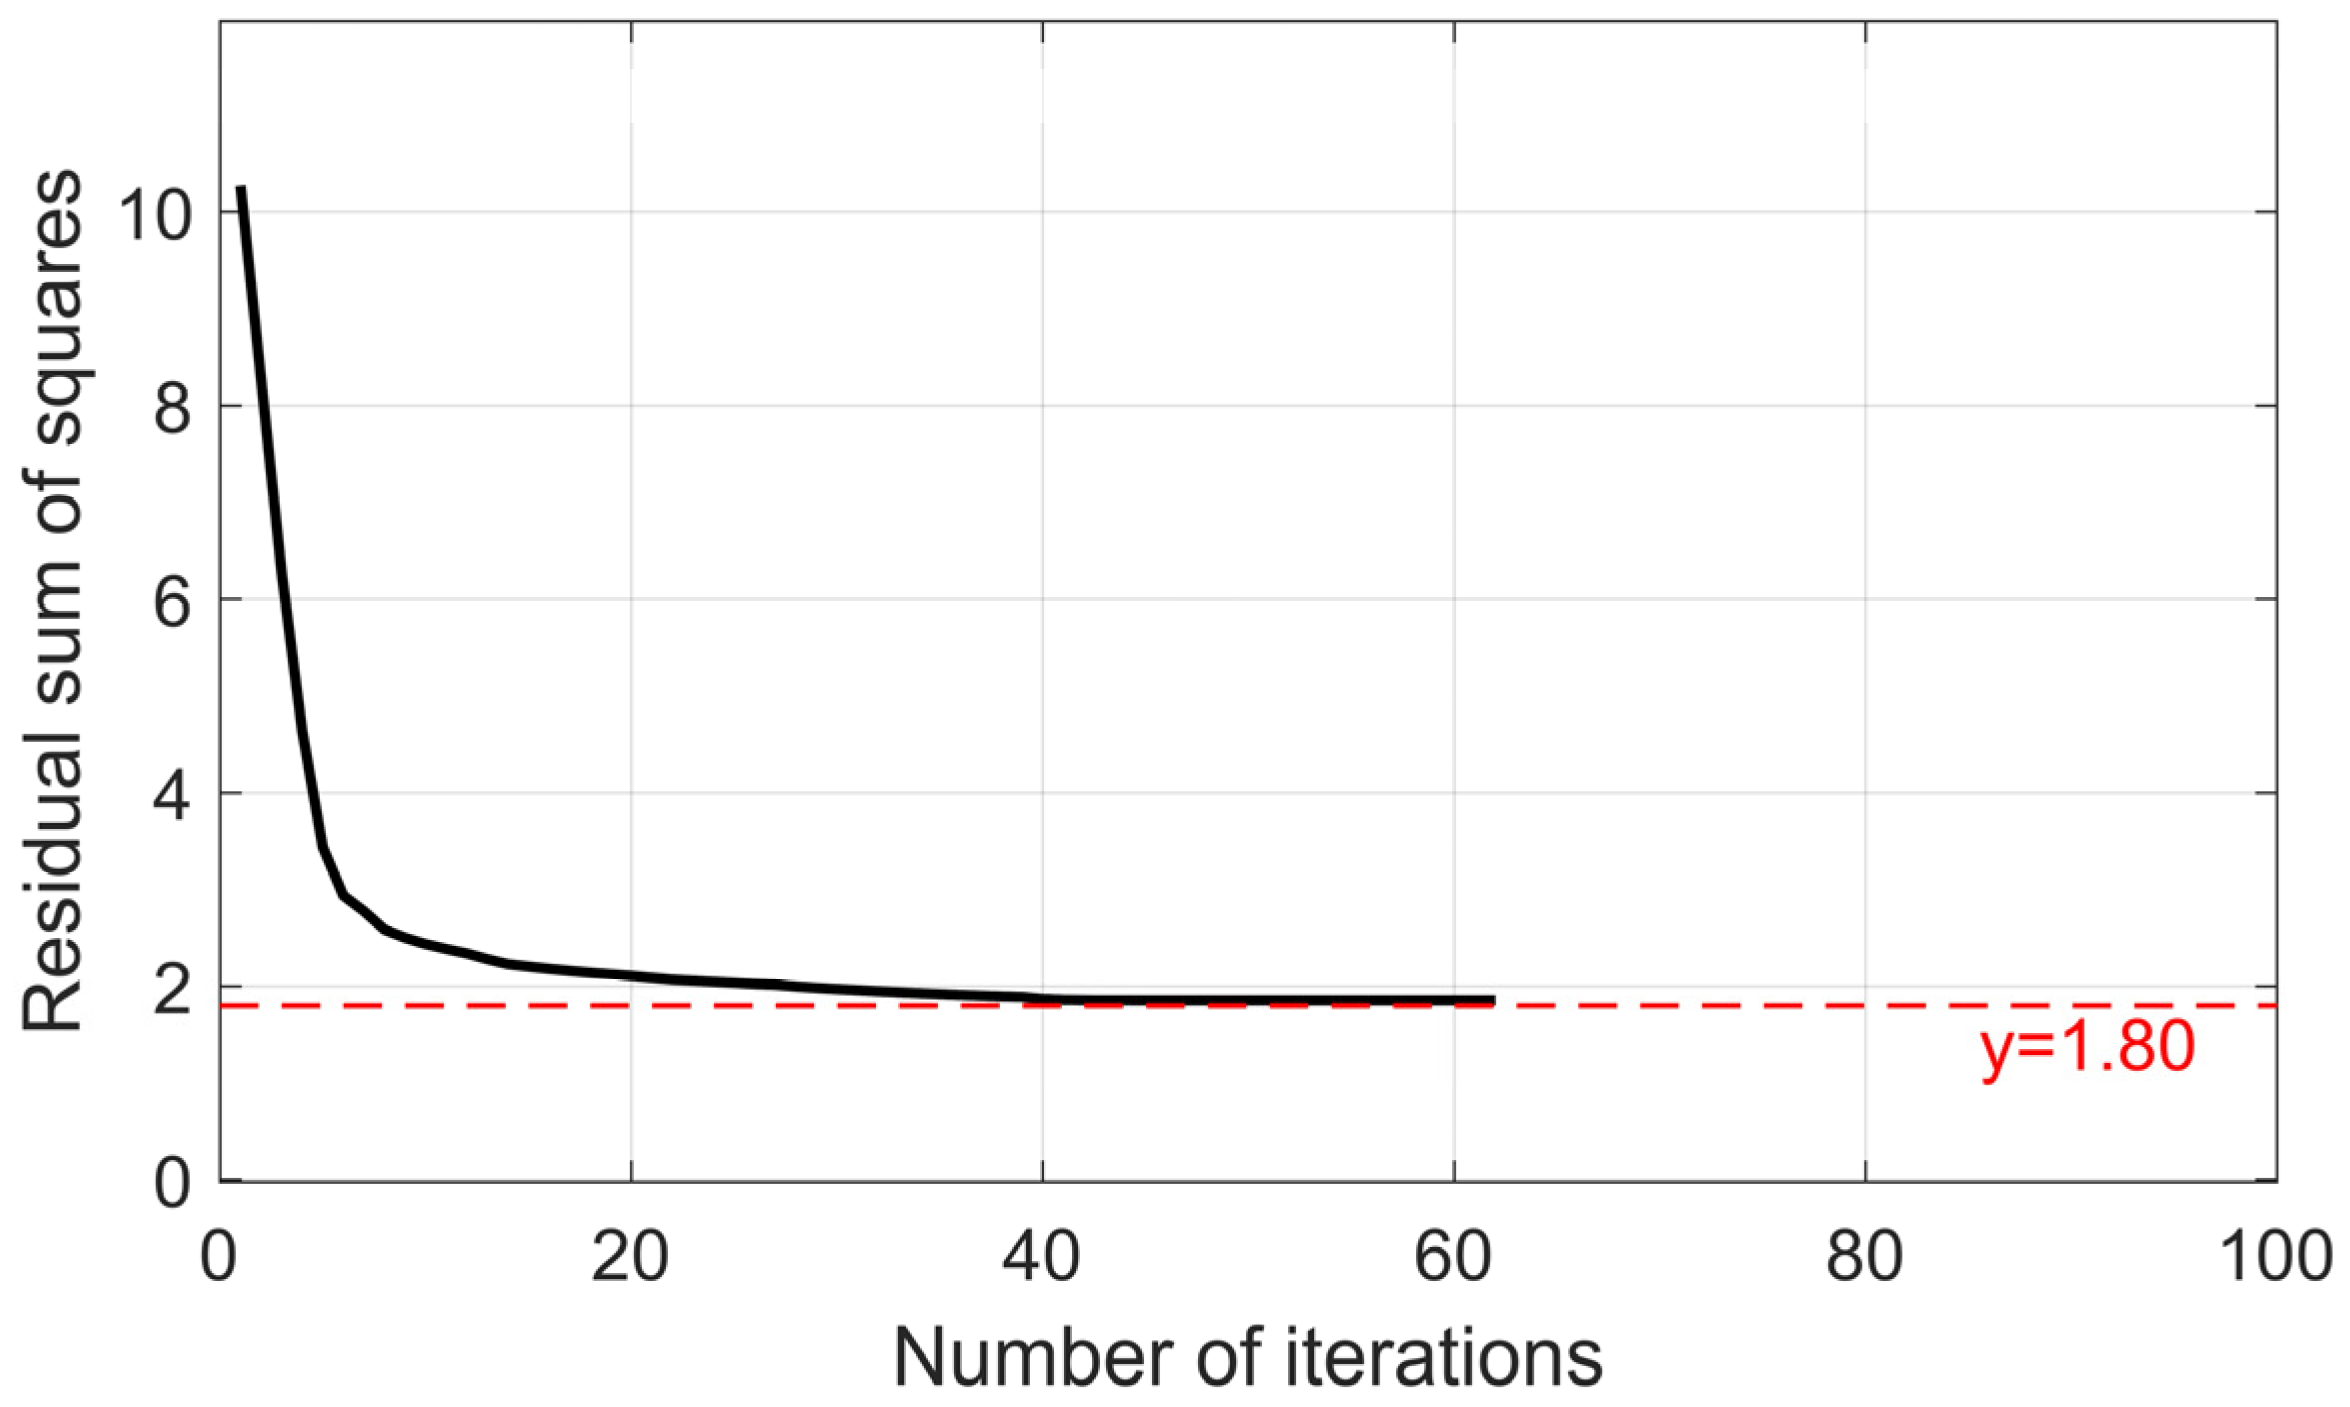
3.4.3. Fitting Method and Process

The data were divided into a training database and a test database, i.e., the first 16 sets were the training sets and the last 2 sets were used for the test. Polynomial function fitting used the nonlinear least square method with the criterion of minimizing the sum of squares of the errors [49], as seen in Equation (11).
i = 0 n ( y i f i ( x ) ) 2
where y i was the i-th actual value and f i ( x ) was the i-th predicted value.
For the calculation of the nonlinear least square method in this paper, the Levenberg–Marquardt (LM) method, for which the core idea is to solve the nonlinear minimization problem by introducing a damping factor [50], was chosen.
Based on the optimal exponential orders for the five intendent variables from Table 6, the multivariate nonlinear model equation was established as Equation (12). And, using Equation (11), the error equation can be expressed as Equation (13).
Y 1 ( x ) = b 1 x 1 - 2 + b 2 x 2 - 2 + b 3 x 3 4 + b 4 x 4 4 + b 5 x 5 2 + b 0
r ( x ) = i = 1 18 [ y i Y 1 ( x ) ] 2
The initial parameter vectors (b0, b1, …, b5) were all set to 1 in the first iteration. After 62 iterations, the r ( x ) remained stable at about 1.89 (Figure 18), and the values for b0, b1, …, b5 are presented in Table 7. It corresponded to R2 = 0.604 and RSEM = 1.404.
From the values of R2 and RSEM, it could be concluded that a single factor could not have a significant independent impact on the vibration amplitude in the crossflow direction. Therefore, the coupled effects of two factors have been developed, and the initial Equation (12) has been expanded as Equation (14).
Y 2 ( x ) = b 1 x 1 - 2 + b 2 x 2 - 2 + b 3 x 3 4 + b 4 x 4 4 + b 5 x 5 2 + i = 1 4 b i + 5 x i x i + 1 + i = 1 3 b i + 9 x i x i + 2 + i = 1 2 b i + 12 x i x i + 3 + b 15 x 1 x 5 + b 0
where bn (n = 1, 2, …, 15) were the parameters to be optimized.
The values of the error equation (Equation (13)) with the increasing number of iterations are presented in Figure 19.
From Figure 19, it was found that after 83 iterations, the r ( x ) remained stable at about 0.64, and the values for b0, b1, …, b15 are presented in Table 8. It corresponded to R2 = 0.989 and RSEM = 0.039, which indicated the accuracy of the fitted model, and the comparison between the actual vibration amplitude and predicted vibration amplitude is illustrated in Figure 20.
From the comparison between the actual vibration amplitude and the predicted vibration amplitude in Figure 20, the overall difference between actual values and predicted values was 4.5%, especially for the cases with obvious VIV. This showed the good accuracy of Equation (14), especially for the cases with obvious VIV. The analysis of the coupled effect of three, four, and five factors was also conducted; however, the R2 and RSEM did not change obviously, which meant that consideration of the coupled effect of two factors reached an acceptable prediction. It should be noted that based on the technical foundations of nonlinear regression modeling, the method demonstrates robust predictive performance for continuous data within the calibrated parameter range [51]. However, it also exhibits significant limitations when extrapolating to parameter boundary regions, particularly manifesting as substantial prediction errors at the lower critical boundary [51]. Due to this constraint, additional fitting procedures are normally required for design parameters extending beyond the training domain [52]. Future investigations could consider advanced methodologies, such as artificial neural network (ANN). It exhibits enhanced nonlinear modeling capability and generalization ability that effectively capture complex fluid–structure interactions and efficiently process high-dimensional data, as validated in a recent riser fatigue damage prediction study [53].
Based on the values in Table 8, it was found that the most important single factors were b1 (tensile modulus) and b3 (slenderness ratio) and the most significant interacting factors were b11 (flexural modulus + top tension force). And, it has to be noted that the interaction of coupled factors generally affected the crossflow VIV more remarkably than a single factor. Within engineering practice, this model could be integrated throughout the design–evaluation cycle. During conceptual design, engineers input core parameters (e.g., environmental conditions, material properties) to delineate viable operating envelopes meeting VIV performance requirements. In the detailed design stage, the model’s output—employed in tandem with finite element analysis—guides parametric optimization while minimizing physical testing needs. For safety assessment, the model predicts riser dynamics across diverse marine environments, establishes data-driven early-warning thresholds, and enables evidence-based decision making across all project phases.

4. Conclusions

In this paper, the vortex-induced vibration characteristics of FRP composite risers (both orthotropic and optimized design) and metal risers under 18 different study cases were investigated using FEA simulations, and the feasibility and accuracy of the FEA method have been proven through a corresponding experimental test. The influence of five factors on the VIV of risers was obtained using a multivariate nonlinear fitting model, and the coupling effect of parameters with different numbers of interactions was also examined.
From this study, the following was found.
(1)
All three types of risers tended to stabilize after the initial growth of displacement in the downstream direction, while the displacement exhibited obvious vibration characteristics in the crossflow direction. With the same condition, the optimized FRP composite riser had the largest displacement, while that of the metal riser was the smallest. Moreover, the increase in the riser’s length and flow velocity, as well as the decrease in the riser’s modulus, led to the increase of downstream displacement and crossflow vibration amplitude.
(2)
The overall stresses of both FRP composite risers were less than that of the metal riser, and the optimized FRP composite riser could more effectively use the strength of the reinforced fiber.
(3)
When the number of coupled parameters reached two, the accuracy of the established multivariate nonlinear fitting model gained an acceptable level. The most important single factors were b1 (tensile modulus) and b3 (slenderness ratio), and the most significant interacting factors were b11 (flexural modulus + top tension force). Moreover, the crossflow VIV was affected by the interaction of coupled factors, which was generally more remarkable than that of the single factors.

Author Contributions

Conceptualization, L.Z., C.W. and W.H.; methodology, L.Z., C.W. and W.H.; validation, L.Z. and C.W.; formal analysis, L.Z. and C.W.; data curation, L.Z., K.M., Z.Z., R.Z. and C.V.A.; investigation, L.Z. and C.W.; writing—original draft preparation, L.Z. and C.W.; writing—review and editing, C.W.; supervision, C.W. All authors have read and agreed to the published version of the manuscript.

Funding

This research was funded by the Shandong Province Graduate Education Quality Teaching Resources Project (SDYAL2023114); the Shandong Undergraduate Teaching Reform Research Project (Z2023102); the Shandong Natural Science Foundation Project (ZR2020ME269); the Open Fund Project of the Shandong Key Laboratory of Ocean Engineering (KLOE202005); and the Key Research and Development Program of Shandong Province (2019GHY112076).

Data Availability Statement

The data is contained in the article.

Conflicts of Interest

The authors declare no conflict of interest.

References

  1. Liu, G.; Li, H.; Qiu, Z.; Leng, D.; Li, Z.; Li, W. A mini review of recent progress on vortex-induced vibrations of marine risers. Ocean Eng. 2020, 195, 106704. [Google Scholar] [CrossRef]
  2. Amaechi, C.V.; Reda, A.; Shahin, M.A.; Sultan, I.A.; Beddu, S.B.; Ja’e, I.A. State-of-the-art review of composite marine risers for floating and fixed platforms in deep seas. Appl. Ocean Res. 2023, 138, 103624. [Google Scholar] [CrossRef]
  3. Amaechi, C.V. Local tailored design of deep-water composite risers subjected to burst, collapse and tension loads. Ocean Eng. 2022, 250, 110196. [Google Scholar] [CrossRef]
  4. Ye, J.; Zhou, H.; He, K. A generalized framework of two-way coupled numerical model for fluid-structure-seabed interaction (FSSI): Explicit algorithm. Eng. Geol. 2024, 340, 107679. [Google Scholar] [CrossRef]
  5. Tan, L.B.; Chen, Y.; Jaiman, R.K.; Sun, X.; Tan, V.B.C.; Tay, T.E. Coupled fluid–structure simulations for evaluating a performance of full-scale deepwater composite riser. Ocean Eng. 2015, 94, 19–35. [Google Scholar] [CrossRef]
  6. Zheng, R.; Wang, C.; He, W.; Zhang, Z.; Ma, K.; Ren, M. The Experimental Study of Dynamic Response of Marine Riser under Coupling Effect of Multiparameter. J. Mar. Sci. Eng. 2023, 11, 1787. [Google Scholar] [CrossRef]
  7. Wang, C.; Shankar, K.; Morozov, E.V. Global design and analysis of deep sea FRP composite risers under combined environmental loads. Adv. Compos. Mater. 2017, 26, 79–98. [Google Scholar] [CrossRef]
  8. Ge, S.; Wang, C.; Sun, M.; Wang, Y. Three-dimensional computational fluid dynamics simulation of vortex-induced vibration of fiber-reinforced composite marine risers considering fluid-structure interaction. Jinan Univ. J. (Nat. Sci. Ed.) 2020, 34, 1–9. [Google Scholar] [CrossRef]
  9. Wang, C.; Shankar, K.; Ashraf, M.A.; Morozov, E.V.; Ray, T. Surrogate-assisted optimisation design of composite riser. Proc. Inst. Mech. Eng. Part L J. Mater. Des. Appl. 2016, 230, 18–34. [Google Scholar] [CrossRef]
  10. Toh, W.; Tan, L.B.; Jaiman, R.K.; Tay, T.E.; Tan, V.B.C. A comprehensive study on composite risers: Material solution, local end fitting design and global response. Mar. Struct. 2018, 61, 155–169. [Google Scholar] [CrossRef]
  11. Wang, C.; Sun, M.; Shankar, K.; Xing, S.; Zhang, L. CFD Simulation of Vortex Induced Vibration for FRP Composite Riser with Different Modeling Methods. Appl. Sci. 2018, 8, 684. [Google Scholar] [CrossRef]
  12. Lin, M.Y.; Huang, L.H. Numerical simulation of wave–structure interaction using a Lagrangian vortex method. Ocean. Eng. 2012, 44, 11–22. [Google Scholar] [CrossRef]
  13. Ragheb, H.A.; Goodridge, M.; Pham, D.C.; Sobey, A.J. Extreme response based reliability analysis of composite risers for applications in deepwater. Mar. Struct. 2021, 78, 103015. [Google Scholar] [CrossRef]
  14. Nammi, S.K.; Gupta, R.; Pancholi, K. Comparative strength and stability analysis of conventional and lighter composite flexible risers in ultra-deep water subsea environment. Proc. Inst. Mech. Eng. Part E J. Process Mech. Eng. 2025, 239, 666–677. [Google Scholar] [CrossRef]
  15. Liu, H.; Li, M.; Shen, Y. Numerical Analysis of Mechanical Behaviors of Composite Tensile Armored Flexible Risers in Deep-Sea Oil and Gas. J. Mar. Sci. Eng. 2023, 11, 619. [Google Scholar] [CrossRef]
  16. Liu, Q.; Xue, H.; Tang, W.; Yuan, Y. Theoretical and numerical methods to predict the behaviour of unbonded flexible riser with composite armour layers subjected to axial tension. Ocean Eng. 2020, 199, 107038. [Google Scholar] [CrossRef]
  17. Kang, C.; Zhan, J.; Liu, Z.; Jing, X.; Deng, B.; Guo, J.; Weng, H.; Liu, J.; Wang, J. Numerical study of the axial compression strength for nano-reinforced filament-wound riser considering curing residual stress. Appl. Ocean Res. 2024, 142, 103829. [Google Scholar] [CrossRef]
  18. Edmans, B.D.; Pham, D.C.; Zhang, Z.Q.; Guo, T.F.; Sridhar, N.; Stewart, G. An Effective Multiscale Methodology for the Analysis of Marine Flexible Risers. J. Mar. Sci. Eng. 2019, 7, 340. [Google Scholar] [CrossRef]
  19. Wang, E.; Xiao, Q. Numerical simulation of vortex-induced vibration of a vertical riser in uniform and linearly sheared currents. Ocean Eng. 2016, 121, 492–515. [Google Scholar] [CrossRef]
  20. Zheng, Y.; Chen, J. A modified multi-objective particle swarm optimization approach and its application to the design of a deepwater composite riser. Acta Mech. Sin. 2018, 34, 275–284. [Google Scholar] [CrossRef]
  21. Amaechi, C.V.; Gillett, N.; Odijie, A.C.; Hou, X.; Ye, J. Composite risers for deep waters using a numerical modelling approach. Compos. Struct. 2019, 210, 486–499. [Google Scholar] [CrossRef]
  22. Pham, D.C.; Sridhar, N.; Qian, X.; Sobey, A.J.; Achintha, M.; Shenoi, A. A review on design, manufacture and mechanics of composite risers. Ocean Eng. 2016, 112, 82–96. [Google Scholar] [CrossRef]
  23. Huang, Z.; Zhang, W.; Qian, X.; Su, Z.; Pham, D.-C.; Sridhar, N. Fatigue behaviour and life prediction of filament wound CFRP pipes based on coupon tests. Mar. Struct. 2020, 72, 102756. [Google Scholar] [CrossRef]
  24. Chang, X.P.; Qu, C.J.; Song, Q.; Li, Y.H.; Liu, J. Coupled cross-flow and in-line vibration characteristics of frequency-locking of marine composite riser subjected to gas-liquid multiphase internal flow. Ocean Eng. 2022, 266, 113019. [Google Scholar] [CrossRef]
  25. Liu, M. Multi-Fidelity Machine Learning Prediction Method for Vortex-Induced Vibration of Marine Risers. Master’s Thesis, Dalian Maritime University, Dalian, China, 2024. [Google Scholar] [CrossRef]
  26. Wang, C.; Ge, S.; Jaworski, J.; Liu, L.; Jia, Z. Effects of Different Design Parameters on the Vortex Induced Vibration of FRP Composite Risers Using Grey Relational Analysis. J. Mar. Sci. Eng. 2019, 7, 231. [Google Scholar] [CrossRef]
  27. Ragheb, H.; Sobey, A. Effects of extensible modelling on composite riser mechanical responses. Ocean Eng. 2021, 220, 108426. [Google Scholar] [CrossRef]
  28. Khan, R.A.; Ahmad, S. Nonlinear Dynamic and Bilinear Fatigue Performance of Composite Marine Risers in Deep Offshore Fields. In Proceedings of the OMAE2020, Volume 2A: Structures, Safety, and Reliability, Virtual, 3–7 August 2020. [Google Scholar] [CrossRef]
  29. Wang, C.G.; Ma, Y.H.; Sun, M.Y.; Zhang, L.; Wang, Y.T. Three-dimensional CFD vortex-induced vibration simulation of metal and composite Marine risers. J. Shandong Univ. Technol. (Nat. Sci. Ed.) 2017, 31, 35–41. [Google Scholar] [CrossRef]
  30. Alexander, C.; Ochoa, O.O. Extending onshore pipeline repair to offshore steel risers with carbon–fiber reinforced composites. Compos. Struct. 2010, 92, 499–507. [Google Scholar] [CrossRef]
  31. Chen, Y.; Seemann, R.; Krause, D.; Tay, T.-E.; Tan, V.B.C. Prototyping and testing of composite riser joints for deepwater application. J. Reinf. Plast. Compos. 2016, 35, 95–110. [Google Scholar] [CrossRef]
  32. Lambert, A.; Do, A.T.; Felix-Henry, A.; Grosjean, F. Qualification of Unbonded Dynamic Riser with Carbon Fiber Composite Armours. In Proceedings of the ASME 2012 31st International Conference on Ocean, Offshore and Arctic Engineering, Rio de Janeiro, Brazil, 1–6 July 2012; Volume 3: Pipeline and Riser Technology. The American Society of Mechanical Engineers (ASME): New York, NY, USA, 2012; pp. 117–125. [Google Scholar] [CrossRef]
  33. Jena, R.K.; Yue, C.Y. Development of nanocomposite for rigid riser application. Compos. Sci. Technol. 2016, 124, 27–35. [Google Scholar] [CrossRef]
  34. Zhai, G.; Ding, Y.; Wang, Y.; Ma, Z. Experimental investigation of the hydrostatic compression of a hollow glass microspheres/epoxy resin under high-pressure conditions at the full ocean depth. Polym. Compos. 2020, 41, 5331–5342. [Google Scholar] [CrossRef]
  35. Han, Z.; Huang, X.; Yang, Z. Effect of Al–Zn Alloy Coating on Corrosion Fatigue Behavior of X80 Riser Steel. Materials 2019, 12, 1520. [Google Scholar] [CrossRef] [PubMed]
  36. Kuo, C.H.; Zeng, Y.; Baker, D.; Huang, W.; Dunn, G.; Hoyt, D.; Ladeuille, L.; Evin, H. Sulfide Stress Cracking Response of X80 Simulated Heat Affected Zone for Offshore Pipeline and Riser Application. In Proceedings of the 2022 14th International Pipeline Conference, Calgary, AB, Canada, 26–30 September 2022; Volume 3: Operations, Monitoring, and Maintenance, Materials and Joining. The American Society of Mechanical Engineers (ASME): New York, NY, USA, 2022. [Google Scholar] [CrossRef]
  37. Chakrabarti, S.; Halkyard, J.; Capanoglu, C. Historical Development of Offshore Structures. In Handbook of Offshore Engineering; Chakrabarti, S.K., Ed.; Elsevier: London, UK, 2005; pp. 1–38. [Google Scholar]
  38. Kim, W. Composite Production Riser Assessment. Ph.D. Thesis, Texas A&M University, College Station, TX, USA, 2007. [Google Scholar]
  39. Bose, R.C.; Bush, K.A. Orthogonal Arrays of Strength two and three. Ann. Math. Stat. 1952, 23, 508–524. [Google Scholar] [CrossRef]
  40. Wang, C. Tailored Design of Composite Risers for Deep Water Applications. Ph.D. Thesis, UNSW Sydney, Sydney, Australia, 2013. [Google Scholar] [CrossRef]
  41. Ma, K.S.; Wang, C.G.; He, W.T.; Zheng, R.; Zhang, Z.Y.; Zhang, L. The coupling effect of current, wave and platform movement on the dynamic characteristics of marine risers with different elastic modulus and constraint number. Appl. Ocean Res. 2024, submitted.
  42. Feng, L.H.; Wang, J.J. Modification of a circular cylinder wake with synthetic jet: Vortex shedding modes and mechanism. Eur. J. Mech. B/Fluids 2014, 43, 14–32. [Google Scholar] [CrossRef]
  43. Chan, P.H.; Tshai, K.Y.; Johnson, M.; Li, S. Finite element analysis (FEA) modelling of fiber-reinforced polymer (FRP) repair in offshore risers. In Rehabilitation of Pipelines Using Fiber-reinforced Polymer (FRP) Composites; Woodhead Publishing: Cambridge, UK, 2015; pp. 177–210. [Google Scholar] [CrossRef]
  44. Kaw, A.K. Mechanics of Composite Materials, 2nd ed.; CRC Press: Boca Raton, FL, USA, 2005. [Google Scholar]
  45. Bao, Y.; Zhu, H.B.; Huan, P.; Wang, R.; Zhou, D.; Han, Z.L.; Palacios, R.; Graham, M.; Sherwin, S. Numerical Prediction of Vortex-Induced Vibration of Flexible Riser with Thick Strip Method. J. Fluids Struct. 2019, 89, 166–173. [Google Scholar] [CrossRef]
  46. Xu, W.; He, Z.; Zhai, L.; Wang, E. Vortex-Induced Vibration Prediction of an Inclined Flexible Cylinder Based on Machine Learning Methods. Ocean. Eng. 2023, 282, 114956. [Google Scholar] [CrossRef]
  47. Deng, D.; Zhao, W.; Wan, D. Vortex-Induced Vibration Prediction of a Flexible Cylinder by Three-Dimensional Strip Model. Ocean. Eng. 2020, 205, 107318. [Google Scholar] [CrossRef]
  48. Park, H.Y.; Kim, J.; Kuwahara, S. Cyclic behavior of shear-type hysteretic dampers with different cross-sectional shapes. J. Constr. Steel. Res. 2021, 187, 106964. [Google Scholar] [CrossRef]
  49. Madsen, K. Methods for Non-Linear Least Squares Problems, 2nd ed.; Technical University of Denmark: Kongens Lyngby, Denmark, 2004. [Google Scholar]
  50. Dai, T.; Li, Z. SLAM graph optimization based on optimized Levenberg-Marquardt method. Harbin Univ. Sci. Technol. J. 2021, 26, 68–74. [Google Scholar] [CrossRef]
  51. Lamich, M.; Balcells, J.; Corbalán, M.; Griful, E. Nonlinear Loads Model for Harmonics Flow Prediction, Using Multivariate Regression. IEEE Trans. Ind. Electron. 2017, 64, 4820–4827. [Google Scholar] [CrossRef]
  52. Wang, S.; Hu, X.; Lu, R.; Yan, S.; Li, Y.; Zhang, D. Research on Correlation Analysis and Multivariate Nonlinear Regression Modeling Method for the Tensile Properties of Mugwort Petiole. Sci. Rep. 2024, 14, 31597. [Google Scholar] [CrossRef] [PubMed]
  53. Sivaprasad, H.; Lekkala, M.R.; Latheef, M.; Seo, J.; Yoo, K.; Jin, C.; Kim, D.K. Fatigue Damage Prediction of Top Tensioned Riser Subjected to Vortex-Induced Vibrations Using Artificial Neural Networks. Ocean. Eng. 2023, 268, 113393. [Google Scholar] [CrossRef]
Figure 1. Design configuration of optimized FRP composite riser.
Jmse 13 01281 g001
Figure 2. Design configuration of orthogonal FRP composite riser.
Jmse 13 01281 g002
Figure 3. Two elastic modulus calculation models: (a) for tensile modulus calculation, (b) for flexural modulus calculation.
Jmse 13 01281 g003
Figure 4. Flow chart and finite element model of the simulation for the FRP composite riser: (a) for the coupled transient analysis, (b) for modal analysis, (c) for the composite riser and the fluid field.
Jmse 13 01281 g004
Figure 5. Benchmark test of PMMA riser.
Jmse 13 01281 g005
Figure 6. Comparison of wet natural frequencies for 18 study cases.
Jmse 13 01281 g006
Figure 7. The reduced velocities for the 18 study cases.
Jmse 13 01281 g007
Figure 8. Time history of deformation in the downstream direction: (a) for the riser with 12.5 m, (b) for the riser with 25 m, (c) for the riser with 37.5 m, (d) enlarged example of case 7 at 18.8 m.
Jmse 13 01281 g008
Figure 9. Maximum standardized downstream deformations for all 18 cases (0 m was the top end).
Jmse 13 01281 g009
Figure 10. Time history of deformation in the crossflow direction: (a) for the riser with 12.5 m, (b) for the riser with 25 m, (c) for the riser with 37.5 m.
Jmse 13 01281 g010aJmse 13 01281 g010b
Figure 11. Maximum standardized crossflow deformations for all 18 cases.
Jmse 13 01281 g011
Figure 12. Maximum total deformation and time duration for all 18 study cases.
Jmse 13 01281 g012
Figure 13. Stress distribution for all 18 study cases (0 m was the top end).
Jmse 13 01281 g013
Figure 14. Time history of maximum stresses for 18 study cases: (a) with riser length of 12.5 m, (b) with riser length of 25 m, (c) with riser length of 37.5 m.
Jmse 13 01281 g014
Figure 15. Safety factors in each layer for case 7.
Jmse 13 01281 g015
Figure 16. Safety factors in each layer for case 17.
Jmse 13 01281 g016
Figure 17. Accuracy of different functional relationships: (a) exponential function, (b) logarithmic function, (c) optimal polynomial function, and (d) R2 for the three functions.
Jmse 13 01281 g017aJmse 13 01281 g017b
Figure 18. The values of the error equation with the increasing number of iterations of the basic fitting model.
Jmse 13 01281 g018
Figure 19. The values of the error equation with the increasing number of iterations of the high-order interaction polynomial model.
Jmse 13 01281 g019
Figure 20. The comparison between the actual vibration amplitude and the predicted vibration amplitude.
Jmse 13 01281 g020
Table 1. Design parameters for optimized FRP composite riser, orthogonal FRP composite riser, and X80 riser.
TypeNumber of LayersInside Diameter (m)Outside Diameter (m)Unit Volume
(m3)
Unit Mass
(kg/m)
Optimized FRP composite riser180.250.3110.026945.7
Orthogonal FRP composite riser220.250.3290.035959.6
X80 riser 0.250.30.0216169
Table 2. Material properties for FRP composite riser and steel riser.
MaterialDensity
(kg/m3)
Modulus of Elasticity
(GPa)
Shear Modulus
(GPa)
Poisson’s RatioUltimate Strength
(MPa)
Yield Strength
(MPa)
Elongation at Break
(%)
AS41750.00E1 = 235.00G12 = G13 = 28.00υ12 = υ13 = 0.203590.00
E2 = E3 = 14.00G23 = 5.60υ23 = 0.25
AS4–epoxy composite1530.00E1 = 135.40
E2 = E3 = 9.37
G12 = G13 = 4.96
G23 = 3.20
υ12 = υ13 = 0.32
υ23 = 0.46
S1 = 1732,S2 = 49.4, S12 = 71.2
Epoxy1200.004.501.600.40130.00
Titanium alloy4430.00113.80 0.34950.00880.0014.00
Steel-X807850.00207.00 0.30625.00555.005.87
Table 3. The 18 study cases determined through the orthogonal test.
CaseDesign of ExperimentStudied Parameters
Riser TypeRiser Length
(m)
Flow Velocity (m/s)Tensile Modulus (GPa)Flexural Modulus (GPa)Slenderness RatioVelocity (m/s)Top Tension (N)
1Optimized FRP riser12.50.3640.535.7400.3611,200
2Orthogonal FRP riser37.51.2250.156.81141.2243,774
3X80 riser252.13207207832.1362,309
4Optimized FRP riser251.2240.535.7801.2222,400
5Orthogonal FRP riser12.52.1350.156.8382.1314,591
6X80 riser37.50.362072071250.3693,463
7Optimized FRP riser37.52.1340.535.71212.1333,600
8Orthogonal FRP riser250.3650.156.8760.3629,183
9X80 riser12.51.22207207421.2231,154
10Optimized FRP riser252.1340.535.7802.1322,400
11Orthogonal FRP riser12.50.3650.156.8380.3614,591
12X80 riser37.51.222072071251.2293,463
13Optimized FRP riser37.50.3640.535.71210.3633,600
14Orthogonal FRP riser251.2250.156.8761.2229,183
15X80 riser12.52.13207207422.1331,154
16Optimized FRP riser12.51.2240.535.7401.2211,200
17Orthogonal FRP riser37.52.1350.156.81142.1343,774
18X80 riser250.36207207830.3662,309
Table 4. Displacement and modulus of elasticity for 18 study cases.
CaseΔ1 (m)Δ2 (m)Etensile (GPa)Eflexural (GPa)CaseΔ1 (m)Δ2 (m)Etensile (GPa)Eflexural (GPa)
10.02770.941940.535.7100.02770.941940.535.7
20.01410.413650.156.8110.01410.413650.156.8
30.00670.2112207207120.00670.2112207207
40.02770.941940.535.7130.02770.941940.535.7
50.01410.413650.156.8140.01410.413650.156.8
60.00670.2112207207150.00670.2112207207
70.02770.941940.535.7160.02770.941940.535.7
80.01410.413650.156.8170.01410.413650.156.8
90.00670.2112207207180.00670.2112207207
Table 5. Relevant parameters for 18 study cases.
CaseFlow Density (kg/m3)v (m2/s)ReStI (%)
110241.06 × 10−6105,6230.203.768
2378,6600.213.213
3602,8300.223.031
4357,9430.213.235
561,1040.222.996
6101,8870.203.785
7624,9340.223.018
8111,7360.203.742
9345,2830.213.250
10624,9340.223.018
11111,7360.203.742
12345,2830.213.250
13105,6230.203.768
14378,6600.213.213
15602,8300.223.031
16357,9430.213.235
1761,1040.222.996
18101,8870.203.785
Table 6. The R2 of polynomial function with different exponential orders for each variable.
Exponential Order
−4−3−2−11234
R2 of tensile modulus (x1)0.00010.09750.11860.11430.04150.05560.11700.0713
R2 of flexural modulus (x2)0.00010.09750.13860.12590.04150.05560.11700.1343
R2 of slenderness ratio (x3)0.21830.22340.20120.27890.17710.15560.15470.3108
R2 of top tension force (x4)0.08360.10320.11420.10470.10330.10400.10470.1683
R2 of flow velocity (x5)0.07790.10470.10470.10470.09150.28930.10470.1047
Table 7. The coefficient values of iterations of the basic fitting model.
Coefficientb0b1b2b3b4b5
Fitted values−0.2251.3089−3.0910.6220.8260.686
Table 8. The coefficient values of the high-order interaction polynomial model.
Coefficientb0b1b2b3b4b5b6b7
Fitted values1.527−7.6623.9856.2023.34733.669−0.8938.559
Coefficientb8b9b10b11b12b13b14b15
Fitted values9.322−2.11010.37516.487−4.230−5.0694.382−1.655
Disclaimer/Publisher’s Note: The statements, opinions and data contained in all publications are solely those of the individual author(s) and contributor(s) and not of MDPI and/or the editor(s). MDPI and/or the editor(s) disclaim responsibility for any injury to people or property resulting from any ideas, methods, instructions or products referred to in the content.

