Article

A Meta-Frontier Approach to Evaluating the Environmental Efficiency of Coastal Ports: Implications for Port Sustainability

1
College of Transportation Engineering, Dalian Maritime University, Dalian 116026, China
2
Intelligent Transportation Systems Research Center, Wuhan University of Technology, Wuhan 430070, China
*
Author to whom correspondence should be addressed.
J. Mar. Sci. Eng. 2025, 13(7), 1272; https://doi.org/10.3390/jmse13071272
Submission received: 6 May 2025 / Revised: 26 June 2025 / Accepted: 27 June 2025 / Published: 30 June 2025
(This article belongs to the Special Issue Maritime Transport and Port Management)

Abstract

As pivotal nodes in maritime logistics networks, ports face mounting pressure to reconcile economic growth with environmental sustainability. Although the SBM-Undesirable model has been extensively applied to assess port environmental efficiency (PEE), most applications assume strong disposability and disregard heterogeneity in technological capacities across different port scales, potentially biasing the assessments. To overcome these limitations, coastal ports are initially categorized into three subgroups based on operational scale criteria. A meta-frontier SBM-Undesirable model incorporating weak disposability is then developed to evaluate PEE. Dynamic characteristics are further explored via the Global Malmquist Index. Results indicate substantial disparities between subgroup frontiers and the meta-frontier. The average group PEE (0.732) exceeded the meta PEE (0.570), implying potential overestimation under homogeneity assumptions. Large-sized ports, with a mean technology gap ratio (TGR) of 0.956, operated near the meta-frontier, whereas medium-sized and small-sized ports, with TGRs of 0.770 and 0.600 respectively, exhibited substantial technological gaps. Total factor productivity (TFP) demonstrated a volatile upward trend, averaging 6.8% annual growth. In large-sized and medium-sized ports, TFP growth was primarily driven by technological innovation, whereas in small-sized ports, it stemmed from combined improvements in technical efficiency and technological level. These insights underscore the necessity of differentiated decarbonization strategies for port management.

1. Introduction

Growing concerns over climate change and the accelerating transition to sustainable development have heightened focus on the environmental ramifications of shipping activities. Maritime transport constitutes approximately 3% of total anthropogenic CO2 emissions, and remains a persistent contributor to climate change [1,2]. Consequently, the maritime sector has been increasingly pressured to reconcile operational efficacy with environmental stewardship. While vessel operations remain the principal emitter, ports are also recognized as significant emission hubs [3]. Improving port environmental efficiency (PEE) has thus emerged as a critical strategy for reconciling logistics growth with climate commitments. A scientific evaluation of PEE is essential to guide the design of green port policies and operational practices that support more sustainable and efficient maritime operations.
A variety of methodologies have been employed to assess port efficiency, mainly including stochastic frontier analysis (SFA) and data envelopment analysis (DEA). DEA has gained prominence due to its non-parametric nature and suitability for multi-input, multi-output systems [4]. Early DEA applications for evaluating port efficiency frequently omitted by-products in the production process, such as CO2 emissions, concentrating exclusively on economic or operational performance metrics [5,6]. Later studies have incorporated undesirable outputs into evaluation frameworks using models such as the directional distance function (DDF) [7], network DEA [8], slack-based measure DEA (SBM-DEA) [9], and range-adjusted measure DEA (RAM-DEA) [10], among others. These approaches improve the analytical rigor of PEE assessment by explicitly incorporating undesirable outputs.
Despite these methodological improvements, two major limitations persist. First, most models rely on the strong disposability assumption, which treats undesirable outputs independently from desirable outputs. This implies that their reduction is assumed to occur without incurring any expenses and without affecting the production of desirable outputs [11]. Second, most pertinent studies typically use homogeneous harmonized technological frontiers that ignore disparities between large, automated ports and small, labor-intensive ports. As a result, the substantial heterogeneity in production technologies, infrastructure, operational scales, and environmental constraints across different ports is overlooked. These omissions may result in biased efficiency scores and misleading policy recommendations [12,13].
How can PEE be accurately assessed by integrating environmental constraints and technological heterogeneity? To address this question, this study advances a meta-frontier SBM-Undesirable model grounded in a weak disposability assumption. This assumption reflects the inherent tradeoffs in production, where diminishing undesired outputs (e.g., CO2 emissions) may come at the cost of restricting desirable output increases. Ports are classified into three subgroups, large-sized, medium-sized, and small-sized, based on relative operational scale to account for technological heterogeneity. Subsequently, the model captures technical heterogeneity by constructing subgroup frontiers and estimating the technology gaps between the subgroup frontiers and meta-frontier. Furthermore, the Global Malmquist Index is employed to investigate the dynamic characteristics and driving forces underlying the determinants of PEE within China’s coastal ports over the period spanning 2014 to 2023. This provides a robust intertemporal comparison under a consistent technological benchmark. Accordingly, the study is particularly concerned with the following research questions: How has PEE evolved under different technological frontiers? How does the gap between subgroups and potential optimal production technologies shift? And what are the dominant factors driving total factor productivity (TFP) change in China’s coastal ports?
This study offers marginal contributions in three dimensions:
(1)
An SBM-Undesirable model incorporating weak disposability is employed to better reflect the joint production relationships between desirable and undesirable outputs, enabling a more accurate assessment of PEE.
(2)
Production technology heterogeneity is systematically addressed by constructing subgroup frontiers and a meta-frontier and then measuring technology gaps relative to the potential optimal frontier.
(3)
The total factor productivity of PEE is further decomposed into technical efficiency change and technical change, offering deeper insights into the underlying drivers of efficiency dynamics.
The structure of the paper is as follows. Section 2 reviews the relevant literature. Section 3 presents the methodology and data descriptions. Section 4 presents the empirical results. Section 5 expounds the discussion. Section 6 concludes and outlines policy implications.

2. Literature Review

2.1. DEA Application in Port Efficiency Evaluation

Port efficiency is commonly defined as the capability of a port to maximize output given a set of inputs, or to achieve predetermined outputs with the minimum inputs [14,15]. Empirical studies on port efficiency measurement are broadly categorized into parametric and non-parametric approaches. Stochastic frontier analysis (SFA), the dominant parametric approach, has garnered considerable attention. For instance, Quintano et al. [16] and Durán et al. [17] applied SFA to evaluate the operational efficiency of ports in Europe, Mexico, and Chile, respectively. Nonetheless, SFA necessitates the pre-determination of the form and associated parameters of the frontier function.
By contrast, data envelopment analysis (DEA), as a non-parametric method, does not require the pre-specification of parameters, offering greater adaptability. Consequently, DEA has increasingly become the predominant methodology for port efficiency assessment [18]. The initial application of DEA in the port sector was proposed by Roll and Hayuth [19], who utilized hypothetical numerical data to demonstrate the method’s potential in evaluating port efficiency. Subsequently, Martínez-Budría et al. [20] conducted an empirical study using the BCC model to evaluate the efficiency of 26 Spanish ports. Thereafter, the application of DEA in port efficiency research became increasingly widespread.
In quantitative studies employing DEA for port efficiency analysis, Nguyen et al. [21] employed a bootstrapped DEA approach to estimate the technical efficiency of 43 major ports in Vietnam. et al. [22] utilized an SBM–DEA model to assess 58 European ports, revealing that technical efficiency was significantly influenced by the implementation of Emission Control Areas (ECAs). Huang et al. [23] conducted a benchmarking study on ports along the 21st Century Maritime Silk Road. Hus et al. [24] evaluated the operational efficiency of container terminals within ports using a standard DEA framework. Similarly, Agüero-Tobar et al. [25] assessed the operational performance of Chilean ports. Although these studies have contributed valuable insights into the operational performance of ports, most remain confined to economic or operational dimensions. Environmental pollutants, particularly CO2 emissions, have been largely overlooked. In the context of growing environmental pressure, such omissions have become increasingly inappropriate.

2.2. Weak Disposability Assumption in DEA Applications

In recent years, many scholars have extended the concept of economic efficiency to the evaluation of port environmental performance. Notably, Chin and Low [26] pioneered the integration of environmental externalities into port performance frameworks. Their study, focusing on major Asian ports, underscored the critical role of environmental factors in comprehensive performance appraisals. Subsequently, Li et al. [27] and Wang et al. [28] examined Chinese ports using carbon dioxide and particulate matter (PM) emissions as proxies for environmental impact. More recently, Jiang et al. [29] employed a network cross-efficiency DEA model to assess the environmental efficiency and dynamic evolution of hinterland transport systems linked to regional seaports, highlighting the superior performance of road–rail intermodal transport. Furthermore, Kong et al. [30] developed a multidimensional evaluation framework that integrates economic, environmental, and social dimensions to benchmark port supply chain efficiency.
Incorporating environmental pollutants as “undesirable outputs” is critical for a comprehensive evaluation of PEE. Most previous studies have been predicated on the strong disposability assumption regarding undesirable outputs, which demonstrates that pollutants can be freely eliminated without compromising desirable outputs [11]. Yet such an assumption is unrealistic in practice. Growing recognition has been directed toward the adoption of a weak disposability assumption. This assumption posits that pollution abatement necessitates minimizing desired outputs or expanding inputs, thus better reflecting the environmental constraints inherent in practical emission control.
Recognizing the limitations of strong disposability, scholars have incorporated weak disposability into environmental efficiency assessments. In practical applications, Chang et al. [31] modified the constraint of the SBM model such that undesirable outputs increased proportionally with improvements in output slack, thus aligning with the weak disposability assumption. They applied this adjusted model to assess global airlines’ economic efficiency. Subsequently, Jo and Chang [11] and Taleb et al. [32] benchmarked the port environmental efficiency by utilizing the SBM–DEA model with weak disposability. However, the above studies are generally predicated on the assumption of port homogeneity, failing to adequately account for the technical heterogeneity stemming from variations in natural endowments, operational scales, and geographical locations among ports. Hence, it becomes imperative to consider port technological heterogeneity in PEE evaluation.

2.3. Technological Heterogeneity: Meta-Frontier Approaches

This growing amount of research has also drawn attention to the substantial heterogeneity in port technologies and operating conditions. Assuming a homogeneous production frontier across all ports may neglect these disparities, thereby leading to biased efficiency assessments. In recent years, growing recognition has been given to the significance of accounting for technological heterogeneity within port efficiency evaluations. Meta-frontier analysis has been proposed as an effective solution, by estimating group-specific frontiers alongside a common meta-frontier that envelops them [33]. This framework enables the efficiency comparison of DMUs operating under different technologies while quantifying the “technology gap” among groups.
Extensive empirical evidence has confirmed the advantages of meta-frontier approaches in assessing port efficiency and identifying technological disparities across groups [34,35]. For instance, Tovar and Wall [12] adopted a meta-frontier DEA model to benchmark Spanish ports, revealing that large and complex ports consistently exhibited distinct technological superiorities. Similarly, Fernández et al. [36] examined the link between container specialization and port efficiency, finding that highly specialized ports achieved superior performance, while ports with moderate specialization exhibited considerable potential for improvement. Additional insights were provided by Laxe et al. [37], who identified notable differences in efficiency and profitability across ports with varying scales, specialization levels, and geographic attributes.
Ghiara and Tei [38] further emphasized that the impact of external environmental heterogeneity (e.g., scale and location) on port efficiency surpassed that of automation technology. In addition, Martínez-Moya et al. [35] incorporated a berthing time variable and compared efficiency levels between transshipment and gateway/mixed ports, showing that transshipment ports consistently demonstrated higher efficiency and stronger technological advantages. At a global level, Zhang et al. [39] implemented a meta-frontier DEA approach to assess the efficiency of the world’s top 80 container ports from both operator and carrier viewpoints. Nevertheless, the aforementioned studies focus on static PEE analysis and do not consider the dynamic evolution of PEE and its drivers, failing to provide more comprehensive insights.
Taken together, the above literature reveals three dominant themes in PEE research: the application of DEA methodologies, the incorporation of weak disposability assumptions to handle undesirable outputs, and the implementation of meta-frontier approaches to capture technological heterogeneity. Although considerable progress has been made, the joint consideration of environmental constraints and technological heterogeneity in PEE assessment remains limited, as summarized in Table 1. In light of these observations, this study adopts a meta-frontier SBM-Undesirable model with weak disposability to assess the PEE of China’s coastal ports from 2014 to 2023. It also employs the Global Malmquist Index to analyze the drivers of TFP shift. By integrating static and dynamic perspectives under a more realistic production technology framework, this study aims to provide a more nuanced and policy-relevant assessment of port environmental performance.

3. Methodology and Data Descriptions

3.1. Research Framework Overview

This study proposes an integrated analytical framework combining meta-frontier and global benchmarking methods to systematically evaluate the PEE of China’s coastal ports. The framework is illustrated in Figure 1. First, a meta-frontier SBM-Undesirable model with weak disposability is established. By categorizing ports by operational scale, the model constructs group frontiers and a meta-frontier to account for technological heterogeneity. The technological disparity between group-specific frontiers and the meta-frontier is then explored. Second, the Global Malmquist Index is applied to capture dynamic changes in environmental performance over time. This index is further decomposed into efficiency change and technological change, revealing the underlying drivers of TFP dynamics. This integrative analytical framework enables a comprehensive assessment of PEE from both static and dynamic perspectives, providing policy-relevant insights into sustainable port development.

3.2. A Meta-Frontier SBM-Undesirable Model Imposing Weak Disposability

The prototype SBM-Undesirable model, proposed by Tone, has been extensively applied in port efficiency studies. Nevertheless, this model typically rests on the strong disposability assumption of undesirable outputs, implying that such outputs (e.g., CO2 emissions) can be freely reduced without any trade-off. This assumption is often unrealistic in practice, as reducing undesirable outputs usually entails opportunity costs or compromises in desirable outputs. To overcome this limitation, Chang et al. [31] proposed a modified SBM-Undesirable model that incorporates a weak disposability assumption. This adjustment explicitly acknowledges the link between desirable and undesirable outputs, recognizing that emission reductions may come at the expense of economic output, and enables more accurate assessments of environmental efficiency.
Despite this advancement, Chang’s model assumes technological homogeneity, disregarding the underlying heterogeneity in production technologies among individuals. This simplification overlooks substantial variations in port characteristics, such as operational scale, resource endowment, and geographical location, factors that shape production technology and technical efficiency. Applying a unified technology frontier to evaluate all ports can therefore produce biased or misleading efficiency scores.
To address this issue, meta-frontier theory (cf. Bartels et al. [40] and O’Donnell et al. [41]) can be incorporated into the efficiency analysis. Under this approach, ports are first classified into several subgroups based on shared production characteristics (e.g., operating scale), and group-specific frontiers are constructed to reflect internal technical efficiency. A meta-frontier is then derived to envelop all group frontiers, providing a common benchmark for comparing efficiencies across heterogeneous subgroups. This method facilitates the computation of efficiency gaps between group-specific and common production frontiers and thus reveals disparities in technological levels.
Hence, this study integrates both advances into a meta-frontier SBM-Undesirable model imposing weak disposability, which simultaneously resolves strong disposability of environmental constraints and technological heterogeneity in PEE assessment. Thereby, this modified model is applied to compute the environmental efficiency of Chinese coastal ports.
Consider a port system consisting of n decision-making units (DMUs), each characterized by m input variables, s desirable outputs, and q undesirable outputs. Let x R m , y R s , and b R q denote the vectors of inputs, desirable outputs, and undesirable outputs, respectively, and the corresponding matrices are: X = [ x 1 , , x n ] R m × n , Y g = [ y g 1 , , y g n ] R s × n , and Y b = [ y b 1 , , y b n ] R q × n , where X > 0 , Y g > 0 , and Y b > 0 . Assuming there are H subgroups ( h Ω = 1 , 2 , 3 , , H ) in n DMUs, each group h includes n k DMUs.
Consequently, the production possibility set (PPS), assuming Variable Returns to Scale (VRS), can be represented as Equation (1):
P h = ( x , y g , y b ) x j = 1 n λ j x j y g j = 1 n λ j y j g y b j = 1 n λ j y j b j = 1 n λ j = 1 λ j 0
where λ depicts weight variable.
The PPS under the meta-frontier P m e t a can be regarded as the convex combination of all PPSs under the group frontier and satisfied P m e t a = P 1 P 2 P H . The P m e t a represents the global optimal technology across all groups and is defined as
P m e t a = ( x , y g , y b ) x h = 1 H j = 1 n k λ j h x j , y g h = 1 H j = 1 n k λ j h y j g , y b h = 1 H j = 1 n k λ j h y j b , h = 1 H j = 1 n k λ j h = 1 , λ j h 0
The group frontier SBM-Undesirable model, imposing weak disposability, can be expressed as follows:
m i n   ρ = 1 1 m i = 1 m s i x i 0 1 + 1 s + q r = 1 s s r g + y r 0 g + p = 1 q s p b y p 0 b s . t .                       j = 1 n k X j λ j + s = x 0                                     j = 1 n k Y j g λ j s g + = y 0 g                                     j = 1 n k Y j b λ j + s b = ( 1 + 1 s r = 1 s s r g + y r 0 g ) y 0 b                                     j = 1 n k λ j = 1                                     s 0 , s g + 0 , s b 0 , λ j 0 , j = 1 , 2 , , n k
where ρ is the efficiency value and λ depicts the weight variable. s , s g + , s b , respectively, signify the slack of inputs, desirable outputs, and undesirable outputs. Since Model (1) is nonlinear, the Charnes-Cooper transformation [42] is utilized to convert it into a linear model; that is, by letting 1 1 + 1 s + q r = 1 s s r g + y r 0 g + p = 1 q s p b y p 0 b = t . Next, multiply t by each constraint in the aforementioned model. This leads to the following equations: S i = t s i , S r g + = t s r g + , S p b = t s p b , and Λ j = t λ j . These equations define new variables S i , S r g + , S p b , and Λ j .
Consequently, Model (3) can be converted into the following linear programming model:
m i n   ρ ˜ = t 1 m i = 1 m S i x i 0 s . t .         t + 1 s + q r = 1 s S r g + y r 0 g + p = 1 q S p b y p 0 b   = 1                     j = 1 n k X j Λ j + S = t x 0                     j = 1 n k Y j g Λ j S g + = t y 0 g                     j = 1 n k Y j b Λ j + S b = ( t + 1 s r = 1 s S r g + y r 0 g ) y 0 b                     j = 1 n k Λ j = t                     S 0 , S g + 0 , S b 0 , t 0 , Λ j 0 , j = 1 , 2 , , n k
Let the optimal solution of Model (2) be ( ρ ˜ , t , Λ , S * , S g + * , S b * ); then, the optimal solution of Model (1) is
ρ = ρ ˜ , λ * = Λ t , s * = S * t , s g + * = S g + * t , s b * = S b * t .
The meta-frontier SBM-Undesirable model with weak disposability can be derived. This model is applicable to all DMUs without group restrictions, as shown below:
m i n   ρ m e t a = 1 1 m i = 1 m s i x i 0 1 + 1 s + q r = 1 s s r g + y r 0 g + p = 1 q s p b y p 0 b s . t .                 h = 1 H j = 1 n k X j λ j h + s = x 0                               h = 1 H j = 1 n k Y j g λ j h s g + = y 0 g                               h = 1 H j = 1 n k Y j b λ j h + s b = ( 1 + 1 s r = 1 s s r g + y r 0 g ) y 0 b                               h = 1 H j = 1 n k λ j h = 1                               s 0 , s g + 0 , s b 0 , λ j h 0 , j = 1 , 2 , , n k , h = 1 , 2 , , H
Similarly, the linear formulation for Model (5) is as follows:
m i n   ρ ˜ m e t a = t 1 m i = 1 m S i x i 0 s . t .             t + 1 s + q r = 1 s S r g + y r 0 g + p = 1 q S p b y p 0 b   = 1                         h = 1 H j = 1 n k X j Λ j h + S = t x 0                         h = 1 H j = 1 n k Y j g Λ j h S g + = t y 0 g                         h = 1 H j = 1 n k Y j b Λ j h + S b = ( t + 1 s r = 1 s S r g + y r 0 g ) y 0 b                         h = 1 H j = 1 n k Λ j h = t                         S 0 , S g + 0 , S b 0 , t 0 , Λ j h 0 , j = 1 , 2 , , n k     , h = 1 , 2 , , H
The optimal solution of Model (6) is calculated as in Model (4).
The technology gap ratio (TGR) quantifies the technological disparity between a subgroup and the aggregate benchmark. It is calculated as the ratio of a unit’s efficiency under the common frontier to that under the subgroup frontier and is given by
T G R = M E E i G E E i
where M E E i and G E E i represent the environmental efficiency of i DMU under the meta-frontier and group frontier, respectively. According to production theory, the inequality, since the inequality M E E G E E always holds, of the TGR falls within the interval (0,1]. A higher TGR indicates a narrower gap, implying that the subgroup’s potential technology level is closer to the optimal level. Thus, the TGR reflects the extent to which a subgroup approaches the best available technology.

3.3. The Global Malmquist Index

The SBM-Undesirable model can only statically evaluate each DMU’s efficiency performance, yet it is incapable of describing the dynamic characteristic of efficiency growth. The Malmquist Index method is the most prevalently adopted approach for analyzing efficiency change and TFP growth. However, the traditional Malmquist Index only captures productivity changes between adjacent periods and often encounters infeasibility under VRS, limiting its use for intertemporal persistence analysis [43]. To overcome these limitations, the Global Malmquist Index (GM index) [44], which encompasses undesirable outputs, is applied to compute the TFP. Assuming the study period is T , the production possibility set (PPS) in period t is expressed as follows:
P t = x t , y t , b t : x t   c a n   p r o d u c e   ( y t , b t )
The union of PPSs over all time periods constitutes the global PPS, which is expressed as P G = P 1 P 2 P T .
The GM Index via the formula outlined below is
G M t , t + 1 ( x t + 1 , y t + 1 , b t + 1 , x t , y t , b t ) = D G ( x t + 1 , y t + 1 , b t + 1 ) D G ( x t , y t , b t )
where D G ( x , y , b ) indicates the global hybrid distance functions and D t ( x , y , b ) , D t + 1 ( x , y , b ) stands for the distance functions in two periods. G M > 1 means TFP gain over time, whereas G M < 1 denotes a degradation. The GM Index further decomposes as follows:
G M t , t + 1 ( x t + 1 , y t + 1 , b t + 1 , x t , y t , b t ) = D G ( x t + 1 , y t + 1 , b t + 1 ) D G ( x t , y t , b t ) = D t ( x t + 1 , y t + 1 , b t + 1 ) D t ( x t , y t , b t ) × D G ( x t + 1 , y t + 1 , b t + 1 ) / D t + 1 ( x t + 1 , y t + 1 , b t + 1 ) D G ( x t , y t , b t ) / D t ( x t , y t , b t ) = G M E C t , t + 1 × G M T C t , t + 1
where G M E C t , t + 1 and G M T C t , t + 1 , respectively, represent change for technical efficiency and technological progress. When G M E C > 1 , it signifies the technical efficiency has risen, and vice versa; when G M T C < 1 , it implies technological innovation, and vice versa.

3.4. Data Collection and Descriptions

This study selects the data from 2014 to 2023 and takes 22 major ports along China’s coastal ports as the research objects. Drawing upon prior research [23,27,45], a set of input and output indicators was determined, as outlined in Table 2. The data were obtained from authoritative sources including the National Bureau of Statistics, the China Statistical Yearbook (2015–2024), and the China Port Yearbook (2015–2023).
Because direct data on port carbon emissions are not available in official statistics, we estimated CO2 emissions indirectly following Cui et al. [45]. The port’s CO2 emissions (C) are computed using the formula
C = S C × H C × α
where SC is the coal-equivalent energy consumption per unit of port throughput, measured in tons of standard coal per 10,000 tons of throughput. It represents an aggregated value of total port energy consumption and is compiled from China’s Statistical Bulletin on Transport Development (Ministry of Transport). In years where SC data were not reported, values were supplemented through a regression interpolation, as illustrated in Table 3. HC is the port’s annual cargo throughput (in 10,000 tons), and S C × H C expresses port energy consumption (in 10,000 tons of standard coal equivalent). The carbon emission coefficient α , set at 2.4589, is based on the theoretical CO2 emissions resulting from the complete combustion of standard coal. Specifically, each ton of standard coal contains approximately 0.67 tons of carbon, and the full oxidation of one ton of carbon yields about 3.67 tons of CO2. Thus, one ton of standard coal is estimated to produce 0.67 × 3.67 = 2.4589 tons of CO2.
Given the variations in specialization, complexity, and scale, ports often exhibit heterogeneous production technologies. To effectively capture the heterogeneity in production characteristics across ports and ensure appropriate group classification for subsequent meta-frontier analysis, this study adopts a port classification method based on relative output importance, following the approach proposed by Tovar and Wall [12,46]. As it explicitly accounts for port-level differences in scale and specialization, this method provides a practical framework for grouping ports with similar production characteristics [27].
In line with this methodology, the “average output importance index” of each port is calculated for two key output dimensions: container throughput and cargo throughput. This index captures each port’s average proportional contribution to the overall system output over the study period. For each port i and output type j , the index is computed as follows:
I i j = T i j i = 1 n T i j
where T i j denotes the average output of type j (i.e., container or cargo throughput) for port i , and i = 1 n T i j is the total average output of type j across all n ports. Based on the above approach, the average output importance index of each port over the entire study period for both container and cargo throughput was computed. A port is classified into large-sized ports if its average output importance index exceeds the overall average in both output categories, into medium-sized ports if it exceeds the average in only one category, and into small-sized ports otherwise. The classification results are detailed in Table 4. By applying this classification approach, the influence of technological heterogeneity across ports is effectively mitigated, thereby ensuring greater comparability in the subsequent group-frontier efficiency analysis.
Table 5 presents the descriptive statistics of the indicators.

4. Empirical Results

By estimating the model outlined in Section 3.2 and Section 3.3 using Gurobi as the solver in Python 3.11, the meta-PEE, group-PEE, and TFP, along with the decomposition items for 22 China’s coastal ports from 2014 to 2023, were obtained. The empirical results were obtained on a PC running Windows 11 with a 13th Gen Intel (R) Core (TM) i5-13500H processor at 2.60 GHz and 16 GB of RAM.

4.1. Overall Analysis of Port Environmental Efficiency

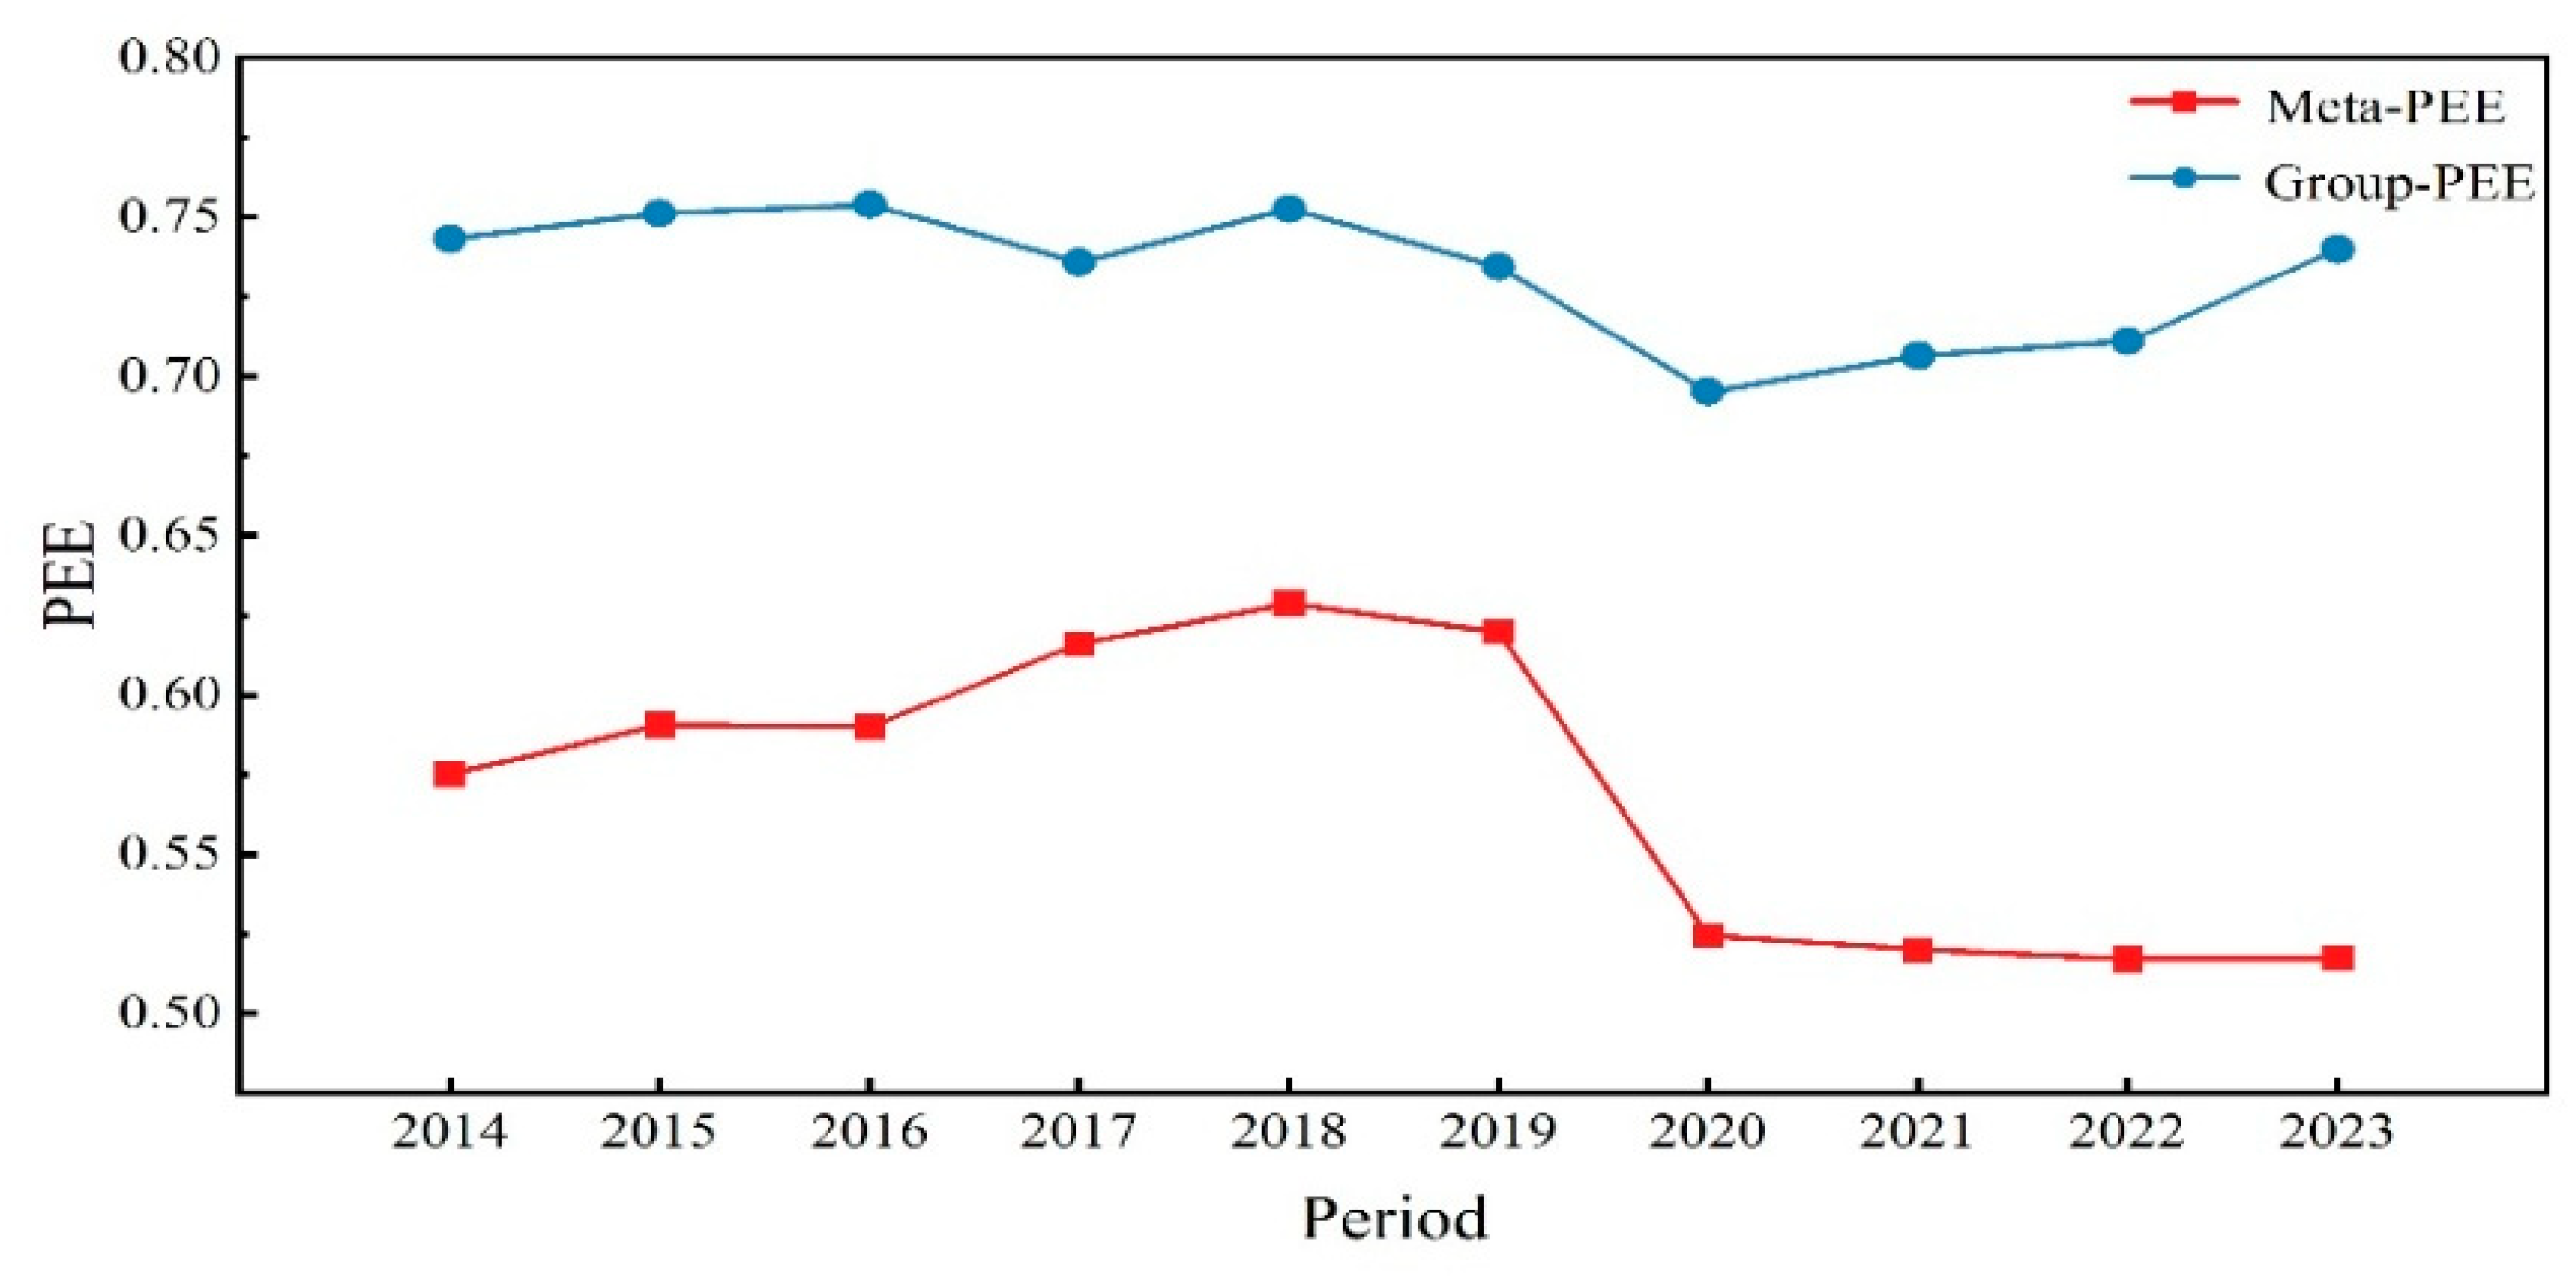
The meta-PEE and group-PEE trends are illustrated in Figure 2. From the meta-frontier perspective, the meta-PEE experienced a fluctuating downward trend over the period 2014–2023, with an average annual decline of approximately 1.173%. Between 2014 and 2018, the mean meta-PEE increased somewhat, from 0.575 to 0.629, representing a 9.391% improvement overall. This growth may primarily be attributed to concerted efforts promoting smart ports, enhancing port integration, and prioritizing sustainable development [47,48]. However, this positive momentum did not persist. From 2018 to 2022, a substantial decline in efficiency was detected. The average meta-PEE fell sharply to 0.517, representing a reduction of 17.806%. This deterioration was largely induced by the COVID-19 pandemic, which caused a significant drop in cargo throughput and disrupted normal port operations [49].
With respect to the group frontier, a similar “rise-then-fall” pattern was observed in group-PEE, with its overall trajectory broadly consistent with that of the meta-PEE. Notably, the mean group-PEE (0.732) was significantly higher than that of meta-PEE (0.570), which is in line with Li et al. [27]. This divergence underscores the importance of accounting for technological heterogeneity across ports. When such heterogeneity is considered, PEE estimates become more representative of actual performance.
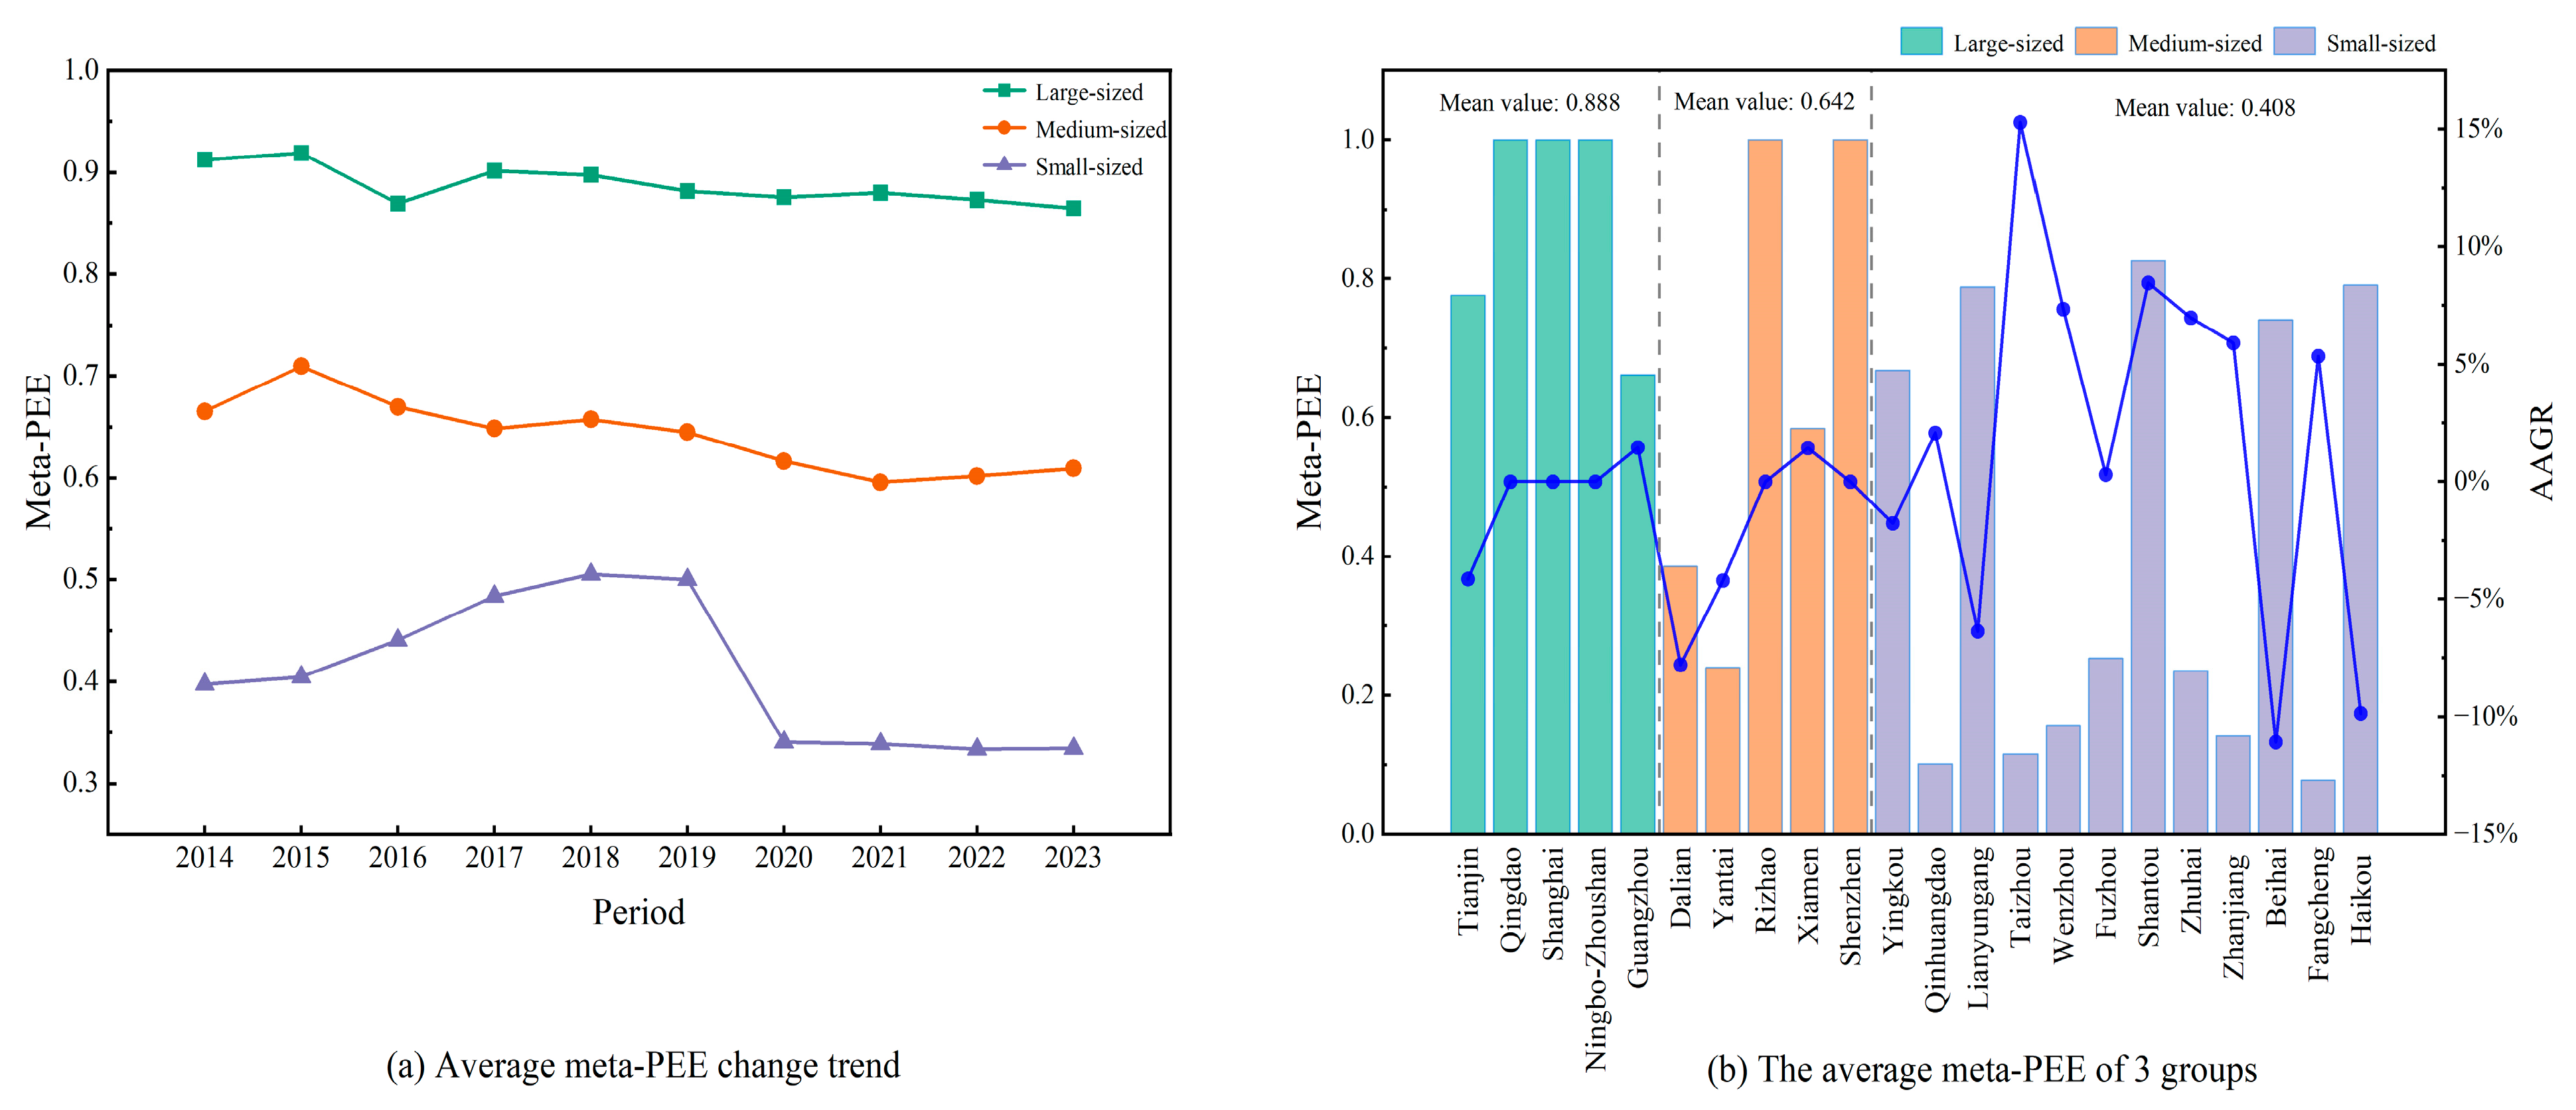
As depicted by Figure 3a, substantial disparities in meta-PEE were observed among ports of different sizes during 2014–2023. The average meta-PEEs for large-sized, medium-sized, and small-sized ports were 0.888, 0.642, and 0.408, respectively, while the national average stood at 0.570. The findings highlight pronounced variations in environmental performance across port size categories, suggesting that larger ports possess a distinct advantage in terms of carbon mitigation performance. This discrepancy may be attributed to several factors. Large-sized ports often enjoy better access to capital, advanced technologies, and policy support, enabling more efficient implementation of green practices. They are also vulnerable to greater regulatory pressure, which can hasten environmental improvements. In contrast, small-sized and medium-sized ports may encounter financial and technical constraints, limiting their ability to invest in low-carbon infrastructure and decarbonization technologies.
The meta-PEE values for individual ports are presented in Figure 3b. Among the 22 coastal ports evaluated, only 5 ports were positioned on the meta-frontier, representing approximately 23% of the sample. Specifically, the ports of Shanghai, Ningbo-Zhoushan, and Qingdao were classified as large-sized ports, while Shenzhen Port and Rizhao Port were medium-sized. These ports demonstrated a strong capacity to enhance operational performance while effectively mitigating carbon emissions. Notably, several small-sized ports also exhibited notable environmental performance. Ports such as Yingkou, Lianyungang, Shantou, Beihai, and Haikou performed relatively well in decarbonization, suggesting that, despite limited scale and constrained resources, effective emission control can still be achieved. In contrast, poor performance was observed in certain middle-sized ports, particularly the ports of Yantai, Xiamen, and Dalian. Although these ports possess considerable operational capacity, their PEE was hindered by suboptimal resource allocation and possibly inefficient management pattens.
Notably, nearly half of the small-sized ports recorded an average annual growth rate (AAGR) in meta-PEE exceeding 5%, manifesting considerable potential for further decarbonization. In contrast, medium-sized ports have generally suffered increasing pressure from diminishing meta-PEE, with some exhibiting a persistent trend of deterioration.
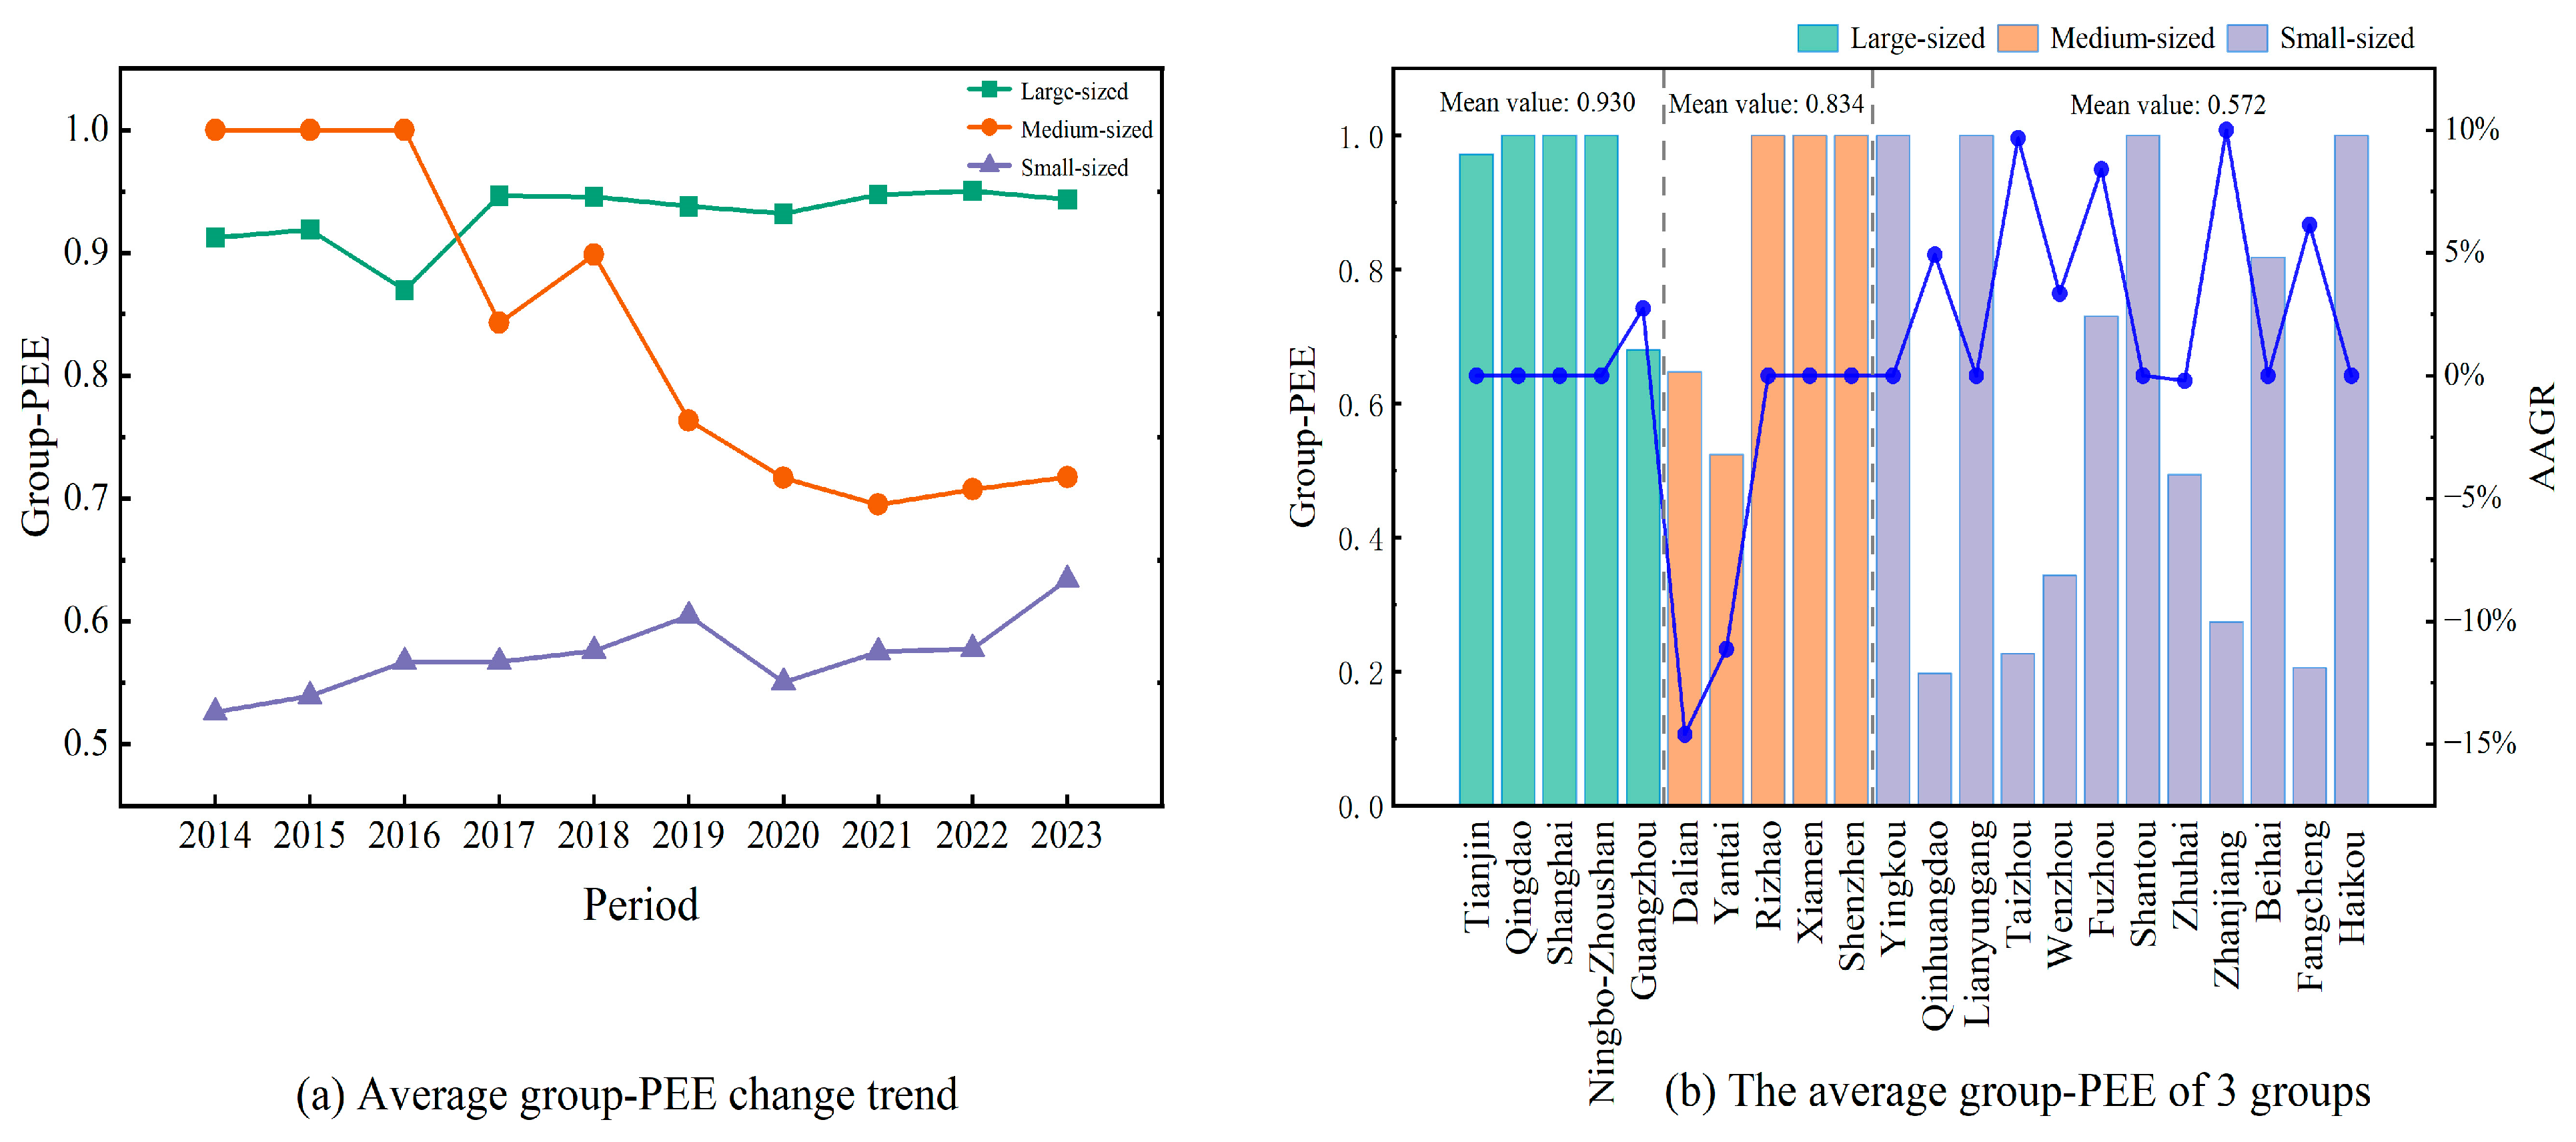
From the group frontier perspective, the average group-PEE during 2014–2023 was 0.930 for large-sized ports, 0.834 for medium-sized ports, and 0.572 for small-sized ports, with a national average of 0.732. Compared with the corresponding meta-PEE values, all three subgroups experienced varying degrees of improvement, approximately 4.730%, 29.907%, and 40.196%, separately. These results suggest that when technological heterogeneity across port groups is disregarded, PEE tends to be underestimated. The significance of incorporating group-specific technical heterogeneity into the evaluation of port carbon mitigation performance is thus underscored. In terms of temporal trends (see Figure 4a), the group-PEE for large-sized ports remained relatively stable, with only a slight decline observed in 2016. Medium-sized ports initially performed well, even surpassing large-sized ports temporarily. However, a sharp decline was observed from 2016 onwards, eventually stabilizing around 0.7 in later years, showcasing a volatile downward trajectory. In contrast, small-sized ports exhibited a steady upward trend in group-PEE, suggesting continuous progress in decarbonization efforts over time.
As illustrated in Figure 4b, ten ports were identified as DEA-efficient under their respective group frontiers, representing approximately 45% of the total sample. Besides the aforementioned five ports that reached the meta-frontier, the remaining five ports include Xiamen (a medium-sized port), along with Yingkou, Lianyungang, Shantou, and Haikou (all categorized as small-sized ports). While these latter five ports possess relatively high PEE within their respective subgroups, considerable improvement potential remains when benchmarked under the meta-frontier. Further advancements may be achieved by benchmarking against top-performing peers, such as Shanghai and Ningbo-Zhoushan. Furthermore, Tianjin Port also demonstrated strong decarbonization performance, with group-PEE exceeding 0.9.
Further analysis based on the AAGR reveals that all large-sized ports witnessed consistent growth in group-PEE throughout the investigated period. Conversely, medium-sized ports such as Dalian Port and Yantai Port suffered marked deterioration in group-PEE, highlighting the critical need to adopt best practices from more efficient peers within the same subgroup. Regarding small-sized ports, except for Zhuhai Port, all other ports registered positive annual growth in group-PEE. Particularly, the ports of Zhanjiang, Taizhou, Fuzhou, and Fangcheng achieved AAGRs exceeding 5%, demonstrating rapid improvements and promising potential for sustained decarbonization.
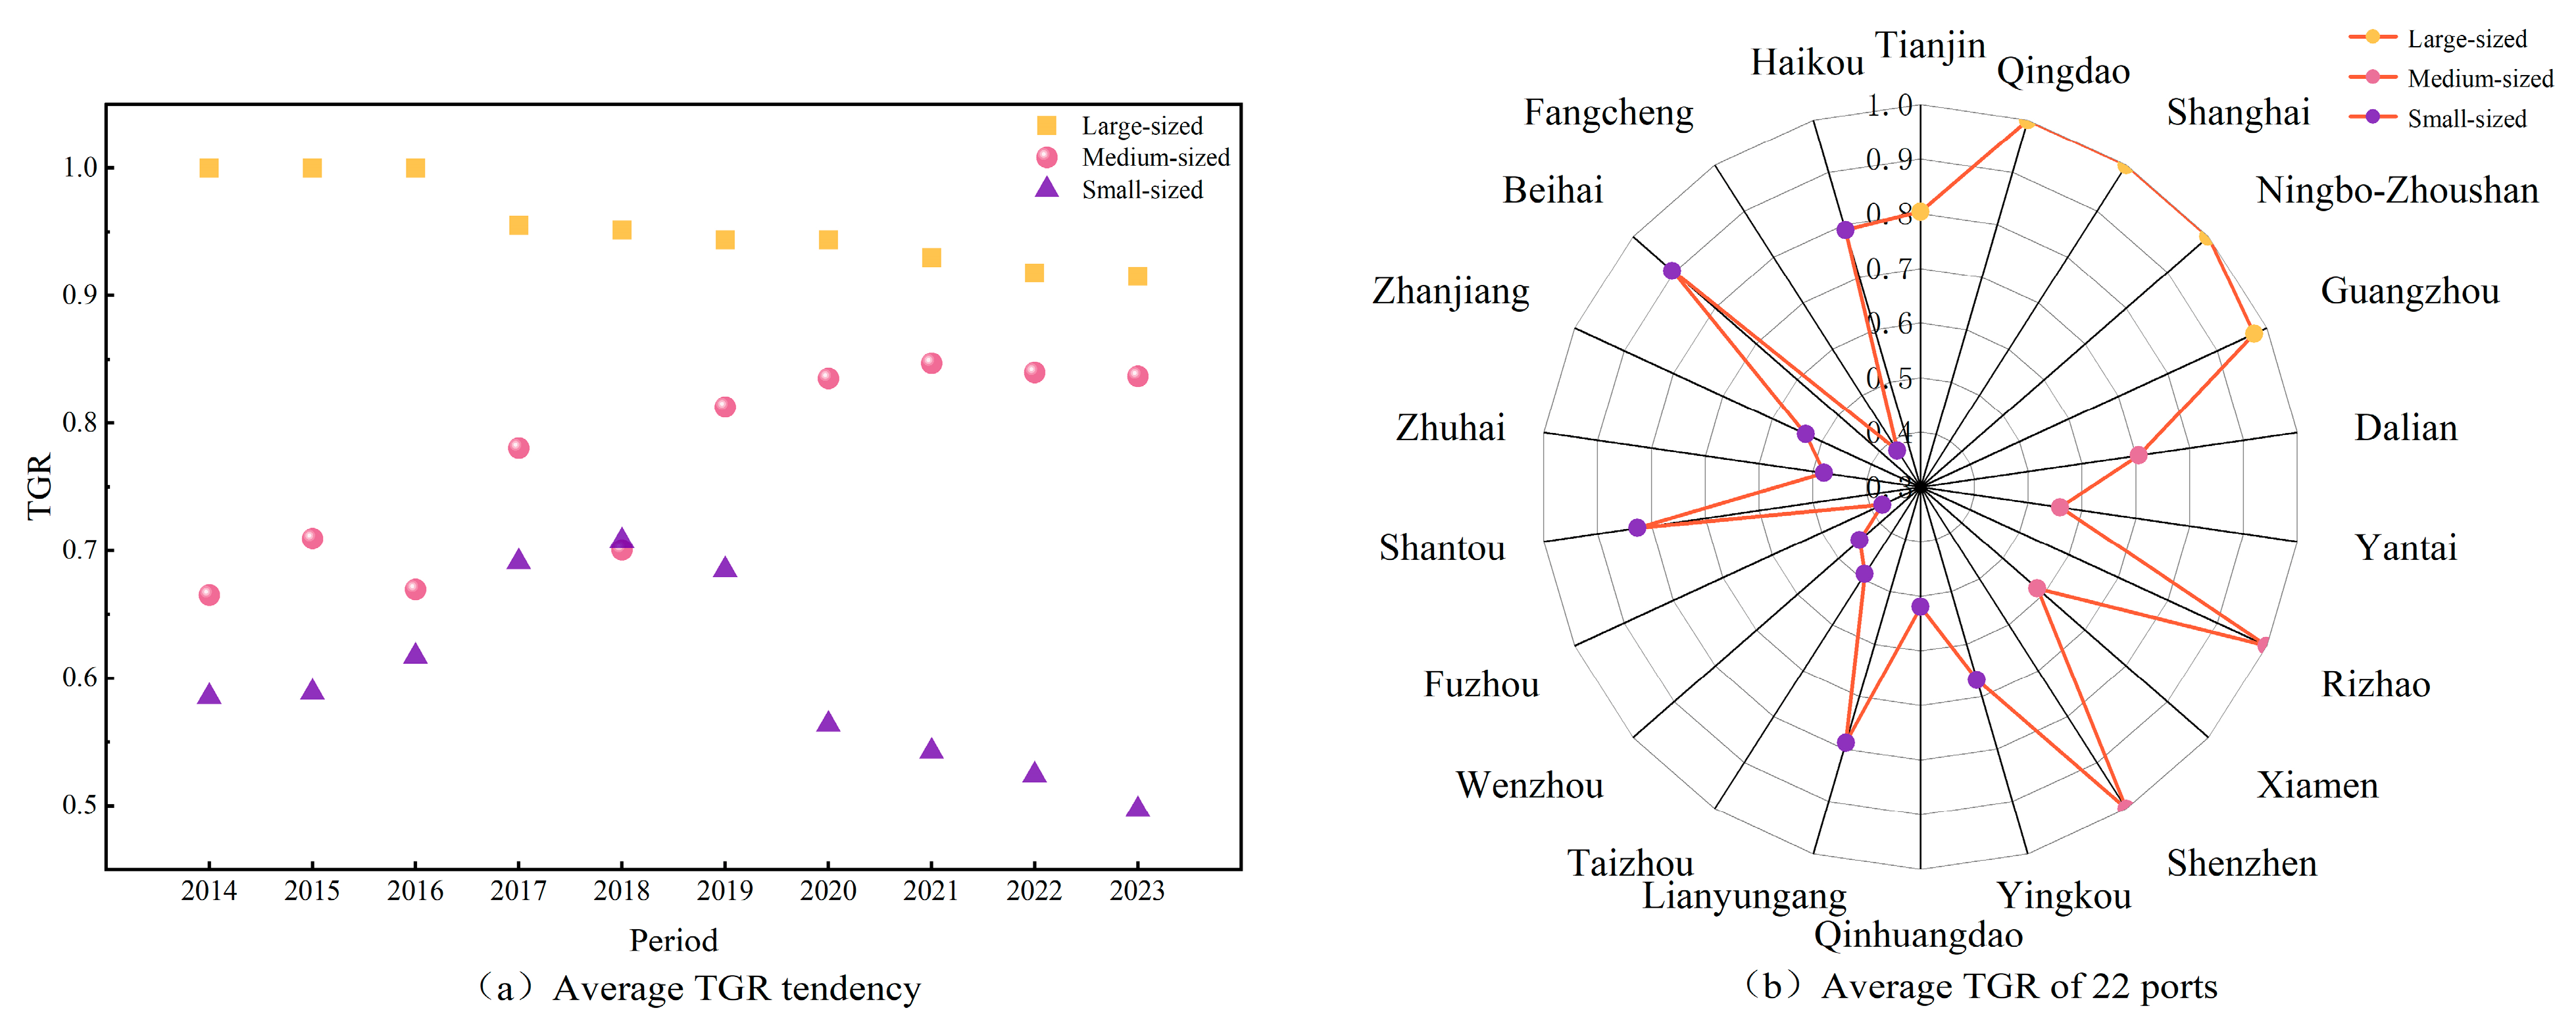
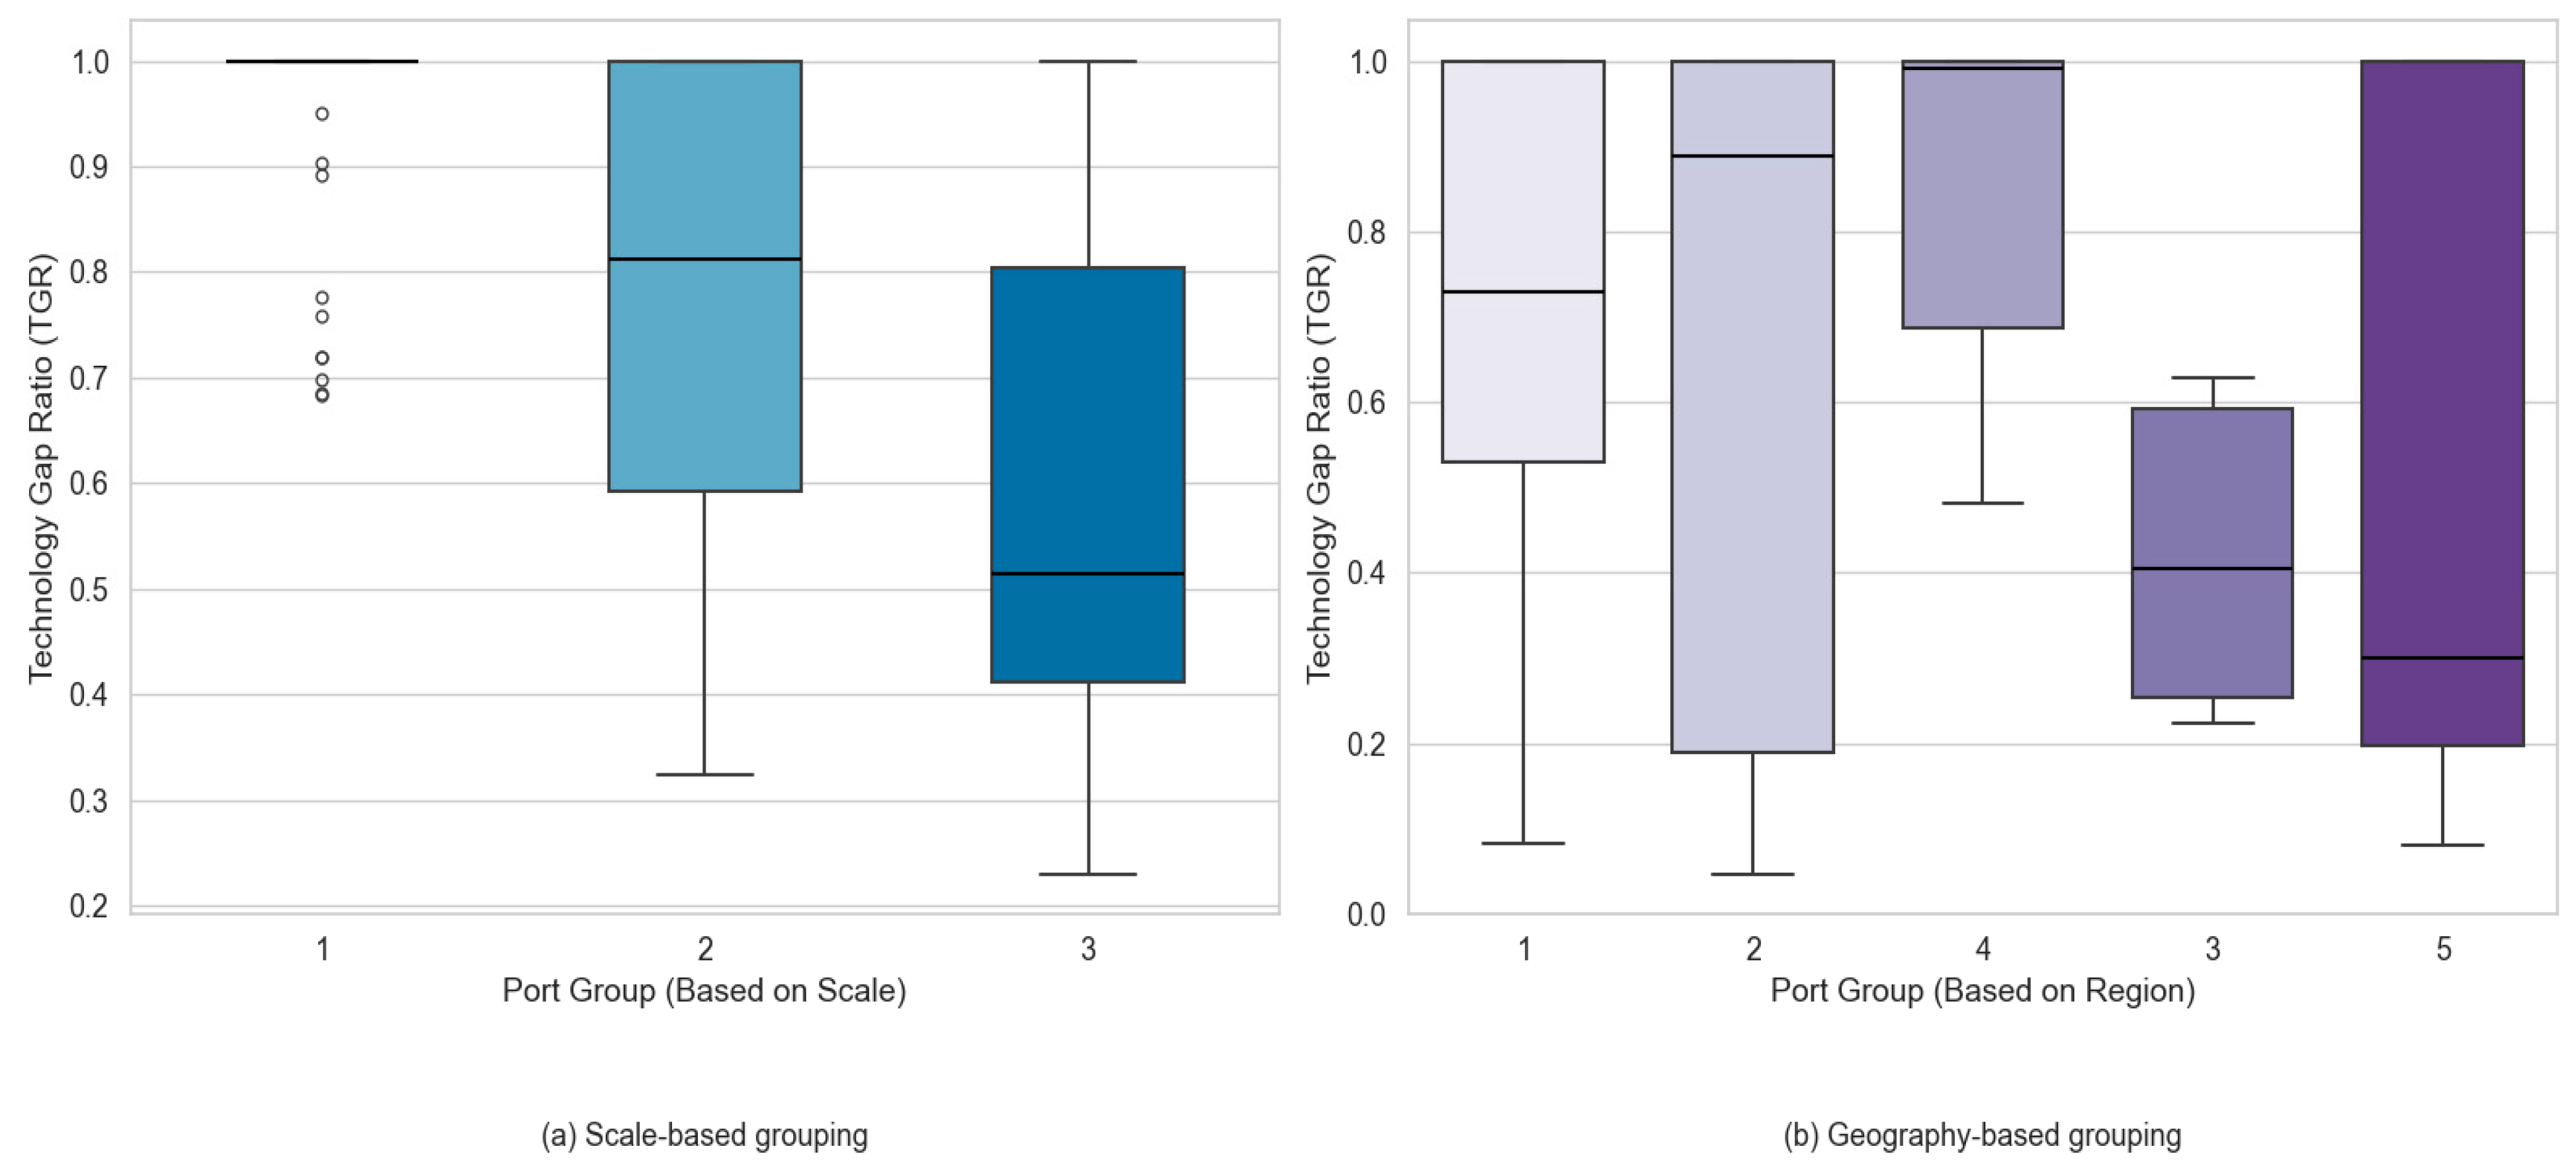
The TGR serves as a critical metric to assess the technological disparity between subgroup frontiers and the meta-frontier. A higher TGR value indicates a closer alignment with the global optimal technology level; representing a narrower technological gap. As shown in Figure 5a, notable variations in TGR are observed across port subgroups of varying sizes. During 2014–2023, the average TGR ranked in descending order as follows: large-sized; medium-sized; and small-sized ports. This finding aligns with Tovar and Wall [12], who also reported the distinct technological edge typically possessed by bigger and more sophisticated ports. Specifically, large-sized ports demonstrated the highest mean TGR at 0.956, indicating that their technological level closely approximated the meta-frontier, with an overall minimal technological gap. In contrast, the average TGRs for medium-sized and small-sized ports were 0.770 and 0.600, respectively, implying that their PEEs reached only 77% and 60% of the potential benchmark. From a temporal perspective, large-sized ports consistently maintained a high and stable technological level, solidifying their industry-leading position. Medium-sized ports exhibited a steady catch-up tendency, gradually narrowing the gap with large-sized ports. In comparison, the technological performance of small-sized ports was more volatile. Their average TGRs initially improved but subsequently declined, indicating a widening gap from the optimal technology and indicating instability in their production technology
As illustrated in Figure 5b, five ports achieved an average TGR of 1, indicating that their technological levels had reached the current optimal frontier, representing the best-practice production technology during the investigated period. Specifically, among large-sized ports, the ports of Shanghai, Ningbo-Zhoushan, and Qingdao all demonstrated superior technological capabilities, with their TGRs consistently equal to 1. By comparison, Guangzhou Port and Tianjin Port posted average TGRs of 0.975 and 0.804, respectively, suggesting that their technologies lagged behind the optimal level by approximately 2.5% and 19.6%. Among medium-sized ports, Shenzhen Port and Rizhao Port matched the technological performance of the leading large-sized ports, both achieving TGRs of 1. However, the ports of Yingkou and Xiamen exhibited TGRs of only 0.559 and 0.584, indicating potential efficiency improvements of approximately 44.0% and 41.6%, respectively. Within the small-sized port subgroup, Beihai Port demonstrated the highest degree of technological proximity to the optimal frontier, with an average TGR of 0.904. Conversely, significant underperformance was observed in ports of Fuzhou, Fangcheng, Wenzhou, Zhuhai, and Taizhou, where average TGRs were below 0.5. These results demonstrate that approximately half of their efficiency potential remains unrealized. These ports are in urgent need of technological upgrades and managerial improvements to narrow the gap with the sector’s top performers.

4.2. Dynamic Characteristics Analysis of Port Environmental Efficiency

To dynamically investigate PEE trends, the GM index was utilized to determine TFP from 2014 to 2023. Table 6 presents the GM index and its decomposition items.
As illustrated in Figure 6, the average GM index of China’s coastal ports exhibited a fluctuating upward trend spanning 2014–2023. The mean GM index over the period was 1.068, demonstrating a modest yet continuous increase in TFP corresponding to an average annual growth rate of 6.8%. In terms of annual change, a slight decline of 1.144% was observed in 2014, marking the only reduction during the studied period. In all subsequent years, TFP experienced consistent growth, albeit at varying magnitudes across the years. Notably, the most substantial growth occurred between 2018 and 2019, during which the GM Index reached 1.161, representing a surge of 16.145%.
Further decomposition of the GM index (as presented in Table 6) reveals that TFP growth was predominantly driven by technological progress. Overall, the average values of the GMEC and GMTC indices were 1.024 and 1.069, representing respective yearly increases of 2.4% and 6.9%. These highlight that although certain improvements in efficiency were achieved, the predominant source of TFP growth lay in technological progress. This result is consistent with the conclusions of Cui et al. [45], who also identified advancements in production technology as the dominant driver of TFP enhancement in the port sector. Specifically, in 2014–2015, the decline in technological level emerged as the principal constraint on TFP growth. In contrast, from 2015 to 2018, advancements in technical efficiency served as the main driver of TFP enhancement. From 2019 onwards, however, technological advancement became the predominant contributor to TFP enhancement. This shifting pattern reveals that the driving factors behind TFP gains varied across different stages. It also underscores the critical significance of simultaneously boosting both technical efficiency and technological progress in achieving sustained long-term TFP growth.
Figure 7 delineates the evolution of the average GM index across the three port subgroups. The average annual GM indices for all three subgroups exceeded 1, signifying a positive tendency in TFP from 2014 to 2023, reflective of relatively rational resource allocation and operational management. Among the three subgroups, small-sized ports witnessed the most pronounced improvement, with a TFP growth of 8.9%. Large-sized ports followed with a 6.5% increase, while medium-sized ports lagged behind, experiencing only a 2.3% rise, which was significantly below the overall average level. These disparities point to differences in technological advancement and TFP gains among the port categories. Furthermore, the GM index for large-sized ports displayed a relatively steady upward tendency, indicative of continuous TFP progress throughout the investigated period. Medium-sized ports experienced considerable fluctuations, with noticeable declines observed during 2014–2017, 2018–2020, and 2022–2023. On the contrary, small-sized ports demonstrated a volatile upward trend, largely in line with the whole pattern.
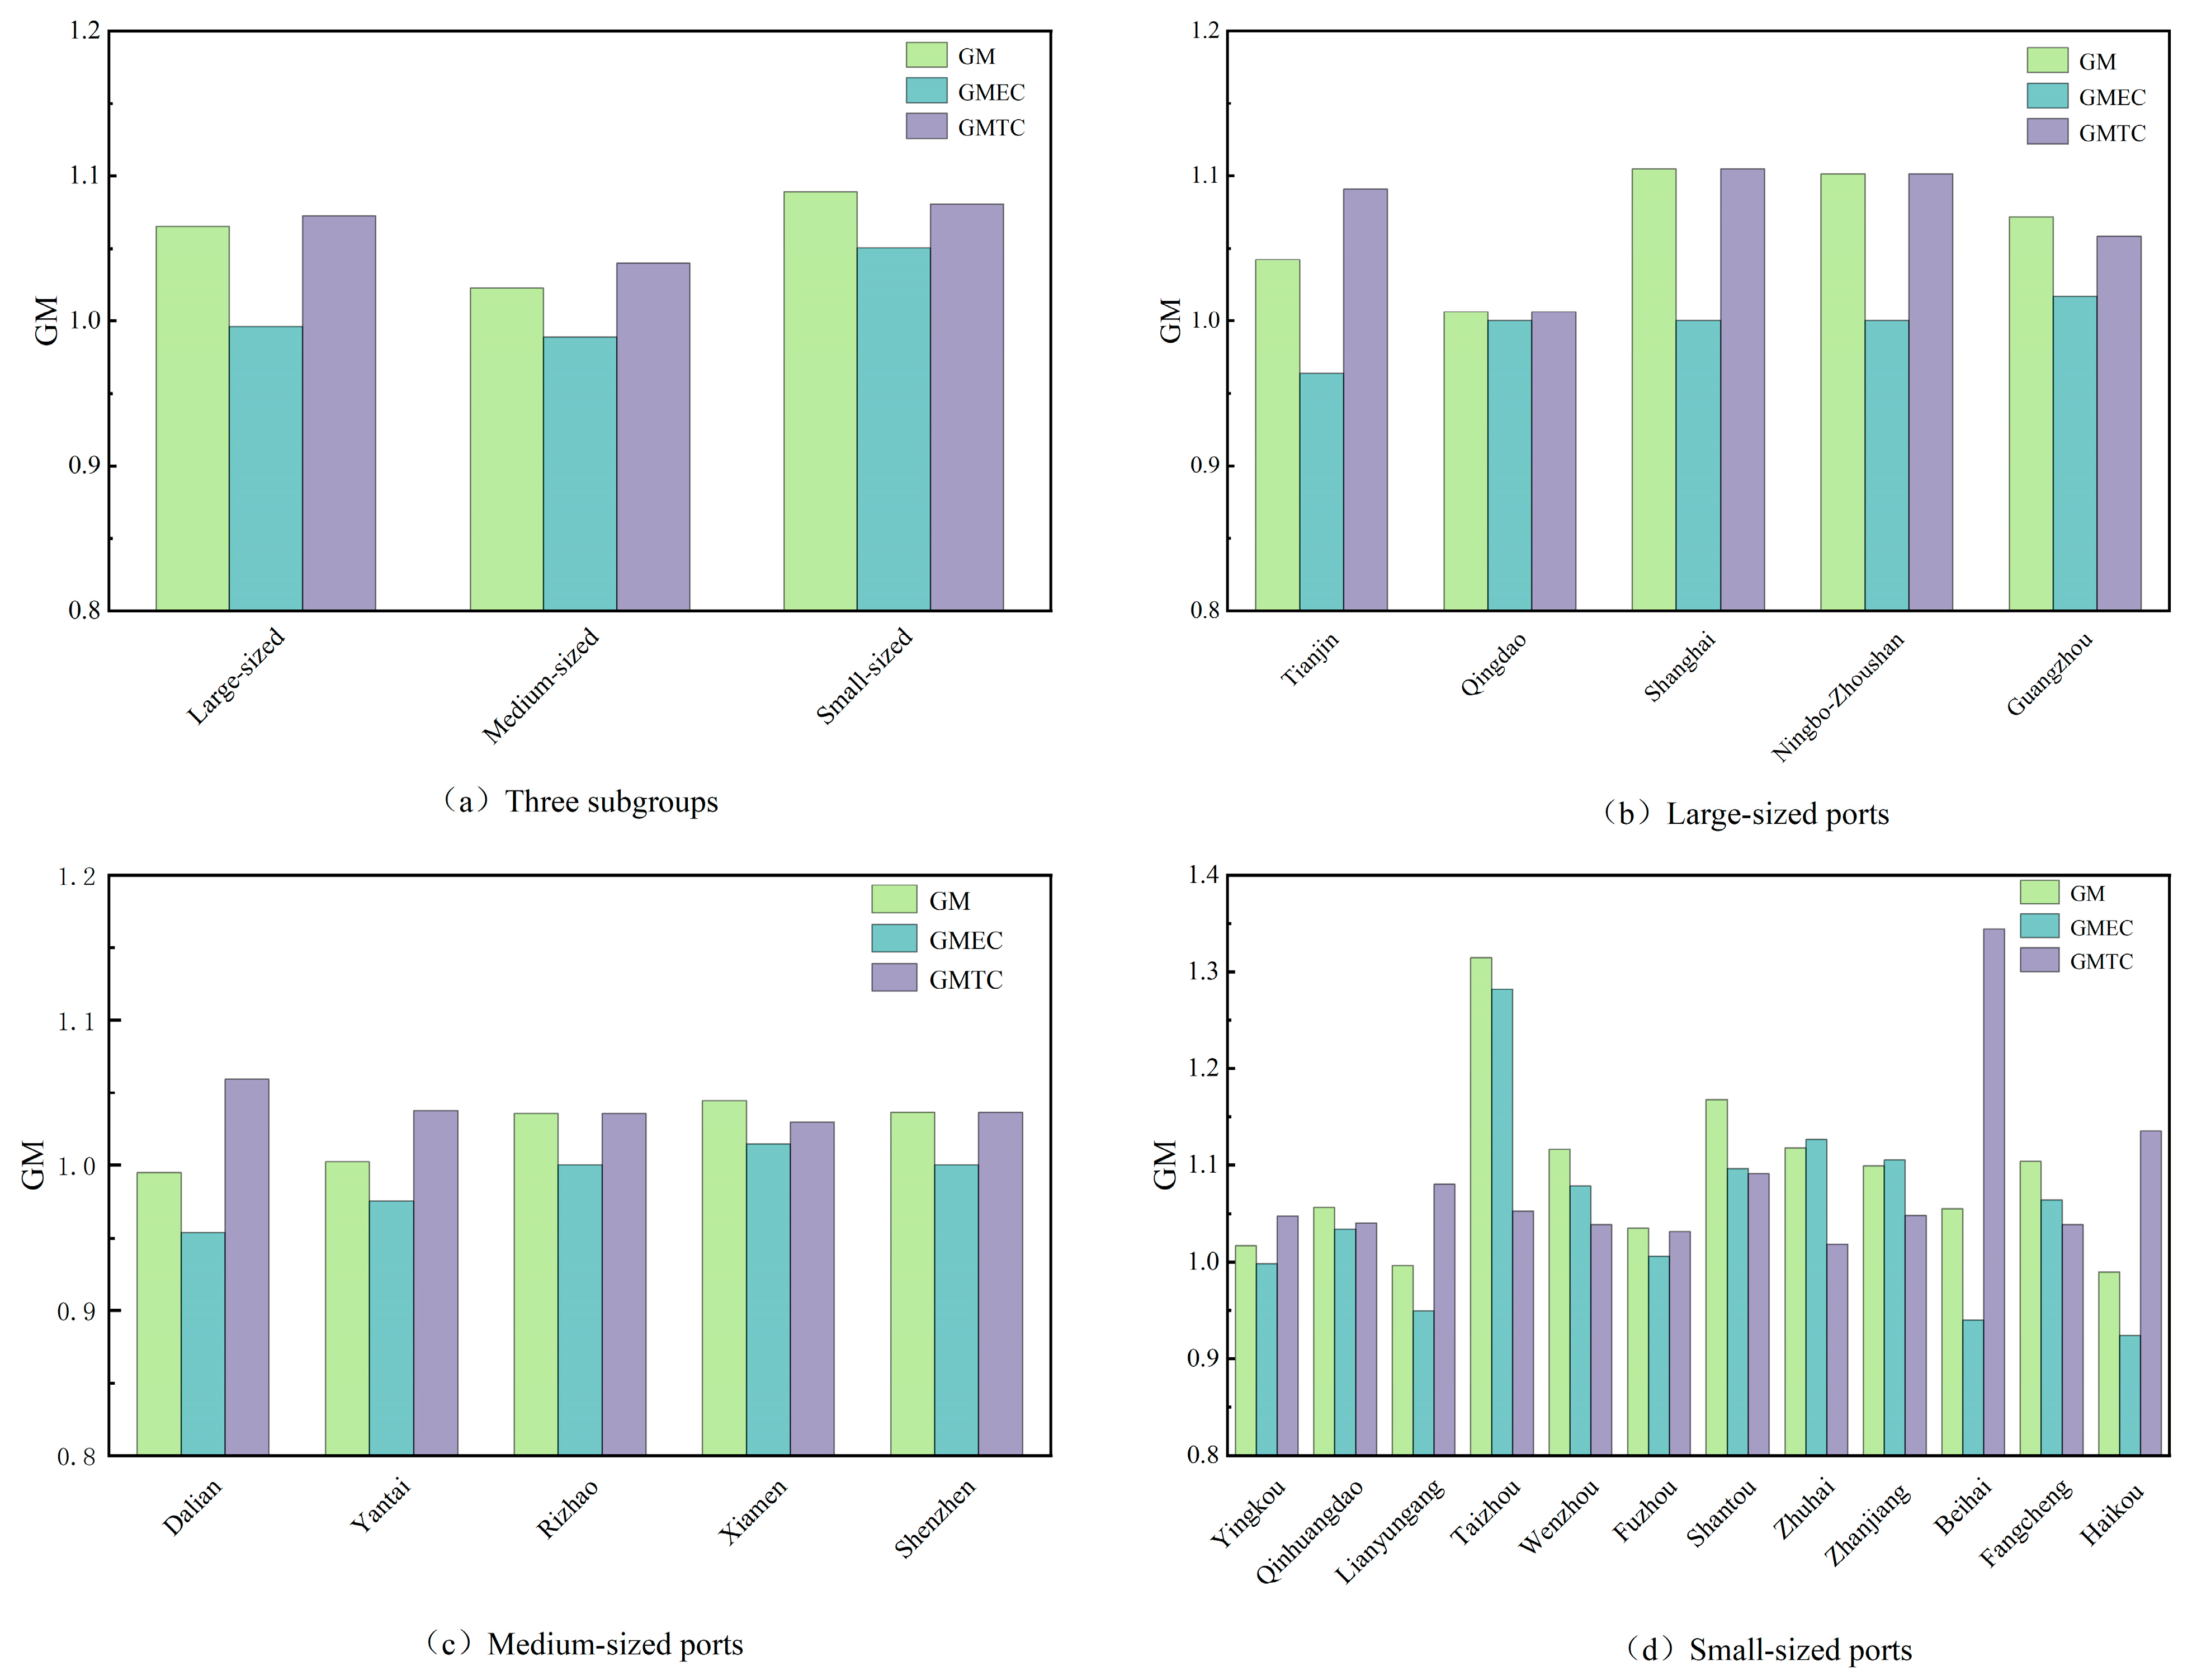
The average GM indices and decomposition items for the three port subgroups are visualized in Figure 8. For large-sized and medium-sized ports, GMTC increased by 7.2% and 4.0%, respectively. However, both subgroups experienced declines in GMEC, with negative growth of −0.4% and −1%. This indicates that TFP growth in these ports was predominantly propelled by technological progress. In contrast, small-sized ports exhibited simultaneous enhancements in both GMEC and GMTC, which rose by 5.0% and 8.1%, respectively. These figures suggest that while both technical efficiency and technological advancement contributed to the TFP improvements in small-sized ports, the latter remained the dominant force. At the individual port level, the average GM index for 19 ports (constituting 86% of the total) surpassed 1, denoting a sustained TFP enhancement. Among these, Taizhou Port stood out with the highest GM value of 1.314, whereas Dalian Port exhibited the lowest average GM value of 0.995.
As depicted in Figure 8b, all large-sized ports experienced consistent improvements in TFP throughout the study period. The most pronounced progress was observed at Shanghai Port, where TFP averaged a 10.5% annual increase. In contrast, the lowest growth was recorded by Qingdao Port, with a marginal gain of only 0.6%. A distinguishing feature across all large-sized ports was that the growth rate of GMTC consistently outpaced that of GMEC, thereby underscoring technological innovation as the primary contributor for their TFP augmentation.
Figure 8c demonstrates that TFP growth has been primarily positive for most of the medium-sized ports, with the exception of Dalian Port. Xiamen Port performed most favorably, with TFP averaging 10.5% annual growth. Conversely, Dalian Port encountered a persistent decline, with TFP falling by 0.5% per year on average. With respect to underlying drivers, ports such as Yantai, Shenzhen, and Rizhao exhibited GMTC values that substantially exceeded GMEC, underscoring the dominant role of technological progress. For Xiamen Port, the similarity between GMEC and GMTC suggests a more balanced contribution from both technical efficiency improvements and technological advancement. In contrast, the drop in Dalian’s TFP can be primarily attributed to a sustained deterioration in technical efficiency.
Figure 8d presents a more differentiated pattern for small-sized ports. Only Lianyungang and Haikou Ports experienced consistent declines in TFP over time. Taizhou Port stood out with the highest average GM index, while Haikou Port recorded the lowest. The driving element behind TFP growth also differed across ports. Beihai Port, Fuzhou Port, and Yingkou Port were predominantly motivated by technological advances, as evidenced by GMTC values significantly surpassing GMEC. Conversely, ports such as Taizhou, Zhuhai, Zhanjiang, Wenzhou, and Fangcheng were characterized by a predominance of technological efficiency, with GMEC values substantially higher than GMTC. In the case of Qinhuangdao and Shantou Ports, GMEC and GMTC were relatively balanced, suggesting that TFP improvements stemmed from both drivers. Notably, the decrease in TFP for Haikou Port and Lianyungang Port can be ascribed to pronounced technical inefficiencies.

5. Discussion

Due to substantial discrepancies in natural endowment, specialization and operational scale, Chinese coastal ports exhibit significant heterogeneity in production technologies. Neglecting such heterogeneity in environmental efficiency assessment may introduce biases into the outcomes. Therefore, grouping ports with similar technological characteristics can help construct more accurate group frontiers and improve the effectiveness and policy relevance of performance evaluations.
Existing research often employs geographical proximity [13,50] or operational scale [27,39] as criteria for classification in PEE assessments to reflect inter-port technological heterogeneity. Although both approaches are extensively utilized, limited attention has been paid to evaluating which classification strategy more accurately captures the impact of heterogeneity on PEE outcomes. This section, therefore, undertakes an empirical comparison of the two categorization schemes, scale-based and geography-based, to evaluate their effectiveness in identifying technological heterogeneity. The geography-based categorization of ports is detailed in Appendix A.
To this end, we evaluated the effectiveness of both schemes by examining the distribution of the TGR across groups. The TGR measures the gap between a port’s group frontier and the meta-frontier, serving as a proxy for the degree of technological advancement. The Kruskal–Wallis H test was utilized to assess whether significant differences in TGR existed across groups, while intra-group mean, standard deviation, and coefficient of variation (CV) were computed to evaluate internal consistency. The results are presented in Table 7.
The test results demonstrate that both classification schemes produced statistically significant inter-group differences in TGR at the 1% level. Nevertheless, the H statistic for the scale-based grouping (H = 69.93) is substantially higher than for the geography-based grouping (H = 29.46), indicating that the former possesses stronger inter-group heterogeneity and a better capacity to capture technological homogeneity. Furthermore, as depicted in Table 6, Subgroup 1 in the scale-based scheme, which included large-sized ports, exhibited the highest mean TGR (0.956) and the lowest CV (0.104), indicating strong technological homogeneity. In contrast, most geography-based subgroups exhibited high internal variation (CV > 0.4), undermining their suitability for representing a common frontier.
Figure 9 presents side-by-side boxplots of TGR distributions under the two grouping strategies. It is evident that the scale-based subgroups have tighter interquartile ranges and fewer outliers, indicating stronger internal homogeneity in production technology. In contrast, the geography-based subgroups display longer boxes and more outliers, reflecting substantial within-group variability and the presence of heterogeneous technologies within the same regions.
The comparative analysis demonstrates that scale-based grouping is more effective in capturing technological heterogeneity than geography-based grouping. Hence, the scale-based classification more accurately reflects actual variances in production technology and provides a sound basis for constructing group-specific frontiers in environmental efficiency evaluation.

6. Conclusions and Policy Implications

Amid the rising global imperative for sustainable and efficient maritime operations, evaluating the environmental performance of ports has become increasingly critical. This study focuses on coastal ports in China, empirically investigating the evolution and dynamic characteristic of PEE across ports of diverse sizes. By capturing both technological heterogeneity and temporal dynamics, the study provides novel insights into differentiated decarbonization pathways across port types. The main findings are summarized threefold.
(1)
Pronounced discrepancy in PEE was observed across Chinese coastal ports. With respect to the meta-frontier, the overall PEE exhibited a volatile downward trend throughout the study period. The average group-PEE (0.732) substantially exceeded the corresponding meta-PEE (0.570), underscoring that neglecting scale heterogeneity would lead to an underestimation of actual port environmental performance. At the subgroup level, large-sized ports demonstrated a clear outperformance in PEE, while medium-sized and small-sized ports confronted the predicament of lower PEE.
(2)
Disparities in PEE were found to be strongly linked to variations in technological level and operational scale. Large-sized ports recorded an average TGR of 0.956, indicating that performance levels approach the optimal production frontier. In comparison, the average TGRs for medium-sized and small-sized ports stood at 0.770 and 0.600, respectively, suggesting ample leeway for improvement. This demonstrates that operational scale, to a certain extent, dictates a port’s technological advantage. Furthermore, compared to geography-based classifications, scale-based grouping was also found to provide a more accurate revelation of the impact of technological heterogeneity on port PEE.
(3)
From 2014 to 2023, TFP experienced a generally upward tendency across coastal ports, averaging 6.8% annual growth. The decomposition items offer further insights: average GMTC (1.069) substantially surpassed average GMEC (1.024), demonstrating that technological progress was the dominant element of TFP enhancement. TFP growth was achieved by the majority of ports, with small-sized ports displaying particularly notable upward momentum. However, TFP regress was observed in some medium-sized ports (e.g., Dalian Port) and small-sized ports (e.g., Haikou Port and Lianyungang Port), primarily constrained by technological inefficiencies.
Based on the empirical findings, several policy recommendations can be drawn.
(1)
Specialization in large-sized ports should be further emphasized. Given their inherent advantages in resource allocation, advanced infrastructure, and service coverage, large-sized ports are well-positioned to pursue a more specialized and intensive development path. Integrated improvements and green transformation should be achieved through measures such as functional zoning, the construction of dedicated terminals, and the integration of business processes.
(2)
The application of green technologies and carbon management capabilities in small-sized and medium-sized ports need to be enhanced. These ports generally face constraints related to limited technical capacity and limited infrastructural resources. Therefore, increased fiscal support is required to promote the introduction and application of technologies in areas such as green infrastructure, intelligent port operations, and carbon emission monitoring, thereby strengthening their decarbonization capabilities.
(3)
Differential port decarbonization strategies should be explored. Substantial heterogeneity in resources, technological maturity, and operational efficiency among ports requires a tailored approach to carbon mitigation. Emission reduction pathways and evaluation metrics should be aligned with port size, technological capacity, and functional orientation. Furthermore, a dynamic adjustment mechanism should be introduced to enhance the operability and adaptability of decarbonization targets.
(4)
Regional collaboration and experience sharing should be enhanced to foster sustainable port group development. Given the divergent paths of ports in green transition, a coordinated framework should be established with large-sized ports serving as regional anchors. Medium and smaller ports should be encouraged to participate through shared platforms and joint initiatives. Through the exchange of best practices and joint innovation efforts, synergies can be maximized, and collective decarbonization accelerated.
While this study provides a comprehensive evaluation of port environmental efficiency, several limitations should be acknowledged. For instance, the current analysis is centered on port-level performance and does not incorporate the integrated performance of ports and their associated hinterland transportation systems. Moreover, the study primarily concentrates on efficiency measurement under technological heterogeneity, and it does not extend to examining the effects of external macro-level factors on port environmental performance.
Building on the current framework, future research could extend the analysis in several meaningful directions. A port–hinterland integration perspective could be adopted to develop a more comprehensive framework for assessing port environmental performance across the entire port–hinterland system. Moreover, future studies could employ multivariate analysis or machine learning techniques to identify and quantify the impact of external drivers, such as economic level, technology adoption, openness, and environmental regulation.

Author Contributions

Conceptualization, J.Z. and G.G.; methodology, J.Z. and X.P.; formal analysis, G.G. and X.P.; software, J.Z.; resources, X.P. and G.G.; data curation, J.Z. and X.P.; writing–original draft preparation, J.Z.; writing–review and editing, X.P. and G.G.; funding acquisition, G.G. All authors have read and agreed to the published version of the manuscript.

Funding

This research was funded by the Social Science Fund of Liaoning Province (Grant Number L23CGL017), the China Postdoctoral Science Foundation (Grant number 2023M740465), and the Fundamental Research Funds from the Liaoning Education Department (Grant Number JYTMS20230168).

Data Availability Statement

The raw data supporting the conclusions of this article will be made available by the authors on request.

Acknowledgments

The authors sincerely appreciate the editor and anonymous reviewers for their valuable feedback on this paper.

Conflicts of Interest

The authors declare no conflicts of interest.

Abbreviations

The following abbreviations are used in this manuscript:
PEEPort Environmental Efficiency
DEAData Envelopment Analysis
SFAStochastic Frontier Analysis
DMUDecision Making Unit
DDFDirectional Distance Function
NDEANetwork DEA
SBMSlack-Based Measure
RAMRange-Adjusted Measure
TFPTotal Factor Productivity
MIMalmquist Productivity Index
GMIGlobal Malmquist Productivity Index
PPSProduction Possibility Set
ECEfficiency Change
TCTechnological Change

Appendix A

Appendix A.1. The Geography-Based Categorization of Ports

According to the geographical distribution of coastal ports, this paper divides the 22 coastal ports under study into 5 major port groups, as shown in Table A1.
Table A1. The port grouping based on geography.
SubgroupPort GroupContains Port
1Bohai Sea port groupDalian Port, Yingkou Port, Qinhuangdao Port, Tianjin Port,
Yantai Port, Qingdao Port, Rizhao Port
2Yangtze River Delta port groupShanghai Port, Lianyungang Port, Ningbo-Zhoushan Port,
Taizhou Port, Wenzhou Port
3Southeast Coastal port groupFuzhou Port, Xiamen Port
4Pearl River Delta port groupShantou Port, Shenzhen Port, Guangzhou Port, Zhuhai Port
5Southwest Coastal port groupZhanjiang Port, Beihai Port, Fangcheng Port, Haikou Port

References

  1. Issa Zadeh, S.B.; López Gutiérrez, J.S.; Esteban, M.D.; Fernández-Sánchez, G.; Garay-Rondero, C.L. Scope of the Literature on Efforts to Reduce the Carbon Footprint of Seaports. Sustainability 2023, 15, 8558. [Google Scholar] [CrossRef]
  2. Nguyen, P.N.; Kim, H. Analysis of Effectiveness for Cargo Operation Productivity Considering Environmental Efficiency on Container Ports in the Northeast Asian Region. Transp. Policy 2024, 157, 111–123. [Google Scholar] [CrossRef]
  3. Wang, B.; Liu, Q.; Wang, L.; Chen, Y.; Wang, J. A Review of the Port Carbon Emission Sources and Related Emission Reduction Technical Measures. Environ. Pollut. 2023, 320, 121000. [Google Scholar] [CrossRef]
  4. Mergoni, A.; Emrouznejad, A.; De Witte, K. Fifty Years of Data Envelopment Analysis. Eur. J. Oper. Res. 2024, S0377221724009913. [Google Scholar] [CrossRef]
  5. Yuen, A.C.; Zhang, A.; Cheung, W. Foreign Participation and Competition: A Way to Improve the Container Port Efficiency in China? Transp. Res. Part A Policy Pract. 2013, 49, 220–231. [Google Scholar] [CrossRef]
  6. Ding, Z.-Y.; Jo, G.-S.; Wang, Y.; Yeo, G.-T. The Relative Efficiency of Container Terminals in Small and Medium-Sized Ports in China. Asian J. Shipp. Logist. 2015, 31, 231–251. [Google Scholar] [CrossRef]
  7. Tovar, B.; Wall, A. Environmental Efficiency for a Cross-Section of Spanish Port Authorities. Transp. Res. Part D Transp. Environ. 2019, 75, 170–178. [Google Scholar] [CrossRef]
  8. Zhang, W.; Wu, X.; Guo, J. CO2 Emission Efficiency Analysis of Rail-Water Intermodal Transport: A Novel Network DEA Model. J. Mar. Sci. Eng. 2022, 10, 1200. [Google Scholar] [CrossRef]
  9. Zhu, J.; Zhao, Y.; Yang, Q.; Jiang, J. Analysis of Regional Differences and Evolution Features for Waterway Transport Efficiency in the Yangtze River Economic Belt Considering Undesired Outputs. Ocean Coast. Manag. 2024, 253, 107122. [Google Scholar] [CrossRef]
  10. Cui, Q. Environmental Efficiency Measures for Ports: An Application of RAM-Tobit-RAM with Undesirable Outputs. Marit. Policy Manag. 2017, 44, 551–564. [Google Scholar] [CrossRef]
  11. Jo, A.H.; Chang, Y.T. Environmental Efficiency of Seaports Correcting Estimation Biases: Weak Disposability and Bootstrapping Method. Transp. Res. Part D Transp. Environ. 2023, 122, 103884. [Google Scholar] [CrossRef]
  12. Tovar, B.; Wall, A. Are Larger and More Complex Port More Productive? An Analysis of Spanish Port Authorities. Transp. Res. Part A Policy Pract. 2019, 121, 265–276. [Google Scholar] [CrossRef]
  13. Wang, M.; Wu, X.; Xie, Y.; Chiu, Y. Comparative Analysis of Port Efficiency in Yangtze River Delta and Pearl River Delta: A Meta Dynamic D.D.F. Approach. Econ. Res.-Ekon. Istraž. 2023, 36, 2129405. [Google Scholar] [CrossRef]
  14. Krmac, E.; Mansouri Kaleibar, M. A Comprehensive Review of Data Envelopment Analysis (DEA) Methodology in Port Efficiency Evaluation. Marit. Econ. Logist. 2023, 25, 817–881. [Google Scholar] [CrossRef]
  15. Fei, H.; Shi, H.; Pan, X. A Systematic Review of Green Port Evaluation: Methods, Subjects, and Indicators. J. Mar. Sci. Eng. 2025, 13, 604. [Google Scholar] [CrossRef]
  16. Quintano, C.; Mazzocchi, P.; Rocca, A. Evaluation of the Eco-Efficiency of Territorial Districts with Seaport Economic Activities. Util. Policy 2021, 71, 101248. [Google Scholar] [CrossRef]
  17. Durán, C.; Derpich, I.; Moreno, F.; Karbassi Yazdi, A.; Tan, Y. Modelling Sustainable Port Operations: Balancing Inputs and Outputs with the Cobb–Douglas Function. J. Mar. Sci. Eng. 2024, 12, 2285. [Google Scholar] [CrossRef]
  18. Zhang, J.; Yang, D.; Luo, M. Port Efficiency Types and Perspectives: A Literature Review. Transp. Policy 2024, 156, 13–24. [Google Scholar] [CrossRef]
  19. Roll, Y.; Hayuth, Y. Port Performance Comparison Applying Data Envelopment Analysis (DEA). Marit. Policy Manag. 1993, 20, 153–161. [Google Scholar] [CrossRef]
  20. Martinez-Budría, E. A Study of the Efficiency of Spanish Port Authorities Using Data Envelopment Analysis. Int. J. Transp. Econ. 1999, 26, 237–253. [Google Scholar]
  21. Nguyen, H.-O.; Nguyen, H.-V.; Chang, Y.-T.; Chin, A.T.H.; Tongzon, J. Measuring Port Efficiency Using Bootstrapped DEA: The Case of Vietnamese Ports. Marit. Policy Manag. 2016, 43, 644–659. [Google Scholar] [CrossRef]
  22. Chang, Y.-T.; Park, H.K.; Lee, S.; Kim, E. Have Emission Control Areas (ECAs) Harmed Port Efficiency in Europe? Transp. Res. Part D Transp. Environ. 2018, 58, 39–53. [Google Scholar] [CrossRef]
  23. Huang, T.; Chen, Z.; Wang, S.; Jiang, D. Efficiency Evaluation of Key Ports along the 21st-Century Maritime Silk Road Based on the DEA–SCOR Model. Marit. Policy Manag. 2021, 48, 378–390. [Google Scholar] [CrossRef]
  24. Hsu, W.K.K.; Huang, S.H.S.; Huynh, N.T. An Assessment of Operating Efficiency for Container Terminals in a Port—An Empirical Study in Kaohsiung Port Using Data Envelopment Analysis. Res. Transp. Bus. Manag. 2023, 46, 100823. [Google Scholar] [CrossRef]
  25. Agüero-Tobar, M.A.; González-Araya, M.C.; González-Ramírez, R.G. Assessment of Maritime Operations Efficiency and Its Economic Impact Based on Data Envelopment Analysis: A Case Study of Chilean Ports. Res. Transp. Bus. Manag. 2023, 46, 100821. [Google Scholar] [CrossRef]
  26. Chin, A.T.H.; Low, J.M.W. Port Performance in Asia: Does Production Efficiency Imply Environmental Efficiency? Transp. Res. Part D Transp. Environ. 2010, 15, 483–488. [Google Scholar] [CrossRef]
  27. Li, Y.; Li, J.; Gong, Y.; Wei, F.; Huang, Q. CO2 Emission Performance Evaluation of Chinese Port Enterprises: A Modified Meta-Frontier Non-Radial Directional Distance Function Approach. Transp. Res. Part D Transp. Environ. 2020, 89, 102605. [Google Scholar] [CrossRef]
  28. Wang, Z.; Wu, X.; Guo, J.; Wei, G.; Dooling, T.A. Efficiency Evaluation and PM Emission Reallocation of China Ports Based on Improved DEA Models. Transp. Res. Part D Transp. Environ. 2020, 82, 102317. [Google Scholar] [CrossRef]
  29. Jiang, X.; Zhan, Z.; Ren, W.; Tao, X.; Zheng, S.; Luo, M. Balancing Economic and Environmental Strategies in Regional Hinterland Transport: A Dynamic Network Cross Efficiency Analysis. Transp. Policy 2025, 162, 128–154. [Google Scholar] [CrossRef]
  30. Kong, Y.; Zhang, X.; Wang, J.; Zhu, G. Navigating towards Sustainability: A Comprehensive Evaluation of Port Supply Chain in China. Transp. Res. Part D Transp. Environ. 2025, 144, 104770. [Google Scholar] [CrossRef]
  31. Chang, Y.T.; Park, H.; Jeong, J.; Lee, J. Evaluating Economic and Environmental Efficiency of Global Airlines: A SBM-DEA Approach. Transp. Res. Part D Transp. Environ. 2014, 27, 46–50. [Google Scholar] [CrossRef]
  32. Taleb, M.; Khalid, R.; Emrouznejad, A.; Ramli, R. Environmental Efficiency under Weak Disposability: An Improved Super Efficiency Data Envelopment Analysis Model with Application for Assessment of Port Operations Considering NetZero. Environ. Dev. Sustain. 2023, 25, 6627–6656. [Google Scholar] [CrossRef]
  33. Chen, Y.; Zhang, R.; Miao, J. Unearthing Marine Ecological Efficiency and Technology Gap of China’s Coastal Regions: A Global Meta-Frontier Super SBM Approach. Ecol. Indic. 2023, 147, 109994. [Google Scholar] [CrossRef]
  34. Chang, V.; Tovar, B. Efficiency Drivers for the South Pacific West Coast Port Terminals: A Two-Stage Non-Convex Metafrontier Dea Approach. Oper. Res. 2022, 22, 2667–2701. [Google Scholar] [CrossRef]
  35. Martínez-Moya, J.; Mestre-Alcover, A.; Sala-Garrido, R.; Furió-Pruñonosa, S. Are Transhipment Ports More Efficient in the Mediterranean Sea? Analysing the Role of Time at Ports Using DEA Metafrontier Approach. J. Transp. Geogr. 2024, 116, 103866. [Google Scholar] [CrossRef]
  36. Fernández, X.L.; Hidalgo-Gallego, S.; Pérez-Urbaneja, S.; Coto-Millán, P. When Container Specialisation Makes a Difference: An Efficiency Analysis of the Spanish Port Authorities. Marit. Policy Manag. 2021, 48, 629–650. [Google Scholar] [CrossRef]
  37. Laxe, F.G.; Bermúdez, F.M.; Prado Domínguez, A.J. Are Spanish Ports Efficient and Profitable? A Quantitative Analysis. Util. Policy 2021, 70, 101195. [Google Scholar] [CrossRef]
  38. Ghiara, H.; Tei, A. Port Activity and Technical Efficiency: Determinants and External Factors. Marit. Policy Manag. 2021, 48, 711–724. [Google Scholar] [CrossRef]
  39. Zhang, J.; Luo, M.; Yang, D. Are Efficient Ports for Port Operators Also Those for Shipping Companies? A Meta-Frontier Analysis of Global Top 80 Container Ports. Ocean Coast. Manag. 2025, 263, 107616. [Google Scholar] [CrossRef]
  40. Battese, G.E.; Rao, D.S.P.; O’Donnell, C.J. A Metafrontier Production Function for Estimation of Technical Efficiencies and Technology Gaps for Firms Operating under Different Technologies. J. Prod. Anal. 2004, 21, 91–103. [Google Scholar] [CrossRef]
  41. O’Donnell, C.J.; Rao, D.S.P.; Battese, G.E. Metafrontier Frameworks for the Study of Firm-Level Efficiencies and Technology Ratios. Empir. Econ. 2008, 34, 231–255. [Google Scholar] [CrossRef]
  42. Tone, K. A Slacks-Based Measure of Efficiency in Data Envelopment Analysis. Eur. J. Oper. Res. 2001, 130, 498–509. [Google Scholar] [CrossRef]
  43. Wang, M.; Feng, C. Revealing the Pattern and Evolution of Global Green Development between Different Income Groups: A Global Meta-Frontier by-Production Technology Approach. Environ. Impact Assess. Rev. 2021, 89, 106600. [Google Scholar] [CrossRef]
  44. Pastor, J.T.; Lovell, C.A.K. A Global Malmquist Productivity Index. Econ. Lett. 2005, 88, 266–271. [Google Scholar] [CrossRef]
  45. Cui, L.; Chen, L.; Yang, X. Evaluation and Analysis of Green Efficiency of China’s Coastal Ports under the “Double Carbon” Goal: Two Improved DEA Models with CO2 Emissions. Environ. Dev. Sustain. 2023, 26, 29099–29128. [Google Scholar] [CrossRef]
  46. Tovar, B.; Wall, A. Specialisation, Diversification, Size and Technical Efficiency in Ports: An Empirical Analysis Using Frontier Techniques. Eur. J. Transp. Infrastruct. Res. 2017, 17, 279–303. [Google Scholar] [CrossRef]
  47. Issa Zadeh, S.B.; Esteban Perez, M.D.; López-Gutiérrez, J.-S.; Fernández-Sánchez, G. Optimizing Smart Energy Infrastructure in Smart Ports: A Systematic Scoping Review of Carbon Footprint Reduction. J. Mar. Sci. Eng. 2023, 11, 1921. [Google Scholar] [CrossRef]
  48. Ma, Q.; Li, S.; Jia, P.; Kuang, H. Is Port Integration a Panacea for Regions Green Development: An Empirical Study of China Port City. Transp. Policy 2025, 160, 15–28. [Google Scholar] [CrossRef]
  49. Xu, L.; Yang, S.; Chen, J.; Shi, J. The Effect of COVID-19 Pandemic on Port Performance: Evidence from China. Ocean Coast. Manag. 2021, 209, 105660. [Google Scholar] [CrossRef]
  50. Nguyen, H.-O.; Nghiem, H.-S.; Chang, Y.-T. A Regional Perspective of Port Performance Using Metafrontier Analysis: The Case Study of Vietnamese Ports. Marit. Econ. Logist. 2018, 20, 112–130. [Google Scholar] [CrossRef]
Figure 1. Research framework.
Jmse 13 01272 g001
Figure 2. Graph of average PEE change during 2014–2023.
Jmse 13 01272 g002
Figure 3. Graph of average meta-PEE during 2014–2023.
Jmse 13 01272 g003
Figure 4. Graph of average group-PEE during 2014–2023.
Jmse 13 01272 g004
Figure 5. The average TGRs from 2014 to 2023.
Jmse 13 01272 g005
Figure 6. GM evolutionary trend and its change rate during 2014–2023.
Jmse 13 01272 g006
Figure 7. GM evolutionary trends in different subgroups across 2014–2023.
Jmse 13 01272 g007
Figure 8. Average values of GM index and its decomposition for the three port subgroups.
Jmse 13 01272 g008
Figure 9. Side-by-side boxplots of TGR distribution.
Jmse 13 01272 g009
Table 1. Summary of representative studies on PEE using DEA approaches.
Author(s) (Year)Research ObjectMethodInputsOutputs
Chin et al. (2010) [26]13 major East Asian portsSBMShipping frequency, trade flowsContainer capacity, NOx, SO2, CO2, PM
Nguyen et al. (2016) [21]43 major ports in VietnamBootstrapped DEABerth length, terminal area, cargo handling equipmentCargo throughput, container throughput
Chang et al. (2018) [22]58 European ports SBMBerth length, number of cranes, terminal areaContainer throughput
Tovar and Wall (2019) [12]26 Spanish portsMeta-frontier DDFLabor, intermediate consumption, capital assets, deposit areaLiquid bulk, solid bulk, container cargo, general cargo, passengers
Huang et al. (2020) [23]9 key ports along the 21st-Century Maritime Silk Road CCR, BCCNumber of container berths, wharf length, number of gantry cranesContainer throughput
Li et al. (2020) [27]16 Chinese portsMeta-frontier SBMLabor, fixed assetsCargo throughput, net profit, CO2 emissions
Wang et al. (2020) [28]11 Chinese portsDDFLabor, terminal length, berths, assetsContainer throughput, PM emission
Fernández et al. (2021) [36]26 Spanish portsMeta-frontier CCRLabor, terminal area, intermediate consumptionContainer traffic ratio
Agüero-Tobar et al. (2023) [25]12 Chilean portsCCR, BCCMaximum draft, quay length, number of berthsTEUs transferred, number of vessels
Hsu et al. (2023) [24]Kaohsiung PortCCR, BCCBerth length, yard area, fixed costs, variable costsTotal loading and unloading capacity
Jo & Chang (2023) [11]9 Korean portsSBM–DEA Quay length, labor, open storage yard areaCargo handled, vessel tonnage, CO2 emissions
Taleb et al. (2023) [32]19 Korean portsSE–SBMQuay length, labor, energy consumption, terminal area Cargo handled, vessel tonnage, CO2 emissions
Martínez- Moya et al. (2024) [35]19 Mediterranean container portsMeta-frontier CCRBerth length, quay cranes, yard area, depthTEU throughput per berth time
Jiang et al. (2025) [29]Regional seaport hinterland transport network in ChinaNetwork cross-efficiency DEAEnergy consumption, cargo volume, operation cost, transit timeFreight turnover, CO2 emissions, air pollutants
Kong et al. (2025) [30]16 port supply chains in ChinaCH–DEA modelQuay length, labor, open storage yard areaCargo handled, vessel tonnage, CO2 emissions
Zhang et al. (2025) [39]80 global container portsMeta-frontier BCCBerth length, quay cranes, depth, yard areaContainer throughput, container movements, ship time
Table 2. Port efficiency evaluation index.
IndicatorVariableUnit
Inputs Quay lengthm
Berth numberpcs
Energy consumption10,000 tons
Desirable outputsCargo throughput 10,000 tons
Container throughput 10,000 TEU
Undesirable outputsCO2 emission10,000 tons
Table 3. Reference coefficient of port energy consumption per unit.
Period2014201520162017201820192020202120222023
SC 2.72.62.52.42.32.12.01.91.751.62
Note—Data sources: Statistical Bulletin on the Development of China’s Transportation Industry.
Table 4. Port classification.
PortCargoContainerAbove AverageGroup
Guangzhou0.084 0.105 Cargo, ContainerLarge-sized
Ningbo-Zhoushan0.157 0.131 Cargo, ContainerLarge-sized
Qingdao0.082 0.103 Cargo, ContainerLarge-sized
Shanghai0.099 0.207 Cargo, ContainerLarge-sized
Tianjin0.077 0.081 Cargo, ContainerLarge-sized
Dalian0.056 0.044 CargoMedium-sized
Rizhao0.064 0.020 CargoMedium-sized
Shenzhen0.036 0.130 ContainerMedium-sized
Xiamen0.031 0.053 ContainerMedium-sized
Yantai0.052 0.016 CargoMedium-sized
Beihai0.006 0.002 NoneSmall-sized
Fangcheng0.018 0.002 NoneSmall-sized
Fuzhou0.030 0.015 NoneSmall-sized
Haikou 0.016 0.008 NoneSmall-sized
Lianyungang0.034 0.025 NoneSmall-sized
Qinhuangdao0.032 0.003 NoneSmall-sized
Shantou0.006 0.007 NoneSmall-sized
Taizhou0.009 0.002 NoneSmall-sized
Wenzhou0.012 0.004 NoneSmall-sized
Yingkou0.043 0.029 NoneSmall-sized
Zhanjiang 0.036 0.005 NoneSmall-sized
Zhuhai0.017 0.009 NoneSmall-sized
Table 5. Indicator data description statistical analysis.
IndicatorMinMaxMeanStd
WholeQuay5013126,92131,225.226,224.11
Berth 341238225.37243.53
Energy6145.2249,409.767,698.7354,727.8
Cargo throughput2276132,37031,331.525,539.4
Container throughput104916926.871149.89
CO2 emission15,110.43613,273.5166,464.4134,570.2
Large-sizedQuay22,714126,92165,992.8633,392.79
Berth 901238530.14361.16
Energy90,722.8249,409.7148,357.246,362.49
Cargo throughput46,802132,37068,762.3822,393.16
Container throughput113149162565.44984.56
CO2 emission223,078.3613,273.5364,795.5114,000.7
Medium-sizedQuay13,50448,21132,509.229498.3
Berth 52257170.7863.17
Energy35,749.47114,309.971,603.4722,706.61
Cargo throughput20,50459,28433,223.6210,967.51
Container throughput24230041061.64876.42
CO2 emission87,904.37281,076.6176,065.855,833.27
Small-sizedQuay501331,62816,203.665759.95
Berth 34218121.1250.54
Energy6145.289,297.132,464.0620,562.65
Cargo throughput227637,00114,946.929136.16
Container throughput10649187.98177.92
CO2 emission15,110.43219,572.679,825.8750,561.49
Table 6. Changes in GM index and decomposition items from 2014 to 2023.
PeriodGMGMECGMTC
2014–20150.989 1.057 0.935
2015–20161.055 1.083 0.986
2016–20171.025 1.071 0.980
2017–20181.085 1.048 1.046
2018–20191.161 1.065 1.106
2019–20201.090 0.856 1.383
2020–20211.048 1.000 1.052
2021–20221.090 0.999 1.092
2022–20231.074 1.036 1.047
Mean1.068 1.024 1.069
Table 7. Intra-group TGR statistics for scale-based and geography-based groupings.
Group ClassificationSubgroupMean Std CV
Scale-Based10.956 0.099 0.104
20.770 0.232 0.301
30.600 0.239 0.397
Geography-based 10.705 0.307 0.436
20.625 0.400 0.640
30.419 0.172 0.411
40.849 0.176 0.207
50.475 0.363 0.765
Disclaimer/Publisher’s Note: The statements, opinions and data contained in all publications are solely those of the individual author(s) and contributor(s) and not of MDPI and/or the editor(s). MDPI and/or the editor(s) disclaim responsibility for any injury to people or property resulting from any ideas, methods, instructions or products referred to in the content.

