1. Introduction
The maritime industry is continuously challenged by the need to ensure the structural integrity and safety of marine structures against various impact loads. These loads can arise from multiple sources, including sea waves, ice, dropped objects, grounding incidents, and collisions with other units or structures. Such impacts can lead to severe damage to ships’ hulls and structural components, necessitating a significant focus on enhancing crashworthiness. This term refers to the ability of a structure to absorb energy during an impact condition, thereby protecting both the vessel and its crew. The importance of crashworthiness is underscored by the potential consequences of structural failures, which may include costly repairs, environmental hazards due to spills, and, most critically, threats to human life. Historically, ship structures have relied on stiffened panels (SPs) due to their satisfactory performance in terms of rigidity and strength. These panels have been a staple in marine design for decades, providing essential support and stability.
Thus, a large amount of research activity has been concerned with testing and simulating scale models representing the condition of marine structures during collision, grounding, or objects being dropped, such as the work done by Ellinas and Valsgard [
1], Jones [
2], Samuelides and Frieze [
3], Samuelides, et al. [
4], and Liu, et al. [
5]. Alsos and Amdahl [
6] performed experimental analysis on the penetration resistance of stiffened plates with different reinforcement configurations, simulating the condition of grounding. It was reported that, as the stiffness of the specimen increases, the ductility decreases as a function of fracture initiation. Also, the stiffeners play an important role in controlling the damage zone and directly affect the fracture occurrence and enhance the post-fracture resistance.
Cho and Lee [
7] experimentally tested 33 stiffened plates under impact loading and derived an analytical expression for the onset of crack formation based on a relationship between dent depth and plate thickness, and initial kinetic energy of the hammer and the absorbed energy of the stiffened plate. Villavicencio and Guedes Soares [
8] investigated the effect of stiffener end conditions on the crashworthiness of stiffened panels. It was observed that end-connected stiffeners substantially enhanced resistance to deformation by reducing both peak deflections and local indentations and consequently increased the absorbed energy, in contrast to free-ended configurations.
Liu and Guedes Soares [
9] analyzed the crashworthiness of stiffened web girders using both experimental and numerical methods. It was stressed that the parameters of boundary conditions, weld joint modeling, and structural details influence the prediction of large plastic deformation and failure initiation. Calle, et al. [
10] and Yang and Wang [
11] conducted experimental and numerical studies to assess the crashworthiness of different marine structural components, considering plastic strain hardening and strain rate, and addressed their effect on the results’ accuracy. Prabowo, et al. [
12] assessed structural performance in a ship–container collision scenario. It was demonstrated that the impact speed significantly affected both damage distribution and energy absorption, and also that the most damage occurred at the contact area.
Liu, et al. [
5] proposed a conceptual design framework for evaluating the crashworthiness of double-hull ships during collision and grounding. Romanoff, et al. [
13] experimentally examined the crashworthiness of stiffened and web-core steel sandwich panels. It was found that stiffened panels offer high crashworthiness and energy with less sensitivity to variation in load. Furthermore, the boundary conditions significantly affect the deformation of the load and the structural capacity. Liu, et al. [
14] performed both experimental and numerical evaluation of the crashworthiness of inclined stiffened plates. It was observed that, as the impact angle decreases, the impact capacity decreases, and the likelihood of crack occurrence increases. Liu, et al. [
15] analyzed the crushing capacity and structural response of a cruciform as a part of a marine structre using numerical, analytical, and experimental methods.
Fhandy, et al. [
16] investigated the crashworthiness of stiffened panels subjected to quasi-static impact loading. The effect of different variables, such as mesh size and stiffener type/spacing, on the crashworthiness was considered. It was concluded that mesh size had a remarkable effect on the results and stiffeners; Single-L and Cross-Y offered higher energy absorption and deformation control than other types.
For dented marine and offshore structures, Saad-Eldeen, et al. [
17,
18,
19] assessed the ultimate compressive strength and ultimate bending capacity of steel plates and small-scale box girders with a local dent, taking into consideration different dent shapes, sizes, orientations, and directions. Based on extensive numerical analyses, a generalized expression for assessing the strength reduction was proposed.
This paper aims to numerically investigate the behavior of stiffened panels subjected to impact loads and to find out the best structural configurations for an original model with high crashworthiness and without a considerable increase in structure weight based on parametric study. This paper also aims to analyze the structural behavior of both the original and the proposed models considering prior mechanical dent damage located away from the hammer location.
2. Numerical Simulation of Stiffened Panel
A real simulation of the stiffened panel tested by Ali, et al. [
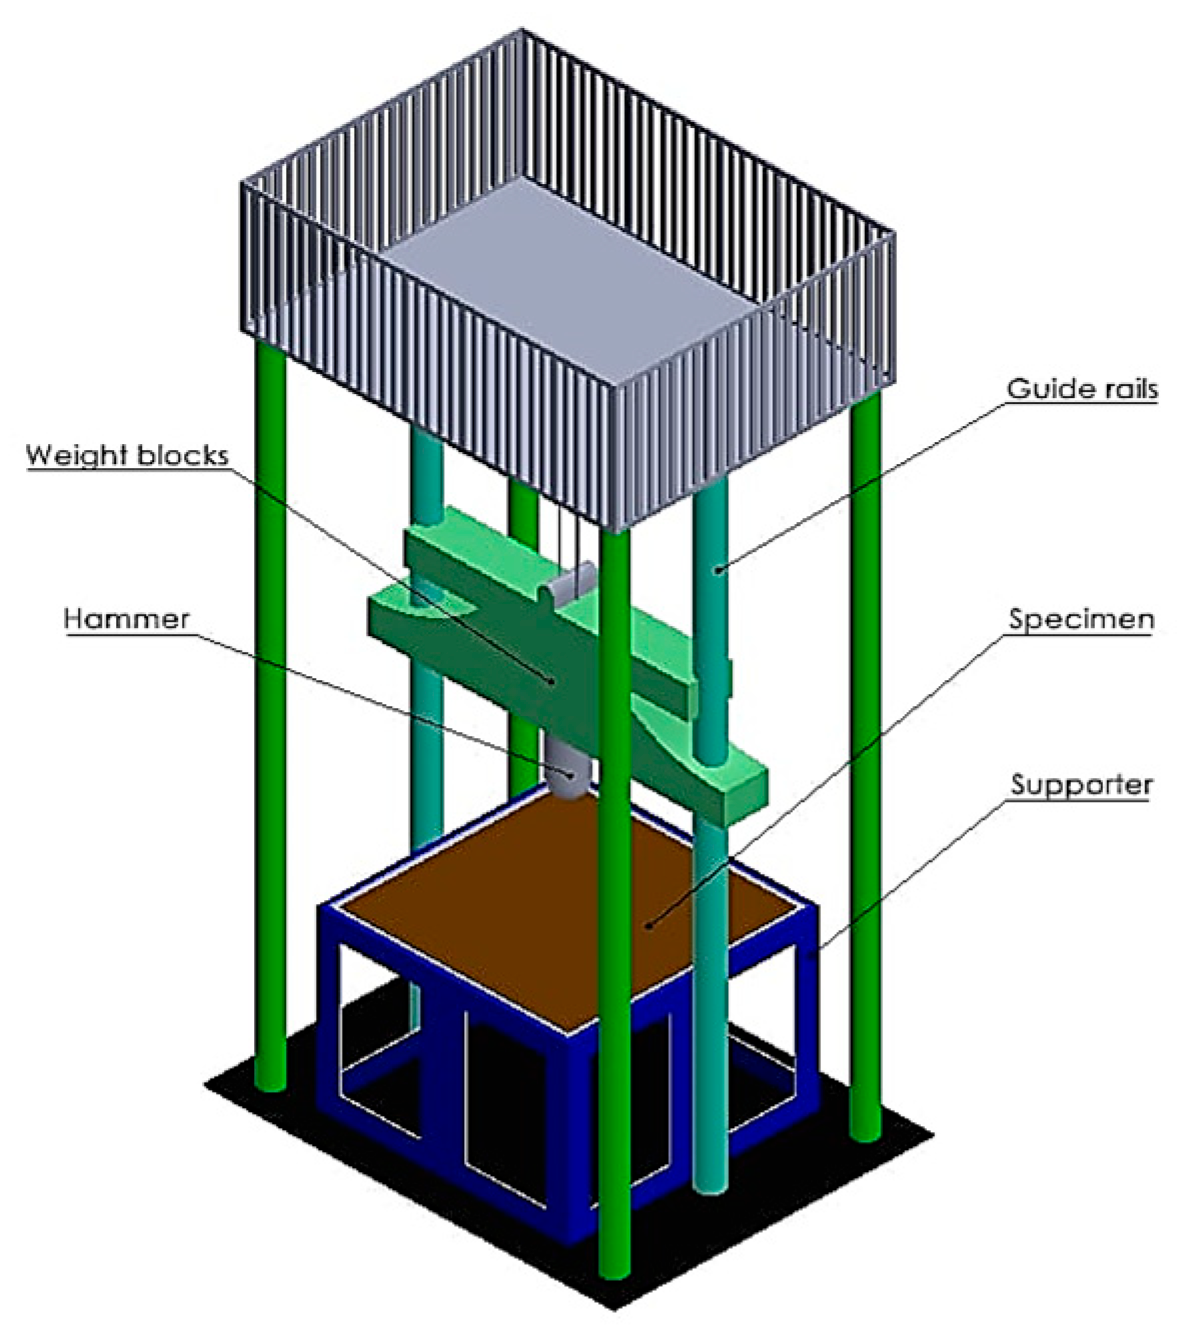
20] under impact load is performed, which is considered as the reference test for the current study. This panel represents a structural part of a deck, side, or outer bottom panel of a marine structure. The falling weight impact tester shown in
Figure 1 comprises a hemispherical hammer with a 150 mm diameter and a 1350 kg weight block, where the initial velocity of the drop hammer is 7.67 m/s (see
Figure 1). The stiffened panel specimen is bordered by a supporter which is attached directly to the ground foundation to ensure the overall rigidity of the impact system.
2.1. Steel Stiffened Panel (SP) Description
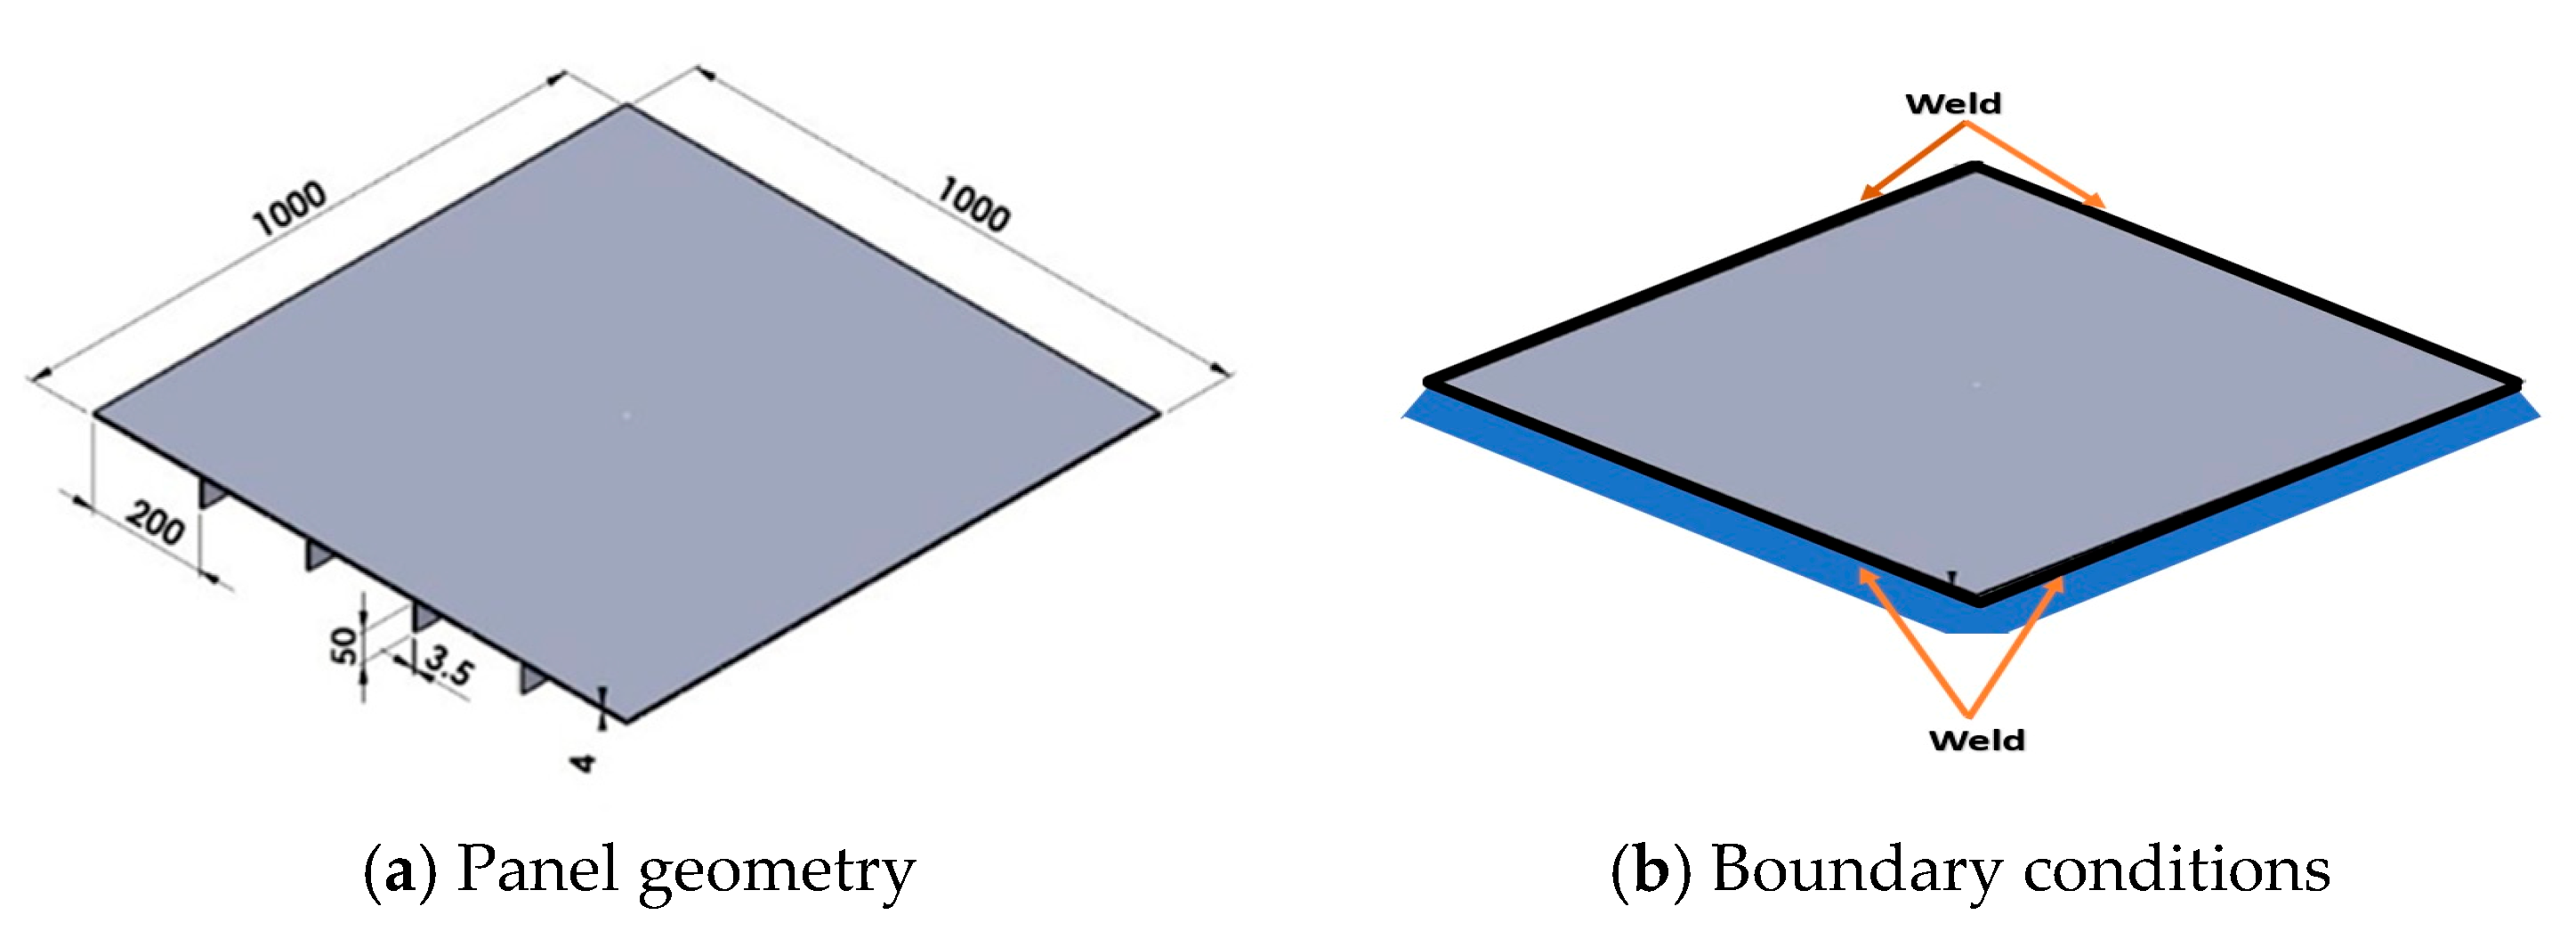
The tested panel is composed of base plating with a thickness t
p of 4 mm, equal length and breadth of 1000 mm, and attached flat bar stiffeners with web height h
w and thickness t
w of 50 mm and 3.5 mm, respectively, with reinforcement spacing of 200 mm, as shown in
Figure 2a. The stiffened panel is constructed from steel Q235, with material properties given in
Table 1. The four sides of the specimen are welded to the inner side of the supporter to simulate the real condition of global integrity of the system and to impose sufficient fixation; see
Figure 2b.
2.2. Finite Element Modeling and Analyses
A series of finite element analyses is performed to simulate the real test conditions of the stiffened panel shown in
Figure 1 and
Figure 2 and to build up a calibrated model based on experimental data.
2.2.1. Finite Element Model
The model is created using the commercial code ANSYS Workbench 2007 [
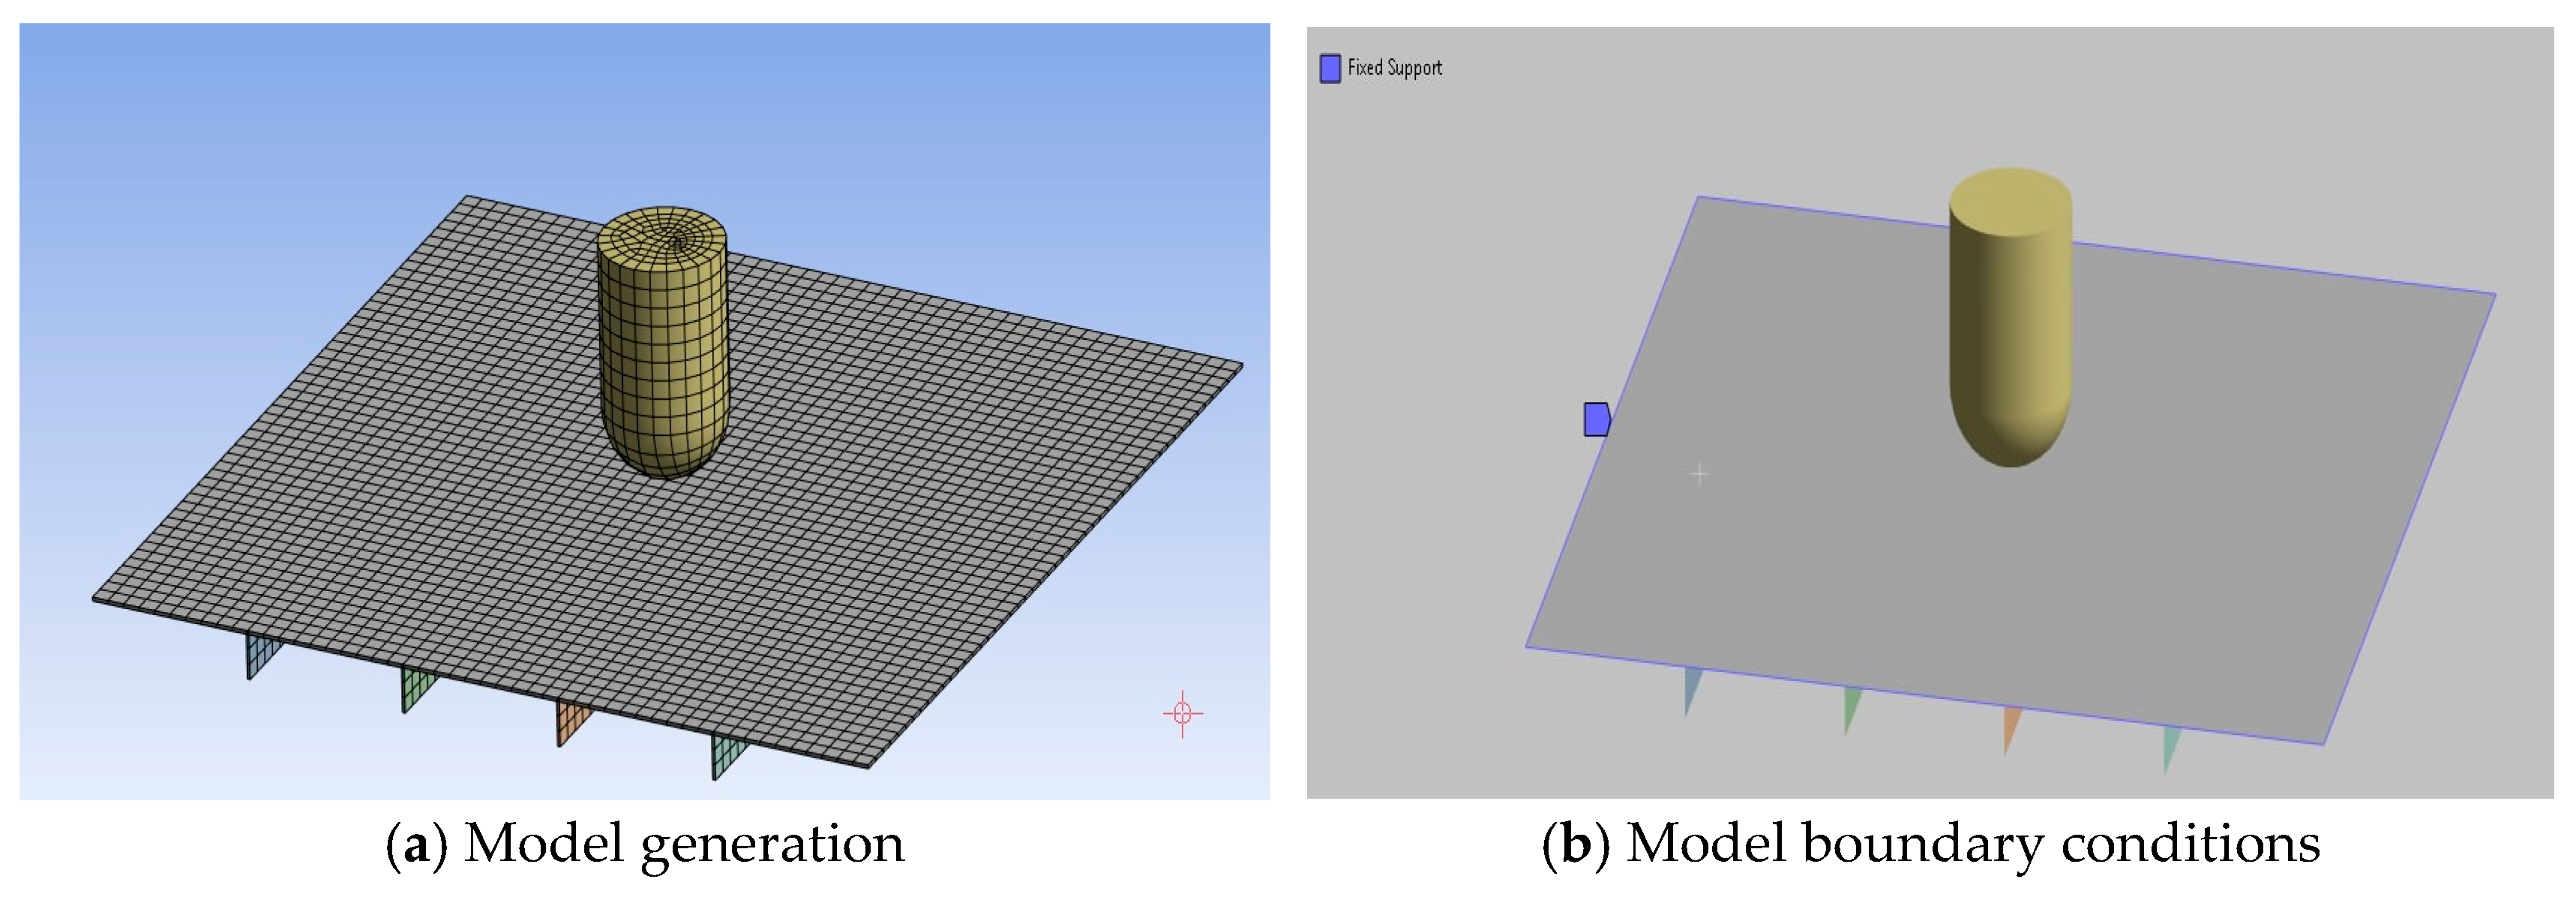
21], considering explicit dynamic analyses. The entire stiffened panel model is generated using a 4-node shell element (SHELL 163), see
Figure 3a, which supports both bending and membrane, with 12 degrees of freedom at each node: translations, accelerations, and velocities. For the drop hammer, solid element (SOLID 164) is used, which is defined by eight nodes. The entire finite element model is presented in
Figure 3b.
2.2.2. Material Model and Boundary Conditions
The material model is defined as linear isotropic elastic perfectly plastic with a yield stress, modulus of elasticity, and plastic strain at failure of 235 MPa, 210 GPa and 0.3, respectively. To simulate the real boundary conditions of the experiment, the four edges of the SP plating are totally fixed, without imposing constraints on the attached stiffeners; see
Figure 2. The path of the drop hammer is configured to act perpendicularly to the surface of the stiffened panel to ensure uniform contact and accurate penetration. Impact load is applied using the modelled hemispherical drop hammer of 150 mm diameter, with a falling speed of 7.67 m/s, which results in impact energy of up to 30.70 kJ.
The effect of welding on induced imperfections and residual stress is not included in the model. Different mesh sizes are considered to find out the best mesh density through a mesh convergence analysis. Based on the mesh analyses, it is observed that the results of the impact load as a function of the mesh density are almost constant without visible change for an element size of 5 mm and less for the stiffened panel; therefore the selected element size for the current analyses is 5 mm for better representation of the results and computational time, and 10 mm for the dropping hammer.
2.2.3. FE Model Calibration
A comparison between the experimental results of Ali, et al. [
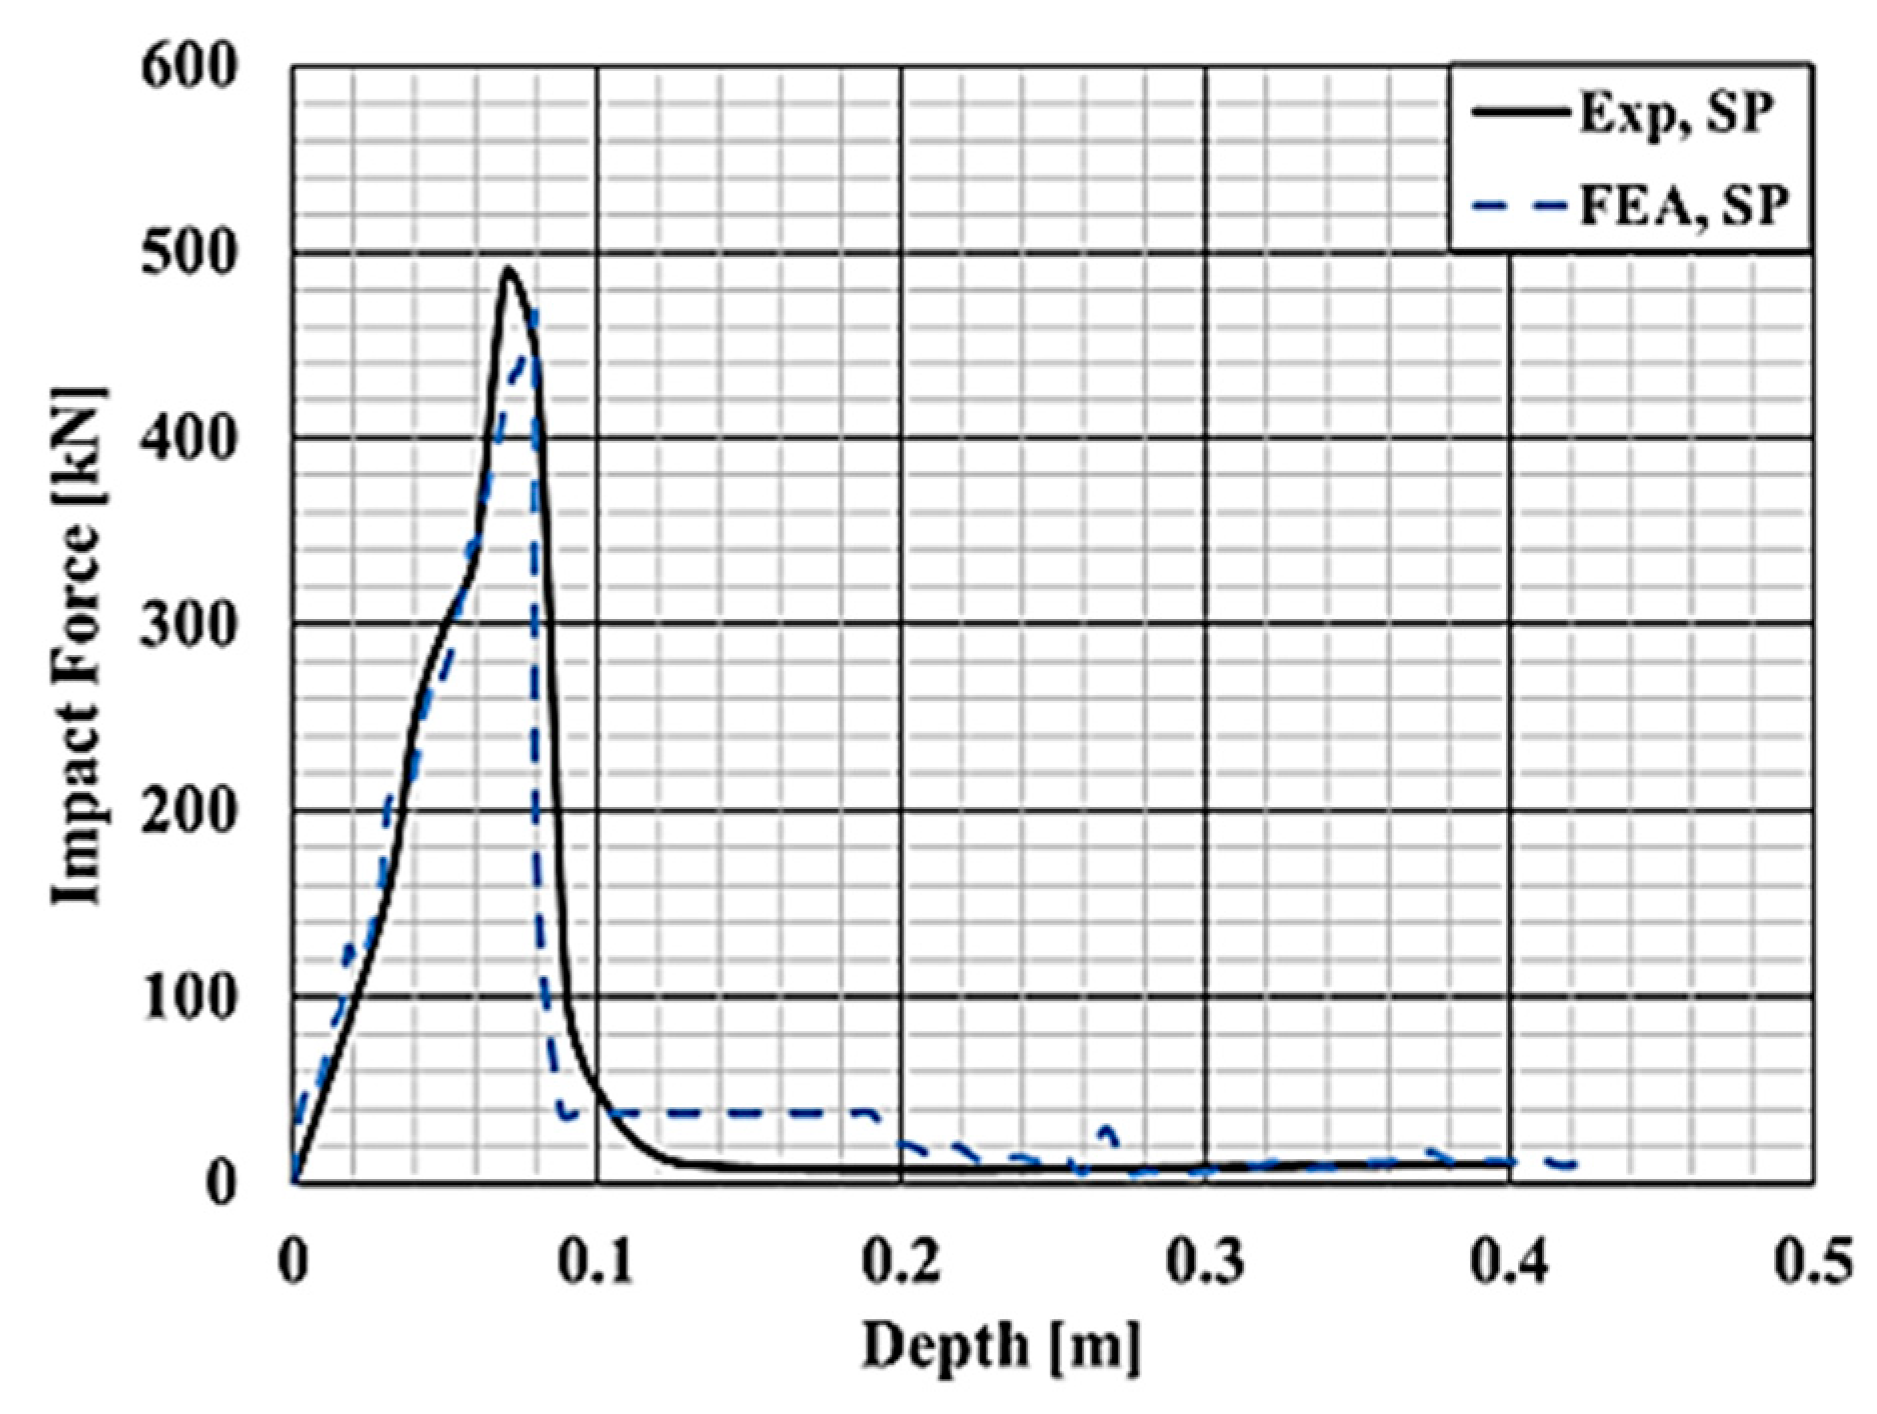
20] and the proposed finite element model is carried out for model calibration. The simulation results are presented in the form of a relationship between the impact force and the developed penetration depth, and also the deformed shape and the von Mises stress distribution, as presented in
Figure 4 and
Figure 5. It is obvious from
Figure 4 that the global trends of the FE model and the experimental one are similar, while the peak of the impact force resulting from the FE model is less than that of the experiment by 4.69%, with lag of occurrence. This peak lag, in addition to the higher penetration depth of the FE model, results in higher absorbed energy than the experiment by 10.09%, as shown in
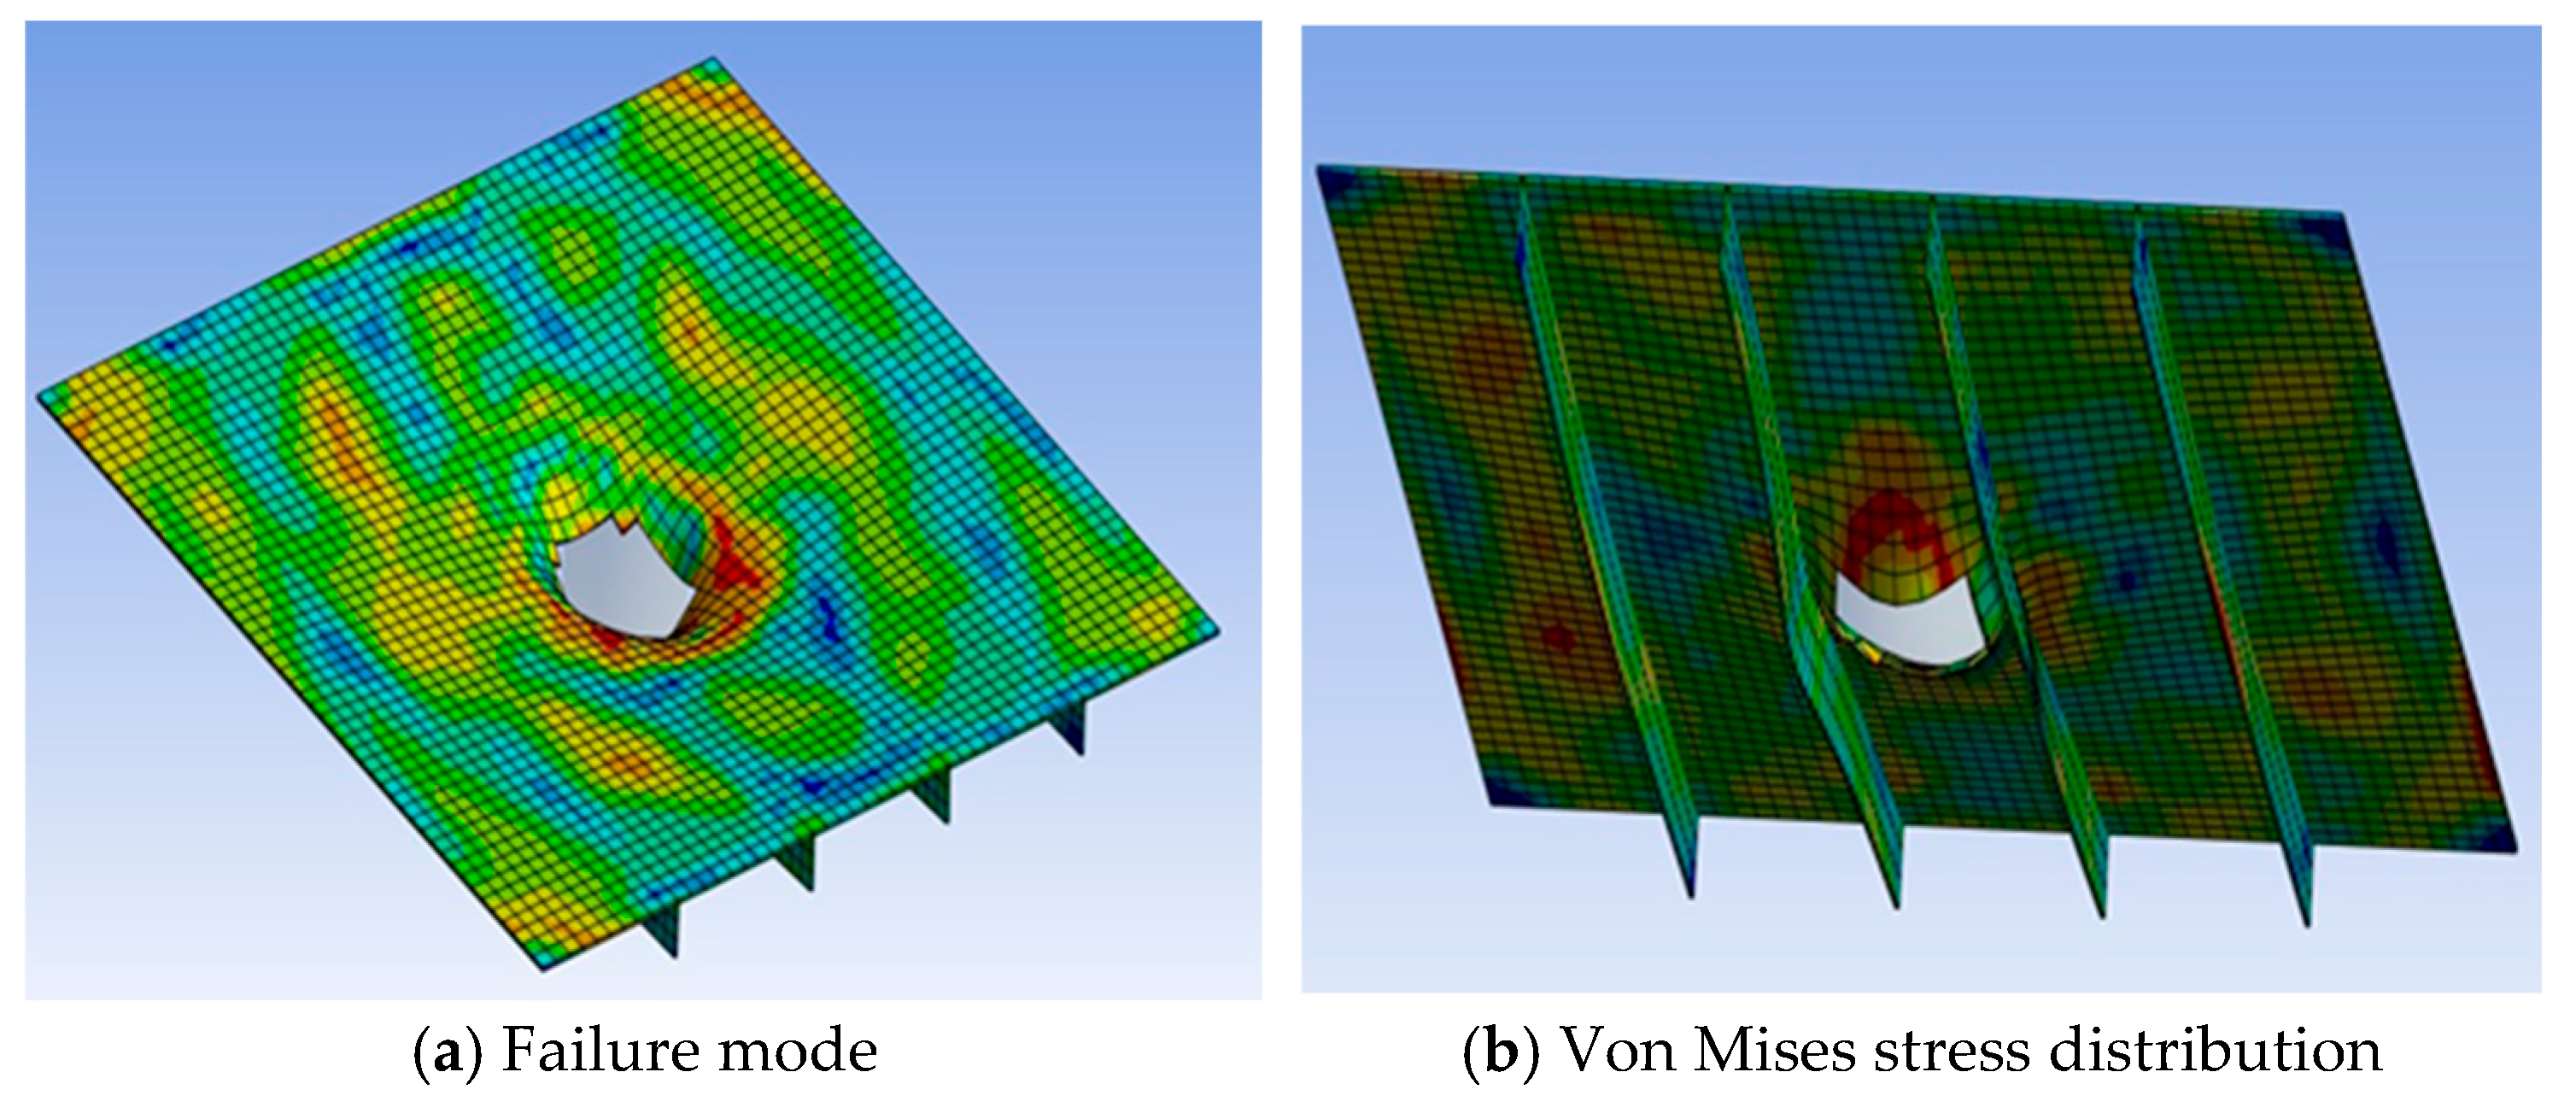
Table 2. From
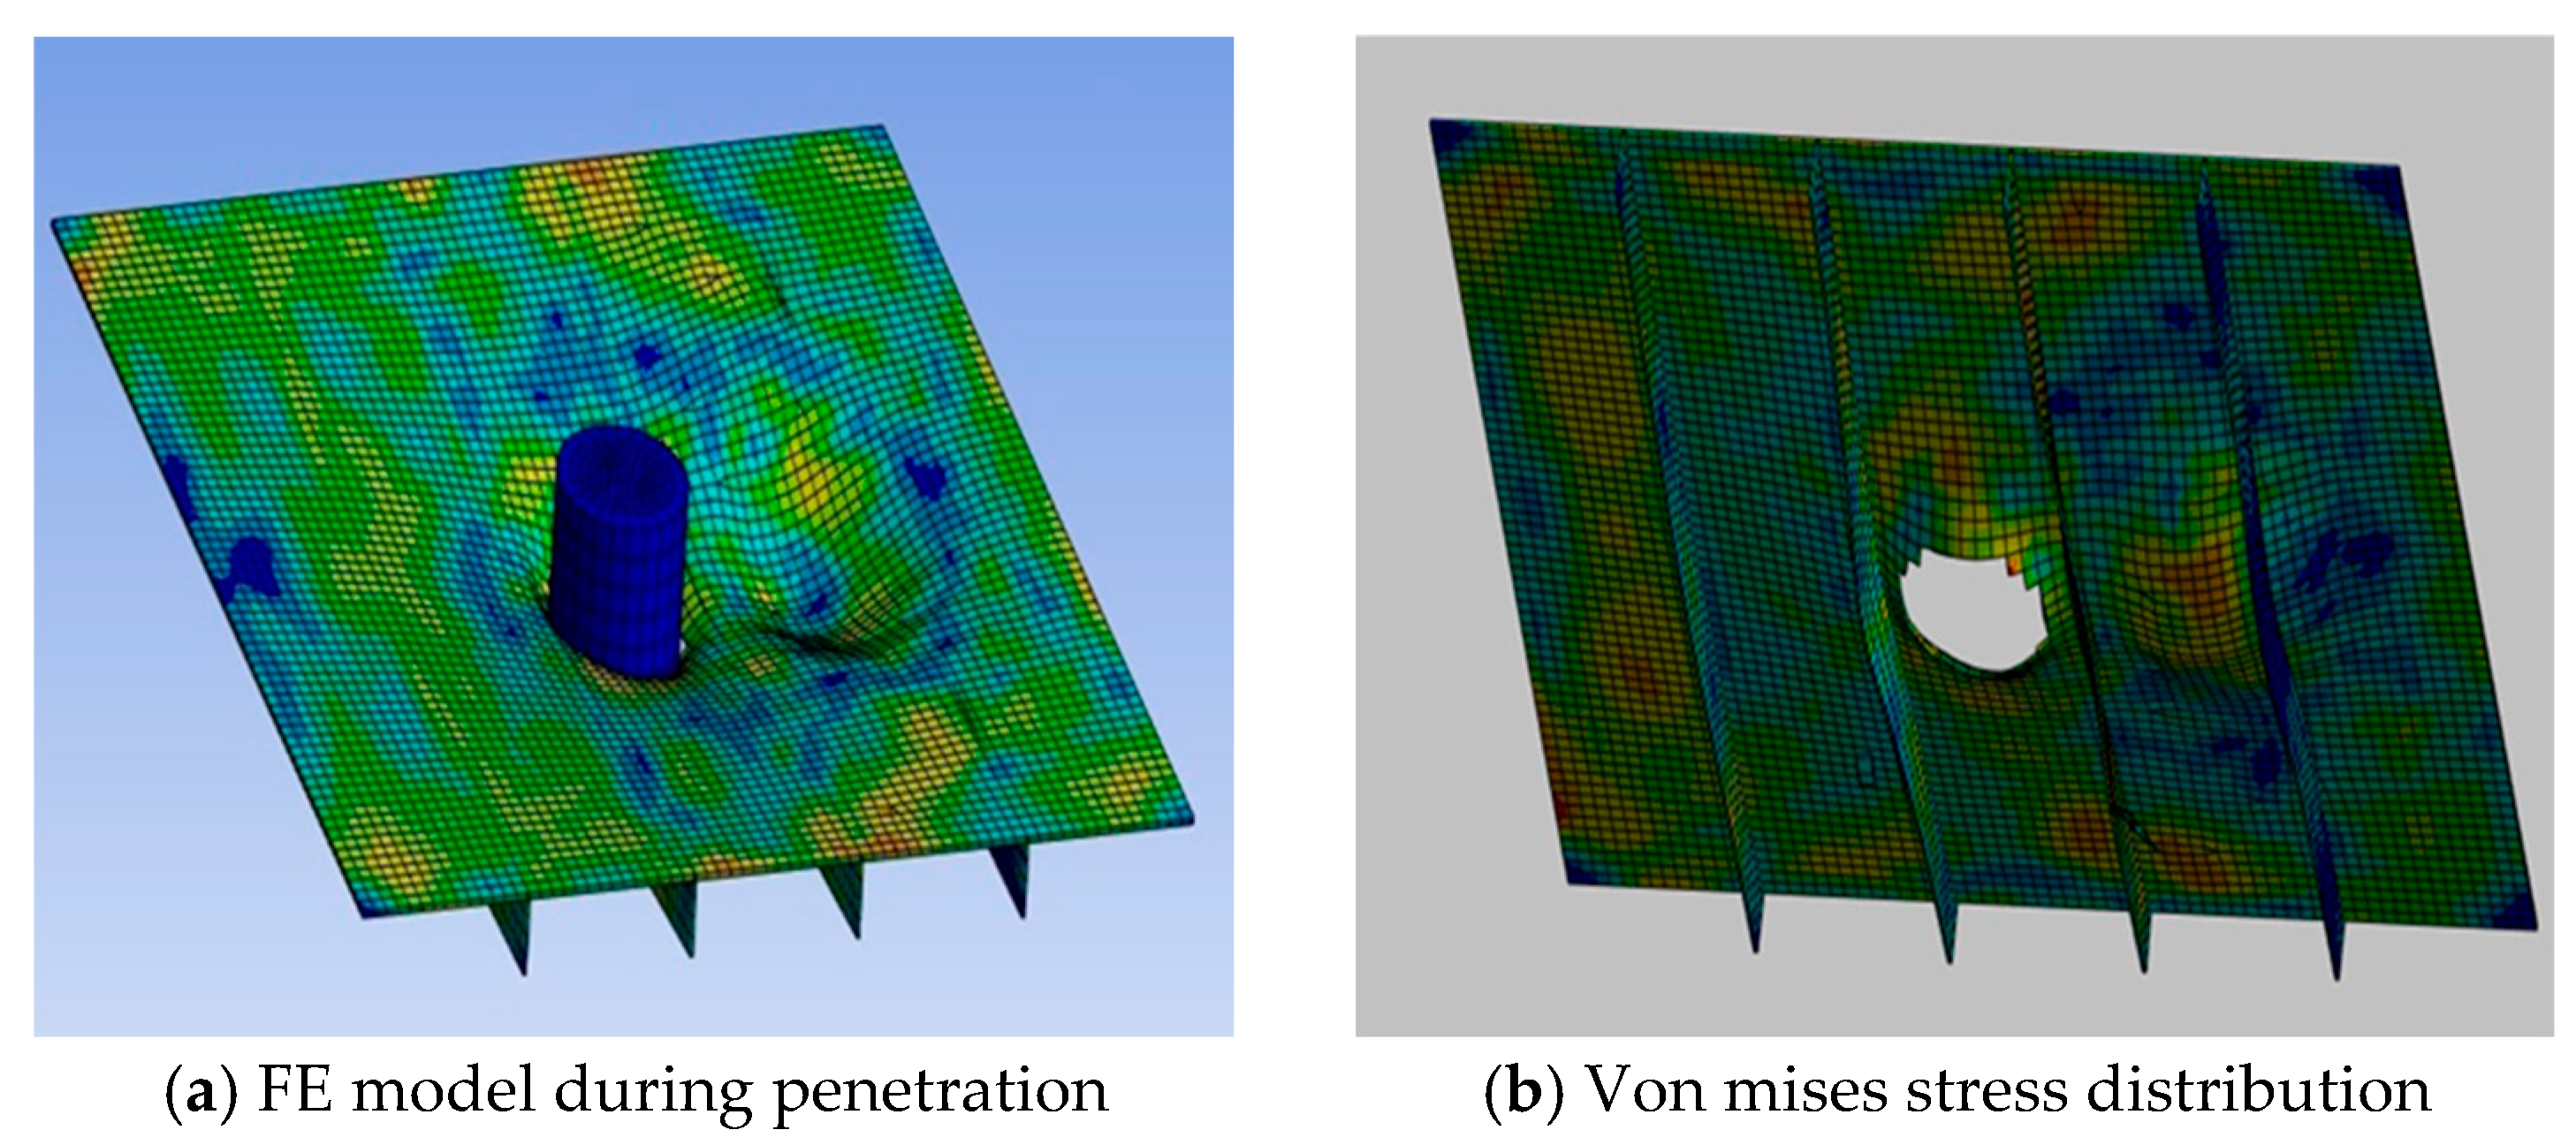
Figure 5, it is clear that the stiffened plane is fully penetrated by the hammer and that the rupture is petal-shaped, with visible lateral buckling of the adjacent stiffeners. Also, the von Mises stress distribution confirms the highly stressed locations within and near the penetrated area, with less effect of the impact on the far borders of either the plate or the stiffeners. This consistency further strengthens confidence in the accuracy of the FEM, supporting its reliability for use in present investigation.
3. Parametric Analyses
Based on the FE model calibration, a parametric analysis is performed to explore the effect of different design parameters of the stiffened panel, such as plating thickness, stiffener spacing, and stiffener profiles, on the crashworthiness characteristics. The geometrical configurations that offer the best crashworthiness without considerable increased weight are also explored.
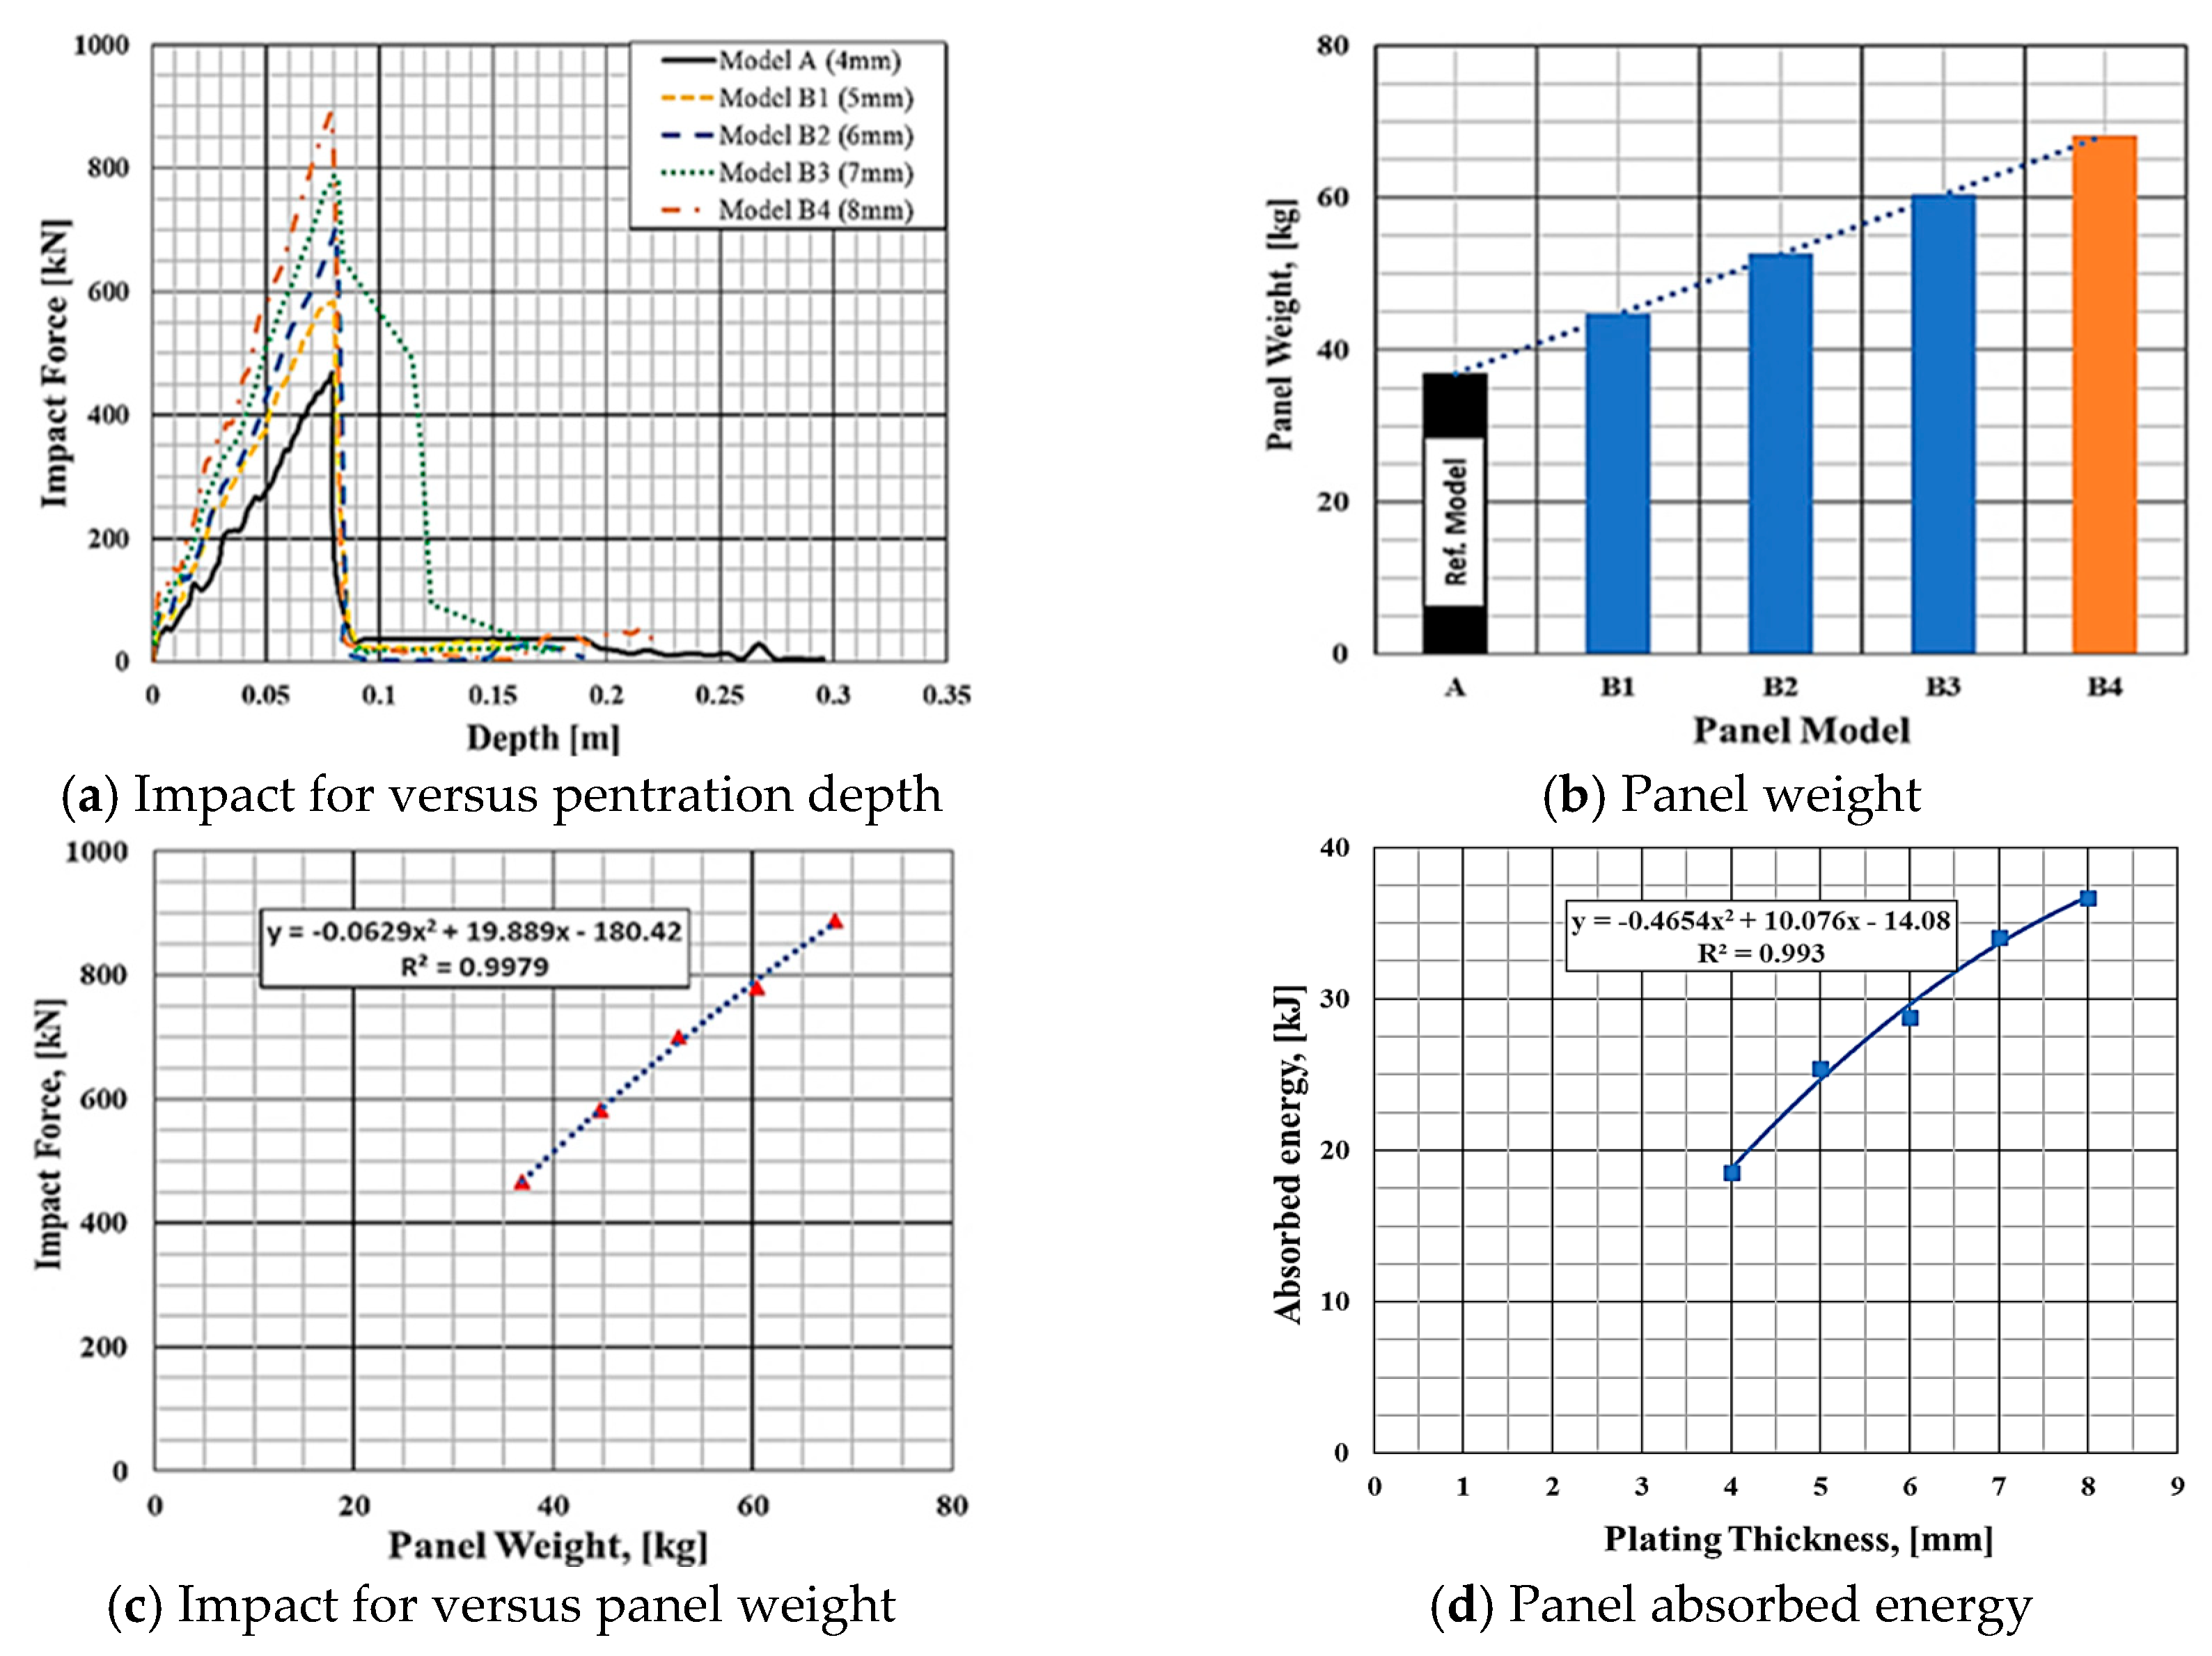
3.1. Group 1: Effect of Plating Thickness
In this group, the effect of changing the plating thickness will be analyzed, where the different plating thicknesses considered range from 4 mm, which relates to the original FE (model A), up to a plating thickness 8 mm with intervals of 1 mm, without changing the panel aspect ratio or stiffener geometric configurations, as tabulated in
Table 3. As may be seen
Figure 6a, as the plate thickness increases, the maximum impact force of the panel increases nonlinearly, with the impact capability increasing by 36.75% and 97.61% as the plate thickness increases to 5 mm (model B2) and 8 mm (model B4), respectively, with respect to the original model (A). This nonlinear increment may also be represented as a relationship between the panel weight for each model with respect to the corresponding impact force; see
Figure 6b,c.
Also, increasing the plating thickness has a slight influence on the penetration depth, with the penetration depth increasing for model (B1, B2, and B3) by an increase of 0.82%, 1.83%, and 2.08%, respectively, and decreasing only for model (B4) by 0.72%, with respect to the original model. Regarding the absorbed energy (see
Figure 6d), it is obvious that the trend between the plating thickness and the absorbed energy may be fitted to a nonlinear function, with increased absorbed energy as the plate thickness increases, with fitting criteria R
2 0.993.
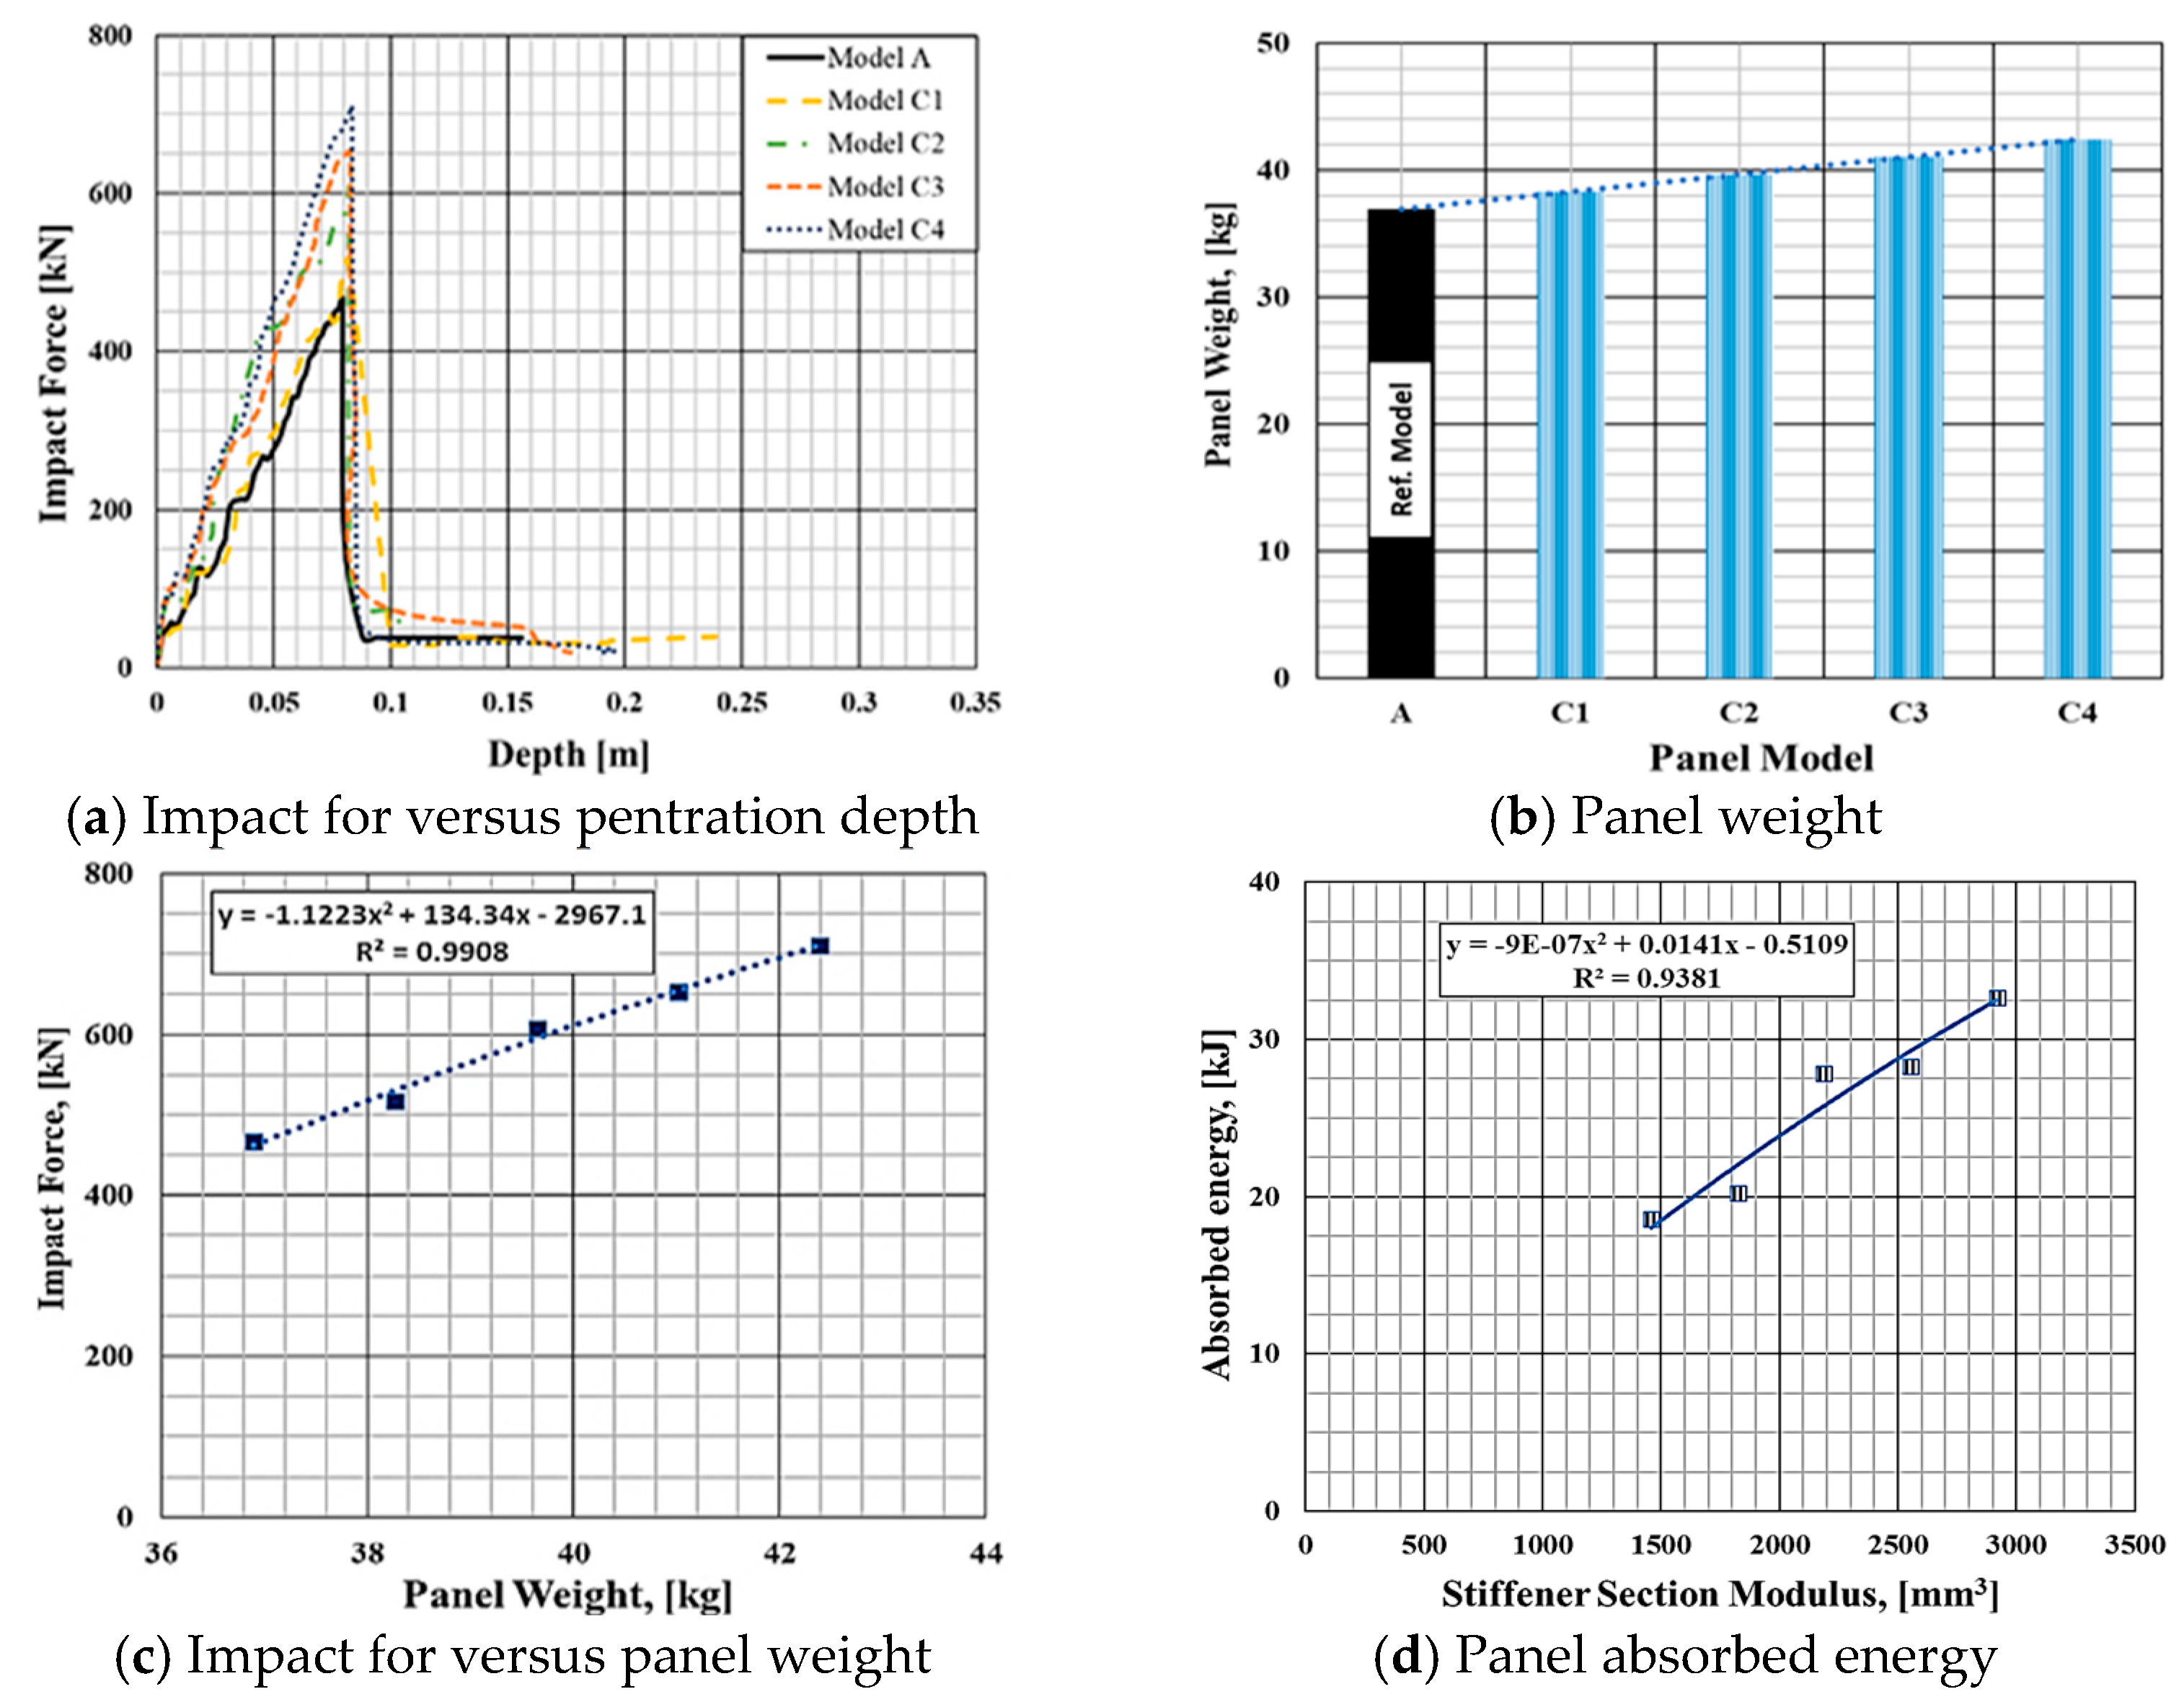
3.2. Group 2: Effect of Stiffener Section Modulus
The second group deals with the effect of increasing the stiffener section modulus on the impact force, where the stiffener thickness increases by the same percentage as the base plating thickness in Group 1, as tabulated in
Table 4. As may be seen from
Figure 7a–c, by increasing the reinforcement section modulus, the panel weight increases and, respectively, the corresponding impact force of the panel increases; for model (C1) and (C4), the capacity increases by 10.78% and 52.24%, for modulus increases of 25% and 100%, respectively. This indicates that the relationship between impact force, weight, and section modulus may be fitted to a nonlinear function.
Regarding the penetration depth, it may be noted that the depth increases as the capacity increases due to increased modulus, and the increments are also nonlinear. The relationship between impact capacity and penetration depth represents the envelope of the absorbed energy.
Figure 7d shows the relationship between the absorbed energy and reinforcement section modulus; it is obvious that, as the section modulus increases, the ability of the panel to withstand more force and develop higher penetration depth increases nonlinearly.
It has to be stressed that, in both groups 1 and 2, the only variable is the plating and reinforcement thickness (section modulus) and the effect of this change on both local and global behavior is different, as presented in
Figure 8. The trend in
Figure 8 indicates that, at the same panel weight, the impact force with respect to the increased stiffener thickness modulus (t
w) is higher than that for plating thickness (t
p) by 18.80%. This reveals that the impact capacity of such panel configurations is sensitive to the geometrical configuration of the reinforcement (t
w), rather than the plating thickness.
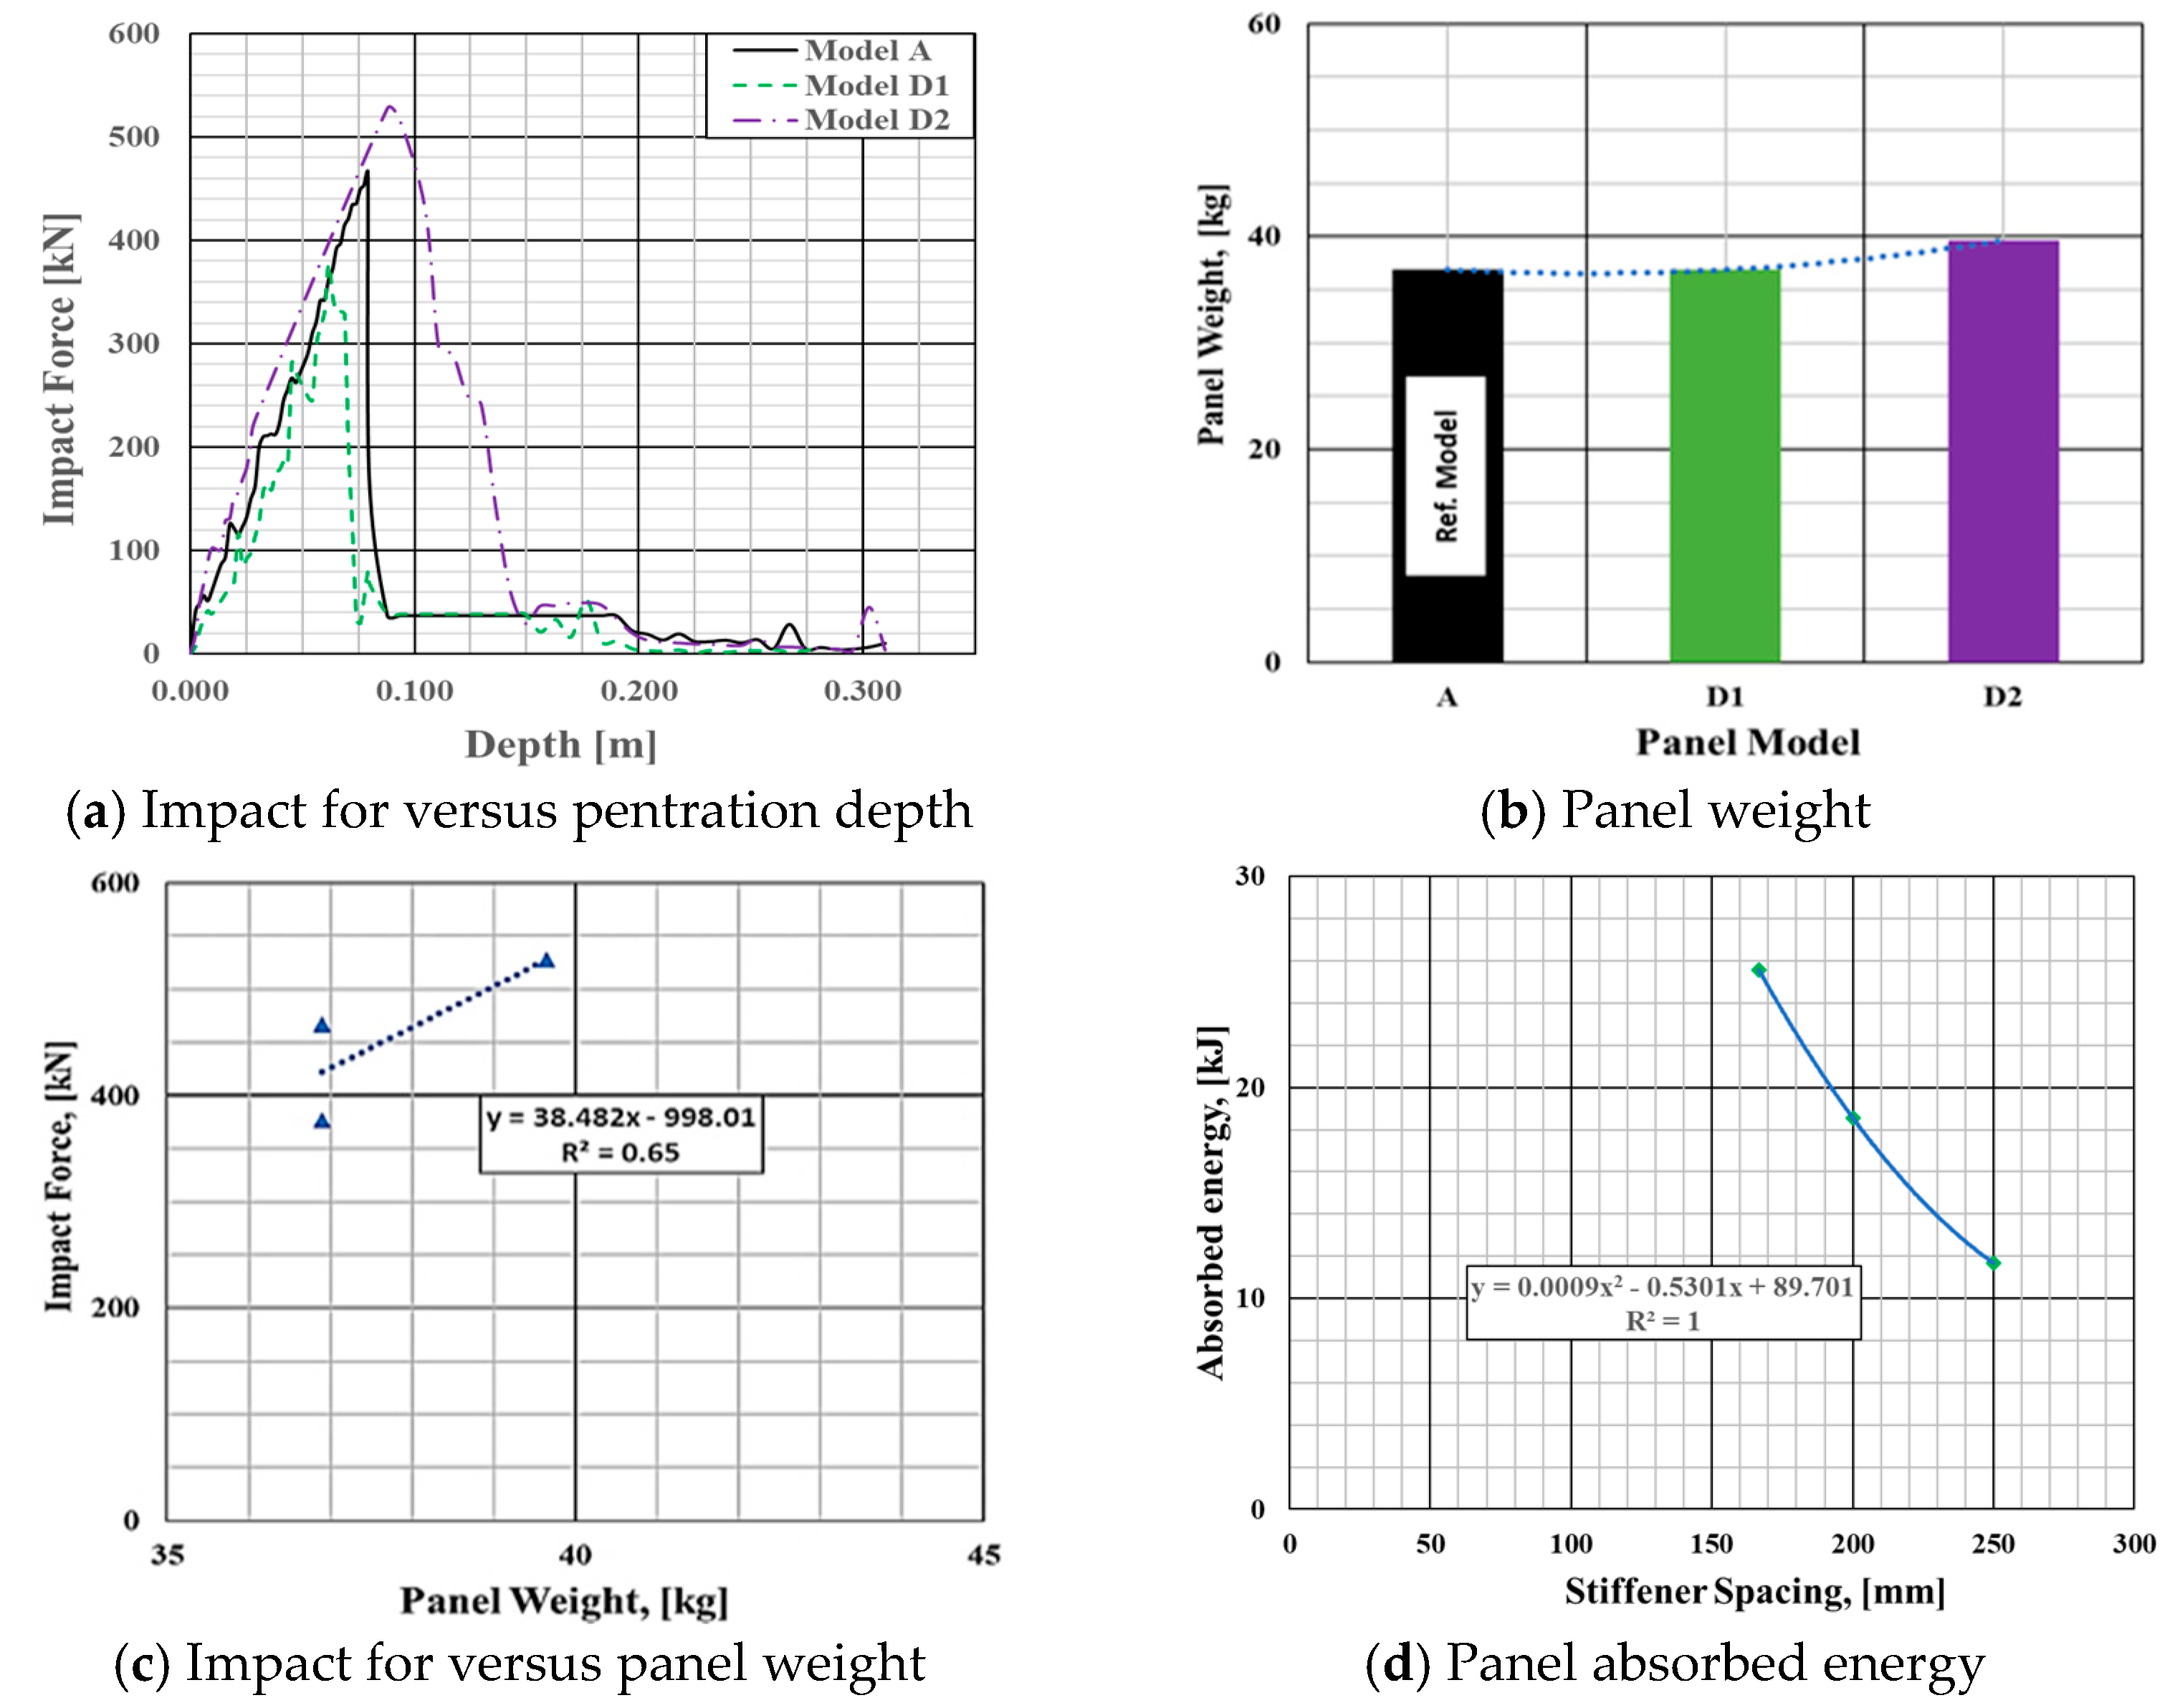
3.3. Group 3: Effect of Stiffener Spacing
In the third group, the base plating thickness is constant at 4 mm (model A), while the stiffener spacing is variable. Two spacings are analyzed, as follows: 250 mm for model (D1) and 166.67 mm for model (D2), considering that the location below the hammer is unstiffened; thus, the spacing between the two stiffeners around the hammer is to be the stiffener spacing, as given in
Table 5. The distribution of the stiffeners for models (D1 and D2) is presented in
Figure 9. For model (D1), there are four stiffeners, which is the same as for model (A), see
Figure 9a, but the spacing between the stiffeners increases from 200 mm to 250 mm, from the panel center. This wide space decreases the impact capacity of the panel by 19.90%, with respect to model (A), while the panel weight is constant, as presented in
Figure 10a,b, and decreases the penetration depth by 22.09%.
For the other model (D2), the space between the stiffener decreases to 166.67 mm, resulting in an increased stiffener number from four for model (A) to six for model (D2), see
Figure 9b; consequently, the weight of the panel increases (see
Figure 10b). The effect of this spacing decrement directly increases the panel impact capacity by 13.06% and the penetration depth by 10.94%, with respect to model (A), as may be seen from
Figure 10a,b, while the panel weight increases by 7.45%; see
Figure 10c.
Figure 10d presents the relationship between stiffener spacing and the absorbed energy, and it is clear that, when the spacing decreases by 16.7%, the number of stiffeners increases, the panel weight increases, and the corresponding absorbed energy increases nonlinearly by 37.79%. On the other hand, when the spacing increases by 25%, with respect to the original spacing, keeping the number of stiffeners and the weight constant, the absorbed energy decreases by 37.12%.
3.4. Group 4: Effect of Stiffener Profile
In the fourth set of panels, the variable is the profile’s cross-sectional shape. To facilitate comparison, the dimensions of alternative cross-sectional shapes were determined to uphold an identical section modulus to that of the initial flat bar model (A).
Table 6 indicates the geometrical configurations of the alternative profiles (L and T) for model (E1) and model (E2), respectively (see
Figure 11); these configurations reveal a decrement in the panel weight by 4.17%.
The relationship between the depth of the penetration and the impact capacity for different stiffener profiles is presented in
Figure 12a. It is noticeable that the impact capacity increases by 4.84% and 9.58%, respectively, for the L profile for model (E1) and T profile for model (E2), and that the penetration depth consequently increases by 24.04% and 32.65%, regardless of the constant weight decrement (
Figure 12b,c). The bar chart presented in
Figure 12d exhibits the increment of panel absorbed energy as the stiffener profile changes from flat bar to L model (E1) and T model (E2), keeping section modules constant. Based on the parametric analyses performed, a plot for weight, impact force, and energy absorbed with respect to the original model (A) is presented in
Figure 13. To select the best model characteristics that offer the best crashworthiness without considerable increased weight, a decision criterion is proposed based on two parameters, on the condition that the panel’s weight is less than, equal to, or greater than that of the original panel by only 5%. The two parameters are the specific energy absorption (SEA) and weight efficiency index (WEI), which are defined in Equations (1) and (2), and are widely used, as mentioned by Yin, et al. [
22] and Sistani, et al. [
23].
Based on the defined criteria, the output is defined in
Table 7, where 0 denotes fail and 1 denotes pass panel configurations. It is obvious that only three panels’ models pass the proposed criteria, which may be ordered as follows: Model E2, E1, and C1, from higher to lower acceptance.
4. Impact Assessment of Dented Stiffened Panel
To cover complex realistic scenarios during operation, pre-existing mechanical damage consisting of a specified dent is applied to the intact panel, to check the survivability of the proposed model with respect to the intact one. These pre-dented panels introduce an additional layer of complexity, as the initial deformation alters the structural integrity, load-bearing capacity, and energy absorption characteristics.
The analysis involves subjecting a pre-dented panel to impact conditions identical to those applied to model (A) (see
Figure 2 and
Figure 3), and the finite element model for the dented panel is presented in
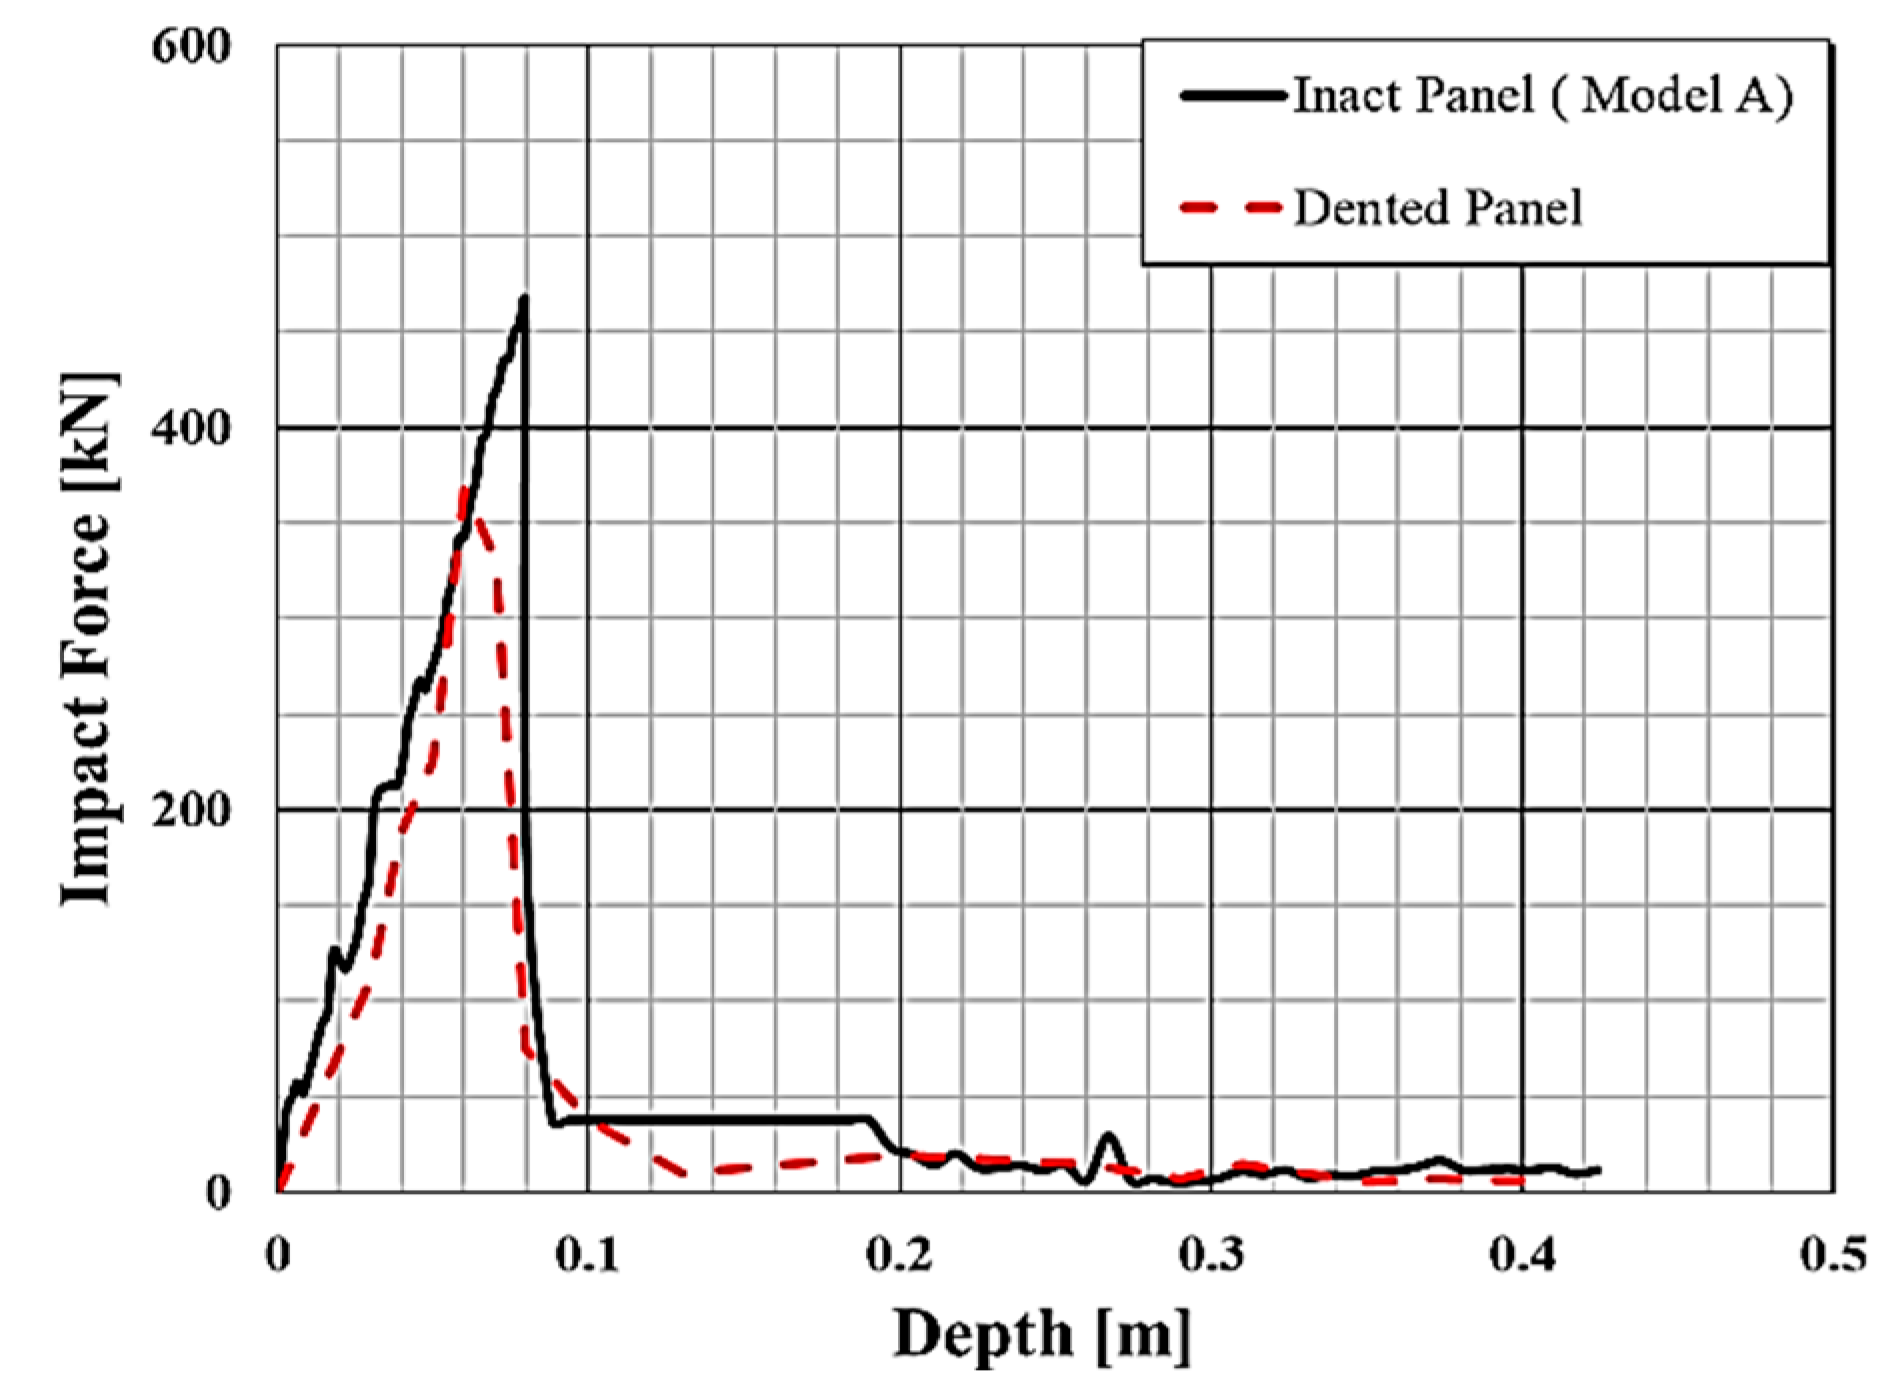
Figure 14, with specified dent configurations. The dent location is selected to be away from the panel center and hammer acting point for better assessment of its effect on the panel’s impact capacity. The relationship between the impact force and penetration depth is presented in
Figure 15. It is evident that the impact force experienced by the pre-dented panel is less than that of the intact panel, model A, by 21.24%. It is important to state that, when the pre-existing dent is closer to the location of the hammer, the impact capacity of the panel decreases rapidly. This may be represented by lower penetration depth as well as absorbed energy, compared to the intact panel, of 24.05% and 55.71%, respectively.
Comparing the structural response, it is evident that the von Mises stress distribution is different in the intact model presented in
Figure 5b, and the dented panel in
Figure 16b, where the stress gradient around the penetration is less in the case of dentation and the nearest stiffeners to the dent location are also under less stress than those of the intact one.
The next step is to apply the same dent configurations to the selected panels according to the proposed criteria for best panel configurations according to
Figure 13 and
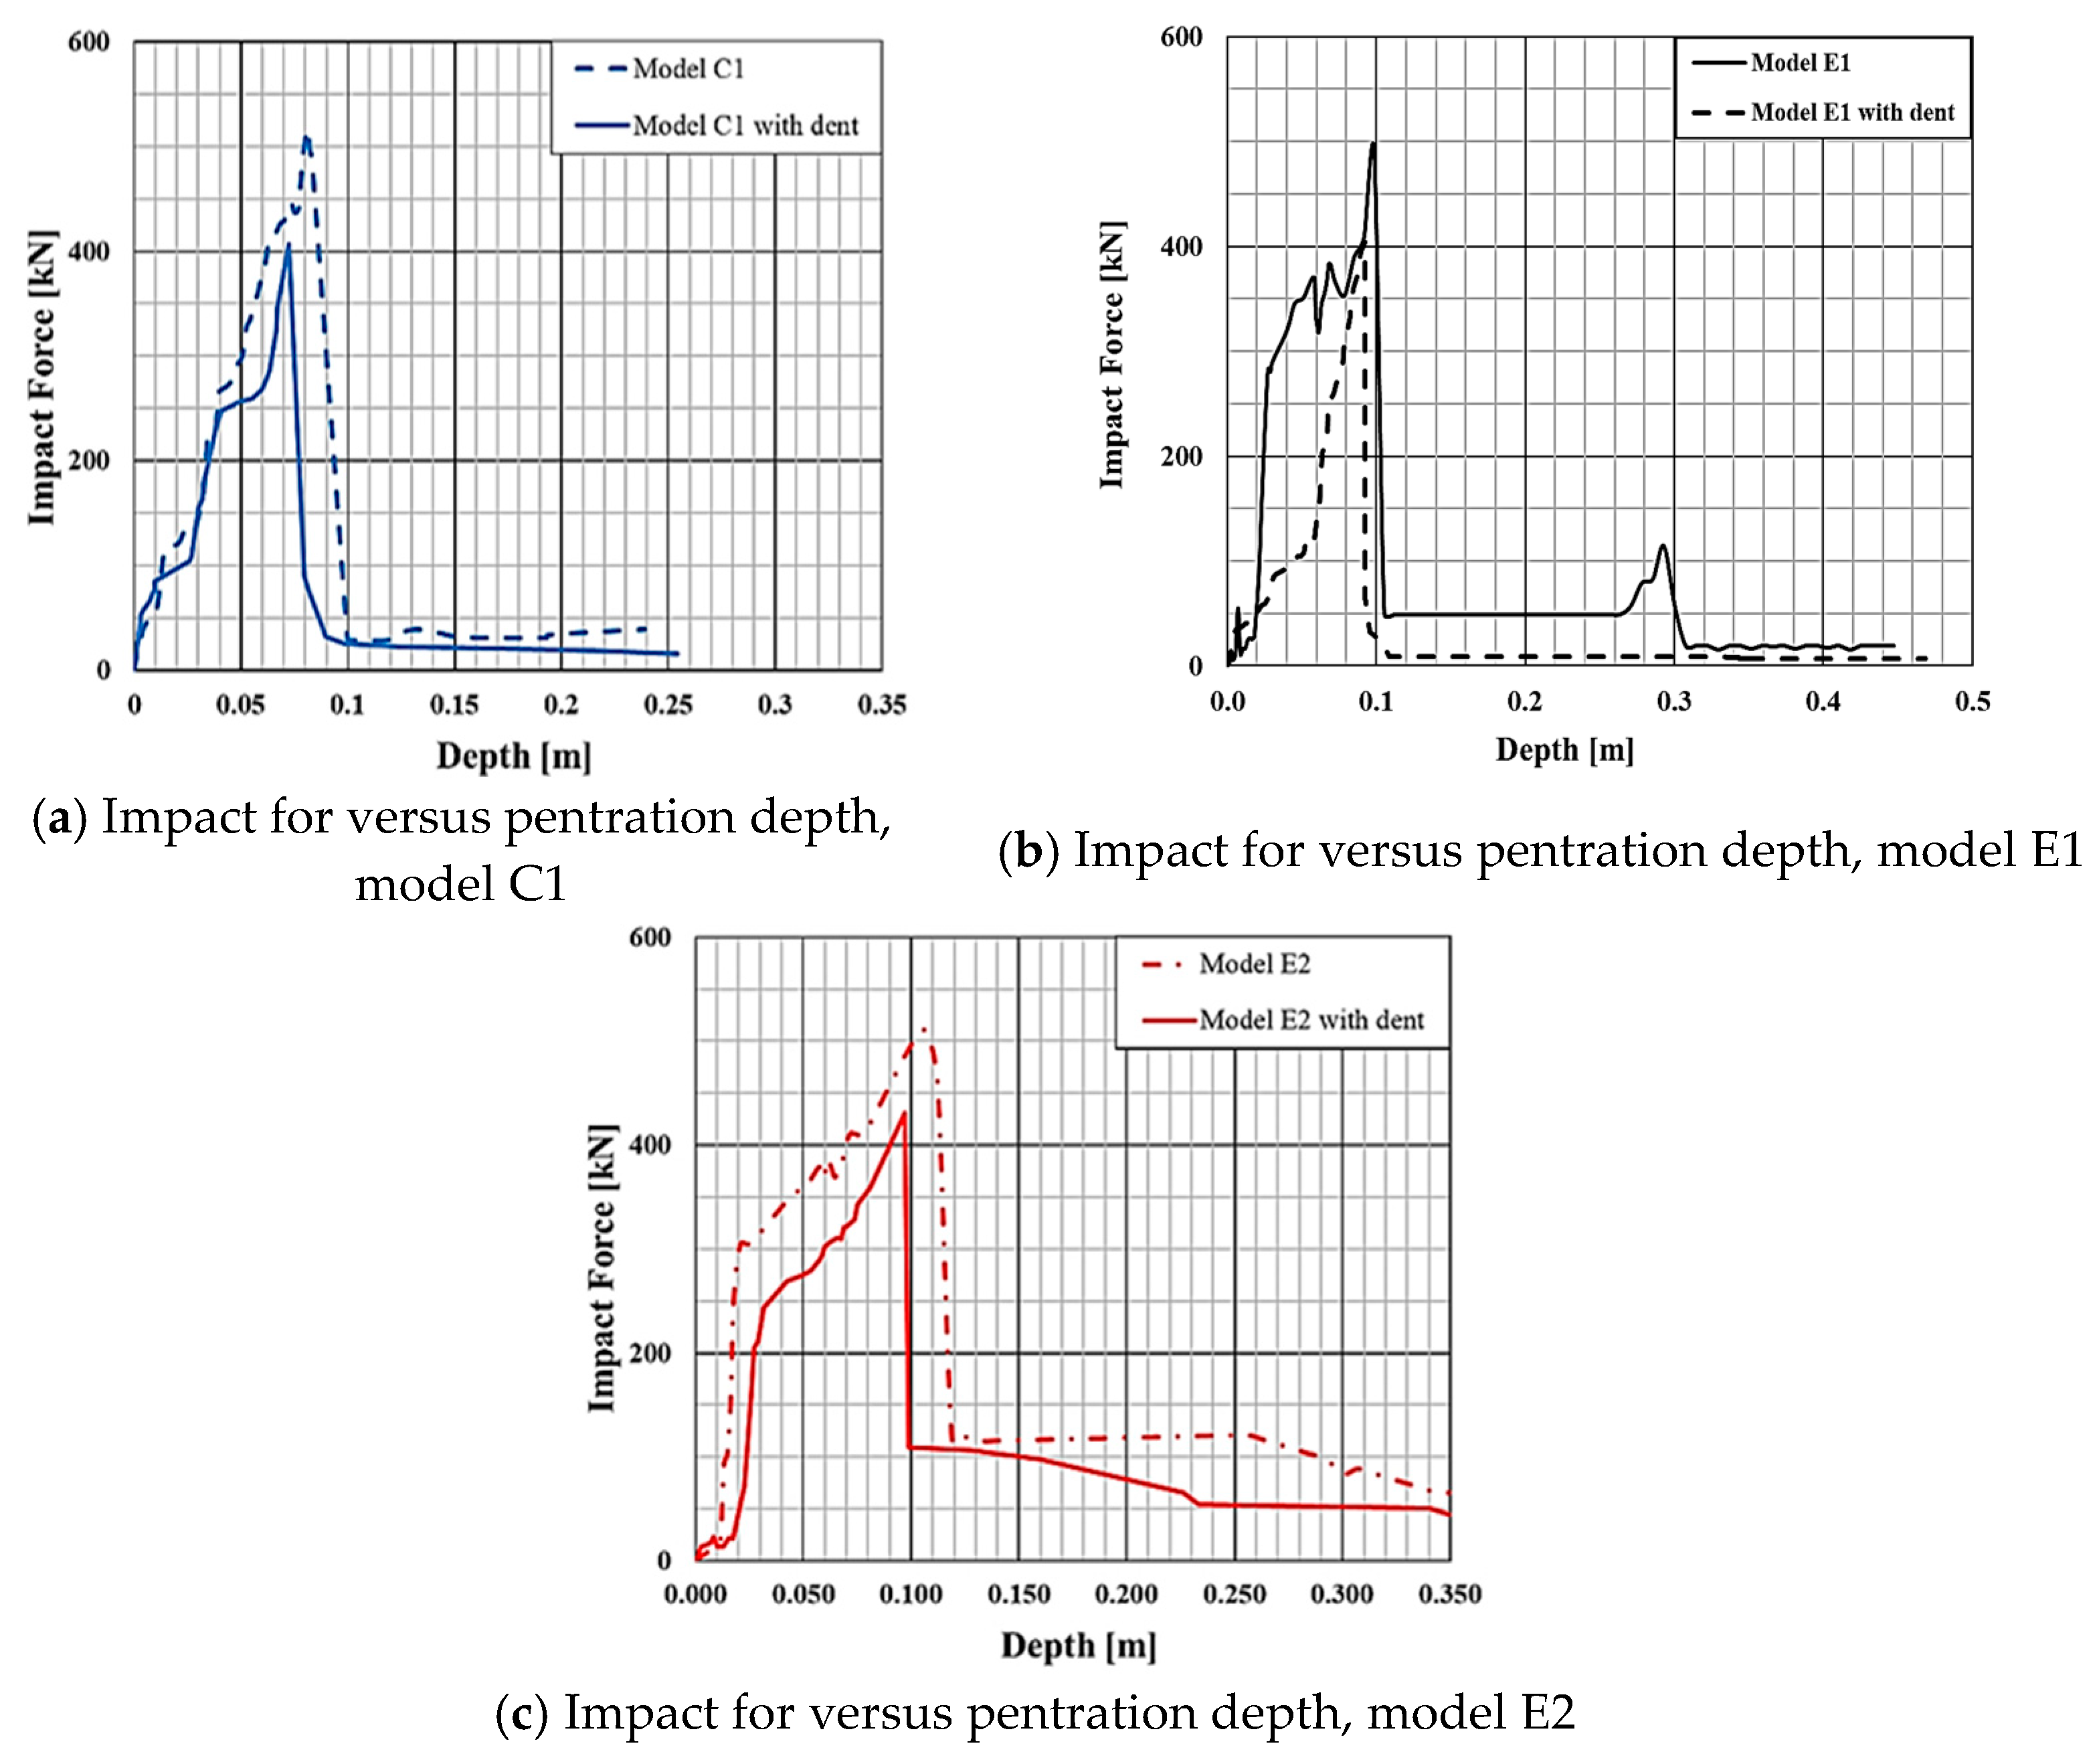
Table 7, to compare the effect of a prior dent on the new selected panels. To accurately replicate the behavior of a pre-dented stiffened panel under impact loading, FEM was constructed for models C1, E1, and E2 using predefined parameters. The FE simulation outcomes, such as penetration depth versus impact force for the three models, are presented in
Figure 17. As may be seen from
Figure 17a, in model C1, the impact capacity and the penetration depth decreased by 21.32% and 10.87%, respectively, due to the existence of the dent. Consequently, the total absorbed energy offered by the panel decreases by 31.78%.
Model E1 represents the panel with stiffener profile (L), see
Figure 17b, for which the panel with a dent withstands impact force and penetration depth less than the intact model of the same stiffener profile, with 17.41% and 6.38 %, respectively. For model E2, with the same dent size and location, the capability of the panel to withstand impact force decreases by 15.73% and penetration depth by 7.85%, which directly affects the absorbed energy, for which a reduction of 33.70% occurs; see
Figure 17c. This decrease highlights the substantial effect that prior deformation has on the structural performance and energy absorption capacity of the panel. The von Mises stress distribution for the three panels with a dent is presented in
Figure 18. It is clear that the stress gradient around the penetrated part is different and that the most highly stressed panel is the one with increased stiffener section modulus model C1, while with the least stress is model E2 with T stiffener profile.
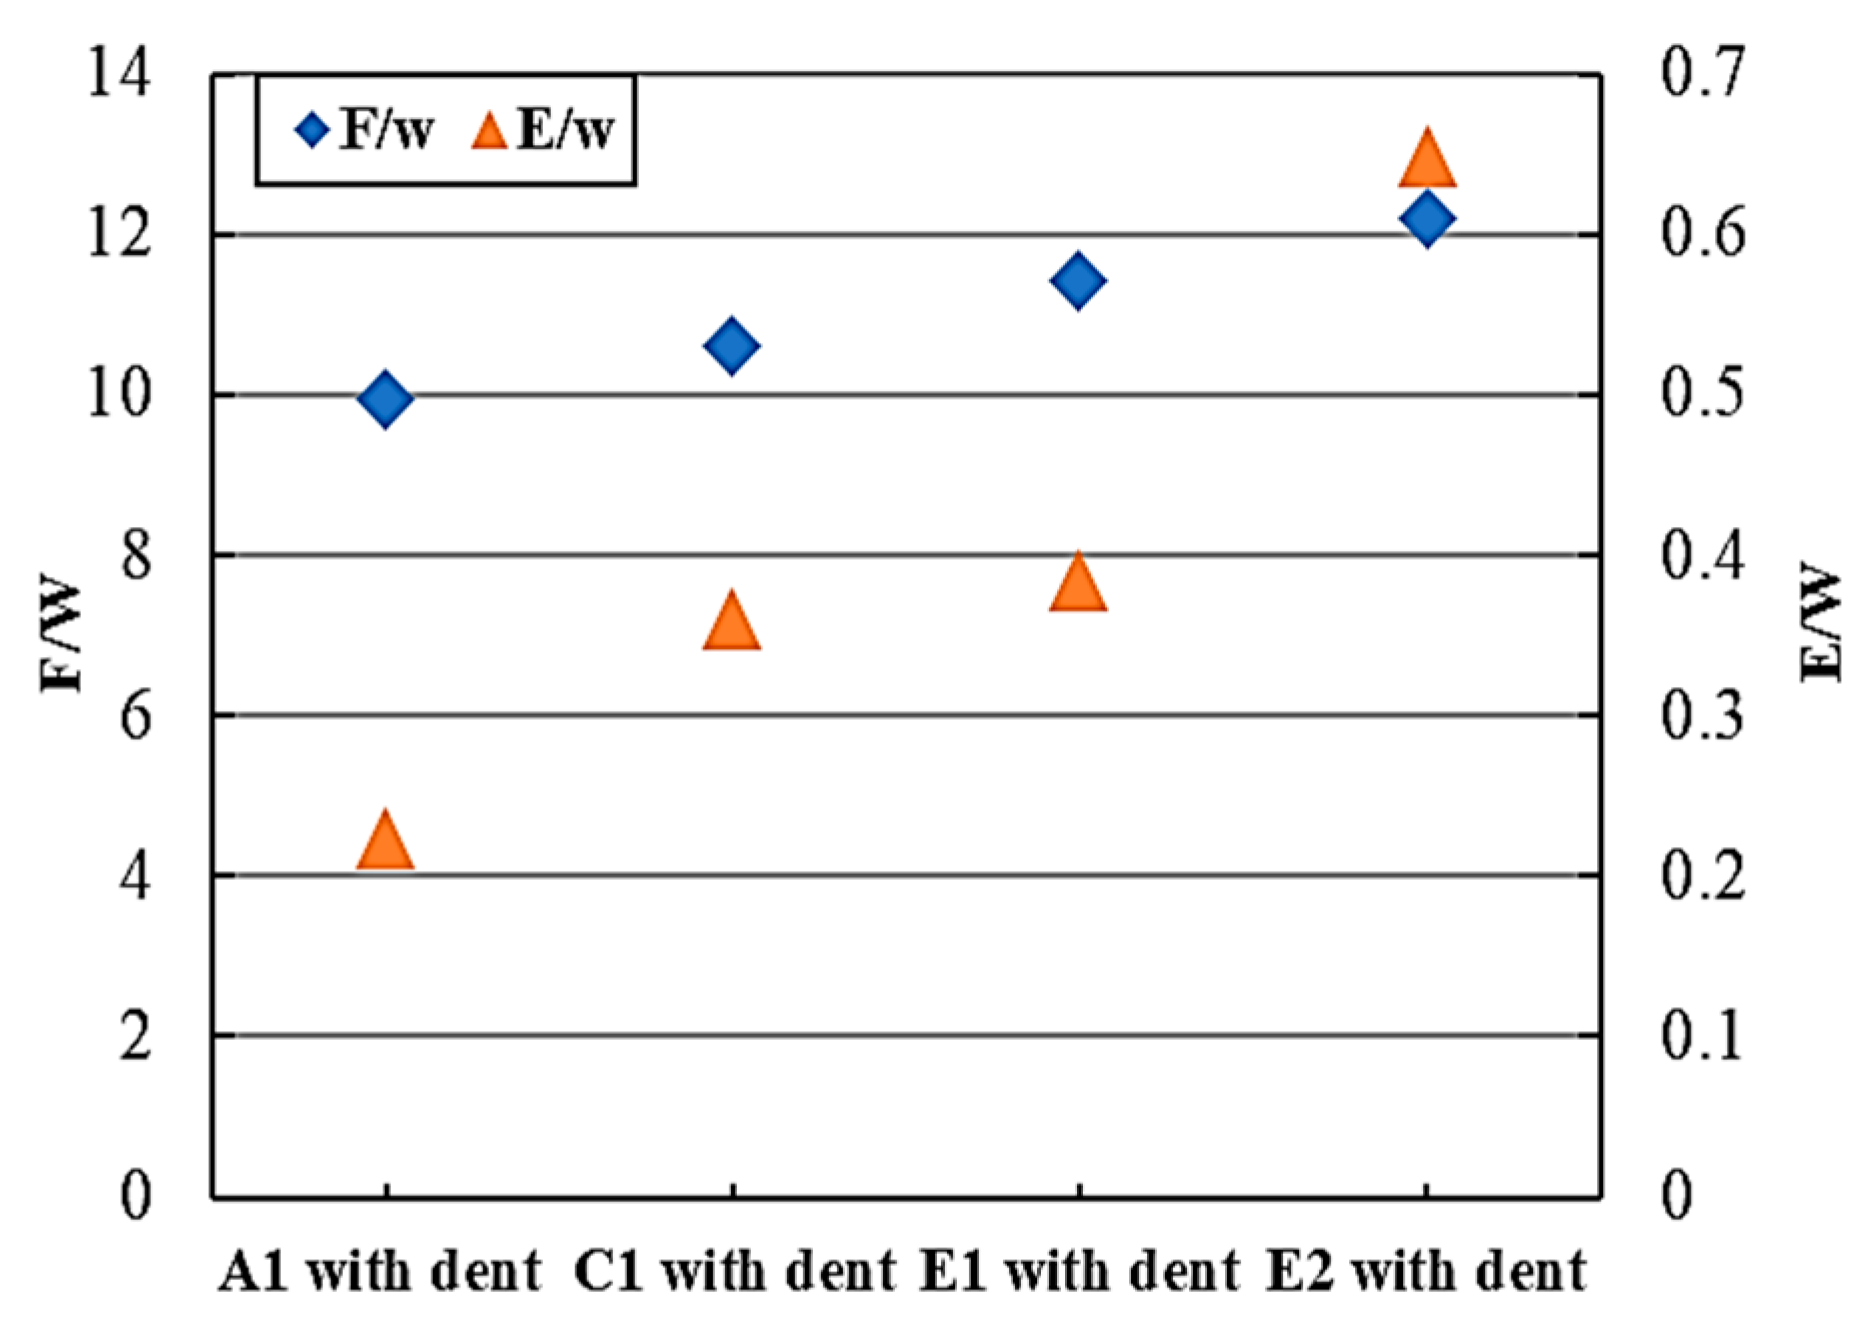
Figure 19 presents a plot for both SEA and WEI parameters for the three dented panels. It is evident that the effect of a prior dent on the panel capacity as well as the absorbed energy with respect to the panel weight may be ordered from higher acceptance to lower acceptance as model E2, model E1, and model C1, respectively.
Therefore, it may be concluded that the best crashworthiness in both the intact and prior-damage conditions is offered by the panel with stiffeners of T profile, which satisfy the same section modulus as the flat bar ones, and also that increasing the section modulus of the flat bar (web thickness) significantly affects the absorbed energy without a considerable effect on the panel, which is contrary to increasing the base plating thickness. These observations emphasize the importance of considering the variation of geometry responses and initial damage in crashworthiness assessment to enhance the accuracy of predictive models.
5. Conclusions
A series of numerical impact simulations are performed for a stiffened panel, where the master model is calibrated based on published experimental results. Parametric analysis is performed to find out the best panel configurations which offer high crashworthiness without a considerable effect on the panel weight. Based on the performed analysis, the following conclusions are stated:
The developed FEM serves as a versatile design tool applicable to various geometric configurations for the stiffened panel, usable for a range of distinct applications.
By increasing the plate thickness, the maximum impact force of the panel increases nonlinearly.
Changing plating thickness has a slight influence on penetration depth and a remarkable effect on the panel weight.
As the stiffener spacing increases with constant panel weight, a significant reduction of both impact force and energy occurs.
The impact capacity of the panel is sensitive to the geometrical configurations of the reinforcement (tw), rather than the plating thickness.
A decision-making criterion is developed based on specific energy absorption (SEA) and weight efficiency index (WEI) for selecting the best panel configurations.
The proposed criteria reveal that the best models for offering higher intact crashworthiness with less considerable weight increment may be ordered from higher to lower acceptance as follows: model (E2, E1) for stiffener profile and C1 for stiffener section modulus.
Both impact force and energy reduction highlight the substantial effect that a prior dent has on the structural performance of the panel.
It is important to state that, when the pre-existing dent is closer to the location of the hammer, the impact capacity of the panel decreases rapidly.
Considering prior dent damage, the best crashworthiness is offered by the panel with stiffener profile T, followed by profile L, and finally the panel with increased stiffener section modulus.
Author Contributions
Conceptualisation, S.A.E., H.S.E.-K., S.S.-E., and E.F.; methodology, S.A.E., H.S.E.-K., and S.S.-E.; validation, S.A.E., H.S.E.-K., and S.S.-E.; formal analysis, S.A.E. and S.S.-E.; writing—original draft preparation, S.A.E. and S.S.-E.; writing—review and editing, S.A.E., H.S.E.-K., S.S.-E., and E.F. All authors have read and agreed to the published version of the manuscript.
Funding
This research received no external funding.
Data Availability Statement
The data presented in this study are available within the article.
Conflicts of Interest
The authors declare no conflicts of interest. The funders had no role in the design of the study; collection, analyses, or interpretation of data; writing of the manuscript; or decision to publish the results.
References
- Ellinas, C.P.; Valsgard, S. Collisions and Damage of Offshore Structures: A State-of-the-Art. J. Energy Resour. Technol. 1985, 107, 297–314. [Google Scholar] [CrossRef]
- Jones, N. A Literature Survey on the Collision and Grounding Protection of Ships; Ship Research Institute of Norway: Trondheim, Norway, 1979. [Google Scholar]
- Samuelides, E.; Frieze, P.A. Fluid-structure interaction in ship collisions. Mar. Struct. 1989, 2, 65–88. [Google Scholar] [CrossRef]
- Samuelides, M.S.; Voudouris, G.; Toulios, M.; Amdahl, J.; Dow, R. Simulation of the behaviour of double bottoms subjected to grounding actions. In Proceedings of the Fourth International Conference on Collision and Grounding of Ships, Hamburg, Germany, 9–12 September 2007. [Google Scholar]
- Liu, B.; Villavicencio, R.; Pedersen, P.T.; Soares, C.G. Analysis of structural crashworthiness of double-hull ships in collision and grounding. Mar. Struct. 2021, 76, 102898. [Google Scholar] [CrossRef]
- Alsos, H.S.; Amdahl, A. On the resistance to penetration of stiffened plates, Part I–Experiments. Int. J. Impact Eng. 2009, 36, 799–807. [Google Scholar] [CrossRef]
- Cho, S.R.; Lee, H.S. Experimental and analytical investigations on the response of stiffened plates subjected to lateral collisions. Mar. Struct. 2009, 22, 84–95. [Google Scholar] [CrossRef]
- Villavicencio, R.; Soares, C.G. Numerical modelling of laterally impacted plates reinforced by free and end connected stiffeners. Eng. Struct. 2012, 44, 46–62. [Google Scholar] [CrossRef]
- Liu, B.; Soares, C.G. Experimental and numerical analysis of the crushing behaviour of stiffened web girders. Int. J. Impact Eng. 2016, 88, 22–38. [Google Scholar] [CrossRef]
- Calle, M.A.G.; Oshiro, R.E.; Alves, M. Ship collision and grounding: Scaled experiments and numerical analysis. Int. J. Impact Eng. 2017, 103, 195–210. [Google Scholar] [CrossRef]
- Yang, L.; Wang, D.Y. Experimental and numerical investigation on the response of stiffened panels subjected to lateral impact considering material failure criteria. Ocean. Eng. 2019, 184, 193–205. [Google Scholar] [CrossRef]
- Prabowo, A.R.; Laksono, F.B.; Sohn, J.M. Investigation of structural performance subjected to impact loading using finite element approach: Case of ship-container collision. Curved Layer. Struct. 2020, 7, 17–28. [Google Scholar] [CrossRef]
- Romanoff, J.; Kõrgesaar, M.; Lehto, P.; Berntsson, K.; Remes, H. Experimental Investigations on Stiffened and Web-core Sandwich Panels Made for Steel under Quasi-Static Penetration. Procedia Struct. Integr. 2022, 37, 17–24. [Google Scholar] [CrossRef]
- Liu, F.; Hu, Y.; Feng, G.; Li, C. Experimental and numerical study on the penetration of the inclined stiffened plate. Ocean. Eng. 2022, 258, 111792. [Google Scholar] [CrossRef]
- Liu, H.; Liu, K.; Wang, X.; Gao, Z.; Wang, J. On the Resistance of Cruciform Structures during Ship Collision and Grounding. J. Mar. Sci. Eng. 2023, 11, 459. [Google Scholar] [CrossRef]
- Fhandy, B.A.; Prabowo, A.R.; Tuswan, T.; Zubaydi, A.; Smaradhana, D.F.; Baek, S.J.; Fitri, S.N. Crashworthiness behaviour of the stiffened panel in idealized penetration test: A developed stiffening configuration against impact loading. Brodogradnja 2025, 76, 76205. [Google Scholar]
- Saad-Eldeen, S.; Garbatov, Y.; Soares, C.G. Ultimate strength analysis of highly damaged plates. Mar. Struct. 2016, 45, 63–85. [Google Scholar] [CrossRef]
- Saad-Eldeen, S.; Garbatov, Y.; Soares, C.G. Strength assessment of steel plates subjected to compressive load and dent deformation. Struct. Infrastruct. Eng. 2016, 12, 995–1011. [Google Scholar] [CrossRef]
- Saad-Eldeen, S.; Garbatov, Y.; Soares, C.G. Structural capacity of an aging box girder accounting for the presence of a dent. In Analysis and Design of Marine Structures; Soares, C.G., Shenoi, R.A., Eds.; Taylor & Francis Group: London, UK, 2015; Volume 1, pp. 403–414. [Google Scholar]
- Ali, T.; Peng, Y.; Jinhao, Z.; Kun, L.; Renchuan, Y. Crashworthiness optimization method for sandwich plate structure under impact loading. Ocean. Eng. 2022, 250, 110870. [Google Scholar] [CrossRef]
- ANSYS; ANSYS Inc.: Canonsburg, PA, USA, 2007.
- Yin, H.; Xiao, Y.; Wen, G.; Qing, Q.; Deng, Y. Multiobjective optimization for foam-filled multi-cell thin-walled structures under lateral impact. Thin-Walled Struct. 2015, 94, 1–12. [Google Scholar] [CrossRef]
- Sistani, R.; Mashhadi, M.M.; Mohammadi, Y. Improvement of Crashworthiness Indicators with a New Idea in the Design of the Multi-Cell Hexagonal Tube under Dynamic Axial Load. Machines 2023, 11, 641. [Google Scholar] [CrossRef]
Figure 1.
Falling weight impact tester.
Figure 1.
Falling weight impact tester.
Figure 2.
Schematic diagram of the stiffened panel.
Figure 2.
Schematic diagram of the stiffened panel.
Figure 3.
The entire FE model and imposed boundary conditions.
Figure 3.
The entire FE model and imposed boundary conditions.
Figure 4.
Relationship between impact force and developed penetration depth.
Figure 4.
Relationship between impact force and developed penetration depth.
Figure 5.
Failure mode and von Mises stress distribution.
Figure 5.
Failure mode and von Mises stress distribution.
Figure 6.
Effect of plate thickness on impact force and absorbed energy.
Figure 6.
Effect of plate thickness on impact force and absorbed energy.
Figure 7.
Effect of stiffener section modulus on impact force and absorbed energy.
Figure 7.
Effect of stiffener section modulus on impact force and absorbed energy.
Figure 8.
Relationship between panel weight and impact force, Group 1 and Group 2.
Figure 8.
Relationship between panel weight and impact force, Group 1 and Group 2.
Figure 9.
FE model for D1 (a) and D2 (b).
Figure 9.
FE model for D1 (a) and D2 (b).
Figure 10.
Effect of stiffener spacing on impact force and absorbed energy.
Figure 10.
Effect of stiffener spacing on impact force and absorbed energy.
Figure 11.
FE model for E1 (a) and E2 (b).
Figure 11.
FE model for E1 (a) and E2 (b).
Figure 12.
Effect of stiffener profile on impact force and absorbed energy.
Figure 12.
Effect of stiffener profile on impact force and absorbed energy.
Figure 13.
Parametric study output for weight, impact force, and energy.
Figure 13.
Parametric study output for weight, impact force, and energy.
Figure 14.
Dent configurations and finite element model.
Figure 14.
Dent configurations and finite element model.
Figure 15.
Comparison between intact and dented panel for Model A.
Figure 15.
Comparison between intact and dented panel for Model A.
Figure 16.
FE model for the dented panel.
Figure 16.
FE model for the dented panel.
Figure 17.
FE results for models C1, E1 and E2, with and without dent.
Figure 17.
FE results for models C1, E1 and E2, with and without dent.
Figure 18.
Von Mises stress distribution for models C1, E1 and E2, with and without dent.
Figure 18.
Von Mises stress distribution for models C1, E1 and E2, with and without dent.
Figure 19.
FE results for models C1, E1, and E2 with a dent.
Figure 19.
FE results for models C1, E1, and E2 with a dent.
Table 1.
Material properties of the tested specimen.
Table 1.
Material properties of the tested specimen.
| Density ρ (kg/m3) | 7850 |
| Young’s modulus E (GPa) | 210 |
| Poisson’s ratio ν | 0.3 |
| Yield stress σy (MPa) | 235 |
| Maximum plastic strain at failure ϵp | 0.3 |
Table 2.
Comparison between experimental and FEA results.
Table 2.
Comparison between experimental and FEA results.
| | Impact
Force, kN | Penetration
Depth, m | Absorbed
Energy, kJ |
|---|
| Exp | 490 | 0.07 | 17.15 |
| FEM | 467 | 0.079 | 18.88 |
| Difference% | −4.69 | +12.86 | +10.09 |
Table 3.
Geometrical configurations of Group 1 (different plating thickness), all in mm.
Table 3.
Geometrical configurations of Group 1 (different plating thickness), all in mm.
Principal
Characteristics | SP Group 1 | | |
|---|
| Model A | B1 | B2 | B3 | B4 |
|---|
| Length (L) | 1000 |
| Breadth (B) | 1000 |
| Thickness (tp) | 4 | 5 | 6 | 7 | 8 |
| Web height (hw) | 50 |
| Web thickness (tw) | 3.5 |
| Flange breadth (bf) | −− |
| Flange thickness (tf) | −− |
| No. of stiffeners | 4 |
Table 4.
Geometrical configurations of Group 2 (different stiffener section modulus), all in mm.
Table 4.
Geometrical configurations of Group 2 (different stiffener section modulus), all in mm.
Principal
Characteristics | SP Group 2 | | |
|---|
| Model A | C1 | C2 | C3 | C4 |
|---|
| Length (L) | 1000 |
| Breadth (B) | 1000 |
| Thickness (tp) | 4 | 4 | 4 | 4 | 4 |
| Web height (hw) | 50 |
| Web thickness (tw) | tw | 1.25xtw | 1.5xtw | 1.75xtw | 2xtw |
| Flange breadth (bf) | −− |
| Flange thickness (tf) | −− |
| No. of stiffeners | 4 |
Table 5.
Geometrical configurations of Group 3 (different stiffener spacing), all in mm.
Table 5.
Geometrical configurations of Group 3 (different stiffener spacing), all in mm.
Principal
Characteristics | SP Group 3 |
|---|
| Model A | D1 | D2 |
|---|
| Length (L) | 1000 |
| Breadth (B) | 1000 |
| Thickness (tp) | 4 |
| Web height (hw) | 50 |
| Web thickness (tw) | 3.5 |
| Flange breadth (bf) | −− |
| Flange thickness (tf) | −− |
| Stiffener spacing/no. of stiffeners | 200/4 | 250/4 | 166.67/4 |
Table 6.
Geometrical configurations of Group 4 (different stiffener profile), all in mm.
Table 6.
Geometrical configurations of Group 4 (different stiffener profile), all in mm.
Principal
Characteristics | SP Group 4 |
|---|
| Model A | E1 | E2 |
|---|
| Length (L) | 1000 |
| Breadth (B) | 1000 |
| Thickness (tp) | 4 |
| Web height (hw) | 50 |
| Web thickness (tw) | 3.5 | 1.8 | 1.8 |
| Flange breadth (bf) | −− | 30 | 30 |
| Flange thickness (tf) | −− | 1.8 | 1.8 |
| No. of stiffeners | 4 |
Table 7.
Results of the proposed criterion for best panel configurations.
Table 7.
Results of the proposed criterion for best panel configurations.
| Model | % F | % E | % W | F/W, W
(5% or Less) | E/W, W
(5% or Less) | Final
Decision |
|---|
| A | REF | REF | REF | REF | REF | REF |
| B1 | 1 | 1 | 0 | 0 | 0 | Fail |
| B2 | 1 | 1 | 0 | 0 | 0 | Fail |
| B3 | 1 | 1 | 0 | 0 | 0 | Fail |
| B4 | 1 | 1 | 0 | 0 | 0 | Fail |
| C1 | 1 | 1 | 1 | 1 | 1 | Pass |
| C2 | 1 | 1 | 0 | 0 | 0 | Fail |
| C3 | 1 | 1 | 0 | 0 | 0 | Fail |
| C4 | 1 | 1 | 0 | 0 | 0 | Fail |
| D1 | 0 | 0 | 1 | 0 | 0 | Fail |
| D2 | 1 | 1 | 0 | 0 | 0 | Fail |
| E1 | 1 | 1 | 1 | 1 | 1 | Pass |
| E2 | 1 | 1 | 1 | 1 | 1 | Pass |
| Disclaimer/Publisher’s Note: The statements, opinions and data contained in all publications are solely those of the individual author(s) and contributor(s) and not of MDPI and/or the editor(s). MDPI and/or the editor(s) disclaim responsibility for any injury to people or property resulting from any ideas, methods, instructions or products referred to in the content. |
© 2025 by the authors. Licensee MDPI, Basel, Switzerland. This article is an open access article distributed under the terms and conditions of the Creative Commons Attribution (CC BY) license (https://creativecommons.org/licenses/by/4.0/).


