Article

Study on the Dilatancy Behavior of Coral Sand and Its Influence on Shear Strength Parameters

1
Institute of Engineering Mechanics, China Earthquake Administration, Harbin 150080, China
2
Guangxi Key Laboratory of Geomechanics and Geotechnical Engineering, Guilin University of Technology, Guilin 541004, China
*
Author to whom correspondence should be addressed.
J. Mar. Sci. Eng. 2025, 13(7), 1255; https://doi.org/10.3390/jmse13071255
Submission received: 27 May 2025 / Revised: 19 June 2025 / Accepted: 26 June 2025 / Published: 28 June 2025
(This article belongs to the Section Coastal Engineering)

Abstract

Coral sand is characterized by unique particle morphology and pore structure, which result in pronounced dilatancy and a high internal friction angle during shear. The dilatancy angle is a critical parameter for finite element analyses of sand foundation bearing capacity; the inappropriate selection of this parameter can lead to significant computational errors. In this research, a series of consolidated drained triaxial tests were conducted on coral sand samples from the South China Sea to investigate the dilatancy behavior and its effect on shear strength parameters. A dilatancy equation for coral sand was proposed, incorporating the dilatancy index, relative density, and mean effective stress. The results indicate the following: (1) Within the confining pressure range of 25–400 kPa, the stress–strain curves exhibit varying degrees of strain softening. When the effective confining pressure reaches 400 kPa, the dilatant behavior is nearly suppressed, resulting in a transition from dilatancy to contraction; (2) The peak internal friction angle decreases significantly with increasing effective confining pressure. However, the sensitivity to confining pressure varies for samples with different relative densities (Dr = 30–90%), with denser samples showing a more rapid reduction in peak friction angle; (3) At a confining pressure of 25 kPa, the maximum dilatancy angle of coral sand samples reaches 44.2°, significantly exceeding the typical range observed in terrestrial quartz sands. This difference may be attributed to the irregular and angular characteristics of the coral sand particles; (4) Based on Bolton’s dilatancy theory, a dilatancy equation applicable to coral sand was developed, demonstrating a strong linear relationship among the dilatancy index (IR), relative density (Dr), and peak mean effective stress (pf). These findings provide valuable guidance for the selection of strength parameters for engineering applications involving coral sand.

1. Introduction

With the ongoing expansion of island and offshore engineering developments worldwide, coral sand foundations have become the primary supporting foundations for numerous major infrastructure projects, such as artificial islands, airport runways, port facilities, and offshore wind farms [1,2,3,4]. The accurate evaluation of the bearing capacity of these foundations is critical to ensuring the safety and stability of overlying structures. As the bioclastic remains of deceased reef-building corals, coral sand is distributed throughout temperate and tropical regions globally [5]. Observational studies and scanning electron microscopy analyses reveal that coral sand exhibits particle characteristics fundamentally different from those of quartz sand, including rough surfaces with abundant, well-developed pores and a high degree of irregularity due to pronounced angularity [6]. Wang et al. [7] indicated that coral sand particles exhibit various morphologies—blocky, flaky, and branching—which significantly influence their macroscopic mechanical behavior. Due to its unique formation and particle characteristics, coral sand exhibits significantly different physical and mechanical behavior compared to terrestrial quartz sand. Therefore, accurately assessing its strength and deformation characteristics is of significant importance.
For sandy soils, particle size distribution, particle shape, and surface roughness are key factors influencing their macroscopic mechanical behavior. Rowe [8] proposed that the internal friction angle mobilized during shearing must account for not only the slip resistance at particle contacts, but also the dilatancy resulting from particle rolling and rearrangement. Studies have shown that, in addition to surface roughness, particle shape plays a dominant role in controlling the spatial arrangement and interlocking of grains [9]. Through investigations on the effects of particle characteristics of single-mineral soils on shear strength, Koerner [10] demonstrated that soil strength increases with increasing particle angularity and decreases with increasing particle roundness. Furthermore, discrete element method (DEM) simulations have been employed to model the shearing of particles with varying shapes; the results indicate that angular materials exhibit markedly higher peak shear strength than rounded particles, with the peak strength occurring at larger axial strains [11,12]. Therefore, the pronounced interlocking among angular coral sand particles, combined with their diverse morphologies, contributes to the development of a more stable granular skeleton, resulting in enhanced resistance to deformation under loading. These microstructural attributes underpin the high internal friction angle and pronounced dilatancy effect observed in coral sand during engineering applications. To quantitatively characterize the dilatancy behavior of sand, extensive research has been conducted. Rowe [8] experimentally demonstrated that the dilatancy of granular soils is governed by the distribution of contact stresses between particles, and, by assuming that failure corresponds to a minimum energy ratio, derived a stress–dilatancy relationship under plane strain conditions. Bolton [13], based on a large number of triaxial and plane strain tests on terrigenous quartz sands, proposed a theoretical expression relating the peak friction angle and the dilatancy angle. Guo and Su [9], from triaxial shear tests under low confining pressures, obtained an empirical dilatancy angle expression for Ottawa sand through analytical fitting. Esposito and Andrus [14] carried out triaxial and plane strain tests on Pleistocene age sand under confining pressures ranging from 17 to 138 kPa, and established an empirical relationship for the dilatancy angle. In addition, several researchers have developed stress–dilatancy equations for various sands based on Bolton’s theory, allowing for the accurate prediction of the empirical relationships among peak friction angle, relative density, and stress level, with fitted parameters determined for different sand types [15,16].
Since the dilatancy angle directly influences the volumetric deformation behavior of soils under external loading, it not only governs the magnitude of ultimate bearing capacity, but also affects the deformation pattern of the foundation and the stability of the superstructure. In recent years, finite element numerical methods have gradually become the mainstream approach for evaluating bearing capacity and are being extensively applied in both geotechnical research and engineering practice. Yin et al. [17] noted that in numerical analyses, the dilatancy angle ψ has a significant impact on the calculated bearing capacity factor, and this influence intensifies as the difference between the dilatancy angle and the internal friction angle increases. Erickson and Drescher [18] reported that under a non-associated flow rule, the values of the bearing capacity factors Nc and Nγ are highly dependent on the dilatancy angle ψ, with differences in ψ potentially resulting in up to a 40% variation in these factors. De Borst and Vermeer [19] evaluated the bearing capacity of strip footings by varying the dilatancy angle within the range of 0° ≤ ψφ. They found that different values of the dilatancy angle could not only significantly affect the numerical stability of the computation process, but could also result in calculation errors of up to 40%. Loukidis and Salgado [20] used finite element methods to evaluate the bearing capacity of strip foundations and observed that for soils with high internal friction angles, differences in the dilatancy angle could lead to up to a 45% variation in computed results. Collectively, a substantial body of research has confirmed that the influence of the dilatancy angle on bearing capacity analyses cannot be neglected [21,22,23]. The accuracy of finite element simulations is highly dependent on the accuracy of the input material parameters, among which the dilatancy angle is a critical factor affecting bearing capacity calculations. Therefore, when assessing the bearing capacity of coral sand foundations, which typically exhibit high internal friction angles, it is essential to adequately account for the effects of dilatancy.
However, current research on dilatancy characteristics has primarily focused on terrigenous quartz sands, and studies concerning the stress–dilatancy relationship of coral sand remain very limited [24]. In practical engineering design, the dilatancy angle is typically determined empirically, with no standardized testing methods or selection criteria available. If empirical parameters developed for quartz sand are directly applied to coral sand, considerable deviations in calculation results may occur, potentially posing safety risks to marine engineering projects. Therefore, scientifically and reasonably evaluating the dilatancy behavior of coral sand has become a critical issue that needs to be addressed. In this context, a series of triaxial shear tests investigating the volumetric deformation of coral sand were carried out in this study. The influences of relative density and effective confining pressure on the dilatancy behavior and shear strength parameters were systematically analyzed, and a stress–dilatancy relationship for coral sand was established based on the dilatancy index, relative density, and mean effective stress. The results of this study provide a theoretical basis and reference for the rational selection of key parameters in evaluating the bearing capacity of coral sand foundations and conducting finite element numerical analyses.

2. Materials and Methods

2.1. Basic Physical Properties of Coral Sand

Coral sand is a biogenic carbonate sand whose primary composition is similar to that of carbonate sands formed from shells and microorganisms. Due to its unique and complex internal biological structure, coral sand exhibits higher particle strength and resistance to deformation [25]. However, researchers often use the term “coral sand” as a general designation for all biogenic carbonate sands, which may lead to misunderstandings regarding their physical and mechanical properties. Therefore, there is a clear need within the academic community to provide a more precise definition of coral sand materials. In this study, the test material used was coral sand collected from a marine area in the South China Sea, primarily composed of bioclastic debris formed from the fragmentation of coral reefs after their death. To further investigate its particle morphology, scanning electron microscopy (SEM) was employed to compare the particle shapes of coral sand with those of typical terrigenous quartz sand, as illustrated in Figure 1. As shown in Figure 1b, quartz sand particles generally exhibit regular geometric shapes, smooth surfaces, and high roundness, with virtually no surface pores. In contrast, the particles of coral sand are angular and irregular in outline, possess rougher surfaces, and contain numerous well-developed internal and external pores; their shapes are predominantly blocky, platy, or irregular, as shown in Figure 1a. This irregular morphology promotes complex mechanisms of particle rolling, sliding, and interlocking during shearing, while the rough particle surfaces provide greater frictional resistance. These distinctive particle characteristics result in a mechanical behavior of coral sand that differs substantially from that of conventional quartz sand in engineering practice.
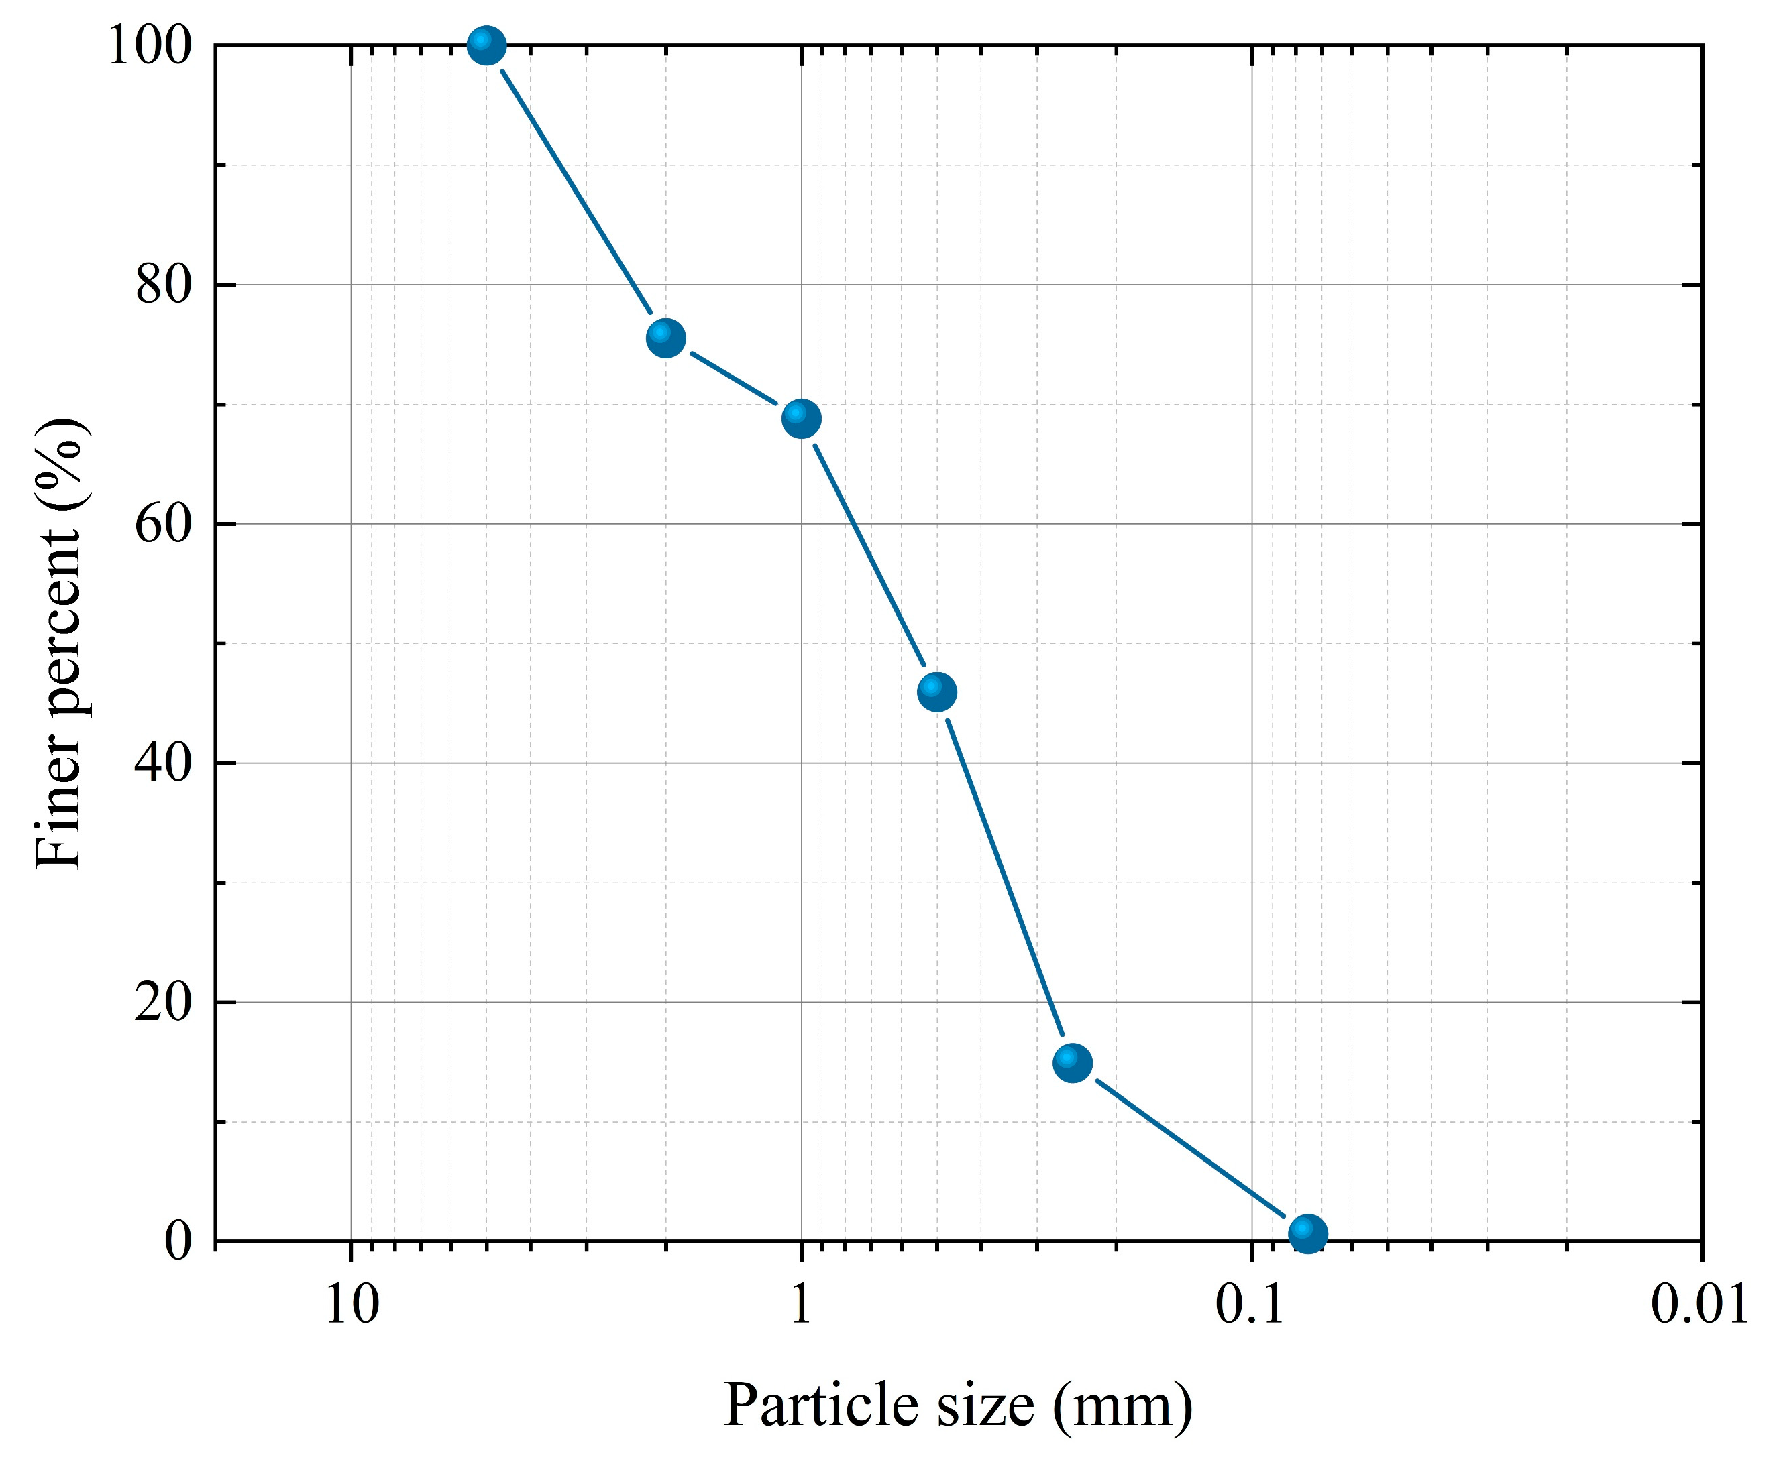
Figure 2 presents the particle size distribution curve of the coral sand. The maximum particle size (dmax) is 5 mm, and the median particle size (d50) is 0.58 mm. Particles smaller than 0.075 mm constitute approximately 0.6% of the total mass. The coefficient of uniformity (Cu) is 5.2 (Cu ≥ 5.0), and the coefficient of curvature (Cc) is 1.02 (1.0 ≤ Cc ≤ 3.0), indicating that the coral sand used in this study is well-graded. According to the classification of soil particle sizes defined by the Chinese Standard for geotechnical testing method (GB/T 50123-2019) [26], the samples can be categorized as coral medium sand. The fundamental physical parameters of coral sand materials are presented in Table 1. The determination of the maximum and minimum dry densities in Table 1 was conducted in accordance with the Chinese Standard for geotechnical testing method (GB/T 50123-2019) [26]. To evaluate the degree of particle breakage during the testing process, sieve analyses were performed on the samples before and after the maximum dry density tests. The results indicate that the amount of particle breakage in the measured samples was minimal, and the particle size distribution curves remained virtually unchanged. Therefore, the effect of particle breakage on the test results can be considered negligible.

2.2. Experimental Design and Procedure

The behavior of dilatancy in sandy soils is primarily controlled by the relative density and the level of confining pressure. When the relative density is constant, lower confining pressure results in weaker interlocking among sand particles, making it easier for rolling and sliding between particles to occur, which leads to a more pronounced dilatancy effect. Conversely, as the confining pressure increases, the number of point contacts among sand particles increases, enhancing the interlocking action between them. This significantly restricts the rolling behavior between particles and leads to a substantial reduction in the dilatancy effect [9,11,12]. Guo and Su [9] conducted triaxial shear tests on sandy soils with two different particle shapes and found that angular sand samples exhibited a more significant dilative behavior and stronger particle interlocking effects. Liu and Matsuoka [27] performed direct shear tests on sandy soils with various particle characteristics and reported that differences in particle shape, reflected as variations in interparticle contact angles, had a significant influence on both shear strength and dilatancy. Therefore, for coral sand with well-developed angularity and diverse particle shapes, its sensitivity to confining pressure will inevitably differ markedly from that of terrigenous quartz sand. In order to investigate the typical shear mechanical behavior of coral sand under low to normal confining pressures, consolidated drained triaxial tests were performed at effective confining pressures ranging from 25 to 400 kPa. Furthermore, the sand samples were saturated prior to consolidation so that the volumetric change in the specimen could be determined from the amount of drainage measured during shearing, allowing an assessment of the dilatancy characteristics of coral sand under different confining pressures and relative densities.
The triaxial tests were conducted using an electromagnetic triaxial apparatus manufactured by GDS Instruments (UK), which Is capable of providing a maximum axial load of 5 kN. The coral sand specimens had a diameter of 50.0 mm and a height of 100.0 mm. The relative densities (Dr) were controlled at 30%, 50%, 70%, and 90%, corresponding to the loose to dense states typically encountered for coral sand foundations in the field. The sample preparation process follows the Chinese Standard for geotechnical testing method (GB/T 50123-2019) [26]. When preparing samples with a relatively high density, vibration can be applied to the sample by striking the split mold. To minimize the impact of particle breakage during sample preparation, a combination of compaction and vibration methods was employed. The specific procedure is as follows: an appropriate amount of sand is weighed and gradually poured into the split mold wrapped with a rubber membrane using a funnel. After an initial leveling, the sand is gently compacted, while a vibration rod is used to strike the split mold at a fixed frequency. This process is repeated until the sand reaches the predetermined height for each layer, continuing until the required sample height is achieved. Sieve analyses performed on the completed sand samples showed that there was virtually no particle breakage during the preparation process, indicating that this preparation method is reasonable and effective. Prior to consolidation, the saturation of the sample was achieved using the back pressure method. The pore water pressure coefficient B of the sample was monitored in real time using a pore pressure sensor, and the determination of saturation was based on the value of the pore water pressure coefficient B. According to the saturation phase testing requirements outlined in the ASTM standards (ASTM D4767-11) [28], the sample is considered fully saturated when the pore water pressure coefficient B exceeds 0.95. After the automatic consolidation procedure was finished, the shear stage was initiated by applying a constant shear strain rate of 0.02 mm/min. The test was terminated when the axial strain reached 20%. Table 2 summarizes the details of the triaxial compression test program for the coral sand. Owing to the high density of the Dr = 90% specimens, the applied axial load during testing was close to the maximum capacity of the apparatus. Consequently, the highest confining pressure for the Dr = 90% tests was limited to 300 kPa, whereas a maximum confining pressure of 400 kPa was adopted for specimens at lower relative densities.

3. Results and Discussion

3.1. Strength and Volumetric Deformation Behavior of Coral Sand

Figure 3 presents the deviator stress–axial strain curves from consolidated drained triaxial shear tests on coral sand specimens with relative densities of 30%, 50%, 70%, and 90%. The results show that, within the confining pressure range of 25 kPa to 400 kPa, the stress–strain curves of all specimens exhibit varying degrees of strain-softening behavior. Taking the case of Dr = 50% as an example, under a confining pressure of 25 kPa, the peak stress occurs at an axial strain (ε1) of approximately 4%, while under a confining pressure of 400 kPa, the peak stress appears at around ε1 = 11%. This indicates that increasing the confining pressure significantly delays the occurrence of peak stress. At a given confining pressure, an increase in relative density results in closer contacts among coral sand particles, and the presence of angular and branched particles leads to a more pronounced interlocking effect, which significantly influences the mechanical behavior of the coral sand specimens [14]. Macroscopically, the specimens exhibit higher shear stress at the same axial strain (ε1) as the relative density increases. Microscopically, since the friction between sand particles during shearing includes both sliding and rolling friction, closer particle contacts increase the resistance to particle rolling, which greatly enhances the dilation behavior of the coral sand.
Figure 4 shows the volumetric strain–axial strain curves for coral sand specimens ranging from loose to dense states under effective confining pressures of 25 to 400 kPa, where negative volumetric strain (εv) indicates compression and positive values indicate dilation. The curves indicate that the specimens generally undergo slight compression in the early stages of shearing. As the axial strain (ε1) increases, the specimen volume begins to dilate and then gradually approaches a stable state. This phenomenon corresponds to the strain-softening behavior observed in Figure 3, where after reaching the peak dilation, the specimen progressively develops towards the critical state, during which the shear strength is mainly provided by sliding friction between the particles. Overall, at a given relative density, increasing the confining pressure reduces the dilation effect, whereas, at a fixed confining pressure, higher relative densities enhance the dilation response. This explains why the dilation of coral sand specimens with relative densities of Dr = 30% and 50% is not pronounced under a confining pressure of 400 kPa. As the axial strain (ε1) increases up to 20%, the specimen volume does not stabilize but instead shows a slow increase at later stages.
Unlike quartz sand, coral sand exhibits a significantly lower critical stress threshold for particle crushing, owing to its distinctive internal structure and particle morphology [29]. As evidenced by the results in Figure 3 and Figure 4, the dilative behavior of coral sand particles becomes progressively less pronounced as the effective confining pressure increases to 400 kPa; in particular, the dilation observed in loose specimens nearly disappears [30,31]. Some scholars attribute the changes in dilatant behavior caused by increased confining pressure to enhanced particle breakage. However, previous studies have confirmed that the amount of particle breakage in coral sand is relatively small under confining pressures less than 400 kPa [32,33]. Particle sieving analyses were conducted on samples before and after the experiments, and the results showed that there was no significant change in the particle size distribution of the samples before and after shearing at 400 kPa confining pressure. Therefore, the amount of particle breakage can be considered negligible. As a result, the changes in dilatant behavior at low confining pressures are primarily governed by the interlocking behavior between particles, which is significantly influenced by relative density and confining pressure, while the impact of particle breakage is relatively limited [30,31].
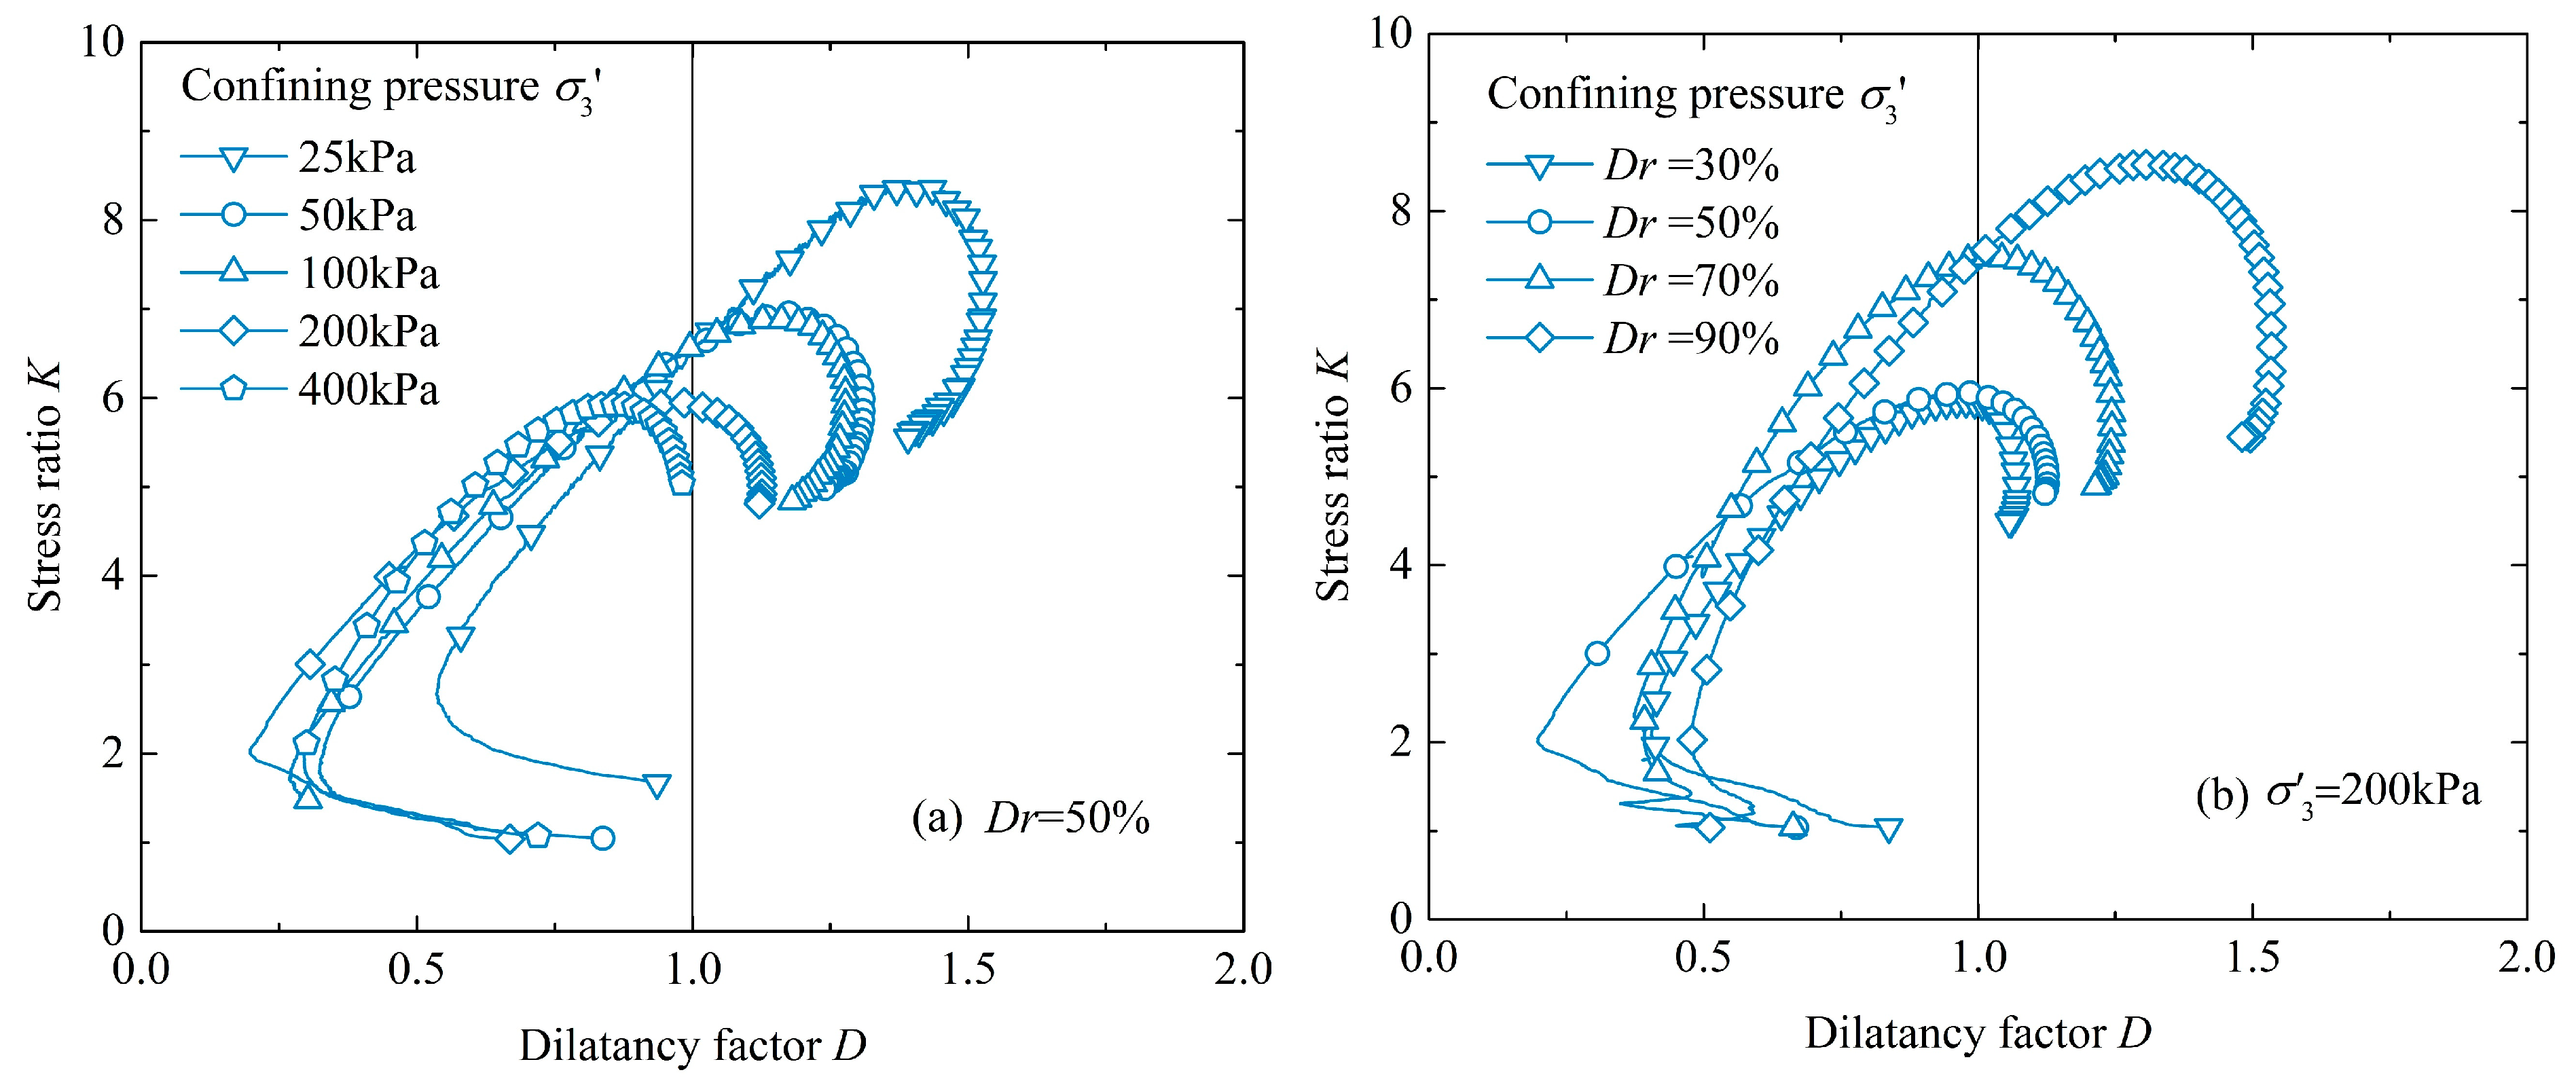
The stress–dilatancy relationship is a crucial mechanical characteristic of sandy soils under shear, serving as the foundation for developing constitutive models. By plotting the relationship curve between the principal stress ratio (K) and the dilatancy coefficient (D), the volumetric change of sand specimens in response to varying stress states during shear deformation can be clearly characterized. In triaxial tests, the principal stress ratio is defined as K = σ1′/σ3′, where σ1′ and σ3′ are the effective major principal stress and effective confining pressure, respectively. According to the dilatancy theory proposed by Rowe [8], the dilatancy coefficient is defined as D = v/1, where v and 1 are the increments of volumetric strain and axial strain, respectively. The dilatancy coefficient DD indicates the relationship between the increase in volumetric strain and deviator strain during shearing. When D is greater than 1, the specimen exhibits dilative behavior; when D is less than 1, the specimen shows contractive behavior.
Figure 5 illustrates the KD relationship curves for coral sand at specified relative densities and confining pressures. The results indicate that coral sand specimens with a relative density of 50% exhibit similar variation patterns at different confining pressure levels. During the initial shear stage, the stress ratio increases as the dilatancy coefficient decreases until the first inflection point appears; the specimen gradually transitions from the compression stage to the dilatancy stage, accompanied by extensive particle rearrangement within the soil. As the shear stress further increases, both the stress ratio (K) and dilatancy coefficient (D) increase simultaneously, and the curve reaches a second inflection point, at which point the specimen achieves maximum dilatancy. The interparticle contacts along the internal shear plane become more uniform, and the specimen transitions from the dilatancy stage to the steady-state shear stage, with both the stress ratio and dilatancy coefficient decreasing synchronously until reaching the critical state. As the confining pressure increases from 25 kPa to 400 kPa, both the peak stress ratio and the peak dilatancy coefficient decrease, and the KD curve shifts downward and to the left. This reflects the fact that increased confining pressure suppresses the dilative behavior of particles during shearing, demonstrating the sensitivity of the dilatancy effect of coral sand to changes in confining pressure. As shown in Figure 5b, under a confining pressure of 200 kPa, the specimens at different relative densities demonstrate consistent dilative behavior: both the peak stress ratio and peak dilatancy coefficient decrease as the relative density decreases, and the KD curve also shifts downward and to the left, indicating that the variation in sample density also notably affects dilatancy. For loose specimens, the large interparticle voids lead to weak interlocking between particles, so their dilative behavior during shearing is less pronounced than that of dense specimens. At higher confining pressures (e.g., 400 kPa), loose specimens may even display contractive behavior.

3.2. Influencing Factors and Trends of the Peak Internal Friction Angle

Under triaxial stress conditions, the ultimate equilibrium state of soil can be expressed in terms of principal stresses as follows:
sin φ = σ 1 / σ 3 1 σ 1 / σ 3 + 1
According to the definition of the generalized dilatancy angle [8], the dilatancy angle of a soil element is defined as the arctangent of the ratio between the increment of volumetric strain and the increment of axial strain during shearing:
ψ = arctan ( d ε v / d ε 1 )
Equation (2) implies that the dilatancy angle is determined by the volumetric strain and axial strain, and that the dilatancy effect of the specimen reaches its peak when the slope of the curve attains its maximum value. Based on the definitions under axisymmetric and plane strain loading, Vermeer [34] suggested that the ψ can be calculated using the following formula:
sin ψ = d ε v d ε v 2 d ε 1
By rearranging the above equation, the dilatancy angle can be further expressed as follows:
ψ = arcsin d ε v / d ε 1 2 d ε v / d ε 1
When the ratio of strain increments reaches its maximum value, the computed dilatancy angle at this point is referred to as the peak dilatancy angle.
The peak internal friction angle (φp) and peak dilatancy angle (ψp) under various conditions were calculated using Equations (1) and (4), with the results summarized in Table 3. The results show that, at a constant confining pressure, both φp and ψp increase markedly as the specimens transition from loose to dense states, reaching maximum values of 62.8° and 44.2°, respectively. Conversely, at a constant relative density, increasing the confining pressure results in a pronounced decrease in both peak angles. For the test groups with relatively low relative densities (Dr = 30% and 50%) under a confining pressure of 400 kPa, the volumetric strain remains negative, even when the axial strain reaches its maximum value of 20%, indicating a contractive macroscopic mechanical response. Overall, the critical confining pressure for the transition from dilative to contractive behavior in coral sand is approximately 400 kPa; at this pressure level, the dilative response of the coral sand specimens is almost completely suppressed, which is consistent with observations reported by other researchers [30,31].
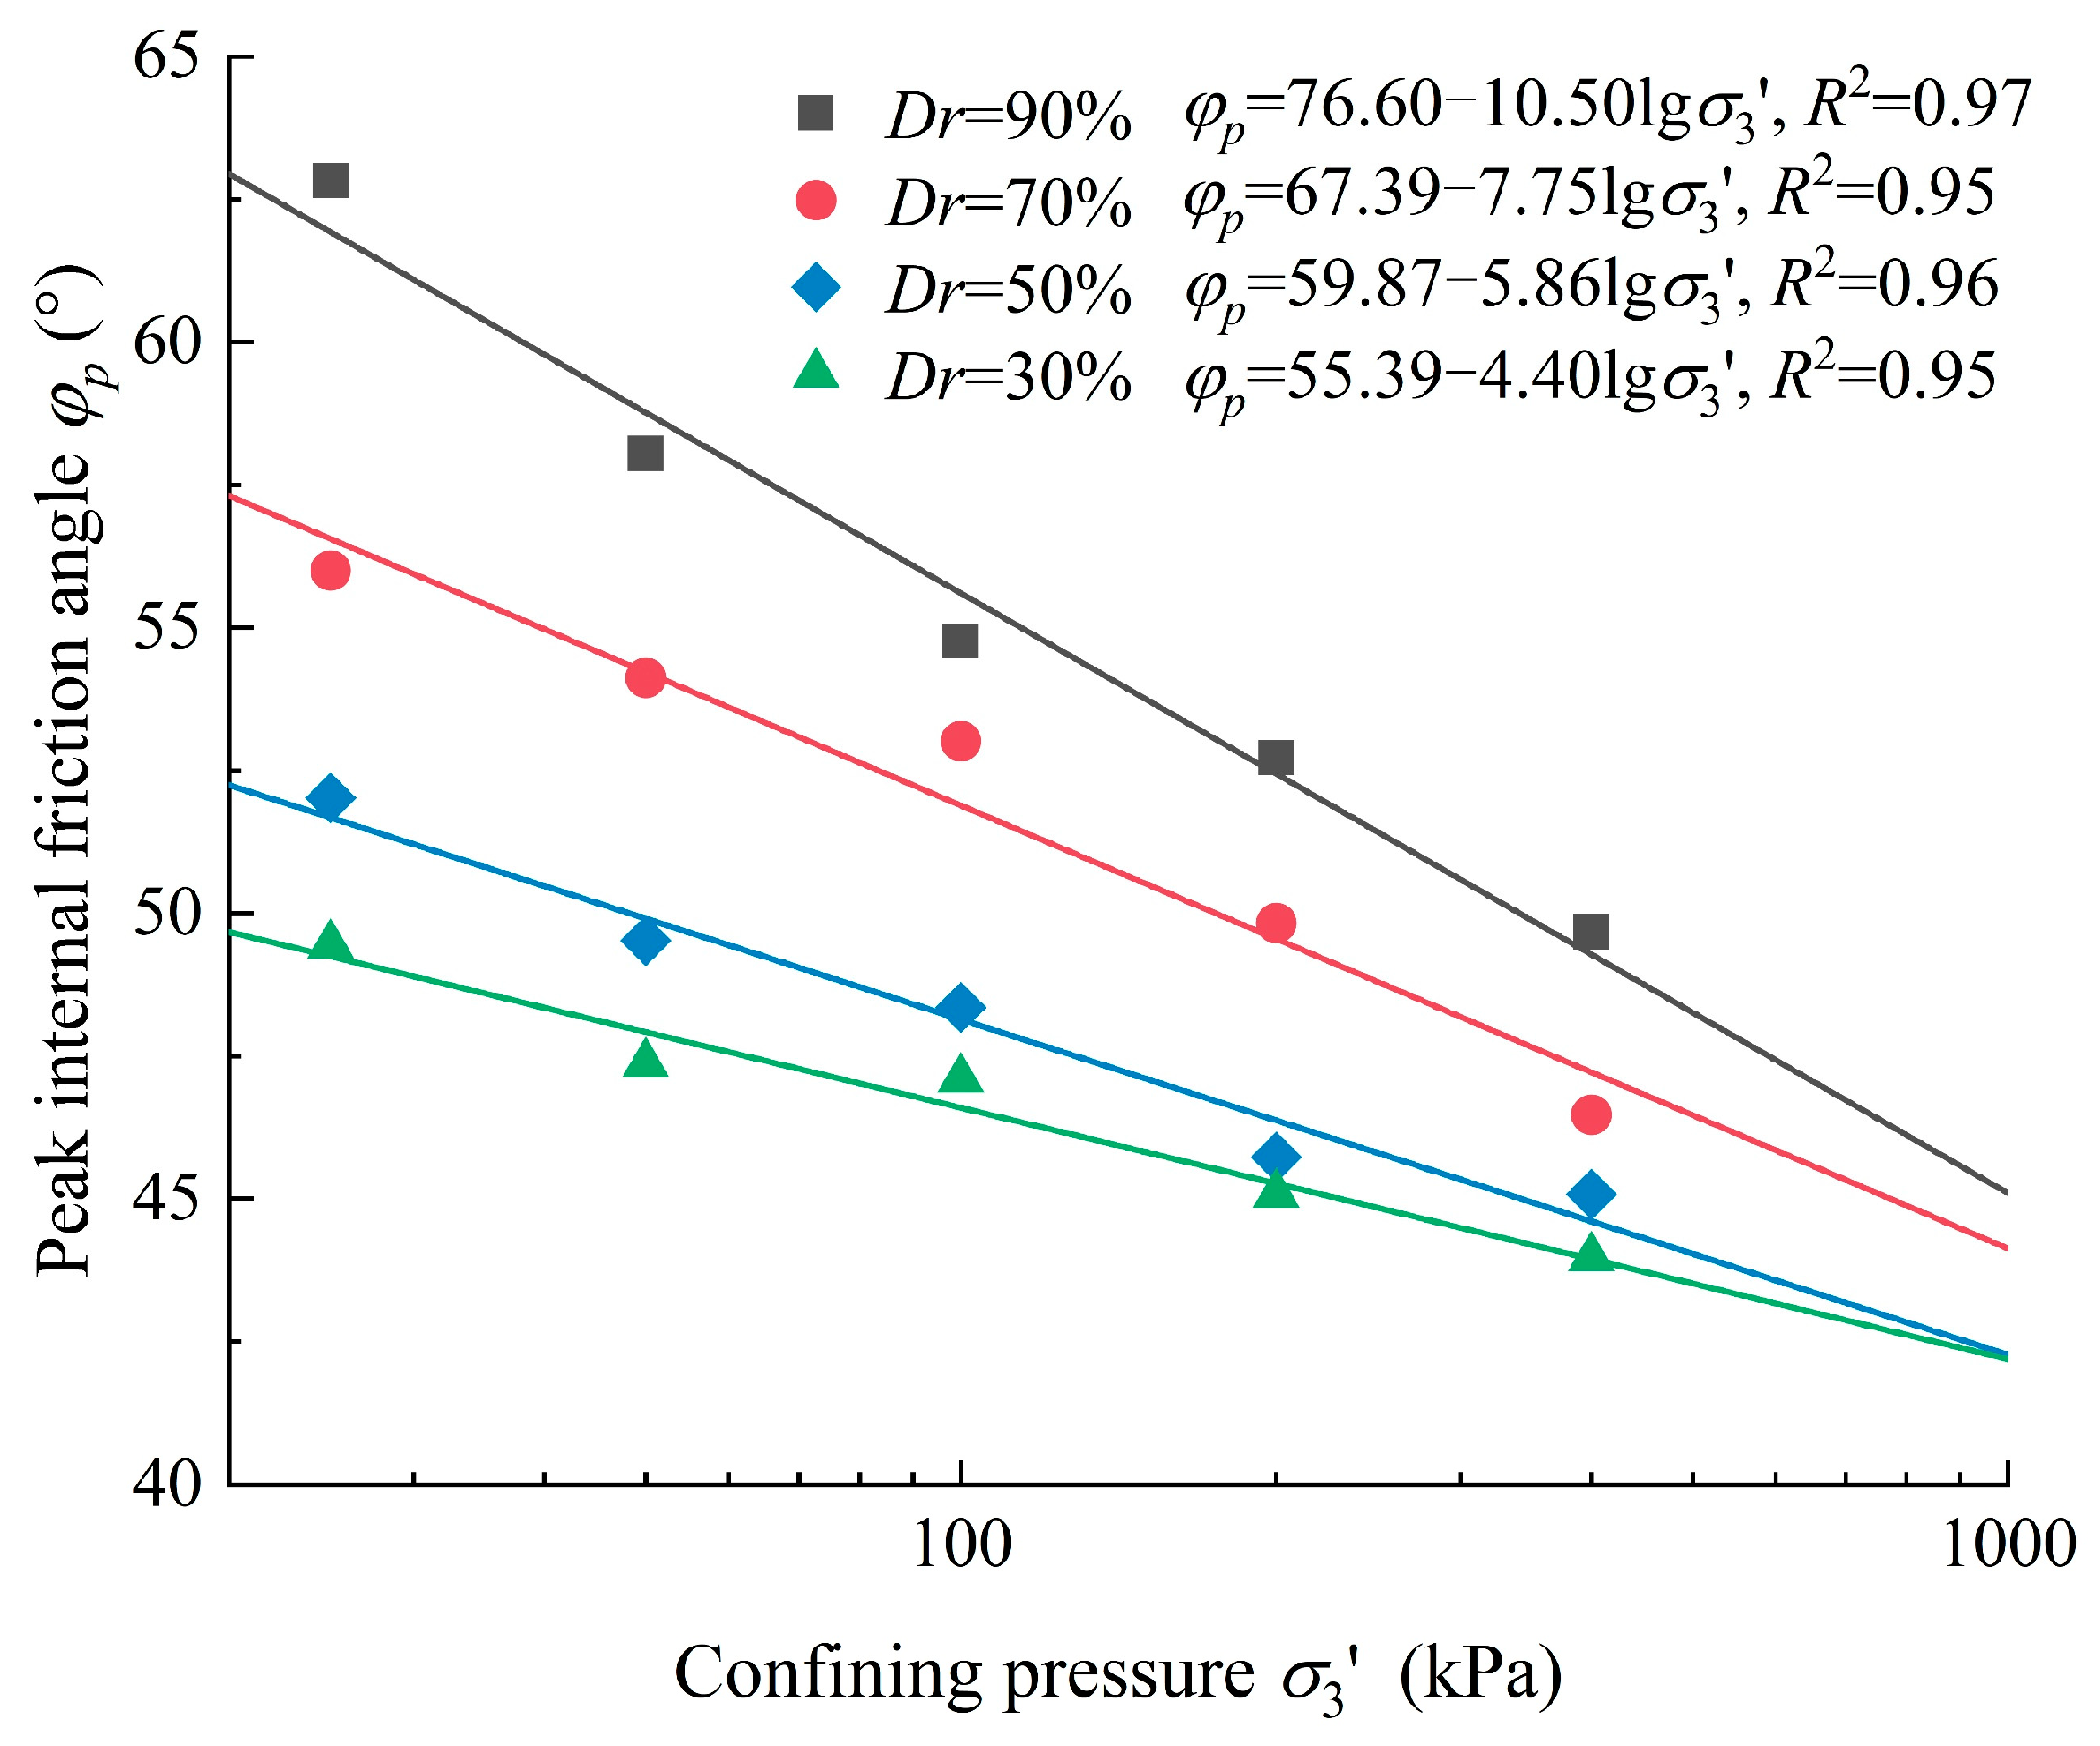
As shown in Figure 6, the rate of decrease in the peak internal friction angle is closely related to the relative density. For the experimental group with higher relative density, the rate of decrease is significantly greater than that of the group with lower relative density. For specimens with relative densities ranging from 30% to 90%, the peak internal friction angle decreases by 4.40°, 5.86°, 7.75°, and 10.50°, respectively, for each unit increase in lgσ3′. This indicates that specimens with higher relative densities exhibit a more significant response to changes in confining pressure. Hao et al. [15] conducted triaxial shear tests on standard quartz sand with various relative densities under confining pressures of 200–8000 kPa. Their results showed that for each unit increase in lgσ3′, the peak internal friction angle decreased by 3.12°–6.34° at low pressure levels (200–800 kPa) and by 6.55°–8.24° at high pressure levels (800–8000 kPa). Bolton [13] summarized the relationship between the internal friction angle and lgσ3′ for Ottawa sand and Sacramento River sand, finding that for each unit increase in lgσ3′, the internal friction angle decreased by approximately 6° for both sands. Similarly, according to the findings of Dickin [35], the internal friction angle of Erith sand decreased by about 4° for every unit increase in lgσ3′. Existing research has shown that, within the low-pressure range, each unit increase in lgσ3′ typically results in a reduction of the peak internal friction angle of quartz sand by about 3°–6° [13,15,35,36]. In comparison, the peak internal friction angle of the coral sand specimens tested in this study decreases at a rate significantly higher than the range reported for quartz sands, indicating a more pronounced stress sensitivity.

3.3. Stress–Dilatancy Equation for Coral Sand

Based on Rowe’s dilatancy theory, Bolton [13] proposed a theoretical model to describe the dilatancy behavior of sands under plane strain conditions. As illustrated in Figure 7, φcv represents the critical state friction angle. Assuming that ss denotes a non-dilating slip plane, sand particles undergo both sliding and rolling during shearing, and the angle between the ss plane and the horizontal corresponds to the dilatancy angle (ψ).
Therefore, the friction angle (φ) observed on the failure plane consists of both the critical state friction angle (φcv) and the dilatancy angle (ψ) (i.e., φ = φcv + ψ). This expression represents only a fundamental form of the friction–dilatancy relationship and cannot quantitatively characterize the dilatancy behavior of soils. To address this, Bolton [13], by analyzing a large number of plane strain and triaxial test data for quartz sand, proposed the following relationship among the peak friction angle (φp), peak dilatancy angle (ψp), and critical state friction angle (φcv) during the shearing process of sand:
φ p = a ψ p + φ c v
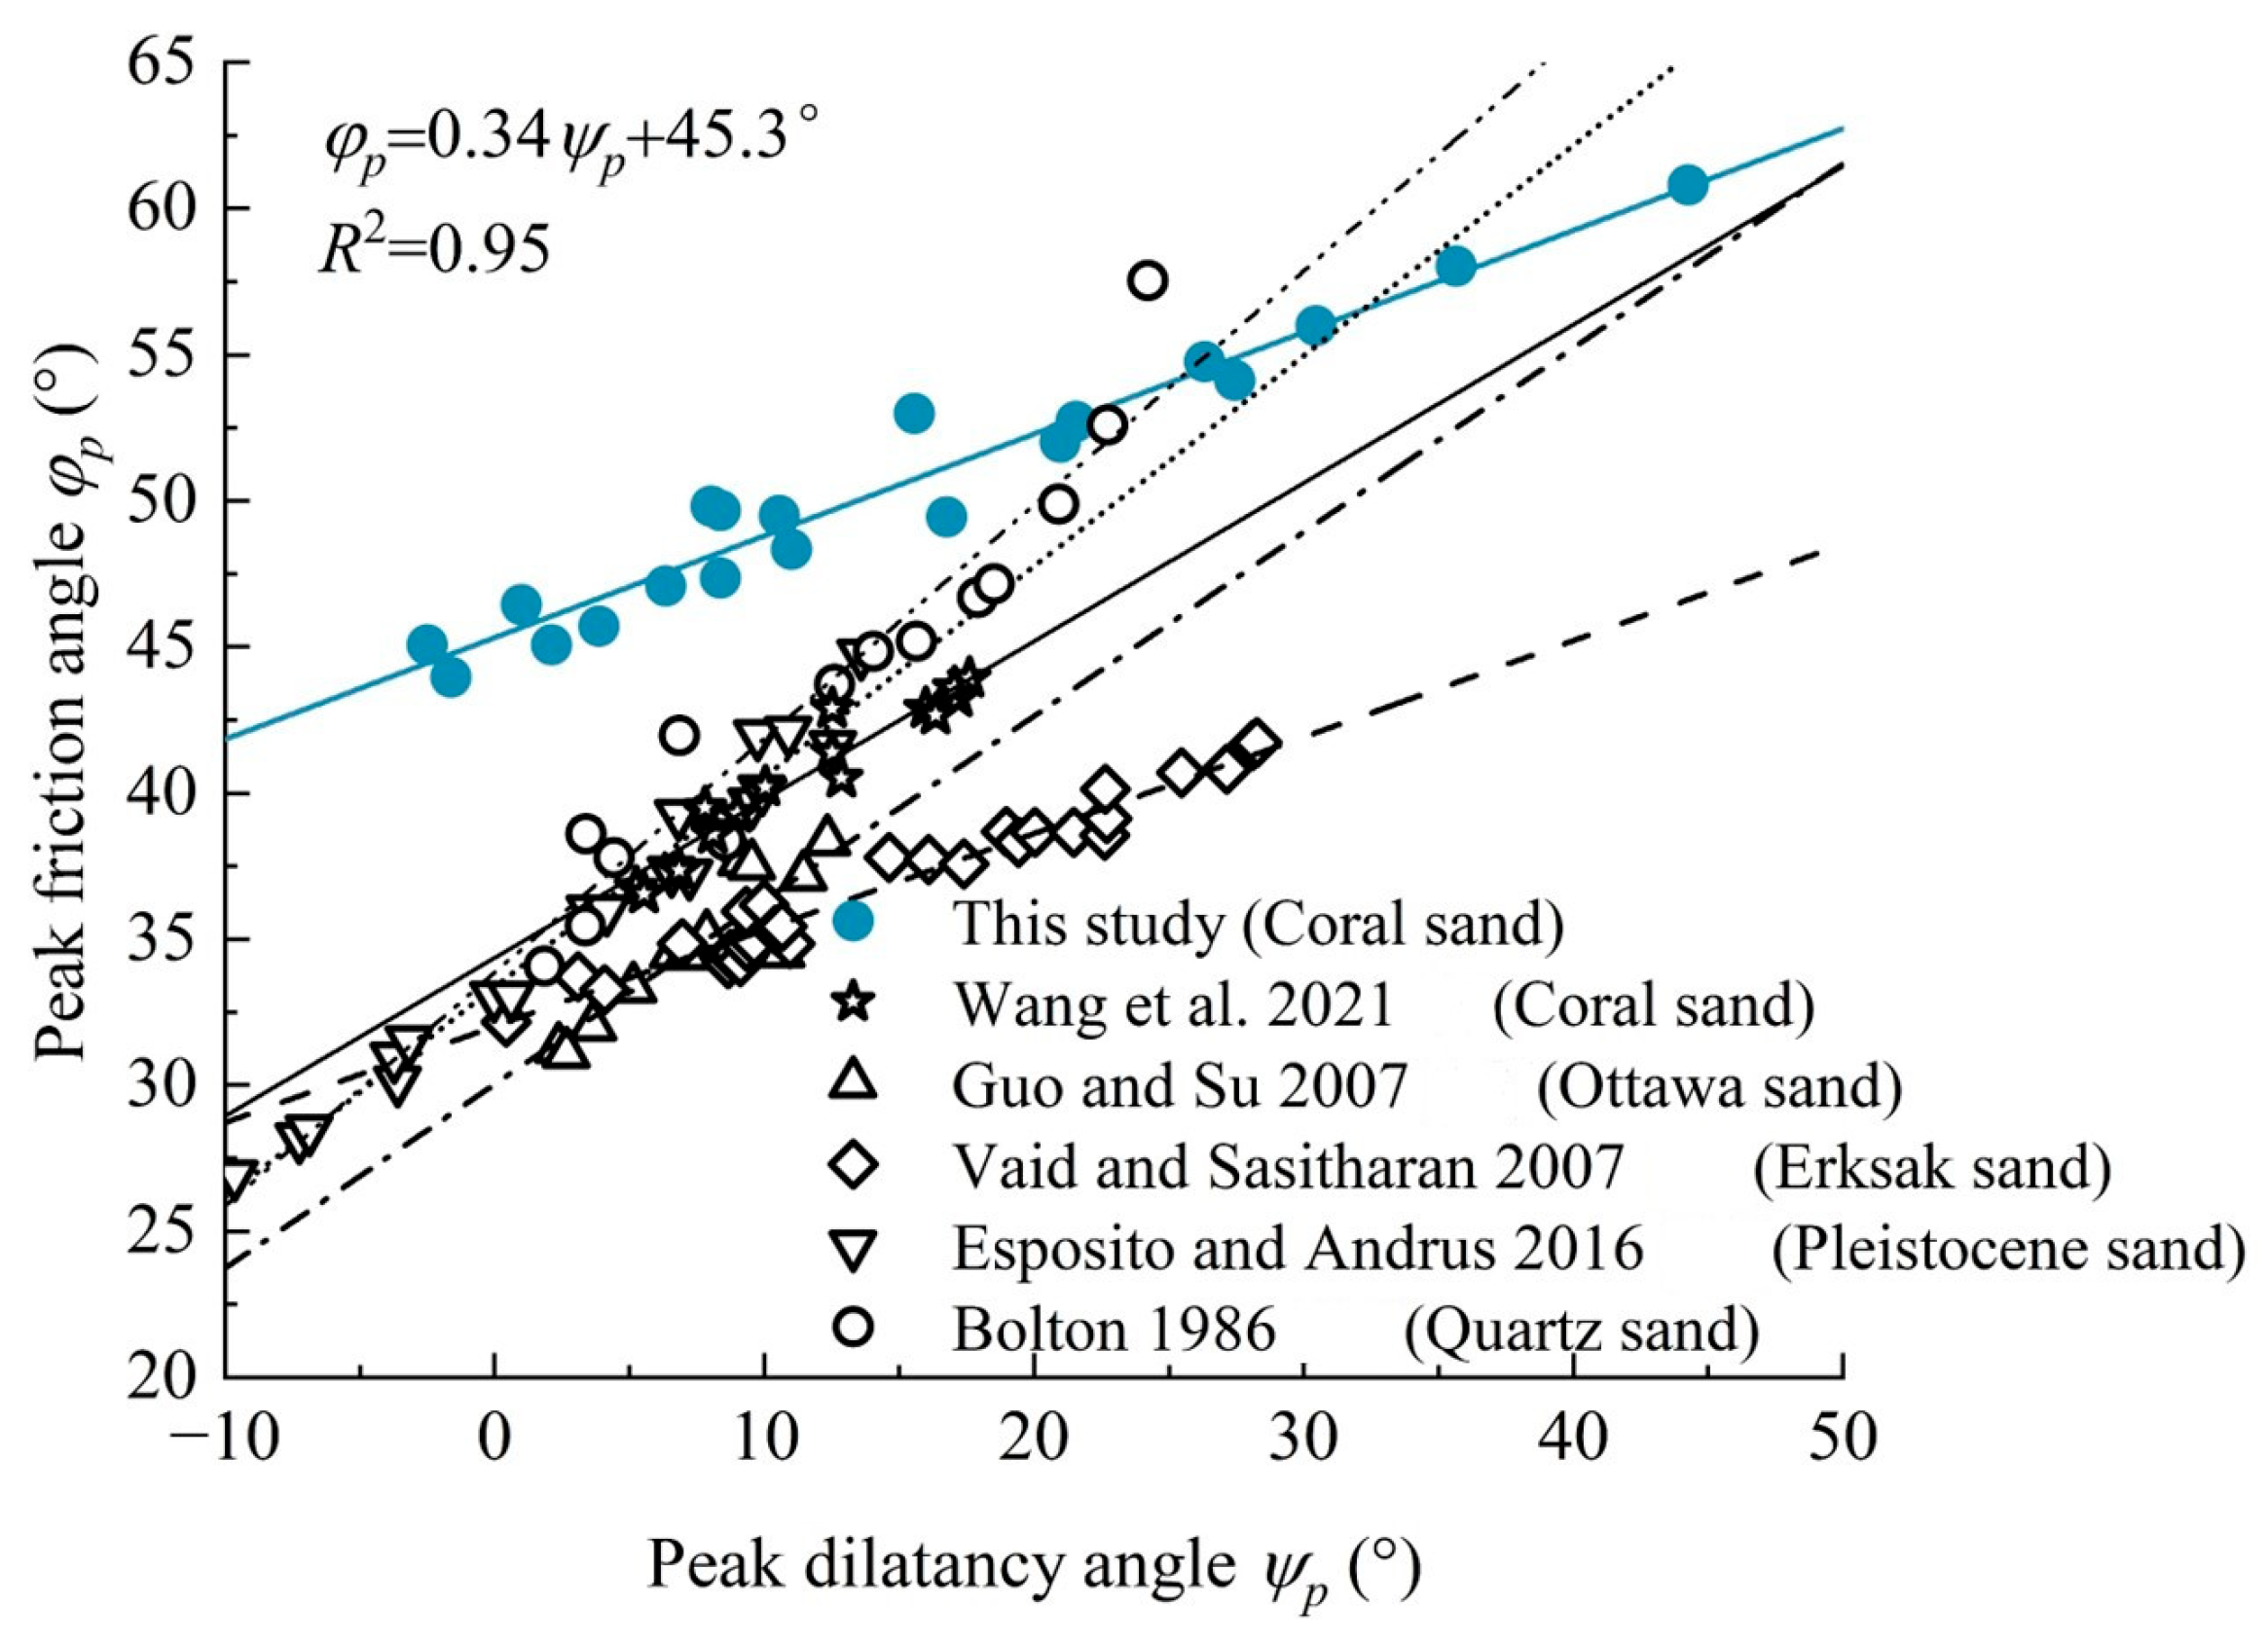
In this equation, the coefficient a is taken as 0.5 under triaxial stress conditions and 0.8 under plane strain conditions. Subsequent studies have shown that the value of a also varies among different types of sand. To investigate the relationship between the peak friction angle and the peak dilatancy angle of coral sand, the experimental results of φpψp for coral sand specimens were plotted and linearly fitted in Figure 8. The results show that the fitted coefficient for coral sand is a = 0.34, and the critical state friction angle (φcv) is 45.3°, which is much higher than that of quartz sand. Previous research has demonstrated that the critical state friction angle is closely related to particle roughness and particle rearrangement behavior during shearing [24]. Compared with quartz sand, coral sand particles have a much rougher surface, resulting in greater sliding resistance during shear. In addition, the more complex shape of coral sand means that particle rearrangement always occurs during shear, which may be an important reason for the significant differences in φcv between the two. The observations from the fitting results of carbonate-dominant limestone sand under effective confining pressures ranging from 100 kPa to 500 kPa, as shown in Figure 8, indicate that its critical state friction angle φcv also approaches approximately 40°. Although the fitted critical state friction angle (φcv) of the coral sand presented in this study remains higher than that of typical carbonate sands, these results at least provide justification for the observed difference in φcv between the two sand types.
Table 4 presents the basic test conditions and results for both coral sand and quartz sand. The fitted coefficient a for quartz sand generally ranges from 0.33 to 0.8, which is consistently higher than the value of 0.34 obtained for coral sand in this study. The table shows that, in addition to the influence of stress level, the type of sand also greatly affects the value of coefficient a (Table 4). Moreover, the maximum peak dilatancy angle (ψp,max) of quartz sand mostly ranges from 10° to 30°, whereas the ψp,max for coral sand in this study reaches up to 44.2°. This difference can be attributed mainly to two factors. First, coral sand grains are characterized by pronounced angularity and dendritic or platy structures, which result in stronger interlocking and greater dilatancy due to enhanced particle rolling during shearing. Additionally, relative density is an important factor affecting the dilatancy angle (ψ) of sand [14]. The dilatancy angles of samples in this study, which exceed 20°, were derived from test groups characterized by high density and low confining pressures. The lower confining pressures do not completely limit the dilatancy effects of coral sand samples. Thus, the elevated peak internal friction angles and dilatancy angle results presented in this paper are related to the confining pressures selected during the calculations. These findings further indicate that using general empirical relationships to estimate the dilatancy angle of coral sand may lead to significant discrepancies in the results. For example, according to the dilatancy angle prediction formula proposed by Bolton [13], the statistical results indicate that the φcv for quartz sand is approximately 33°, with a coefficient a of 0.5 under triaxial conditions. If we substitute the peak friction angle of the coral sand from this study into the calculation, the computed dilatancy angle ψ can reach 59°, which is clearly unreasonable. When evaluating the bearing capacity of sandy foundations, an excessively high dilatancy angle can significantly overestimate the foundation’s bearing capacity, leading to adverse effects on the engineering project. Therefore, in construction and numerical calculations, it is essential to reasonably estimate the dilatancy angle of coral sand while considering the actual stress levels and degrees of compaction.
These findings demonstrate a close relationship among the peak dilatancy angle, relative density, and confining stress. By establishing empirical correlations, it is possible to accurately predict the peak friction angle of sand. According to Bolton [13], in order for sand to exhibit a certain dilatancy angle, the soil must have a corresponding degree of density, and the stress level should not be too high so as to avoid particle breakage. The following dilatancy index can be used to evaluate the dilatancy behavior of sands:
I R = D r Q ln p f R
In this equation, Q and R are constants, and pf is the peak mean effective stress. When 0 < IR < 4, the difference between the φp and the φcv is described as follows:
Δ φ = φ p φ c v = m I R
In this expression, m is a dimensionless parameter. Based on the analysis of extensive plane strain and triaxial test data, Bolton suggests that m should be taken as 5 under plane strain conditions and 3 under triaxial conditions. Under both conditions, the dilatancy index IR and the strain increment ratio satisfy the following relationship:
I R = 10 3 d ε v d ε 1 max
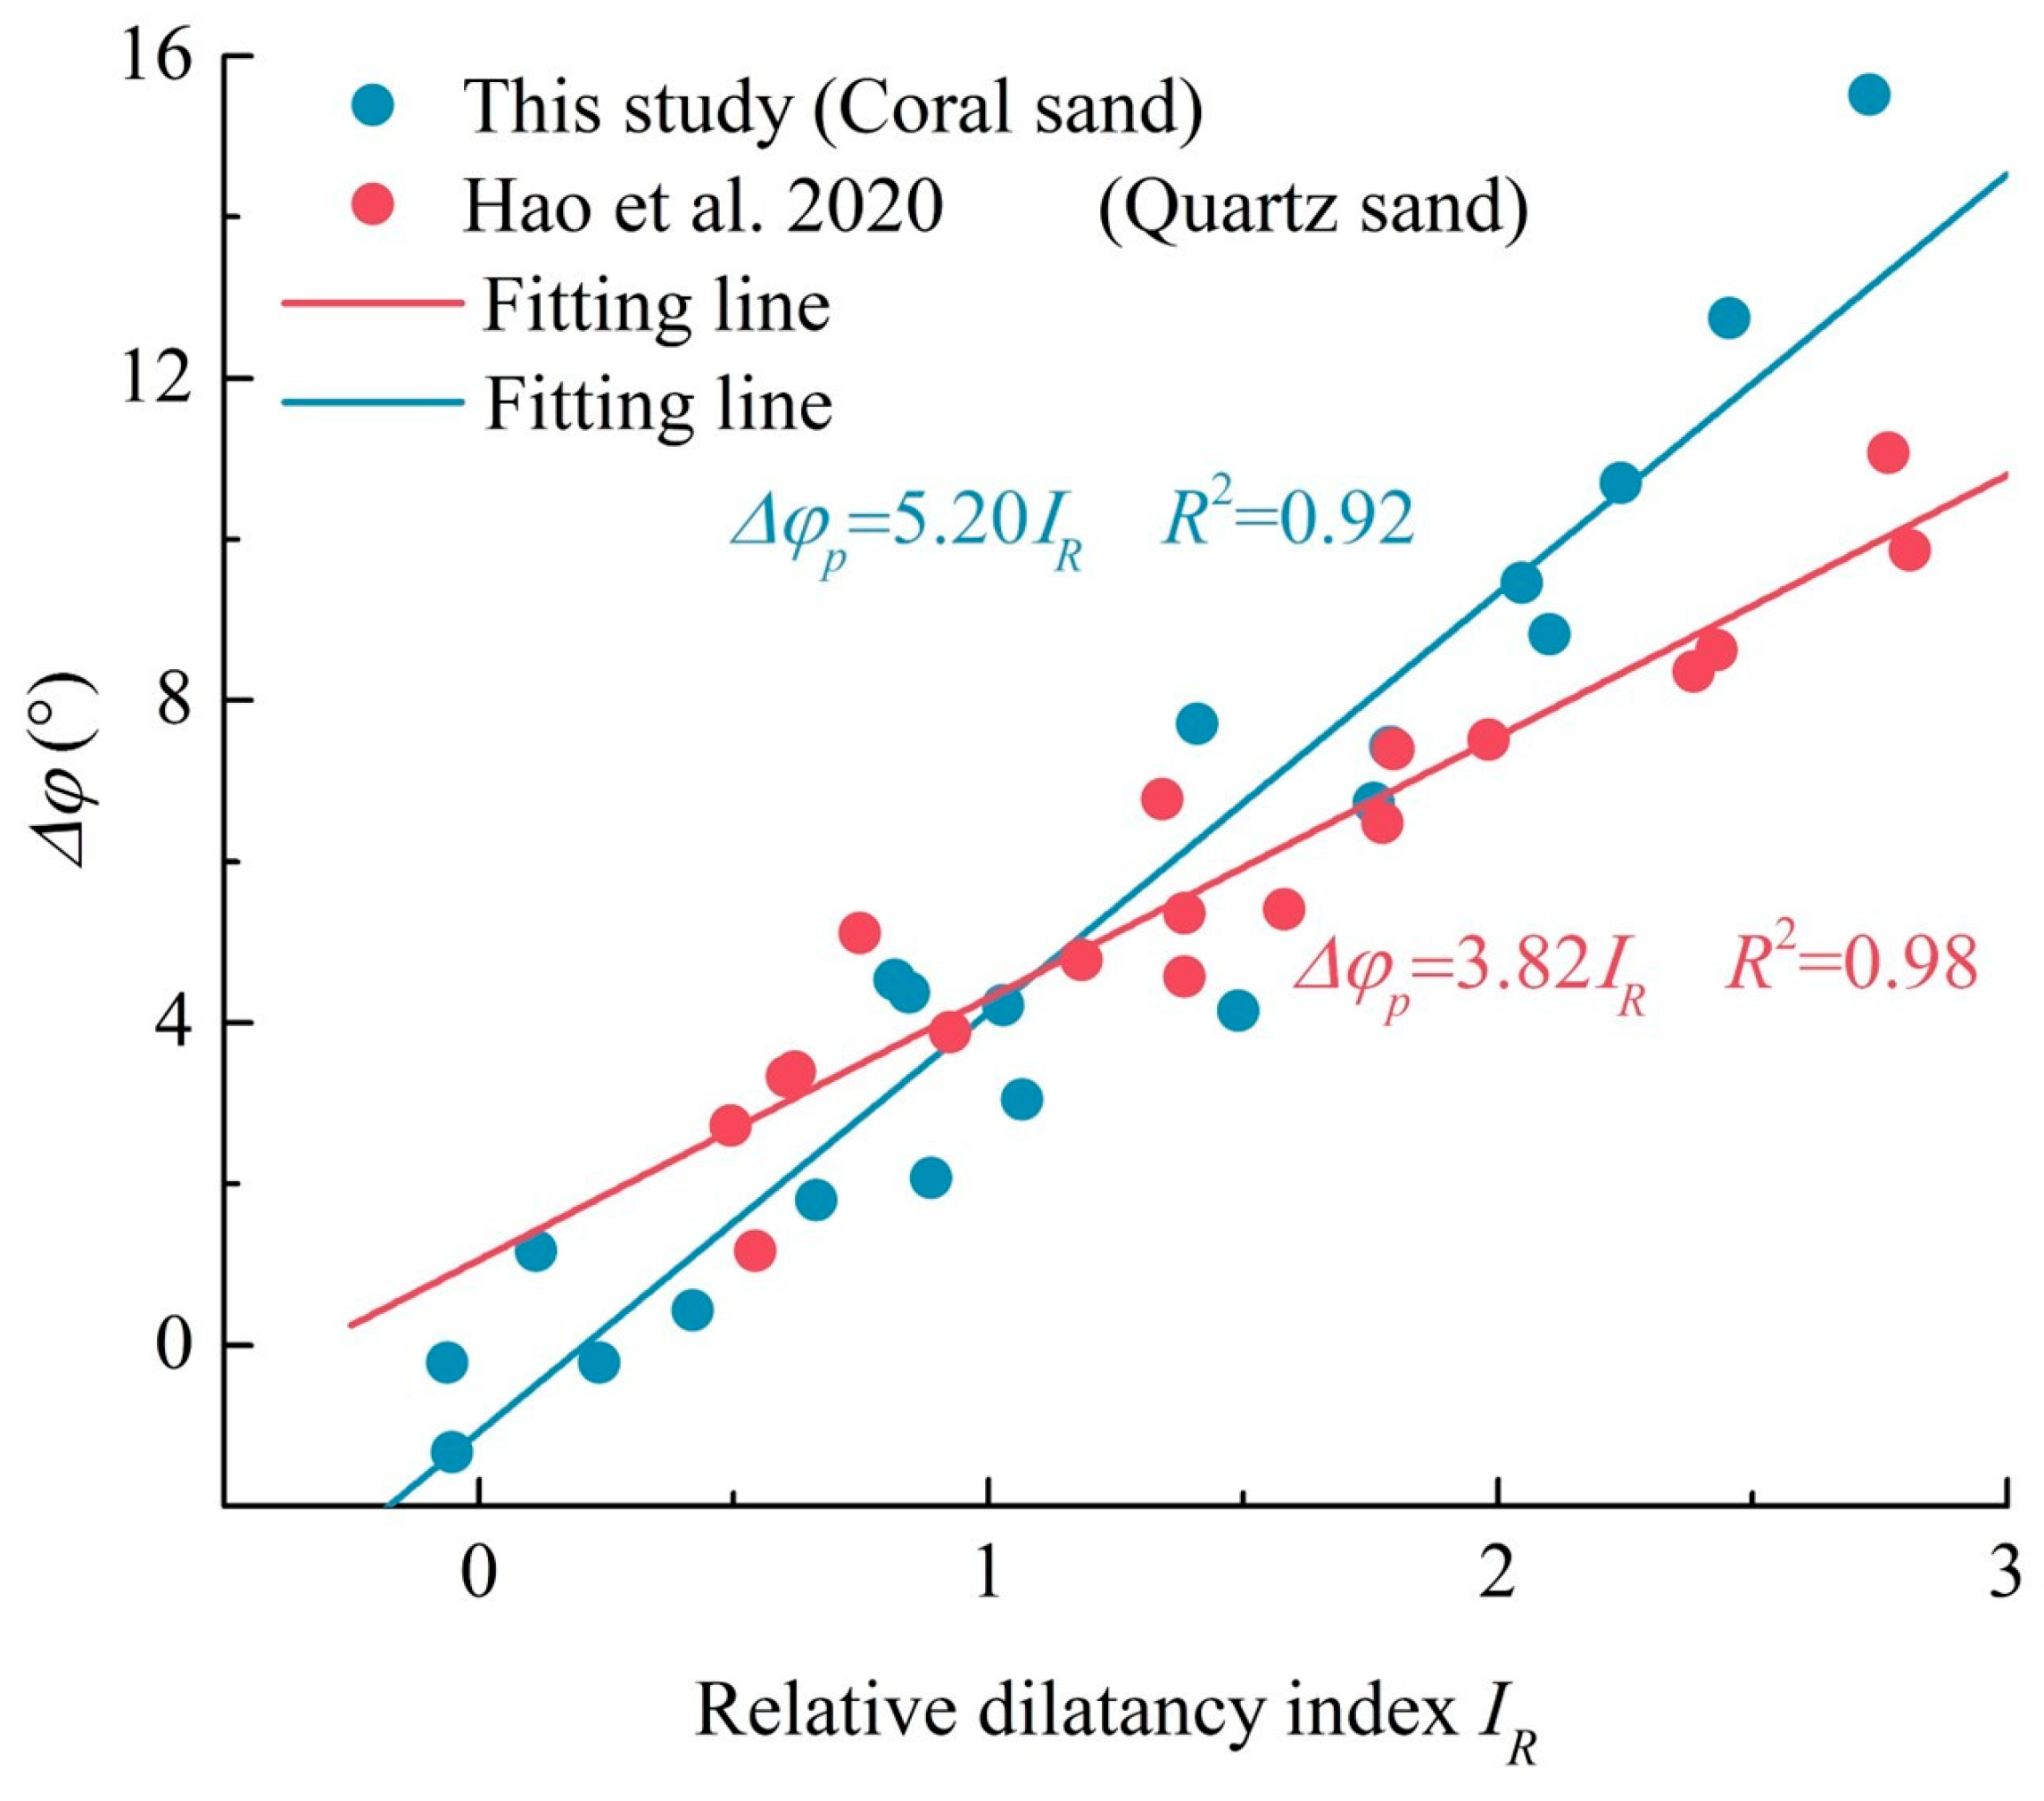
Here, (3/1)max represents the maximum value of the strain increment ratio. Figure 9 shows the relationship curve between the dilatancy index (IR) and the difference in friction angle Δφ for coral sand in this study. For comparison, the figure also includes corresponding results for quartz sand from previous studies [15]. The results indicate that the fitted coefficient m for coral sand in this study is 5.2, which means that for every unit increase in the dilatancy index (IR), the corresponding peak friction angle increases by 5.2°. In contrast, for quartz sand, each unit increase in IR results in only a 3.82° increase in the peak friction angle. Previous research has shown that, since coral sand particles are more prone to crushing than quartz sand particles, part of the energy applied during shearing is consumed in particle breakage. This leads to coral sand experiencing a greater shear force than quartz sand for the same increment in IR. Furthermore, the rearrangement of particles after coral sand breakage makes the specimen denser, further increasing its overall strength. This may be an important reason for the difference in the rate of increase in the friction angle between the two sands [24].
After normalizing Equation (6), it can be rewritten as follows:
I R = D r Q ln 100 p f p a R
In this equation, pa denotes the standard atmospheric pressure. By combining Equations (7) and (9), the following expression is obtained:
φ p φ c v m = D r Q ln 100 p f p a R
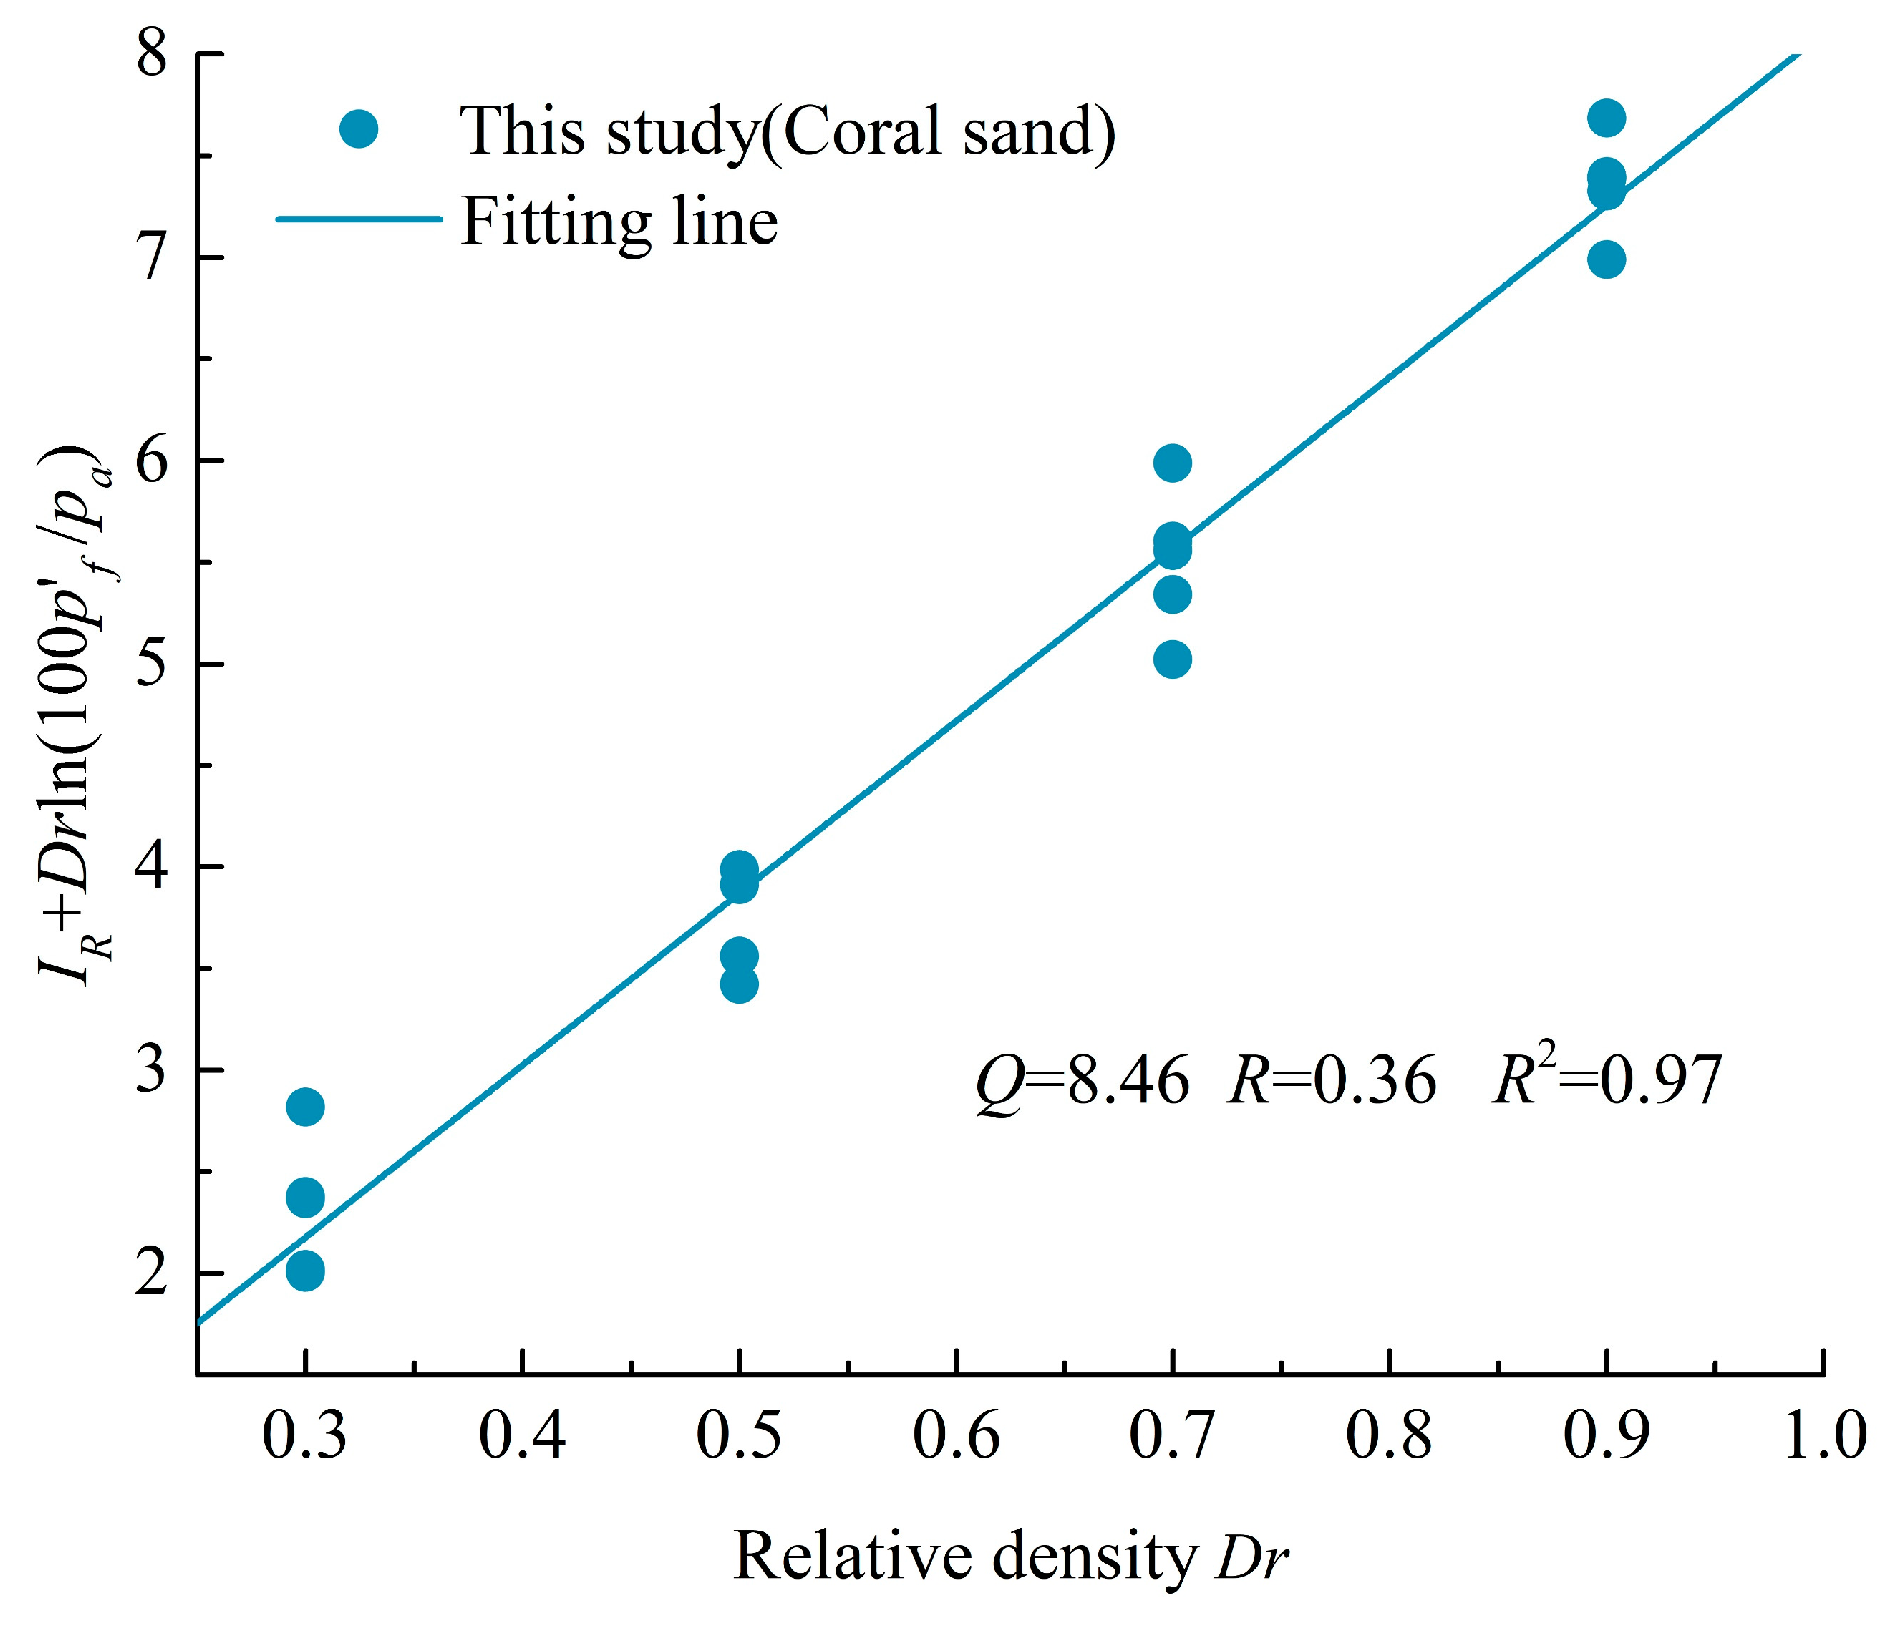
To establish a correlation expression among the peak friction angle, relative density, and peak mean effective stress, the relationship between Dr and IR + Drln(100p’/pa) was plotted in Figure 10 and fitted accordingly. The results show that the dimensionless parameters Q and R in Equation (10) are 8.46 and 0.36, respectively, with a fitting degree R2 of 0.97. By substituting the value of parameter m and combining Equations (5) and (10), the prediction formula for the peak friction angle of coral sand considering the dilatancy effect can be obtained:
φ p = 5.2 D r 8.46 ln 100 p p a 0.36 + 45.3
Salgado et al. [39] provided dilatancy parameters for Ottawa sand with different fines contents. When the fines content is 0, the values of Q and R are 9.0 and 0.49, respectively; when the fines content ranges from 5% to 20%, Q ranges from 7.3 to 11.4, and R ranges from −0.6 to 1.29. Hao et al. [15], through high-pressure triaxial tests, presented the dilatancy index of medium quartz sand at confining pressures of 200–8000 kPa for different relative densities, with Q and R values of 10.05 and −0.26, respectively. Wang et al. [24] reported that for medium coral sand, the fitted coefficients Q and R are 4.63 and −1.52, respectively. It can be seen that the fitted value of Q is generally positive, while R may be either negative or positive. When R is negative, it indicates that samples at different relative density levels exhibit strain-softening behavior, with the peak friction angle greater than the critical state friction angle. When R is positive, it suggests that, at lower relative density levels, the calculated peak friction angle is less than the critical state friction angle. Accordingly, the fitted result of R > 0 in this study is associated with the calculated peak friction angle (φp) for specimens with low relative density. At higher confining pressure levels, the calculated peak friction angle (φp) becomes lower than the critical state friction angle (φcv).

4. Conclusions

In this study, a range of drained triaxial shear tests were conducted to systematically analyze the dilatancy behavior of coral sand under varying stress conditions and relative densities, as well as its influence on shear strength parameters. Based on Bolton’s dilatancy theory, a stress–dilatancy equation suitable for coral sand was established. The results provide a scientific basis for the selection of relevant parameters in the engineering design and calculation involving coral sand. The main conclusions and findings of this study are as follows:
(1) Under confining pressures ranging from 25 to 400 kPa, the deviator stress–axial strain curves of coral sand samples exhibit varying degrees of strain-softening behavior. The volumetric strain–axial strain curves and the stress ratio–dilatancy index relationships indicate that the critical effective confining pressure for the transition from dilative to contractive behavior is approximately 400 kPa, at which point the dilatancy of coral sand is significantly suppressed.
(2) With increasing effective confining pressure, the peak internal friction angle (φp) of coral sand decreases significantly, and the rate of decrease is related to the relative density. For samples with Dr = 30%, 50%, 70%, and 90%, the peak internal friction angle decreases by 4.40°, 5.86°, 7.75°, and 10.50°, respectively, for each unit increase in lgσ3′. This indicates that samples with higher relative densities are more sensitive to changes in confining pressure.
(3) For coral sand, which exhibits a typical high internal friction angle, the maximum dilatancy angle at an effective confining pressure level of 25 kPa can reach 44.2°, significantly exceeding the dilatancy angle range of approximately 20° observed in terrigenous quartz sands. This disparity may be attributable to the unique particle irregularity and angular morphology characteristic of coral sand.
(4) Based on Bolton’s dilatancy theory, the theoretical relationships among the peak internal friction angle, peak dilatancy angle, and critical state friction angle of coral sand within a confining pressure range of 25 to 400 kPa were established. An expression describing the stress–dilatancy relationship in terms of the IR, Dr, and pf was developed.
It should be noted that the definition of coral sand in the current academic literature is rather ambiguous, with notable differences in the mineral composition, structural characteristics, and other properties of coral sand materials used in various studies. Therefore, the results of this study are most applicable to describing the stress–dilatancy relationship of coral sand sampled from the specific location investigated. When selecting and comparing relevant parameters, it is important to consider the influence and limitations that may arise from the differences among various coral sand materials.

Author Contributions

Conceptualization, Z.C.; data curation, Y.S.; formal analysis, Y.S.; funding acquisition, Z.C.; investigation, Y.S.; methodology, Y.S.; project administration, L.J.; resources, Z.C.; supervision, Z.C.; validation, X.Z.; visualization, Y.S.; writing—original draft, Y.S. and Z.C.; writing—review and editing, L.J. and X.Z. All authors have read and agreed to the published version of the manuscript.

Funding

This work was funded by the National Natural Science Foundation of China (No. 51968015).

Data Availability Statement

The original contributions presented in this study are included in the article. Further inquiries can be directed to the corresponding author.

Conflicts of Interest

The authors declare no conflict of interest.

References

  1. Yang, J.; Xu, D.; Shen, J.; Wei, H.; Wang, R.; Xiao, X. Effect of Coral Sand Powders and Seawater Salinity on the Impact Mechanical Properties of Cemented Coral Sand. Soils Found. 2022, 62, 101206. [Google Scholar] [CrossRef]
  2. Chen, B.; Ye, Y.; Wang, D.; Li, Y.; Xiong, J.; Qu, C. Seismic Response Characteristics and Liquefaction Risk of Artificial Island with Saturated Hydraulic Fill Coral Sand. Ocean. Eng. 2024, 317, 120025. [Google Scholar] [CrossRef]
  3. Wang, X.-Z.; Jiao, Y.-Y.; Wang, R.; Hu, M.-J.; Meng, Q.-S.; Tan, F.-Y. Engineering Characteristics of the Calcareous Sand in Nansha Islands, South China Sea. Eng. Geol. 2011, 120, 40–47. [Google Scholar] [CrossRef]
  4. Shen, Y.; Zhu, Y.; Liu, H.; Li, A.; Ge, H. Macro-Meso Effects of Gradation and Particle Morphology on the Compressibility Characteristics of Calcareous Sand. Bull. Eng. Geol. Environ. 2017, 77, 1047–1055. [Google Scholar] [CrossRef]
  5. Shahnazari, H.; Jafarian, Y.; Tutunchian, M.A.; Rezvani, R. Probabilistic Assessment of Liquefaction Occurrence in Calcareous Fill Materials of Kawaihae Harbor, Hawaii. Int. J. Geomech. 2016, 16, 05016001. [Google Scholar] [CrossRef]
  6. Coop, M.R. The Mechanics of Uncemented Carbonate Sands. Géotechnique 1990, 40, 607–626. [Google Scholar] [CrossRef]
  7. Wang, T.; Ma, L.; Wang, M.; Li, Z.; Zhang, X.; Geng, H. Effects of Particle Shape on Dynamic Mechanical Behaviours of Coral Sand under One-Dimensional Compression. Eng. Geol. 2022, 304, 106624. [Google Scholar] [CrossRef]
  8. Rowe, P.W. The Stress-Dilatancy Relation for Static Equilibrium of an Assembly of Particles in Contact. Proc. R. Soc. Lond. A Math. Phys. Sci. 1962, 269, 500–527. [Google Scholar] [CrossRef]
  9. Guo, P.; Su, X. Shear Strength, Interparticle Locking, and Dilatancy of Granular Materials. Can. Geotech. J. 2007, 44, 579–591. [Google Scholar] [CrossRef]
  10. Koerner, R.M. Effect of Particle Characteristics on Soil Strength. J. Soil Mech. Found. Div. 1970, 96, 1221–1234. [Google Scholar] [CrossRef]
  11. Mirghasemi, A.A.; Rothenburg, L.; Matyas, E.L. Influence of Particle Shape on Engineering Properties of Assemblies of Two-Dimensional Polygon-Shaped Particles. Géotechnique 2002, 52, 209–217. [Google Scholar] [CrossRef]
  12. Chen, C.; Gu, J.; Peng, Z.; Dai, X.; Liu, Q.; Zhu, G.-Q. Discrete Element Modeling of Particles Sphericity Effect on Sand Direct Shear Performance. Sci. Rep. 2022, 12, 5490. [Google Scholar] [CrossRef] [PubMed]
  13. Bolton, M.D. The Strength and Dilatancy of Sands. Géotechnique 1986, 36, 65–78. [Google Scholar] [CrossRef]
  14. Esposito, M.P.; Andrus, R.D. Peak Shear Strength and Dilatancy of a Pleistocene Age Sand. J. Geotech. Geoenviron. Eng. 2016, 143, 04016079. [Google Scholar] [CrossRef]
  15. Hao, D.; Yue, C.; Chen, R.; Ren, J.; Chen, F. Shear characteristics and stress-dilation relation of medium sand under normal to high pressures. Chin. J. Geotech. Eng. 2020, 42, 765–772. [Google Scholar] [CrossRef]
  16. Vaid, Y.P.; Sasitharan, S. The Strength and Dilatancy of Sand. Can. Geotech. J. 1992, 29, 522–526. [Google Scholar] [CrossRef]
  17. Yin, J.-H.; Wang, Y.-J.; Selvadurai, A.P.S. Influence of Nonassociativity on the Bearing Capacity of a Strip Footing. J. Geotech. Geoenviron. Eng. 2001, 127, 985–989. [Google Scholar] [CrossRef]
  18. Erickson, H.L.; Drescher, A. Bearing Capacity of Circular Footings. J. Geotech. Geoenviron. Eng. 2002, 128, 38–43. [Google Scholar] [CrossRef]
  19. De Borst, R.; Vermeer, P.A. Discussion: Possibilities and Limitations of Finite Elements for Limit Analysis. Géotechnique 1985, 35, 90–94. [Google Scholar] [CrossRef]
  20. Loukidis, D.; Salgado, R. Bearing Capacity of Strip and Circular Footings in Sand Using Finite Elements. Comput. Geotech. 2009, 36, 871–879. [Google Scholar] [CrossRef]
  21. Griffiths, D.V. Computation of Bearing Capacity Factors Using Finite Elements. Géotechnique 1982, 32, 195–202. [Google Scholar] [CrossRef]
  22. Lin, H.-D.; Wang, W.-C.; Li, A.-J. Investigation of Dilatancy Angle Effects on Slope Stability Using the 3D Finite Element Method Strength Reduction Technique. Comput. Geotech. 2019, 118, 103295. [Google Scholar] [CrossRef]
  23. Phuor, T.; Harahap, I.S.H.; Ng, C.Y. Bearing Capacity Factors of Flat Base Footing by Finite Elements. J. Geotech. Geoenviron. Eng. 2022, 148, 04022062. [Google Scholar] [CrossRef]
  24. Wang, X.; Wu, Y.; Lu, Y.; Cui, J.; Wang, X.; Zhu, C. Strength and Dilatancy of Coral Sand in the South China Sea. Bull. Eng. Geol. Environ. 2021, 80, 8279–8299. [Google Scholar] [CrossRef]
  25. Dong, K.; Ren, H.; Ruan, W.; Huang, K. Dynamic Mechanical Behavior of Different Coral Sand Subjected to Impact Loading. Proc. Inst. Mech. Eng. Part C J. Mech. Eng. Sci. 2020, 235, 1512–1523. [Google Scholar] [CrossRef]
  26. GB/T 50123-2019; Standard for Geotechnical Testing Method. China Planning Publishing House: Beijing, China, 2019.
  27. Liu, S.; Matsuoka, H. Microscopic Interpretation on a Stress-Dilatancy Relationship of Granular Materials. Soils Found. 2003, 43, 73–84. [Google Scholar] [CrossRef]
  28. D4767-11 (Reapproved 2020); Standard Test Method for Consolidated Undrained Triaxial Compression Test for Cohesive Soils. ASTM International: West Conshohocken, PA, USA, 2020.
  29. Lade, P.V.; Yamamuro, J.A. Undrained Sand Behavior in Axisymmetric Tests at High Pressures. J. Geotech. Eng. 1996, 122, 120–129. [Google Scholar] [CrossRef]
  30. Wu, Y.; Li, N.; Wang, X.; Cui, J.; Chen, Y.; Wu, Y.; Yamamoto, H. Experimental Investigation on Mechanical Behavior and Particle Crushing of Calcareous Sand Retrieved from South China Sea. Eng. Geol. 2020, 280, 105932. [Google Scholar] [CrossRef]
  31. Gutierrez, M. Modeling of the Steady-State Response of Granular Soils. Soils Found. 2003, 43, 93–105. [Google Scholar] [CrossRef]
  32. Zhang, J.-M.; Zhang, L.; Jiang, G.-S.; Wang, R. Research on Particle Crushing of Calcareous Sands under Triaxial Shear. Rock Soil Mech. 2008, 29, 2789–2793. [Google Scholar] [CrossRef]
  33. Lv, C.; Wu, H.; Shi, M.; Zhang, D. Experimental Study on the Mechanical Strength, Deformation Behavior and Infiltration Characteristics of Coral Sand. Sustainability 2024, 16, 3479. [Google Scholar] [CrossRef]
  34. Vermeer, P.A. Non-Associated Plasticity for Soils, Concrete and Rock. In Physics of Dry Granular Media; Springer: Dordrecht, The Netherlands, 1998; pp. 163–196. [Google Scholar]
  35. Dickin, E.A. Uplift Behavior of Horizontal Anchor Plates in Sand. J. Geotech. Eng. 1988, 114, 1300–1317. [Google Scholar] [CrossRef]
  36. Frydman, S.; Shaham, I. Pullout Capacity of Slab Anchors in Sand. Can. Geotech. J. 1989, 26, 385–400. [Google Scholar] [CrossRef]
  37. Chakraborty, T.; Salgado, R. Dilatancy and Shear Strength of Sand at Low Confining Pressures. J. Geotech. Geoenviron. Eng. 2010, 136, 527–532. [Google Scholar] [CrossRef]
  38. Hassanlourad, M.; Salehzadeh, H.; Shahnazari, H. Drained Shear Strength of Carbonate Sands Based on Energy Approach. Int. J. Geotech. Eng. 2014, 8, 1–9. [Google Scholar] [CrossRef]
  39. Salgado, R.; Bandini, P.; Karim, A. Shear Strength and Stiffness of Silty Sand. J. Geotech. Geoenviron. Eng. 2000, 126, 451–462. [Google Scholar] [CrossRef]
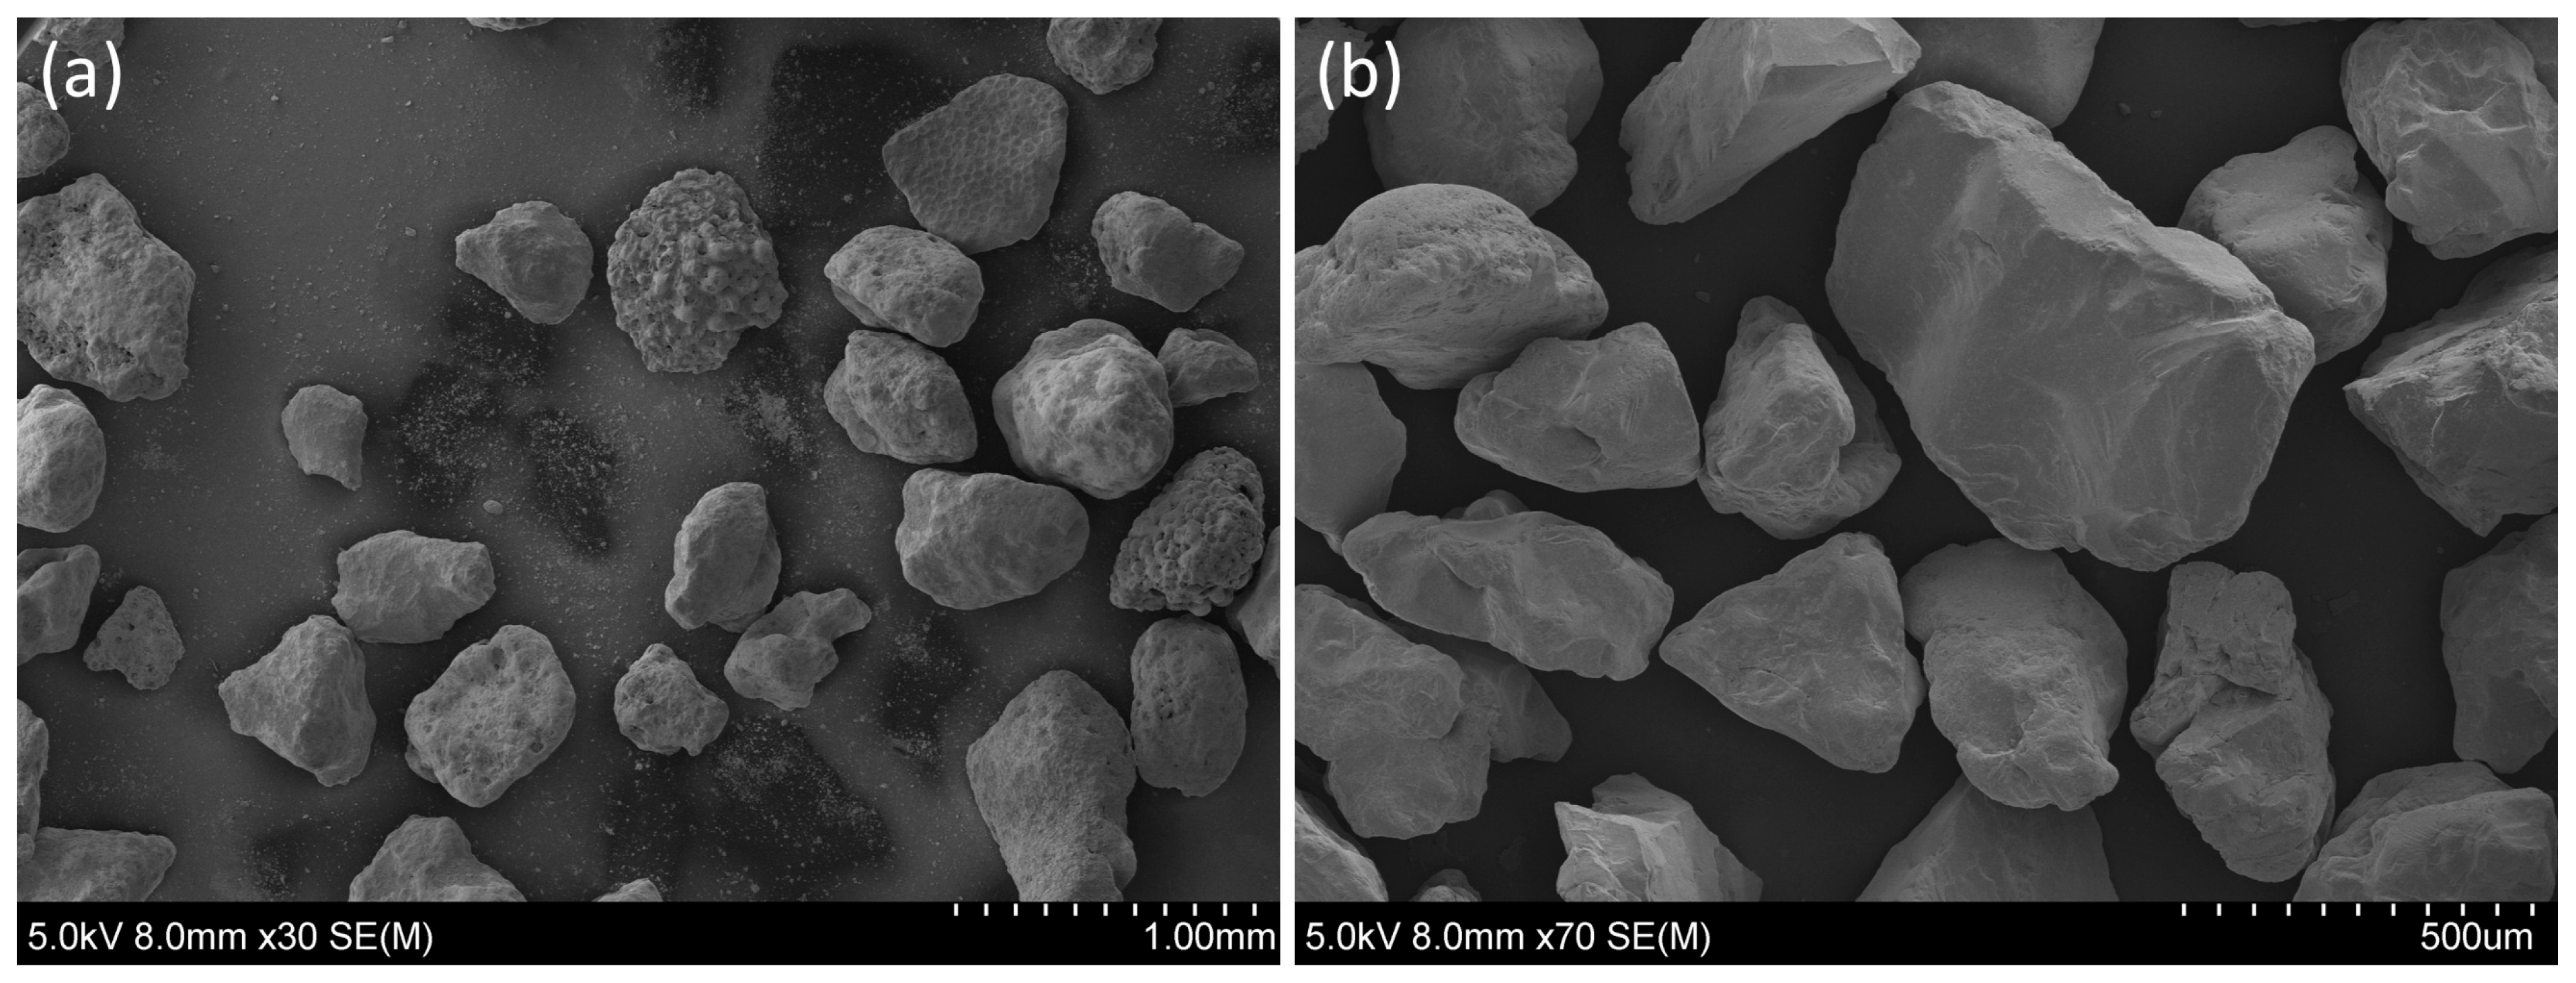
Figure 1. Results of scanning electron microscopy (SEM): (a) particle morphology of coral sand; (b) particle morphology of quartz sand.
Jmse 13 01255 g001
Figure 2. Particle size distribution curve of the coral sand specimen.
Jmse 13 01255 g002
Figure 3. Deviator stress–axial strain curves of coral sand.
Jmse 13 01255 g003
Figure 4. Volumetric strain-axial strain curves of coral sand.
Jmse 13 01255 g004
Figure 5. Relationship between stress ratio (K) and dilatancy coefficient (D) of coral sand: (a) relative density Dr = 50%; (b) confining pressure σ3′ = 200 kPa.
Jmse 13 01255 g005
Figure 6. Relationship between σ3′ and φp.
Jmse 13 01255 g006
Figure 7. Theoretical dilatancy model of sand particles.
Jmse 13 01255 g007
Figure 8. Relationship between peak internal friction angle (φp) and peak dilatancy angle (ψp) for different sands ([9,13,14,16,24]).
Jmse 13 01255 g008
Figure 9. Fitted relationship between Δφ and dilatancy index (IR) [15].
Jmse 13 01255 g009
Figure 10. Determination of stress–dilatancy parameters (Q and R) of coral sand.
Jmse 13 01255 g010
Table 1. Basic physical properties of the coral sand.
ParameterUnitValue
CaCO3, Calcium carbonate content%95
Gs, Specific gravity of solidsmm2.80
d10, Effective particle sizemm0.15
d50, Average particle sizemm0.58
Cu, Coefficient of uniformity-5.2
Cc, Coefficient of curvature-1.02
ρmax, Maximum dry densityg/cm31.78
ρmin, Minimum dry densityg/cm31.34
Table 2. Summary of triaxial test conditions for coral sand.
Test No.Dr (%)σ′3 (kPa)Test No.Dr (%)σ′3 (kPa)
CD13025CD117025
CD23050CD127050
CD330100CD1370100
CD430200CD1470200
CD530400CD1570400
CD65025CD169025
CD75050CD179050
CD850100CD1890100
CD950200CD1990200
CD1050400CD2090300
Table 3. Calculated results of peak internal friction angle and peak dilatancy angle of coral sand.
σ3′ (kPa)Peak Internal Friction Angle φp (°)Peak Dilatancy Angle ψp (°)
Dr = 30%Dr = 50%Dr = 70%Dr = 90%Dr = 30%Dr = 50%Dr = 70%Dr = 90%
2549.4552.0256.0062.8216.7520.9730.4544.24
5047.3749.5254.1258.048.3510.5327.4335.64
10047.148.3553.0154.766.3310.9915.5626.32
20045.0845.7349.8352.722.13.858.0221.55
300---49.67---8.35
40043.9745.0846.47-−1.63−2.510.98-
Table 4. Comparison of shear test conditions and strength parameters between coral sand and quartz sand.
No.Test TypeSand TypeMain Compositionσ3
(kPa)
dmax
(mm)
d50
(mm)
φp,max (°)ψp,max (°)aReferences
1PlaneQuartz sandQuartz---57.524.20.8Bolton [13]
2PlaneToyoura sand5~98-0.1650.423.30.62Chakraborty
and Salgado [37]
3TriaxialToyoura sand4~197-0.1644.819.40.62Chakraborty
and Salgado [37]
4TriaxialErksak sand50~2500-0.3441.828.20.33Vaid [16]
5TriaxialOttawa sand100~5001.20.3738.412.30.63Guo and Su [9]
6TriaxialPleistocene age sand17~1385.00.1844.813.60.72Esposito and
Andrus [14]
7TriaxialChinese standard sand200~80001.00.3541.819.10.59Hao et al. [15]
8TriaxialLimestone sandCalcium carbonate100~5002.01.6448.111.70.91Guo and Su [9]
9TriaxialKish sand50~6000.160.5147.010.8-Hassanlourad
[38]
10TriaxialHormuz sand50~6000.180.5153.012.4-Hassanlourad
[38]
11TriaxialCoral sand150~300200.2944.017.50.5Wang et al. [24]
12TriaxialCoral sand25~4005.00.5862.844.20.34This study
Note: The data in No. 1 are compiled from various sands collected by Bolton [13], which are classified as quartz sand since their main mineral component is quartz. dmax is the maximum particle size of the sample, and a is the fitting coefficient in Equation (5).
Disclaimer/Publisher’s Note: The statements, opinions and data contained in all publications are solely those of the individual author(s) and contributor(s) and not of MDPI and/or the editor(s). MDPI and/or the editor(s) disclaim responsibility for any injury to people or property resulting from any ideas, methods, instructions or products referred to in the content.