1. Introduction
Amid rising global energy demand and worsening environmental impacts of fossil fuel consumption, the International Energy Agency (IEA) estimates that renewables must account for 90% of global electricity production by 2050 to meet carbon neutrality goals [
1]. Ocean wave energy—characterized by advantages in energy density, consistency, and availability—holds great potential [
2,
3]. Especially when it comes to the power demands for a large amount of distributed marine equipment, wave energy is an accessible energy source with the capability to make a critical addition to the current solution (solar PV plus battery) [
4].
To integrate with carriers (power demand platform), built-in power take off is developed, which could minimize the influence on its carrier in the overall hull form design. It also avoids the direct dynamic impact and corrosion from seawater, especially on the transmission and connection parts, making the system more robust. It can supply power to various sensors and collect information from the ocean, such as water temperature, pH value, dissolved oxygen and wave spectrum [
5]. Contemporary research on power take off can be categorized into two primary approaches. The first utilizes mechanical drive systems that transduce wave-induced reciprocating motion into rotational generator movement [
6]. The second implements direct electromagnetic induction through wave-driven relative motions between permanent magnets and conductive coils, achieving energy conversion without intermediate mechanical components [
7].
Wave energy conversion with generator rotation employs various mechanical configurations such as ball screws [
8], rack-and-pinion systems [
9], cable–pulley assemblies [
10], and belt transmission systems [
11]. Wang et al. [
12] developed a magnetic multi-stable pendulum that converts wave motion via pendulum dynamics, magnetic interactions, and universal joints, achieving efficient energy conversion. Chen et al. [
13] proposed a hybrid system combining a point absorber with a horizontal-axis turbine to harvest energy from both waves and tidal currents. Han et al. [
14] proposed a hybrid wind–wave energy harvester that integrates an anemometer cup rotor with an inertial pendulum to simultaneously capture both wave energy and offshore wind energy. However, mechanical transmission systems usually require more complex components, posing challenges for robustness in the dynamic marine environments. Existing wave energy technologies relying on multistage conversion exhibit inherent limitations like system complexity, maintenance costs, and transmission losses [
15,
16].
Emerging direct energy conversion technologies based on electromagnetic induction—such as linear generators—have attracted considerable interests [
17,
18]. These systems utilize the relative motion between permanent magnets (usually as motors) and coil arrays (usually as stators) to directly generate electricity [
19,
20]. Direct power take off enhances wave energy utilization through a simplified process, reducing cumulative losses in multi-stage conversion systems [
16]. For wave energy harvesting, Cui et al. [
21] developed a toroidal electromagnetic generator where a spherical magnet moving along a circular path induces flux variations in circumferential coils. Zhang et al. [
22] created an inertial energy harvester where buoy-induced oscillations drive a magnetic flywheel through ratchet-based transmission, converting reciprocating motion into unidirectional rotation. Lu et al. [
23] developed a self-powered marine environment monitoring system. Under minimal wave excitation, a rolling magnetic sphere undergoes oscillatory motion along a cavity, rotating around its center of mass to generate induced voltage.
Despite these advancements, some challenges remain [
24]. One of them is the startup performance under low amplitude conditions [
25,
26]. Many nations (like China) are situated in coastal regions with relatively low amplitude waves (compared with Western Europe or Australia) [
27]. That means, in considerable percentage of service time, marine distributed systems operate under mild waves. Under these conditions, floating structures exhibit limited motions [
28]. Wave induced motions are the excitation to wave energy converters. During mild sea states, they should also be able to produce the basic output to supply its users.
The study is among the earliest explorations that proposes a rolling mode, straight track electromagnetic wave energy converter. The design differs from previous ones in that it uses a cylindrical magnet roller to form a power take off without transmission. Straight track makes parallel arrangement of multiple units more accessible. While both the translation (e.g., along x-axis) and rotation (around y-axis) contribute to the electromagnetic induction, the translation axis is not the rotation axis, which is different from the linear direct generator. The design is advantageous in startup easiness (i.e., can start operating under small amplitude motions), simple structure (e.g., transmission not required), and robustness (i.e., fewer solid constrains). By aligning the track into multiple directions, it could utilize energy from multiple degree of freedom, enhancing adaptability in the marine environment. The prototype could provide an in situ power supply for marine monitoring nodes through direct wave energy conversion.
2. Design and Working Principle of the Device
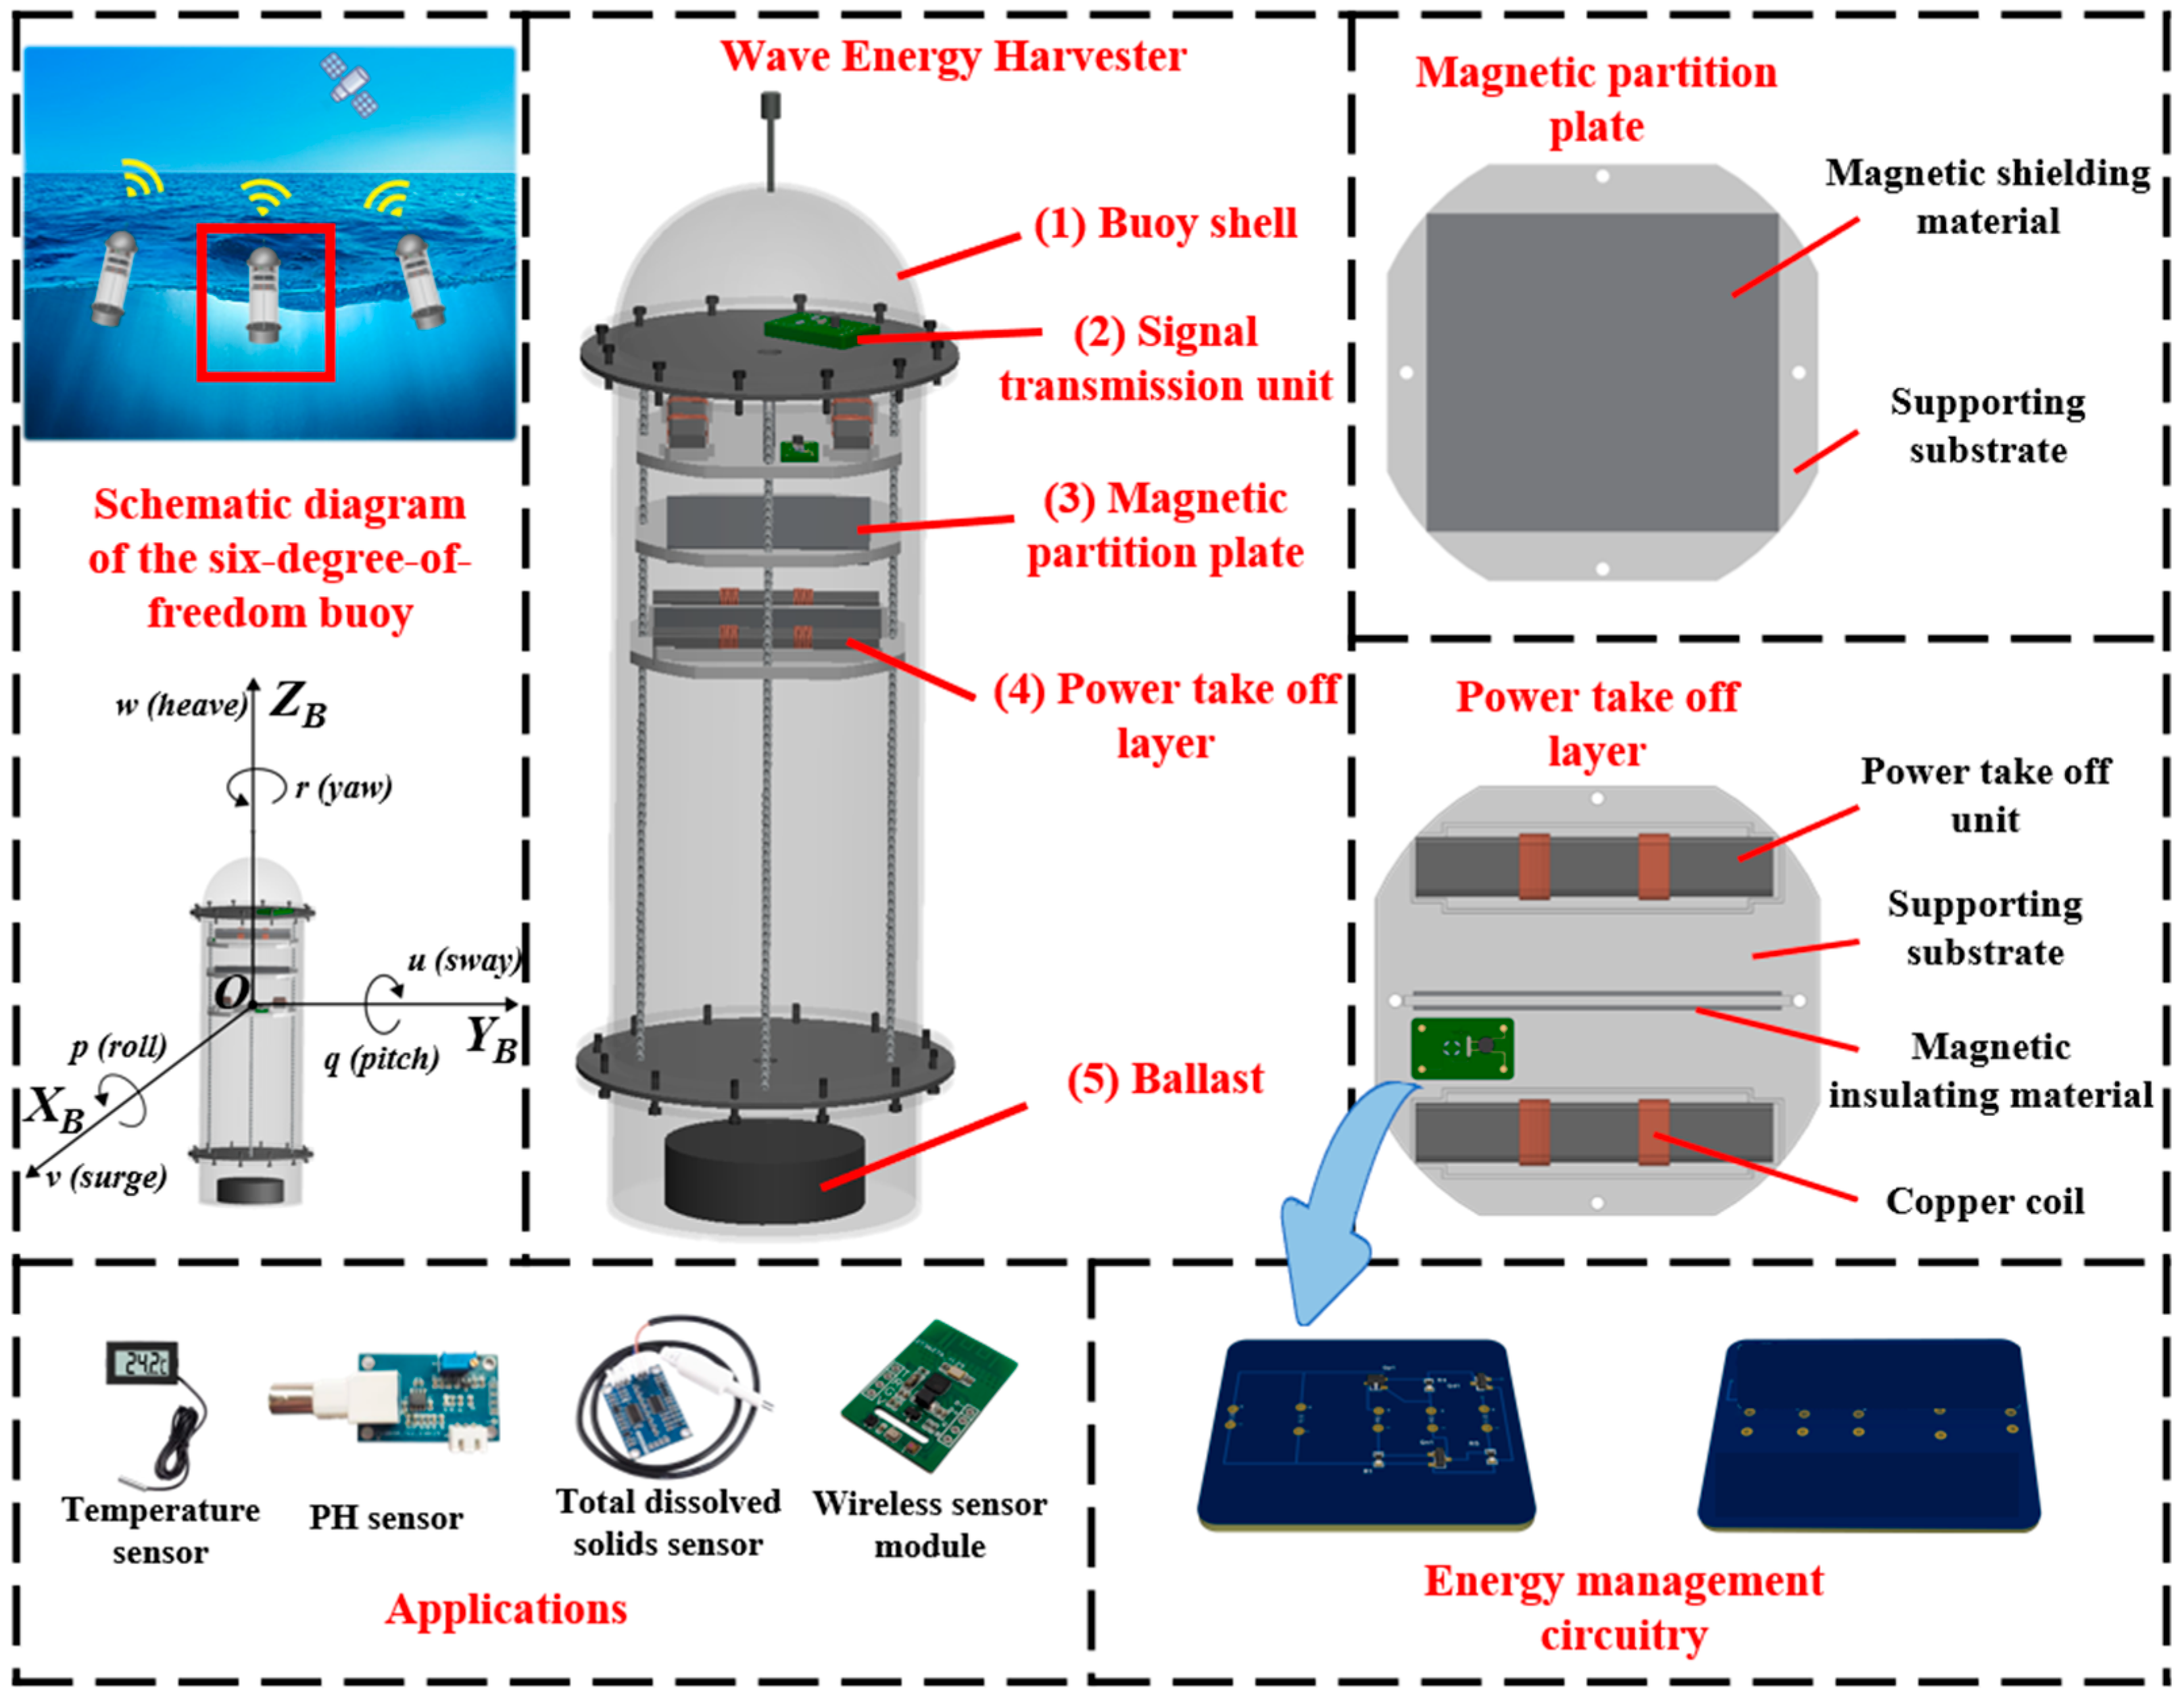
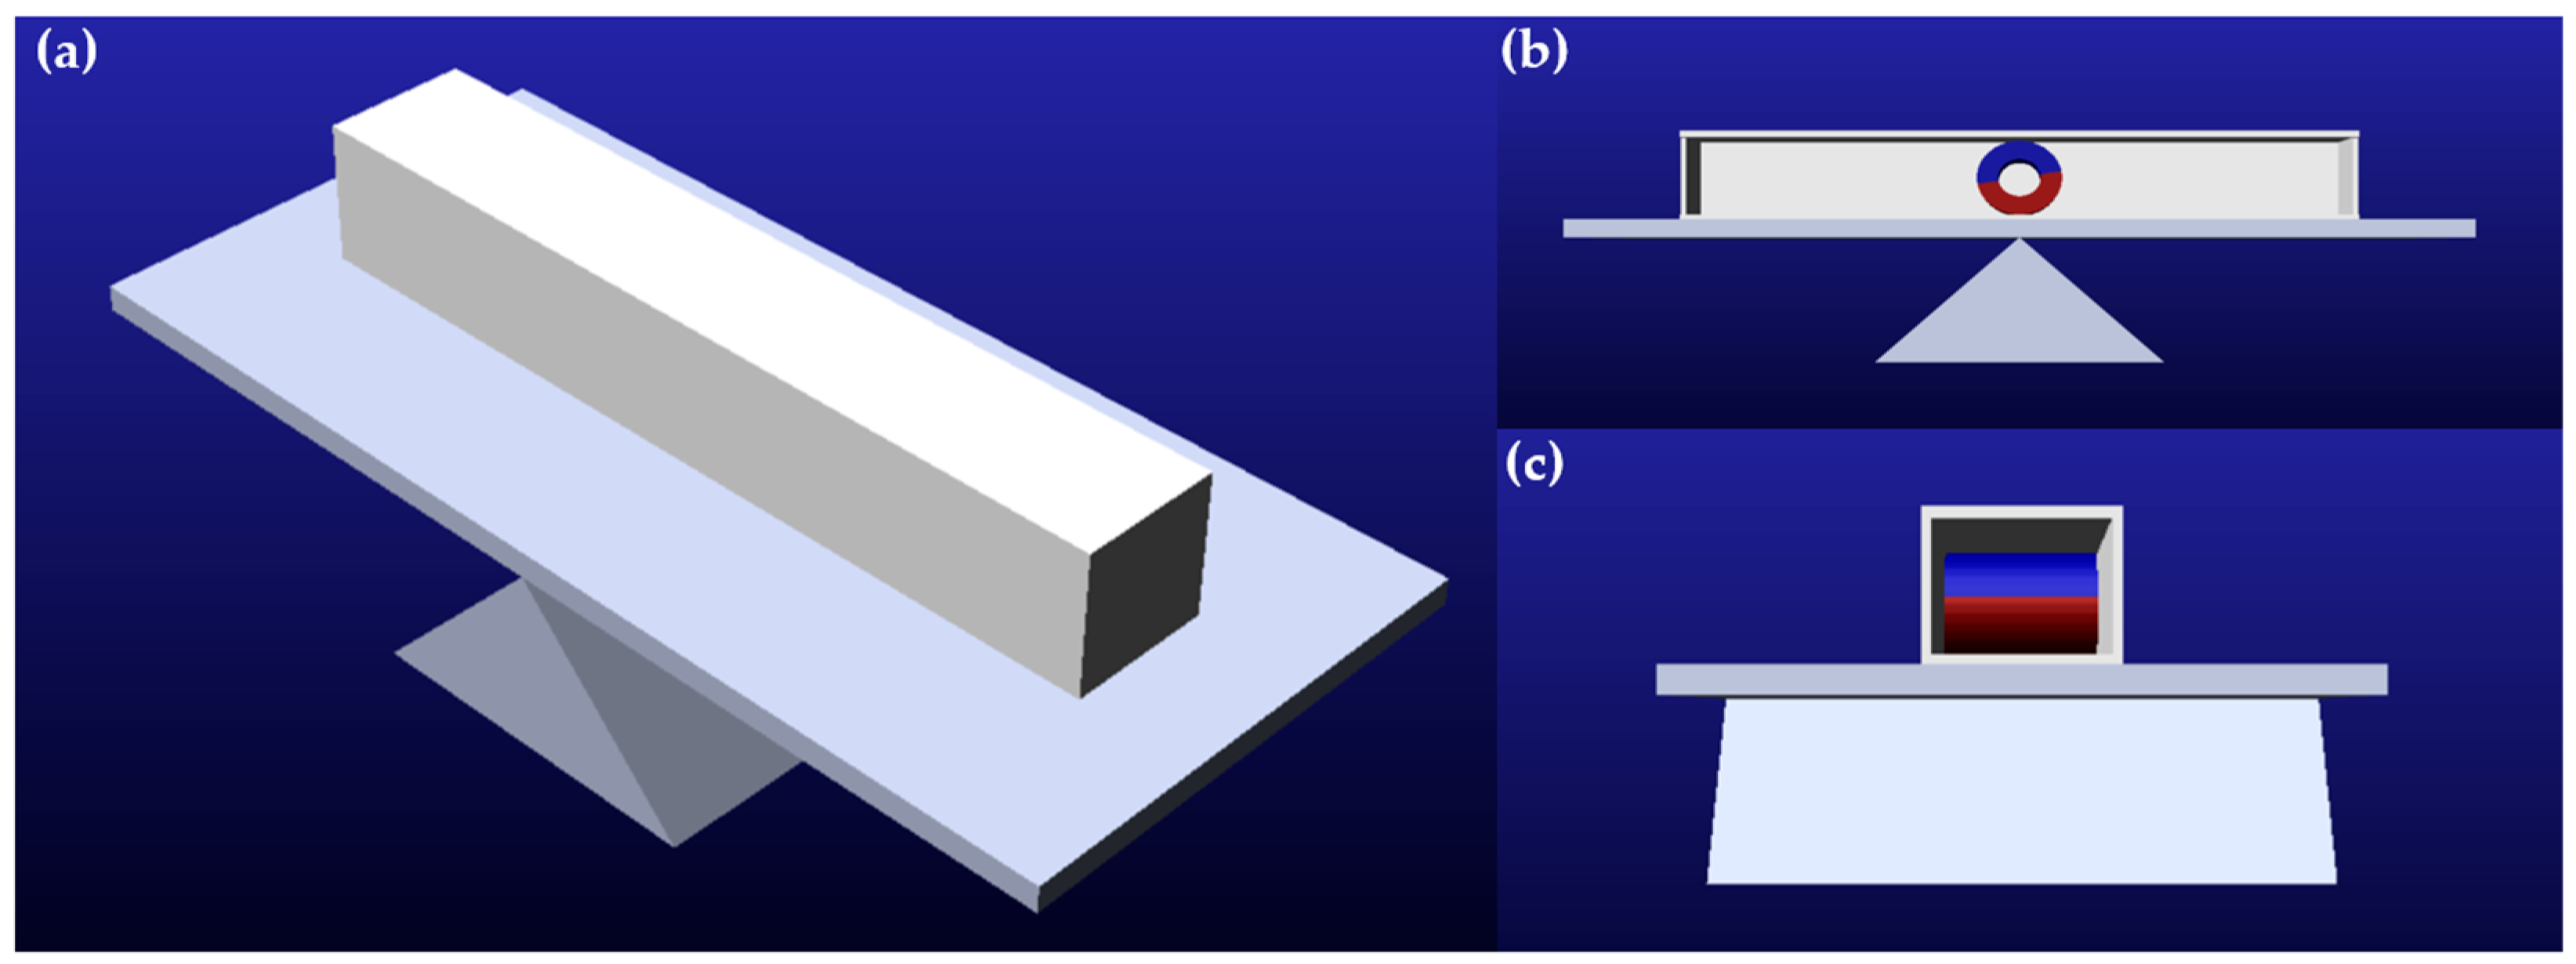
The study proposes a rolling-mode wave energy converter for powering marine monitoring nodes. As shown in
Figure 1, the power take off unit is encapsulated in a cylindrical buoy, forming a hermetic seal that protects it from direct seawater impact/corrosion. Wave excitations drive the motions of magnets relative to the copper coils, generating electricity through electromagnetic induction. The harvested energy is conditioned and stored in capacitors to power marine sensors.
As shown in
Figure 1, the buoy consists of five components: (1) buoy shell; (2) signal transmission unit; (3) multi-functional magnetic partition plates; (4) power take off layer (each layer composed of two units connected in series); and (5) ballast. A power take off layer assembly employs two series-connected power take off units spatially separated by a magnetic insulating material to minimize magnetic interference. Each unit comprises a direct electromagnetic generator incorporating a magnet that reciprocates on the track (with the copper coils around the track).
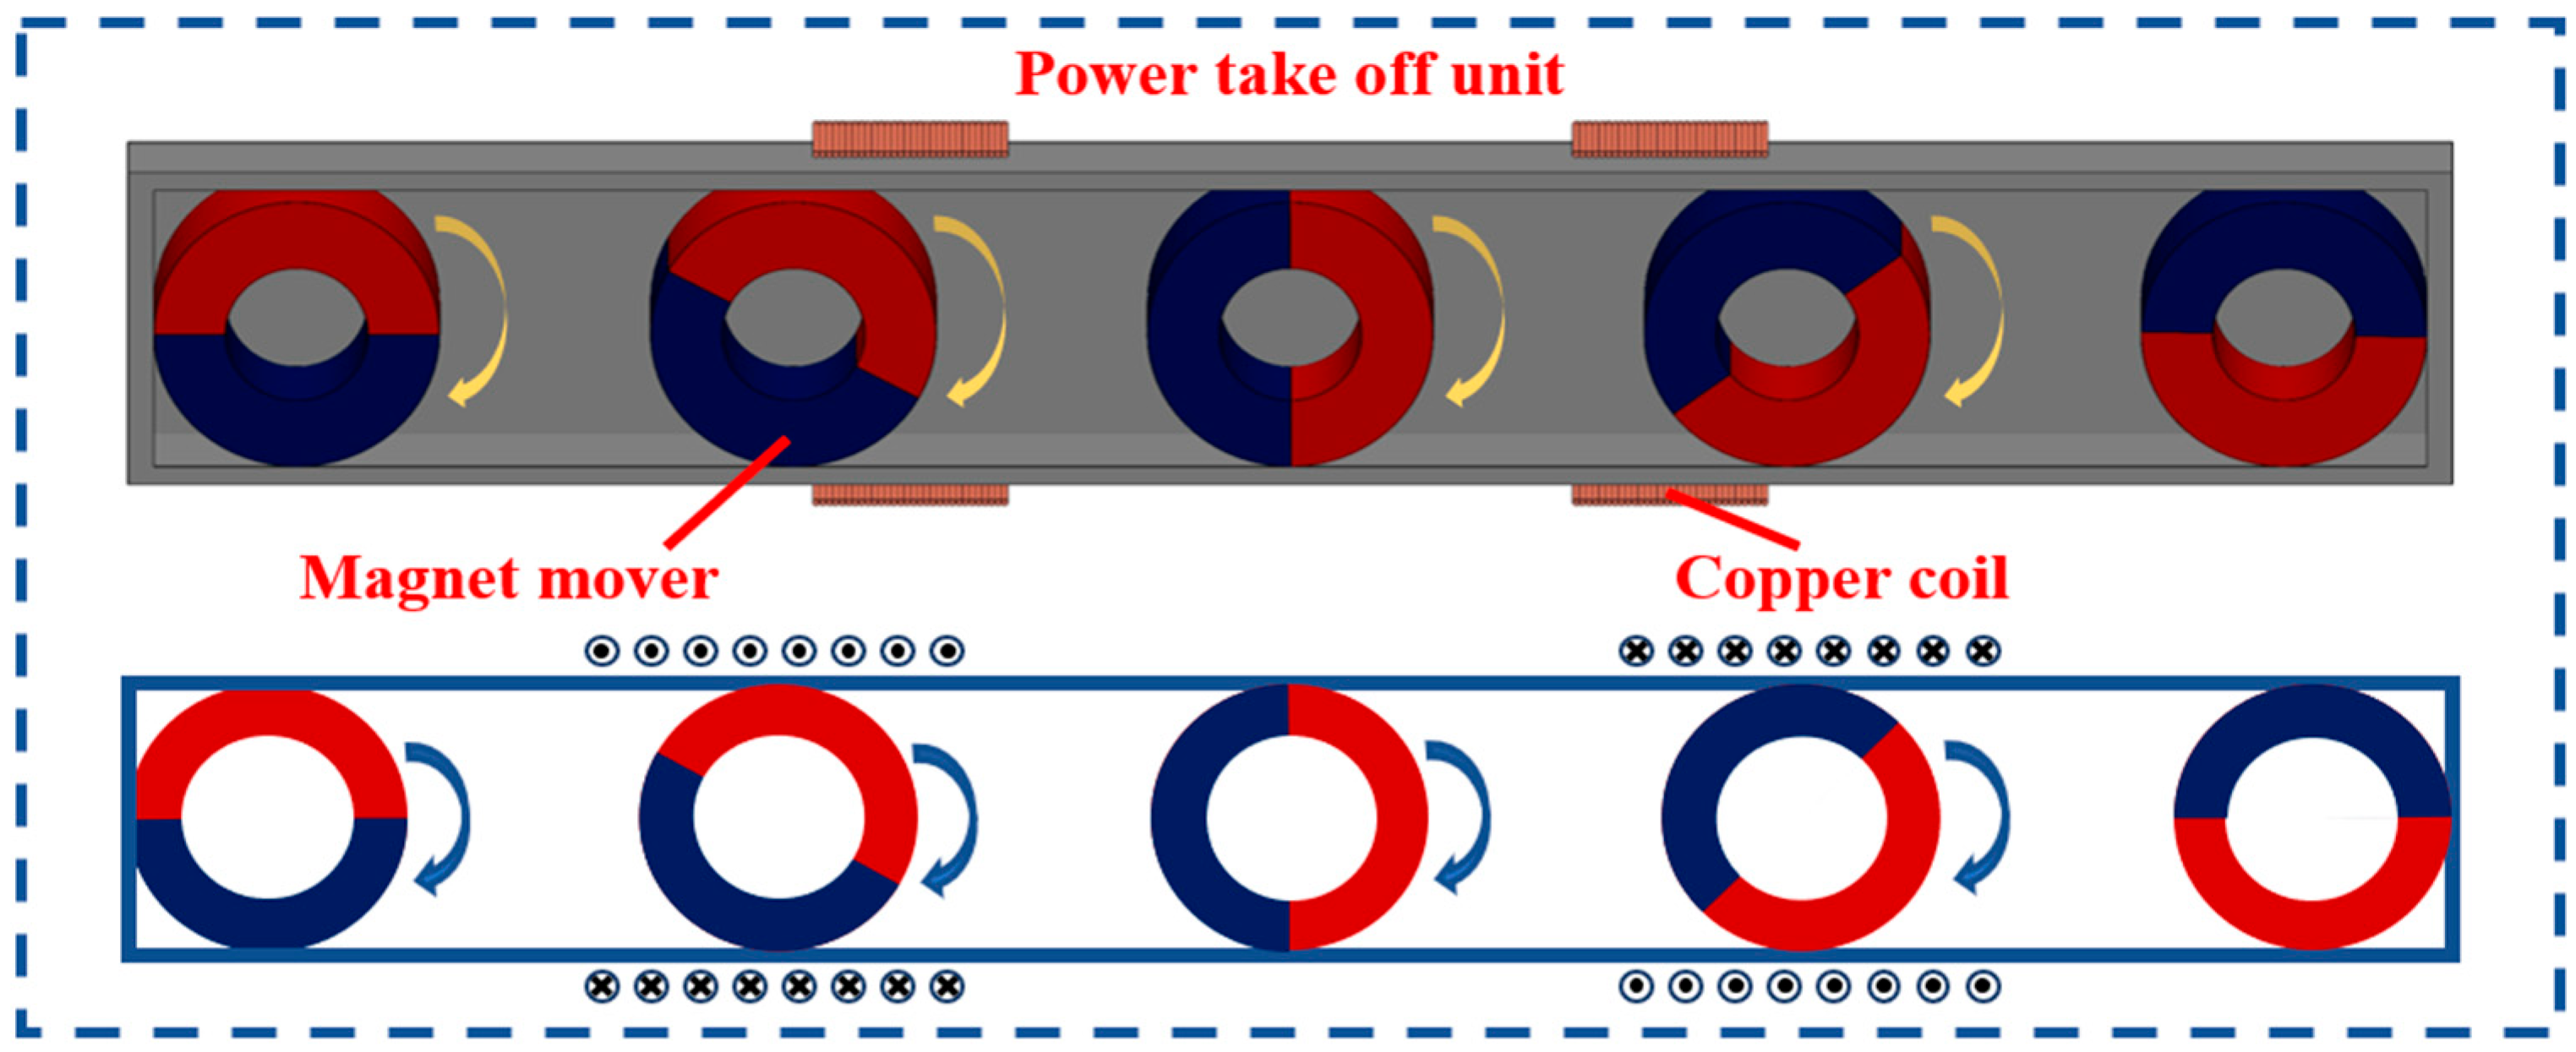
The magnet’s reciprocating translation motion and rotation (
Figure 2) enables magnetic flux cutting through the copper coils. This process generates induced electromotive force (EMF). The resulting alternating current is subsequently rectified and stored in energy storage systems using active power conditioning circuits.
Under wave excitation, the cylindrical magnet rolls on the track. According to the law of electromagnetic induction, if
V represents the induced EMF generated by the coil,
Φ represents the magnetic flux inside the coil, and
N represents the number of turns in the coil. The induced EMF can be obtained as follows:
Assuming the cylindrical magnet moves through the generator unit with velocity
v, traversal time
t, and displacement
x, the induced EMF can be derived by considering the spatial dependence of the magnetic flux density
B(x) and the coil cross-sectional area
S. The generalized expression is [
29]:
According to Equation (2), it is evident that the magnitude of the induced voltage is related to the speed of the magnet mover crossing the coil. The greater the moving speed magnitude, the higher the induced voltage generated in the coil. The speed of the magnet mover is related to the pitch angle of the wave energy converter.
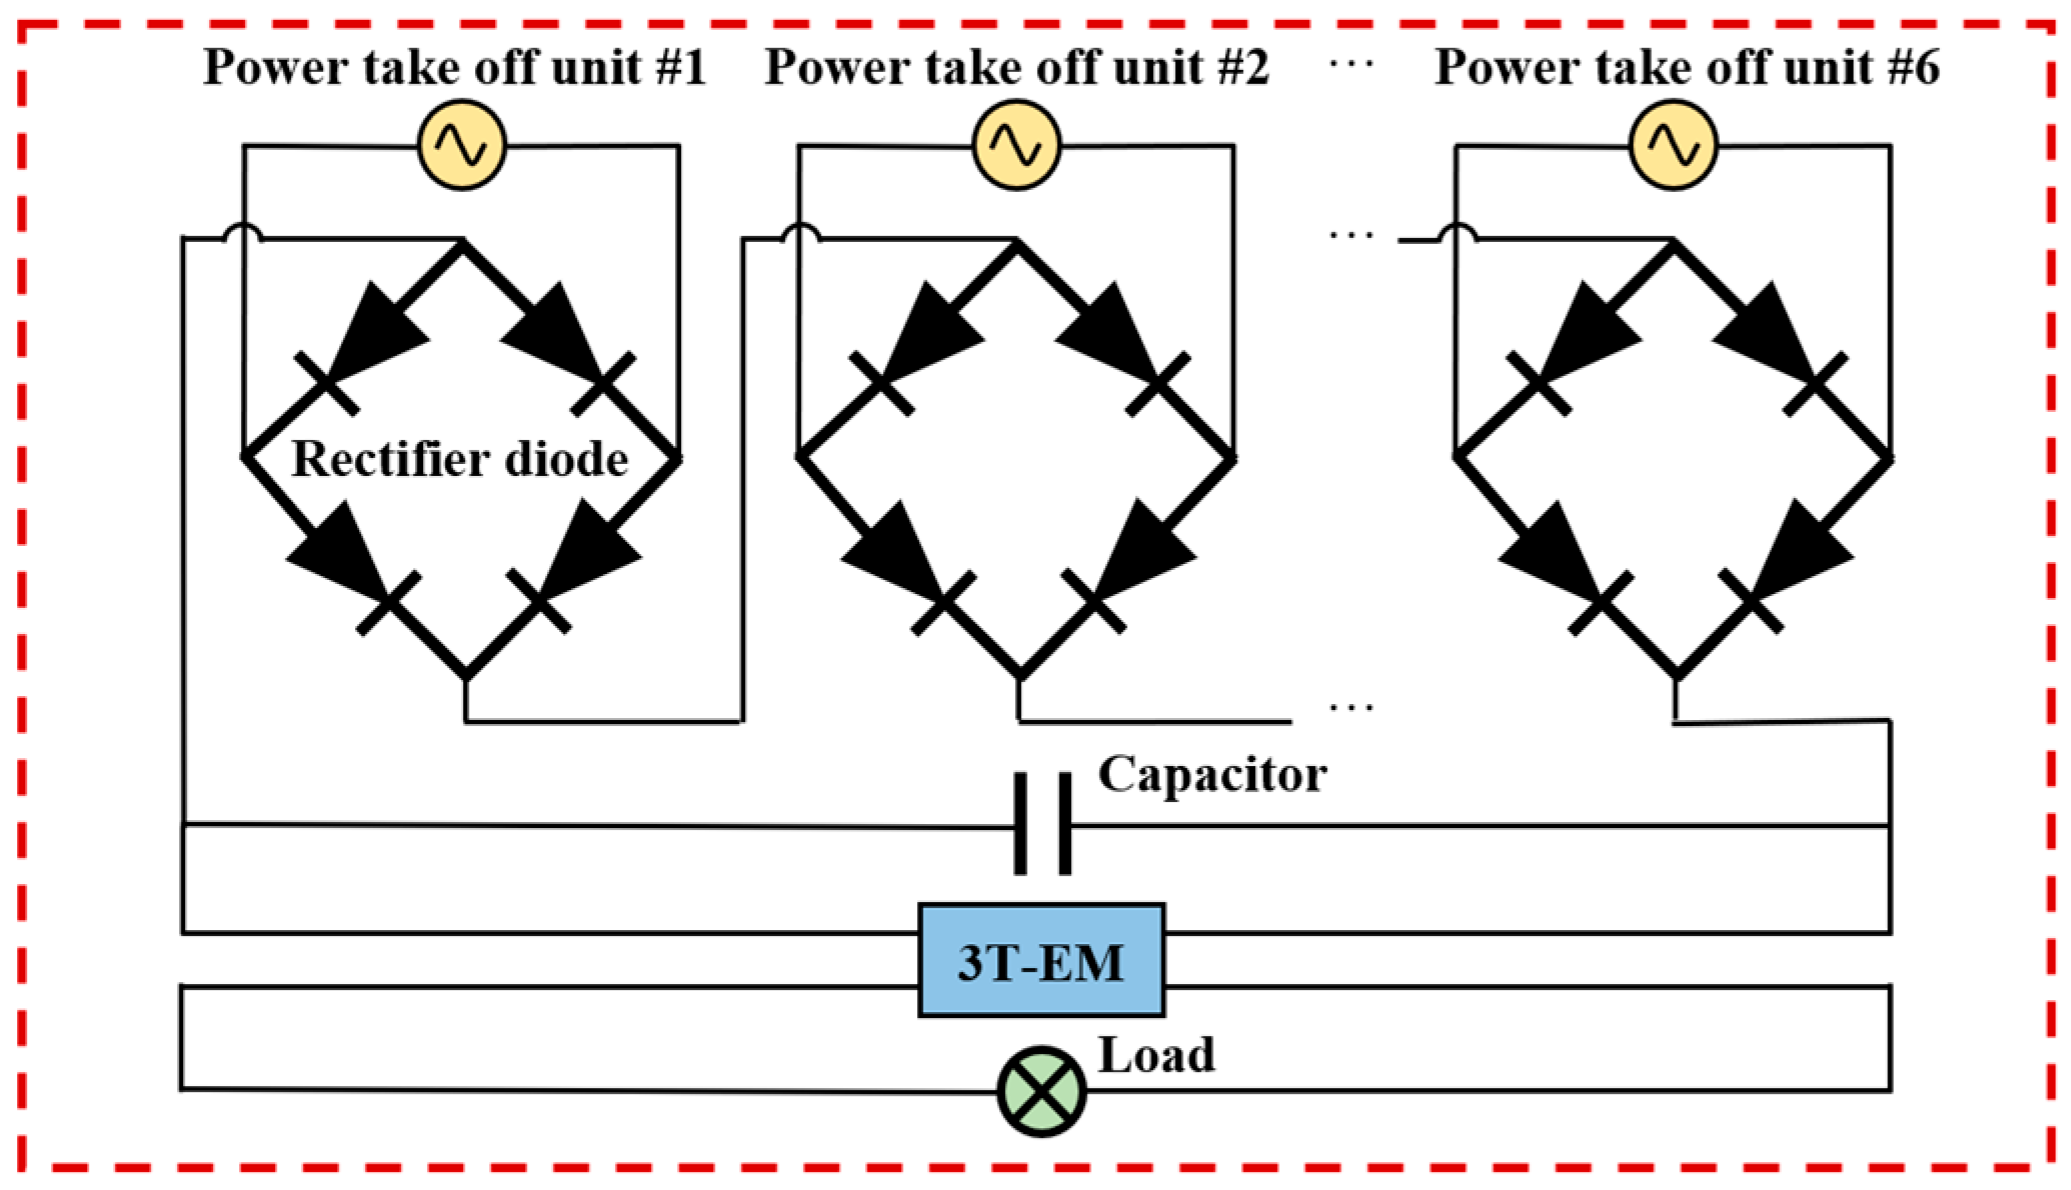
While the reciprocating motion of the cylindrical magnet generates alternating current, it needs to be rectified before it can be applied to the sensor. As illustrated in
Figure 3, a full-wave bridge rectifier comprising Schottky diodes is implemented to condition the multi-phase outputs from the power take off unit. Post-rectification, the system delivers a pulsed direct current.
To ensure relatively stable power output under varying input voltages and various user (load), a three-transistor active energy management (3T-EM) circuit was proposed and developed by Teng [
30]. The design of the 3T-EM circuit was used to deliver a stable output voltage to the load, effectively preventing it from both power supply voltage fluctuations and load variations.
3. Dynamic Analysis with WAMIT and ADAMS
Dynamic analysis were performed using WAMIT V5.4 and ADAMS View 2020 software, to evaluate the motion of the magnet mover under various pitch angles and frequencies. The response amplitude operator (RAO) of the buoy carrying the designed rolling-mode power take off was analyzed with WAMIT V5.4, a well-recognized frequency domain hydrodynamic software based on linear potential theory. Linear potential theory is a widely used, basic solution to the hydrodynamics of floating structures. However, as motion amplitude becomes larger, the importance of nonlinear effects grows, which reduces its accuracy [
31]. Computational fluid dynamics and physical model tests are necessary for the large motion amplitude cases.
Design parameters of the buoy are summarized in
Table 1. VCG is the vertical center of gravity of the designed buoy.
Ixx,
Iyy and
Izz are the mass moment of inertia about the VCG. As shown in
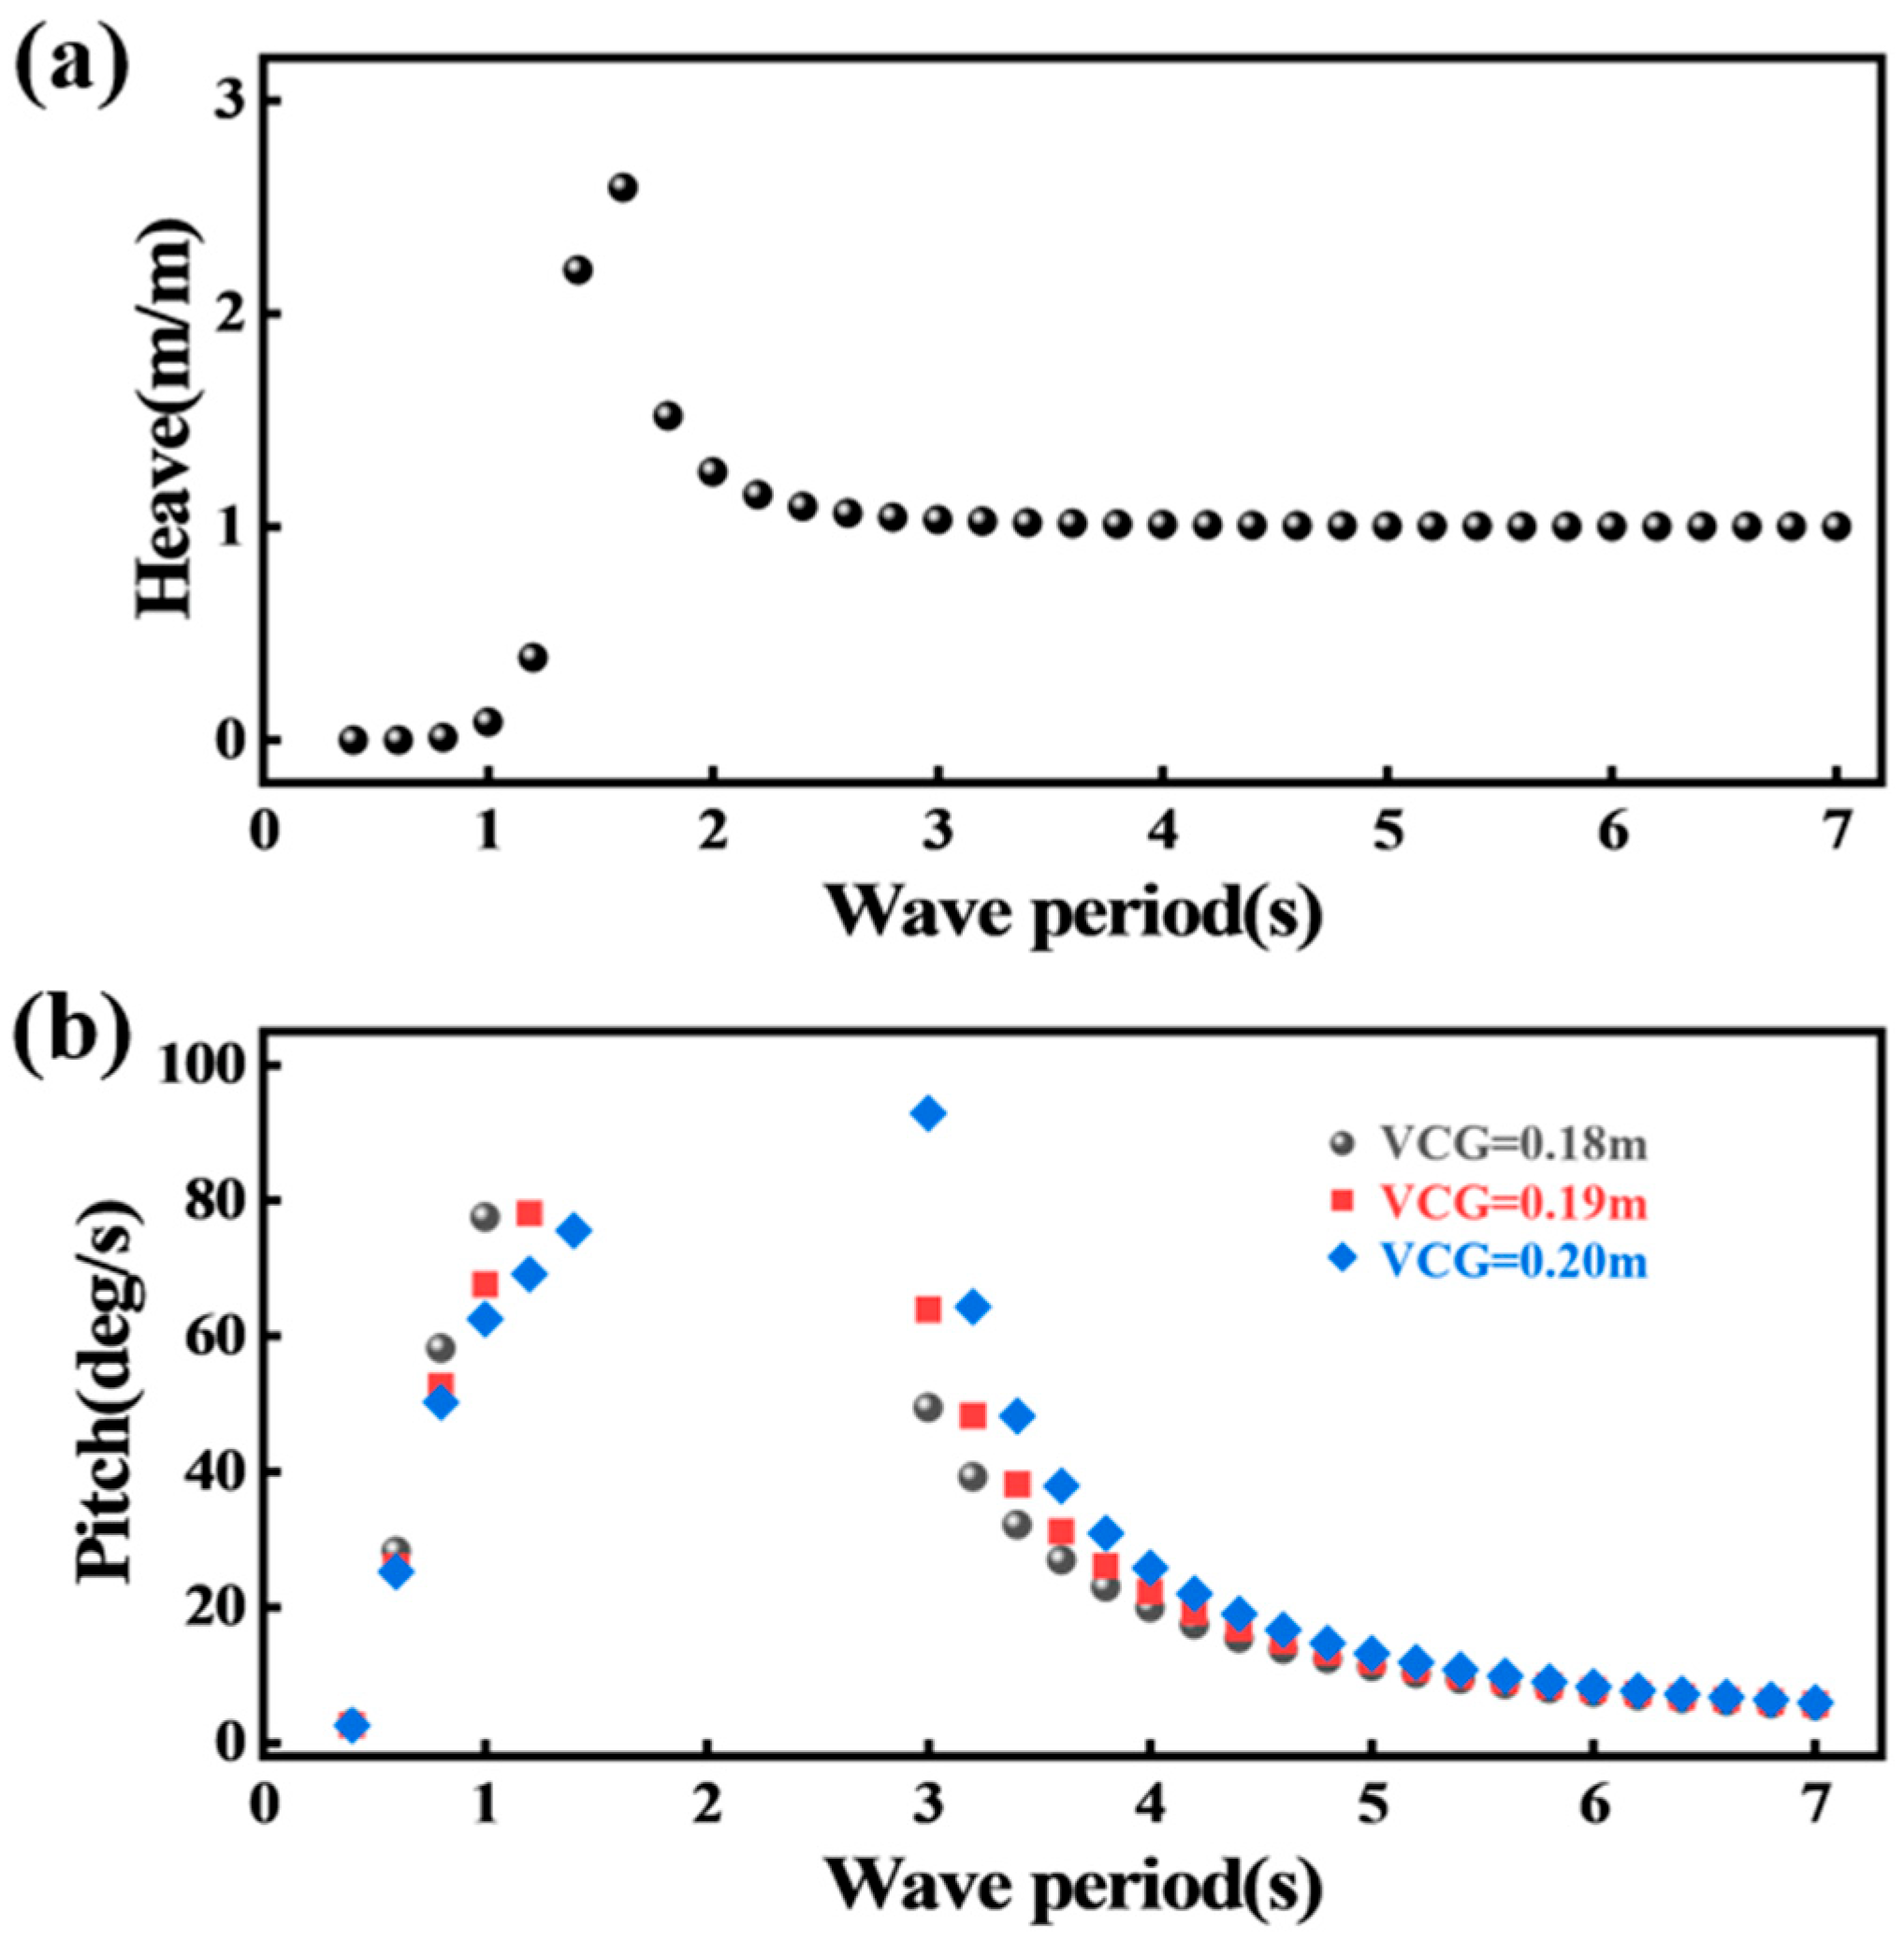
Figure 4a, the heave motion of the designed buoy yields a natural frequency of about 1.6 s. When wave period is above 2.8 s, the buoy follows the wave amplitude quite well (the heave amplitude has less than 5% difference from the wave amplitude).
Figure 4b shows the influence of different VCGs on the pitch RAO of the buoy. It is worth noting that in
Figure 4b the pitch response amplitude operator were cut off within 1.2–2.8 s period range. This is because this range is close to the natural period, where the pitch RAO becomes very large (>90°/m). Under this condition, nonlinearities are no longer neglectable, therefore the results given by linear potential flow theory (i.e., WAMIT RAO) may be less accurate [
31].
The buoy is designed according to the most common sea state of Dalian nearshore waters (wave height is about 1.0 m and wave period is about 3.6–4.0 s). According to the pitch RAO, the pitch amplitude of the buoy is estimated to be 10–19°, which is used in simulating the roller. The roller’s simulation model was constructed according to actual design dimensions, as shown in
Figure 5. ADAMS View 2020 software facilitated analysis of the mover’s motion response under various forced motion conditions.
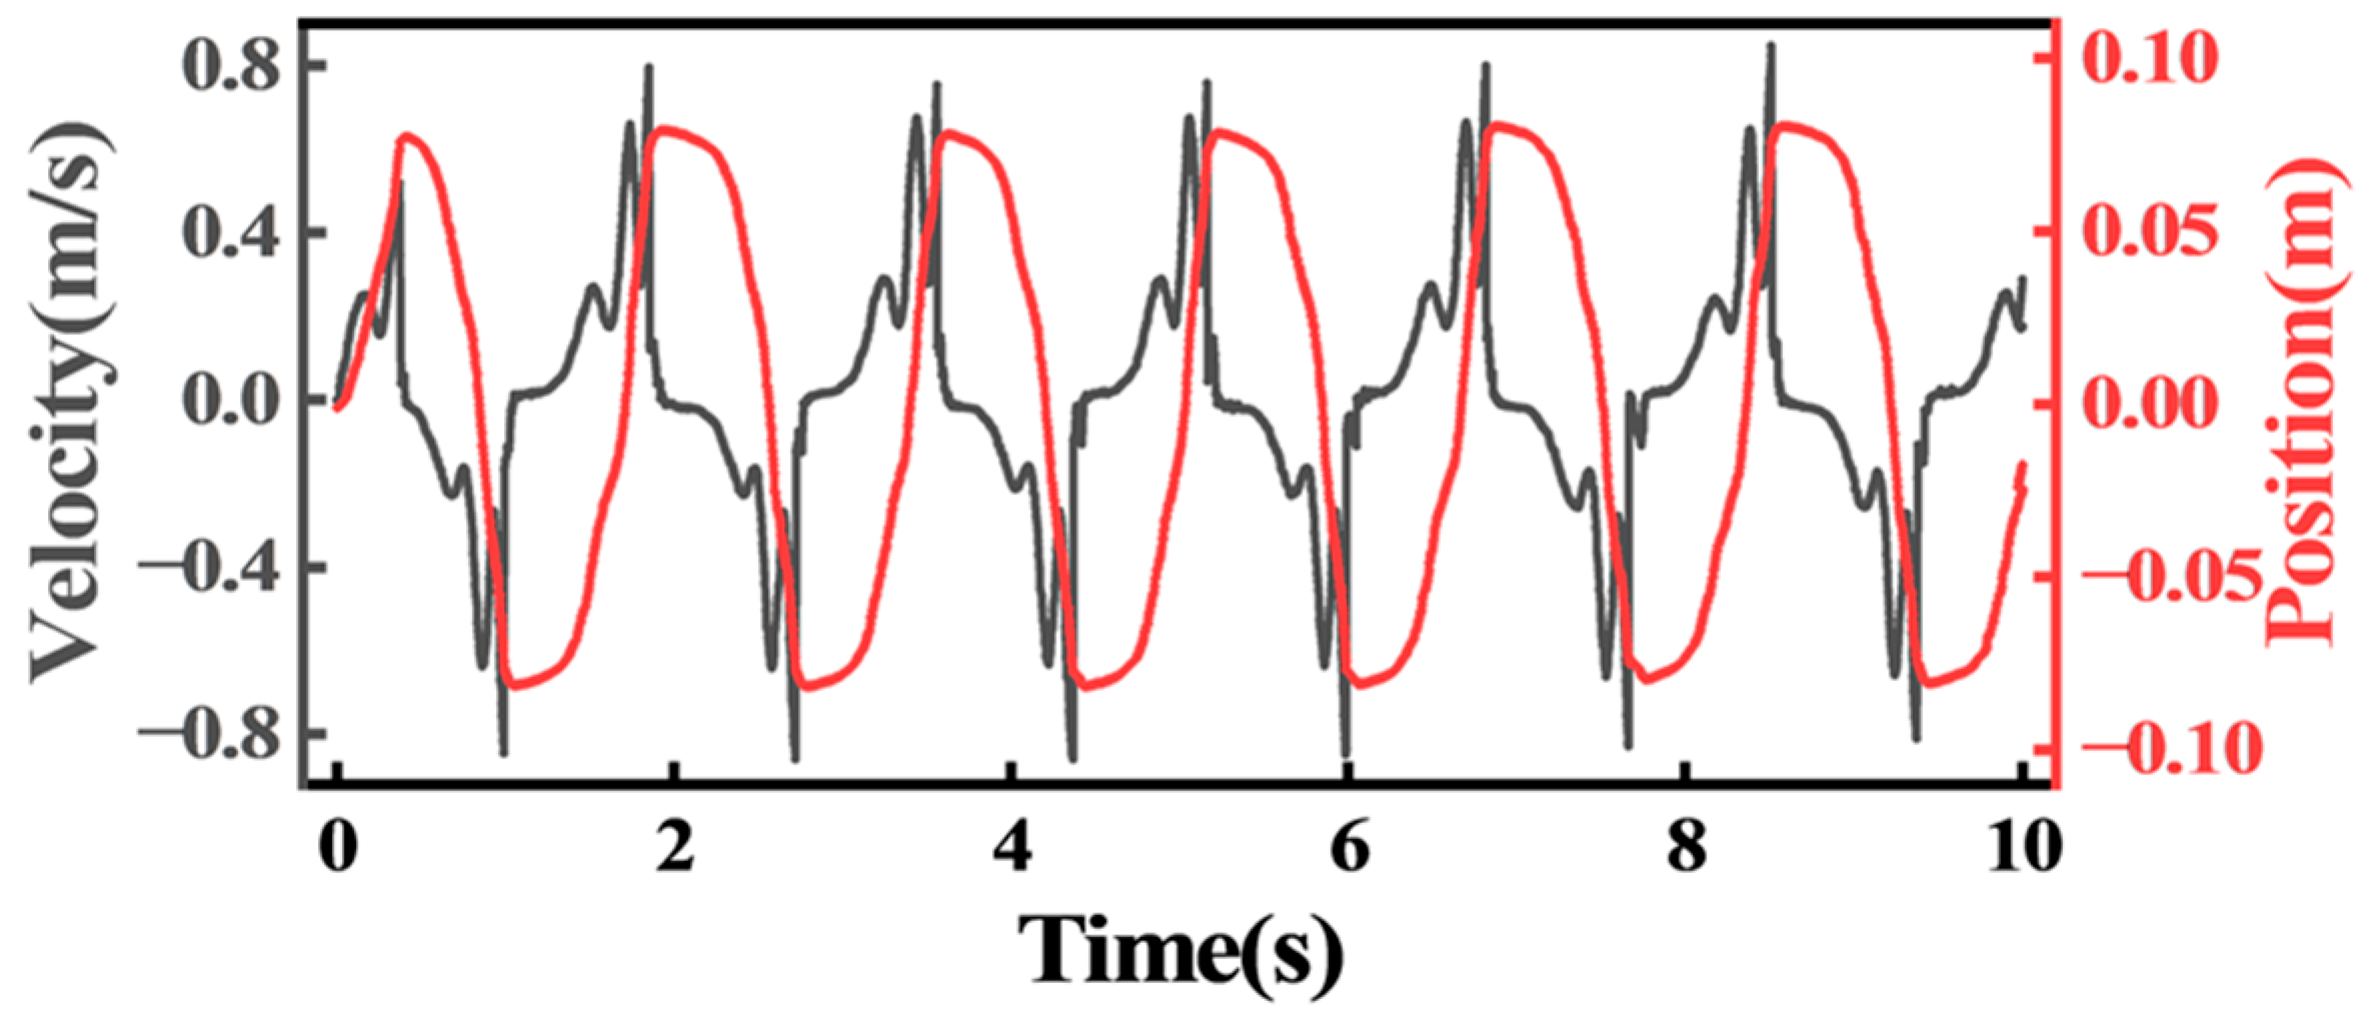
Under the applied rotation, the cylindrical magnet rotates downward along the track (under the gravity and the friction). Its motion ceases upon contacting the baffles at either end of the device. After that, the cylindrical magnet reverses motion direction following the next rotating stroke of the forced motion platform. As shown in
Figure 6, the cylindrical magnet rolled within the housing under a pitch angle of 16° and a frequency of 0.6 Hz, colliding with the end baffles. The middle of the power take off unit is defined as the origin of displacement. The instant of maximum displacement coincided with the zero velocity of the cylindrical magnet, as it will be suddenly stopped by the ends of the power take off unit.
To find the cylindrical magnet’s maximum velocity under different input conditions, simulations were performed in ADAMS View 2020 with pitch angles of 10°, 12°, 14°, 16°, 18° and with frequencies of 0.2 Hz, 0.3 Hz, 0.4 Hz, 0.5 Hz, 0.6 Hz. As shown in
Figure 7, the maximum velocity of the magnet mover increased with increased pitch angle and frequency, reaching a maximum velocity of 0.97 m/s under the conditions of 18° pitch angle and 0.6 Hz frequency.
4. Forced Motion Tests and Discussions
This section performed a number of experiments to test, optimize and demonstrate the designed power take off. The power take off unit consists of three primary components: a polytetrafluoroethylene (PTFE) housing, an enameled copper coil, and an axially hollow NdFeB magnet mover (22 mm outer diameter × 11 mm inner diameter × 25.4 mm length) with radial magnetization. The unit is 23 mm (width) × 26 mm (height) × 175 mm (length), with the PTFE housing fabricated via 3D printing. The track of the power take off unit is designed to be only slightly wider than the width of the rolling magnetic to effectively constrain the lateral motion. NdFeB material was selected for its good magnetic characteristics.
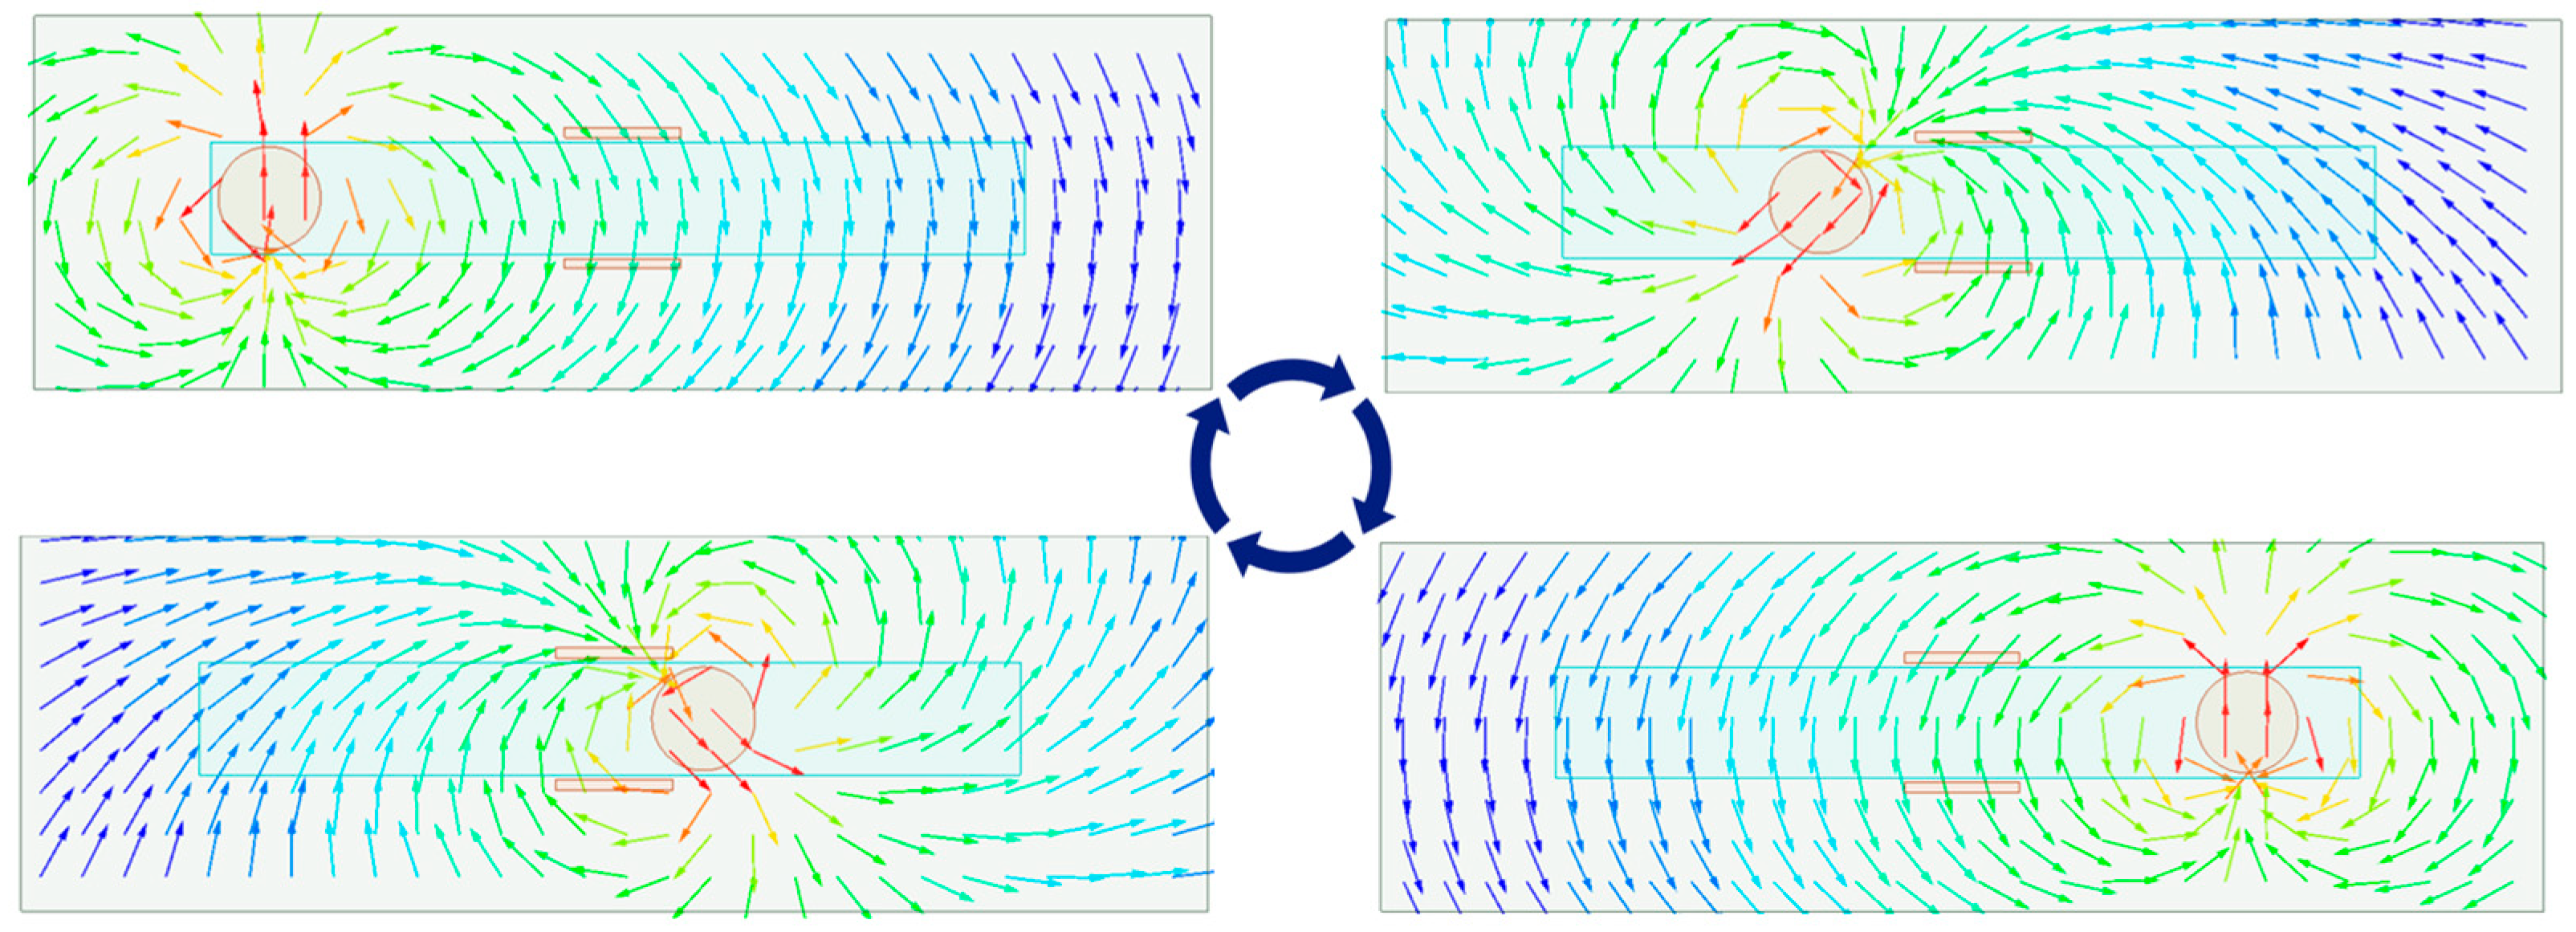
The magnet motion is a combination of both the translation and the rotation. As the magnet rolls, the positions of magnetic poles alternate.
Figure 8 is schematic diagram of the magnetic field variations in a working cycle of the power take off unit. Coil parameters should be determined for the power take off unit under its typical working conditions. Therefore, forced motion experiments were performed for coils of different wire diameters and turn numbers to characterize their influences on the output.
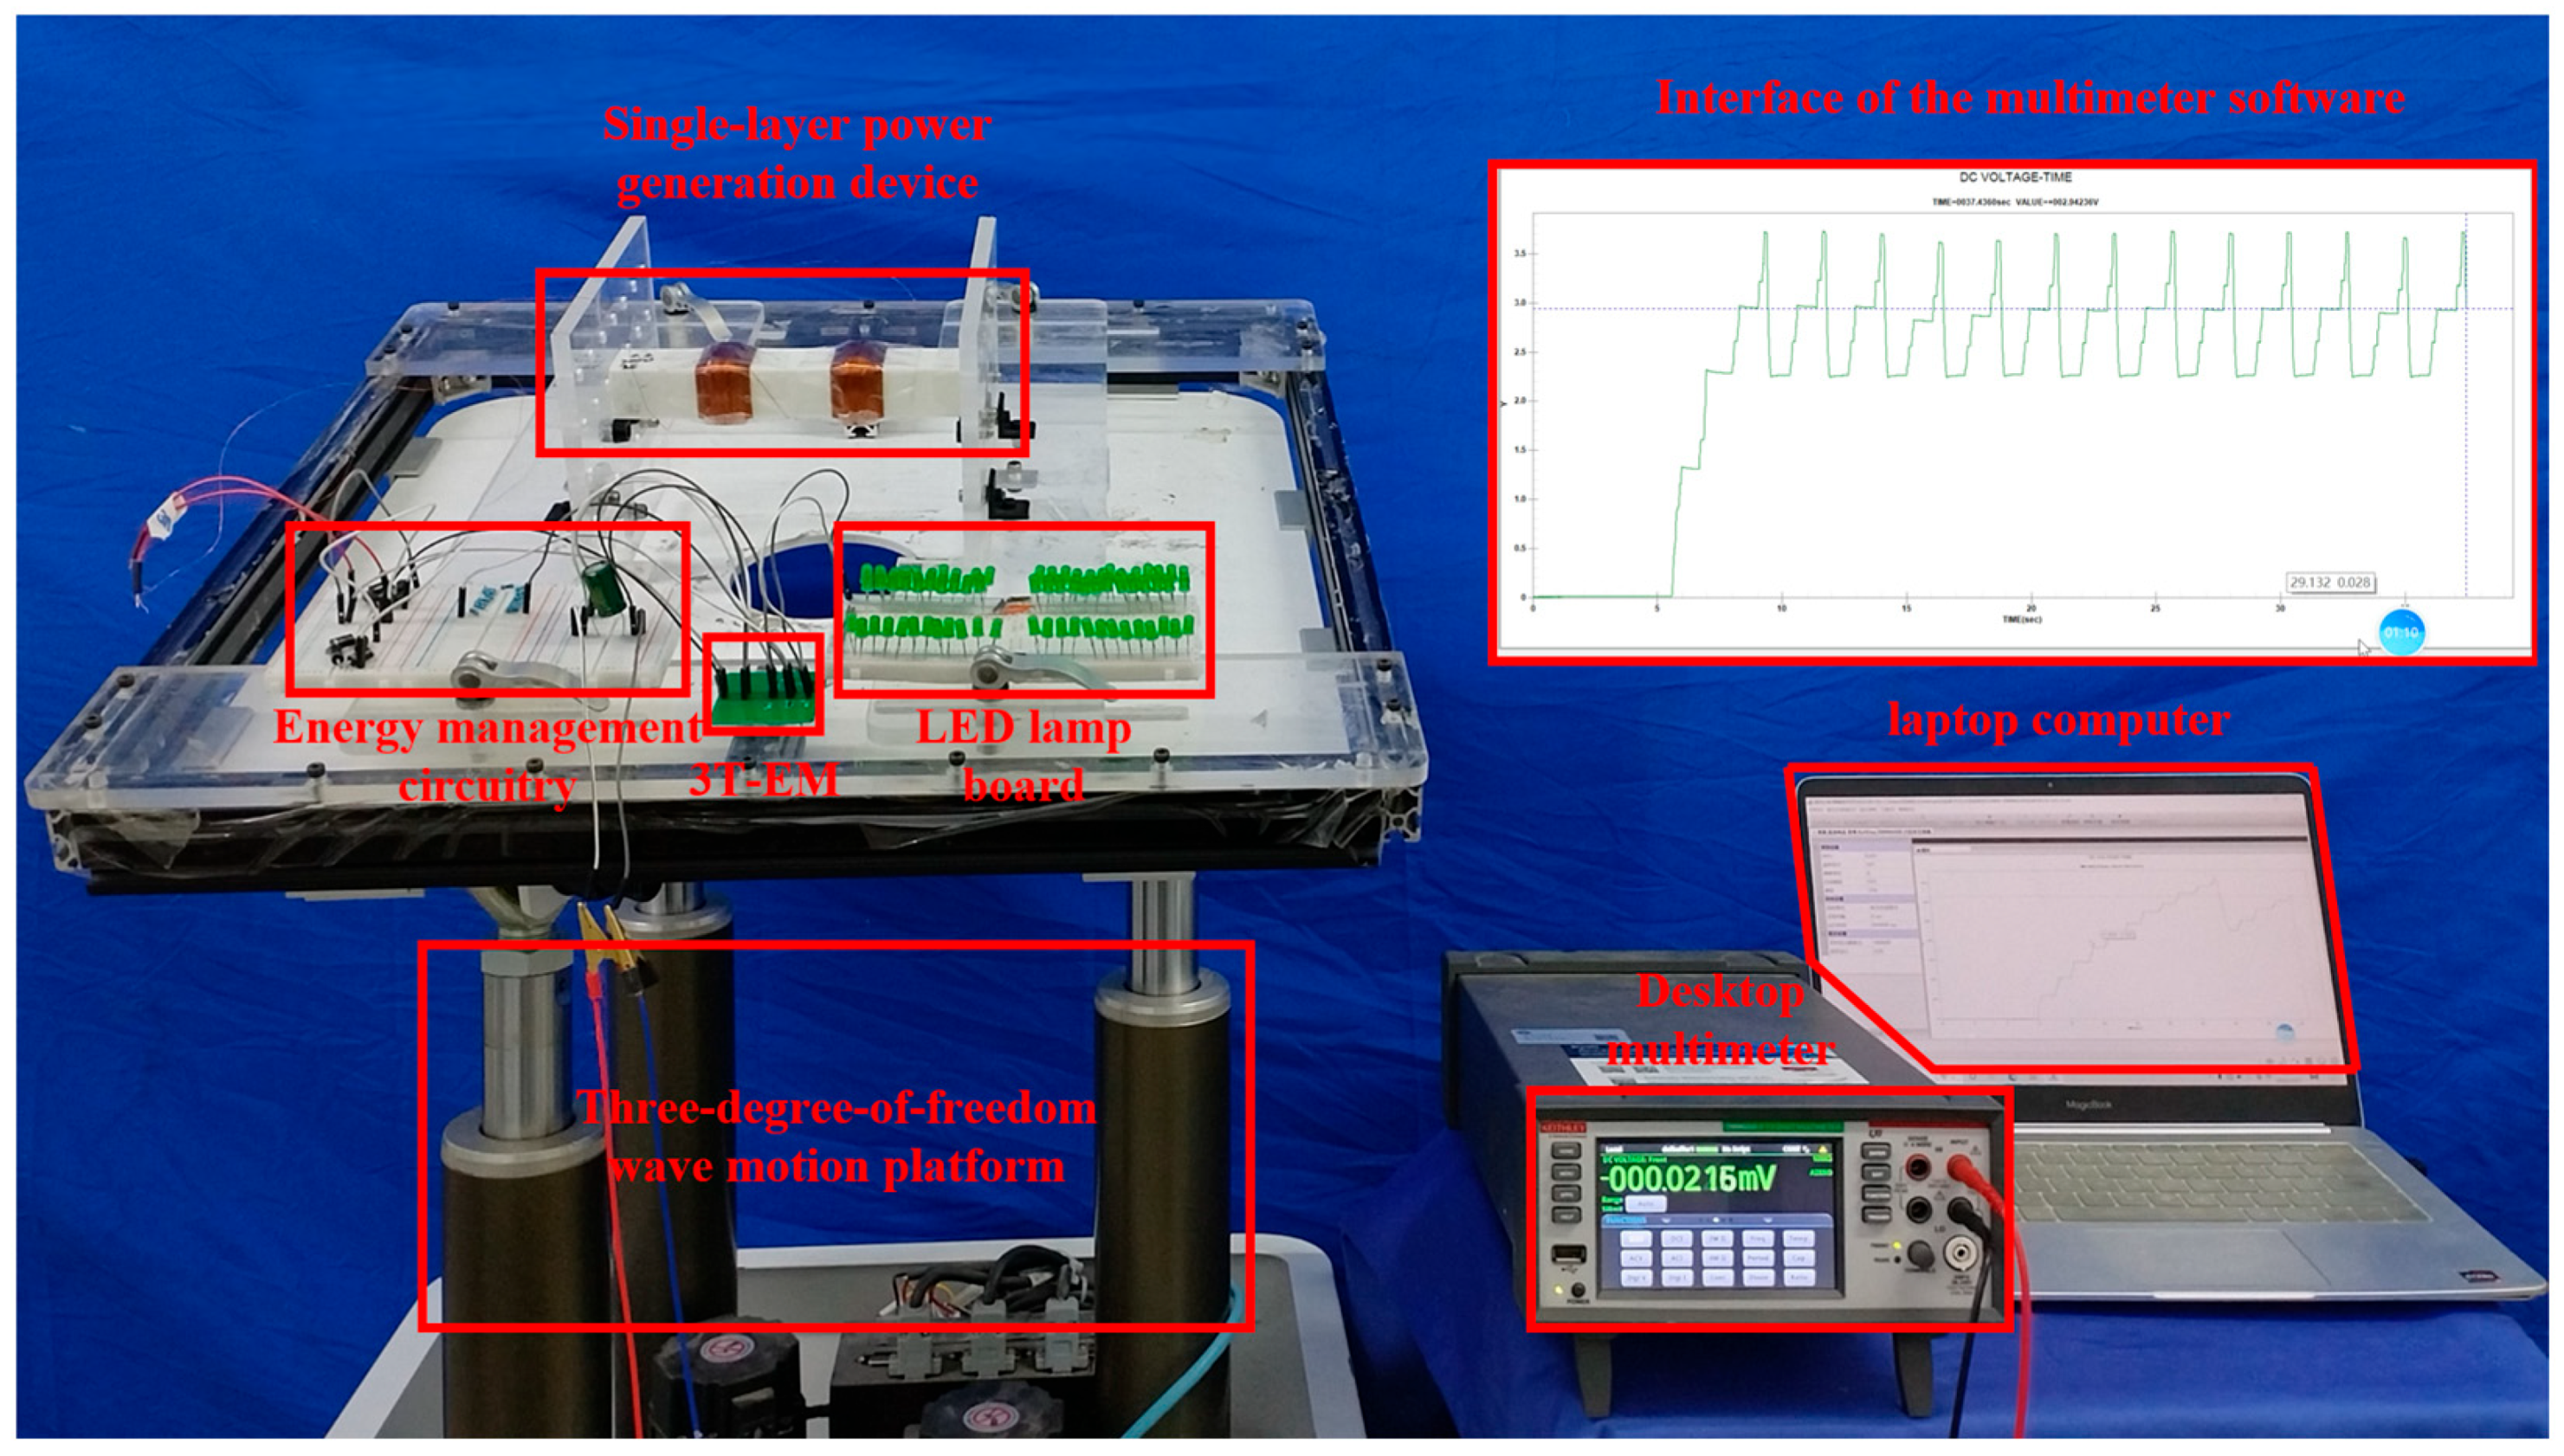
A three-degree-of-freedom (3-DOF) platform was adopted to generate the specific (forced) motions, with the measurements recorded by a bench multimeter and processed through computer-based data acquisition. Coil of different wire diameters and different turn numbers were tested on the platform. As illustrated in
Figure 9, the output performance of the power take off unit was evaluated under a test condition of a 10° pitch angle and 0.3 Hz frequency. It needs to be noted that in these experiments (comparing different coil parameters), the coil was placed in the middle of the power take off unit (as depicted in
Figure 8).
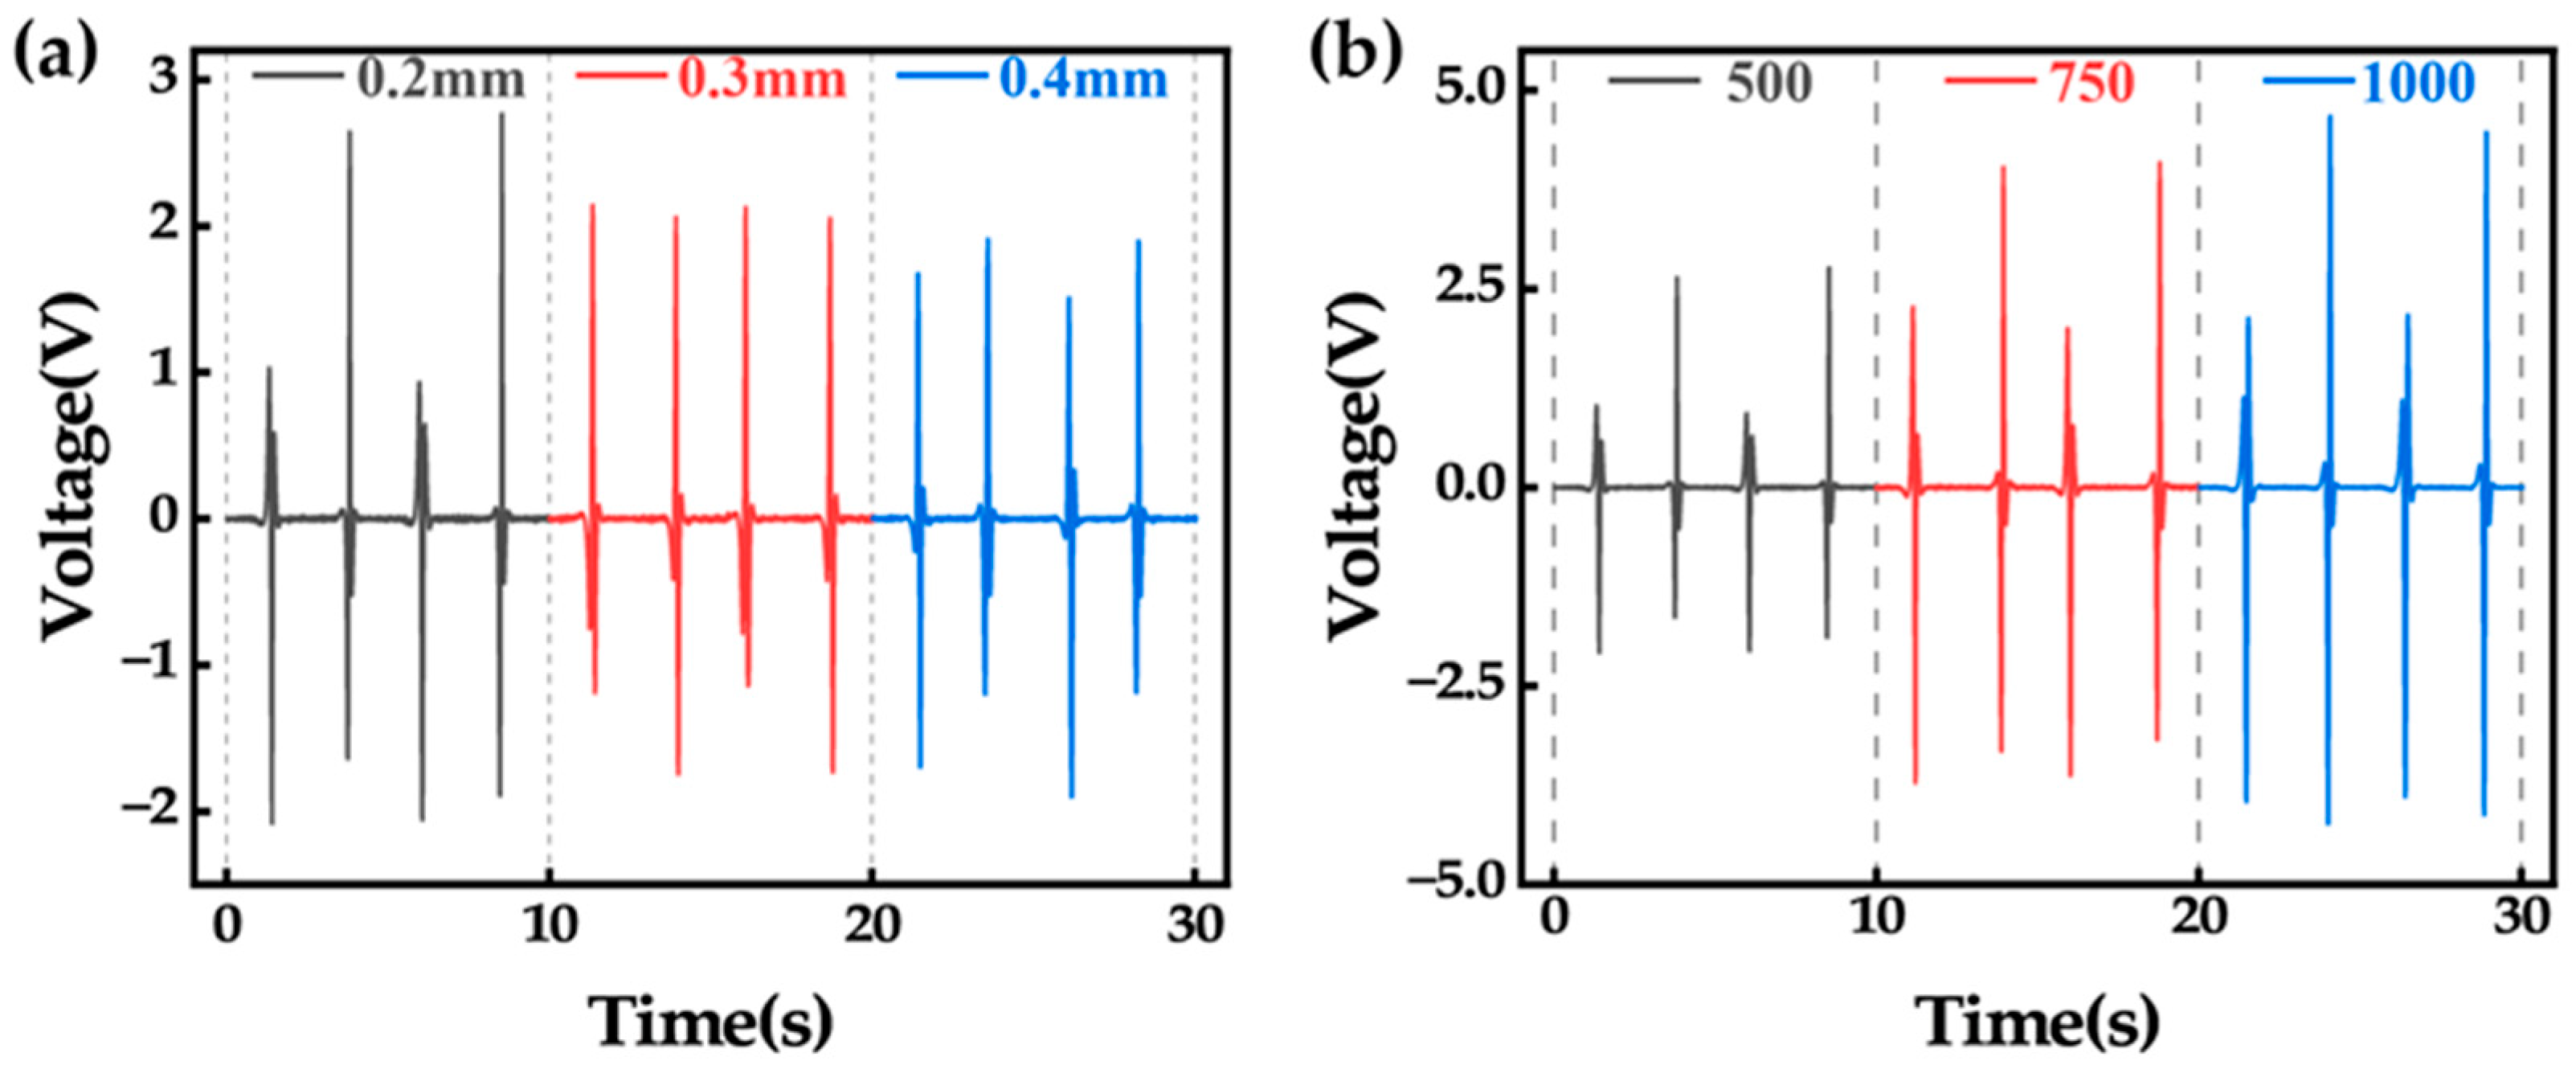
Figure 9a is the experimental results under different copper wire diameters. Increasing the wire diameter from 0.2 mm to 0.4 mm reduced the peak open circuit voltage from 2.78 V to 1.92 V. The results mean thinner copper wires yielded higher open circuit voltage. As the wire diameter was reduced, the distance between the coil and the permanent magnet was compressed. The diminished distance enhanced electromagnetic induction and consequently promoted the open circuit voltage, as presented in
Figure 9a.
The number of coil turn also affects the output characteristics, so the open circuit voltage under various coil turn numbers were tested. As shown in
Figure 9b, the open circuit voltage increased with the coil turn number. As the coil turn number increased from 500 to 1000, the peak open circuit voltage rose from 2.78 V to 4.7 V. While higher coil turn number amplified the voltage, it also increased the internal resistance. For 0.2 mm-diameter copper wire, 1000-turn, 750-turn and 500-turn coils exhibited resistances of 52.2 Ω, 43.3 Ω, and 26.3 Ω, respectively.
Coil selection should consider both load characteristics and environmental conditions. The number of coils also affects the output of the power take off unit, as additional coils increase magnetic flux-cutting events in every cycle. In the rest of the study, two 0.2 mm-diameter copper coils (1000 turns each) were implemented for a power take off unit, and they were placed as shown in
Figure 10, which was different from the previous experiments comparing different coil parameters. Still, the three-degree-of-freedom (3-DOF) platform was used to generate the specific (forced) motions. The 3-DOF platform generated pitch of various angles (10°, 12°, 14°, 16°, 18°) and various frequencies (0.2 Hz, 0.3 Hz, 0.4 Hz, 0.5 Hz, 0.6 Hz). The open-circuit voltage and the short-circuit current were measured under these conditions.
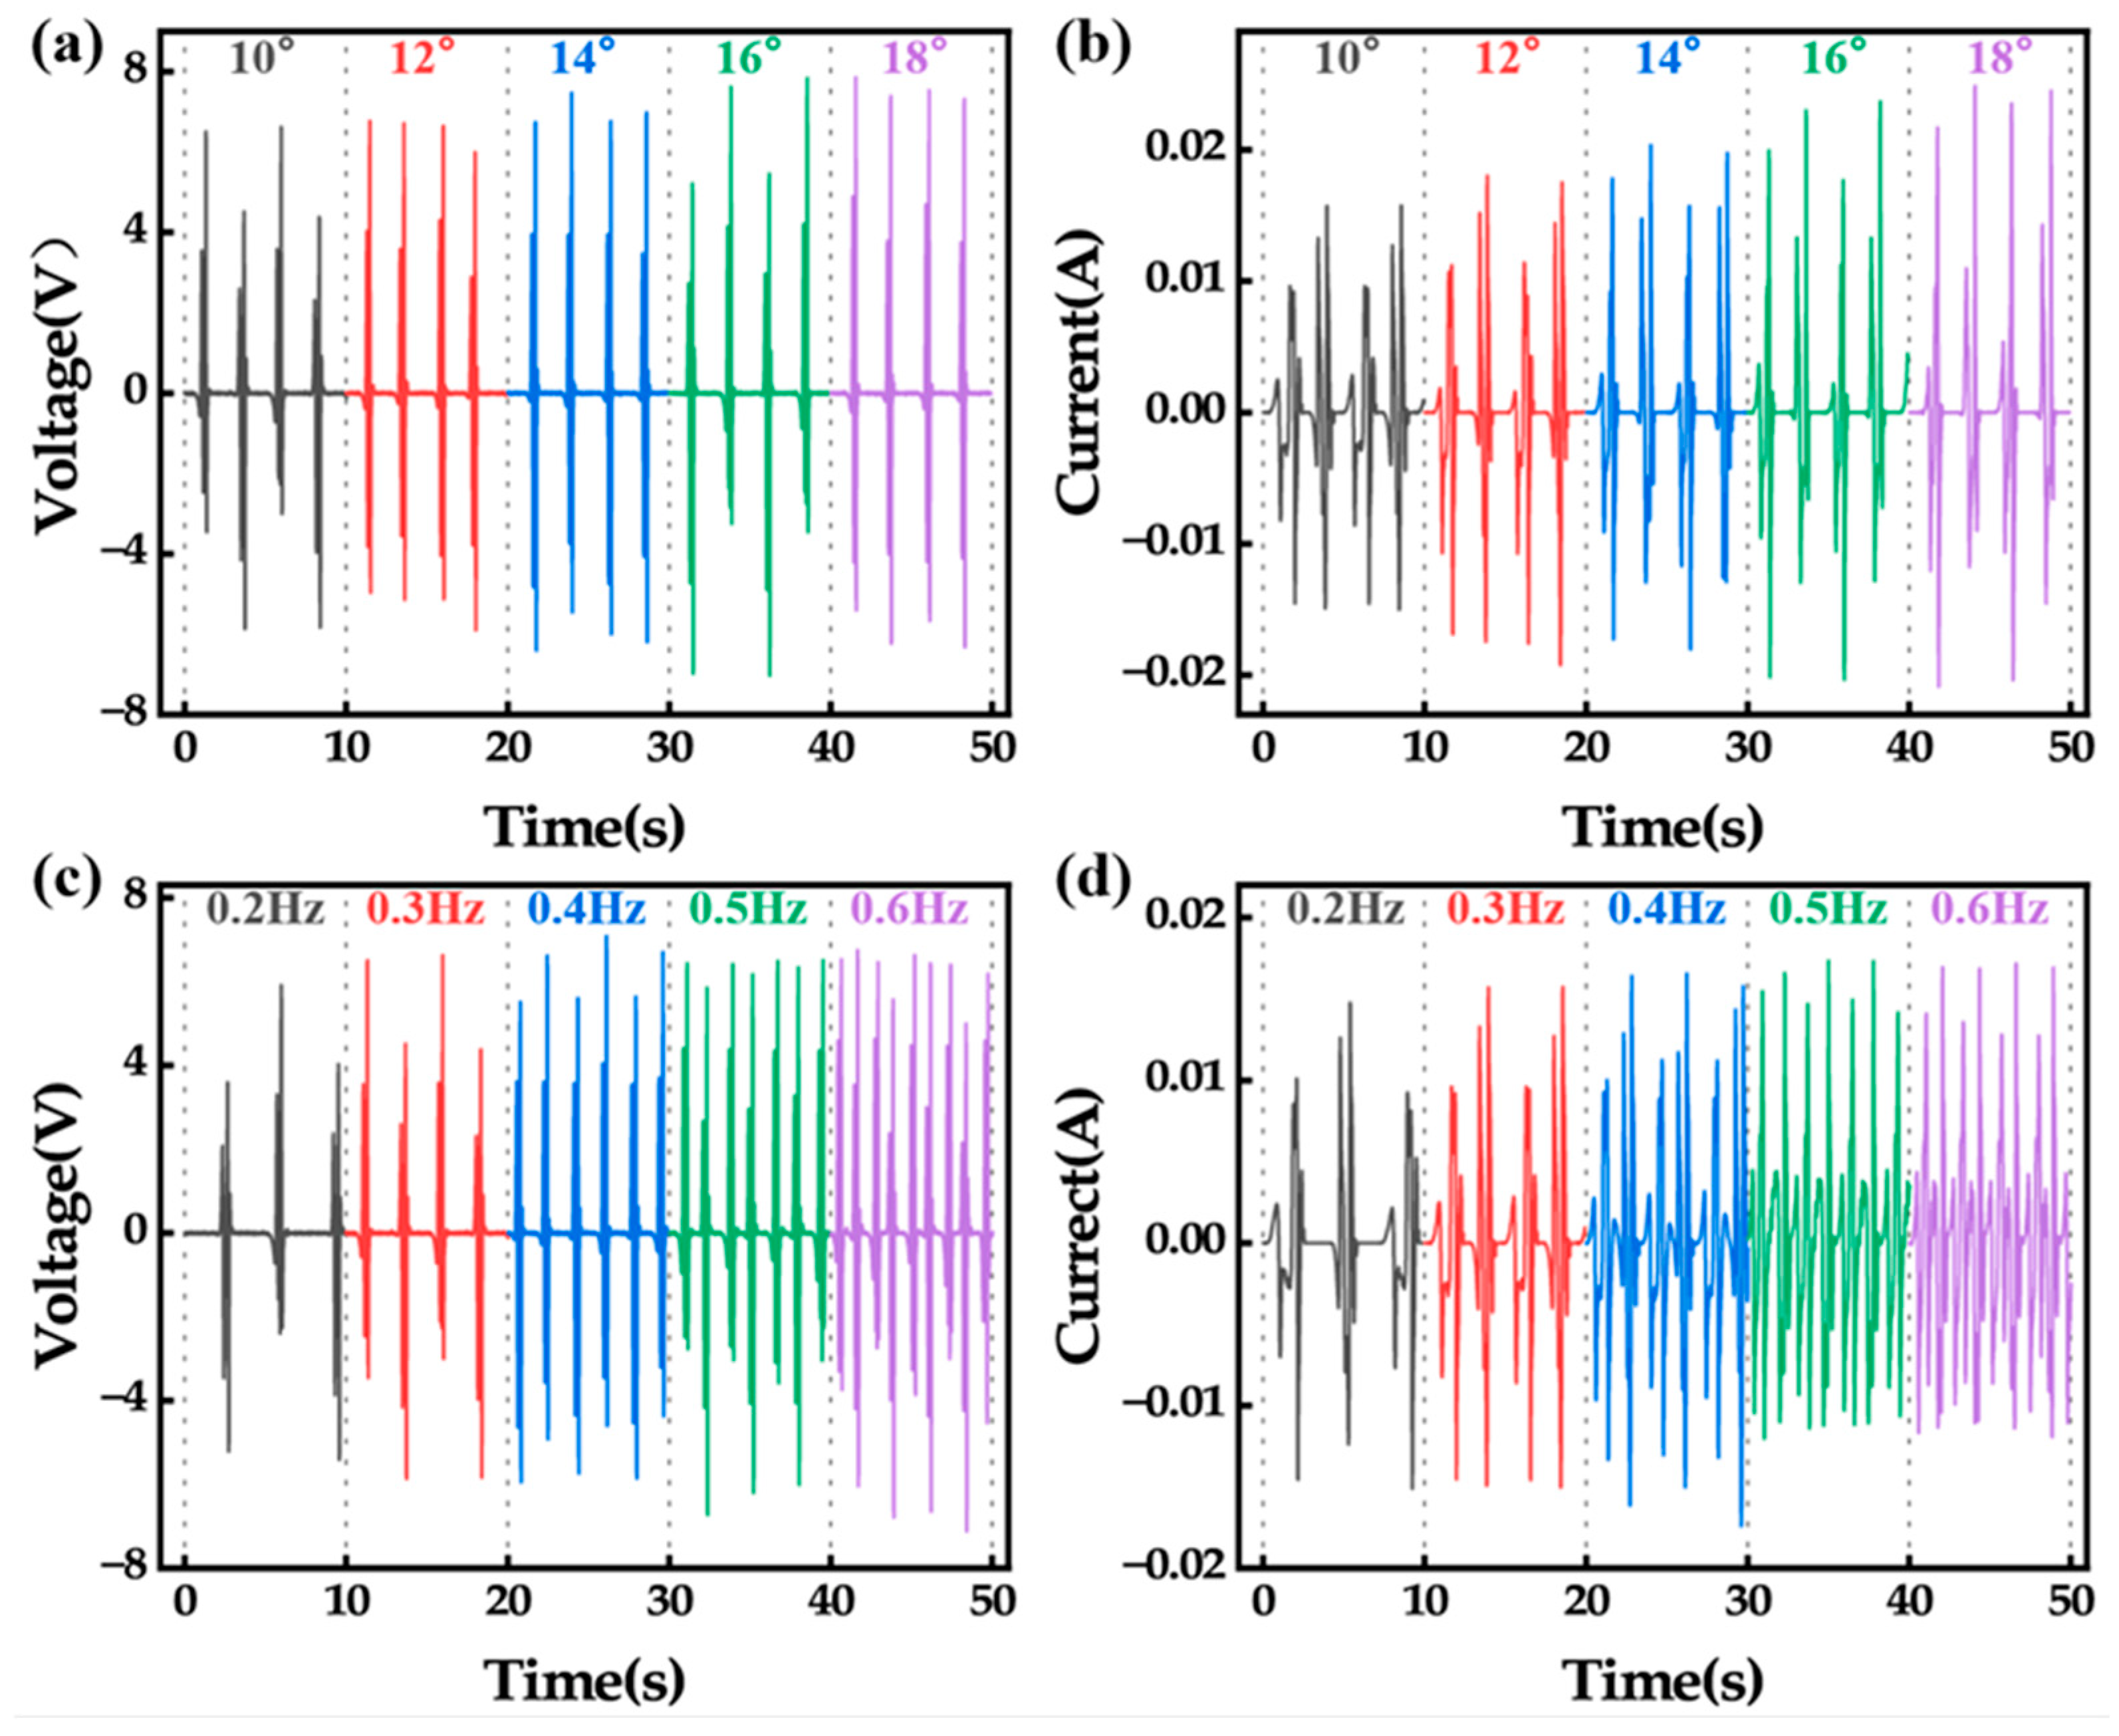
As shown in
Figure 11a,b, keeping 0.3 Hz pitching frequency observed gradual increases in induced voltage and current with larger pitch angles. This correlation could be attributed to increased magnet velocity crossing the coils under greater angular displacements, which elevated magnetic flux variation rates.
As shown in
Figure 11c,d, keeping 10° pitch angle observed both the peak open-circuit voltage and the peak short-circuit current increasing with the excitation frequency. Also, as the motion frequency increased, the frequency of the magnet cutting the coil increased, which was reflected in the increase in the number of wave peaks in
Figure 11c,d.
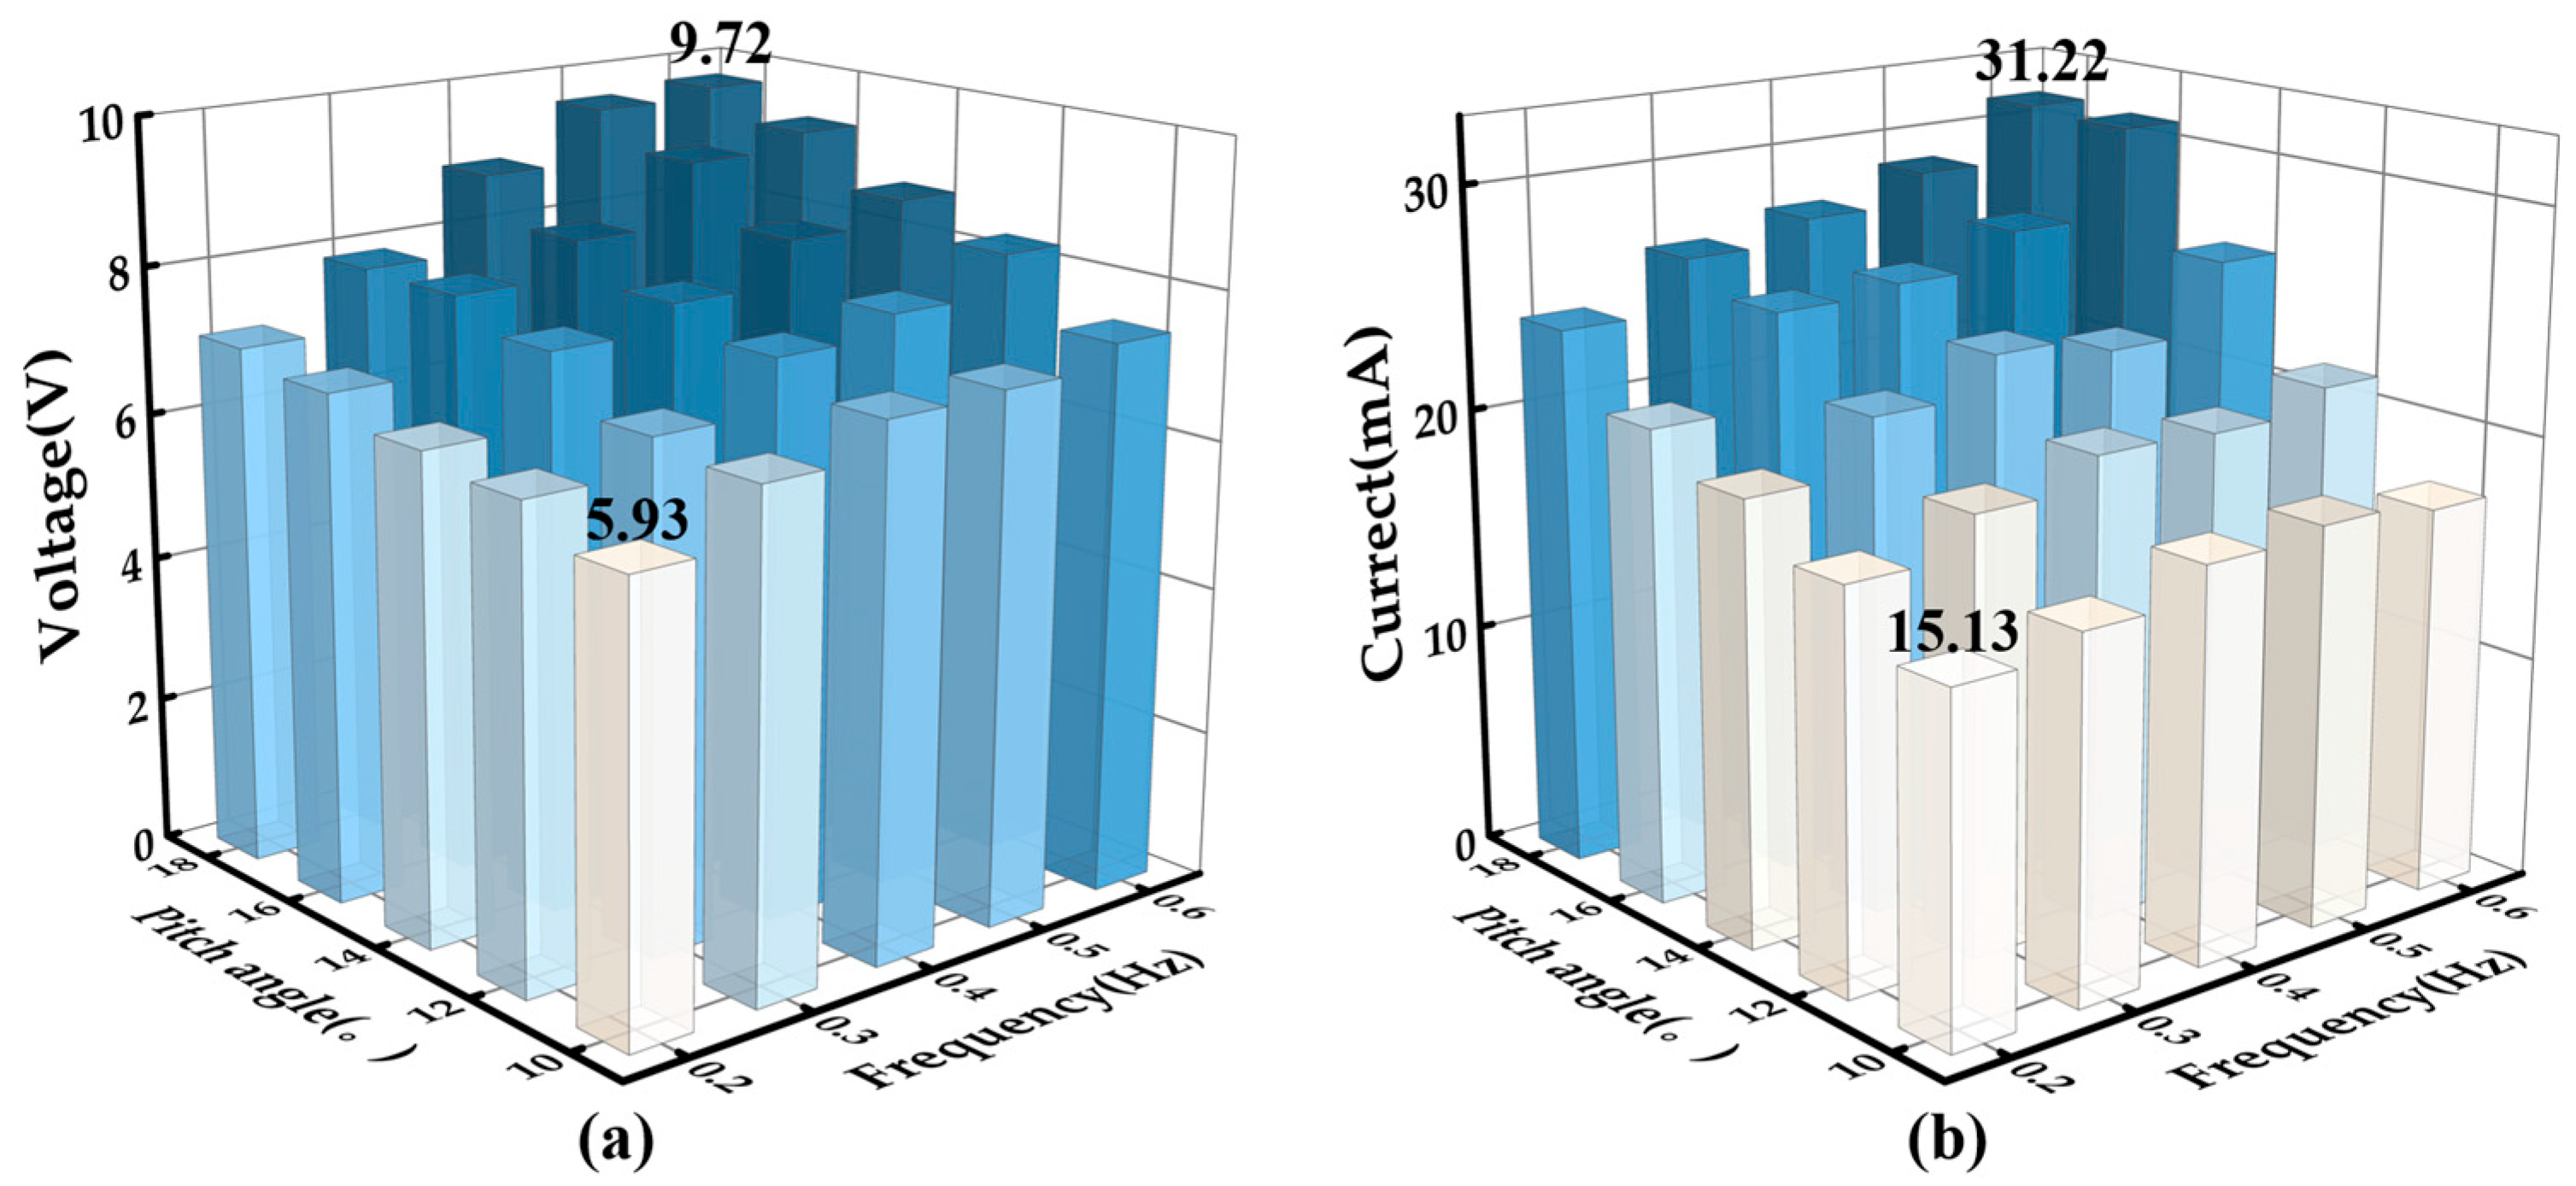
Figure 12 presents the unit’s output matrix under varying excitation frequencies and pitch angles. Optimal performance occurred at 18° pitch angle and 0.6 Hz frequency, yielding a peak open-circuit voltage of 9.72 V and a peak short-circuit current of 31.22 mA. Even under relative low inputs (0.2 Hz, 10° pitch angle), the power take off unit maintained a peak open-circuit voltage of 5.93 V and a peak short-circuit current of 15.13 mA.
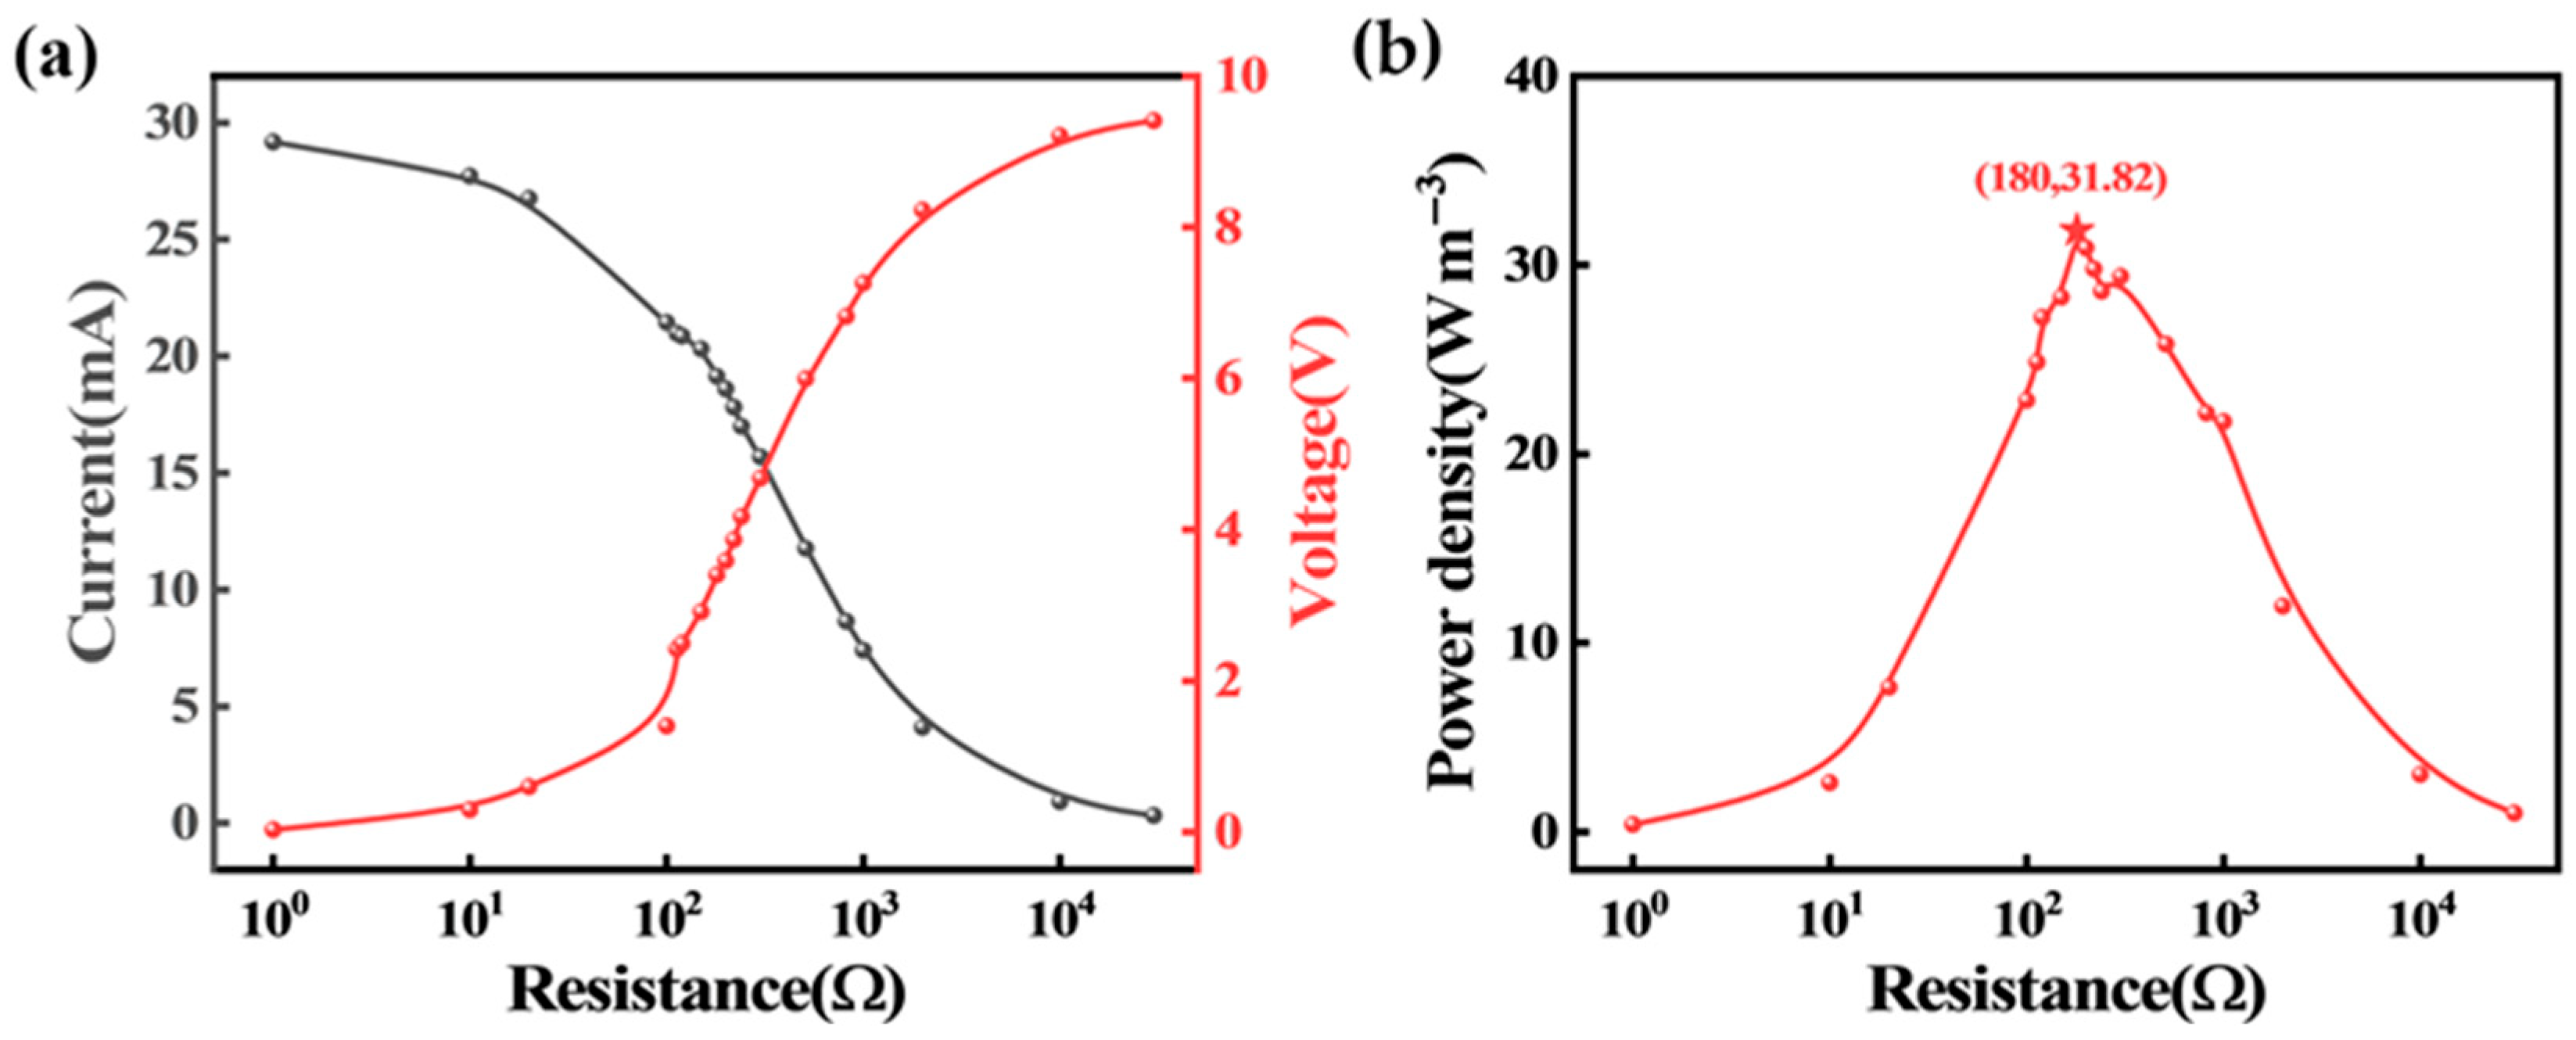
Impedance matching experiments were performed on one power take off unit to evaluate the average power density. The unit was connected to a variable resistive load, and the output were measured under each load resistance.
The load matching was conducted under the test condition of 18° pitch angle and 0.6 Hz frequency, with load resistance varying from 1 Ω to 30 kΩ. As the load resistance increased, the load voltage increased and the current in the circuit decreased, as shown in
Figure 13a. If
P represents the output power,
U represents the load voltage, and
R represents the load resistance, the instantaneous power could be calculated as follows:
The average power was calculated by integrating the instantaneous power over time.
Figure 13b is the resulting power density across load variation, so that the optimal load value can be determined to maximize the output power. As shown in
Figure 13b, the average output power density reached 31.82 W/m
3 at 180 Ω, which was basically sufficient for marine sensing applications.
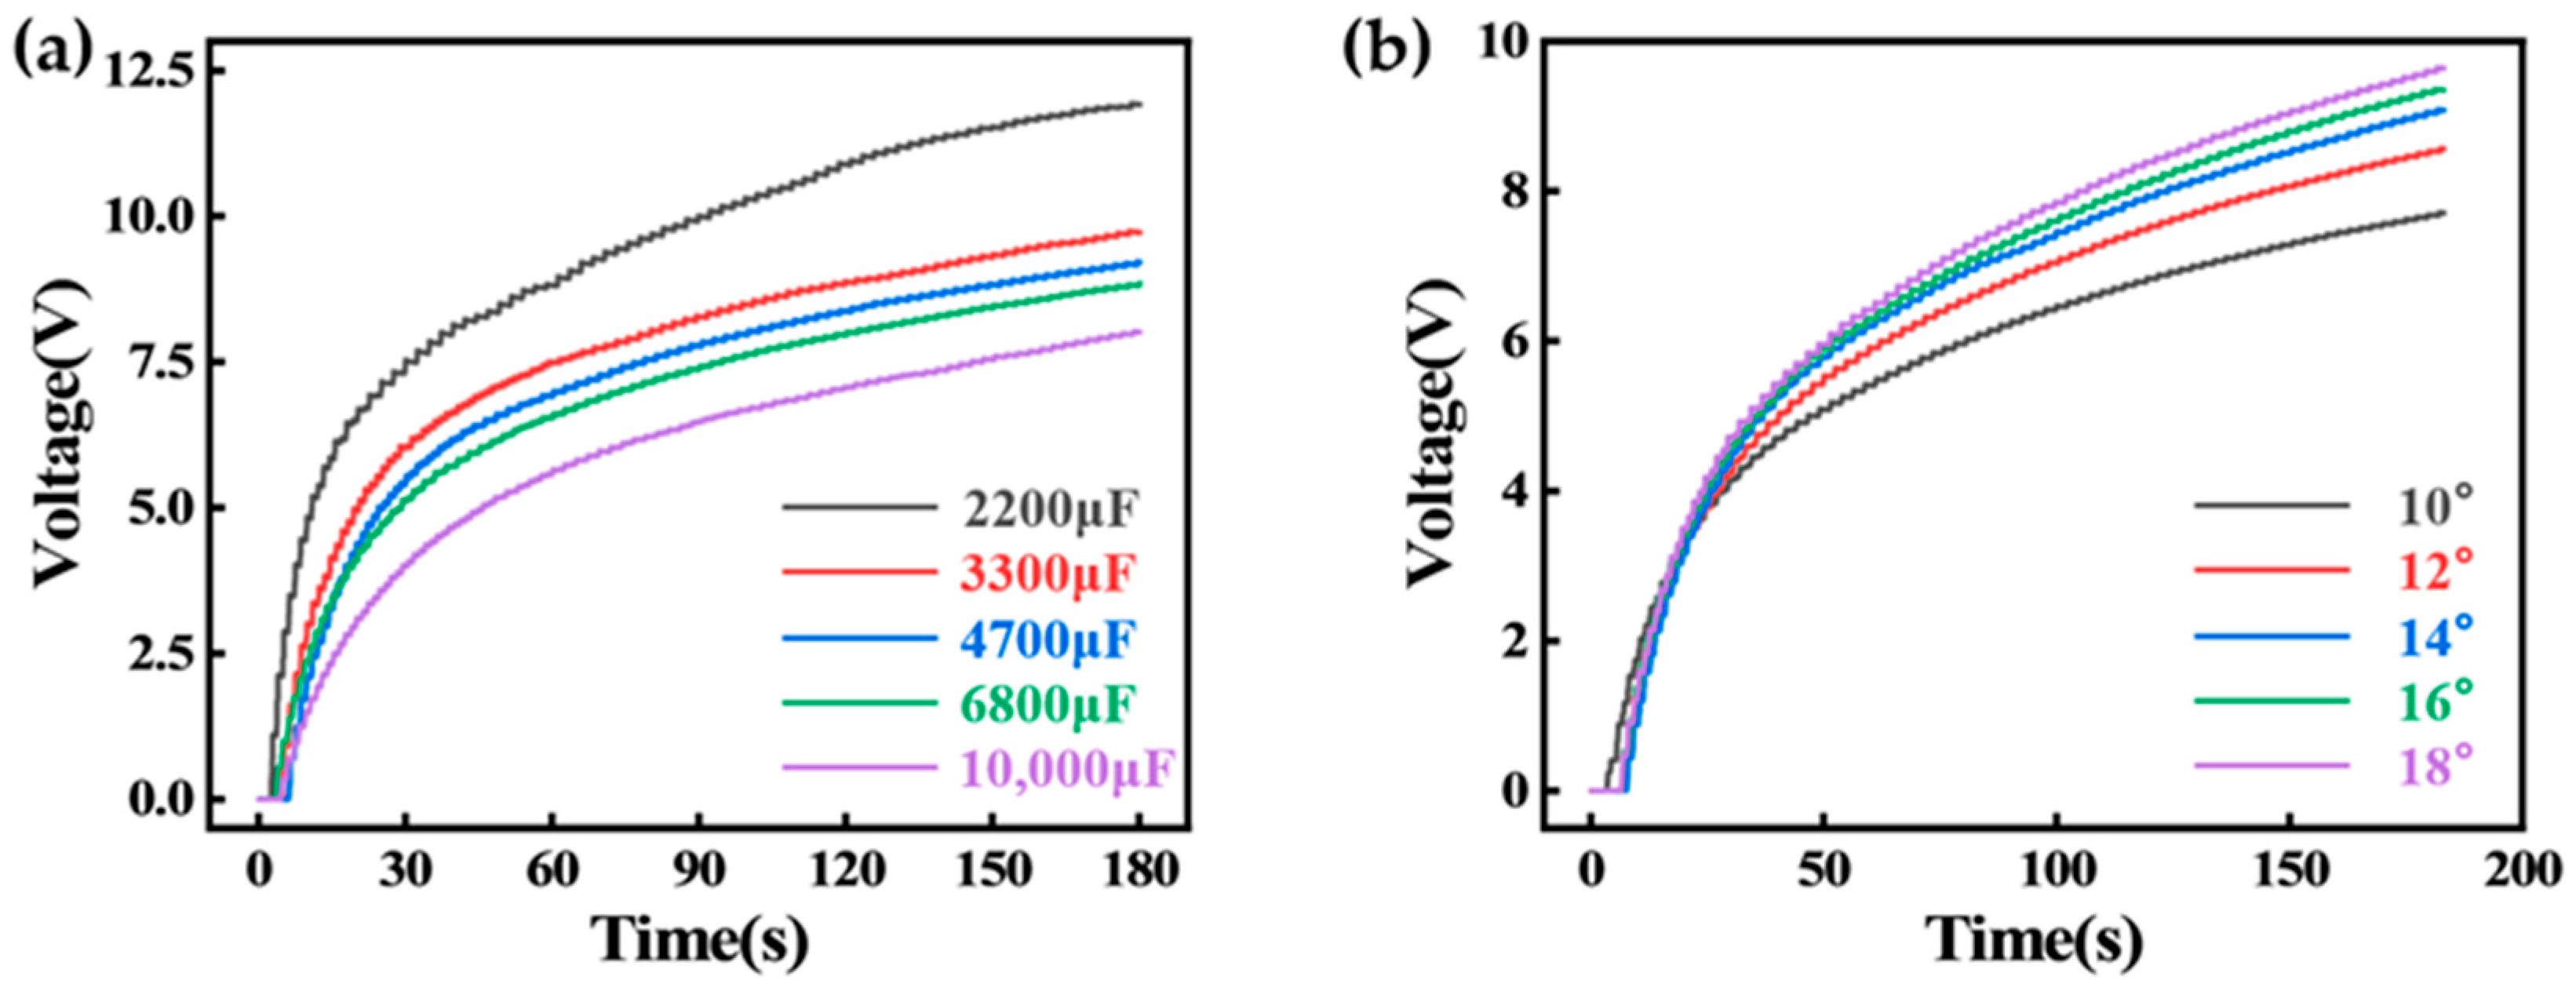
In this study, charging tests were conducted using a power take off layer (including two power take off units). The two units were serially connected, separated by iron–nickel soft magnetic alloy shielding. This material demonstrated good permeability in magnetic fields, effectively minimizing electromagnetic interference between magnets (in adjacent units).
A power take off layer (including two power take off units) was employed to charge capacitors after rectification. As shown in
Figure 14a, under the test condition of 18° pitch angle and 0.3 Hz frequency, a 2200 μF capacitor could be charged to 7.54 V within 30 s, and to 11.92 V within 180 s. The power take off layer successfully charged a 10,000 μF capacitor to 8 V within the 180 s. As shown in
Figure 14b, under various pitch angles (0.6 Hz frequency), the power take off layer charged a 6800 μF capacitor. At 10° pitch angle and 0.6 Hz, the capacitor voltage reached 7.7 V within 180 s.
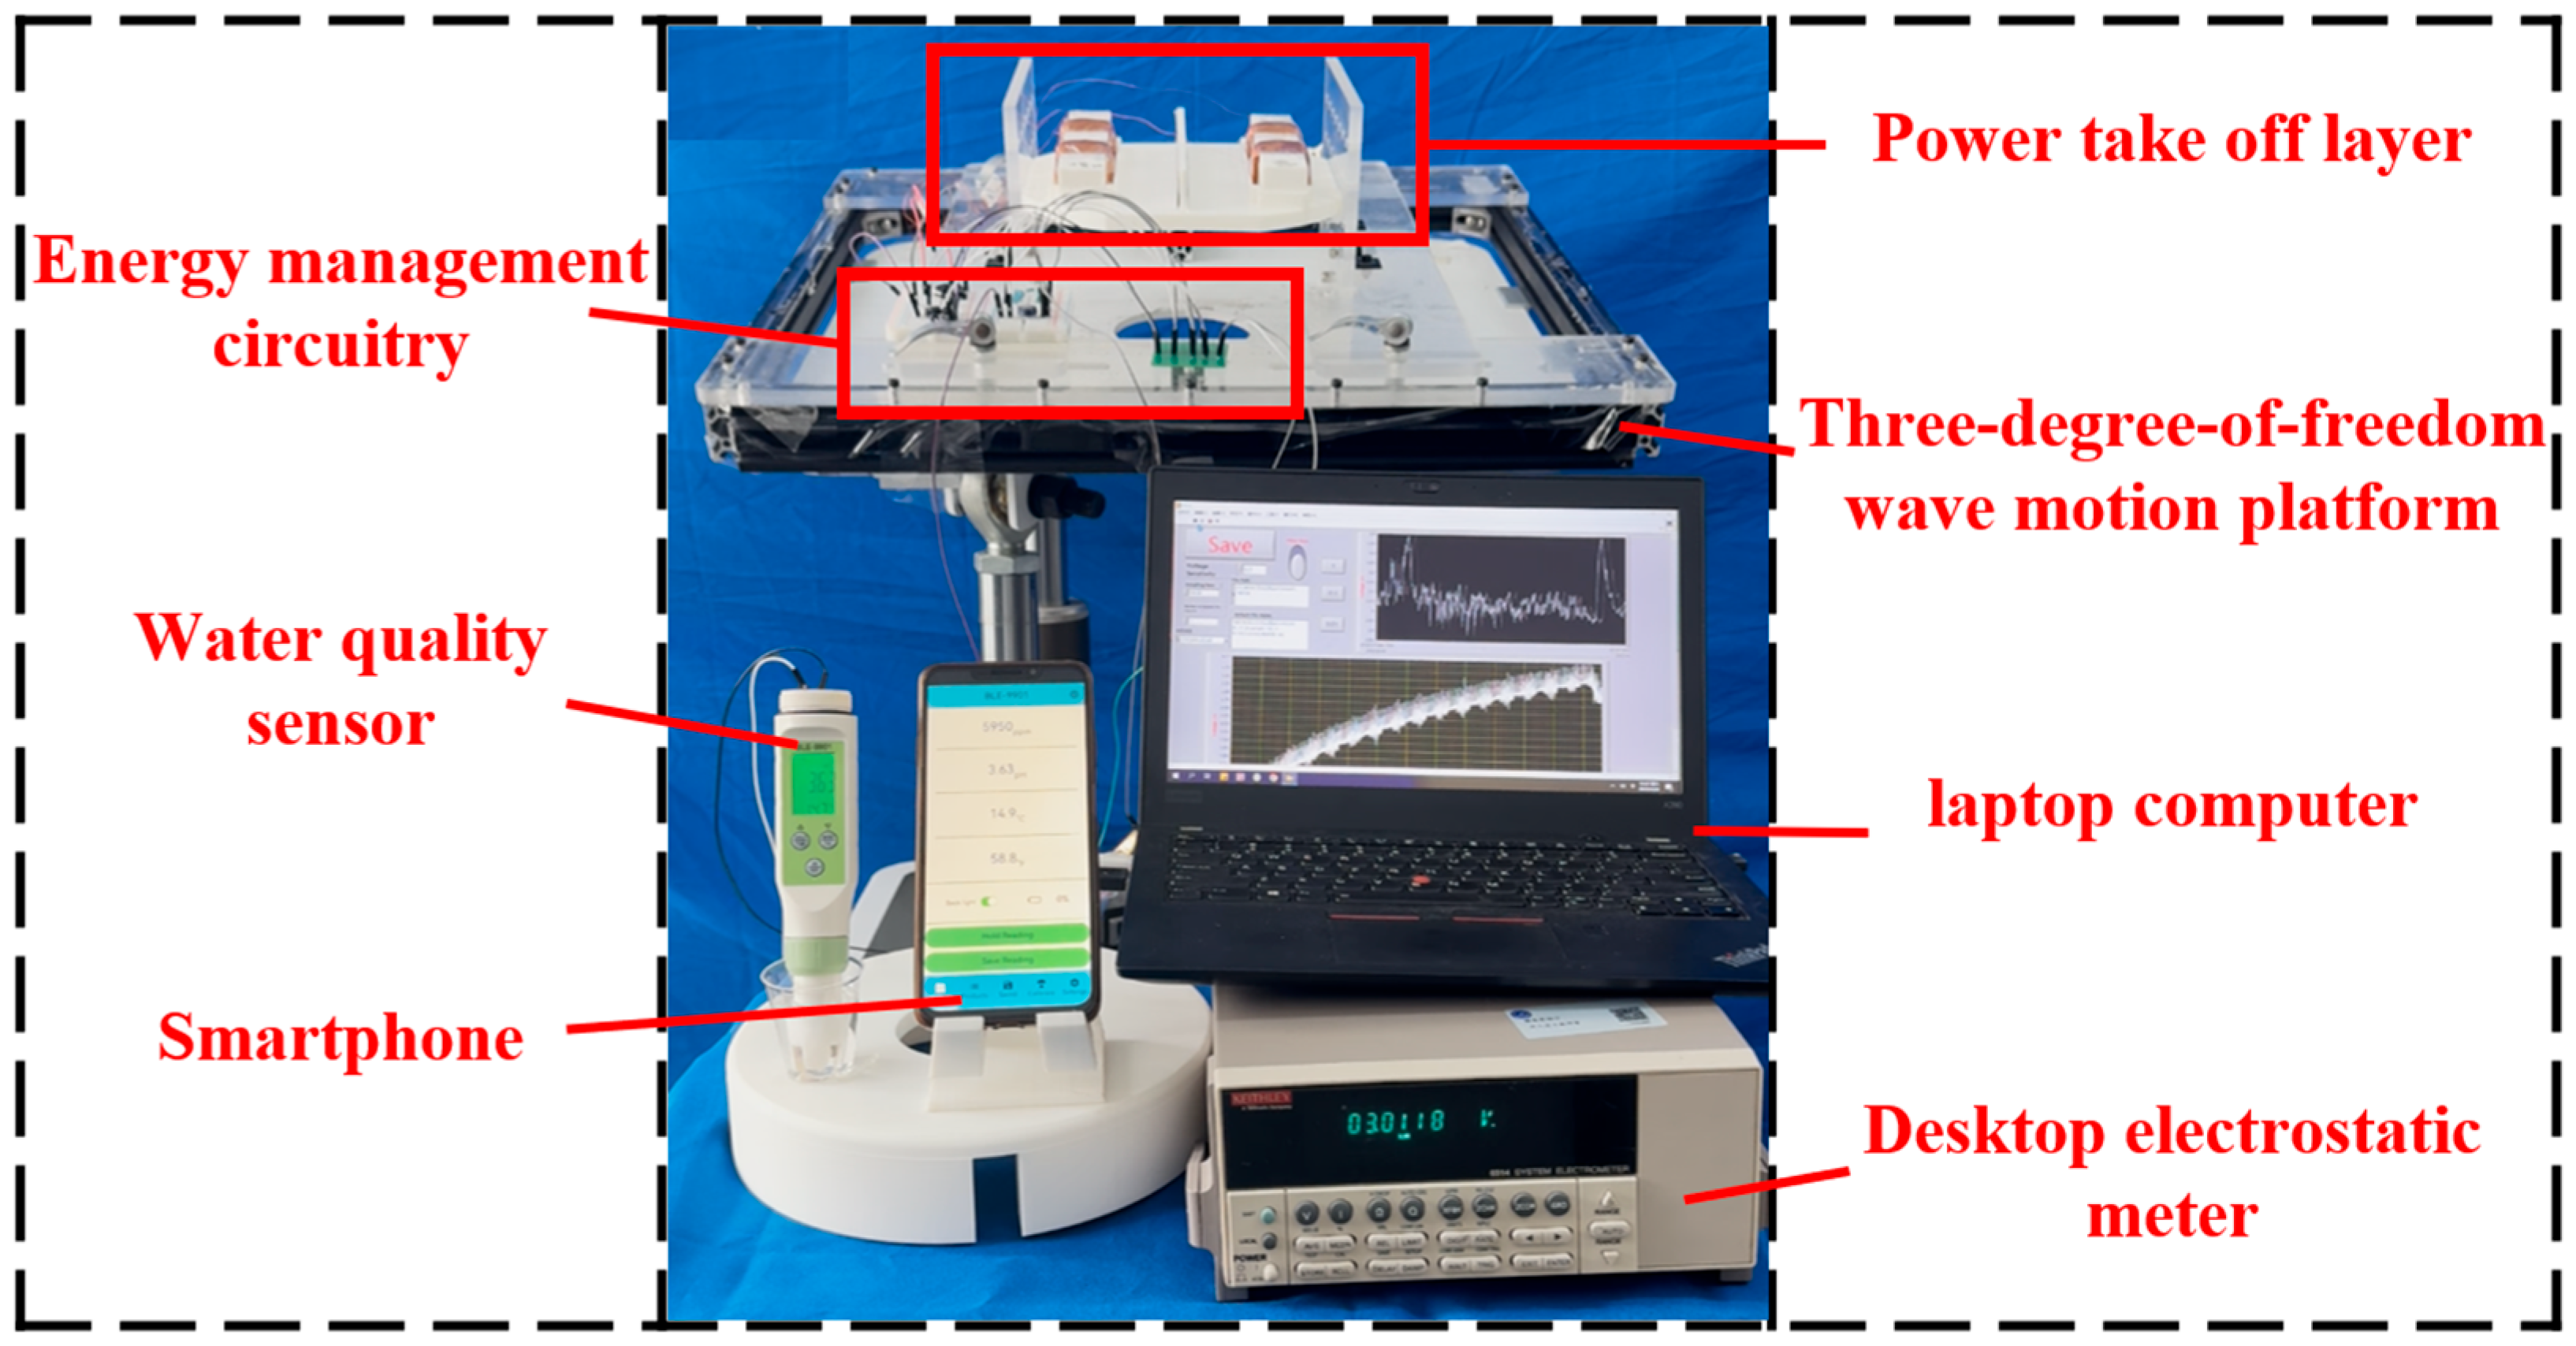
Charging tests were followed by an application demonstration for supporting actual loads. As shown in
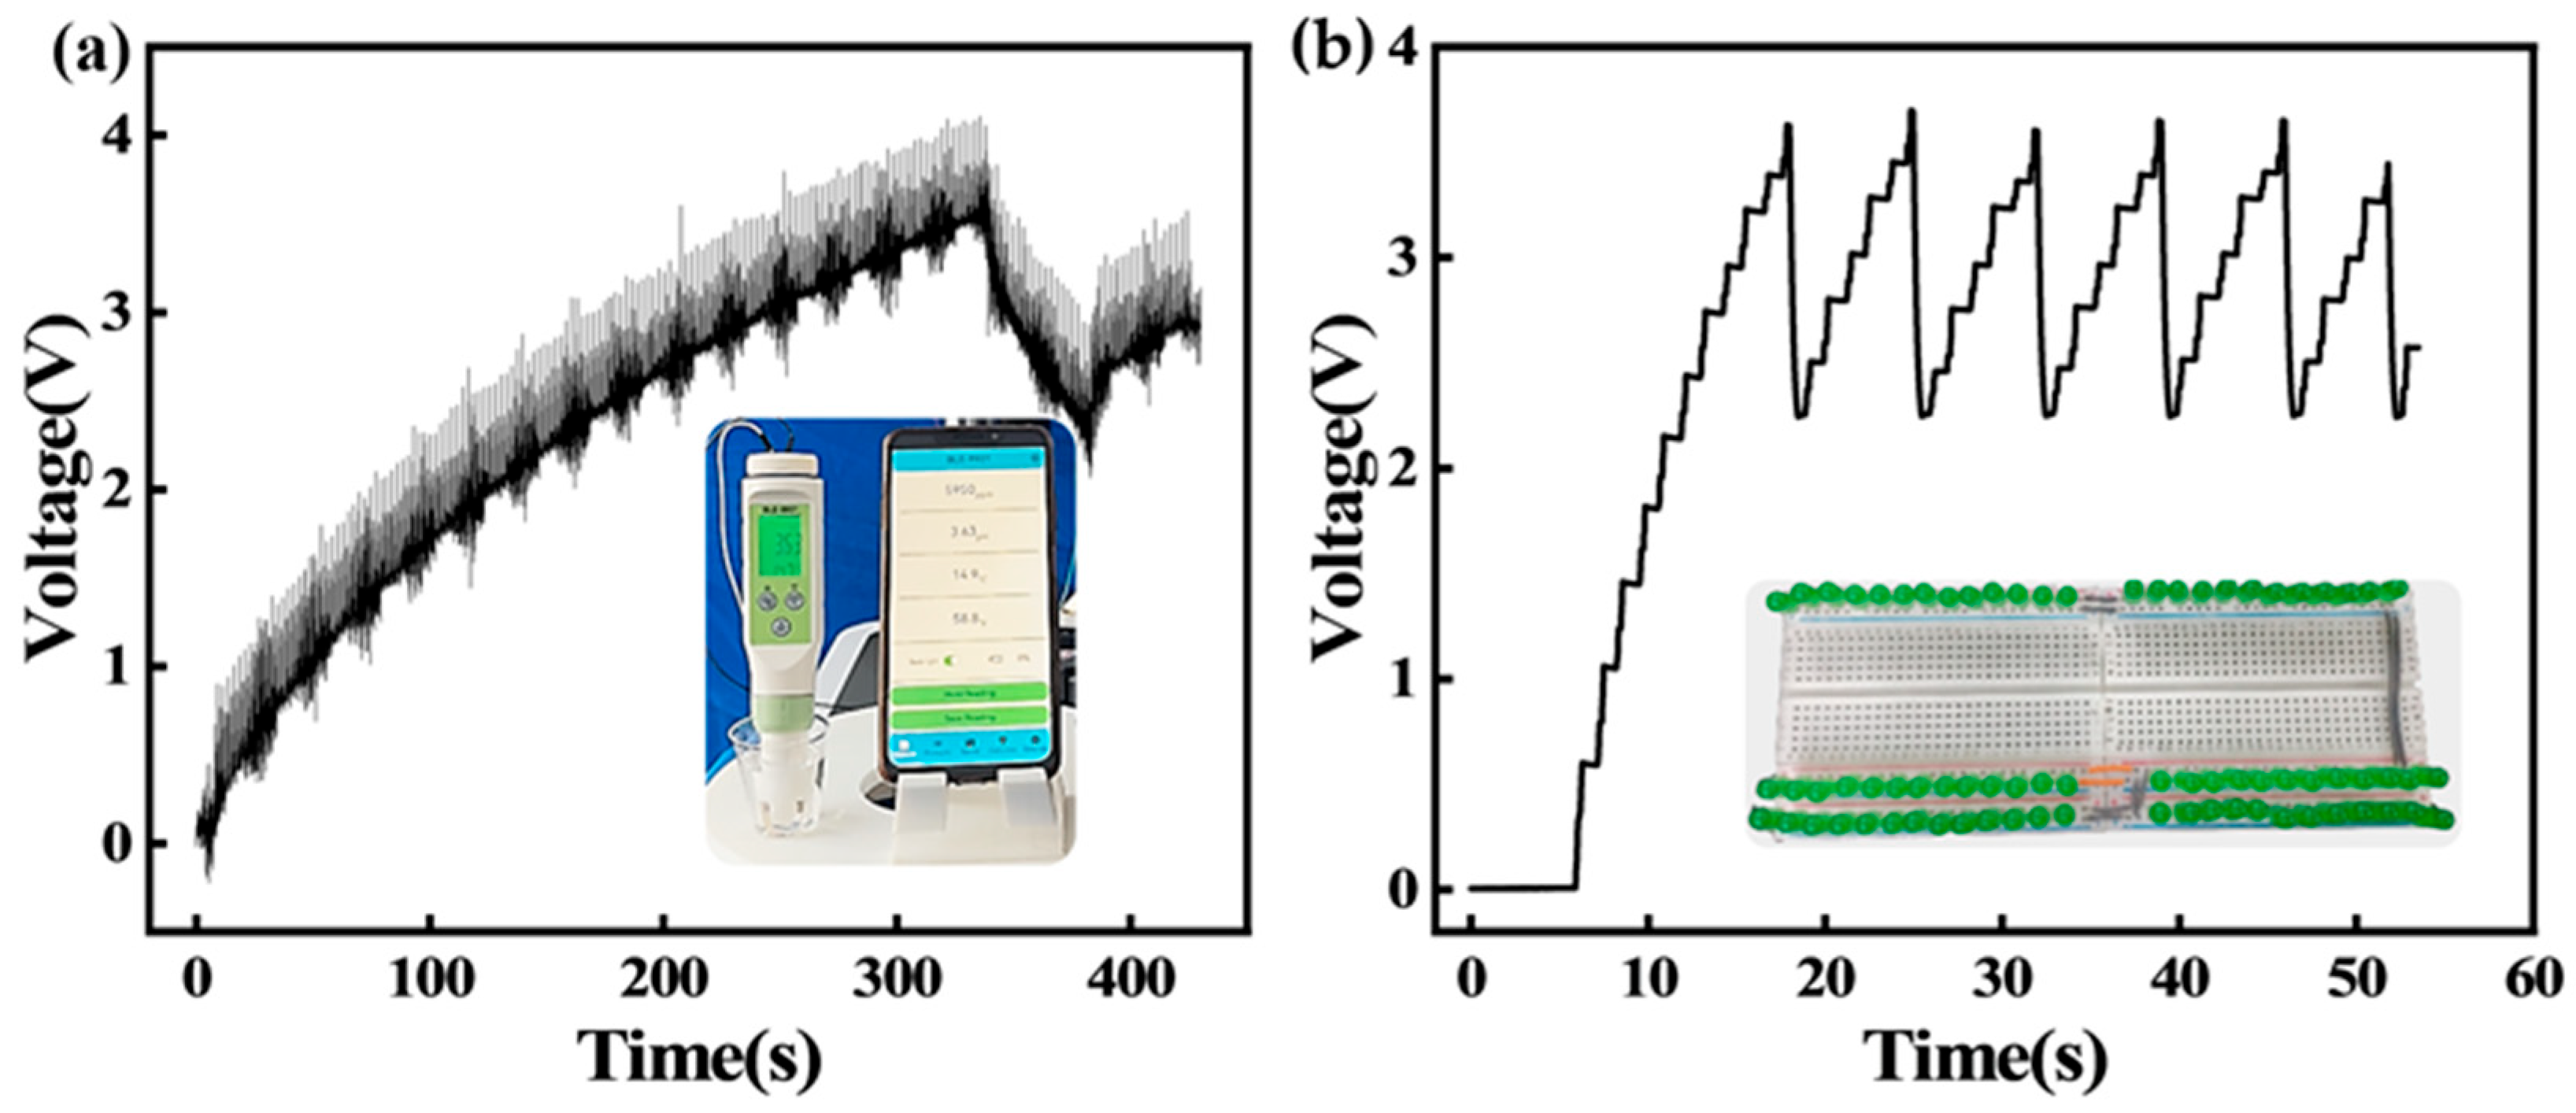
Figure 15, the power take off layer was used to charge a 0.1 F capacitor to power a water quality (temperature and pH) sensor. The sensor integrated Bluetooth module (for wireless data transmission) and memory module (for water temperature and pH data). As shown in
Figure 16a, under the test condition of 18° pitch angle and 0.6 Hz frequency, the power take off layer charged the 0.1 F capacitor to 3.5 V within 5.5 min. This capacitor voltage was adequate to power the Bluetooth water quality sensor. After the sensor started operating, the capacitor voltage began to drop. As the voltage dropped to 2.4 V, the energy management circuit cut off the connection between the capacitor and the sensor, and the water quality sensor stopped working. The working process could last for approximately 50 s.
Under the condition of 18° pitch angle and 0.6 Hz frequency, the power take off layer also successfully powered 70 LEDs (5 mm diameter). As shown in
Figure 16b, when the 6800 μF capacitor voltage reached 3.6 V, the energy management circuit was activated to power the LEDs. As the voltage declined, the circuit triggered a low-voltage lockout at approximately 2.25 V, disconnecting the capacitor from the LEDs to cut energy loss.
In general, the design comes with advantages in aspects of corrosion or fatigue. As the power take off is built-in (does not contact seawater), the corrosion problem can be greatly relieved. The rolling magnet does not has mechanical transmission or many solid constrains, it is expected to have less fatigue issue. The collision with the ends of the track can become an issue, but it can be relieved by adding springs at both ends.


