Article

Spatial Dynamics and Ecological Risk Assessment of Microplastics in Littoral Sediments of the Sea of Marmara, Türkiye

by
Esra Billur Balcıoğlu İlhan
Department of Chemical Oceanography, Institute of Marine Sciences and Management, Istanbul University, Istanbul 34134, Türkiye
J. Mar. Sci. Eng. 2025, 13(6), 1159; https://doi.org/10.3390/jmse13061159
Submission received: 16 May 2025 / Revised: 1 June 2025 / Accepted: 3 June 2025 / Published: 12 June 2025
(This article belongs to the Special Issue Marine Pollution, Bioremediation and Ecosystem Restoration)

Abstract

Plastic and especially microplastic (MP) pollution has posed a serious threat to the marine environment for decades. Studies on MPs have started to gain momentum especially in the Sea of Marmara (SoM), which is an international waterway, under the pressure of intense maritime traffic and exposure to domestic and industrial discharges. The aim of this study was to evaluate the MPs found in surface sediments collected from the coastal area of the SoM according to the locations and to reveal the extent of the existing pollution. This is the first study to examine MPs in both the surface sediments of the entire shorelines of the SoM, which have not been previously reported, and in the surface sediments of Çanakkale Strait. Accordingly, the highest MP abundance was detected at Yenice station (St 15) with 1286 items/kg, and the lowest MP abundance was detected at Turan Village station (St 14) with 199 items/kg. The most dominant shapes across all sampling stations and months were fiber (37%) and fragment (26%), while the most dominant color was blue (35%). According to the polymer characterization results, PE (polyethylene) was found to be the most dominant polymer type. Additionally, most stations were found to have “Moderate” and “High” pollution levels in terms of the contamination factor (CF), and regions were classified as “Moderate” and ‘High’ in terms of the pollution load index (PLI), with the St 15 station specifically exhibiting “Very High” pollution levels. Furthermore, hazard index (HI) and pollution risk index (PRI) values were also calculated regionally, revealing that regions have pollution levels classified as “High”, “Very High”, and even “Dangerous”. This study concluded that there are no areas with low pollution levels in SoM, and that the threat posed by MP pollution in this sea is increasing. Furthermore, this study found that stations with high MP pollution levels are located near river discharges and that rivers significantly contribute to MP pollution in the seas. The findings are of great importance in terms of the need to implement sustainable plans and measures to prevent pollution in the SoM and to take concrete steps to protect and ensure the sustainability of coastal ecosystems, particularly those under serious pollution threats.

1. Introduction

Aquatic ecosystems are among the ecosystems most affected by MP pollution. The main reason for this is domestic and industrial wastewater discharges into aquatic areas, which are considered the primary source of MP, leachate from solid waste disposal sites, and aquaculture activities [1,2]. Although most MPs with a polymer chemical structure resistant to degradation are removed in wastewater treatment plants [3], it is known that MPs leaking from wastewater treatment plants accumulate in aquatic areas that serve as receiving environments. In particular, most MPs that enter the marine environment never sink due to their low density and the high density of seawater and can float or remain suspended indefinitely [4], and their occurrence speed will affect the distance of MPs in their travel from the source [5]. Nevertheless, they can also sink to the bottom due to their ability to adsorb various contaminants. As a result of these processes, approximately 70% to 90% of MPs in water could be expected to accumulate in sediments [6]. Consequently, the continuous release of MPs into coastal environments, along with their subsequent vertical transport and sedimentation following suspension in the water column, contributes to the substantial accumulation of MPs in nearshore sediments. So, the presence and concentration of MPs in coastal areas have begun to be investigated in different regions around the world in recent years [7,8,9,10,11].
MPs are described as plastic pieces smaller than 5 mm and have been found globally in various marine environments, such as seawater and sediments [12,13,14]. Studies conducted particularly in marine areas have shown that plastics accumulate both in the water column and in bottom and coastal sediments [15,16]. MP pollution in marine environments represents a critical environmental issue and has emerged as an international priority due to its extensive and rapidly escalating distribution [15,17,18]. An estimated 8 million tons of plastic enter the world’s oceans each year in addition to the 150 million metric tons of plastic already known to exist in the oceans [19,20]. These micropollutants have anthropogenic origins and contaminate various environmental media directly and/or indirectly, adversely affecting the ecosystem and ecological processes in the environment [21,22,23].
The Marmara Region has 11 cities and a population of 24,465,194. The SoM is a semi-enclosed inland sea with a coastline of approximately 1200 km, including the straits, and together with the Istanbul Strait and the Çanakkale Strait forms the Turkish Straits System (TSS) being an international waterway. In particular, the location of major cities such as Istanbul, Bursa, Kocaeli, Balıkesir, and Tekirdağ on the coast of the sea, and the domestic and industrial waste/wastewater, agricultural activities, and maritime activities originating from these cities, significantly increase pollution [24,25]. In addition to all this, pollutants also come from the Danube River, which accounts for 50% of the pollution in the Black Sea [26]. Although the number of studies on SoM sediments has been increasing recently, most of these studies have been conducted in the eastern part of the SoM, particularly in specific regions such as the Istanbul Strait and its coasts [27,28,29,30,31], the Golden Horn [32,33], the Küçükçekmece Lagoon [34], the Gemlik Bay [35], and the Bandırma Bay [36]. However, it should also be noted that there is no study that reveals the degree of MP pollution exposure of all coastal area sediments in the SoM and evaluates this pollution collectively across all regions. Therefore, this study is the first to examine the entire coastal zone of the SoM, including the Istanbul and Çanakkale Straits, not only as an inland sea but also as an international waterway. Within this framework, the amount of MP in coastal surface sediments collected along the entire coastal zone of the SoM, including the Çanakkale Strait, their morphological characteristics, and the variation of polymer types according to stations and regions were investigated, and an ecological risk assessment was conducted.
Thus, the author believes that these results will contribute to the establishment of an MP monitoring system in the future and provide useful information for a comprehensive assessment of the potential risks posed by MPs in sediments in all coastal areas. Additionally, it will provide important information by serving as a database for future studies on biota samples in these areas in terms of the spatial–temporal determination of point and diffuse sources, thereby assisting in the development of pollution-related policies.

2. Material and Methods
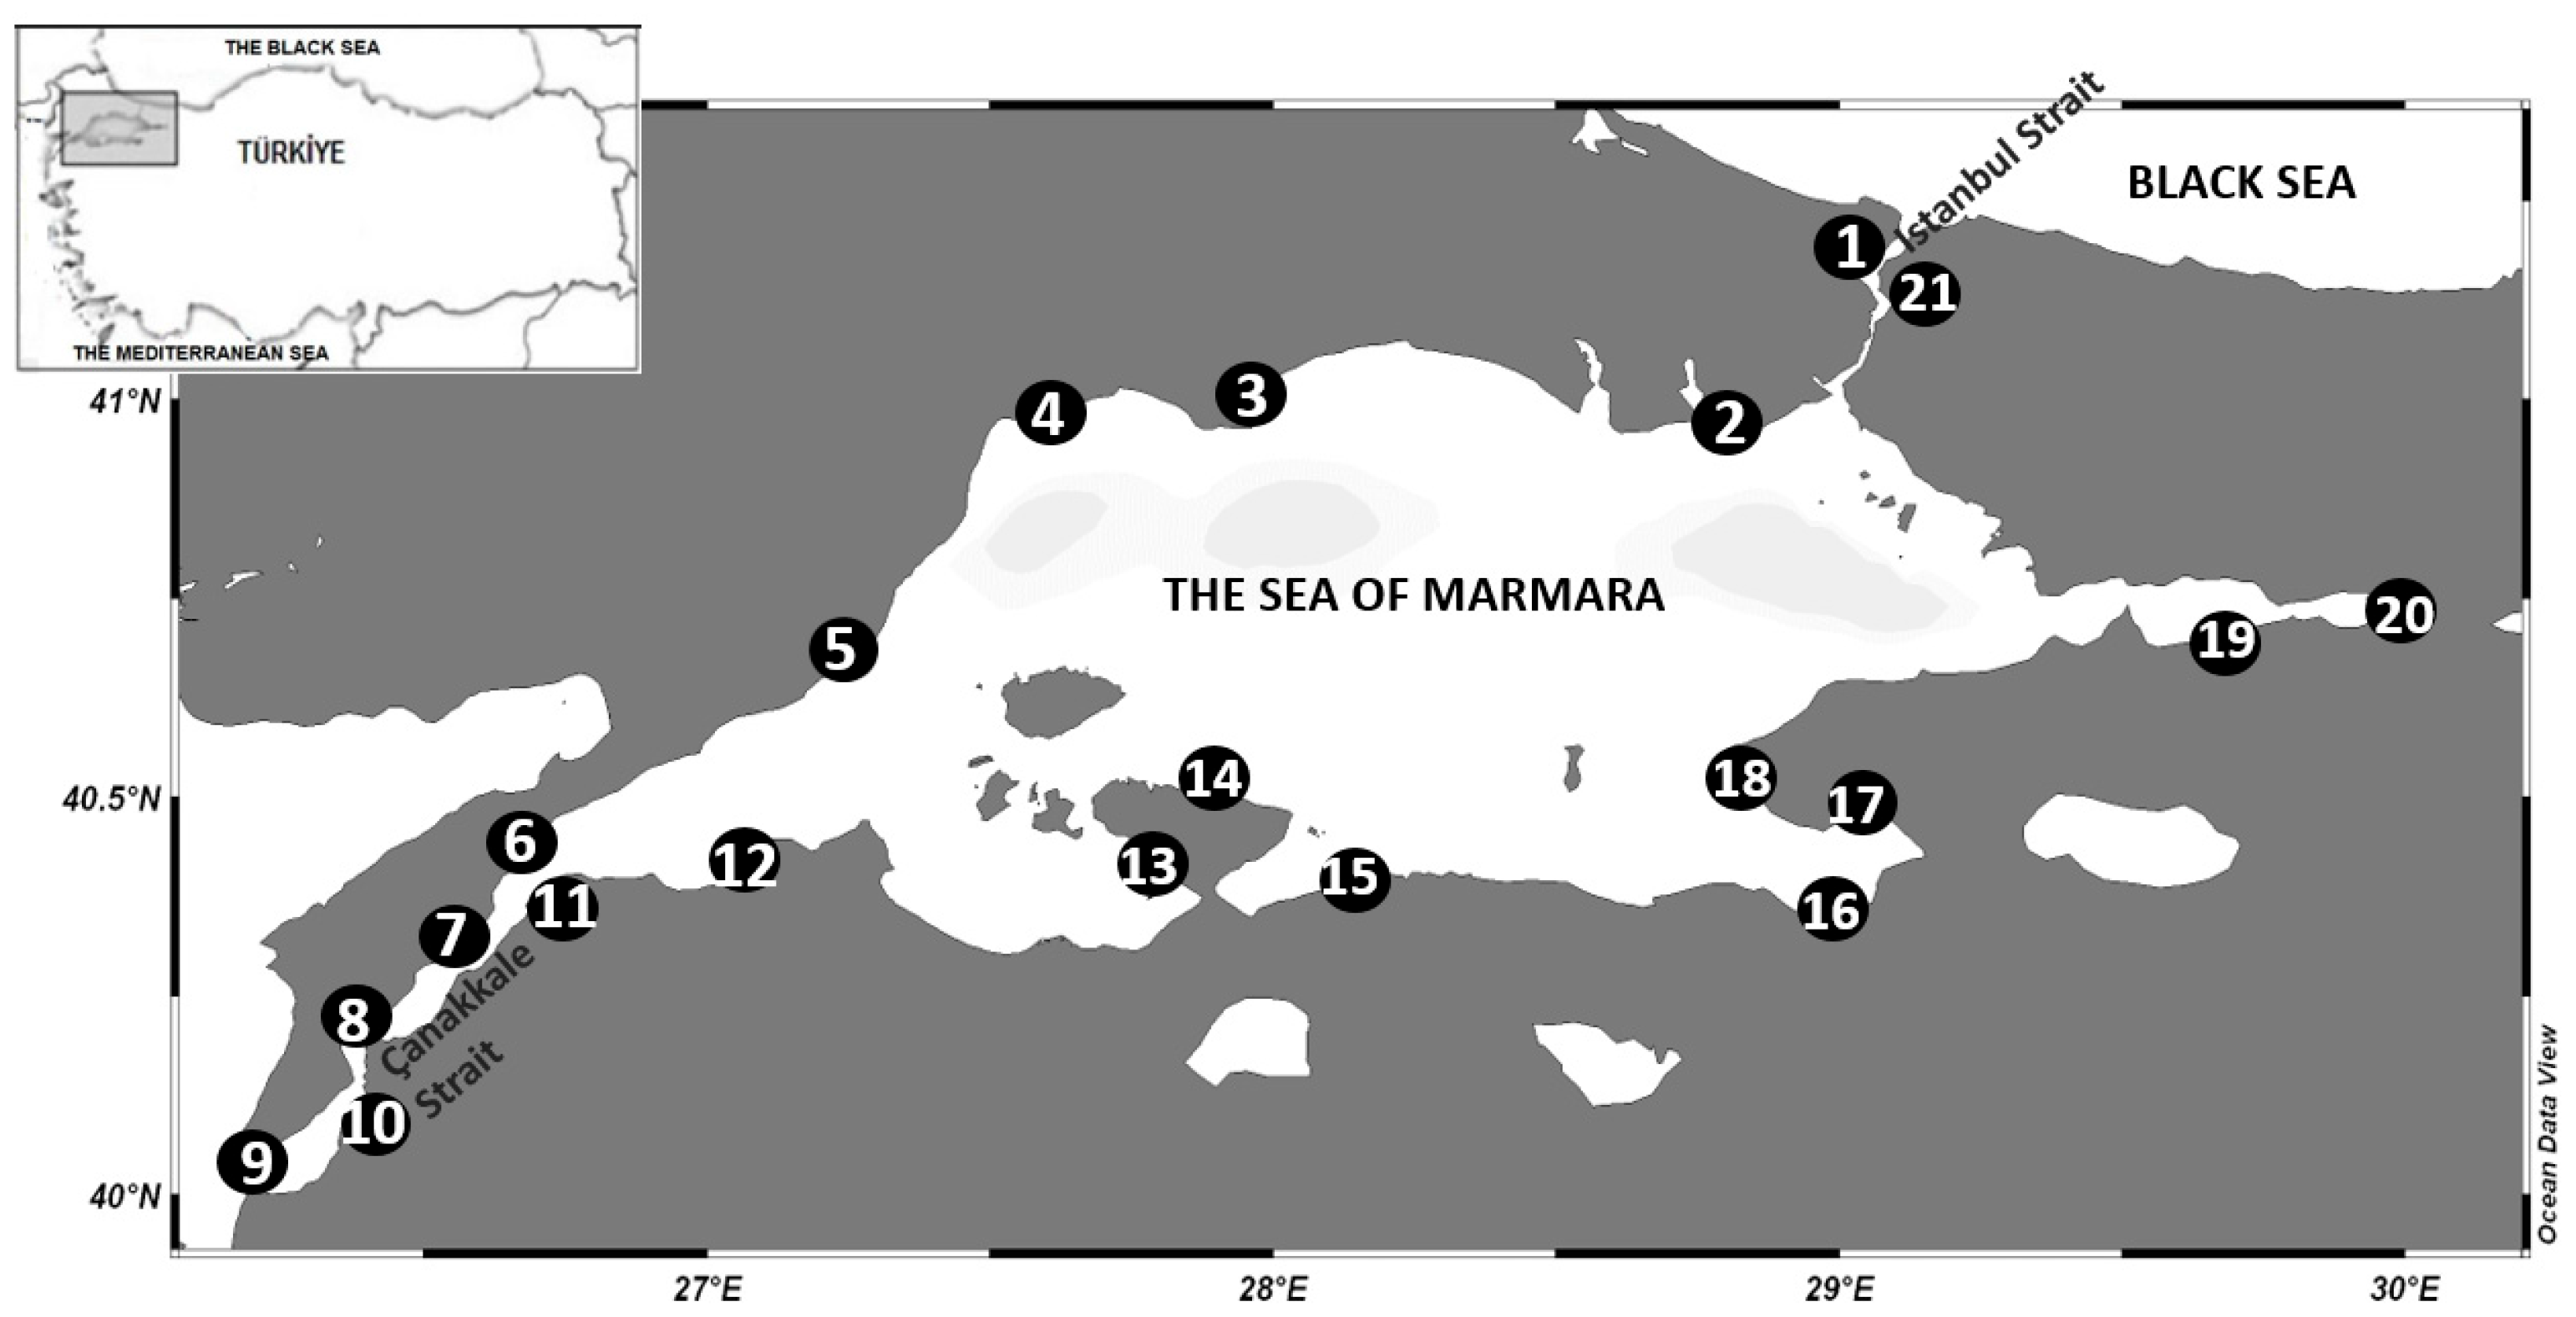
2.1. Research Area

In the Black Sea, including the Straits of Istanbul and Çanakkale, there is a two-layered water system where the slightly saline (18 PSU) waters flowing from the Black Sea to the Mediterranean Sea and the saline (38 PSU) waters flowing from the Mediterranean Sea to the Black Sea do not fully mix due to their different salinity and density levels [37,38,39]. The halocline layer, where two different layers meet and there is a small amount of mixing, is located at approximately 25 m. Coastal salinities may vary depending on freshwater inputs such as river discharges in the regions. Within the scope of this study, coastal sediments were collected from 21 different stations along the coast of the SoM.
Fieldwork was conducted between April 8 and 15, 2024. Sampling stations are shown in Figure 1.

2.2. Sampling

Surface sediments (0–10 cm) were collected from all stations according to depth by diving or Van Veen grabs or manually into glass jars, which were then tightly sealed. Following collection in glass jars, the samples were transported under refrigerated conditions and preserved at −18 °C until further analysis. In order to obtain a dry research material, it has been reported that the sample must be dried prior to analysis, and freeze-drying has been recommended to prevent the polymer structure of the MP in the sample from deteriorating [40]. Therefore, prior to analysis, the samples were removed from the deep freezer and freeze-dried in a lyophilizer without allowing them to thaw.

2.3. Microplastic Extraction

Pritzker et al. [41] used two different extraction methods to identify MPs in sediment samples and compared the differences between them. In the first method, 140 g/L of NaCl solution was added to 1 kg of wet sediment sample, mixed for 5 min, left to settle for 1 h, and then filtered through a sieve, and then it was examined under a microscope. In the second method, 10 g of dry sediment sample was taken and 150 mL of NaCl (1.2 g/mL) solution was added in three stages, mixed for 1 min, and left to settle for 5 min. Then, 5 mL of 30% v/v H2O2 was added for the decomposition of organic matter, and the mixture was left to stand for 24 h, filtered, and counted under a microscope. In the second method, the number of MP particles and the color scale were found to be higher than in the first method [41].
Thus, the second method was applied to 10 g of sediment sample after drying using ZnCl2 (Fisher Scientific, Waltham, MA, USA) solution. For this purpose, 10 g of sediment sample was placed in three separate beakers, and 150 mL of ZnCl2 (1.7 g/mL) solution was added in three stages to each beaker, with five minutes of mixing between each stage. The analyses were conducted in three separate parallel sets. The clarity of the upper layers was monitored, and the samples were left to settle completely for 48–72 h. After settling was complete, 10 mL of 30% v/v H2O2 (Merck Scientific 50%, Darmstadt, Germany) was added, and the mixture was left to settle for 24 h. Finally, the natant in the samples was decanted and filtered through GF/C filter paper, then the paper was dried in an oven at 35 °C and visually assessed under a microscope.

2.4. Physical and Chemical Characterization

Filter papers were examined under a stereomicroscope (AccuScope—AccuScope—3075-LED-E Binocular Zoom Stereo Microscope, New York, NY, USA) to identify the morphological structures of MP particles based on visual assessment according to Hidalgo-Ruz et al. [15]. These particles are classified according to their shapes as fibers, filaments, particles, films, beads, and foams.
The polymeric characterizations of the separated MPs were determined by FTIR (Fourier Transform Infrared Spectroscopy—PerkinElmer—Rowville, Melbourne, Australia) spectroscopy. Analyses were performed in the wavelength range of 4000 cm−1 to 400 cm−1. Particle spectra analysis results were compared with library data in the device.

2.5. QA/QC

Throughout the analyses conducted in this study, as in other similar studies, the analyses were carried out with great care to ensure that there was no contamination from the external environment [42,43]. The instruments and equipment used in the laboratory processes were rinsed with distilled water prior to analysis, left to dry in an airtight environment, and stored in aluminum foil until analysis. Extractions and microscopic observations were performed using cotton clothing and nitrile gloves in an environment free of air currents. Therefore, all sources of air circulation, such as windows and doors, have been kept closed. In addition, before each use, the filter papers were individually checked under a microscope for any contamination.

2.6. Microplastics Contamination Factor and Pollution Risk Index

The MP contamination factor (Cf) indicates the contamination of MPs in the research material (MPi) based on background reference values (MPb), the calculation is shown in Equation (1). Since there is no internationally accepted reference value for this study, the lowest MP value recorded in this study (199 items/kg) was taken as MPb. This value was found in a sample taken from Turan Village (St 14), located at the highest point of the Kapıdağ Peninsula, where the lowest MP amount was detected, there is no industrialization, and settlement is sparse. Additionally, the regional MP pollution load index (PLI) was calculated as the nth root of the product of the Cf values at the stations (Equation (2)) [44].
Cf = MPi/MPb
PLI = (Cf1 × Cf2 × Cf3 × ………× Cfn)1/n
In this study, MPLI values were calculated for six different regions considered to be affected by different sources: The Istanbul Strait (IS), the northern shelf of the SoM (NS), the Çanakkale Strait (ÇS), the southern shelf of the SoM (SS), the Gemlik Bay (GB), and the Gulf of Izmit Bay (GI). The spatial distribution of stations is as follows: IS (St 1, 21), NS (St 2, 3, 4), ÇS (St 6, 7, 8, 9, 10, 11), SS (St 12, 13, 15), GI (16, 17, 18), and GI (St 19, 20) (St 14 was excluded from regional calculations as it was considered a reference value).

2.7. Hazard Index and Pollution Risk Index

The ecological effects of MP types of polymers also differ and can be calculated using the polymer hazard index (HI) formula given below (Equation (3)). During the production of each polymer, hazard scores (Sn) have been developed based on the relationship between the toxic substances contained in the polymer and the risk of exposure to these substances after the polymer has contaminated the natural environment [45]. “Pn” is the percentage of each polymer type at that point.
HI = ΣSn × Pn
The pollution risk index (PRI) represents the ecological risk posed by different polymer types, as determined by their respective pollution loads. The PRI value is calculated according to the following formula (Equation (4)).
PRI = ΣHI × PLI

2.8. Statistical Analysis

Statistical analyses of the data were conducted using IBM SPSS Statistics version 22. Spearman correlation analyses were performed to examine the relationships between MPs and shapes, as well as between MPs and colors. Kruskal–Wallis tests were applied to compare MPs across different regions. A p-value of less than 0.05 was considered statistically significant.

3. Results

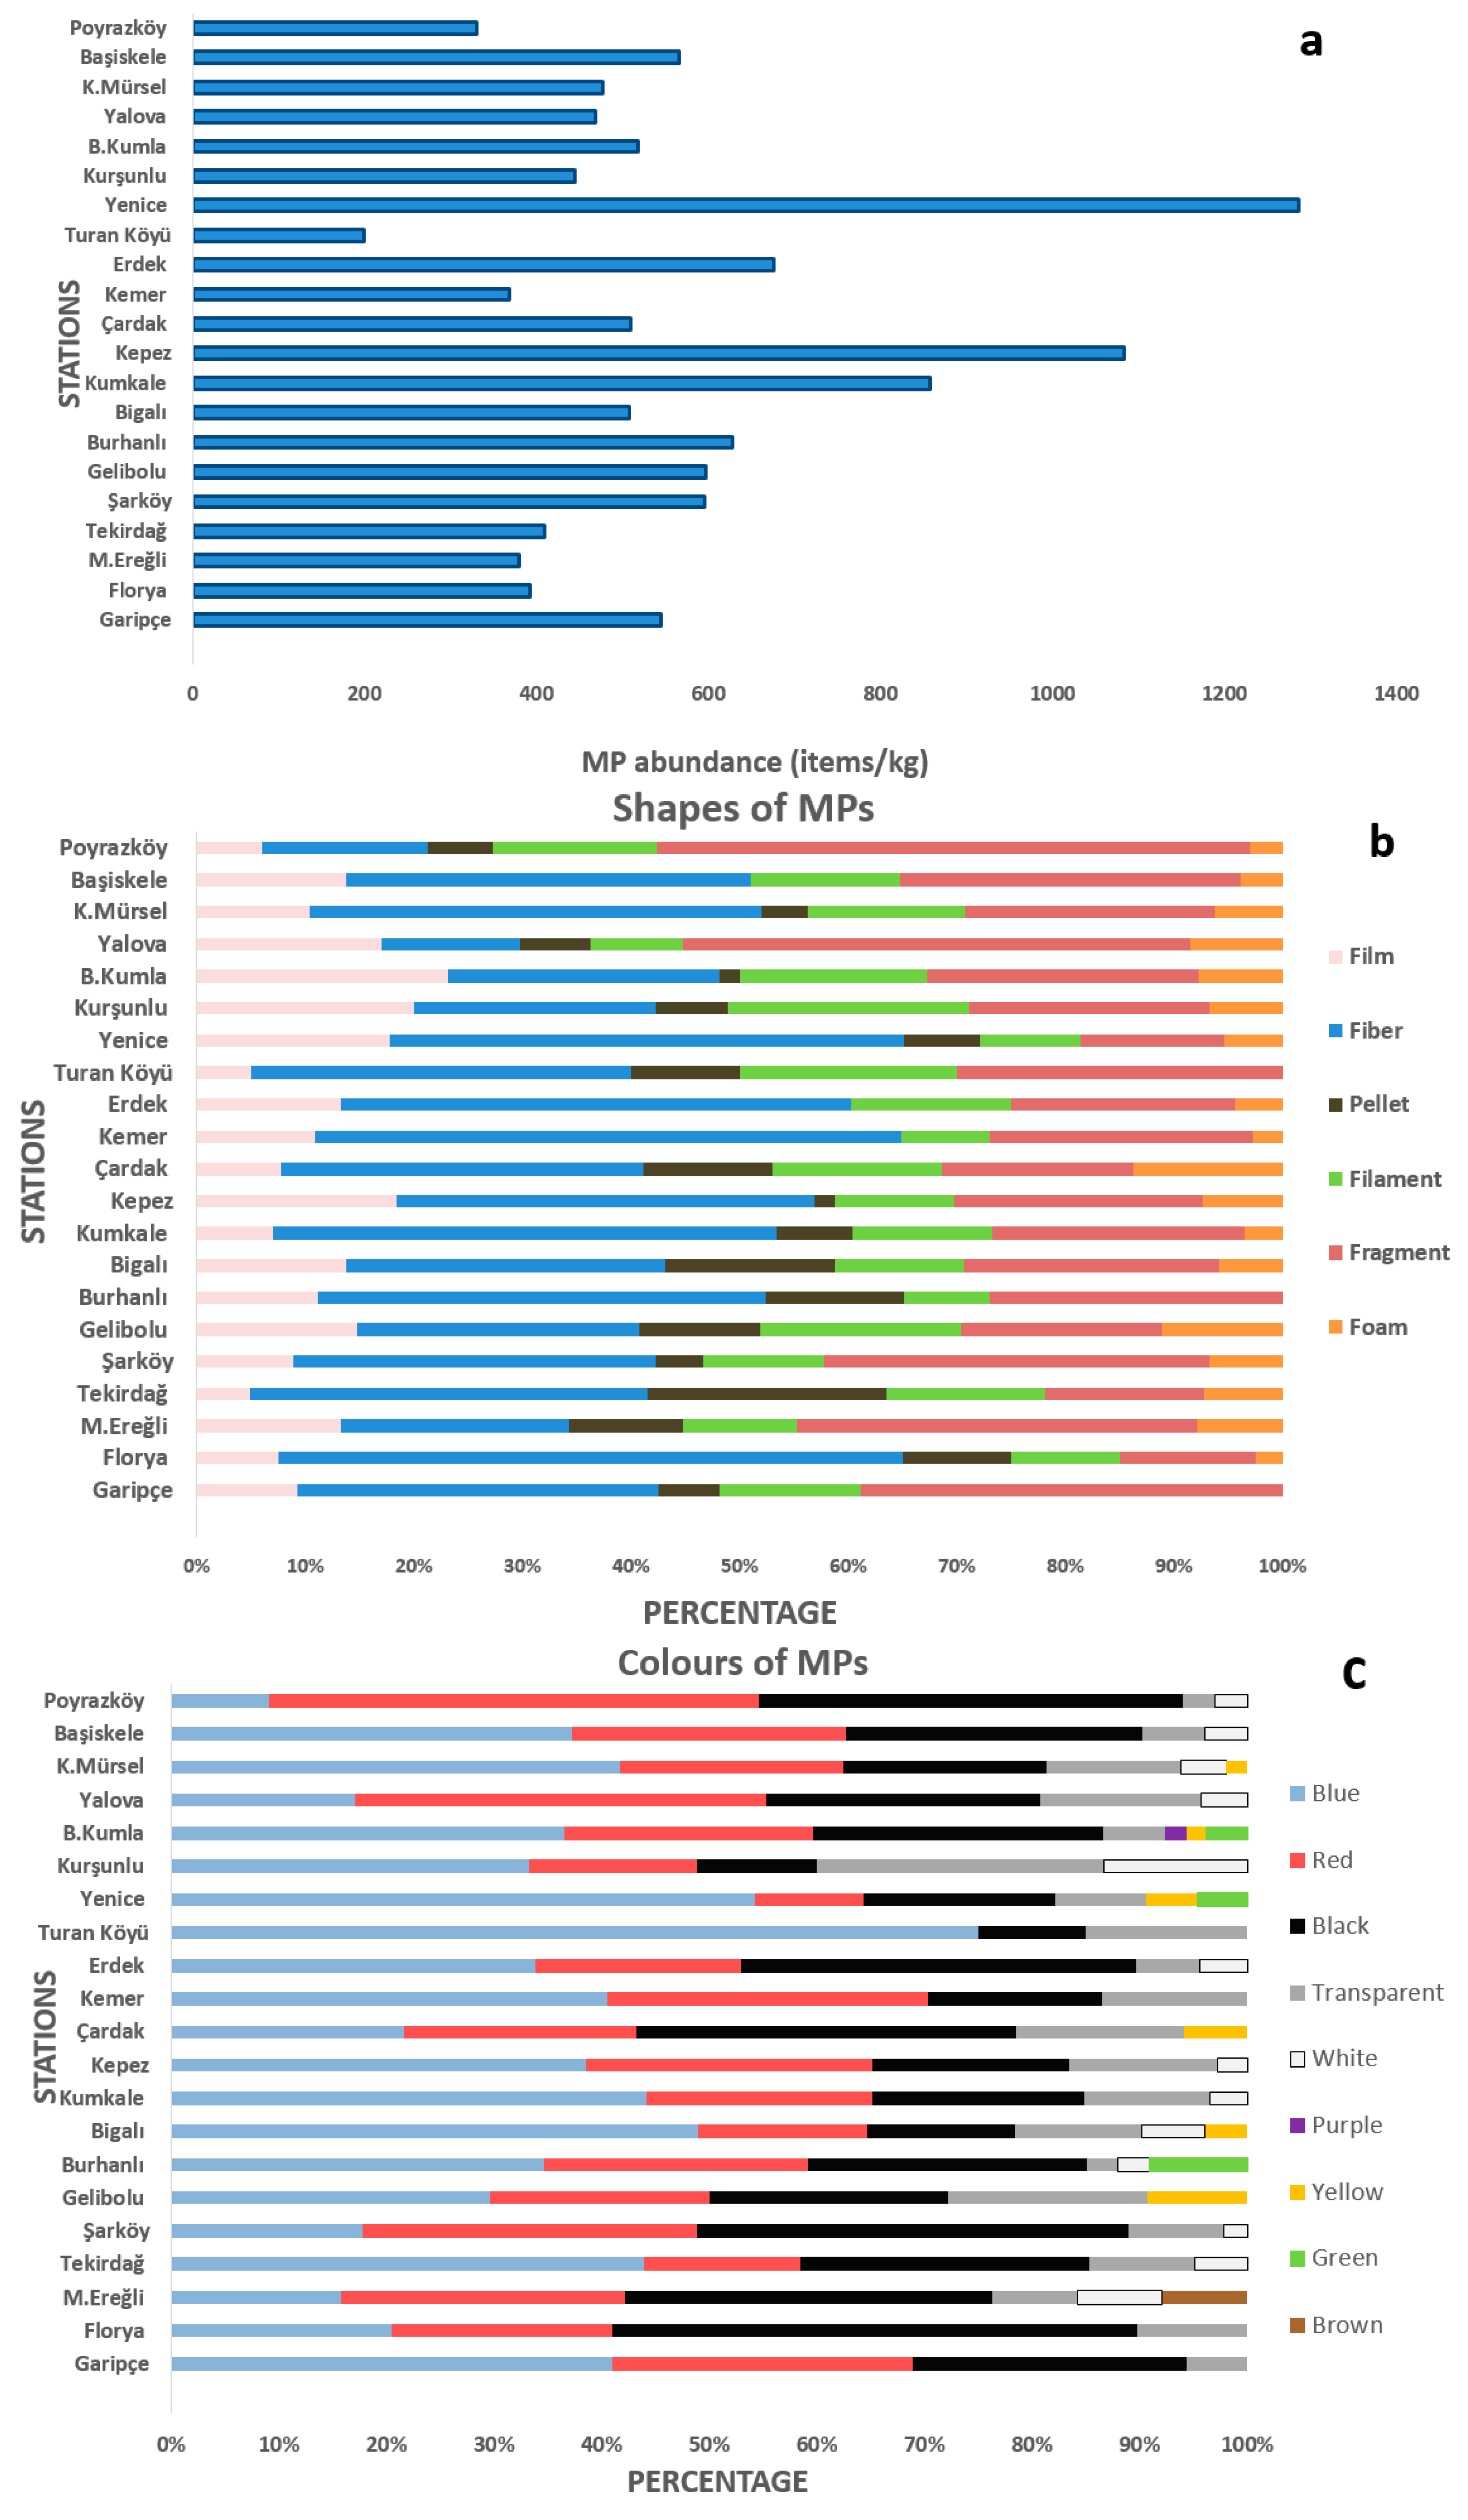
3.1. Abundance and Distribution of MPs in Sediments

Top-layer seabed samples from twenty-one distinct coastal locations of the SoM, encompassing the Çanakkale Strait, were examined. A total of 11,837 items were detected in sediments from all sampling points. Distribution patterns of MPs in seabed sediments varied between 199 and 1286 items/kg dw across all regions. The average MP particle count varied depending on the stations and regions where the samples were collected. The SS exhibits relatively higher MP levels than the NS, with particularly high values per kilogram recorded in the ÇS and the SS. However, the lowest MP value per kilogram was detected in Turan Village (St 14), located at the highest point of the Kapıdağ Peninsula on the SS of the SoM, with 199 items (Figure 2a).
The MP extraction protocol applied in this study demonstrated a high recovery efficiency, yielding over 95% of MPs from sediment matrices. Validation tests using reference polymers revealed recovery rates ranging from 90% to 98% for the three predominant polymer types commonly detected in marine sediments—polyethylene (PE), polyethylene terephthalate (PET), and polypropylene (PP). Among these, PET exhibited the lowest recovery efficiency, while PE showed the highest, indicating both the robustness and selectivity of the method across polymer types.

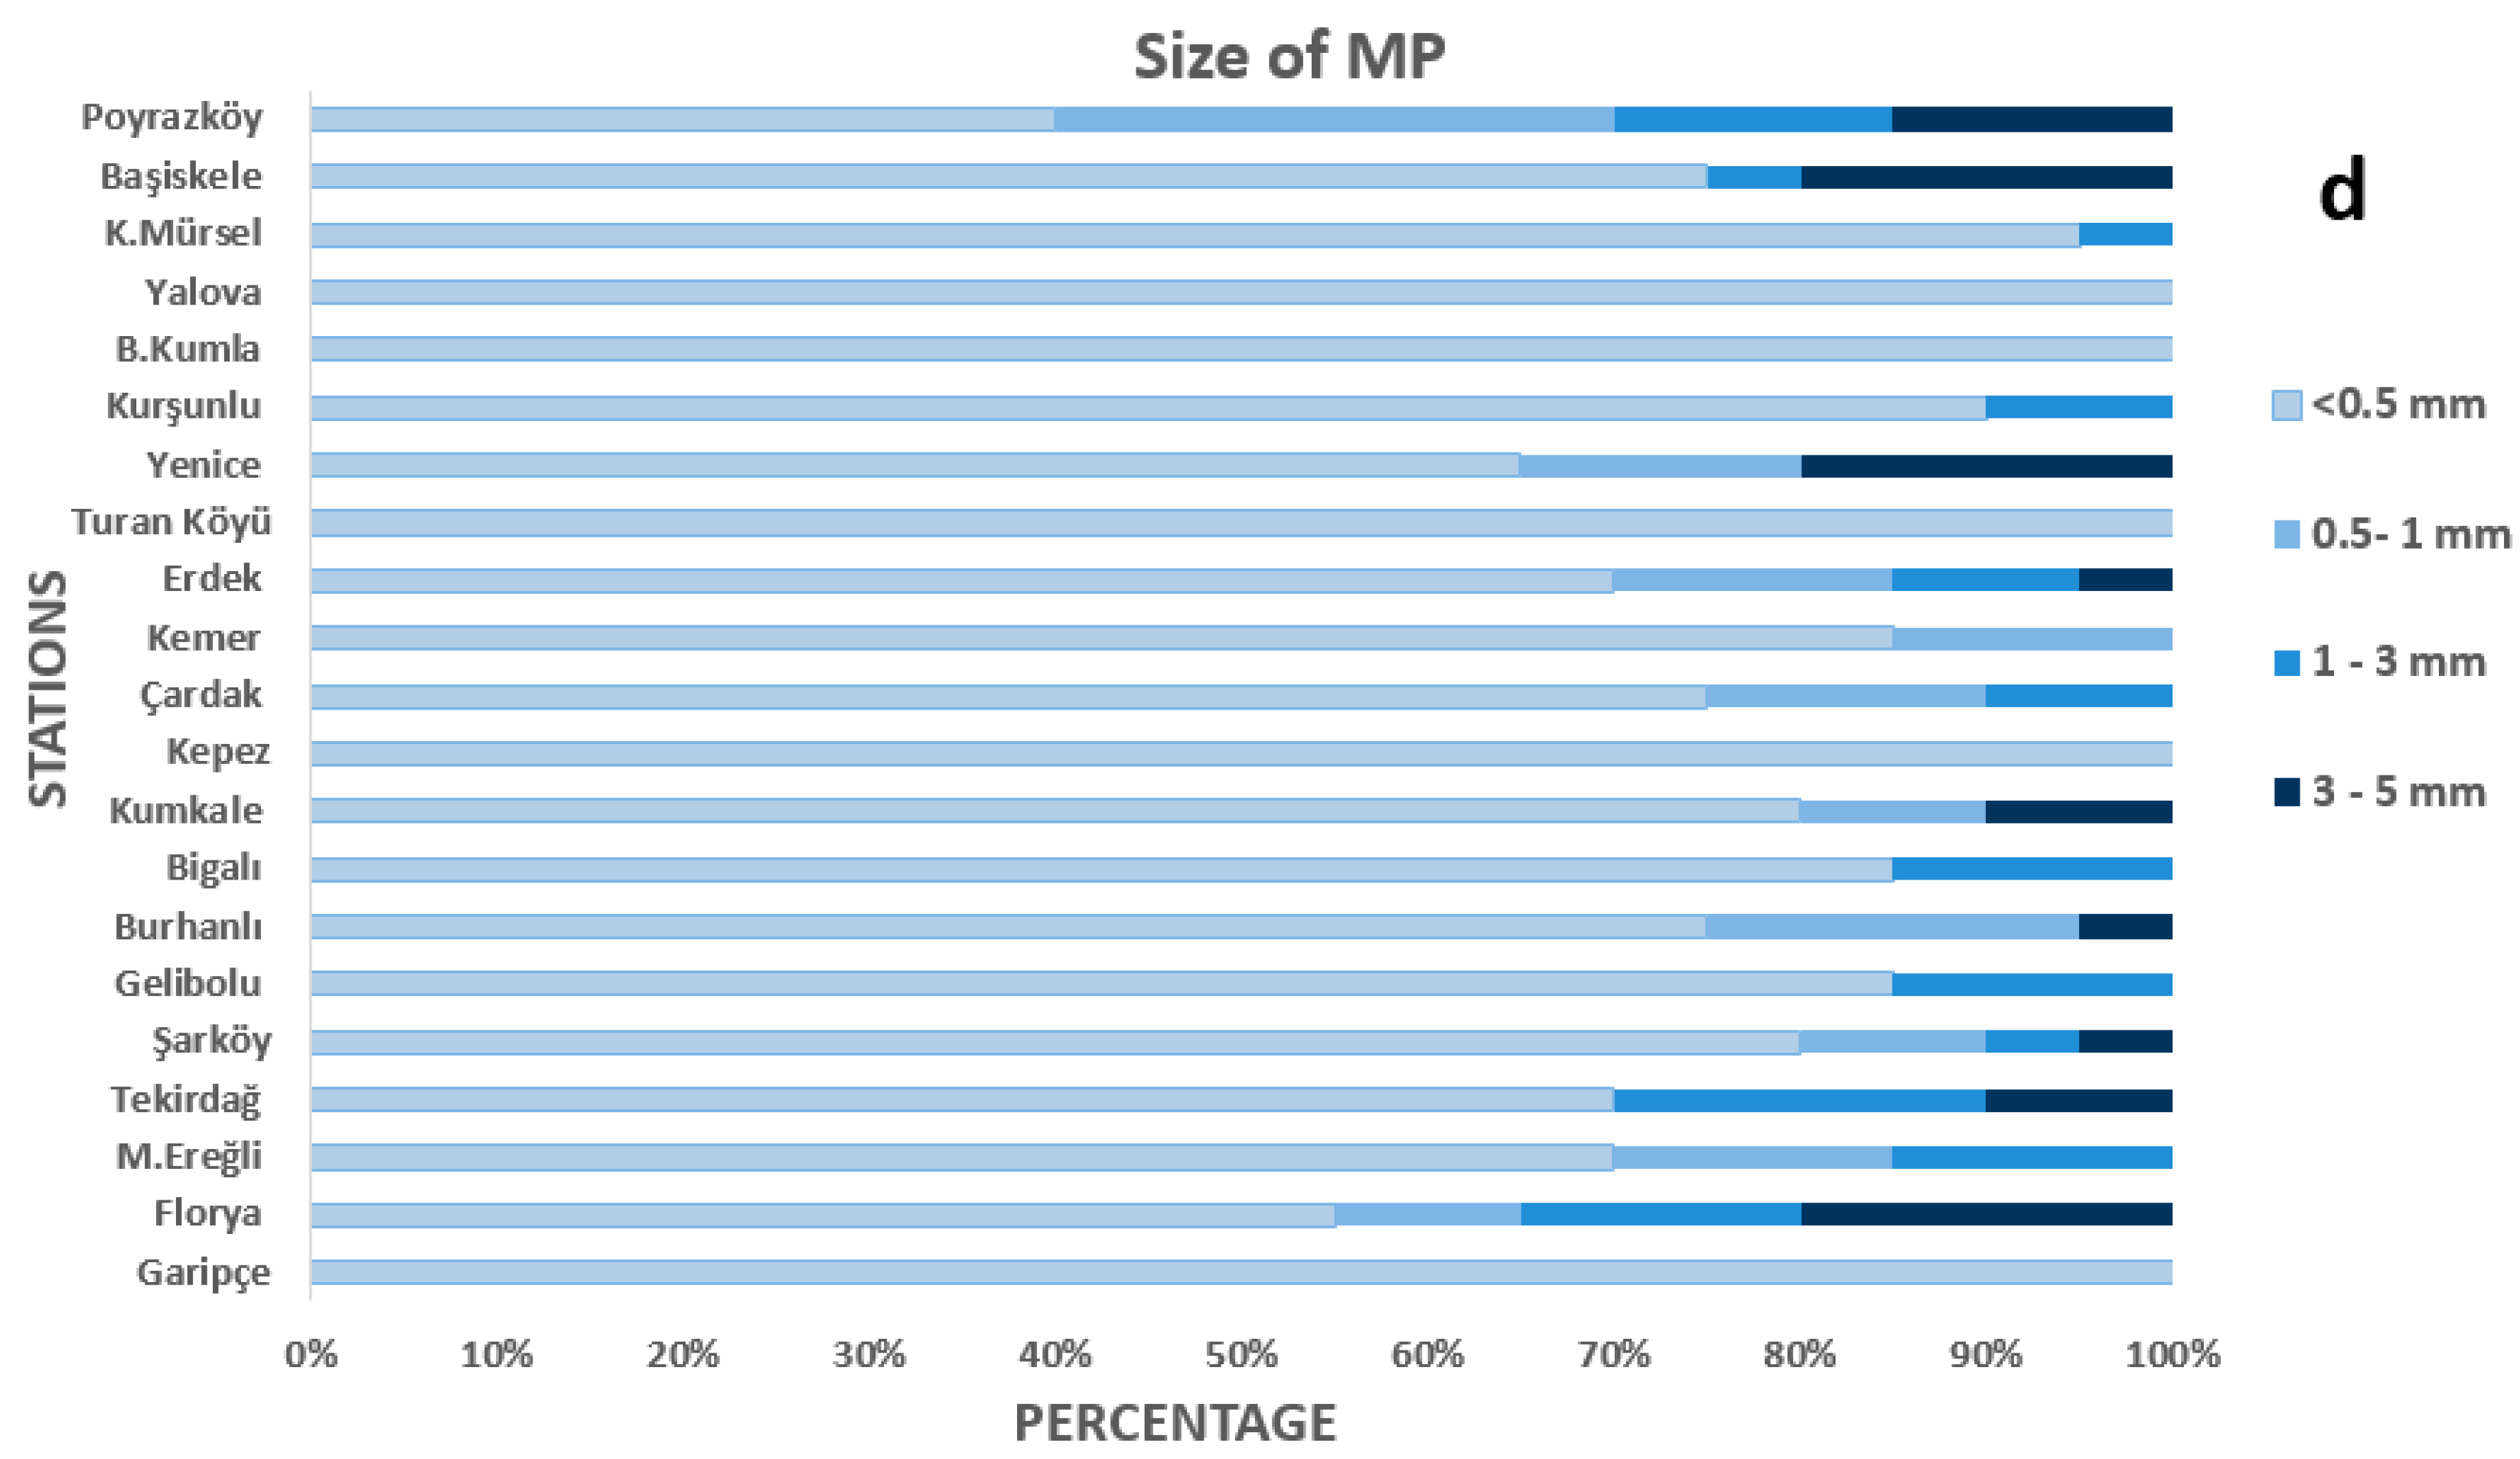
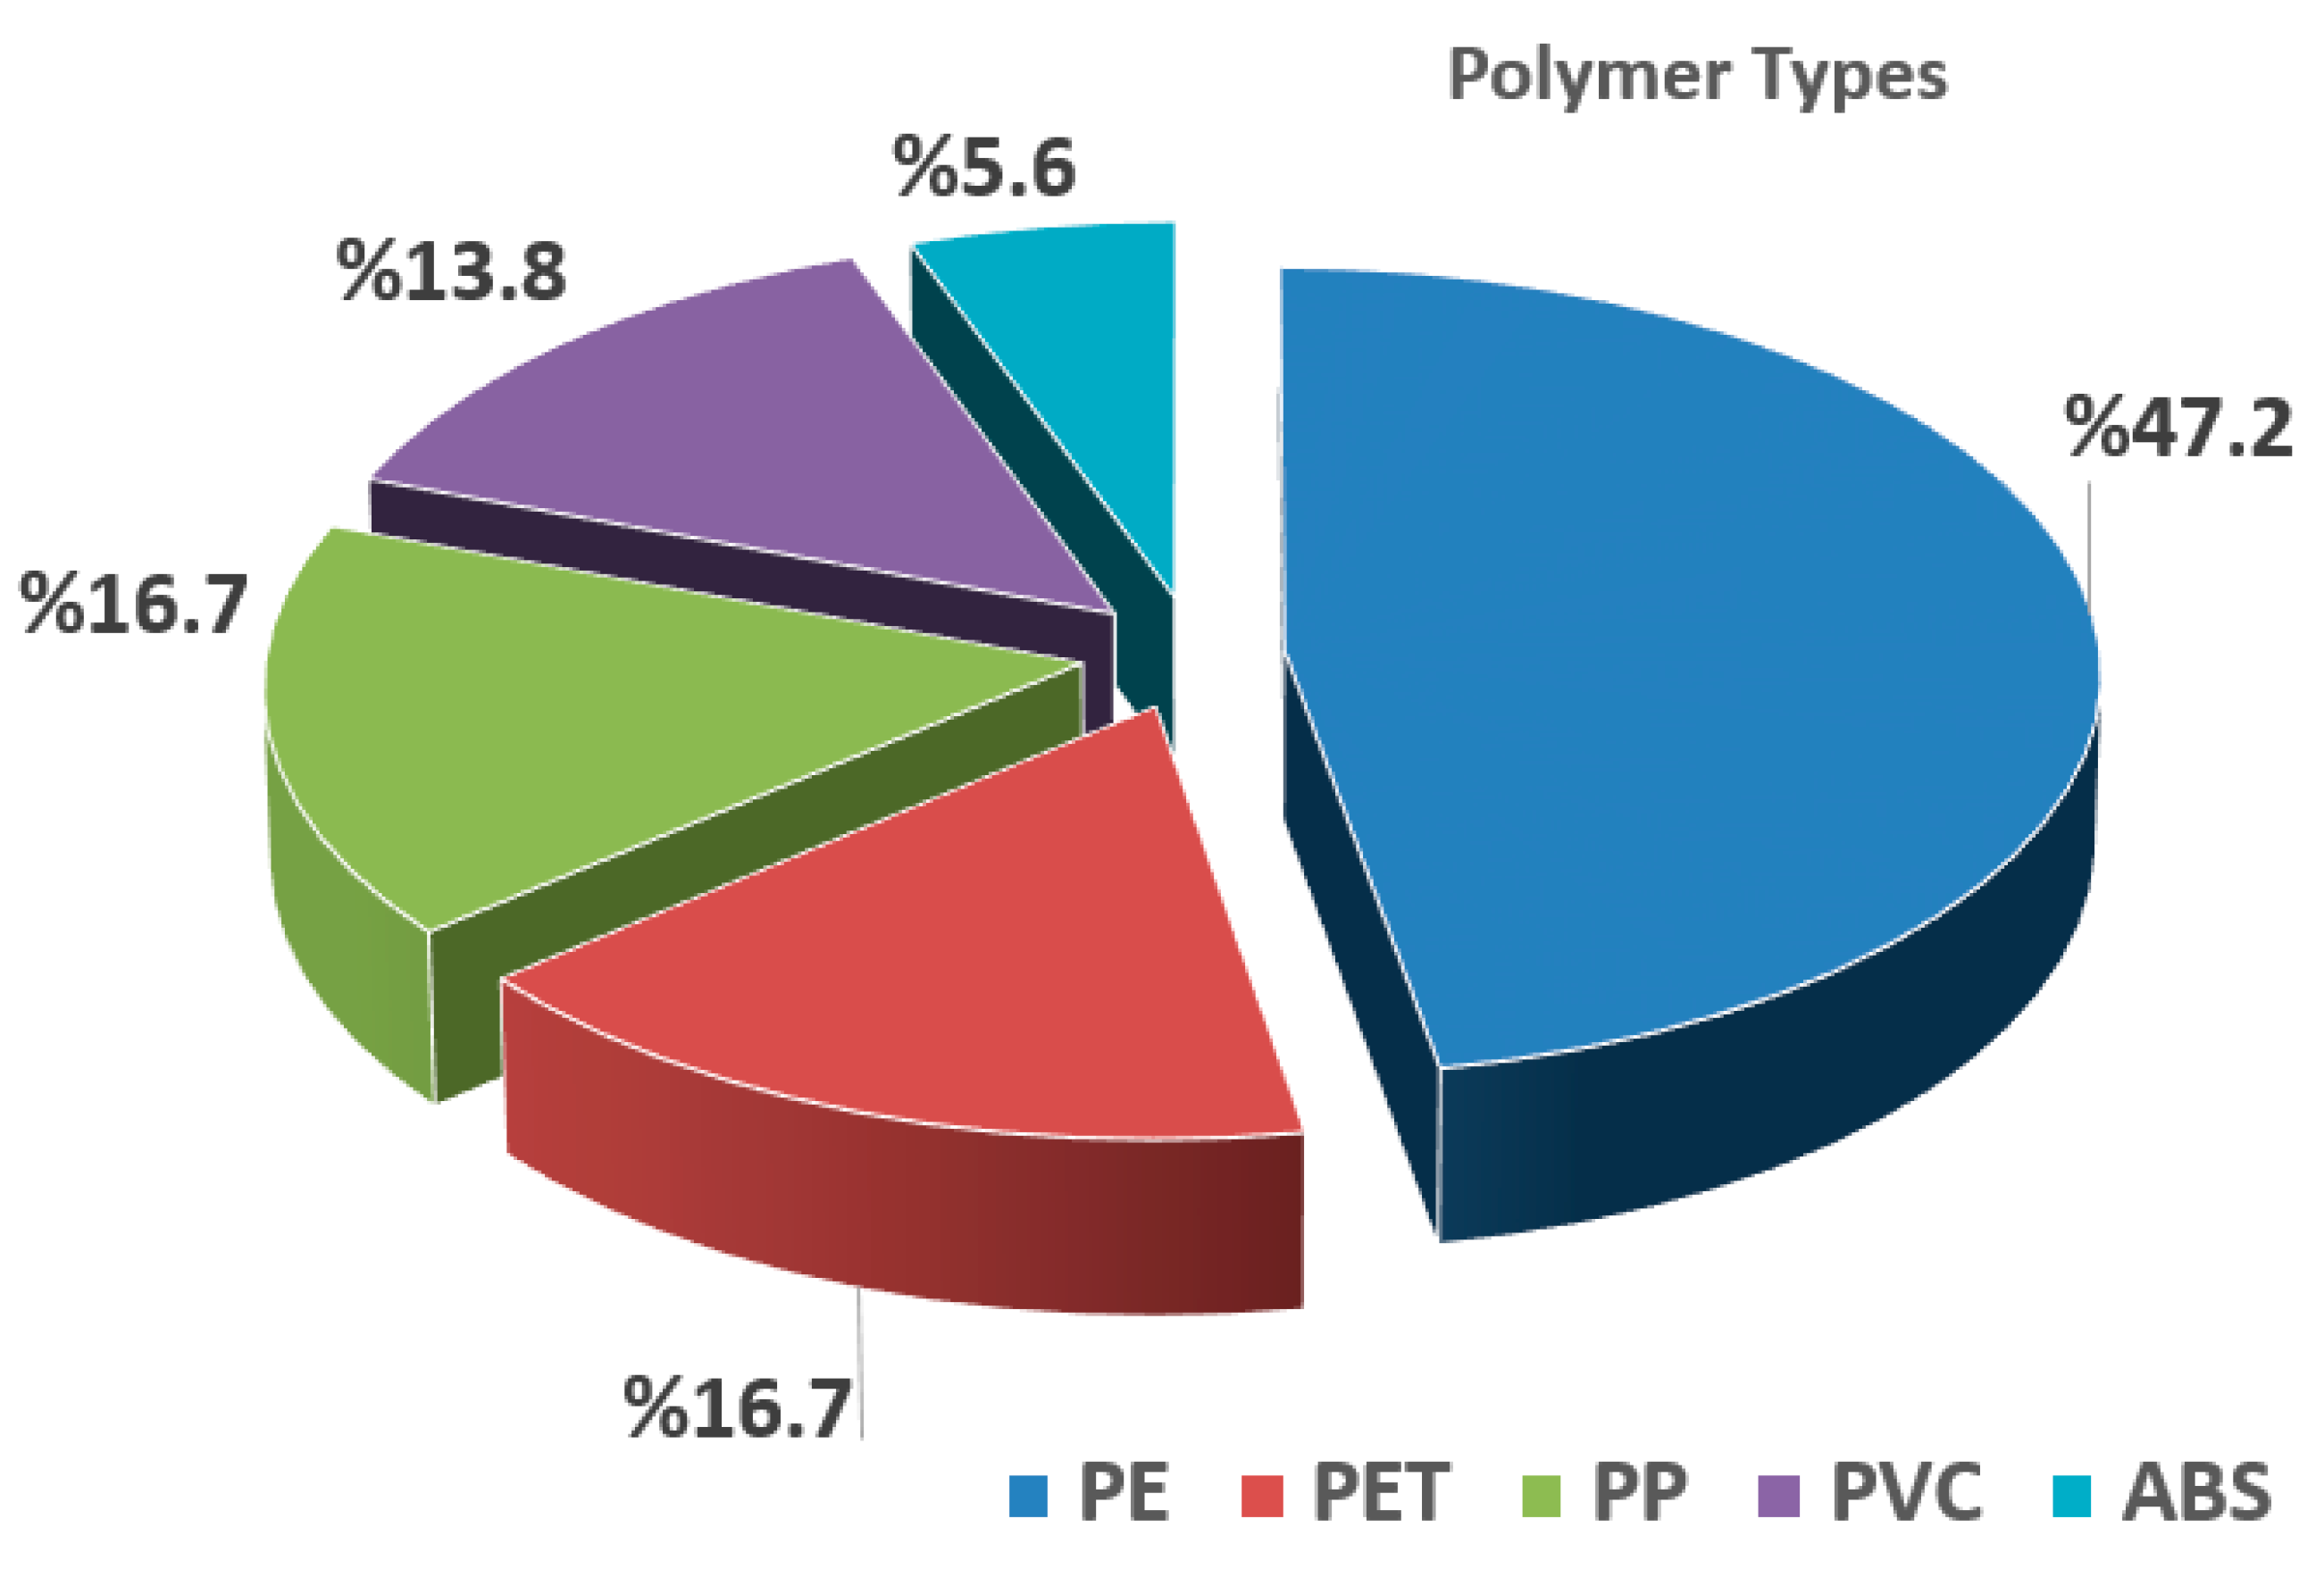
3.2. Physical and Chemical Profiling of MPs

The predominant size class of MPs was <0.5 mm, as illustrated in Figure 2d. Based on morphological characteristics, MPs were classified into six categories: fibers, films, pellets, filaments, foams, and fragments (Figure 2b).
MPs were found in all sediment samples taken in this study. When MPs were evaluated across stations according to their shape, fibers (35%) and fragments (27%) were found to have the highest proportion (Figure 2b). The other MP shapes following the fiber type are filament (13.4%) and film (12.1%), while the shapes with the lowest percentage are bead (8.6%) and foam (6.36%). The station with the highest fiber MPs among the stations is Florya station with 57%. This was followed by Kemer station with 57%. Foam and bead type MPs were detected in most of the stations, although they had the lowest proportion.
Nine different MP colors were detected across all stations, with blue being the most common color (mean 35.1%). This was followed by black (mean 25.8%) and red (24%). Colors with relatively lower rates are transparent (10.9%), green (6.2%), white (4.9%), yellow (4.6%), and purple (1.9%). Brown was also detected at only one station (Figure 2c).
Forty randomly selected sub-samples of MPs from the sediment samples in the appropriate size range were analyzed using FTIR spectroscopy. The most common polymer type was polyethylene (PE) with 47.2%, followed by polyethylene teraphthalate (PTE—16.7%), polypropylene (PP—16.7%), polyvinyl cloride (PVC—13.8%), and acrylonitrile butadiene citrene (ABS—5.6%).

3.3. Contamination Factor and Pollution Load Index

MP contamination factors (Cf) were calculated to reveal the degree of pollution in coastal area sediments collected from different stations. The lowest Cf value was found at Poyrazköy (St 21) station with 1.66, and the highest value was found at Yenice (St 15) station with 6.46. The highest Cf value is about 4 times higher than the lowest value. PLI values were calculated regionally on the basis of Cf values; the lowest value was found in İstanbul Strait with 1.66, and the highest value was found in the southern shelf with 3.44.

3.4. Pollution Risk Index and Polymer Hazard Index

Pollution risk index and polymer hazard index values were calculated to determine potential ecological risks according to the concentrations and polymer types identified by stations. Across all polymers, HI values ranged between 14 and 1100, and PRI values ranged between 48 and 3784. PE was found to have the highest findings for both calculations.

4. Discussion

Although there are regional studies in Türkiye, especially in the SoM, there is no historical data on the MP pollution of the entire coastal area and the coasts of the Çanakkale Strait. The distribution, abundance, and transport patterns of MPs with various physical properties throughout water bodies show different characteristics [46]. The presence, amount, and distribution of MPs can be altered by anthropogenic [47] as well as environmental [48,49,50] influences. It has even been stated that environmental factors such as currents, wind directions, cyclones, and ambient hydrodynamics have more influence on this situation than anthropogenic factors [51,52,53]. The transport of MPs in coastal areas can be affected by coastal hydrodynamic conditions (waves, tides, and wind), biological effects, and physical properties (particle size, shape, and density) [51]. Similarly, wind and waves have been reported to be the most important factors in the transport of MPs in the ocean and coastal zone. Zhang et al. [51] reported that although there was a calm marine environment during the sampling periods as indicated by meteorological and hydraulic records, the distribution of MPs may have been affected and altered by poor sea conditions prior to sampling.
In coastal areas under the combined influence of tides and rivers and the interaction between MPs, waves, and wind can cause the MPs to drift into the upper layers of water. On the other hand, the sediment deposition of MPs can be explained by biofouling, which causes an increase in the concentration of MPs [54,55]. In addition, transport from neighboring areas [16], ocean currents, and atmospheric transport [56,57] are thought to be another cause of deposition of MPs.
Rivers are one of the important pollution sources of the SoM. Particularly, Simav River, which is the largest river flowing into the southern shelf, is one of these polluting rivers. Before flowing into Lake Simav, the river receives its first source of pollution from the vicinity of Şaphane Mountains. It also passes through certain settlements and the district of Karacabey and is fed by many other streams with different flow rates, such as Mustafakemalpaşa Stream, Orhaneli Stream, Nilüfer Stream, and Kocaçay, as well as the excess waters of the Uluabat and Kuşgöl lakes, and continues to reach the SoM. Simav River is also known as the Susurluk River. In the Susurluk Basin, where the Balıkesir, Bursa, and Kütahya provinces and districts are located, there are many industrial establishments such as meat–dairy integrated plants and oil, sugar, cement, and marble factories and agricultural areas [58,59]. This river is known to be heavily polluted [60]. Among the stations, Yenice (St 15), where the highest MP per kg was detected, is also located in the Susurluk Basin where the Simav River flows.
In Kumkale (St 9) and Kepez (St 10), the other stations with high values, concentrations were 858 items/kg and 1083 items/kg. These two stations are under the influence of more than one pollution source. Kepez station (St 10) is close to the Kepez, Umurbey, and Çanakkale Streams, while Kumkale station (St 9) is close to the Hamamlık Stream and Küçük Menderes Stream. These stations are also located towards the exit of the Çanakkale Strait. Therefore, the high values suggest that the pollution load carried by various streams/rivers is caused both by the pollution load carried by various streams/rivers and the pollution of the SoM in addition to the pollution originating from the Black Sea coming through the upper current system along the straits.
It has been reported by Andrady [17] that up to 80% of the total amount of litter in the marine environment consists of plastic litter originating from land. Moreover, these particles, which are < 5 mm in size, are called MPs and are 93% of the plastic litter in the sea [61]. MPs have emerged as a growing environmental concern due to their capacity to disrupt ecological balance and adversely affect human well-being [62,63], and there is a constant flow of information and updates on their occurrence and contamination of the marine environment [64,65,66]. The Ellen MacArthur Foundation predicts that MPs will outnumber fish in the seas and oceans by 2050, unless necessary and important roadmaps on waste management are set [67,68].
The shapes of MPs are categorized as fiber, fragment, film, filament, foam, granule, round, oval, rod, angular, long, and irregular [69]. The distribution of MP shapes detected in this study is given in Figure 2b. The most common type of MP detected in littoral sediment samples is fiber. Of the total 1162 MP particles detected in the study area, 34.9% were fibers, 26.8% were fragments, 13.4% were filaments, 12.1% were films, 8.6% were beads, and 6.4% were foam plastics (Şekil 2b). Fibers are the most common shapes found in studies conducted both along the coasts of Istanbul and the SoM, as well as in other regions and seas [29,30,31,34,36,70,71]. Fiber-shaped MPs are primarily derived from synthetic fabrics, garments, and plastic waste transported through domestic wastewater systems, as well as from fishing-related materials such as nets and lines commonly used in coastal regions [72,73,74].
Florya (St 2) (57.5%), Yenice (St 15) (47.3%), Erdek (St 13) (47.1%), and Kumkale (46.5%) had the highest fiber content. Florya station is located within the borders of Istanbul province, which has a high number of inhabitants as a residential area, as well as human-induced activities such as shopping malls, beach activities, etc. In addition, the availability of easy access to this area increases the circulation of people here during the day. Moreover, off the coast of Florya, there are various large and small ships waiting in line to pass through the Istanbul Strait. The combination of all these anthropogenic activities explains the high pollution in the environment. In Erdek station (St 13), anthropogenic sources and low water circulation due to being a gulf can increase pollution. As mentioned above, the Susurluk River flows near Yenice station. Kumkale station is also located at the exit of Çanakkale Strait and is fed by several small rivers and streams. The other two stations with high fiber content (St 9 and St 15) have in common that they are located close to rivers. The elevated presence of fibrous MPs in the area is likely linked to fluvial discharges from nearby rivers, which act as significant transport pathways for land-based synthetic debris into the marine environment [75,76,77]. Rivers entering the marine system are also considered critical sources of MP contamination, as previously reported [78,79], and plastic waste produced on land is discharged into the sea by rivers and contributes to MP pollution in the marine environment [80]. According to a study in Gemlik Bay, sediments near the outflow of Karsak Creek exhibited high levels of MPs, with fibers constituting a significant proportion of the detected particles [35]. The fact that two of the four stations mentioned in this study have high fiber-type MPs indicates that fiber-type MPs are predominant in rivers and are directly contaminating the sea and that the seas are also significantly exposed to MPs through rivers.
These MP fragments originate primarily from the fragmentation of larger plastic items—such as containers, packaging materials, and household goods—manufactured using high-strength synthetic polymers [81,82]. Fragments can originate from textiles, rubber particles from building materials, and plastic containers transported to the coastal zone via rainwater outlets and river runoff [69,82]. Macro-sized debris break down and form fragment-type plastics under the influence of environmental factors such as the mobility of the marine environment, the presence of oxidative substances, radiation, and hydrophilic water properties [17,83]. Within the scope of our study, fragment is the most dominant species (26.2%) after fiber-type MPs across the stations. Fragments were found to be the most common MP type in the Pendik-Tuzla coasts of SoM [27]. Belivermiş et al. [33] recorded fragments as the most dominant species in sediment core samples in the SoM Golden Horn. In addition, similar studies conducted in different coasts of the Black Sea have also reported that fragment type MPs are more common [84,85].
Sources of filamentous MPs include a range of plastic materials used in consumer packaging, such as plastic bags and wrapping films [73]. This type of MP was found to be the third highest in this study with 13.4%. In addition, pellets within the scope of this study have a rate of 8.8%. One study revealed that MPs in the form of granules on the coastline are mostly caused by tire dust from vehicles passing on nearby roads [86]. The low rates detected in this study and the fact that this MP type was not detected in every station were attributed to the fact that there was not much transportation activity near the sampling stations. MPs in the form of foam are likely to originate from different packaging materials and fishing-related activities [75], as well as from the breakdown of disposable products. It should also be taken into account that, similar to the size of MPs, their morphology may undergo alterations over time as a result of continuous weathering processes in the environment [69].
Film-type MPs are low-density sheet-shaped plastic parts with a very thin layer in flat form [87]. The predominance of transparent MPs can be attributed to their origin from commonly used plastic bags and food packaging, which are typically colorless materials [88]. The percentage of film-type MPs detected in this study was found to be the fourth most dominant shape with 12.1% after fiber, fragment, and filament. This can be explained by the principle of formation of secondary MPs.
Possible sources of different forms of MPs found in littoral sediments are treated and/or untreated wastewater discharged from large and small rivers and streams flowing into this sea, synthetic cables, ropes, and textile wastewater used in fishing and industrial activities, and airborne fibers [89]. Akarsu et al. [31] pointed out that the differences in the findings were due to the differences in sampling sites. In addition, the physical and chemical properties of MPs and marine dynamics also have an impact on this situation. With the increase in disposable products and packaging, especially during the pandemic period, it would be appropriate to predict that the film type will be one of the types that will be seen more frequently and predominantly among the MPs that will be detected in the near future.
The correlations between the total MP values and shaped MPs such as fibers, filaments, fragments, and films identified in this study were also evaluated. When the correlation between MPs and shapes was examined, a strong positive and statistically significant correlation was found between MPs and film (r = 0.753, p = 0.000); a moderate positive significant correlation with fiber (r = 0.671, p = 0.001); a very strong positive significant correlation with filament (r = 0.802, p = 0.000); a moderate positive significant correlation with fragment (r = 0.524, p = 0.015); and a strong positive significant correlation with foam (r = 0.703, p = 0.001). Yıbar et al. [90] conducted a similar statistical evaluation in their studies. Researchers found a high positive correlation between fragment and line MP values (r = 0.868; p = 0.001) and also found that that total MP values were influenced by both fragment and line MP values and that there was a very high positive correlation between fragment MP values (r = 0.976; p < 0.001) and line MP values (r = 0.888; p = 0.001).
In studies related to MPs, different and various colors such as black, red, blue, white, green, brown, yellow, transparent, and multicolored are generally defined [91]. The high levels of white MP detected in environmental settings are thought to be due to degradation processes, while colored MP have been reported to originate from packaging in various industries [92,93]. Plastic products, which are widely used in various industries, are discarded after use and eventually break down into plastic debris [94,95]. This study also examined the correlations between total MP concentrations and colors. The correlation between MPs and colors indicated a very strong positive significant correlation with blue (r = 0.825, p = 0.000); a weak positive significant correlation with red (r = 0.487, p = 0.029); and a moderate positive significant correlation with black (r = 0.610, p = 0.003). Detailed tables and graphs related to correlations are provided in the Supplementary Tables S1 and S2 and Figure S1.
MPs were found in nine different colors in this study: blue, red, black, transparent, white, purple, yellow, yellow, green, and brown. Among all MP colors identified, blue, black, and red were the most dominant colors with 35%, 25%, and 23%, respectively (Figure 2c). The findings involving the different colors detected are in agreement with [28,29,96,97], which report the most predominant MP entities as being blue. Moreover, various studies point to differences in the order of frequently observed colors. For example, Hosseini et al. [98] noted black, transparent, and blue; Rasta et al. [99] reported red, black, and blue; Baysal et al. [27] revealed black; and Mutlu et al. [36] stated blue and black as the most common colors. Li et al. [100] observed that MP particles come in many colors, including white, transparent, yellow, blue, red, and green. Most studies report that white-transparent, black, and/or blue colors are predominant [101,102,103]. Peng et al. [14] reported that the highest proportion of transparent MPs (42%) was found in sediments of the Changjiang Estuary in China. Similar to these studies, MPs of different colors such as red, black, blue, and transparent were identified in this study. When all stations were evaluated, the most dominant colors were blue (35.1%), black (25.8%), and red (24%). This situation can be explained by secondary MPs formed by the degradation of short-lifespan plastic products such as single-use items, carrier bags, flexible packaging, and PET bottles, especially their caps, originating from activities along the SoM coastline. It is considered that white and/or colorless MPs may originate from the degradation of single-use products, which increased during the pandemic.
The coloration of MPs plays a crucial role in determining ingestion rates among organisms at different levels of the food web [104]. The colors of MPs can cause them to be noticed by fish and other marine organisms and mistaken for food [105,106]. Some commercially important fish species and their larvae, as visually driven predators, may misidentify MPs—especially those in white, brown, and yellow hues—as zooplankton prey [93]. Research carried out in the mangrove ecosystems of the Persian Gulf indicated that MPs represented the predominant particle type detected in edible fish (60%), with white MPs being the least common (7%) [93]. Another study identified the majority of plastics found in Gorgon Bay as white and blue. These colors, notably similar to plankton, may contribute to misidentification by local planktonivorous species, including mussels and shrimps [107]. Overall, it can be concluded that organisms are more likely to ingest MPs due to the dark hues of these particles or their resemblance to the organisms’ natural food items [93]. In studies, it has been found that fish accidentally feed on MPs with yellow, brown, and white resembling their planktonic preferred food [108,109,110], similarly, seabirds have been found to accidentally ingest plastics of some shapes and colors [64,110].
In this study, the presence of predominantly blue-, black-, and red-colored MPs in coastal area sediments raises awareness of their possible effects on biota and organisms that use these areas as habitats. As a result, MP ingestion by marine organisms can cause harmful effects and biological damage. The persistent accumulation of MPs in the SoM’s sediments may significantly endanger ecological stability, compromising both ecosystem function and the viability of local marine life. Ensuring the protection of the fragile marine ecosystem in the SoM necessitates both the advancement of scientific research and the implementation of robust strategies to curb MP pollution. There is also a need for longer-term monitoring studies, especially in coastal areas, and more comprehensive studies to understand the exposure of organisms to MPs in these areas.
Besides color and shape, the size of MPs is one of the defining parameters defined by the European MSFD Marine Litter technical subgroup [111]. These size distributions and diversity may provide clues to help understand the potential sources of MPs [112] but also provide important indicators of ecosystem health [113]. The categorization of MPs according to their size is important as it has a determining effect on their transport, bioavailability, and distribution in the marine environment. Sediment-derived MPs were mainly below 0.5 mm in size, despite the classification including both < 0.5 mm and 1–5 mm fractions, suggesting a significant predominance of fine MPs in the sampled region. The fact that most of the MPs were less than 0.5 mm in size is consistent with the predominant size ratio reported in the study by Hosseini et al. [98], but different from the findings of MPs larger than 1 mm in the studies by Erkan et al. [28,29]. The dominant size ranges in MP studies are reported as 0.1–0.5 mm [114,115], 1–2 mm [36,99], 1–5 mm [29], and 4–5 mm [116]. The difference here may be related to the rates of impact from deep-sea discharges and the hydrodynamic structure of the SoM and may be explained by the fact that low-density plastics can be easily displaced by currents and waves.
The plastic particles extracted from the sediment samples were taken in appropriate sizes and chemically characterized. Accordingly, PE type plastics constitute the majority of particles across all stations. Other dominant species were PET (16.7%), PP (16.7%), PVC (13.8%), and ABS (5.6%) (Figure 3). The fact that plastics such as PE has the highest abundance along the SoM coast and PP comes in second place suggest that it may be caused by single-use plastics and packaging. In addition, these polymers are used at a high rate of 70% of plastic production worldwide, and most of these are disposable products [117]. PET type plastics are widely used in industries such as soft drink and drinking water bottles and food packaging [118]. PETs used in industries include bottles that are sensitive to UV rays and perishable [119]. This leads to the presence of mostly PET in secondary MPs. PET also tends to accumulate in sediments due to its higher density compared to other polymer types. This leads to the possibility of ingestion by sediment-dependent feeding organisms. Similarly, PP has low resistance to UV radiation and can degrade quickly [94,120]. ABS, which has the lowest ratio, is a high-strength polymer and is used in industries such as construction, automotive, and household appliances. The presence of different types of polymers at Yenice station (St 15), which has the highest amount of MP, is also associated with the Susurluk River, which flows into the sea very close to this region. Representative FTIR spectrum of the two stations are shown in Figure 4. Spectra of other polymers are shown in Figure S2 in the Supplementary.
Characterization differences and comparisons of MP studies conducted in coastal area sediments of different regions around the world are given in Table 1. Since there is no internationally established standard method for the extraction of MPs, the high-density solutions used in the studies may vary, and laboratory facilities may not be similar [121]. Previous studies have indicated that results can differ by two- to threefold between research groups, even when analyzing sediment samples from identical locations [122]. Therefore, making comparisons between different studies may not give an accurate evaluation result, but it is useful in terms of providing preliminary information. However, such differences are also highly likely for pollutant groups such as MPs, which have different concentrations and can move quickly in the marine environment.
Flotation methods based on density difference are some of the most widely used techniques to extract MPs from environmental media. These methods consist of extracting MPs using highly concentrated solutions such as sodium chloride (NaCl), sodium iodide (NaI), sodium bromide (NaBr), and zinc chloride (ZnCl2) [123,124,125]. Although the toxicity and price of low-density solutions are lower, high-density solutions such as ZnCl2 are needed to isolate relatively dense polymers such as polyethylene terephthalate (PET, 1.37–1.45 g/cm3) and polyvinyl chloride (PVC, 1.16–1.58 g/cm3) [126,127,128].
In addition, the application of high temperatures for the drying of the samples prior to the extraction of MPs may cause deformation, melting, and disintegration of MPs, leading to different and/or overestimated results. Most studies have reported that sediment samples were dried at temperatures up to 90 °C prior to the extraction of MPs [128,129,130,131]. Some plastic polymers may not undergo any degradation or physical changes due to their high melting point (>115 °C) [132,133,134], but researchers usually treat MPs at a maximum of 60 °C to maintain their physical properties [134,135]. In this study, a lyophilizer (freeze-dry) was used for drying the sediment samples and the highest temperature value of 40 °C was maintained throughout the procedure of drying the filter paper after filtration following extraction.
Table 1. Comparison on MPs in coastal sediments of Türkiye and other regions in the world.
Regions/
Locations
Amount of MPs (items/kg)Solution DensityDominant ColorDominant
Polymer
Dominant ShapeReference
Guangdong Coastal Areas, South China433.3–4166.3 ZnCl2 (1.5 g/cm3)TransparentRayonFiber[7]
Pendik-Tuzla (SoM), Türkiye0.3–85.6ZnCl2 (1.4 g/cm3)BlackABSFragment[27]
Istanbul Strait (SoM), Türkiye1957–4079.96NaCl (1.20 g/cm3)Blue, white-Filament, fragment[28]
Istanbul Strait (SoM), Türkiye9500 ± 20,300NaCl (1.2 g/cm3)Blue, White/transparentPE, PPFiber, fragment[29]
Istanbul Strait (SoM), Türkiye144.4–177.6NaCl (1.20 g/cm3)Black, transparentPPSFiber[30]
Southern Coast of Istanbul (SoM), Türkiye1364 ± 600NaCl (6.14 M)TransparentPE, PETFiber[31]
Golden Horn (SoM), Türkiye140NaCl (140 g/L)Yellow, transparent-Film, fiber[32]
Golden Horn (SoM), Türkiye700–4100NaCl (35 g/100 mL)--Fragment, fiber[33]
Gemlik Bay (SoM), Türkiye3333–9733NaCl (1.2 g/cm3)Blue, blackPVC, PPFiber[35]
Gulf of Bandırma (SoM), Türkiye195–226ZnCl2 (1.65 g/cm3)Blue, blackPETFiber [36]
Persian Gulf, Iran1346 ± 601NaI (1.6 g/cm3)BlackPE, PPFiber [70]
Black Sea 106.7NaCl (1.2 g/cm3)Black, blue, PE, PPFragment[84]
Southeast Black Sea, Türkiye108ZnCl2 (1.65 g/cm3)-PEFragment, fiber[85]
Jiaochou Bay (China)25ZnCl2 (1.5 g/cm3)Black, bluePET, PP, PEFiber[96]
South Baltic Sea (Poland) 0–27NaCl (1.2 g/cm3)TransparentPVA Fiber[101]
Tunisian Coast (Mediterranean Sea)141–461NaCl (140 g/L)BlackPE, PP, PSFiber, fragment[102]
Venice Lagoon, Italy672–2175NaCl (120 g/L)Blue, redPE, PPFragment[135]
Southern Black Sea, Türkiye64.06 ± 895ZnCl2 (1.65 g/cm3)-SAC, PET, PEFiber, fragment[136]
Cape town South Africa 38 ± 2NaCl (360 g/L)White, blue/greenNylonFilament[137]
Coasts of SoM, Türkiye199–1286ZnCl2 (1.7 g/cm3)Blue, blackPE, PETFiber, fragmentPresent Study
PPS: polyphenylene sulphide, PVA: polyester, poly(vinyl acetate), “-”: not reported.
When the amount of MPs detected in this study was compared with other studies, it was found to be higher than the findings of the study conducted in the Golden Horn [32] and some studies conducted in the SoM [27] and Istanbul Strait [30] and lower than the results of some other studies [28,29] from Istanbul Strait. Compared to studies worldwide, the findings of this study are close to those of the Venetian lagoon but considerably higher than those of other marine studies. On the other hand, considering that the findings of this study are from data from 2024, it is inevitable that there will be differences as the effects of increased waste during the pandemic period are thought to be ongoing.
Coastal areas have been facing significant pollution from dense settlement, urbanization, and industrialization, leading to widespread littoral zone pollution [138]. In addition to anthropogenic pressures, a range of environmental factors—including substrate composition and mobility, coastal geomorphological features, fluvial proximity, hydrodynamic regimes (e.g., water currents), as well as prevailing wave and wind conditions—play a critical role in shaping the spatial distribution of MPs and driving variability in their potential sources [139]. This may explain the station and regional differences in this study.
Differences in MP intervals between these findings and other studies may be due to various factors such as temporal and spatial variations in MP distribution and heterogeneity in the presence of MPs in the marine environment. The existence and persistence of these factors may influence differences in the amount of MP in future studies. Therefore, it is necessary to develop a more comprehensive and detailed strategy to monitor MP presence and abundance, especially in the SoM, which has a different hydrodynamic structure.
Cf values were calculated according to the stations. Accordingly, CF values varied between 1.66 and 6.46. The lowest CF was found at Poyrazköy station (St 21), and the highest value was found at Yenice station (St 15) (Table 2). When CF values were evaluated as averages by region, they were calculated as 2.20 (Moderate), 2.23 (Moderate), 3.50 (High), 3.90 (High), 2.40 (Moderate), and 2.62 (Moderate) for IS, NS, ÇS, SS, GB, and GI, respectively. In addition, the CF value calculated for Yenice station (St 15) located on the South Shelf was found to be in the “very high” class with 6.46.
PLI is a parameter used to reveal the level of MP pollution [140]. In this study, PLI values were calculated regionally to understand the pollution in the regions where the stations are located because each region has different pollution sources. PLI values across all regions are all higher than 1 (Low I). The IS, NS, GB, and GI regions are in the 1–3 range, indicating a moderate (II) degree of MP pollution. However, since the PLI findings in the ÇS and SS regions were above 3, these regions were found to have a high (III) pollution level. The concentration and distribution of MPs in the marine environment are shaped by regional anthropogenic activities, including population density, industrial operations, economic development practices, and marine-based activities such as fisheries and maritime transportation [140,141]. In addition, this can be explained by the fact that in both ÇS and SS regions there are many large and small rivers flowing into the region. Although pollution loads and MP values at stations in areas such as ÇS and SS were found to be high, no statistically significant differences were found between regions (p > 0.05).
Considering the HI values, the general risk classification of MP pollution in the coasts of the SoM varied between moderate (II) and very high (IV) according to the station and polymer types (Table 2). Accordingly, HI values of MPs in marine sediments show a significant regional trend of MP contamination. For instance, the coastal areas of stations on the southern shelf and in the gulfs have HI values >1000 (very high-IV) due to the presence of MPs of PE species with high hazard scores. Although the HI values of the other polymer types detected have relatively lower scores, it should not be ignored that the hazard class is medium (II) level and other regions are also in the pollution potential. Even if concentrations are low in terms of MP, chemical toxicity should also be considered.
The potential ecological risk index (PRI) values of the coastal area sediments of the Marmara Sea were found to be well above 1200 for PE polymer along the coasts of ÇS, SS, GB, and GI (except for St 2) and were recorded in the Hazardous (V) class. For PET polymer in all regions, the PRI values are in the range of 300–600 and are considered as high (III). In this study, the combination of CF, PLI, HI, and PRI indices allowed a preliminary ecological risk assessment of MP pollution in marine sediments along the coasts of the SoM.
While the PLI and HI indices are useful in classifying the abundance of PMs in the environment and their potential associated risks, it should be noted that there are limitations. Within these limitations, the lack of information on the hazard coefficient of some polymer types identified in the context of this research suggests that the calculated PHI values may be underestimated [142]. Furthermore, while the HI takes into account the hazard of different polymers based on monomer compositions, in most cases it does not take into account the risk associated with various additives in the original and absorbed state. Indeed, studies have emphasized that the toxicity of MPs may be due to the mixture of chemicals attached to these particles rather than the particles themselves [143,144]. On the other hand, although size and shape are important in environmental bio reactivity and ecotoxicological effects [145,146,147], this information is not included in the PHI indices.
A large proportion of MP found in marine environments are formed as a result of the physical, chemical, and biological degradation processes of commonly used synthetic polymers under environmental conditions. Among these polymers, the most common are thermoplastics such as PE, PET, PP, PVC, polystyrene (PS), and nylon (polyamide) [1,17]. Low-density polymers such as PE and PP are commonly found in disposable packaging, bags, and fishing materials, while PET and nylon are mainly sourced from textile products and fishing nets [81,139]. Additionally, microfibers that break off from textile products during laundry washing processes pass through wastewater treatment plants and reach the marine environment, constituting a significant source of secondary MP pollution. On the other hand, primary MPs are particles that are produced directly in small sizes and used in cosmetics, cleaning products, or as industrial raw materials (e.g., plastic pellets) [1]. In this regard, MPs have a wide range of marine sources and are linked to many factors, from plastic production to consumer habits, waste management, and industrial activities.
Recently, it has been discovered that the adverse impacts of plastics on the ecosystem and human health due to criteria such as their global distribution in oceans and seas and their abundance, polymer structures, and physiological properties have made MPs a substantial threat to environmental integrity. Due to their long lifetime in the marine environment, even if their production is stopped now and disposal processes are completed, the negative effects of the presence of current contaminations will continue for years [148].

5. Conclusions

In this study, the presence and abundance of MPs in surface sediments taken from the littoral zone along the entire coast of the SoM, including the Çanakkale Strait, were revealed and the findings were compared with studies conducted in different and nearby regions. An ecological risk assessment was also carried out to interpret regional pollution levels. Accordingly, it was determined that the southern shoreline of the SoM and the Çanakkale Strait were severely polluted. In areas where MPs are concentrated, there are not only anthropogenic sources but also rivers flowing into the sea. This is evidence that MPs in the marine environment also arrive via rivers.
The fact that there is not yet a standard for the analysis methods of MPs in various research materials causes the findings to differ from the results of similar studies. This situation once again highlights the need for an internationally accepted standard methodology for MPs. In addition, more research on MPs in sediments is needed to reveal the long-term behavior and processes of MPs in the SoM, which is under intense pollution pressure due to the influence of many pollutant sources and has a very different hydrodynamic structure, and to consistently monitor their potential effects.
The frequent use of composting and regular disposal methods as waste management practices inevitably leads to the contamination of soil and other environmental media by MP. Therefore, it is important to take sustainable and long-term measures. These measures include restricting the use of disposable products and collecting plastic waste from the environment before it breaks down into MP and subjecting it to recycling. For this, it is essential to raise awareness at the societal and even global level and translate this into action, emphasizing that MP pollution can be reduced in the long term.

Supplementary Materials

The following supporting information can be downloaded at: https://www.mdpi.com/article/10.3390/jmse13061159/s1, Figure S1: Correlation graphs for MPs and shapes; (a) MPs-film, (b) MPs-fiber, (c) MPs-bead, (d) MPs-filament, (e) MPS-fragment, and (f) MPs-foam; Figure S2: FTIR spectrums of detected polymers. Table S1: Spearman correlation coefficient for MPs and shapes; Table S2: Spearman correlation coefficient for MPs and colors.

Funding

This research received no external funding.

Data Availability Statement

The original contributions presented in this study are included in the article/Supplementary Material. Further inquiries can be directed to the corresponding author.

Acknowledgments

The author is grateful to Nuray ÇAĞLAR (Istanbul University, Istanbul, Turkey) for her scientific contributions and suggestions; Hande ÇAVUŞ ARSLAN (Haliç University, Istanbul, Turkey) for statistically evaluating the data and making it meaningful; Fatih İLHAN (Yıldız Technical University, Istanbul, Turkey) and Gökhan BALCIOĞLU (Gelişim University, Istanbul, Turkey) for their patience and hard work during the field sampling.

Conflicts of Interest

The authors declare no conflicts of interest.

Abbreviations

The following abbreviations are used in this manuscript:
MPMicroplastic
SoMSea of Marmara
ISIstanbul Strait
ÇSÇanakkale Strait
SSSouth Shelf
NSNorth Shelf
GBGemlik Bay
GIGulf of Izmit
TSSTurkish Straits System
StStation
CfContamination Factor
PLIPollution Load Index
HIHazard Index
PRIPollution Risk Index

References

  1. GESAMP. Sources, Fate and Effects of Microplastics in the Marine Environment (Part 2); IMO: London, UK, 2016; 221p. [Google Scholar]
  2. Dharmadasa, S.W.S.; Andrady, A.L.; Kumara, P.T.P.; Maes, T.; Gangabadage, C.S. Microplastics pollution in Marine Protected Areas of Southern Sri Lanka. Mar. Pollut. Bull. 2021, 168, 112462. [Google Scholar] [CrossRef] [PubMed]
  3. Bozdaş, K.; Üstün, G.E.; Aygün, A. Micro Plastics and Removal Methods in Wastewater Treatment Plants. Uludağ Univ. J. Fac. Eng. 2020, 25, 1577–1592. (In Turkish) [Google Scholar] [CrossRef]
  4. Marcus, I.M.; Barriquand, T.B.; Thompson, R.M.; Hosselkus, B.C.; Hutson, C.T.; Jacobs, M.; McNeil, C.; Newton, L.; Olivarez, S.M.; Abell, J. Spatial and Temporal Variations of Microplastics within Humboldt Bay, California. CSU J. Sustain. Clim. Change 2023, 3, 3. [Google Scholar] [CrossRef]
  5. GESAMP. Guidelines for the Monitoring & Assessment of Plastic Litter in the Ocean; United Nations Environment Programme: Nairobi, Kenya; IMO: London, UK, 2019. [Google Scholar]
  6. Uddin, S.; Fowler, S.W.; Uddin, M.F.; Behbehani, M.; Naji, A. A review of microplastic distribution in sediment profiles. Mar. Pollut. Bull. 2021, 163, 111973. [Google Scholar] [CrossRef]
  7. Li, Y.; Zhang, Y.; Chen, G.; Xu, K.; Gong, H.; Huang, K.; Yan, M.; Wang, J. Microplastics in Surface Waters and Sediments from Guangdong Coastal Areas, South China. Sustainability 2021, 13, 2691. [Google Scholar] [CrossRef]
  8. Marques Mendes, A.; Golden, N.; Bermejo, R.; Morrison, L. Distribution and abundance of microplastics in coastal sediments depends on grain size and distance from sources. Mar. Pollut. Bull. 2021, 172, 112802. [Google Scholar] [CrossRef]
  9. Chen, X.; Zhao, P.; Wang, D.; Wang, L.; Zhao, H.; Wang, X.; Zeng, Z.; Li, P.; Wang, T.; Liu, W.; et al. Microplastics in Marine Sediments in Eastern Guangdong in the South China Sea: Factors Influencing the Seasonal and Spatial Variations. Water 2023, 15, 1160. [Google Scholar] [CrossRef]
  10. Godoy, V.; Prata, J.C.; Pérez, A.; da Costa, J.P.; Rocha-Santos, T.; Duarte, A.C. Microplastics in Sediments from a Sandy Beach in Costa Nova (Aveiro, Portugal). Sustainability 2023, 15, 6186. [Google Scholar] [CrossRef]
  11. Weerasekara, P.G.Y.W.; De Silva, D.S.M.; De Silva, R.C.L.; Amarathunga, A.A.D.; Bakir, A.; McGoran, A.R.; Sivyer, D.B.; Reeve, C. Sampling and Analysis of Microplastics in the Coastal Environments of Sri Lanka: Estuaries of the Kelani River to Mahaoya. Water 2024, 16, 1932. [Google Scholar] [CrossRef]
  12. Yonkos, L.T.; Friedel, E.A.; Perez-Reyes, A.C.; Ghosal, S.; Arthur, C.D. Microplastics in four estuarine rivers in the Chesapeake Bay, U.S.A. Environ. Sci. Technol. 2014, 48, 14195–14202. [Google Scholar] [CrossRef]
  13. Zhao, S.; Zhu, L.; Wang, T.; Li, D. Suspended microplastics in the surface water of the Yangtze Estuary System, China: First observations on occurrence, distribution. Mar. Pollut. Bull. 2014, 86, 562–568. [Google Scholar] [CrossRef]
  14. Peng, G.; Zhu, B.; Yang, D.; Su, L.; Shi, H.; Li, D. Microplastics in sediments of the Changjiang Estuary, China. Environ. Pollut. 2017, 225, 283–290. [Google Scholar] [CrossRef] [PubMed]
  15. Hidalgo-Ruz, V.; Gutow, L.; Thompson, R.C.; Thiel, M. Microplastics in the marine environment: A review of the methods used for identification and quantification. Environ. Sci. Technol. 2012, 46, 3060–3075. [Google Scholar] [CrossRef] [PubMed]
  16. Lusher, A. Microplastics in the Marine Environment: Distribution, Interactions and Effects. In Marine Anthropogenic Litter; Springer: Cham, Switzerland, 2015; pp. 245–307. [Google Scholar] [CrossRef]
  17. Andrady, A.L. Microplastics in the marine environment. Mar. Pollut. Bull. 2011, 62, 1596–1605. [Google Scholar] [CrossRef]
  18. Cózar, A.; Echevarría, F.; González-Gordillo, J.I.; Irigoien, X.; Ubeda, B.; Hernández-León, S.; Palma, A.T.; Navarro, S.; García-de-Lomas, J.; Ruiz, A.; et al. Plastic debris in the open ocean. Proc. Natl. Acad. Sci. USA 2014, 111, 10239–10244. [Google Scholar] [CrossRef]
  19. Rhodes, C.J. Solving the plastic problem: From cradle to grave, to reincarnation. Sci. Prog. 2019, 102, 218–248. [Google Scholar] [CrossRef]
  20. Tanhua, T.; Gutekunst, S.B.; Biastoch, A. A near-synoptic survey of ocean microplastic concentration along an around-the-world sailing race. PLoS ONE 2020, 15, e0243203. [Google Scholar] [CrossRef] [PubMed]
  21. Lear, G.; Kingsbury, J.M.; Franchini, S.; Gambarini, V.; Maday, S.D.M.; Wallbank, J.A.; Weaver, L.; Pantos, O. Plastics and the microbiome: Impacts and solutions. Environ. Microbiome 2021, 16, 2. [Google Scholar] [CrossRef]
  22. Rodríguez, C.; Fossatti, M.; Carrizo, D.; Sánchez-García, L.; Teixeira De Mello, F.; Weinstein, F.; Lozoya, J.P. Mesoplastics and large microplastics along a use gradient on the Uruguay Atlantic coast: Types, sources, fates, and chemical loads. Sci. Total Environ. 2020, 721, 137734. [Google Scholar] [CrossRef]
  23. Thushari, G.G.N.; Senevirathna, J.D.M. Plastic pollution in the marine environment. Heliyon 2020, 6, e04709. [Google Scholar] [CrossRef]
  24. Sözen, S.; Orhon, D.; Kirca, V.S.O.; Sumer, B.M. Impact of mixing on water quality in the Bosphorus—Implications on sustainable management of wastewater marine discharges. Mar. Pollut. Bull. 2023, 189, 114799. [Google Scholar] [CrossRef] [PubMed]
  25. Yümün, Z.Ü.; Ekici, G. Investigation of Pollution Loads of Marmara Sea Discharge Points Between Suleymanpaşa (Tekirdag) and Kuçukçekmece Lake (Istanbul). Eur. J. Sci. Technol. 2023, 52, 294–301. [Google Scholar] [CrossRef]
  26. Öztürk, I.; Seker, M. Ecology of the Marmara Sea: Formation and Interactions of Marine Mucilage, and Recommendations for Solutions; Turkish Academy of Sciences: Ankara, Türkiye, 2021. [Google Scholar] [CrossRef]
  27. Baysal, A.; Saygin, H.; Ustabasi, G.S. Microplastic occurrences in sediments collected from Marmara Sea-Istanbul, Turkey. Bull. Environ. Contam. Toxicol. 2020, 105, 522–529. [Google Scholar] [CrossRef] [PubMed]
  28. Erkan, H.S.; Turan, N.B.; Albay, M.; Engin, G.Ö. Microplastic pollution in seabed sediments at different sites on the shores of Istanbul-Turkey: Preliminary results. J. Clean. Prod. 2021, 328, 129539. [Google Scholar] [CrossRef]
  29. Erkan, H.S.; Takatas, B.; Ozturk, A.; Gündoğdu, S.; Aydın, F.; Koker, L.; Ozdemir, O.K.; Albay, M.; Engin, G.Ö. Spatio-temporal distribution of microplastic pollution in surface sediments along the coastal areas of Istanbul, Turkey. Mar. Pollut. Bull. 2023, 195, 115461. [Google Scholar] [CrossRef] [PubMed]
  30. Olguner, B.; Mülayim, A.; Gündüz, S.K. Microplastic concentration in the sediment of the Istanbul Strait (the Sea of Marmara, Turkey). J. Soils Sediments 2023, 23, 2892–2904. [Google Scholar] [CrossRef]
  31. Akarsu, C.; Sönmez, V.Z.; Sivri, N. Seasonal Distribution, Characterization, Indexing and Risk Assessment of Micro- and Nanoplastics in Coastal Sediments: A Case Study from Istanbul. Int. J. Environ. Res. 2024, 18, 95. [Google Scholar] [CrossRef]
  32. Doğruyol, P.; Şener, M.; Balkaya, N. Determination of microplastics and large plastics in the sediments of the Golden Horn Estuary (Haliç), Istanbul, Turkey. Desalination Water Treat. 2019, 172, 344–350. [Google Scholar] [CrossRef]
  33. Belivermiş, M.; Kılıç, Ö.; Sezer, N.; Sıkdokur, E.; Güngör, N.D.; Altuğ, G. Microplastic inventory in sediment profile: A case study of Golden Horn estuary, Sea of Marmara. Mar. Pollut. Bull. 2021, 173, 113117. [Google Scholar] [CrossRef]
  34. Işlek, Ş.; Bostan, Z.; Güney, E.; Sönmez, V.Z. Occurrence and spatial distribution of microplastics in coastal lagoon sediments: The case from Küçükçekmece Lagoon. Commagene J. Biol. 2023, 7, 1–11. [Google Scholar] [CrossRef]
  35. Yücedağ, E.; Mülayim, A.; Kecel Gündüz, S. Concentration and Characterisation with Spectroscopic Technique of Microplastics in the Surface Sediment and Commercial Fish Species of Gemlik Bay (Marmara Sea). Turk. J. Fish. Aquat. Sci. 2024, 24, TRJFAS25858. [Google Scholar] [CrossRef]
  36. Mutlu, T.; Eryaşar, A.R.; Karaoğlu, K.; Veske, E.; Gedik, K. Microplastics pollution in Gulf of Bandırma, Sea of Marmara: Biota and sediment. Mar. Pollut. Bull. 2025, 213, 117667. [Google Scholar] [CrossRef]
  37. Beşiktepe, Ş.T.; Sur, H.I.; Özsoy, E.; Latif, M.A.; Oǧuz, T.; Ünlüata, Ü. The Circulation and Hydrography of the Marmara Sea. Prog. Oceanogr. 1994, 34, 285–334. [Google Scholar] [CrossRef]
  38. Beşiktepe, Ş.T. Density Currents in the Two-Layer Flow: An Example of Dardanelles Outflow. Oceanol. Acta 2003, 26, 243–253. [Google Scholar] [CrossRef]
  39. Özsoy, E.; Tuğrul, S.; Delfanti, R.; Sannino, G. Dynamics of High Energy Environment: Processes at the Turkish Straits System (DEEP), TUBITAK1001. 2015. Available online: https://open.metu.edu.tr/bitstream/handle/11511/49585/TVRVeU16UTA.pdf (accessed on 6 March 2025).
  40. Enders, K.; Lenz, R.; Ivar do Sul, J.A.; Tagg, A.S.; Labrenz, M. When every particle matters: A QuEChERS approach to extract microplastics from environmental samples. MethodsX 2020, 7, 100784. [Google Scholar] [CrossRef]
  41. Pritzker, P.; Sullivan, K.; Callender, R. Laboratory Methods for the Analysis of Microplastics in the Marine Environment. 2015; pp. 1–39. Available online: https://repository.library.noaa.gov/view/noaa/10296 (accessed on 13 April 2025).
  42. Lares, M.; Ncibi, M.C.; Sillanpää, M. Occurrence, identification and removal of microplastic particles and fibers in conventional activated sludge process and advanced MBR technology. Water Res. 2018, 133, 236–246. [Google Scholar] [CrossRef] [PubMed]
  43. Gwinnett, C.; Miller, R.Z. Are We Contaminating Our Samples? A Preliminary Study to Investigate Procedural Contamination During Field Sampling and Processing for Microplastic and Anthropogenic Microparticles. Mar. Pollut. Bull. 2021, 173, 113095. [Google Scholar] [CrossRef]
  44. Kabir, A.H.M.E.; Sekine, M.; Imai, T.; Yamamoto, K.; Kanno, A.; Higuchi, T. Assessing small-scale freshwater microplastics pollution, land-use, source-to-sink conduits, and pollution risks: Perspectives from Japanese rivers polluted with microplastics. Sci. Total Environ. 2021, 768, 144655. [Google Scholar] [CrossRef]
  45. Lithner, D.; Larsson, A.; Dave, G. Environmental and health hazard ranking and assessment of plastic polymers based on chemical composition. Sci. Total Environ. 2011, 409, 3309–3324. [Google Scholar] [CrossRef]
  46. Jiang, J.; He, L.; Zheng, S.; Liu, J.; Gong, L. A review of microplastic transport in coastal zones. Mar. Environ. Res. 2024, 196, 106397. [Google Scholar] [CrossRef]
  47. Sarafraz, J.; Rajabizadeh, M.; Kamrani, E. The preliminary assessment of abundance and composition of marine beach debris in the northern Persian Gulf, Bandar Abbas City, Iran. J. Mar. Biol. Assoc. UK 2016, 96, 131–135. [Google Scholar] [CrossRef]
  48. Kim, I.S.; Chae, D.H.; Kim, S.K.; Choi, S.; Woo, S.B. Factors influencing the spatial variation of microplastics on high-tidal coastal beaches in Korea. Arch. Environ. Contam. Toxicol. 2015, 69, 299–309. [Google Scholar] [CrossRef] [PubMed]
  49. Veerasingam, S.; Saha, M.; Suneel, V.; Vethamony, P.; Rodrigues, A.C.; Bhattacharyya, S.; Naik, B.G. Characteristics, seasonal distribution and surface degradation features of microplastic pellets along the Goa coast, India. Chemosphere 2016, 159, 496–505. [Google Scholar] [CrossRef]
  50. Imhof, H.K.; Sigl, R.; Brauer, E.; Feyl, S.; Giesemann, P.; Klink, S.; Leupolz, K.; Löder, M.G.; Löschel, L.A.; Missun, J.; et al. Spatial and temporal variation of macro-, meso- and microplastic abundance on a remote coral island of the Maldives, Indian Ocean. Mar. Pollut. Bull. 2017, 116, 340–347. [Google Scholar] [CrossRef] [PubMed]
  51. Zhang, W.; Zhang, S.; Wang, J.; Wang, Y.; Mu, J.; Wang, P.; Lin, X.; Ma, D. Microplastic pollution in the surface waters of the Bohai Sea, China. Environ. Pollut. 2017, 231, 541–548. [Google Scholar] [CrossRef] [PubMed]
  52. Herrera, A.; Asensio, M.; Martínez, I.; Santana, A.; Packard, T.; Gómez, M. Microplastic and tar pollution on three Canary Islands beaches: An annual study. Mar. Pollut. Bull. 2018, 129, 494–502. [Google Scholar] [CrossRef]
  53. Yabanlı, M.; Yozukmaz, A.; Şener, İ.; Ölmez, Ö.T. Microplastic pollution at the intersection of the Aegean and Mediterranean Seas: A study of the Datça Peninsula (Turkey). Mar. Pollut. Bull. 2019, 145, 47–55. [Google Scholar] [CrossRef]
  54. de Haan, W.P.; Sanchez-Vidal, A.; Canals, M.; Party, N.S.S. Floating microplastics and aggregate formation in the Western Mediterranean Sea. Mar. Pollut. Bull. 2019, 140, 523–535. [Google Scholar] [CrossRef]
  55. Morét-Ferguson, S.; Law, K.L.; Proskurowski, G.; Murphy, E.K.; Peacock, E.E.; Reddy, C.M. The size, mass, and composition of plastic debris in the western North Atlantic Ocean. Mar. Pollut. Bull. 2010, 60, 1873–1878. [Google Scholar] [CrossRef]
  56. Kane, I.A.; Clare, M.A.; Miramontes, E.; Wogelius, R.; Rothwell, J.J.; Garreau, P.; Pohl, F. Seafloor microplastic hotspots controlled by deep-sea circulation. Science 2020, 368, 1140–1145. [Google Scholar] [CrossRef]
  57. Nel, H.A.; Hean, J.W.; Noundou, X.S.; Froneman, P.W. Do microplastic loads reflect the population demographics along the southern African coastline? Mar. Pollut. Bull. 2017, 115, 115–119. [Google Scholar] [CrossRef] [PubMed]
  58. Gürkan, Ü.; Tekin Özan, S. Helminth Fauna of Chub (Squalius cephalus L.) in Susurluk Creek (Bursa-Balıkesir). Süleyman Demirel Univ. Fac. Arts Sci. J. Sci. 2012, 7, 77–85. (In Turkish) [Google Scholar]
  59. Kudun, K. Hydrogeochemistry of the Simav Brook. Master’s Thesis, Istanbul Technical University, Graduate School of Natural and Applied Sciences, Istanbul, Türkiye, 1994. [Google Scholar]
  60. Çiçek, N.L.; Güçlü, S.S.; Erdoğan, Ö.; Küçük, F. Water Quality Assessment of Simav River (Susurluk Basin/Turkey) According to Seasons and Stations. Int. J. Comput. Exp. Sci. Eng. 2023, 9, 68–80. [Google Scholar] [CrossRef]
  61. Eriksen, M.; Lebreton, L.C.M.; Carson, H.S.; Thiel, M.; Moore, C.J.; Borerro, J.C.; Galgani, F.; Ryan, P.G.; Reisser, J. Plastic Pollution in the World’s Oceans: More than 5 Trillion Plastic Pieces Weighing over 250,000 Tons Afloat at Sea. PLoS ONE 2014, 9, e111913. [Google Scholar] [CrossRef]
  62. Barboza, L.G.A.; Vethaak, A.D.; Lavorante, B.R.B.O.; Lundebye, A.-K.; Guilhermino, L. Marine Microplastic Debris: An Emerging Issue for Food Security, Food Safety and Human Health. Mar. Pollut. Bull. 2018, 133, 336–348. [Google Scholar] [CrossRef] [PubMed]
  63. Morrison, M.; Trevisan, R.; Ranasinghe, P.; Greg, B.M.; Santos, J.; Hong, A.; Edward, W.C.; Jayasundara, N.; Somarelli, J.A. A growing crisis for One Health: Impacts of plastic pollution across layers of biological function. Front. Mar. Sci. 2022, 9, 980705. [Google Scholar] [CrossRef]
  64. Barboza, L.G.A.; Gimenez, B.C.G. Microplastics in the marine environment: Current trends and future perspectives. Mar. Pollut. Bull. 2015, 97, 5–12. [Google Scholar] [CrossRef]
  65. Li, Y.; Huang, R.; Hu, L.; Zhang, C.; Xu, X.; Song, L.; Wang, Z.; Pan, X.; Christakos, G.; Wu, J. Microplastics distribution in different habitats of Ximen Island and the trapping effect of blue carbon habitats on microplastics. Mar. Pollut. Bull. 2022, 181, 113912. [Google Scholar] [CrossRef] [PubMed]
  66. Noman, M.A.; Adyel, T.M.; Macreadie, P.I.; Trevathan-Tackett, S.M. Prioritising plastic pollution research in blue carbon ecosystems: A scientometric overview. Sci. Total Environ. 2024, 914, 169868. [Google Scholar] [CrossRef]
  67. Azoulay, D.; Villa, P.; Arellano, Y.; Gordon, M.; Moon, D.; Miller, K.; Thompson, K. Plastic and Health: The Hidden Costs of a Plastic Planet; Center for International Environmental Law (CIEL): Washington, DC, USA, 2019. [Google Scholar]
  68. Ragusa, A.; Svelato, A.; Santacroce, C.; Catalano, P.; Notarstefano, V.; Carnevali, O.; Papa, F.; Rongioletti, M.C.A.; Baiocco, F.; Draghi, S.; et al. Plasticenta: First evidence of microplastics in human placenta. Environ. Int. 2021, 146, 106274. [Google Scholar] [CrossRef]
  69. Islam, T.; Cheng, H. Existence and fate of microplastics in terrestrial environment: A global fretfulness and abatement strategies. Sci. Total Environ. 2024, 953, 176163. [Google Scholar] [CrossRef] [PubMed]
  70. Gholizadeh, M.; Shadi, A.; Abadi, A.; Nemati, M.; Senapathi, V.; Karthikeyan, S.; Kulandaisamy, P. Exploring the microplastic pollution: Unveiling origins and varieties in coastal sediments and waters of the Bushehr Province, Persian Gulf, Iran. Mar. Pollut. Bull. 2024, 198, 115939. [Google Scholar] [CrossRef]
  71. Yahaya, T.; Abdulazeez, A.; Oladele, E.O.; Williams, E.F.; Obadiah, C.D.; Umar, J.; Salisu, N. Microplastics Abundance, Characteristics, and Risk in Badagry Lagoon in Lagos State, Nigeria. Pollution 2022, 8, 1325–1337. [Google Scholar] [CrossRef]
  72. Claessens, M.; De Meester, S.; Van Landuyt, L.; De Clerck, K.; Janssen, C.R. Occurrence and distribution of microplastics in marine sediments along the Belgian coast. Mar. Pollut. Bull. 2011, 62, 2199–2204. [Google Scholar] [CrossRef]
  73. Ding, L.; Wang, Y.; Ju, H.; Tang, D.W.S.; Xue, S.; Geissen, V.; Yang, X. Chlorpyrifos degradation and its impacts on phosphorus bioavailability in microplastic-contaminated soil. Ecotoxicol. Environ. Saf. 2024, 277, 116378. [Google Scholar] [CrossRef] [PubMed]
  74. Dai, Z.; Zhang, H.; Zhou, Q.; Tian, Y.; Chen, T.; Tu, C.; Fu, C.; Luo, Y. Occurrence of microplastics in the water column and sediment in an inland sea affected by intensive anthropogenic activities. Environ. Pollut. 2018, 242, 1557–1565. [Google Scholar] [CrossRef]
  75. Hossain, M.B.; Banik, P.; Nur, A.A.U.; Rahman, T. Abundance and characteristics of microplastics in sediments from the world’s longest natural beach, Cox’s Bazar, Bangladesh. Mar. Pollut. Bull. 2021, 163, 111956. [Google Scholar] [CrossRef]
  76. Urban-Malinga, B.; Zalewski, M.; Jakubowska, A.; Wodzinowski, T.; Malinga, M.; Pałys, B.; Dąbrowska, A. Microplastics on sandy beaches of the southern Baltic Sea. Mar. Pollut. Bull. 2020, 155, 111170. [Google Scholar] [CrossRef]
  77. Lots, F.A.E.; Behrens, P.; Vijver, M.G.; Horton, A.A.; Bosker, T. A large-scale investigation of microplastic contamination: Abundance and characteristics of microplastics in European beach sediment. Mar. Pollut. Bull. 2017, 123, 219–226. [Google Scholar] [CrossRef]
  78. Terzi, Y.; Gedik, K.; Eryaşar, A.R.; Oztürk, R.Ç.; Şahin, A.; Yılmaz, F. Microplastic contamination and characteristics spatially vary in the southern Black Sea beach sediment and sea surface water. Mar. Pollut. Bull. 2022, 174, 113228. [Google Scholar] [CrossRef]
  79. Gündoğdu, S.; Ayat, B.; Aydoğan, B.; Çevik, C.; Karaca, S. Hydrometeorological assessments of the transport of microplastic pellets in the Eastern Mediterranean. Sci. Total Environ. 2022, 823, 153676. [Google Scholar] [CrossRef] [PubMed]
  80. Kye, H.; Kim, J.; Ju, S.; Lee, J.; Lim, C.; Yoon, Y. Microplastics in water systems: A review of their impacts on the environment and their potential hazards. Heliyon 2023, 9, e14359. [Google Scholar] [CrossRef] [PubMed]
  81. Cole, M.; Lindeque, P.; Halsband, C.; Galloway, T.S. Microplastics as contaminants in the marine environment: A review. Mar. Pollut. Bull. 2011, 62, 2588–2597. [Google Scholar] [CrossRef] [PubMed]
  82. Horton, A.A.; Walton, A.; Spurgeon, D.J.; Lahive, E.; Svendsen, C. Microplastics in freshwater and terrestrial environments: Evaluating the current understanding to identify the knowledge gaps and future research priorities. Sci. Total Environ. 2017, 586, 127–141. [Google Scholar] [CrossRef]
  83. Tiwari, M.; Rathod, T.D.; Ajmal, P.Y.; Bhangare, R.C.; Sahu, S.K. Distribution and characterization of microplastics in beach sand from three different Indian coastal environments. Mar. Pollut. Bull. 2019, 140, 262–273. [Google Scholar] [CrossRef]
  84. Cincinelli, A.; Scopetani, C.; Chelazzi, D.; Martellini, T.; Pogojeva, M.; Slobodnik, J. Microplastics in the Black Sea sediments. Sci. Total Environ. 2021, 760, 143898. [Google Scholar] [CrossRef]
  85. Akkan, T.; Gedik, K.; Mutlu, T. Protracted dynamicity of microplastics in the coastal sediment of the Southeast Black Sea. Mar. Pollut. Bull. 2023, 188, 114722. [Google Scholar] [CrossRef]
  86. Al-Nahian, S.; Rakib, M.R.J.; Haider, S.M.B.; Kumar, R.; Mohsen, M.; Sharma, P.; Khandaker, M.U. Occurrence, spatial distribution, and risk assessment of microplastics in surface water and sediments of Saint Martin Island in the Bay of Bengal. Mar. Pollut. Bull. 2022, 179, 113720. [Google Scholar] [CrossRef]
  87. Di, M.; Wang, J. Microplastics in surface water and sediments of the Three Gorges Reservoir, China. Sci. Total Environ. 2018, 616–617, 1620–1627. [Google Scholar] [CrossRef]
  88. Law, K.L.; Thompson, R.C. Microplastics in the seas. Science 2014, 345, 144–145. [Google Scholar] [CrossRef]
  89. Sunitha, T.G.; Monisha, V.; Sivanesan, S.; Vasanthy, M.; Prabhakaran, M.; Omine, K.; Sivasankar, V.; Darchen, A. Micro-plastic pollution along the Bay of Bengal coastal stretch of Tamil Nadu, South India. Sci. Total Environ. 2021, 756, 144073. [Google Scholar] [CrossRef] [PubMed]
  90. Yıbar, A.; Nur Genc, M.; Ceylan, A.; Suzer, B.; Duman, M. Determination of Microplastic and Mold Species in Mussels from the Marmara Sea, Turkey. Acta Vet. Eurasia 2024, 50, 196–209. [Google Scholar]
  91. Frias, J.; Pagter, E.; Nash, R.; O’Connor, I.; Carretero, O.; Filgueiras, A.; Viñas, L.; Gago, J.; Antunes, J.; Bessa, F.; et al. Standardised Protocol for Monitoring Microplastics in Sediments; JPI-Oceans BASEMAN Project; JPI Oceans: Brussels, Belgium, 2018. [Google Scholar] [CrossRef]
  92. Maghsodian, Z.; Sanati, A.M.; Ramavandi, B.; Ghasemi, A.; Sorial, G.A. Microplastics accumulation in sediments and Periophthalmus waltoni fish, mangrove forests in southern Iran. Chemosphere 2021, 264, 128543. [Google Scholar] [CrossRef]
  93. Maghsodian, Z.; Sanati, A.M.; Tahmasebi, S.; Shahriari, M.H.; Ramavandi, B. Study of microplastics pollution in sediments and organisms in mangrove forests: A review. Environ. Res. 2022, 208, 112725. [Google Scholar] [CrossRef]
  94. Arias-Andres, M.; Klümper, U.; Rojas-Jimenez, K. Microplastic pollution increases gene exchange in aquatic ecosystems. Environ. Pollut. 2018, 237, 253–261. [Google Scholar] [CrossRef]
  95. Andrady, A.L. The plastics in microplastics: A review. Mar. Pollut. Bull. 2017, 119, 12–22. [Google Scholar] [CrossRef] [PubMed]
  96. Zheng, Y.; Li, J.; Cao, W.; Liu, X.; Jiang, F.; Ding, J.; Yin, X.; Sun, C. Distribution characteristics of microplastics in the seawater and sediment: A case study in Jiaozhou Bay, China. Sci. Total Environ. 2019, 674, 27–35. [Google Scholar] [CrossRef] [PubMed]
  97. Zhang, D.; Liu, X.; Huang, W.; Li, J.; Wang, C.; Zhang, D.; Zhang, C. Microplastic pollution in deep-sea sediments and organisms of the Western Pacific Ocean. Environ. Pollut. 2020, 259, 113948. [Google Scholar] [CrossRef]
  98. Hosseini, R.; Sayadi, M.H.; Aazami, J.; Savabieasfehani, M. Accumulation and distribution of microplastics in the sediment and coastal water samples of Chabahar Bay in the Oman Sea, Iran. Mar. Pollut. Bull. 2020, 160, 111682. [Google Scholar] [CrossRef]
  99. Rasta, M.; Sattari, M.; Taleshi, M.S.; Namin, J.I. Identification and distribution of microplastics in the sediments and surface waters of Anzali Wetland in the Southwest Caspian Sea, Northern Iran. Mar. Pollut. Bull. 2020, 160, 111541. [Google Scholar] [CrossRef]
  100. Li, J.; Liu, H.; Chen, J.P. Microplastics in freshwater systems: A review on occurrence, environmental effects, and methods for microplastics detection. Water Res. 2018, 137, 362–374. [Google Scholar] [CrossRef] [PubMed]
  101. Graca, B.; Szewc, K.; Zakrzewska, D.; Dołęga, A.; Szczerbowska-Boruchowska, M. Sources and fate of microplastics in marine and beach sediments of the Southern Baltic Sea—A preliminary study. Environ. Sci. Pollut. Res. 2017, 24, 7650–7661. [Google Scholar] [CrossRef] [PubMed]
  102. Abidli, S.; Antunes, J.C.; Ferreira, J.L.; Lahbib, Y.; Sobral, P.; El Menif, N.T. Microplastics in sediments from the littoral zone of the north Tunisian coast (Mediterranean Sea). Estuar. Coast. Shelf Sci. 2018, 205, 1–9. [Google Scholar] [CrossRef]
  103. Deng, H.; Wei, R.; Luo, W.; Hu, L.; Li, B.; Di, Y.; Shi, H. Microplastic pollution in water and sediment in a textile industrial area. Environ. Pollut. 2020, 258, 113658. [Google Scholar] [CrossRef] [PubMed]
  104. John, K.I.; Omorogie, M.O.; Bayode, A.A.; Adeleye, A.T.; Helmreich, B. Environmental microplastics and their additives—A critical review on advanced oxidative techniques for their removal. Chem. Pap. 2023, 77, 657–676. [Google Scholar] [CrossRef]
  105. Abidli, S.; Toumi, H.; Lahbib, Y.; Trigui El Menif, N. The first evaluation of microplastics in sediments from the complex Lagoon-Channel of Bizerte (northern Tunisia). Water Air Soil Pollut. 2017, 228, 262. [Google Scholar] [CrossRef]
  106. Bessa, F.; Barría, P.; Neto, J.M.; Frias, J.P.G.L.; Otero, V.; Sobral, P.; Marques, J.C. Occurrence of microplastics in commercial fish from a natural estuarine environment. Mar. Pollut. Bull. 2018, 128, 575–584. [Google Scholar] [CrossRef]
  107. Bagheri, T.; Gholizadeh, M.; Abarghouei, S.; Zakeri, M.; Hedayati, A.; Rabaniha, M.; Aghaeimoghadam, A.; Hafezieh, M. Microplastics distribution, abundance and composition in sediment, fishes and benthic organisms of the Gorgan Bay, Caspian Sea. Chemosphere 2020, 253, 127201. [Google Scholar] [CrossRef]
  108. Shaw, D.G.; Day, R.H. Colour- and form-dependent loss of plastic micro-debris from the North Pacific Ocean. Mar. Pollut. Bull. 1994, 28, 39–43. [Google Scholar] [CrossRef]
  109. Boerger, C.M.; Lattin, G.L.; Moore, S.L.; Moore, C.J. Plastic ingestion by planktivorous fishes in the North Pacific Central Gyre. Mar. Pollut. Bull. 2010, 60, 2275–2278. [Google Scholar] [CrossRef]
  110. Osorio, E.D.; Tanchuling, M.A.N.; Diola, M.B.L.D. Microplastics occurrence in surface waters and sediments in five river mouths of Manila Bay. Front. Environ. Sci. 2021, 9, 719274. [Google Scholar] [CrossRef]
  111. MSFD Technical Group on Marine Litter. Guidance on the Monitoring of Marine Litter in European Seas: An Update to Improve the Harmonised Monitoring of Marine Litter Under the Marine Strategy Framework Directive; EUR 31539 EN; JRC133594; Publications Office of the European Union: Luxembourg, 2023. [Google Scholar] [CrossRef]
  112. Phuong, N.N.; Fauvelle, V.; Grenz, C.; Ourgaud, M.; Schmidt, N.; Strady, E.; Semépré, R. Highlights from a review of microplastics in marine sediments. Sci. Total Environ. 2021, 777, 146225. [Google Scholar] [CrossRef]
  113. Lehtiniemi, M.; Hartikainen, S.; Näkki, P.; Engström-Öst, J.; Koistinen, A.; Setälä, O. Size matters more than shape: Ingestion of primary and secondary microplastics by small predators. Food Webs 2018, 17, e00097. [Google Scholar] [CrossRef]
  114. Haave, M.; Lorenz, C.; Primpke, S.; Gerdts, G. Different stories told by small and large microplastics in sediment—First report of microplastic concentrations in an urban recipient in Norway. Mar. Pollut. Bull. 2019, 141, 501–513. [Google Scholar] [CrossRef] [PubMed]
  115. Wang, Y.; Zou, X.; Peng, C.; Qiao, S.; Wang, T.; Yu, W.; Khokiattiwong, S.; Kornkanitnan, N. Occurrence and distribution of microplastics in surface sediments from the Gulf of Thailand. Mar. Pollut. Bull. 2020, 152, 110916. [Google Scholar] [CrossRef]
  116. Molina, N.; López Pérez, T.M.; Puerta Cerpa, Y.D. Molecular mechanisms of microplastic toxicity in coastal sediments of La Guajira, Colombia and emerging ecological risks. Case Stud. Chem. Environ. Eng. 2025, 11, 101108. [Google Scholar] [CrossRef]
  117. Erni-Cassola, G.; Zadjelovic, V.; Gibson, M.I.; Christie-Oleza, J.A. Distribution of plastic polymer types in the marine environment: A meta-analysis. J. Hazard. Mater. 2019, 369, 691–698. [Google Scholar] [CrossRef] [PubMed]
  118. Jualaong, S.; Pransilpa, M.; Pradit, S.; Towatana, P. Type and Distribution of Microplastics in Beach Sediment Along the Coast of the Eastern Gulf of Thailand. J. Mar. Sci. Eng. 2021, 9, 1405. [Google Scholar] [CrossRef]
  119. Andrady, A.L.; Neal, M.A. Applications and societal benefits of plastics. Philos. Trans. R. Soc. Lond. B Biol. Sci. 2009, 364, 1977–1984. [Google Scholar] [CrossRef]
  120. Tripathi, D.; Ebrary, I. Practical Guide to Polypropylene; Rapra Technology Limited: Shrewsbury, UK, 2002. [Google Scholar]
  121. Chae, D.-H.; Kim, I.-S.; Kim, S.-K.; Song, Y.K.; Shim, W.J. Abundance and distribution characteristics of microplastics in surface seawaters of the Incheon/Kyeonggi coastal region. Arch. Environ. Contam. Toxicol. 2015, 69, 269–278. [Google Scholar] [CrossRef]
  122. Zhu, J.; Zhang, Q.; Li, Y.; Tan, S.; Kang, Z.; Yu, X.; Lan, W.; Cai, L.; Wang, J.; Shi, H. Microplastic pollution in the Maowei Sea, a typical mariculture bay of China. Sci. Total Environ. 2018, 658, 62–68. [Google Scholar] [CrossRef] [PubMed]
  123. Scheurer, M.; Bigalke, M. Microplastic pollution in freshwater and its impact on environmental health. Environ. Sci. Technol. 2018, 52, 3591–3598. [Google Scholar] [CrossRef]
  124. Thompson, R.C.; Olsen, Y.; Mitchell, R.P.; Davis, A.; Rowland, S.J.; John, A.W.G.; McGonigle, D.; Russell, A.E. Lost at sea: Where is all the plastic? Science 2004, 304, 838. [Google Scholar] [CrossRef] [PubMed]
  125. Quinn, B.; Murphy, F.; Ewins, C. Analytical methods for the detection of microplastics in marine environments. Anal. Methods 2017, 9, 1491–1498. [Google Scholar] [CrossRef]
  126. Liu, M.; Lu, S.; Song, Y.; Lei, L.; Hu, J.; Lv, W.; Zhou, W.; Cao, C.; Shi, H.; Yang, X.; et al. Microplastic and mesoplastic pollution in farmland soils in suburbs of Shanghai, China. Environ. Pollut. 2018, 242, 855–862. [Google Scholar] [CrossRef]
  127. Liu, M.; Song, Y.; Lu, S.; Qiu, R.; Hu, J.; Li, X.; Bigalke, M.; Shi, H.; He, D. A Method for Extracting Soil Microplastics through Circulation of Sodium Bromide Solutions. Sci. Total Environ. 2019, 691, 341–347. [Google Scholar] [CrossRef] [PubMed]
  128. Corradini, F.; Meza, P.; Eguiluz, R.; Casado, F.; Huerta-Lwanga, E.; Geissen, V. Evidence of microplastic accumulation in agricultural soils from sewage sludge disposal. Sci. Total Environ. 2019, 671, 411–420. [Google Scholar] [CrossRef]
  129. Asadi, M.A.; Hertika, A.M.S.; Feni, I.; Aisyah, Y.Y. Microplastics in the sediment of intertidal areas of Lamongan, Indonesia. Aquac. Aquar. Conserv. Legis. 2019, 12, 1065–1073. Available online: https://www.researchgate.net/publication/335365727_Microplastics_in_the_sediment_of_intertidal_areas_of_Lamongan_Indonesia (accessed on 17 March 2025).
  130. Béraud, E.; Bednarz, V.; Otto, I.; Golbuu, Y.; Ferrier-Pagès, C. Plastics are a new threat to Palau’s coral reefs. PLoS ONE 2022, 17, e0270237. [Google Scholar] [CrossRef]
  131. Gao, Z.; Chen, L.; Cizdziel, J.; Huang, Y. Research progress on microplastics in wastewater treatment plants: A holistic review. J. Environ. Manag. 2023, 325, 116411. [Google Scholar] [CrossRef]
  132. Rabari, V.; Patel, K.; Patel, H.; Trivedi, J. Quantitative assessment of microplastic in sandy beaches of Gujarat state, India. Mar. Pollut. Bull. 2022, 181, 113925. [Google Scholar] [CrossRef]
  133. Soursou, V.; Campo, J.; Picó, Y. A critical review of the novel analytical methods for the determination of microplastics in sand and sediment samples. TrAC Trends Anal. Chem. 2023, 166, 117190. [Google Scholar] [CrossRef]
  134. Pinho, I.; Amezcua, F.; Rivera, J.M.; Green-Ruiz, C.; Piñón-Colin, T.J.; Wakida, F. First report of plastic contamination in batoids: Plastic ingestion by Haller’s Round Ray (Urobatis halleri) in the Gulf of California. Environ. Res. 2022, 211, 113077. [Google Scholar] [CrossRef]
  135. Vianello, A.; Boldrin, A.; Guerriero, P.; Moschino, V.; Rella, R.; Sturaro, A.; Da Ros, L. Microplastic particles in sediments of lagoon of Venice, Italy: First observations on occurrence, spatial patterns and identification. Estuar. Coast. Shelf Sci. 2013, 130, 54–61. [Google Scholar] [CrossRef]
  136. Terzi, Y.; Oztürk, R.Ç.; Eryaşar, A.R.; Yandı, İ.; Şahin, A.; Yılmaz, F.; Gündoğdu, S. Riverine microplastic discharge along the southern Black Sea coast of Turkey. Environ. Res. Lett. 2025, 20, 024061. [Google Scholar] [CrossRef]
  137. Ferguson, L.; Awe, A.; Sparks, C. Microplastic concentrations and risk assessment in water, sediment and invertebrates from Simon’s Town, South Africa. Heliyon 2024, 10, e28514. [Google Scholar] [CrossRef] [PubMed]
  138. Browne, M.A.; Crump, P.; Niven, S.J.; Teuten, E.; Tonkin, A.; Galloway, T.; Thompson, R. Accumulation of microplastic on shorelines worldwide: Sources and sinks. Environ. Sci. Technol. 2011, 45, 9175–9179. [Google Scholar] [CrossRef] [PubMed]
  139. Browne, M.A.; Underwood, A.J.; Chapman, M.G.; Williams, R.; Thompson, R.C.; van Franeker, J.A. Linking effects of anthropogenic debris to ecological impacts. Proc. R. Soc. B Biol. Sci. 2015, 282, 20142929. [Google Scholar] [CrossRef]
  140. Pan, Z.; Liu, Q.; Jiang, R.; Li, W.; Sun, X.; Lin, H.; Jiang, S.; Huang, H. Microplastic pollution and ecological risk assessment in an estuarine environment: The Dongshan Bay of China. Chemosphere 2021, 262, 127876. [Google Scholar] [CrossRef]
  141. Jang, M.; Shim, W.J.; Cho, Y.; Han, G.M.; Song, Y.K.; Hong, S.H. A close relationship between microplastic contamination and coastal area use pattern. Water Res. 2020, 171, 115400. [Google Scholar] [CrossRef]
  142. Simon-Sánchez, L.; Vianello, A.; Kirstein, I.V.; Molazadeh, M.S.; Lorenz, C.; Vollertsen, J. Assessment of microplastic pollution and polymer risk in the sediment compartment of the Limfjord, Denmark. Sci. Total Environ. 2024, 950, 175017. [Google Scholar] [CrossRef] [PubMed]
  143. Rochman, C.M.; Brookson, C.; Bikker, J.; Djuric, N.; Earn, A.; Bucci, K.; Athey, S.; Huntington, A.; McIlwraith, H.; Munno, K.; et al. Rethinking microplastics as a diverse contaminant suite. Environ. Toxicol. Chem. 2019, 38, 703–711. [Google Scholar] [CrossRef] [PubMed]
  144. Zimmermann, L.; Göttlich, S.; Oehlmann, J.; Wagner, M.; Völker, C. What are the drivers of microplastic toxicity? Comparing the toxicity of plastic chemicals and particles to Daphnia magna. Environ. Pollut. 2020, 267, 115392. [Google Scholar]
  145. Bucci, K.; Rochman, C.M. Microplastics: A multidimensional contaminant requires a multidimensional framework for assessing risk. Microplast. Nanoplast. 2022, 2, 7. [Google Scholar] [CrossRef]
  146. Koelmans, A.A.; Redondo Hasselerharm, P.E.; Mohamed Nor, N.H.; de Ruijter, V.N.; Mintenig, S.M.; Kooi, M. Risk assessment of microplastic particles. Nat. Rev. Mater. 2022, 7, 138–152. [Google Scholar] [CrossRef]
  147. Iwasaki, Y.; Takeshita, K.M.; Ueda, K.; Naito, W. Estimating species sensitivity distributions for microplastics by quantitatively considering particle characteristics using a recently created ecotoxicity database. Microplast. Nanoplast. 2023, 3, 21. [Google Scholar] [CrossRef]
  148. Avio, C.G.; Cardelli, L.R.; Gorbi, S.; Pellegrini, D.; Regoli, F. Microplastics Pollution after the Removal of the Costa Concordia Wreck: First Evidences from a Biomonitoring Case Study. Environ. Pollut. 2017, 227, 207–214. [Google Scholar] [CrossRef]
Figure 1. Sampling points (1—Garipçe, 2—Florya, 3—Marmara Ereğlisi, 4—Tekirdağ, 5—Şarköy, 6—Gelibolu, 7—Burhanlı Köyü, 8—Bigalı, 9—Kumkale, 10—Kepez, 11—Çardak, 12—Kemer, 13—Erdek, 14—Turan Village, 15—Yenice, 16—Kurşunlu, 17—Büyükkumla, 18—Yalova, 19—Karamürsel, 20—Başiskele, and 21—Poyrazköy).
Jmse 13 01159 g001
Figure 2. Physical properties of detected MPs: (a) amount of MPs, (b) shapes of MPs, (c) colors of MPs, and (d) size pf MPs.
Jmse 13 01159 g002aJmse 13 01159 g002b
Figure 3. Polymer distribution in MPs of the sampling area.
Jmse 13 01159 g003
Figure 4. Representative FTIR spectrum: (a) spectrum of PP (blue film, St 11); (b) spectrum of PE (red fiber, St 13).
Jmse 13 01159 g004
Table 2. Cf, PLI, H, and PRI values by station and region.
Station NoStations HIPRIRegionsPLI
CFPEPETPPPEPETPP
21Poyrazköy1.661100--1826--IS1.66
1Garipçe2.73------
2Florya1.972752002560243855NS2.19
3M. Ereğlisi1.91550--1205--
4Tekirdağ 2.06------
5Şarköy2.99------
6Gelibolu3.00--100--336ÇS3.36
7Burhanlı3.16550--1848--
8Bigalı2.55-20050-672168
9Kumkale4.31550200-1848672-
10Kepez5.44------
11Çardak2.56550-501848-168
12Kemer1.851100--3784--SS3.44
13Erdek3.401100--3784--
15Yenice6.4631911614109739948
16Kurşunlu2.241100--2651--GB2.41
17Büyükkumla2.60------
18Yalova2.36------
19Karamürsel2.401100--2772--GI2.52
20Başiskele2.84550--1386--
Risk Category [44]Low (I)Moderate (II)High (III)Very High (IV)Dangerous (V)
Contamination Factor (CF)<11–33–6>6
Pollution Load Index (PLI)<11–33–44–5>5
Polymer Risk Index (HI)<1010–100101–10001000–10,000>10,000
Pollution Risk Index (PRI)<150150–300300–600600–1200>1200
Since stations 1 and 21 are evaluated together in the same region, station 21 is written in the top row.
Disclaimer/Publisher’s Note: The statements, opinions and data contained in all publications are solely those of the individual author(s) and contributor(s) and not of MDPI and/or the editor(s). MDPI and/or the editor(s) disclaim responsibility for any injury to people or property resulting from any ideas, methods, instructions or products referred to in the content.

